| Title | Size | Downloads |
|---|---|---|
| 03-CAS Cluster Monitoring in U-Center 2.0 Configuration Example-book.pdf | 2.69 MB |
- Table of Contents
- Related Documents
-
| Title | Size | Download |
|---|---|---|
| book | 2.69 MB |
|
|
|
CAS Cluster Monitoring in U-Center 2.0 |
|
Configuration Example |
|
|
|
|
Document version: 5W102-20230922
Copyright © 2023 New H3C Technologies Co., Ltd. All rights reserved.
No part of this manual may be reproduced or transmitted in any form or by any means without prior written consent of New H3C Technologies Co., Ltd.
Except for the trademarks of New H3C Technologies Co., Ltd., any trademarks that may be mentioned in this document are the property of their respective owners.
The information in this document is subject to change without notice.
Contents
Configuring the CAS cluster monitor template
Viewing the CAS cluster monitor reports
Viewing the CAS cluster threshold alarms
Introduction
H3C Cloud Automation System (CAS) is a resource management platform developed by H3C to establish cloud computing infrastructure. It provides the industry-leading virtualization management solution for data center cloud computing infrastructure, and implements centralized management and control of the data center cloud computing environment.
Virtual device monitoring of U-Center 2.0 can monitor CAS clusters and NEW CAS clusters.
· CAS cluster—Compatible with CAS versions earlier than V5.0 (E0535). If too many connections are established for VMs in a CAS environment, frequent interface calls might have an impact on the CAS cluster virtualization service..
· NEW CAS cluster—Compatible with CAS versions later than V5.0 (E0535). CAS cluster virtualization provides batch interface implementation, which has led to significant performance improvements.
CVM is the client used to log in to the CAS cloud computing management platform, and CVK-deployed hosts provide VMs. Both the monitored CAS clusters and NEW CAS clusters connect to the REST API provided by CVM, and obtain the CVK information from the CVM REST API. The clusters cannot connect directly to CVK. The primary and backup CVMs are not distinguished in monitoring, and data of different applications is collected based on IP addresses.
This document introduces how to use U-Center 2.0 to monitor CAS clusters, view monitoring reports, and configure threshold alarms.
Usage guidelines
Application scenarios
This document is applicable in the scenario where U-Center 2.0 monitors CAS clusters.
Prerequisites
· The CAS platform is deployed and configured correctly, and it is running correctly.
· The U-Center 2.0 server is installed and deployed correctly, and it can correctly communicate with the CAS platform.
· You have obtained the username and password of an administrator on the CAS platform that manages the target CAS cluster.
Configuration example
Network configuration
As shown in Figure 1, a host in the DC of a company is installed with CAS to carry services of the company. The server administrator needs to use U-Center 2.0 to incorporate and monitor the CAS cluster, as shown in Table 1.
Figure 1 Network configuration
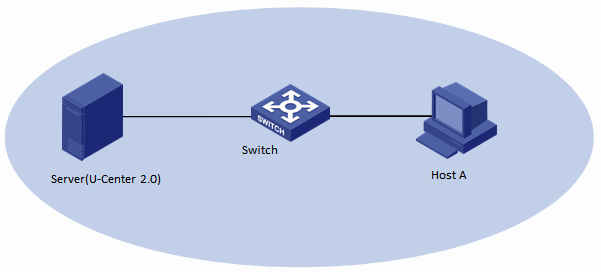
|
Host name |
IP address |
Application |
|
Server(U-Center 2.0) |
192.167.253.159 |
U-Center IOM 2.0(E0709) |
|
Host A |
192.167.33.254 |
V5.0 (E0530H08) |
Procedures
Configuring the CAS platform
1. Log in to CAS by using the username and password of an administrator on the CAS platform that manages the target CAS cluster.
2. Verify that you can view information on the CAS platform from the console.
Adding a CAS cluster
1. Log in to U-Center 2.0.
2. Click the Monitor tab.
3. From the left navigation pane, select Basic Monitor > Virtualization.
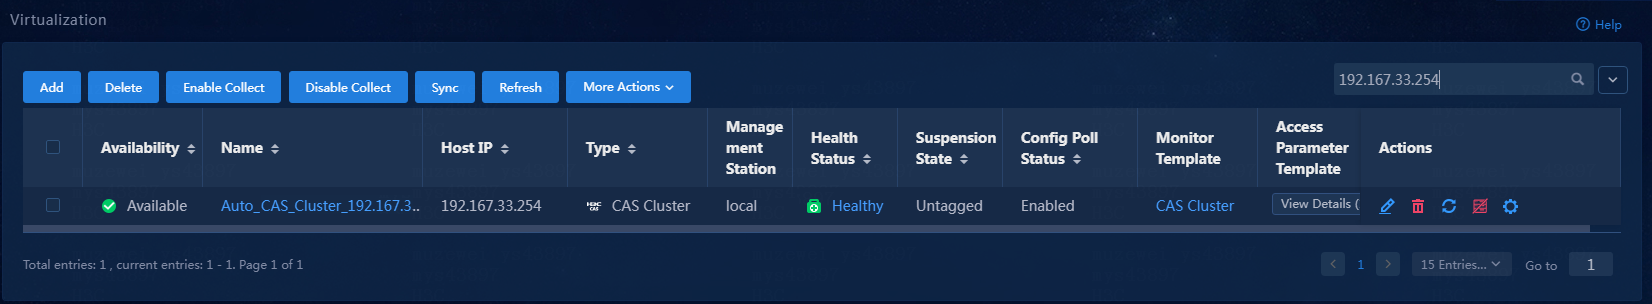
Figure 2 Virtualization
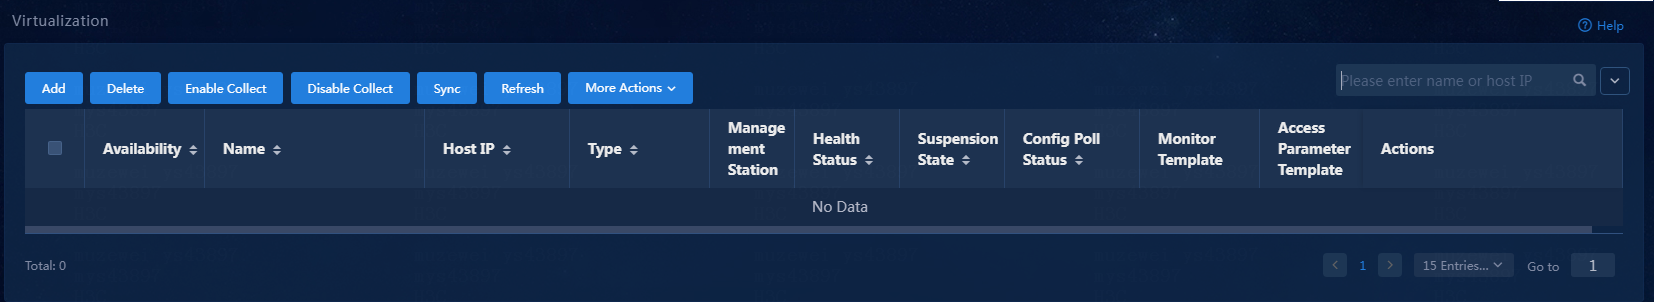
4. Click Add.
5. Click CAS Cluster below virtual device monitoring category.
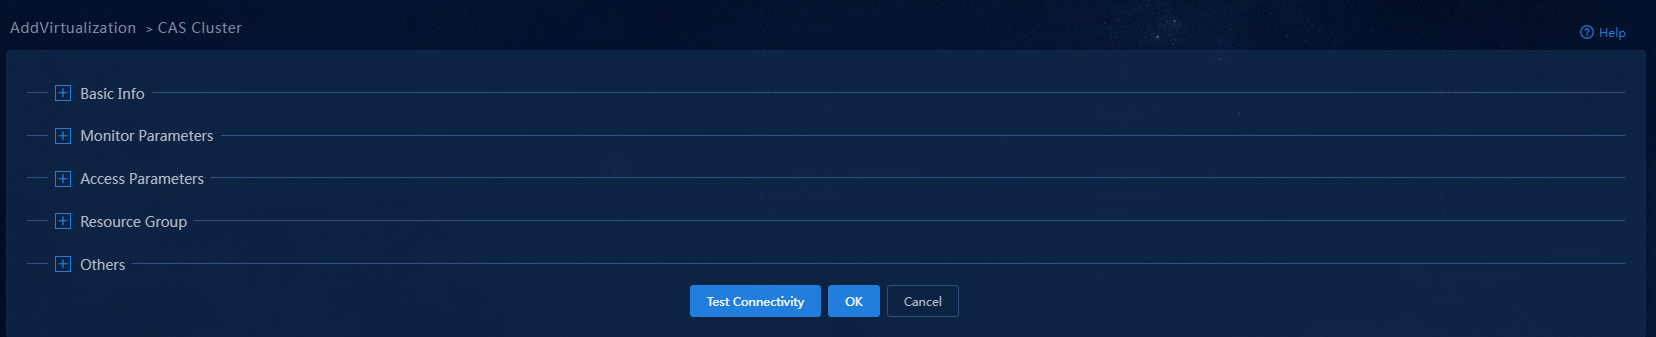
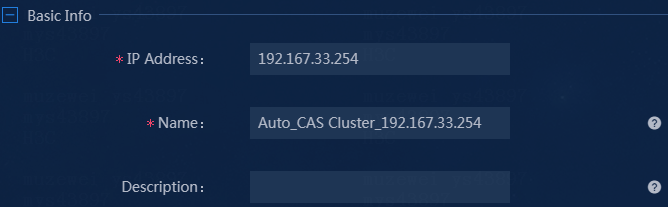
6. Configure the following basic parameters:
¡ IP Address: Enter the IP address of a CAS cluster. In this example, enter 192.167.33.254.
¡ Name: Enter the name of the CAS cluster. In this example, enter Auto_CAS_Cluster_192.167.33.254.
¡ Description: Enter a description. In this example, skip this parameter.
Figure 4 Configuring basic parameters
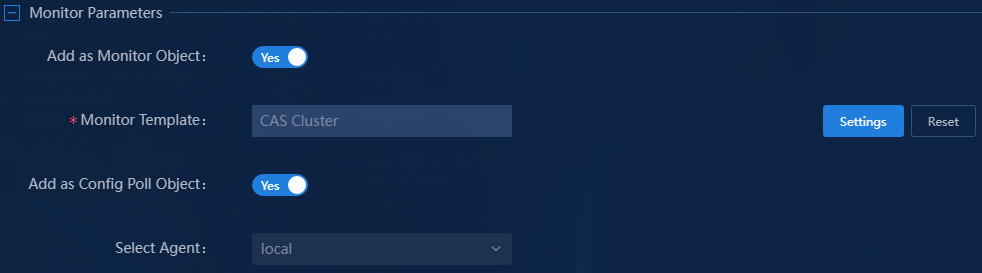
7. Manually configure the monitor parameters, or select a monitor template.
¡ Add as Monitor Object: Select whether to add the CAS cluster as a monitor object. You must add the CAS cluster as a monitor object or configuration poll object.
¡ Monitor Template: In this example, use the default monitor template CAS Cluster. To select a different monitor template or modify the monitor template, click Settings. For information about modifying a monitor template, see "Configuring the CAS cluster monitor template."
¡ Add as Config Poll Object: Select whether to add the CAS cluster as a configuration pool object. This parameter is enabled by default. In this example, use the default setting. The CAS cluster will be added to the monitor and resource management tabs, and its data will be collected periodically. This parameter is available only after CMDB licenses are used for resource quantity-based and feature-based licensing.
¡ Select Agent: Select a monitor agent. In this example, use the default local agent. Configure this parameter if a proxy is required for monitoring.
Figure 5 Configuring monitoring parameters
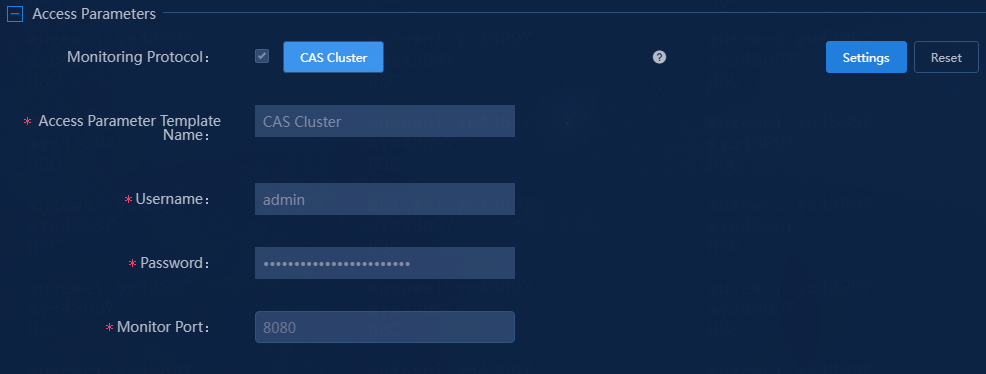
8. Select a monitoring protocol, and manually configure the access parameters or select an access parameter template.
¡ Monitoring Protocol: Use the default protocol CAS Cluster.
¡ Access Parameter Template Name: Select an access parameter template. In this example, use template CAS Cluster. To select a different access parameter template or add a new access parameter template, click Settings.
¡ Username: Enter the username of the CAS cluster.
¡ Password: Enter the password of the CAS cluster.
¡ Monitor Port: Enter the port number of the CAS cluster. In this example, use the default port number 8080.
|
|
IMPORTANT: · U-Center 2.0 supports monitoring CAS clusters running CAS 3.0. · In the monitor report overview, the host summary information is about the physical hosts directly mounted to a host pool, and the host information is about all hosts in a host pool. · For U-Center 2.0 to collect IP indicator data from VMs, you must install CAStools on the VMs. |
Figure 6 Configuring access parameters
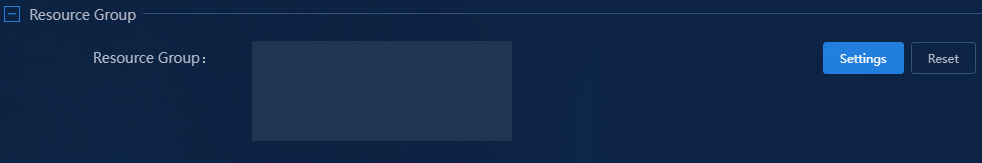
9. Assign the monitor object to a resource group. In this example, skip this parameter.
Figure 7 Assigning the monitor object to a resource group
10. Set the state of detection. Detection enables U-Center to test connectivity to the monitor object, and connectivity detection might take a short period of time. In this example, use the default setting.
Figure 8 Setting the state of detection
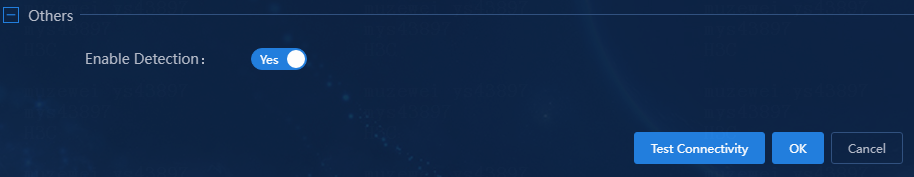
11. Click Test Connectivity to verify correctness of the configuration.
12. After the network connectivity is verified, click OK.
Configuring the CAS cluster monitor template
U-Center 2.0 uses the monitor template to control the collected indexes and their thresholds. The system has predefined a large number of monitor templates that can be directly used. You can also edit a monitor template as needed to customize the monitor template.
You can set thresholds for concerned indexes. By monitoring the alarm state of monitored resources, you can timely learn the application running state. Common operations include:
· Access the CAS cluster monitor template page, as shown in "Accessing the CAS cluster monitor template."
· Select existing index groups on the index settings tab, and edit the collection interval for the index groups, as shown in "Editing the collection interval of an index group."
· Select an existing index on the index settings tab, and add the threshold settings for the index, as shown in "Adding an index threshold."
· Edit the existing threshold configuration, as shown in "Editing index thresholds."
Accessing the CAS cluster monitor template
1. Click the Monitor tab.
2. From the left navigation pane, select Monitor Options > Monitor Templates.
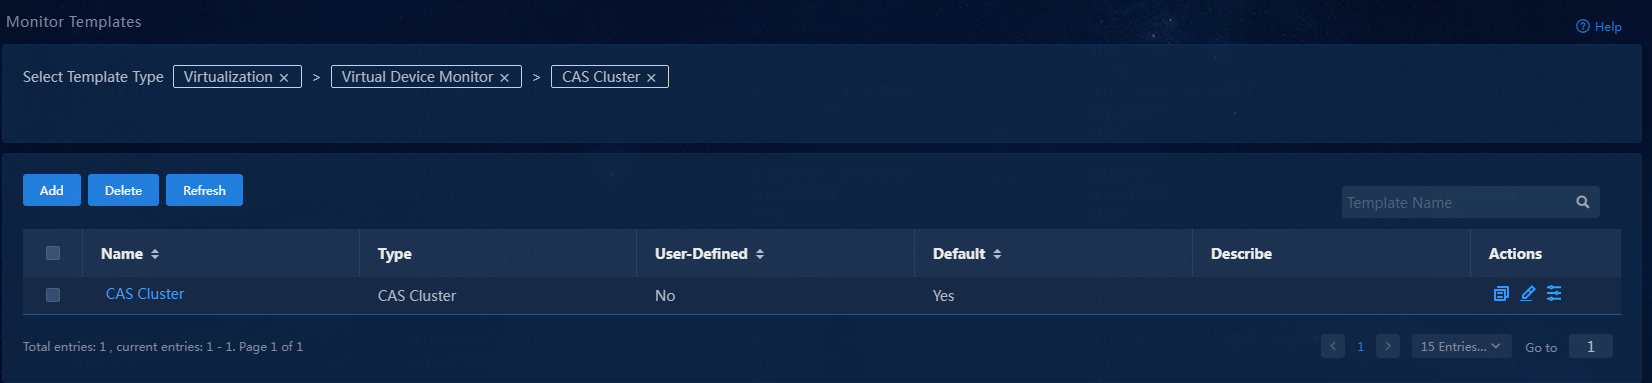
3. Select Virtualization > Virtual Device Monitor > CAS Cluster as the template type.
Figure 10 Select the CAS cluster monitor template
4. Operate the CAS cluster monitor template from the Actions column as follows:
¡ To
copy the monitor template, click ![]() . The new
monitor template is named CAS
Cluster_copy, and you can modify and save the
new monitor template.
. The new
monitor template is named CAS
Cluster_copy, and you can modify and save the
new monitor template.
¡ To edit the basic information and indicator
thresholds of the monitor template, click ![]() . The new monitor template will be applied
at the next collection interval after the monitor template is edited
successfully.
. The new monitor template will be applied
at the next collection interval after the monitor template is edited
successfully.
¡ To
edit the thresholds of the monitor template, click ![]() .
.
Figure 11 Basic information of the monitor template

|
|
NOTE: You can change the monitor template for a resource by using the following methods: · To change the monitor template for a single resource, click · To change the monitor template for a multiple resources of the same type in bulk, select the resources, click More, and then select Change Monitor Template. |
Editing the collection interval of an index group
The following procedure uses the Virtual Machine Summary Information index group as an example.
1. Select the Virtual Machine Summary Information index group on the Index Settings tab.
2. Click Edit Collection Interval, and then edit the collection interval, In this example, set the collection interval to 10 minutes.
Figure 12 Editing the collection interval
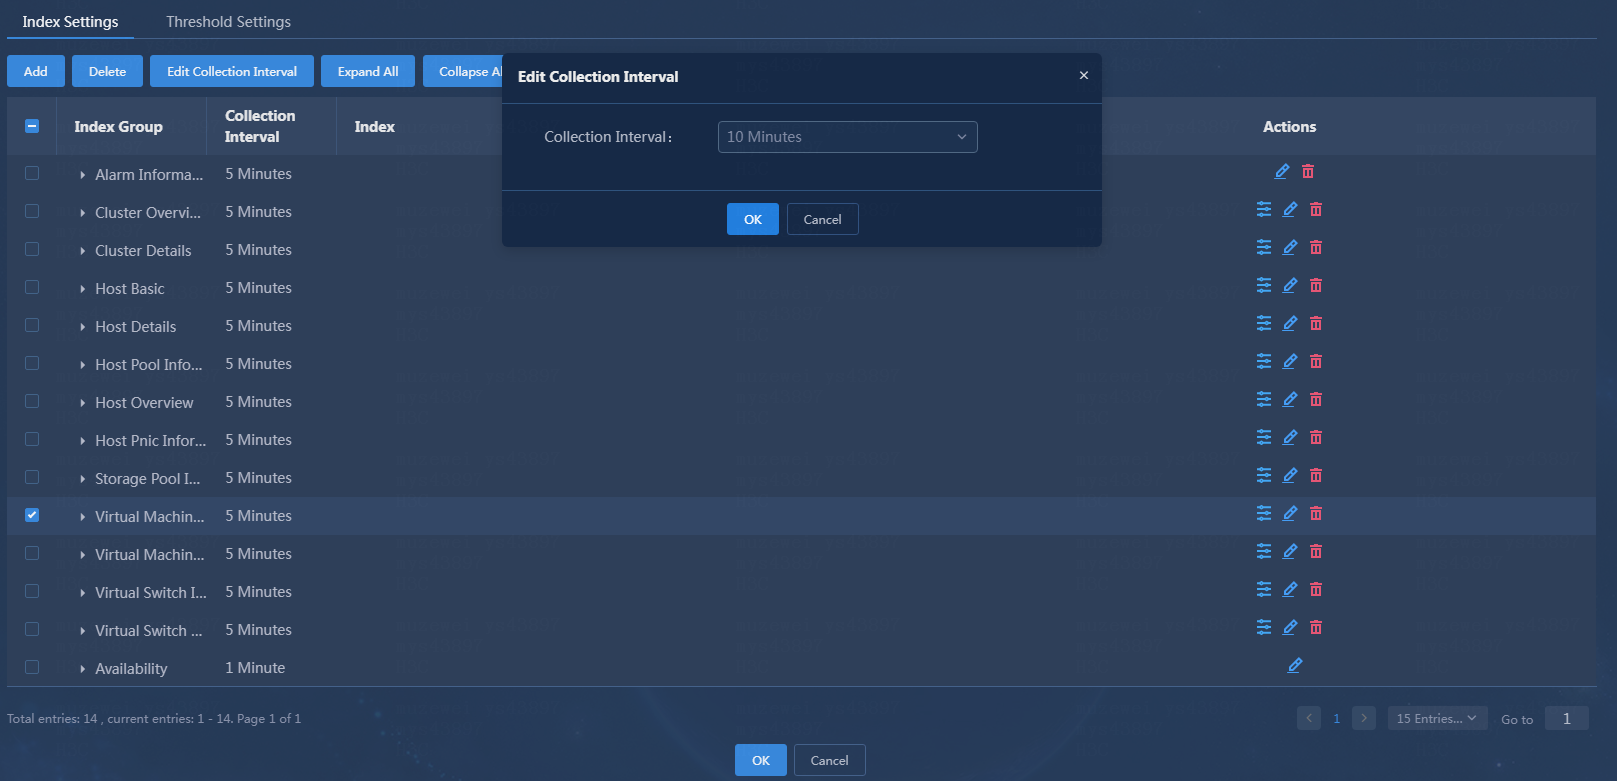
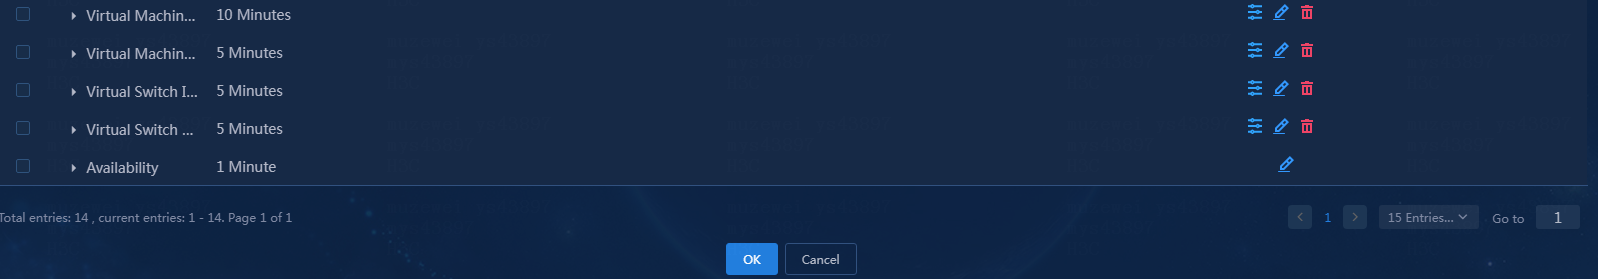
3. Click OK. The new monitor template will be applied at the next collection interval after the monitor template is edited successfully.
Figure 13 Collection interval after modification
Adding an index threshold
The following procedure adds the memory usage index as an example.
1. Expand the Virtual Machine Summary Information index group.
Figure 14 Indexes in the index group
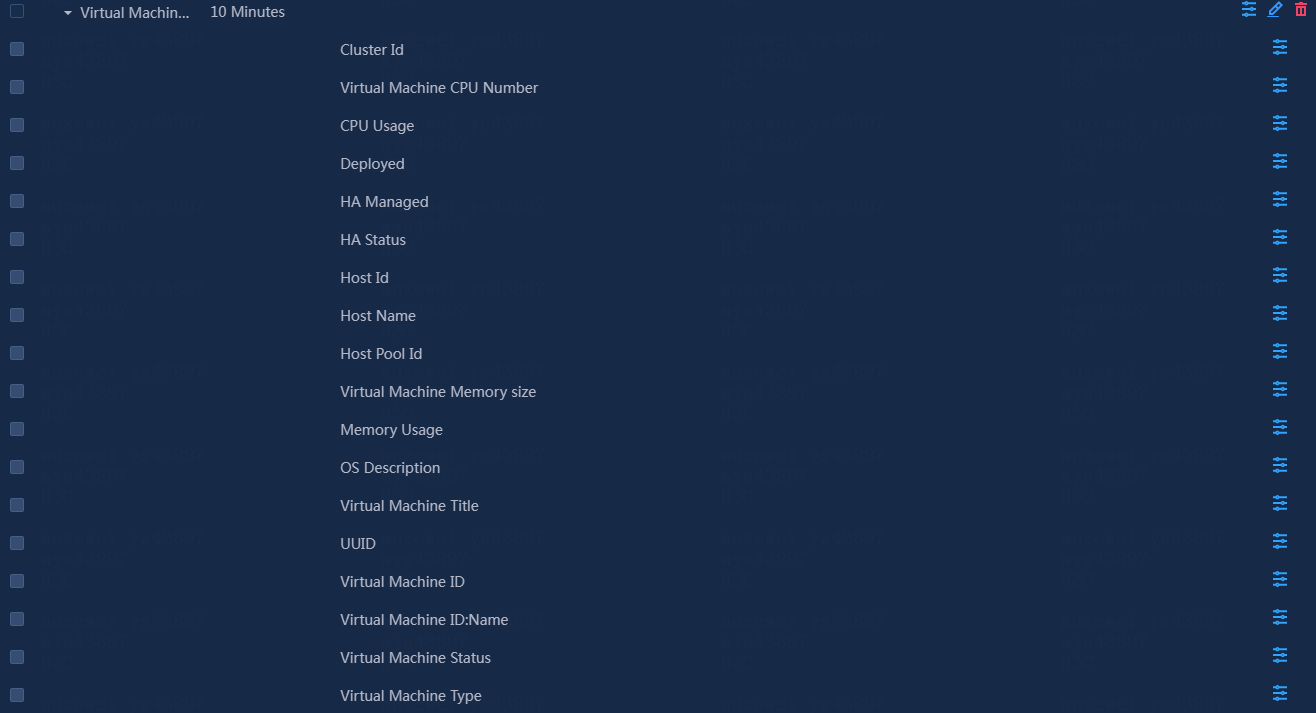
2. Click the ![]() icon
for the memory usage index.
icon
for the memory usage index.
3. Click Add.
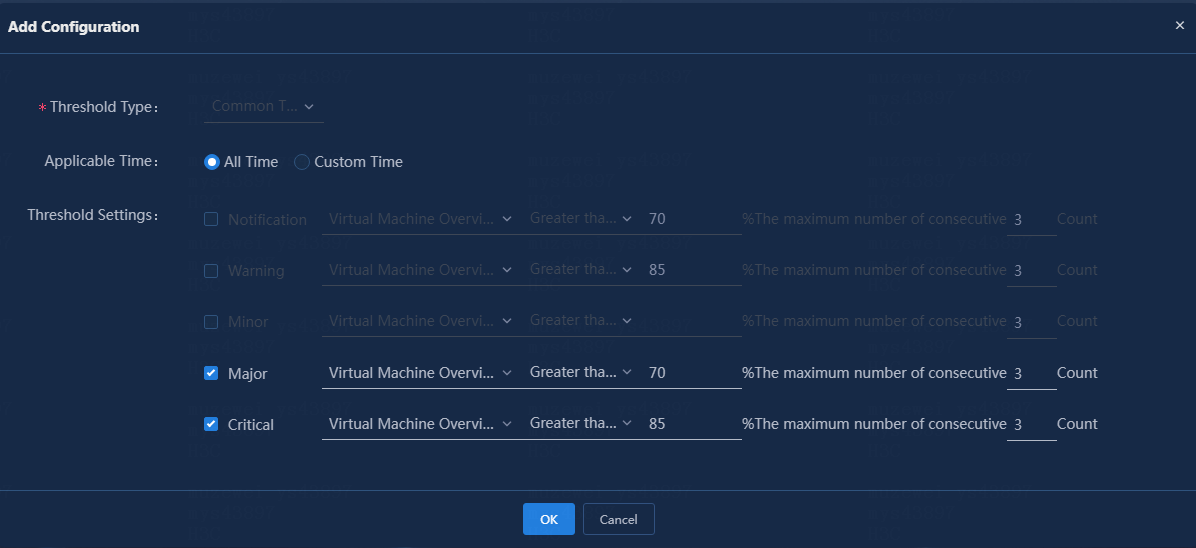
4. Configure the following parameters:
¡ Threshold Type: Select a threshold type. The threshold configuration varies by threshold type. The threshold types for certain indexes are predefined and not configurable. In this example, select the common threshold type.
¡ Applicable Time: Apply the configuration to all time spans or custom time spans. In this example, select All Time.
¡ Threshold Settings: Configure the thresholds. In this example, set the major and critical alarm thresholds to 70% and 85%, respectively, and set the triggering condition to three consecutive occurrences.
Figure 15 Adding configuration
5. Click OK.
Figure 16 Added threshold configuration
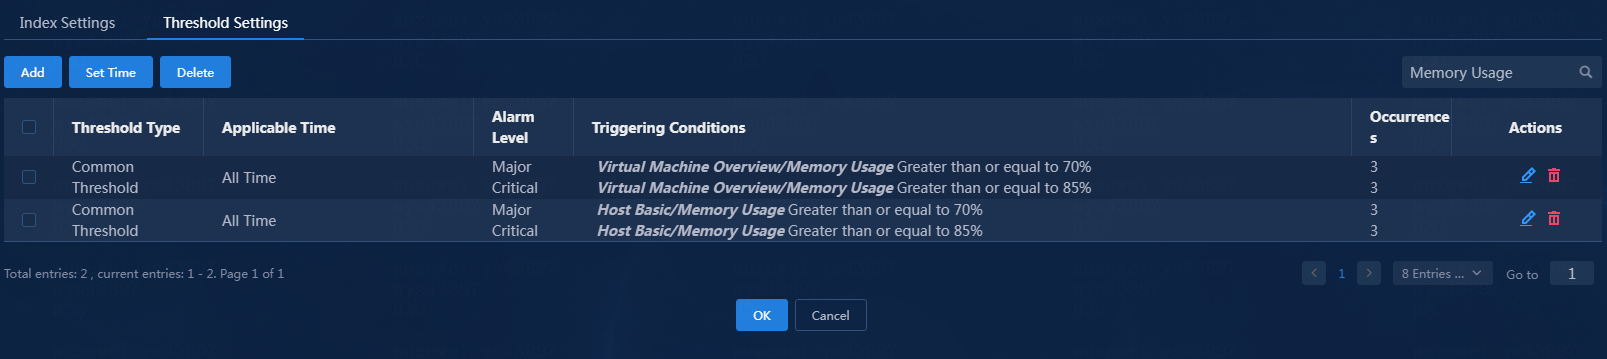
6. Click OK. Modification to the monitor template takes effect in the next collection interval.
Editing index thresholds
The following procedure adds the memory usage index as an example.
1. Expand the Virtual Machine Summary Information index group.
2. Click the ![]() icon
for the memory usage index.
icon
for the memory usage index.
3. Click the ![]() icon
in the Actions column.
icon
in the Actions column.
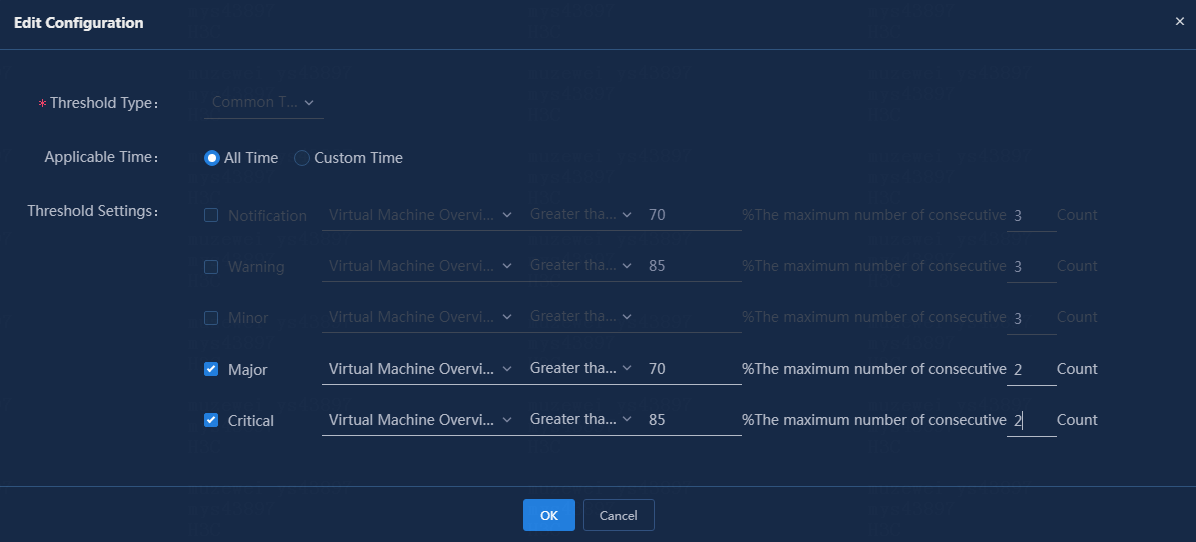
4. Modify the following parameters:
¡ Threshold Type: This parameter is not configurable.
¡ Applicable Time: Apply the configuration to all time spans or custom time spans. In this example, do not edit this parameter. Alternatively, you can select a threshold, and then click Set Time to modify the applicable time.
¡ Threshold Settings: Edit the thresholds. In this example, set the triggering condition to two consecutive occurrences.
Figure 17 Modifying threshold settings
5. Click OK.
Figure 18 Modified threshold configuration
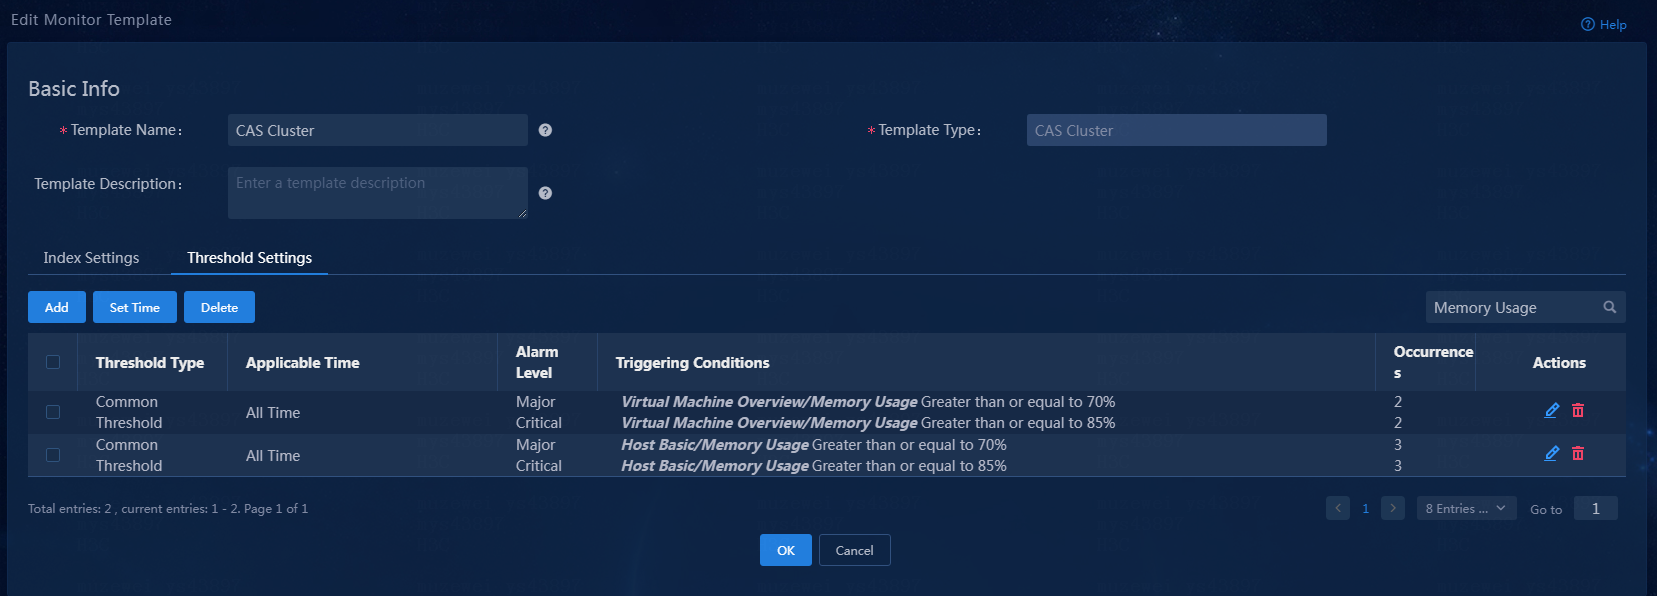
6. Click OK. The new monitor template will be applied at the next collection interval after the monitor template is edited successfully.
Verifying the configuration
Viewing the CAS cluster monitor reports
Viewing CAS cluster resource details
1. Click the Monitor tab.
2. From the navigation pane, select Basic Monitor > Virtualization.
3. On the virtualization page, view the virtualization monitor list.
After a period of collection time, the alarm state has changed, as shown in Figure 19.
Figure 19 Viewing the virtualization monitor list
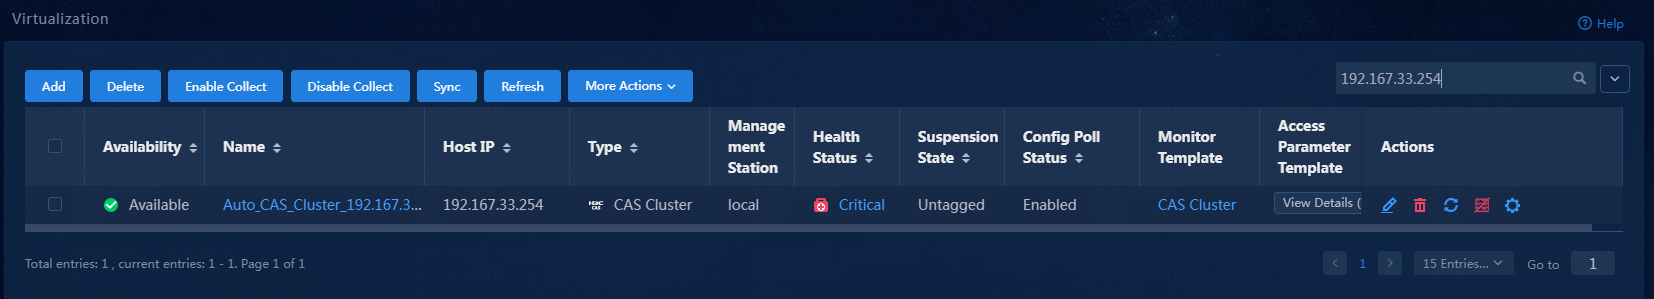
4. Click the Auto_CAS_Cluster_192.167.33.254 link. On the resource details page that opens, view the monitor reports, as shown in Figure 20.
Figure 20 CAS cluster resource details (partial)
|
|
NOTE: · If the value of an index exceeds the corresponding threshold, the background color of the value in the monitor report changes to the color for alarms of the corresponding level defined in U-Center 2.0. · If an application has triggered alarms of different levels, the alarm state displays the highest level of alarms triggered. · U-Center 2.0 provides multiple time spans for an index, including
Past 1 hour |
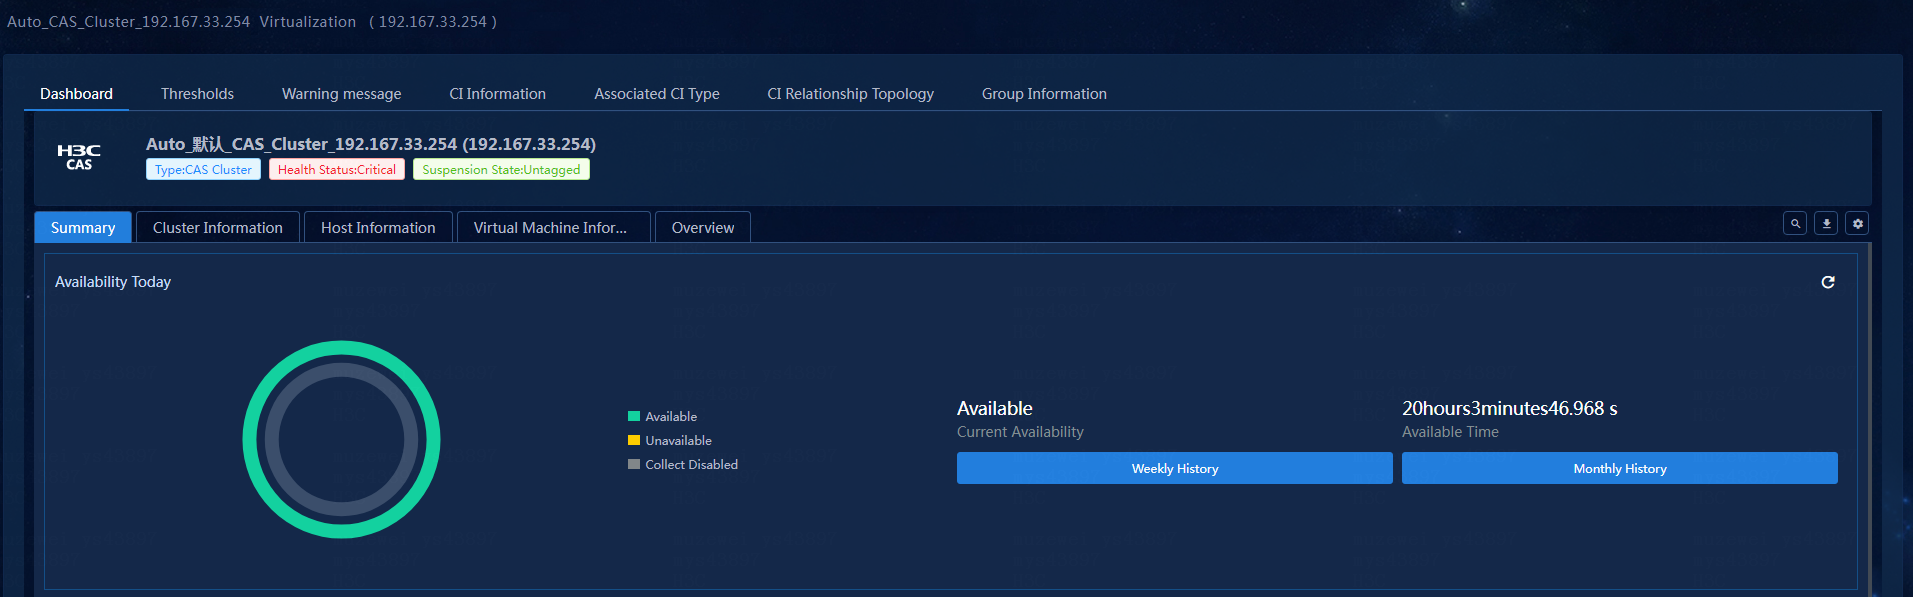
Viewing the availability today section
View the Availability Today section in the monitor summary, as shown in Figure 21.

· Pie Chart: Displays the percentage of each availability state of the application today. To view the percentage of an availability state, hover over the slice in the pie chart.
· Current Availability: Current availability of the application.
¡ Available: Total normal running time of the application since 00:00 today.
¡ Unavailable: Total protocol connection failure time of the application since 00:00 today.
¡ Collect Disabled: Total connection disabled time of the application since you manually disabled the collection state for the monitor on the device.
For a newly added application monitor, the Available, Unavailable, and Collect Disabled fields are collected since the time when the application monitor was added today. An availability state with the time of 0 is not displayed.
· Weekly History: Click this button to view the availability of the application in the last 7 days. The weekly history collects the application availability in the unit of hours, as shown in Figure 22. When you hover over a time span, you can view the percentage of each availability state of the CAS cluster within the time span.

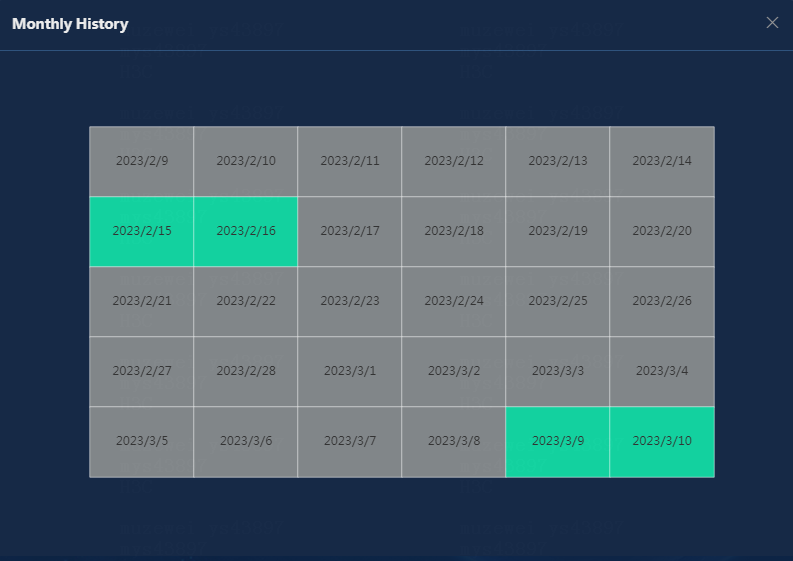
· Monthly History: Click this button to view the availability of the application in the last 30 days. The monthly history collects the application availability in the unit of days. When you hover over a time span, you can view the percentage of each availability state of the CAS cluster within the time span, as shown in Figure 23.
Viewing the host pool information
View the host pool information, as shown in Figure 24.
Figure 24 Host pool information

· Host Pool ID: ID of the current host pool in cloud resources.
· Host Pool Name: Name of the current host pool in cloud resources.
· Operator Group ID: Group ID of the operator who owns the current host pool.
· Operator Group Number: Group number of the operator who owns the current host pool.
· Child Number: Number of first-level hosts and clusters in the current host pool.
· Host Number: Number of first-level hosts in the current host pool.
· CPU Number: Total number of CPU cores in the current host pool.
· Memory Size: Total memory capacity of all the hosts in the current host pool.
· Disk Size: Total local storage capacity of all the hosts in the current host pool.
· Available Size: Total remaining local storage capacity of all the hosts in the current host pool.
· Virtual Machine State: Number of virtual machines in the host pool, including running and shut down virtual machines.
· Virtual Machine Number: Total number of virtual machines in the host pool.
· Virtual Machine Density: Average number of virtual machines per host in the host pool.
Viewing the cluster overview
View the cluster overview, as shown in Figure 25.

· Host Pool ID: ID of the host pool that the current cluster belongs to in cloud resources.
· Host Pool Name: Name of the host pool that the current cluster belongs to in cloud resources.
· Cluster ID: ID of the current cluster in cloud resources.
· Cluster Name: Name of the current cluster in cloud resources.
· Cluster ID:Name: ID and name of the current cluster in cloud resources.
· Description: Description of the current cluster.
· Enable HA: Whether high availability is enabled for the current cluster.
· Boot priority: Boot priority of the current cluster.
· Enable LB: Whether load balancing is enabled for the current cluster.
· LB Persistent Time: Duration of load balancing for the current cluster.
· LB Check Interval: Interval for checking load balancing for the current cluster.
· Enable IPM: Whether Intelligent Power Management (IPM) is enabled for the current cluster.
· IPM Persistent Time: Duration of IPM for the current cluster.
· IPM Check Interval: Interval for checking IPM for the current cluster.
Viewing the host overview
View the host overview, as shown in Figure 26.

· Host Pool ID: ID of the host pool that the current host belongs to in cloud resources.
· Host Pool Name: Name of the host pool that the current host belongs to in cloud resources.
· Host ID: ID of the current host.
· Host Name: Name of the current host.
· Host ID:Name: ID and name of the current host in cloud resources.
· Username: Username used to access the current host.
· Host IP: IP address of the current host.
· Host Status: Whether the current host is running normally.
· Enable HA: Whether the current host is managed for high availability.
Viewing the alarm information
View the alarm information, as shown in Figure 27.
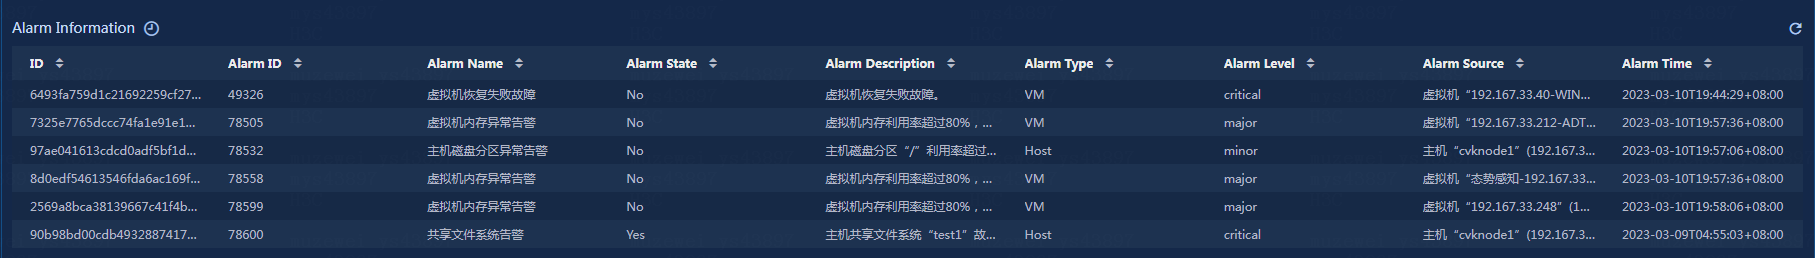
· ID: ID of the current alarm.
· Alarm ID: ID of the current alarm in cloud resources.
· Alarm Name: Name of the current alarm in cloud resources.
· Alarm State: Confirmation state of the alarm, including yes and no.
· Alarm Description: Description of the alarm.
· Alarm Type: Type of the alarm, including host, virtualization software, VM, cluster, and virtualization management software.
· Alarm Level: Level of the alarm, including critical, major, minor, and informational.
· Alarm Source: Device information of the alarm source, showing the device type, device name, and management IP address.
· Alarm Time: Time when the alarm occurred.
Viewing the cluster details
View the cluster details, as shown in Figure 28.
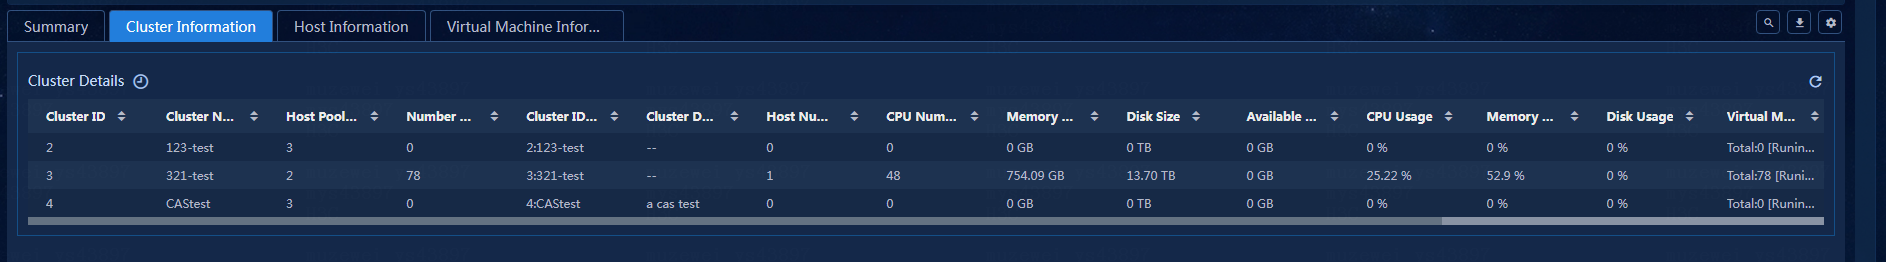
· Cluster ID: ID of the current cluster.
· Cluster Name: Name of the current cluster.
· Host Pool ID: ID of the host pool that the current cluster belongs to.
· Number of Virtual Machines: Number of virtual machines in the current cluster.
· Cluster ID:Name: ID and name of the current cluster.
· Cluster Description: Description of the current cluster.
· Host Number: Number of hosts in the current cluster.
· CPU Number: Total number of CPU cores in the current cluster.
· Memory Size: Total memory size of the current cluster.
· Available Disk Size: Available storage size of the current cluster.
· CPU Usage: CPU usage of the current cluster.
· Memory Usage: Memory usage of the current cluster.
· Disk Usage: Storage usage of the current cluster.
· Virtual Machine State: Status of virtual machines in the current cluster.
Viewing the host basic information
View the host basic information, as shown in Figure 29.
Figure 29 Host basic information
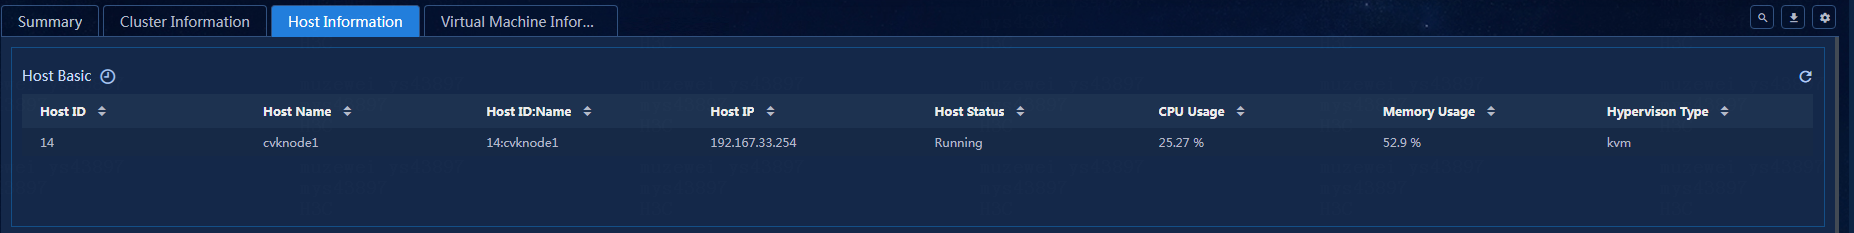
· Host ID: ID of the current host.
· Host Name: Name of the current host.
· Host ID:Name: ID and name of the current host.
· Host IP: IP address of the current host.
· Host Status: Status of the current host.
· CPU Usage: CPU usage of the current host.
· Memory Usage: Memory usage of the current host.
· Hypervison Type: Hypervison type of the current host.
Viewing the host details
View the host details, as shown in Figure 30.

· Host ID: ID of the current host.
· Host Name: Name of the current host.
· Host Pool ID: ID of the host pool that the current host belongs to.
· Host Pool Name: Name of the host pool that the current host belongs to.
· Cluster ID: ID of the cluster that the current host belongs to.
· Serial Number: Serial number of the current host.
· Host ID:Name: ID and name of the current host.
· Host IP: IP address of the current host.
· Server Model: Server model of the current host.
· CPU Number: Number of CPUs on the current host.
· CPU Frequency: CPU frequency of the current host.
· Memory Size: Memory size of the current host.
· Host Version: Version of the current host.
· Virtual Machine Status: Status of virtual machines on the current host.
Viewing the host NIC information
View the host NIC information, as shown in Figure 31.
Figure 31 Host NIC information
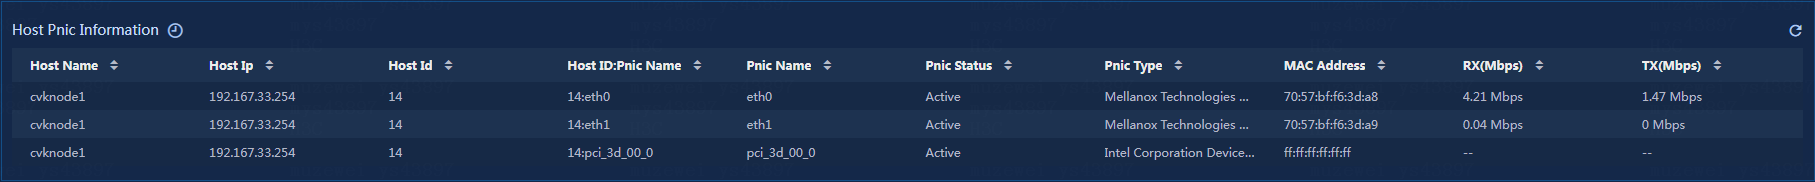
· Host Name: Name of the current host.
· Host Ip: IP address of the current host.
· Host Id: ID of the current host.
· Host ID:Pnic Name: ID and NIC name of the current host.
· Pnic Status: Status of the NIC on the current host.
· Pnic Type: Type of the NIC on the current host.
· MAC Address: MAC address of the NIC on the current host.
· RX (Mbps): Received traffic rate of the current host.
· TX (Mbps): Sent traffic rate of the current host.
Viewing virtual switch information
View the virtual switch information, as shown in Figure 32.
Figure 32 Virtual switch information

· Host Name: Name of the current host.
· Host ID:Virtual Switch Name: ID and name of the virtual switch on the current host.
· Virtual Switch ID: ID of the virtual switch on the current host.
· Virtual Switch Name: Name of the virtual switch on the current host.
· Port Number: Number of ports on the current virtual switch.
· Forward Mode: Forwarding mode of the current virtual switch.
· Pnic Name: Name of the physical NIC on the current virtual switch.
· IP Address: IP address of the current virtual switch.
· Netmask: Subnet mask of the current virtual switch.
· Gateway: Gateway of the current virtual switch.
· Switch Status: Status of the current virtual switch.
· Enable LACP: LACP information of the current virtual switch.
Viewing the storage pool information
View the storage pool information, as shown in Figure 33.
Figure 33 Storage pool information
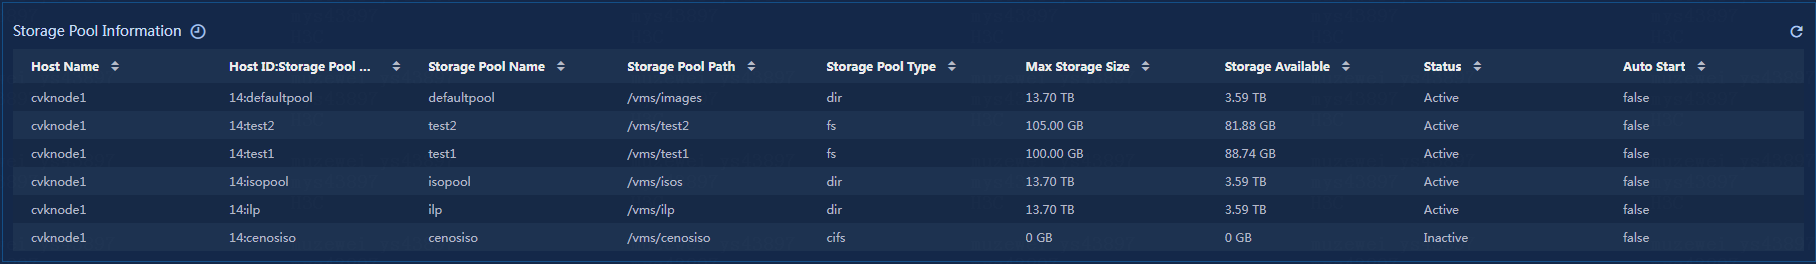
· Host Name: Name of the current host.
· Host ID:Storage Pool Name: ID and name of the storage pool to which the current host belongs.
· Storage Pool Name: Name of the storage pool to which the current host belongs.
· Storage Pool Path: Path of the storage pool to which the current host belongs.
· Storage Pool Type: Type of the storage pool to which the current host belongs.
· Max Storage Size: Maximum storage capacity of the storage pool to which the current host belongs.
· Storage Available: Available storage capacity of the storage pool to which the current host belongs.
· Status: Status of the storage pool to which the current host belongs.
· Auto Start: Auto-start configuration of the storage pool to which the current host belongs.
Viewing the virtual machine information
View the virtual machine information, as shown in Figure 34.
Figure 34 Virtual machine information
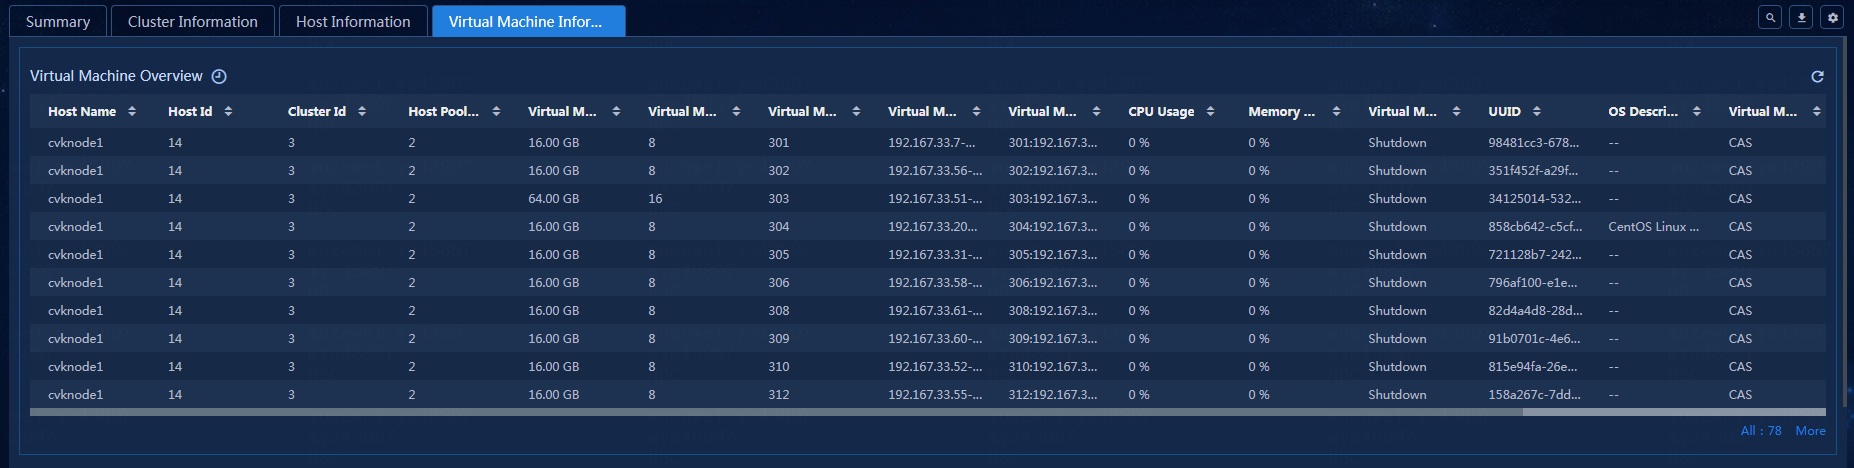
· Host Name: The name of the current host.
· Host Id: The ID of the current host.
· Cluster Id: The ID of the current cluster.
· Host Pool ID: The ID of the current host pool.
· Virtual Machine Memory Size: The memory size of the current virtual machine.
· Virtual Machine CPU Number: The number of CPUs assigned to the current virtual machine.
· Virtual Machine Name: The name of the current virtual machine.
· Virtual Machine ID:Name: The ID and name of the current virtual machine.
· CPU Usage: The current CPU usage of the virtual machine.
· Memory Usage: The current memory usage of the virtual machine.
· Virtual Machine Status: The status of the current virtual machine.
· UUID: The UUID of the current virtual machine.
· OS Description: The operating system description of the current virtual machine.
· Virtual Machine Type: The type of the current virtual machine.
Viewing the virtual machine details
View the virtual machine details, as shown in Figure 35.
Figure 35 Virtual machine details
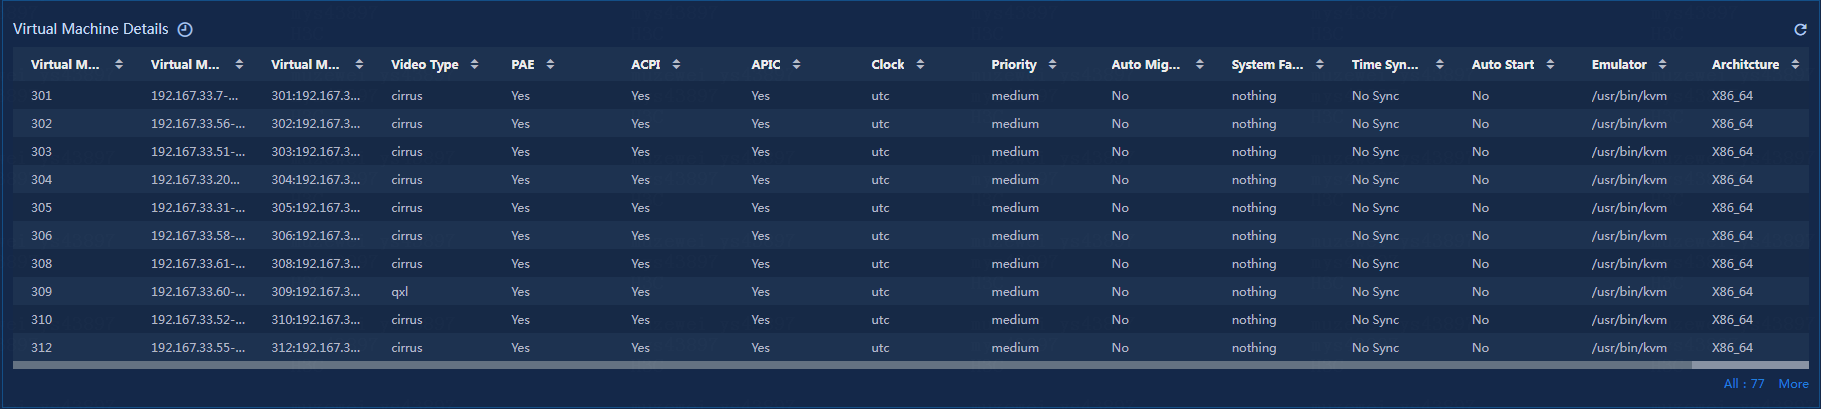
· Virtual Machine ID: The ID of the current virtual machine.
· Virtual Machine Name: The name of the current virtual machine.
· Virtual Machine ID:Name: The ID and name of the current virtual machine.
· Video Type: The graphics card type of the current virtual machine.
· PAE: Whether the current virtual machine uses PAE.
· ACPI: Whether the current virtual machine uses ACPI.
· APIC: Whether the current virtual machine uses APIC.
· Clock: The clock setting of the current virtual machine.
· Priority: The priority information of the current virtual machine.
· Auto Migration: Whether the current virtual machine migrates automatically.
· System Failure Policy: The system failure policy of the current virtual machine.
· Time Sync: Whether the current virtual machine uses time synchronization.
· Auto Start: Whether the current virtual machine starts automatically.
· Emulator: The emulator of the current virtual machine.
· Architecture: The system architecture of the current virtual machine.
Viewing the virtual switch port information
View the virtual switch port information, as shown in Figure 36.
Figure 36 Virtual switch port information
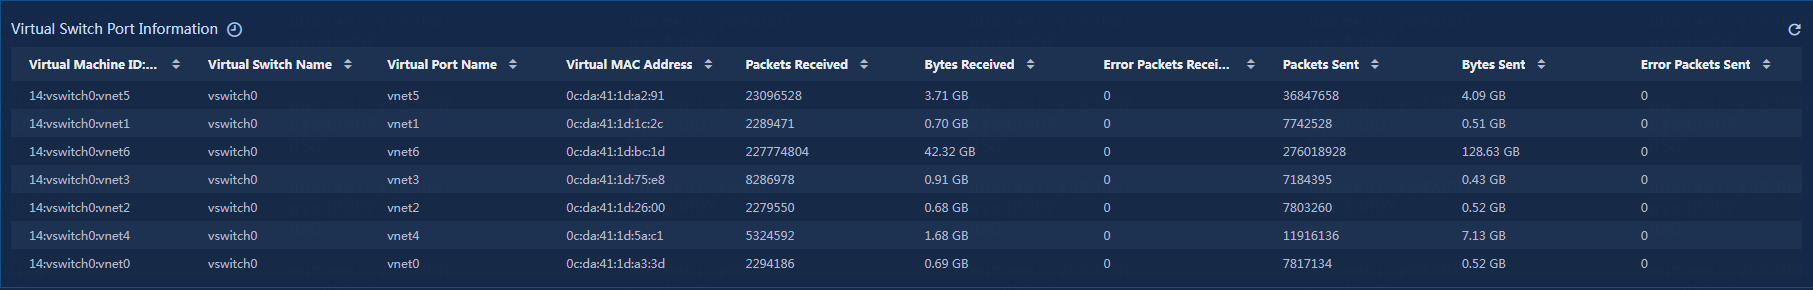
· Virtual Machine ID: The ID of the current virtual machine, virtual switch name, and virtual port name.
· Virtual Switch Name: The name of the virtual switch for the current virtual machine.
· Virtual Port Name: The name of the virtual port for the current virtual machine.
· Virtual MAC Address: The virtual MAC address of the current virtual machine.
· Packets Received: The number of packets received by the current virtual machine.
· Bytes Received: The number of bytes received by the current virtual machine.
· Error Packets Received: The number of error packets received by the current virtual machine.
· Packets Sent: The number of packets sent by the current virtual machine.
· Bytes Sent: The number of bytes sent by the current virtual machine.
· Error Packets Sent: The number of error packets sent by the current virtual machine.
Viewing the CAS cluster threshold alarms
In the CAS cluster resource details window, the Dashboard tab displays the name, type, health status, and suspension state of the monitored application. If an application has triggered alarms of different levels, the health status displays the highest level of alarms triggered.
1. Click the health status link or click the warning message tab.
The warning message page opens, as shown in Figure 37.
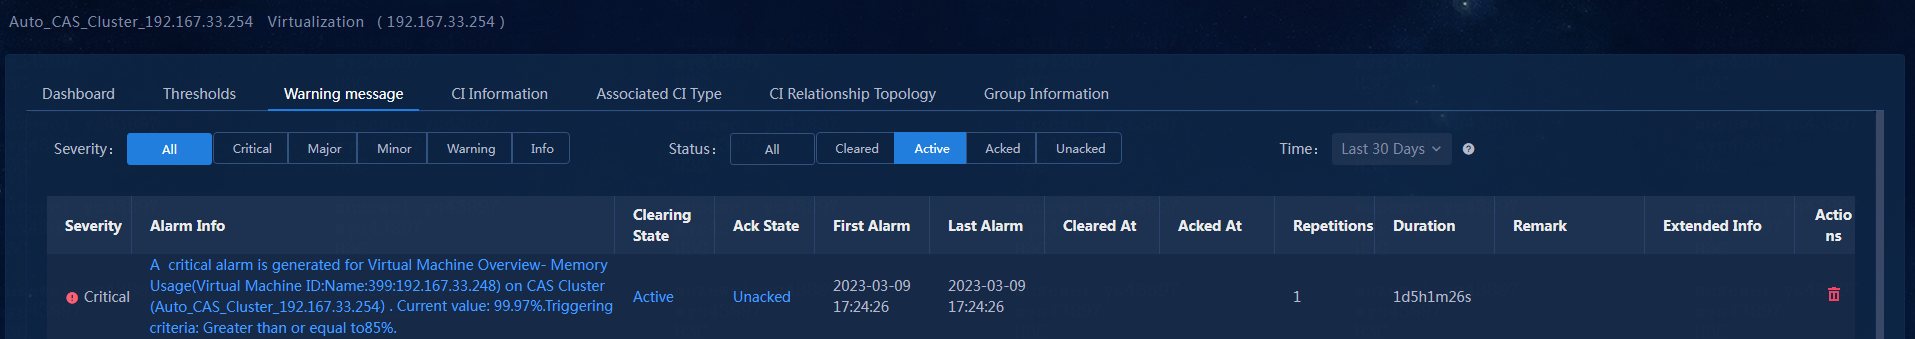
2. Hover over the link in the Alarm Info column to view the details. Alternatively, click the link in the Alarm Info column to directly view the alarm details, as shown in Figure 38.
Figure 38 Alarm details displayed in the floating window

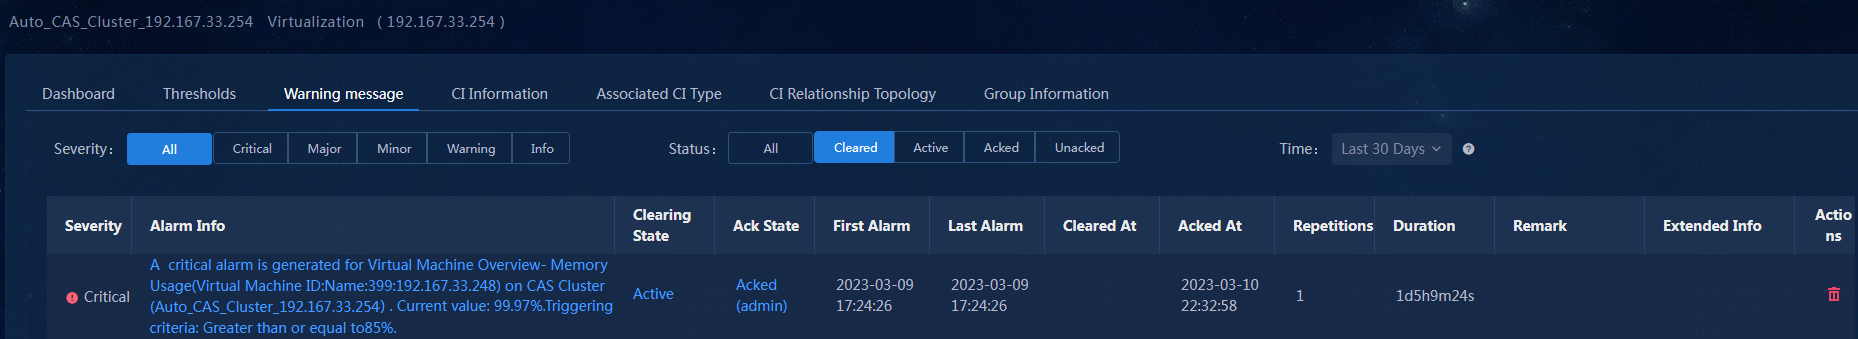
3. After you receive the virtualization threshold alarm generated by the memory usage ratio and confirm that the related information is correct, you click the Unacked link in the Ack State column to acknowledge the alarm, as shown in Figure 39.
Figure 39 Virtualization threshold alarm - Acknowledging the alarm
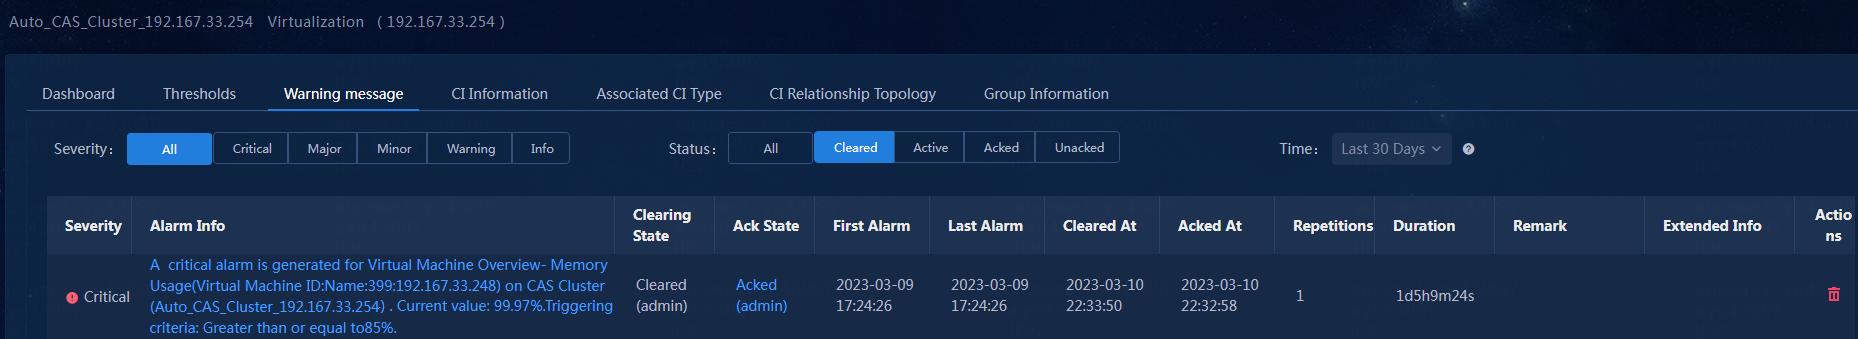
4. After you resolve issues in the environment or set the threshold again, you can click the Active link in the Clearing State column to clear the alarm, as shown in Figure 40.
Figure 40 Virtualization threshold alarm - Clearing the alarm
|
|
NOTE: Automatically clear and acknowledge alarms: · U-Center 2.0 periodically monitors applications. If the metric values collected in the next period no longer meet the threshold conditions, the alarm will be automatically cleared, and the new metric value will be recorded. · After viewing related information, click the Unacked link in the Ack State column to acknowledge the alarm, |
5. After all alarms are cleared, the alarm state of the CAS cluster will be restored to normal, as shown in Figure 41.

