- Released At: 15-01-2024
- Page Views:
- Downloads:
- Table of Contents
- Related Documents
-
URL Application Monitoring in U-Center 2.0
Configuration Example
Document version: 5W102-20230922
Copyright © 2023 New H3C Technologies Co., Ltd. All rights reserved.
No part of this manual may be reproduced or transmitted in any form or by any means without prior written consent of New H3C Technologies Co., Ltd.
Except for the trademarks of New H3C Technologies Co., Ltd., any trademarks that may be mentioned in this document are the property of their respective owners.
The information in this document is subject to change without notice.
Contents
Adding a URL application monitor
Configuring a URL monitor template
Viewing the URL application monitor reports
Viewing the URL threshold alarms
Introduction
A Uniform Resource Locator (URL) contains the location of a resource file and the protocol needed to access the resource.
This document describes how to use U-Center 2.0 to monitor URLs, view the monitor reports, and configure the threshold alarms.
Usage guidelines
Application scenarios
This document is applicable in the scenario where U-Center 2.0 monitors URLs.
Prerequisites
· The URL application starts correctly.
· The server with U-Center 2.0 has been installed and deployed successfully and can ping the URL application.
Configuration example
Network configuration
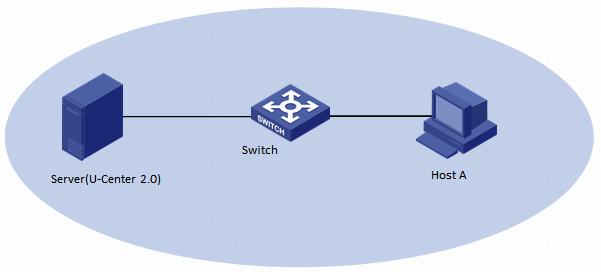
As shown in Figure 1, a host in the DC of a company is configured with multiple services. Each service has a unique URL. The server administrator needs to use U-Center 2.0 to incorporate and monitor the URLs, as shown in Table 1.
|
Host name |
IP address |
Application |
|
Server (U-Center 2.0) |
192.167.253.66 |
U-Center IOM 2.0 (E0707) |
|
Host A |
192.167.252.80 |
URL for the application |
Procedures
Adding a URL application monitor
1. Log in to U-Center 2.0.
2. Click Monitor. On the left navigation tree, select Basic Monitor > Other Resources.
3. Click Add, and select URL from the HTTP Service Monitor list.
The page for adding a URL application monitor opens, as shown in Figure 2.
Figure 2 Adding a URL application monitor

4. Configure the following basic information:
¡ IP Address: Enter the IP address of the application to be monitored. The URL of the application to be monitored in this example is http://192.167.252.80:30000/central, and the IP address is 192.167.252.80.
¡ Name: Enter the name of the application to be monitored. In this example, use name URL_192.167.252.80, which is automatically generated by U-Center 2.0.
¡ Description: Enter the application description as needed. In this example, leave this field empty.
Figure 3 Configuring basic information

5. Configure the following monitor parameters:
¡ Add as Monitor Object: Specify whether to add the application to the monitor when adding the application. This option is enabled by default.
¡ Monitor Template: By default, U-Center 2.0 uses the predefined template named URL. This example uses the default template. To re-select a monitor template or edit the monitor template settings, click Settings. For how to edit a monitor template, see "Configuring a URL monitor template."
¡ Add as Config Poll Object: By default, an application is added as a config poll object. This example uses the default option. To use the Add as Config Poll Object function, you must purchase the corresponding license for the CMDB product to obtain the quantity-based authorization and functional authorization. Without the license, the page does not display the parameter.
¡ Select Agent: Select an agent for the monitor, which is local by default. This example uses the default option and selects the local agent. In the proxy scenario, you must use proxy to incorporate applications (select Proxy as the agent for the monitor).
Figure 4 Configuring monitor parameters

6. Configure the following access parameters:
¡ Monitoring Protocol: Select a monitoring protocol. In this example, select URL.
¡ Click Settings. The Select Monitor Template window opens. From the list, select an access parameter template.
¡ Configure the following access parameters manually:
- Monitor Port: The default port for HTTP is 80, and the default port for HTTPS is 443. In this example, port 30000 is used.
- Protocol: Options include HTTP and HTTPS. In this example, HTTP is selected.
- Relative Path: Relative path in the URL. In this example, / is specified.
- Keyword: Keyword on the on the requested webpages. In this example, no keyword is entered.
Figure 5 Configuring access parameters

7. Configure resource groups. Specify the resource group to which the monitored object belongs in order to facilitate resource management. In this example, this field is not set.
Figure 6 Configuring resource groups

8. Specify whether to enable detection. This example uses the default setting.

9. Click Test Connectivity to check identify whether the parameters are correctly configured.
10. After the test succeeds, click OK.
The system prompts that the object is successfully added, as shown in Figure 8.

11. The added application appears in the Other Resources list.
![]()
Configuring a URL monitor template
U-Center 2.0 uses the monitor template to control the collected indexes and their thresholds. The system has predefined a large number of monitor templates that can be directly used. You can also edit a monitor template as needed to customize the monitor template.
You can set thresholds for concerned indexes. By monitoring the alarm state of monitored resources, you can timely learn the application running state. Common operations include:
· Select an existing index on the index settings tab, and add the threshold settings for the index, as shown in "Adding index threshold configuration."
· Edit the existing threshold configuration, as shown in "Editing index threshold configuration."
Accessing the URL monitor template page
1. Click the Monitor tab.
2. From the navigation pane, select Monitor Options > Monitor Templates.
Figure 10 Monitor template list
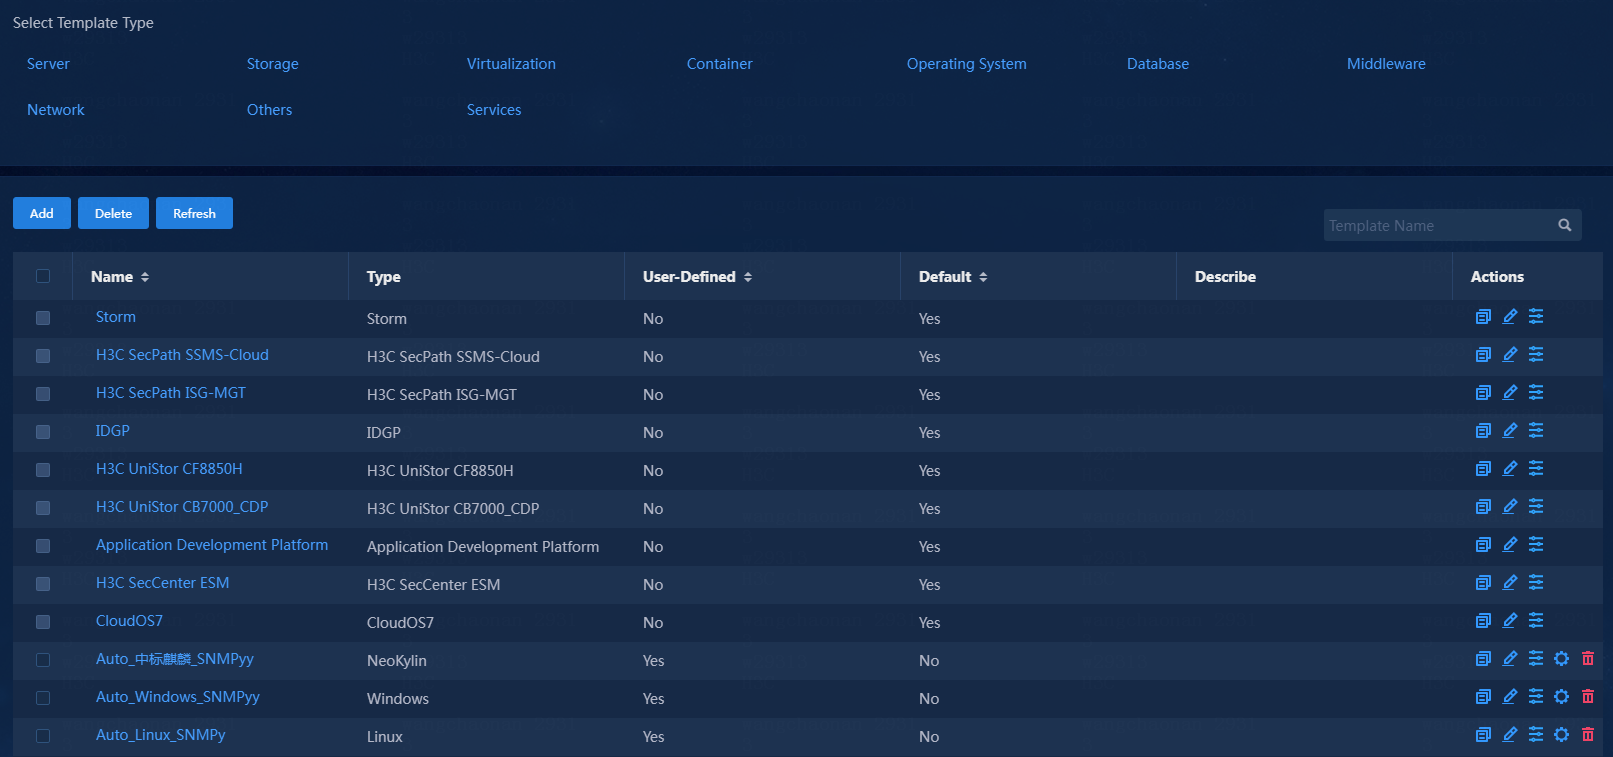
3. In the Select Template Type area, select Others > HTTP Service Monitor > URL. View the URL monitor templates, as shown in Figure 11.
The Actions column provides the following functions:
¡ To
edit a monitor template, click the ![]() icon in the Actions column for that monitor template.
icon in the Actions column for that monitor template.
¡ To
copy a monitor template, click the ![]() icon in the Actions column for that monitor template. The page for
copying that monitor template opens. For example, to copy monitor template A to generate
monitor template A_copy, you can edit and save the new
monitor template information on the page for copying that monitor template.
icon in the Actions column for that monitor template. The page for
copying that monitor template opens. For example, to copy monitor template A to generate
monitor template A_copy, you can edit and save the new
monitor template information on the page for copying that monitor template.
¡ To
edit the threshold configuration for a monitor template, click the ![]() icon in
the Actions column for that monitor template. The
page for editing the threshold configuration for that monitor template opens.
icon in
the Actions column for that monitor template. The
page for editing the threshold configuration for that monitor template opens.
Figure 11 URL monitor template

4. To edit a monitor template, click the ![]() icon
in the Actions column for that monitor template.
icon
in the Actions column for that monitor template.
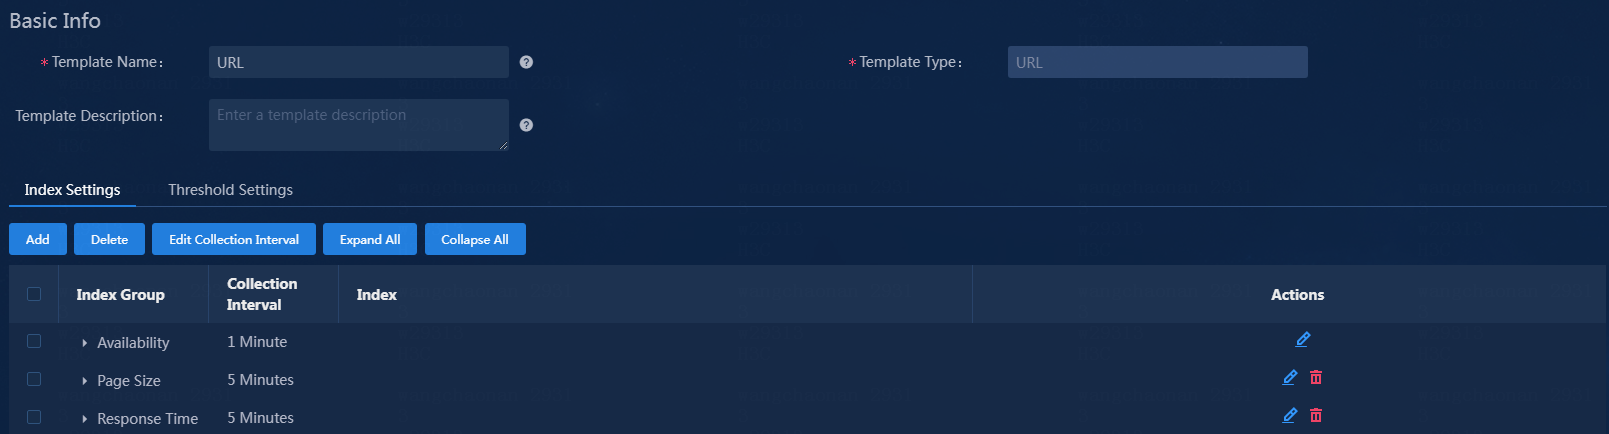
Figure 12 Editing a monitor template
Adding index threshold configuration
This example adds the threshold for the index named Page Size.
1. Expand the index group named Page Size on the index settings tab.
Figure 13 Expanding an index group of a template

2. Click the ![]() icon in the Actions column for the index named Page
Size, and configure the following parameters on the Add Configuration window:
icon in the Actions column for the index named Page
Size, and configure the following parameters on the Add Configuration window:
¡ Threshold Type: For U-Center 2.0, options include Common Threshold, Composite Threshold, Index-Based Rule, and Instance Loss Threshold. Different threshold types need different configurations. Select a threshold type as needed, set the operator, and select a threshold level. Threshold types have been defined for some indexes in U-Center 2.0, and cannot be edited. In this example, select Common Threshold.
¡ Threshold Settings: For the index named Page Size, select Warning in this example, and set the threshold and the maximum number of consecutive occurrences. In this example, select the operator Greater Than. When the page size is greater than 50 for three consecutive occurrences, a warning alarm will be generated.
¡ Applicable Time: Options include All Time and Custom Time. In this example, select All Time.
|
|
NOTE: · All Time: All time ranges after the threshold settings are completed. · Custom Time: Any time ranges on Monday through Sunday. |
Figure 14 Adding threshold settings for the index

3. Click OK to complete the threshold settings for the index named Page Size.
Figure 15 Threshold configuration added

4. If you do not need to edit other parameters in the monitor template, click OK at the bottom of the page to save the configuration.
After a monitor template is successfully edited, the edited monitor template is automatically applied in the next collection interval.
Editing index threshold configuration
This example configures the threshold for the index named Response Time.
1. Expand the index group named Response Time on the index settings tab.
Figure 16 Response Time index group

2. Click the ![]() icon in the Actions column for the index named Response
Time to access the threshold settings tab. Click
icon in the Actions column for the index named Response
Time to access the threshold settings tab. Click ![]() in the Actions column.
in the Actions column.
The Edit Configuration window open.
¡ Threshold Type: For U-Center 2.0, options include Common Threshold, Composite Threshold, Index-Based Rule, and Instance Loss Threshold. Different threshold types need different configurations. Select a threshold type as needed, set the operator, and select a threshold level. Threshold types have been defined for some indexes in U-Center 2.0, and cannot be edited. In this example, select Common Threshold.
¡ Threshold Settings: For the index named Response Time, select Notification and Warning in this example, and set the threshold and the maximum number of consecutive occurrences for each alarm level. In this example, select the operator Greater Than. When the response time is greater than 50 or 100 ms, a notification or warning alarm will be generated.
¡ Applicable Time: Options include All Time and Custom Time. If you select Custom Time, you can configure any time ranges on Monday through Sunday. In this example, select All Time.
Figure 17 Editing configuration

3. Click OK to complete editing the threshold settings for the index named Response Time.
Figure 18 Threshold configuration edited

4. If you do not need to edit other parameters in the monitor template, click OK at the bottom of the page to save the configuration.
Verifying the configuration
Viewing the URL application monitor reports
|
|
NOTE: · If the value of an index exceeds the corresponding threshold, the background color of the value in the monitor report changes to the color for alarms of the corresponding level defined in U-Center 2.0. · If an application has triggered alarms of different levels, the alarm state displays the highest level of alarms triggered. · U-Center 2.0 provides multiple time spans for an index, including
Past 1 hour |
Viewing other resources details
1. Click the Monitor tab.
2. From the navigation pane, select Basic Monitor > Other Resources. The other resources page opens.
3. On the other resources page, view the other resources monitor list.
After a period of collection time, the alarm state has changed, as shown in Figure 19.
Figure 19 Viewing the other resources monitor list

4. Click the URL_192.167.252.219 link. On the resource details page that opens, view the monitor reports.
Figure 20 URL application resource details (partial)

Viewing the availability today section
Figure 21 Availability today
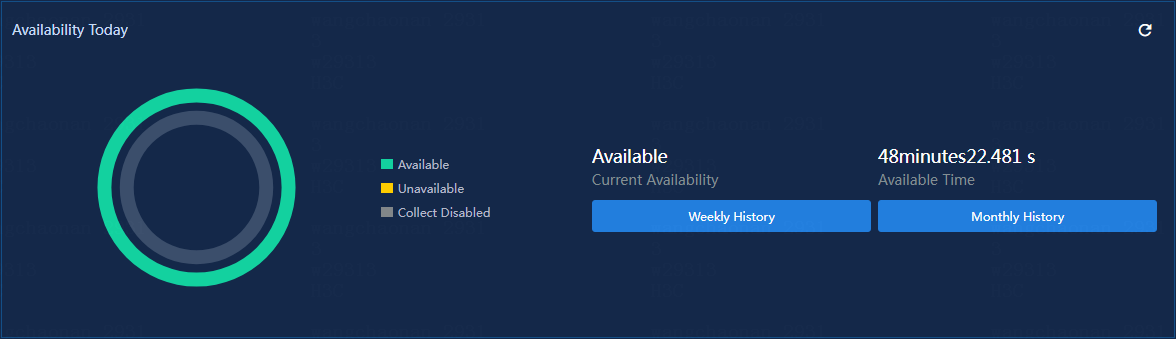
· Pie Chart: Displays the percentage of each availability state of the application today. To view the percentage of an availability state, hover over the slice in the pie chart.
· Current Availability: Current availability of the application.
¡ Available: Total normal running time of the application since 00:00 today.
¡ Unavailable: Total protocol connection failure time of the application since 00:00 today.
¡ Connect Disabled: Total connection disabled time of the application since you manually disabled the collection state for the monitor on the device.
For a newly added application monitor, the Available, Unavailable, and Collect Disabled fields are collected since the time when the application monitor was added today. An availability state with the time of 0 is not displayed.
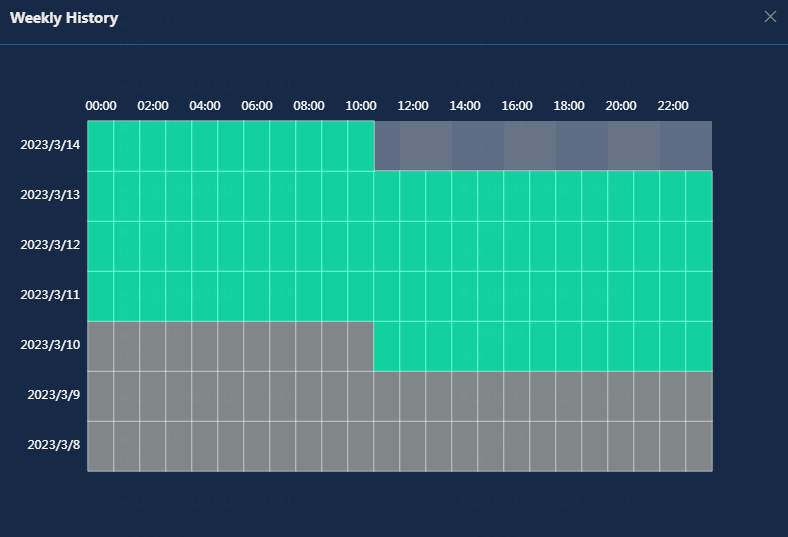
· Weekly History: Click this button to view the availability of the application in the last 7 days. The weekly history collects the application availability in the unit of hours. When you hover over a time span, you can view the percentage of each availability state of the URL application within the time span.
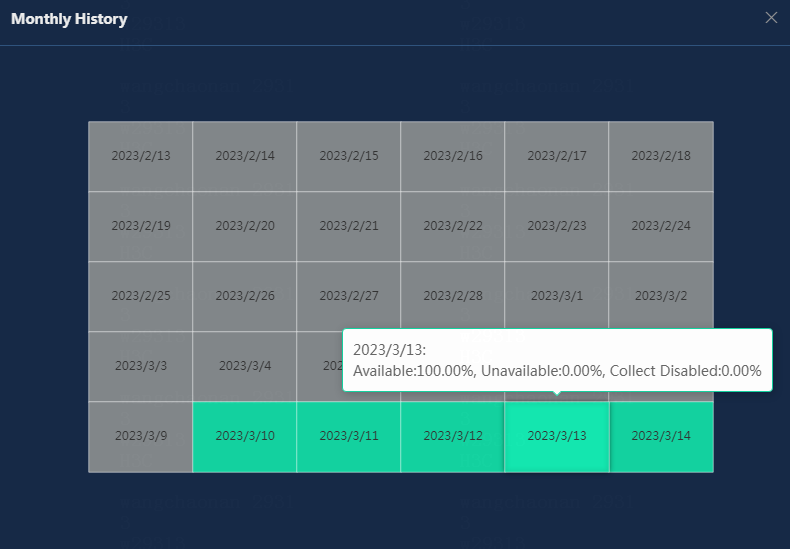
· Monthly History: Click this button to view the availability of the application in the last 30 days. The monthly history collects the application availability in the unit of days. When you hover over a time span, you can view the percentage of each availability state of the URL application within the time span.
Viewing the response time section
Figure 24 Response time
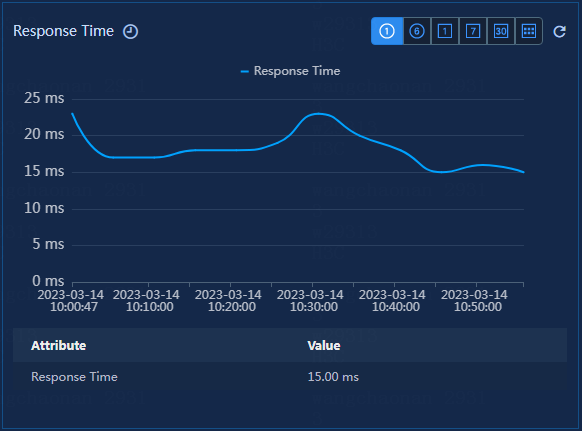
Response time: Time from when U-Center 2.0 sends a request packet to when U-Center 2.0 receives a response packet.
Viewing the page size section
Figure 25 Page size

· Page Size: Size of the current page, in bytes.
· Rate of Change: Ratio of the page size difference before and after the collection interval to the last page size.
Viewing the keyword section
Figure 26 Keyword
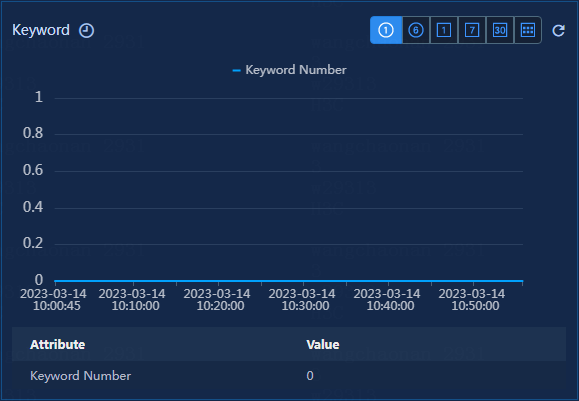
· Keyword: Keyword on the requested webpage.
· Keyword Number: Number of keywords contained on the webpage. Because U-Center 2.0 cannot parse the HTML or Java codes on the webpage, this value is different from that counted through the browser.
Viewing the response code section
Figure 27 Response code
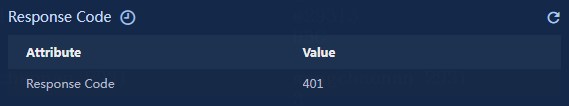
Response code: Response code for the requested URL. For meanings of response codes, see the HTTP status codes.
Associated threshold tab
This page displays the summary threshold settings for the URL application.
Figure 28 Associated threshold

Viewing the URL threshold alarms
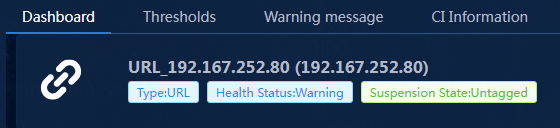
In the URL resource details window, the Dashboard tab displays the name, type, health status, and suspension state of the monitored application. If an application has triggered alarms of different levels, the health status displays the highest level of alarms triggered.
In this example, Notification alarms and Warning alarms can be generated for the URL application, and the Warning alarms are displayed.
Figure 29 URL monitor dashboard
1. Click the health status link or the warning message tab.
The warning message page opens.
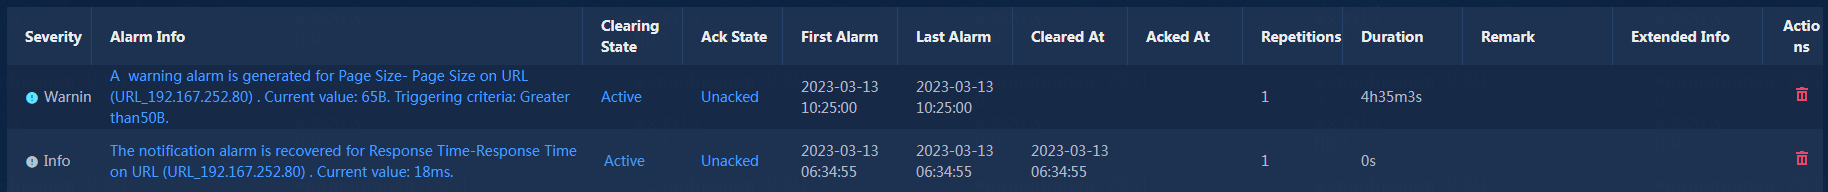
2. Click the link in the Alarm Info column to directly view the alarm details, as shown in Figure 31 and Figure 32.
Figure 31 Warning-Alarm details
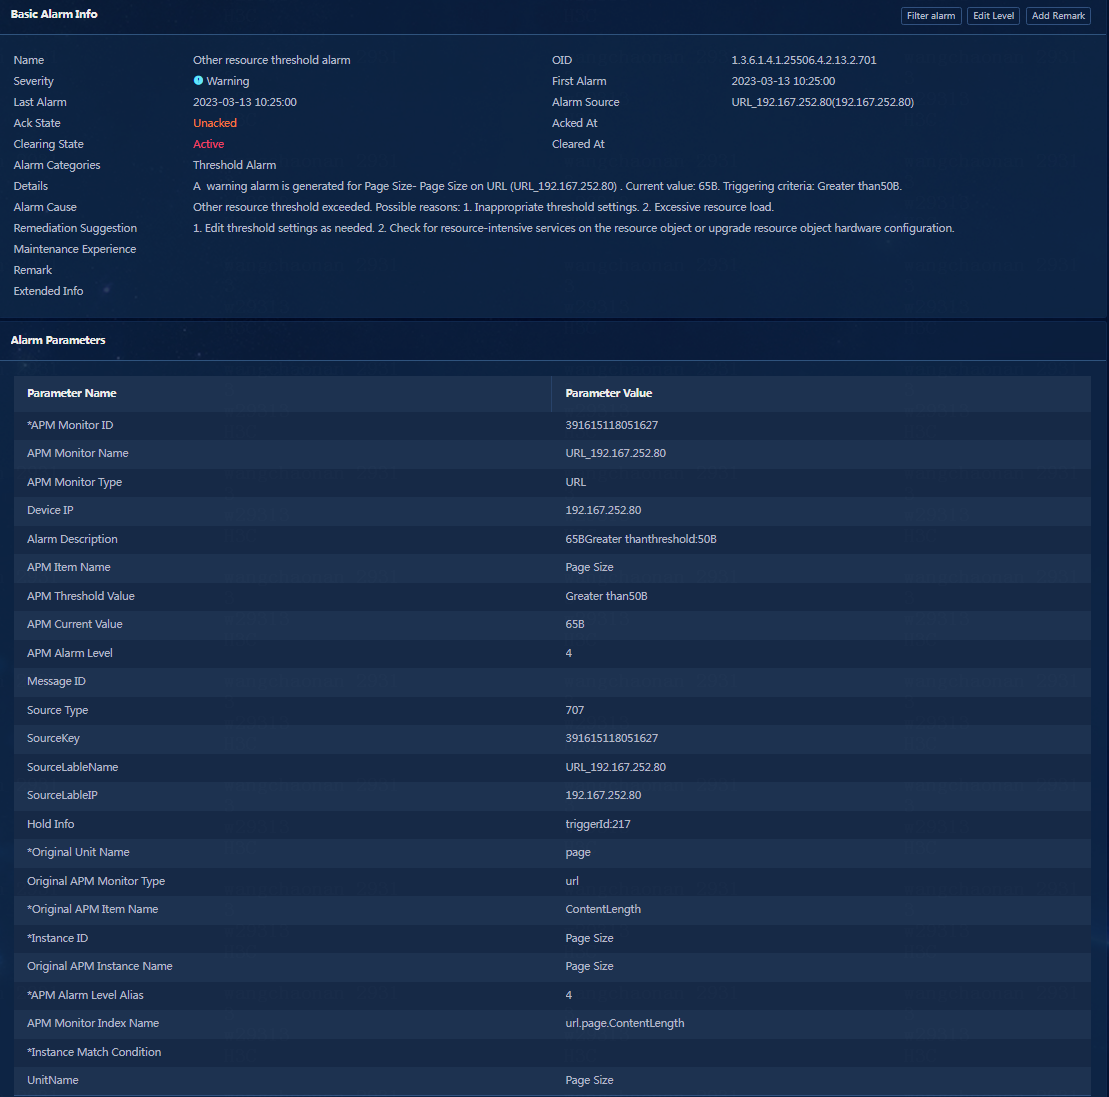
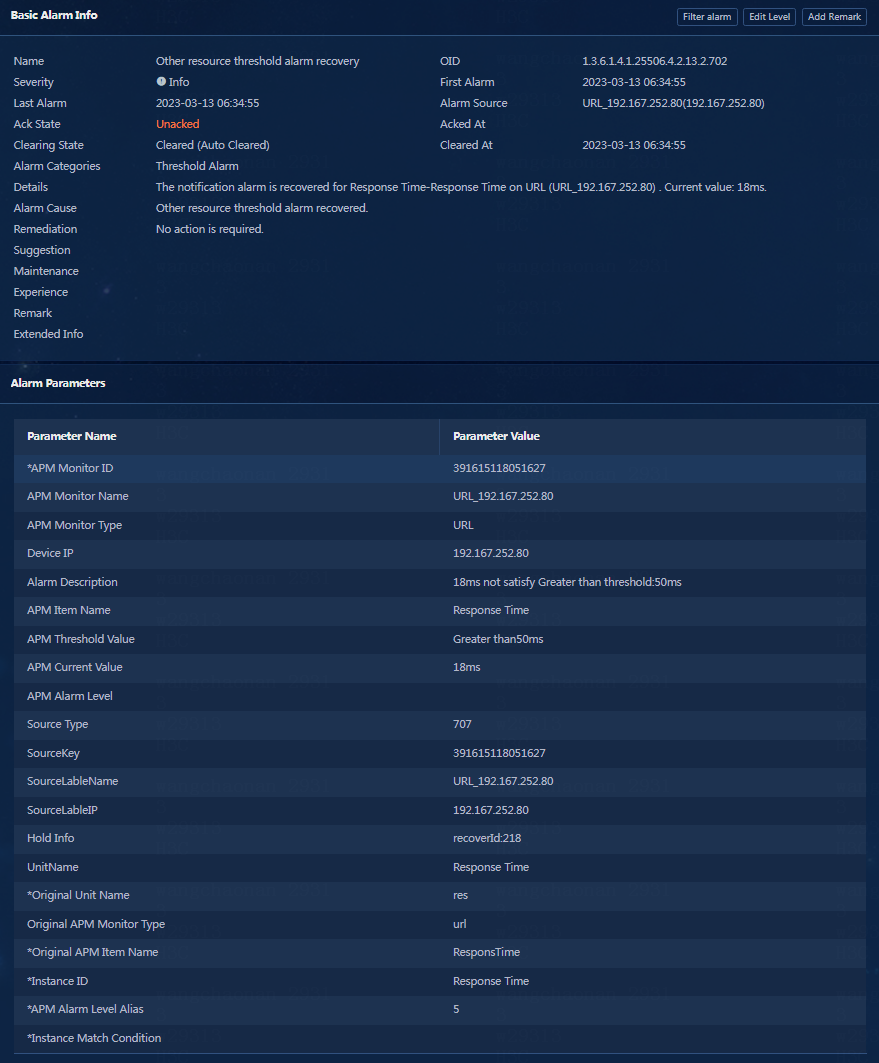
Figure 32 Notification-Alarm details
3. After you receive the threshold alarm generated by the page size and confirm that the related information is correct, you click the Unacked link in the Ack State column to acknowledge the alarm.
Figure 33 Page size threshold alarm–Acknowledging the alarm
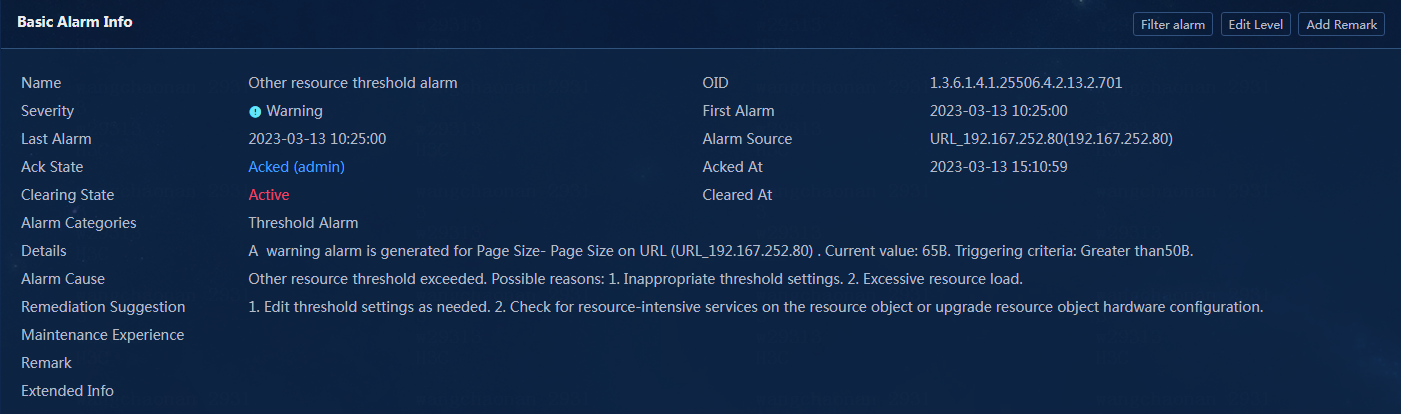
4. After you resolve issues in the environment or set the threshold again, you can click the Active link in the Clearing State column to clear the alarm, as shown in Figure 34.
Figure 34 Page size threshold alarm–Clearing the alarm
![]()
5. U-Center 2.0 periodically monitors applications. If the metric values collected in the next period no longer meet the threshold conditions, the alarm will be automatically cleared, and the new metric value will be recorded.
Figure 35 Response time–Automatically clearing the alarm

6. After you confirm that the related information is correct, you click the Unacked link in the Ack State column to acknowledge the alarm.
Figure 36 Response time–Acknowledging the alarm

7. After all alarms are cleared, the alarm state of the URL application will be restored to normal.

