| Title | Size | Downloads |
|---|---|---|
| H3C HDM2 Technology White Paper-6W102-book.pdf | 7.08 MB |
- Table of Contents
- Related Documents
-
| Title | Size | Download |
|---|---|---|
| book | 7.08 MB |
|
|
|
|
|
H3C HDM2 |
|
Technology White Paper |
|
|
Copyright © 2024 New H3C Technologies Co., Ltd. All rights reserved.
No part of this manual may be reproduced or transmitted in any form or by any means without prior written consent of New H3C Technologies Co., Ltd.
Except for the trademarks of New H3C Technologies Co., Ltd., any trademarks that may be mentioned in this document are the property of their respective owners.
The information in this document is subject to change without notice.
Access capability and management interface
Server deployment capabilities
Functions related to device migration and retirement
Server management capabilities
Server monitoring capabilities
Optimization points of the host's operational capacity
FRU and asset information management
Physical drive management for a storage controller
Marvell M.2 storage controller management
Displaying basic GPU information
GPU module out-of-band upgrade
Powering on or powering off the server
Configuring the server system startup policy after power-on
Cold standby power supply monitor
Dynamic active/standby power supply mode
Historical power consumption statistics
Security monitoring information
Preface
Audience
This document is applicable to the following audience:
· Pre-sales engineers for servers.
· Field technical support and servicing engineers.
· Network administrators.
Revision records
|
Date |
Revised version |
Description |
Revised by |
|
2024-2-22 |
V1.5 |
Added "OTP authentication." |
Platform software |
|
2024-1-12 |
V1.4 |
Added "Black box (log download)." |
Platform software |
|
2023-12-29 |
V1.3 |
1. Added support for the following features: ¡ Support for HTTP 2.0 ¡ Switchover between two Web themes ¡ IPv4 and IPv6 static route configuration ¡ Setting BIOS boot suboptions ¡ Risk prompts for HDM and BIOS upgrade ¡ Support for Intel On Demand ¡ Power supply black box ¡ HDM system maintainability ¡ Memory anti-counterfeit ¡ LDAP certificate import ¡ Fast OS installation ¡ Added support of AMD for MCTP over PCIe out-of-band management ¡ Out-of-band management and remaining lifespan display of the NVMe-MI controller 2. Updated overall workflow 3. Edited fault diagnosis, MRT, and other features |
Platform software |
|
2023-10-24 |
V1.2 |
Cleared information related with old software versions |
Platform software |
|
2023-10-19 |
V1.1 |
Added parameter information of the BMC chip in "HDM overall architecture" and "Silicon root of trust." |
Platform software |
|
2023-7-25 |
V1.0 |
First release |
Platform software |
Applicable products
This document is applicable to H3C G6 servers, including the following:
· H3C UniServer B5700 G6
· H3C UniServer R3950 G6
· H3C UniServer R4300 G6
· H3C UniServer R4700 G6
· H3C UniServer R4700LE G6
· H3C UniServer R4900 G6
· H3C UniServer R4900 G6 Ultra
· H3C UniServer R4900LE G6 Ultra
· H3C UniServer R4950 G6
· H3C UniServer R5350 G6
· H3C UniServer R5300 G6
· H3C UniServer R5500 G6
· H3C UniServer R6700 G6
· H3C UniServer R6900 G6
Overview
HDM2 is an upgraded version of HDM. In addition to inheriting existing functionalities, HDM2 is optimized for multiple application scenarios and provides corresponding compatible features. It adds intelligent-related attributes to support the strategy of the dual-core integration. It also offers enhanced license services, including memory intelligent repair, expansion of unified management for up to 200 devices, Kerberos authentication and single sign-on, one-click retirement, system configuration locking, intelligent tuning, and security monitoring information.
For the sake of convenience, HDM2 is referred to as HDM.
About HDM
Hardware Device Management (HDM) is a remote server management system. It complies with IPMI, SNMP, and Redfish standards and provides various functions, including keyboard, video, and mouse redirection, text console redirection, SOL connection, remote virtual media, and reliable hardware monitoring and management. HDM supports abundant features as described in Table 1.
|
Description |
|
|
Various management interfaces |
Provides abundant management interfaces, such as IPMI, HTTPS, SNMP, and Redfish, to meet various system integration requirements. |
|
Unified control |
Reduces O&M costs of servers in the small and medium-sized enterprises by implementing the unified control in a small scale. |
|
LCD display |
A touchable 3.5-inch or 2.5-inch LCD display is optional for some servers to facilitate on-site inspection or maintenance. |
|
Fault monitoring and diagnosis |
Provides fault location and diagnosis for maintenance to ensure correct 24×7 device operation. The fault logs can be reported proactively through SNMP traps, SMTP, Redfish event subscription, and syslog messages. |
|
Critical OS event screenshot and video recording |
Takes a screenshot or records a video upon a critical OS event (for example, a crash) for future troubleshooting. |
|
Out-of-band RAID management |
Supports out-of-band RAID monitoring and configuration to improve RAID configuration efficiency and management capability. |
|
Smart power supply management |
Supports power capping to increase deployment density, and provides power management to reduce operation costs. |
|
KVM, VNC, and virtual media |
Facilitates remote server maintenance. |
|
DNS, LDAP, and AD, Kerberos |
Supports domain management and directory services to simplify server network management and user management. Kerberos implements single sign-on to avoid repeated authentication and authorization. |
|
USB Wi-Fi adapter |
Supports an external Xiaomi or 360 portable Wi-Fi adapter to facilitate near-field maintenance and management of the server. |
|
Primary/backup image switchover |
Enables startup by using the backup image if the system crashes, which enhances system availability. |
|
Firmware update |
Supports various out-of-band firmware update for HDM, BIOS, CPLD, LCD (firmware package before 1.05), drives, network adapters, storage controllers, GPU modules, REPO packages, and so on. It also supports cold and hot patch updates for HDM, ensuring uninterrupted fault recovery services. Firmware update supports firmware libraries and queues, allowing operators to schedule firmware updates as needed, minimizing impact on service operations. |
|
Software inventory |
Supports obtaining out-of-band firmware version information and in-band operating system software and driver information, including location, name, version, and update time. |
|
Service USB device |
Supports log downloading to simplify on-site maintenance and management. |
|
Asset management |
Simplifies asset management. |
|
Security management |
Ensures server security concerning service access, user accounts, data transmission, and storage, and supports two-factor authentication, whitelist and blacklist rules (firewall), management interfaces, SSL, silicon root of trust, and custom user privileges. |
|
One-click retirement |
Restores server components to the default by one click to implement secure retirement. |
HDM overall architecture
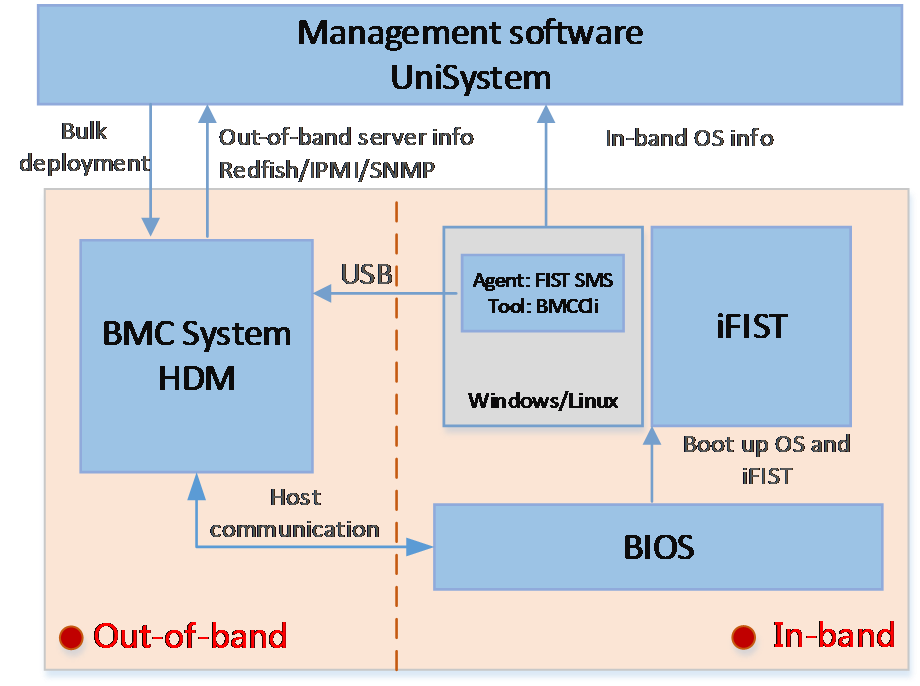
H3C server management software is as shown in Figure 1. HDM is an embedded system that operates independently from the host server. It is used for out-of-band management of the entire server, and cooperates with software such as BIOS, UniSystem, iFIST, FIST SMS, and hREST for server deployment, monitoring, and maintenance. HDM acts as the core and foundation of intelligent server O&M and lifecycle management.
Figure 1 H3C server management software
The system architecture of HDM is as shown in Figure 2. HDM adopts server-specific system on chip (SoC) with processor main frequency 1.2GHz and total memory size 1GB to effectively manage server hardware components. SoC supports KVM, 64MB local VGA display, dedicated and shared network ports, and various board-level management features and peripheral interfaces as follows:
· KVM remote control—Uses the KVM module to process video data and keyboard and mouse data as follows:
a. The KVM module receives video data from the host system through the VGA connector, compresses the video data, and then sends the compressed data to a remote KVM client.
b. The KVM module receives keyboard and mouse data from the remote KVM client, and transmits the data to the host system by using a simulated USB keyboard and mouse device.
· LPC/eSPI communication and IPMI management—Provides the traditional LPC/eSPI system interface for communication with a server and supports the standard IPMI management.
· Remote access through GE interfaces—Provides dedicated GE interfaces through which remote management can be implemented by using IPMI, Redfish, or SNMP over the network.
· NCSI and VLAN support—Supports network controller sideband interface (NCSI) and VLANs, allowing for flexible network management.
· Remote consoles—Supports KVM redirection, text console redirection, remote virtual media (used to map optical drivers, drives, and folders of terminals to the server), and IPMI 2.0-based hardware monitoring and management.
· Sensor-based monitoring and management—Monitors the temperature and voltage in a server through sensors, and also manages fans and power supplies (PSUs) in an intelligent way.
· Two SD cards (Nand flash) attached to HDM—SD card 1 is inserted as a card for saving iFIST images, which is not supported on some servers. SD card 2 is used for recording server operation and diagnosis log, including configuration information, operation log, and event log.
Figure 2 HDM system architecture

The main software architecture of HDM is as shown in Figure 3. The software capabilities of HDM primarily include the following:
· Chassis management—Monitors and manages sensors, power supplies, and other components.
· BMC system management—Provides security management, time management, and network management.
Figure 3 HDM software architecture
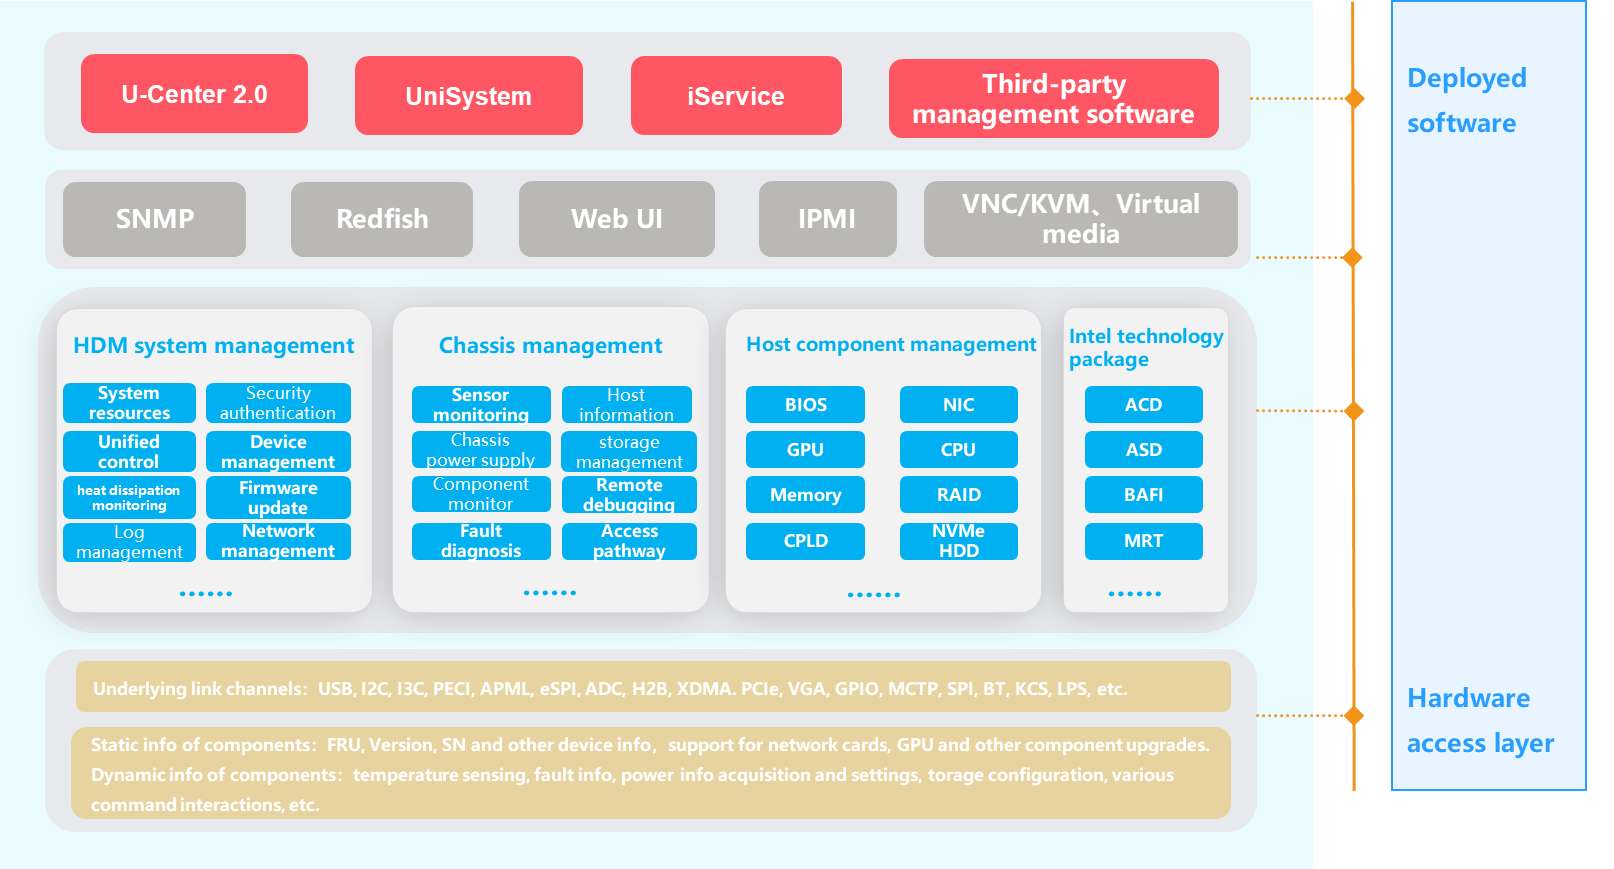
HDM provides abundant user interfaces, such as the Web-based user interface, CLI, IPMI interface, Redfish interface, and SNMP interface. All interfaces adopt authentication mechanisms and highly secure encryption algorithms to ensure access and transmission security.
HDM capabilities
The overall strategy of H3C servers is to implement built-in intelligence for empowering intelligent computing. To implement this strategy, three main underlay platforms are available: AI platform, multivariate computing system platform, and intelligent management platform. On these platforms, servers can sense the load, analyze computing power requirements, efficiently generate and aggregate computing power, and intelligently schedule computing power to fully deploy applications. HDM, from the perspective of servers, supports the implementation of the intelligent management platform by focusing on the various aspects of daily operation and maintenance of servers. It provides intelligent management of data center servers throughout their lifecycle, including intelligent deployment, tuning, energy saving, diagnosis, and retirement. This effectively helps enterprises improve operational efficiency and reduce operational costs. Customers can flexibly configure and deploy servers according to their specific business needs, creating their own dedicated operational environment and providing corresponding firmware support to maximize the capabilities of server hardware. The firmware on servers mainly includes the following types:
· Server host: BIOS on all server models, and OS, iFIST, and FIST SMS for some server models.
· Hardware: Firmware for cards and components.
· Out-of-band management firmware: HDM.
The firmware on the server acts as the management interface for hardware resources and the external access interface for components. From users' perspective, the firmware should possess several capabilities in addition to fulfilling service requirements:
· Access capabilities and management interfaces: Describe how users access servers and the interfaces exported externally by servers.
· Deployment: Covers services in the entire lifecycle of devices, including onboarding, management, migration, and retirement, and supporting features related with parameter configuration and firmware maintenance. The deployment and management functions primarily include device onboarding, configuration, system deployment, firmware update, device migration, and retirement.
· Management: Provides external management capabilities to servers and various components inside the servers, including asset management, inspection, device topology discovery, firmware information, device management, hardware parameter configuration, and BIOS and BMC configuration.
· Monitor: Provides external monitoring of the server operation status, including sensors, log subsystems, reporting channels for types of events especially alarm events, system monitoring status, channels for component alarming and early-warning alarming, and host monitoring capability.
· Diagnosis: Collects relevant contextual information of anomalies, utilizes multiple built-in rules for fault diagnosis, and automatically identifies fault points to locate faulty components in conjunction with server-embedded monitoring capability when anomalies occur. Key features include alarm source monitoring, fault handling mechanism, fault reporting, and maintainability-related features.
· Security: Provides security capabilities for servers.
· Performance: Improves out-of-band response capabilities of servers.
This document focuses on the following aspects:
· Introduces the corresponding solutions provided by H3C servers from the servers' usage scenario and requirements.
· Explains the principles behind each technology from the perspective of the server chassis and key technologies.
· Briefly provides application scenarios for each solution and technology.
Product features
Access capability and management interface
Server access
Considering the different focuses of different users in different scenarios, H3C servers provide a variety of management interfaces and access capabilities. Server access features the following:
· Ease of use: Convenient and easy-to-use configuration capabilities allow users to quickly get started.
· Security: Use various means to ensure the security of each link, which has been verified by multiple security laboratories.
· High performance: Continuously pursuing ultimate performance in terms of both startup and interface access.
· Multiple access methods: Multiple access methods meet the needs of various scenarios.
· Scenario-based optimization: Provides enhanced configurations for applications such as security and reliability, facilitating targeted optimization for users.
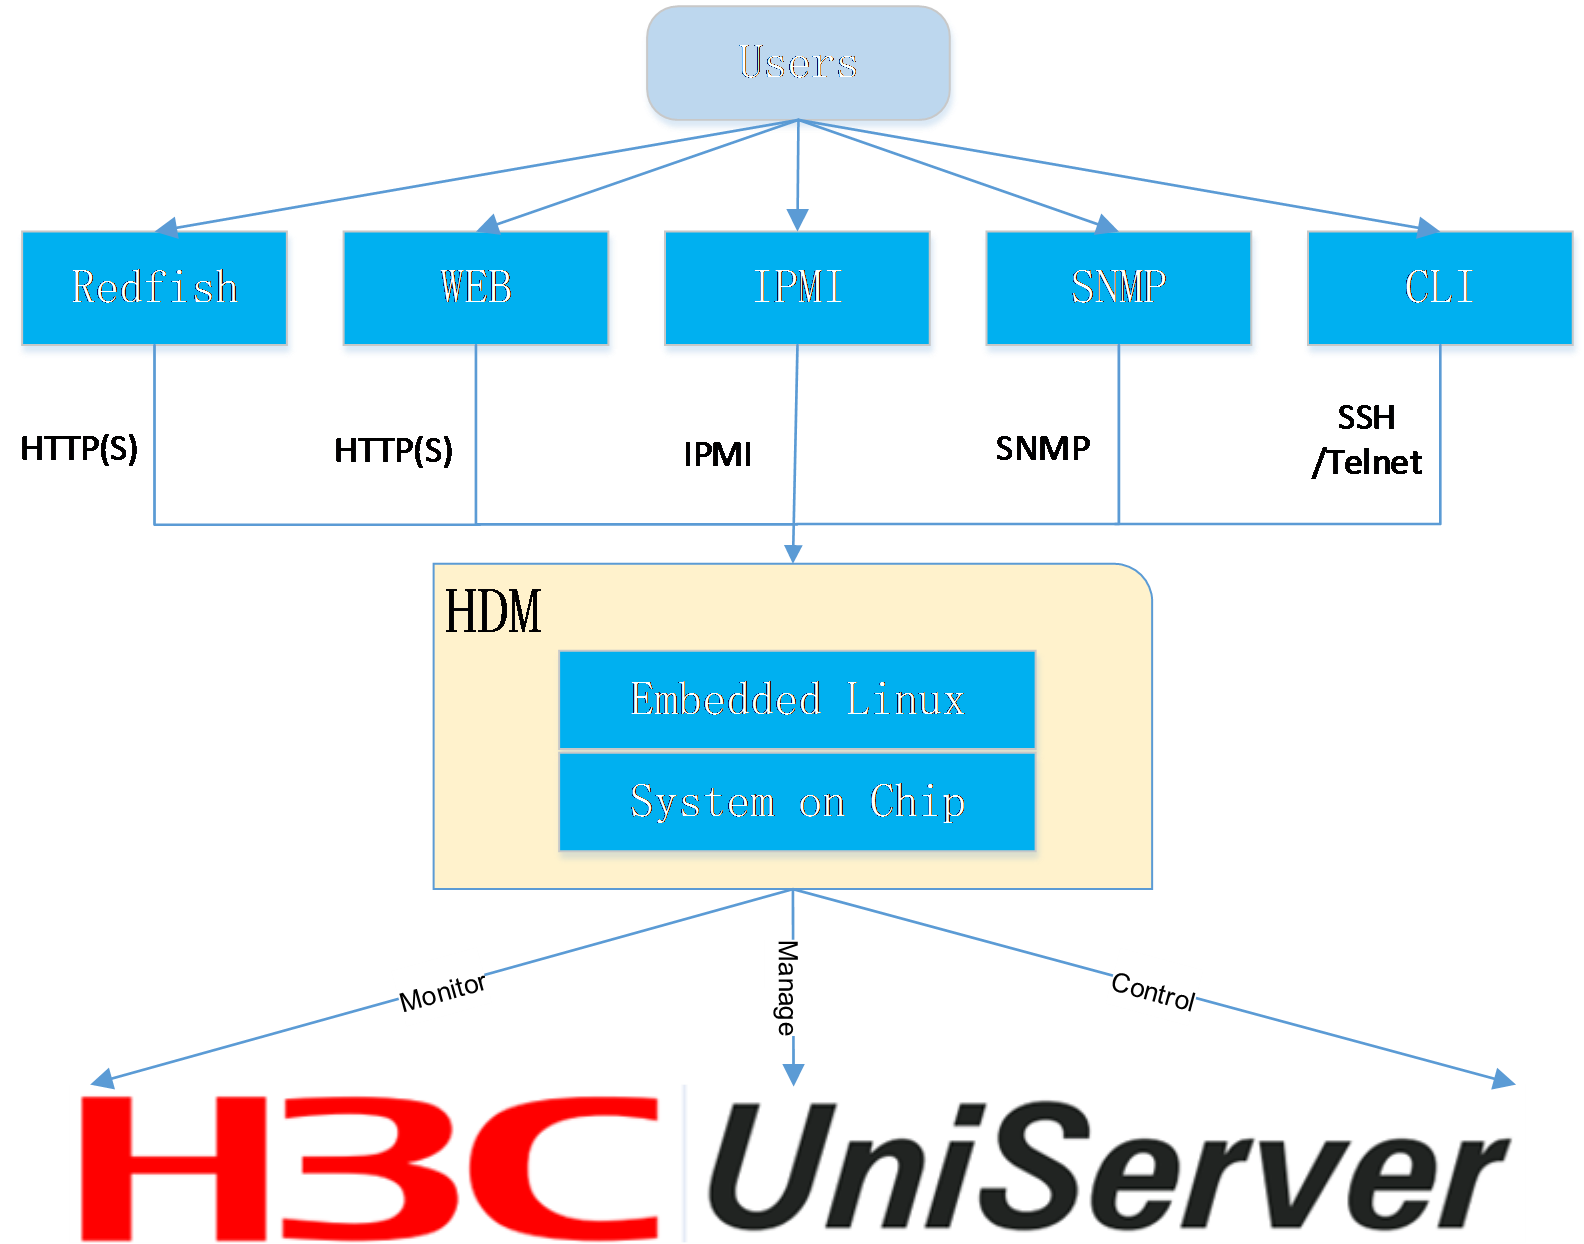
Out-of-band monitoring
The methods to monitor a server include the following types: in-band and out-of-band. The out-of-band interfaces for accessing HDM mainly include Web-based HTTP/HTTPS, Redfish, IPMI, SNMP, and CLI. The HDM out-of-band interface method is shown in Figure 4.
Figure 4 HDM out-of-band interface
Ease of use
In terms of usability, the main features implemented by HDM are as follows:
· Automatic discovery of connected server devices if used together with UniSystem.
· Access based on the default IP address on the device.
Multiple access methods
In terms of diversity of access, the server provides the ability to directly access devices through manual means. The capabilities provided are as follows:
· Access of the HDM webpage through the shared port, dedicated port, or USB Wi-Fi.
· Access of the BIOS using VGA+keyboard.
· Access of the BIOS port through the device interface (serial port).
· Access of the HDM SHELL via device interface (serial port).
The server also provides the ability to access HDM and the BIOS through a management interface, providing the following capabilities:
· By accessing the BIOS and HDM through the interface of the OS, intelligent in-band deployment of servers can be achieved, including functions such as firmware upgrade, configuration management, and log download.
· Accessing HDM with IPMI tools through an out-of-band network enables integration with external management tools.
· Redfish interface can be used to access HDM through out-of-band network for external management tool integration.
· With the unified control feature, other devices' HDM can be accessed through the out-of-band network.
· The BIOS accesses corresponding resources using network services through the in-band network.
· Resources provided by the corresponding network service can be accessed through the KVM interface.
In addition, the device provides LEDs, an LCD display panel, and a security bezel for users to check the operating status of the equipment on site.
Note that the specific access methods may vary across different products. For more information, see the corresponding product manual.
Management interfaces
HDM further expands its interface on the basis of server hardware interfaces to meet the access needs of various scenarios.
Web management interface
HDM provides a Web-based visual management interface based on HTTPS.
· It enables users to quickly complete setup and query tasks through a simple interface operation.
· Through the remote consoles, you can monitor the entire process of OS startup, perform OS tasks on the server, and map optical drives/floppy drives on the server.
· HDM also supports HTTP 2.0. Compared to HTTP 1.1, HTTP 2.0 significantly improves Web performance and reduces network latency, enhancing transmission reliability and security.
· You can toggle between English and Chinese. HDM supports two skin themes, minimalist white and starry blue.
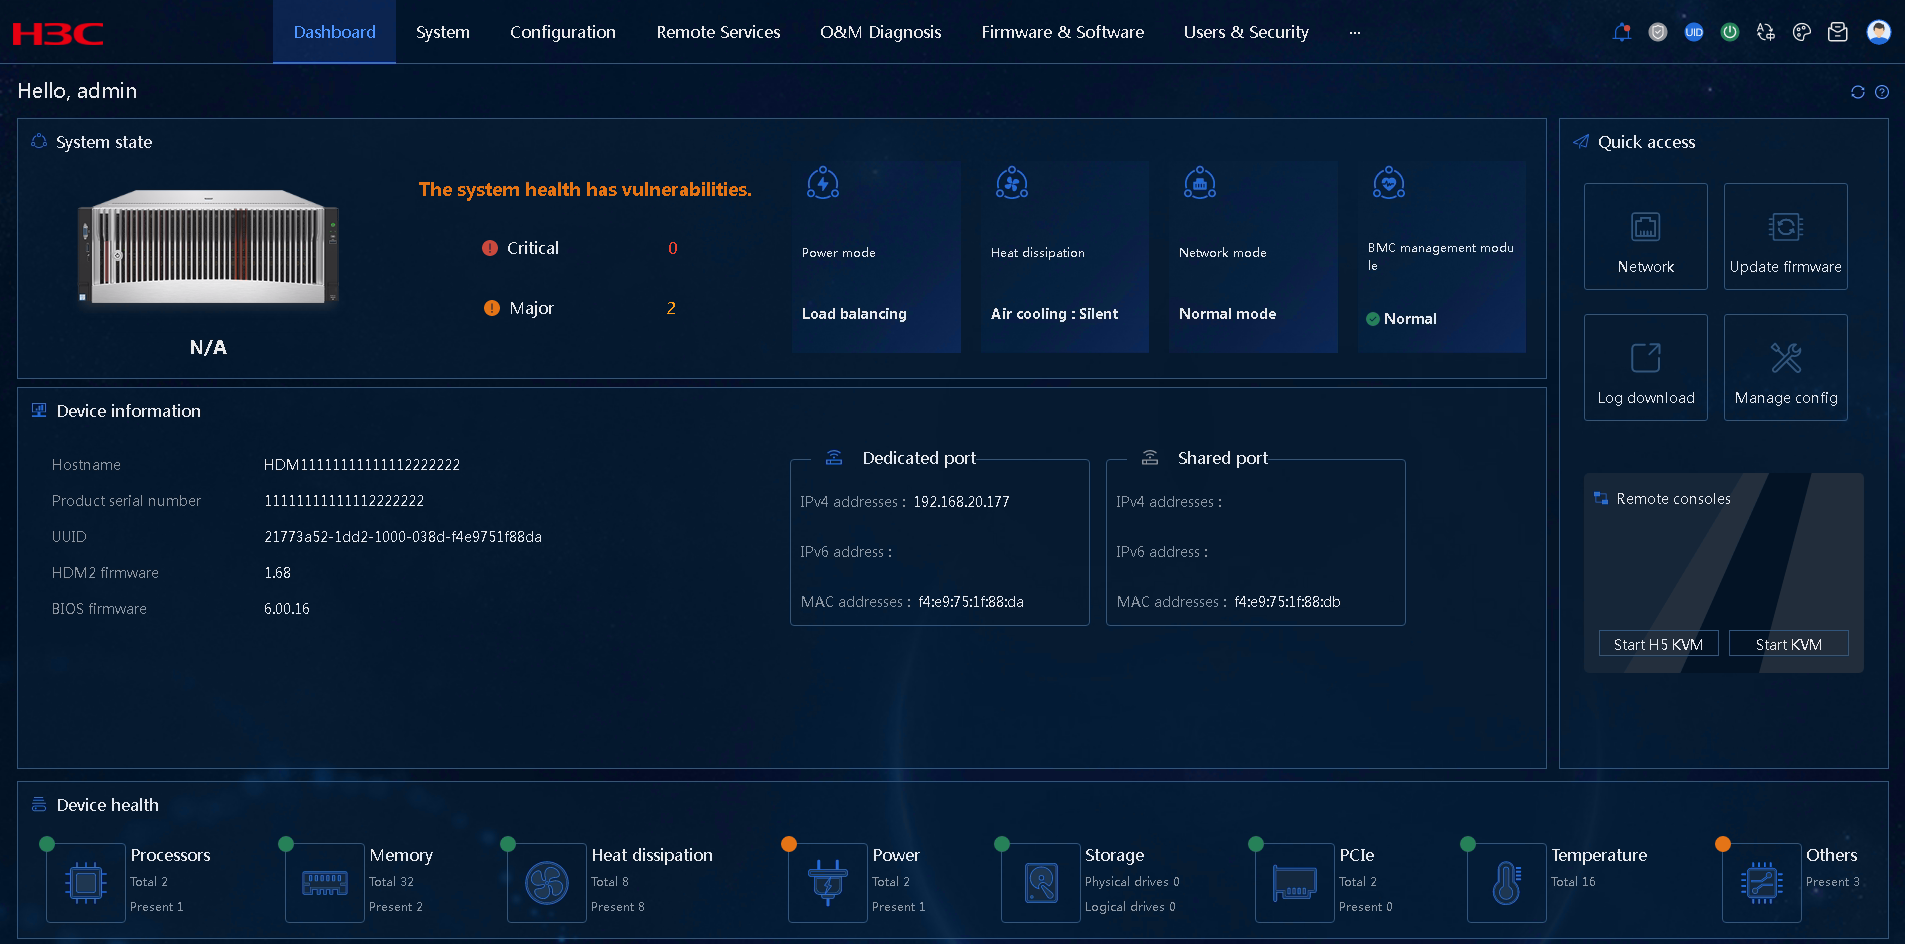
Figure 5 HDM homepage in minimalist white
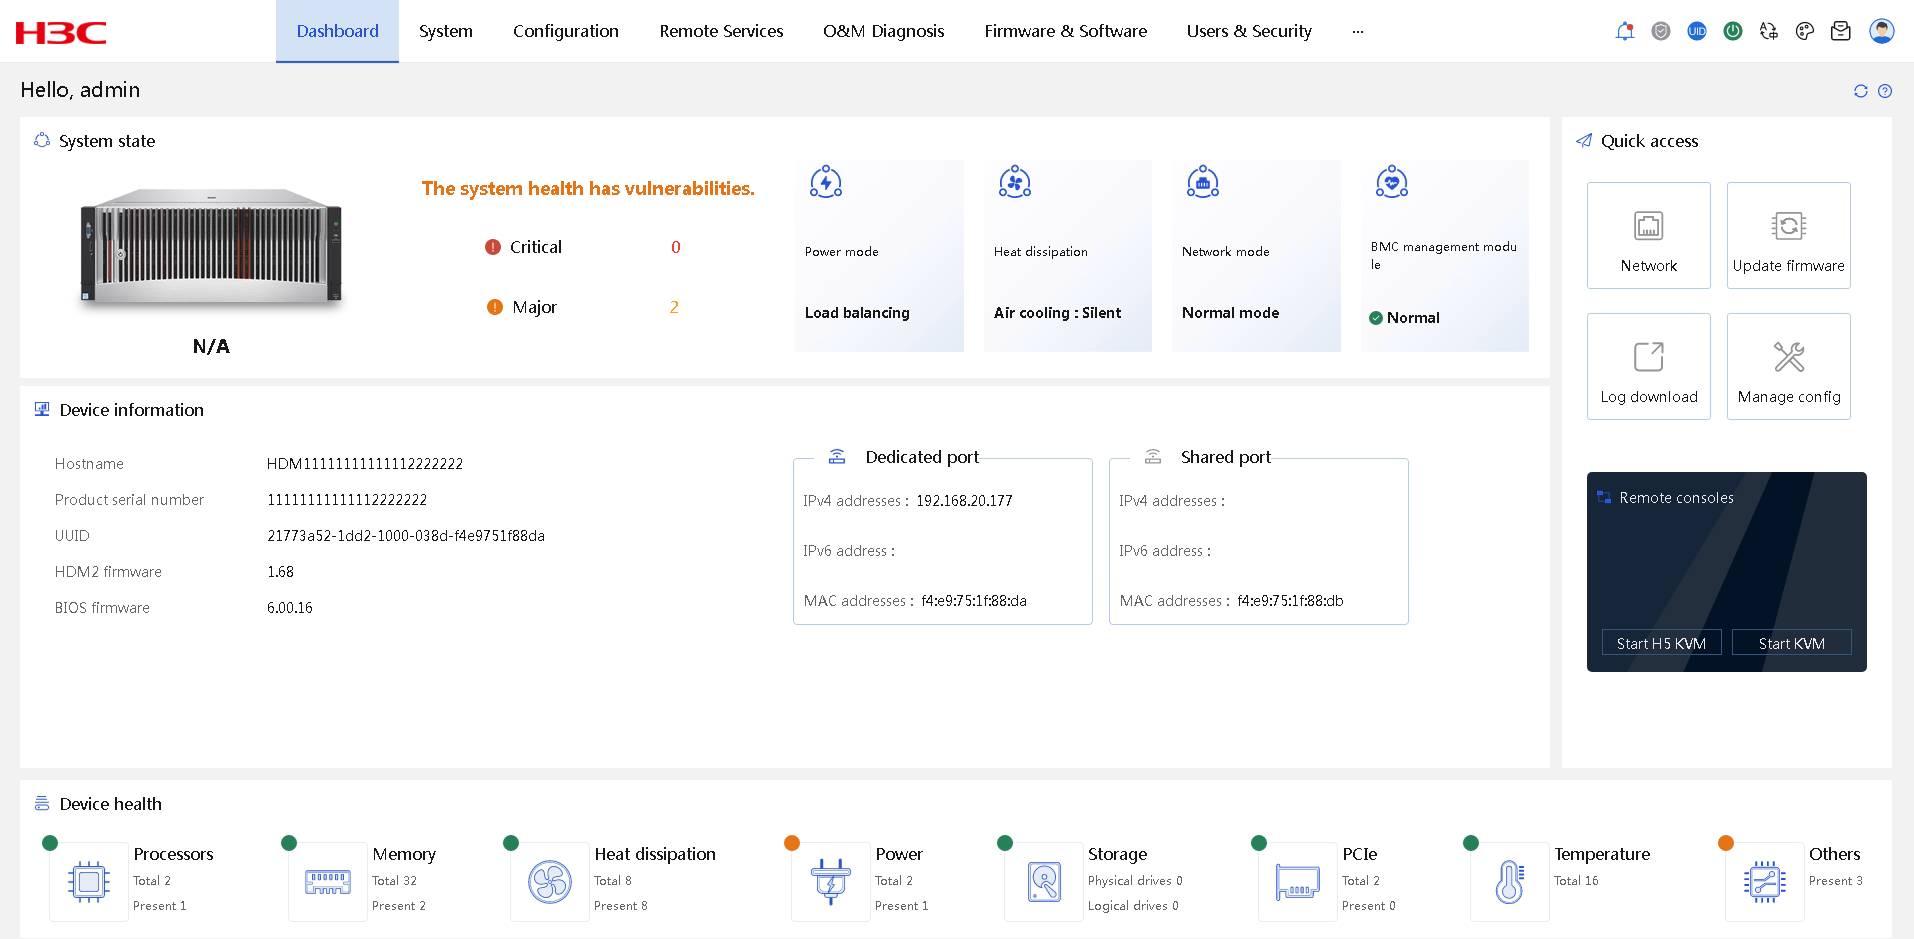
Figure 6 HDM homepage in starry blue
You can open the login interface of HDM Web by entering the IP address (IPv4 or IPv6) or domain address of the HDM's network port into the browser's address bar, and then log in with your account.
Supported browsers include Firefox 90 and above, Chrome 80 and above, Edge 108 and above, and Safari 14 and above.
IPMI management interface
HDM is compatible with the IPMI 1.5/IPMI 2.0 specifications. The Data Center Management Interface (DCMI, a supported data center management interface) enables effective management of servers through third-party tools (such as ipmitool) based on the LPC/eSPI channel or LAN channel, or through the BMCCLI tool based on the USB channel.
· LPC/eSPI channel: Runs the KCS/BT protocol. The ipmitool and other tools must be run on the server's local operating system.
· LAN channel: Runs UDP/IP protocol. The ipmitool and other tools can remotely manage servers.
· USB channel: Runs BMCCLI protocol. BMCCLI tool must run on the server's local operating system.
BMCCLI tools and third-party tools support Windows and Linux systems.
For more information about supported IPMI functions in HDM2, see H3C HDM2 IPMI Basics Command Reference.
SNMP management interface
Simple Network Management Protocol (SNMP) is a communication protocol between management process (NMS) and agent process (Agent). It specifies the standardized management framework, common language of communication, corresponding security, and access control mechanisms for monitoring and managing devices in a network environment.
SNMP has the following technical advantages:
· TCP/IP-based standard protocol, with UDP as the transportation layer protocol.
· Automated network management. Allowing network administrators to use the SNMP platform to retrieve information, modify information, troubleshoot, diagnose faults, perform capacity planning, and generate reports on nodes on the network.
· Shield the physical differences of different devices to achieve automated management of products from different vendors. SNMP provides only the basic functionality set, enabling management tasks to be relatively independent of the physical characteristics and actual network types of the managed devices, thereby achieving management of devices from different vendors.
· Simple request-response mode combined with active notification mode, with timeout and retransmission mechanism.
· Few packet types and simple packet format, which facilitates resolution and implementation.
· SNMPv3 version provides authentication and encryption security mechanisms, as well as user-based access control functions, enhancing security.
¡ HDM provides an SNMP-based programming interface that supports SNMP Get/Set/Trap operations. Third-party management software can easily integrate and manage servers by calling the SNMP interface. SNMP agent supports the v1/v2c/v3 versions.
¡ SNMP agent provides interface queries for system health status, system health events, hardware information, alarm reporting configuration, power statistical data, asset information, heat management, firmware version information, and network management.
Redfish management interface
Redfish is a management standard based on HTTPS services that utilizes RESTful interfaces to achieve device management. Each HTTPS operation submits or returns a resource or result in JSON format encoded with UTF-8 (JSON is a data format consisting of key-value pairs). This technology has the advantage of reducing development complexity, being easy and implement and use, and providing scalability, while also allowing flexibility in design.
Redfish uses REST APIs and a software-defined server (data model), and is currently maintained by the standard organization DMTF (www.dmtf.org).
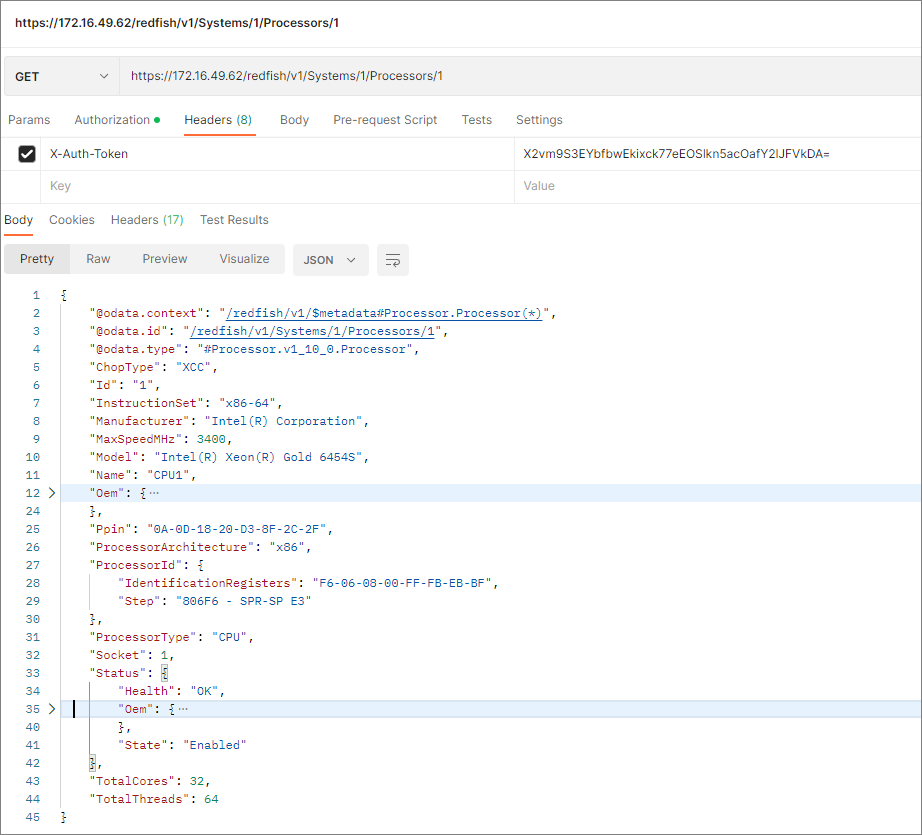
HDM supports Redfish 1.15.1 specifications, which can implement typical HDM and BIOS settings including user management and obtaining server information and management module information. The Redfish client sends HTTP(s) requests, authenticates through Token or Basic, retrieves data from the database, and returns the read results as shown in Figure 7. The database updates its content in real time through SEL and IPMI.
Figure 7 Redfish interface operation example (processor information query)
HDM unified control
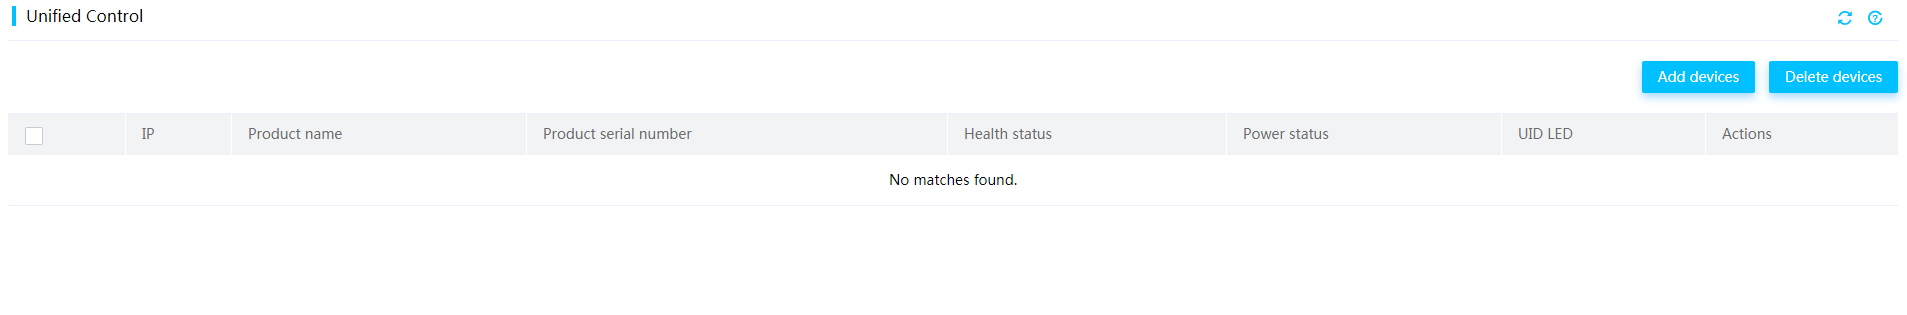
HDM unified control enables centralized management of small-scale servers, simplifying server operation and maintenance management for small and medium-sized enterprises. HDM unified control primarily provides the following functions, as shown in Figure 8:
· Device addition: Support adding single or batch servers, up to 10 devices (IPv6 addresses not supported). After acquiring license authorization, this feature support for up to 200 devices.
· Device deletion: Supports removing devices individually or in batches.
· Status query: Supports viewing basic status information of the device, including product name, product serial number, health status, power status, and UID status.
· Power management: Supports device power operations, including power on, power off, restart, and other operations.
· Remote access: Provides jump links for accessing HDM and H5 KVM consoles.
Figure 8 Unified control interface
LCD display screen
H3C rack servers can be configured with a 3.5-inch or 2.5-inch touchable LCD screen, used for displaying or configuring server information. It improved local maintenance simplicity and accelerated on-site fault location and repair. The LCD screen display supports switching between Chinese and English.
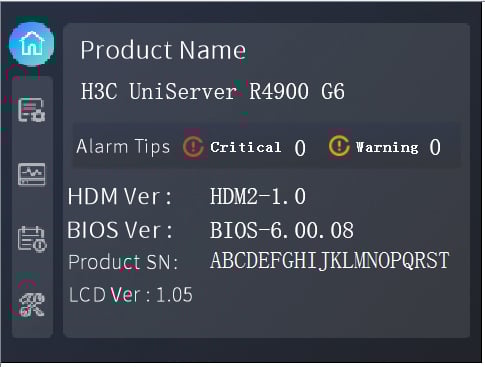
The LCD screen primarily provides the following functions:
· Information page: Displays product name, product serial number, and HDM/BIOS firmware version number, as shown in Figure 9.
· Status page: View the overall health status and log information of the server, as well as the components such as processor, memory, storage, fans, power supply, temperature sensors, and chassis power consumption.
· Monitoring page: Displays inlet temperature and CPU temperature in real time.
· Configuration page: Supports operations such as configuring HDM management interface network and restoring the administrator account.
Each component is displayed in different colors to indicate its status and health, following the same color display rules as the Web:
· Green: The device is normal.
· Orange: Critical alarms are present on the device.
· Red: Emergency alarms are present on the device.
· Gray: The device is not in position.
HDM network configuration
For centralized operation and remote operation of servers, HDM supports multiple network configuration modes, ensuring fast activation of network configurations, including:
· Provide network access through the shared port, dedicated port, and USB Wi-Fi.
· Configure the port active/standby mode and automatic shared port selection.
· Provide support for IPv4, IPv6, and domain names.
· After the device starts up, it automatically sends LLDP, SSDP, and free ARP messages to facilitate external identification and management of the device.
· Support for configuring IPv4 and IPv6 static routes to achieve more flexible network strategies for cross-segment access to meet the requirements in various application scenarios.
HDM provides the following features in terms of security:
· Support for shared port block.
· Support for enabling the firewall mechanism.
· Provide application-level security mechanisms.
Sideband management and NCSI technology
Sideband management (shared network port) is the use of Network Controller Sideband Interface (sideband NCSI) to share the physical NIC of the host system with the management system. This allows simultaneous management operations and service processing through a single NIC, simplifying network configuration and saving switch ports. For security reasons, it is necessary to use VLAN technology to separate management and service into different network segments.
NCSI is an out-of-band management bus protocol based on the physical bus RMII. The NCSI bus is a network communication bus that multiplexes with the RMII bus and defines an NCSI protocol on top of the RMII bus. Network Controller (NC) is divided into internal host interface, external network interface, and sideband interface for external communication. The BMC, as the Management Controller, can both send NCSI control commands to the NC and achieve network data packet communication through the NC and external network interfaces, as shown in Figure 10.
Figure 10 Sideband management diagram
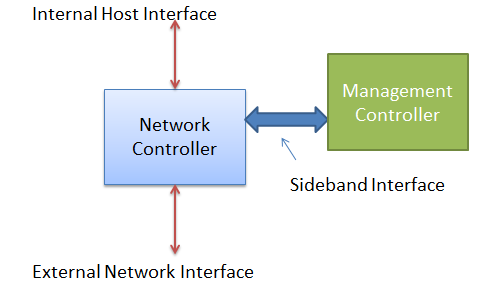
From a data flow perspective, HDM sends a network message to the physical bus RMII via MAC, and the NC receives the network message through RMII and then analyzes it. After analysis, if it is an NCSI message (determined by the ether type being 0x88F8), respond with NCSI. If it is a network message sending data externally (determined by the ether type being not 0x88F8), forward the data to the external interface.
Network port mode
HDM can be configured with normal mode and port active/standby mode for the network interface, as shown in Figure 11.
Figure 11 Network general configuration information
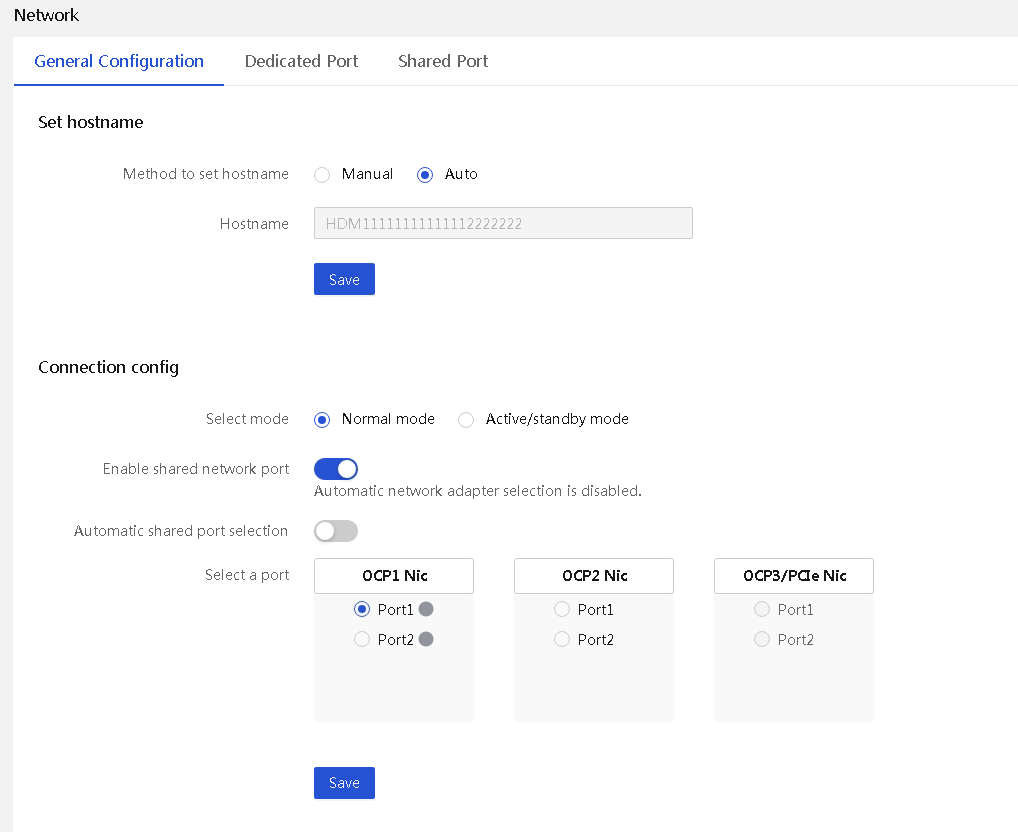
· Normal mode: Users can access HDM through the shared network port or the dedicated network port. The IP addresses of the two ports must belong to different subnets.
· Port active/standby mode: HDM prioritizes the dedicated port as the communication port, and the shared port and dedicated port are in Active/Standby state. Only one type of port can be used to access HDM at a time, with the dedicated port having a higher priority.
¡ When the dedicated network port is connected to a network cable, regardless of whether the shared network port is connected to a network cable, select the dedicated network port as the communication port.
¡ When the shared network port is connected to a network cable and the dedicated port is not connected to a network cable, select the shared port as the communication port.
¡ In active/standby mode, the shared port and dedicated port use the same set of IP address and MAC address (dedicated port MAC).
· Automatic shared port selection: Automatically select a shared port based on the connection status of the network adapter ports. This feature offers the following advantages: HDM management can be done through a shared port as long as at least one network adapter port is connected.
¡ All OCP network adapters and PCIe network adapters that support NCSI support this function.
¡ Switching the shared port allows the administrator to connect to the new shared port and access HDM after the shared port is switched. This feature has the following advantages:
- No need to change the server's network information in the entire network to achieve smooth switching.
- No need to reconfigure the network information for the shared port after switching (including IP address and VLAN) to improve maintenance efficiency.
- Do not enable the active/standby mode and automatic shared port selection at the same time. If you do so, it may cause network failures.
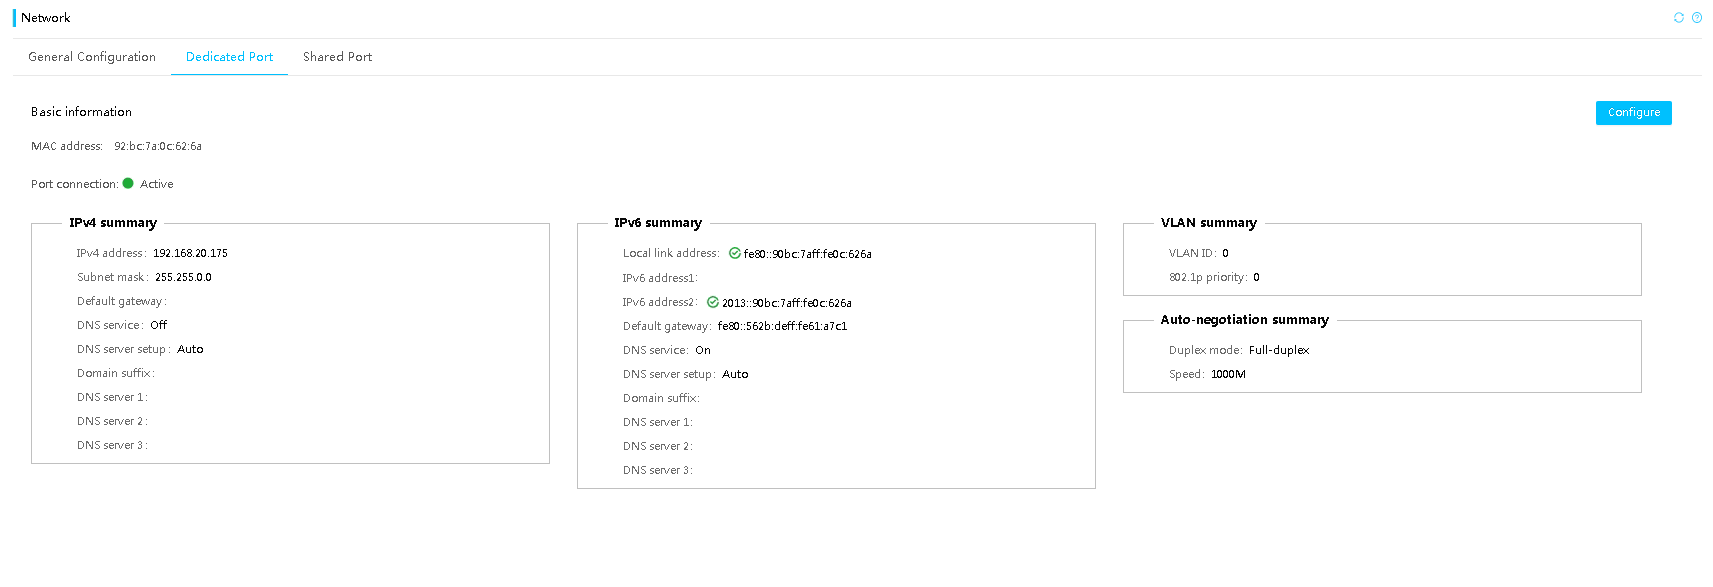
IPv6
HDM fully supports IPv6. Both the dedicated network port and the shared network port (NCSI) support access through IPv6 addresses on their physical channels, as shown in Figure 12.
Figure 12 Dedicated network port configuration
LLDP
Link Layer Discovery Protocol (LLDP) provides a standardized way of discovering network devices and exchanging system and configuration information among different vendors. It allows network management systems to quickly gather information about the Layer 2 network topology and any changes that occur. The configuration information is as shown in Figure 13.
Figure 13 LLDP configuration information
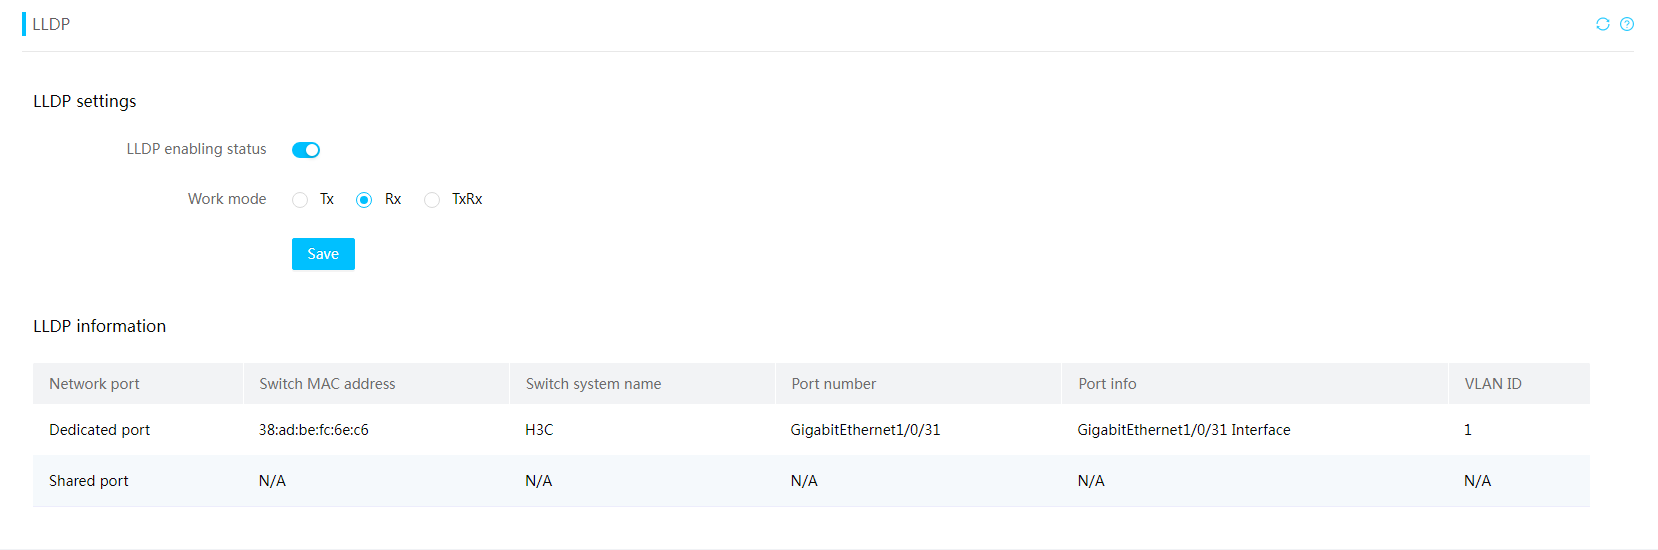
HDM supports the LLDP protocol and can parse relevant information about the local network's switches.
· Network interface: The network interface through which the server receives LLDP information.
· Switch MAC address: MAC address of the uplink switch port.
· Switch system name: Uplink switch system name.
· Connection port number: Upstream switch port number.
· Port information: Upstream switch port name.
· Network interface speed: Speed of the network interface.
HDM supports actively sending LLDP messages to facilitate the discovery of neighboring devices.
SSDP automatic discovery
Simple Service Discovery Protocol (SSDP) is an application layer protocol and one of the core protocols that make up Universal Plug and Play (UPnP) technology.
HDM supports SSDP and regularly sends NOTIFY messages, enabling upper-level operation and maintenance software (such as UniSystem) to automatically discover all BMC devices, eliminating the pain point of individually configuring BMC devices in the initial setup process.
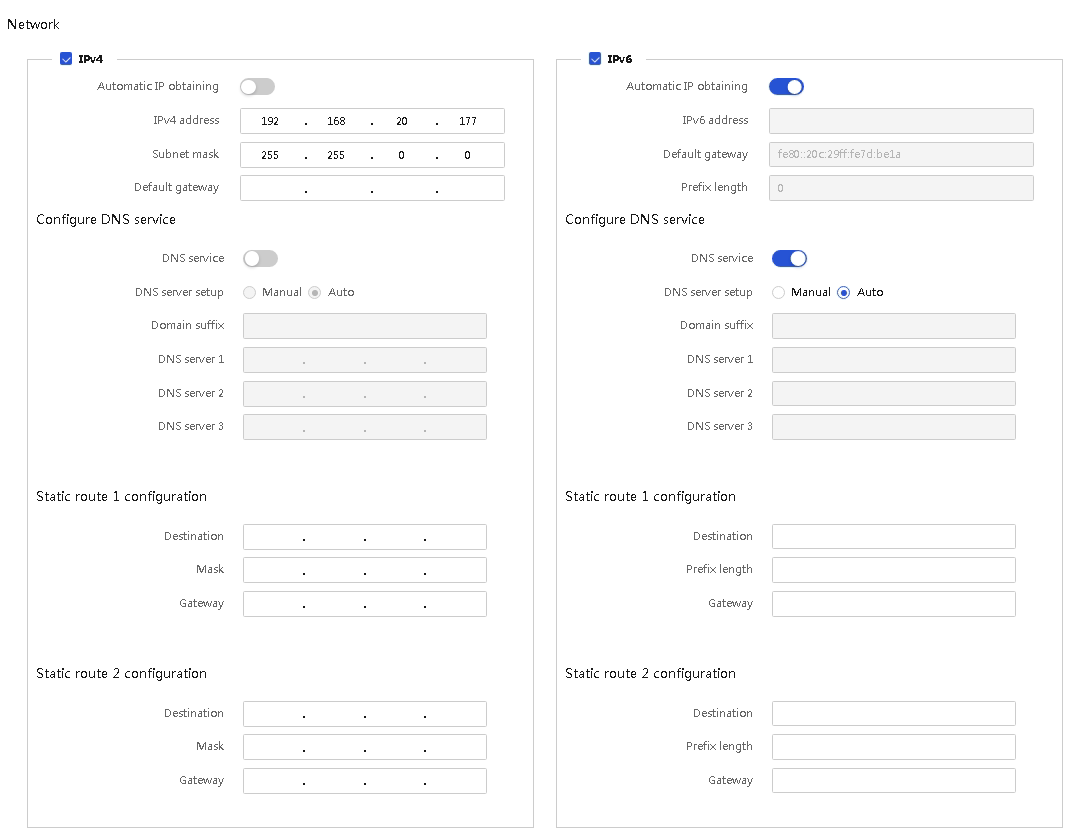
Static routes
HDM supports setting static routes. You can configure two static routes for dedicated and shared network ports, separately for both IPv4 and IPv6 configurations to control and direct network traffic accurately and implement cross-segment route forwarding.
Figure 14 Configuring static routes
HDM time settings
HDM provides multiple levels of time sources and allows setting the synchronization priorities. The following time synchronization methods are supported and their default priorities are in descending order:
Primary NTP server > Secondary NTP server > Tertiary NTP server > DHCP server (acting as a NTP server) > Host ME (only for Intel products) > RTC on HDM.
Time management
HDM supports obtaining time from various sources to meet different time management scenarios. The following scenarios are available:
· Manually configure NTP synchronization: You can configure the same NTP server between different HDM and hosts to ensure that all systems obtain the correct time from this NTP server and remain consistent at all times.
· Use DHCP server to manage NTP synchronization: Specify the NTP server field on the DHCP server, enabling all systems in the equipment room to automatically obtain the same NTP server and thus have accurate and unified time.
· Synchronize host time: Pass host time to HDM through the BIOS and ME components to maintain accurate time and ensure consistency between host and HDM time.
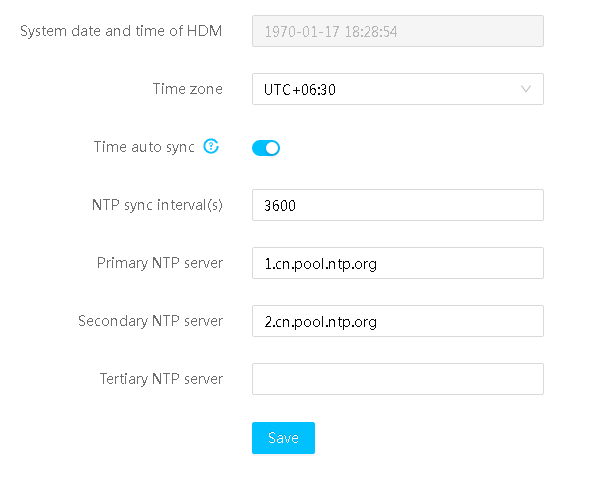
NTP synchronization
The Network Time Protocol (NTP) is an application layer protocol in the TCP/IP protocol suite. It is used to synchronize clocks between a series of distributed time servers and clients.
HDM supports manual configuration of three NTP servers and also supports automatic retrieval of NTP server configuration from the DHCP server, as shown in Figure 15. All NTP servers are managed based on priority, and if a high priority server is unavailable, a low priority server is automatically used, ensuring periodic automatic synchronization.
The NTP server supports IPv4 addresses, IPv6 addresses, and FQDN (fully qualified domain name) addresses.
Figure 15 NTP configuration information
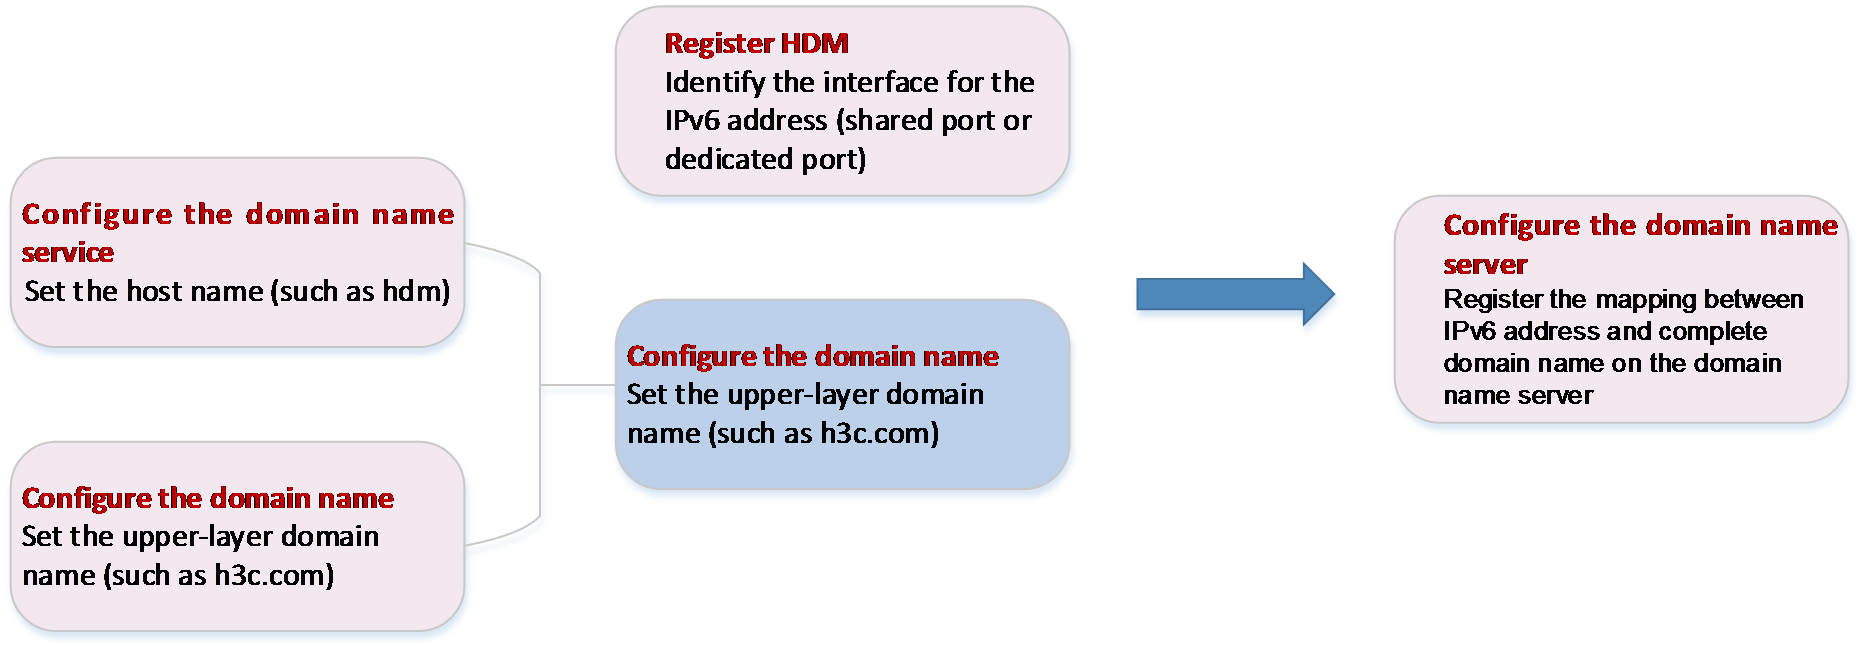
DNS
DNS is a distributed database used by TCP/IP applications to provide translation services between domain names and IP addresses. The complete domain name contains a host name and upper-level domain name. In HDM, the host name can be manually configured or automatically generated based on the server's SN number. The parent domain name can also be manually configured or obtained automatically through DHCP.
HDM supports mapping the IP address of the shared port and dedicated port to a domain name, and registers this mapping with the IP DNS servers in the network.
The registration methods include nsupdate and FQDN/host name: The nsupdate method allows the client to directly update the DNS server zone file through the nsupdate command. The FQDN/host name method allows the DHCP server to dynamically register client information with the DNS server after confirming the client's network address allocation.
The user can add all managed servers to a unified management domain and use a memorable domain name to access the managed servers' HDM.
Figure 16 DNS registration process
HDM supports DNS configuration. DNS information can be independently configured for IPv4 and IPv6 interfaces under dedicated and shared ports, as shown in Figure 17.
Figure 17 DNS configuration information

Server deployment capabilities
Background
H3C servers support general deployment capability, enabling quick access to customers' operational environments, such as PXE servers and DHCP servers. H3C has developed a large number of automation deployment software programs and tools for customers, providing comprehensive and versatile deployment capabilities. Automation software and tools can help customers save a significant amount of manual operation time, provide operational efficiency, and reduce operational costs. H3C can provide the following deployment software and capabilities:
· HDM: Server standalone out-of-band management tool. Customers can achieve some simple server configuration and deployment through HDM, including KVM installation of the operating system, HDM/BIOS/RAID configuration, and firmware updates. For more information, see the other chapters in this document.
· FIST SMS: Server standalone proxy software with in-band deployment capabilities including firmware and driver updates.
· iFIST: Server standalone embedded management software. iFIST is pre-installed on a storage chip in the server to provide in-band standalone deployment capability. Supported deployment functions include automatic installation of operating systems and drivers, HDM/BIOS/RAID configuration, firmware update, pre-mounting device diagnostics, and post-removal data clearance.
· UniSystem: Bulk server management software. If used together with HDM, FIST SMS, and iFIST, UniSystem can provide the ability for bulk deployment of servers, including IP configuration, automatic operating system installation, clone installation, firmware and driver updates, and batch functions such as pushing software installations and configuring HDM/BIOS/RAID. UniSystem supports automatic shelf-up of servers. Customers can plan server software and hardware configuration items in advance on the UniSystem page, and create corresponding server configuration templates and binding rules. When the server accesses the operation and maintenance network, UniSystem will automatically incorporate the server into management and issue corresponding server configuration templates, realizing the automation effect of plug-and-play and worry-free shelf-up.
The deployment of the server mainly involves the following tasks:
· Device rack mounting
Device management: Able to quickly identify new devices joining the network or offline devices.
· Perform batch identification and version management of server equipment and its components.
¡ Check if the firmware and driver versions on the device need updating.
¡ Firmware update: H3C supports multiple methods of firmware update, including in-band single/batch update, out-of-band single/batch update, and offline firmware update.
¡ Driver update: H3C supports multiple driver update methods, including in-band single/batch driver update, and automatic driver installation after operating system installation.
· Configuration operations
Perform centralized HDM configuration, BIOS configuration, batch import and export, and online configuration of components (such as storage controllers).
· Operating system installation
Provide automated batch installation of mainstream operating systems, supporting "split" transmission technology and image cloning technology for image files. Compared to traditional PXE installation methods, UniSystem can greatly improve the speed of operating system installation.
· Support other device operations, such as pre-mounting equipment diagnostics.
· Support security operations after device disassociation, such as data erasure.
Deployment capability
Multiple methods and tools are provided for server configuration and deployment. Along with the support of UniSystem server management center, batch management, deployment, and update capabilities for users are available. For more information, see the H3C UniSystem technical white paper.
Figure 18 Deployment capability diagram
Technical points
Device management capability
HDM supports the following features for easy device incorporation:
· Devices actively send ARP packets to quickly broadcast its MAC address to the network when they connect to the network.
· Devices actively send SSDP and LLDP messages when they connect to the network to facilitate external identification of the devices.
· DHCP supports SN transmission, facilitating unique identification of servers.
· HDM provides rich APIs for external management tools to obtain device information (such as model, version, and asset information).
Rich configuration capabilities
HDM supports the following features to facilitate the configuration of HDM/BIOS/component parameters:
· Support configuration using standard IPMI commands, Redfish commands, and SNMP commands.
· Support one-time effect, permanent effect, immediate effect, and effect upon next startup for the BIOS configuration.
· Support customizing alarm logs and configuring user permissions.
· Support presentation and configuration of BIOS settings through the HDM Web interface.
· Support batch export and import operations of the HDM, BIOS, and storage controller configurations, enabling convenient configuration migration.
· Support factory reset and one-click retirement operations to meet the requirements of equipment migration and retirement.
· Support remote configuration and service switching.
Firmware deployment
HDM supports the following features to facilitate firmware operations:
· Use one image for multiple products without distinguishing versions, making upgrades easier.
· Encapsulate images by firmware type to meet the requirements of security verification and user's unawareness of firmware type.
· Support out-of-band firmware management operations.
· Support immediate upgrade and scheduled asynchronous upgrade.
· Support installing feature packages and patch packages.
· Support REPO upgrade to update multiple types of firmware at the same time.
· Support firmware backup.
· Support automatic recovery of HDM and BIOS firmware anomalies.
· Support resuming upgrade tasks after the host and HDM restart from anomalies.
· Support CPLD restart without power-off.
OS and driver deployment
Except for the traditional method of OS installation and driver deployment through image mounting using KVM or H5 KVM, HDM also supports distributed bulk OS installation and fast OS installation. This can meet fast deployment requirements in various scenarios.
Distributed bulk OS installation: UniSystem, in conjunction with HDM, supports OS installation via distributed image transmission through file sharing, which supports peer-to-peer transmission and avoids bandwidth limitations from software deployment. This improves OS deployment capability by over 10 times compared to traditional installation methods.
Figure 19 Distributed bulk OS installation

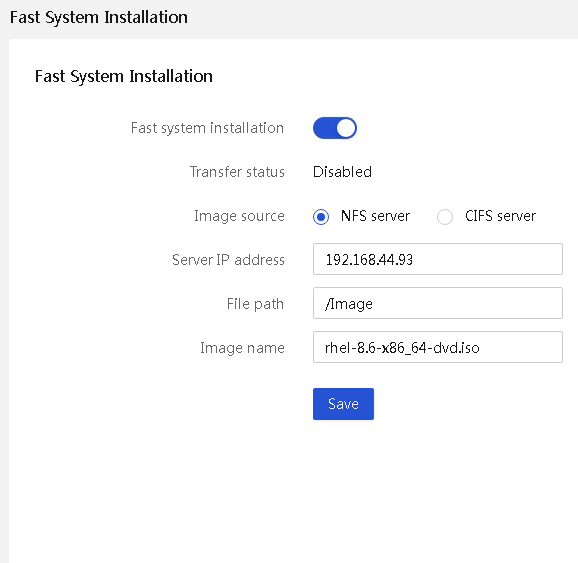
Fast OS installation: HDM supports selecting an image from the NFS server or CIFS (Samba) server for fast OS installation. This feature uses a high-performance, low-latency PCIe hardware link transmission channel to shorten the time for OS installation. This resolves the issue of slow image transmission rates from BMC to the host side during OS installation based on remote virtual media.
Figure 20 Fast OS installation
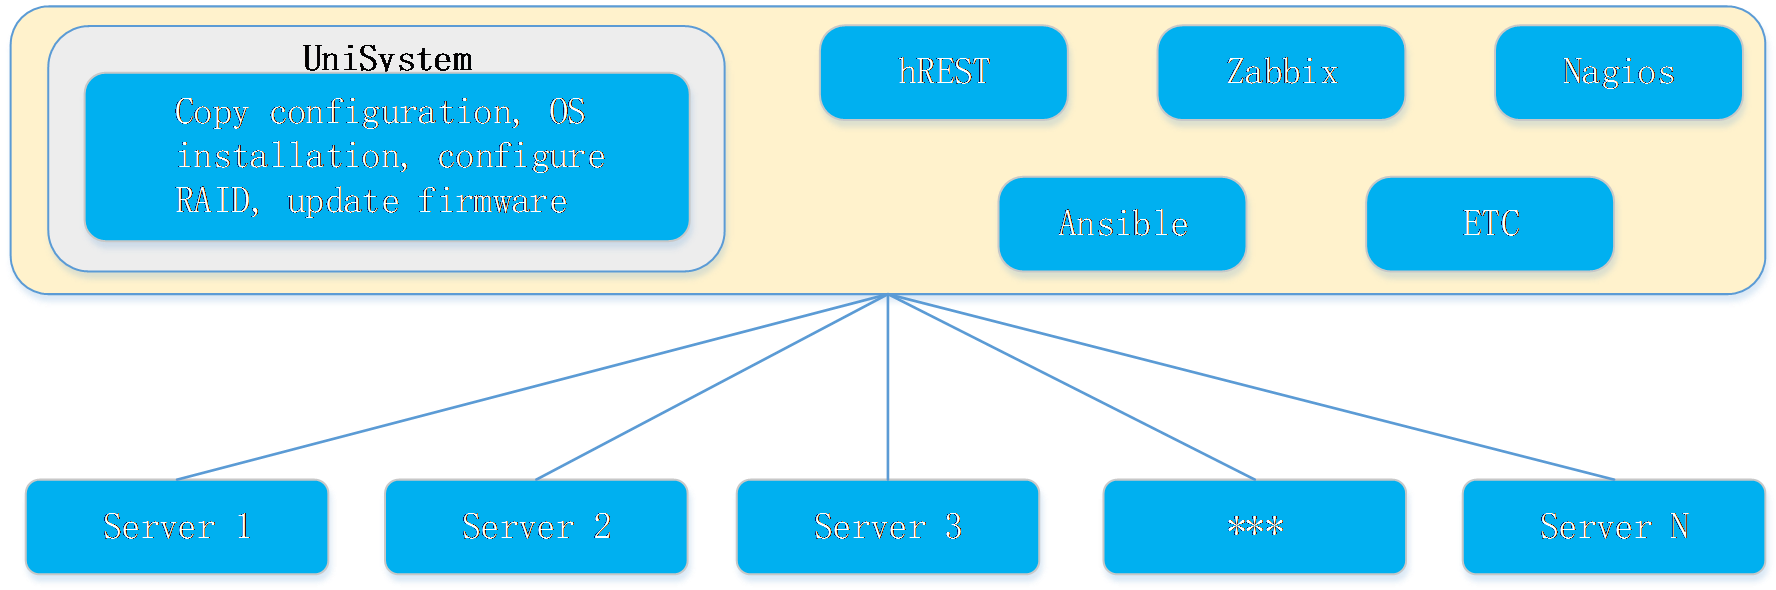
Peripheral tools
HDM provides a rich ecosystem of cooperative interfaces, constructing a diversified server management ecosystem. It supports Ansible orchestration scripts, Zabbix, and Nagios & Nagios XI for third-party incorporation, monitoring, and O&M management.
Table 2 Third-party platforms supported by HDM
|
Third-party platform |
Description |
|
VMWare vCenter |
Alarm monitoring, information query, OS installation, component update, server configuration |
|
Microsoft System Center Operation Manager (SCOM) |
Alarm monitoring |
|
Microsoft System Center Configuration Manager (SCCM) |
OS installation, OS upgrade, system configuration |
|
Ansible |
Information inquiry, RAID configuration, network configuration, BIOS configuration |
|
Zabbix |
Information inquiry, alarm monitoring |
|
Microsoft Admin Center |
Information query, resource usage monitoring |
|
Nagios & Nagios XI |
Information inquiry, alarm monitoring |
Configuration management
Configuration file import and export
This feature allows exporting or importing the configuration of HDM, BIOS, and RAID as configuration files, allowing administrators to easily configure remote servers, as shown in Figure 21.
This feature has the following technical advantages:
· The configuration options of HDM, BIOS, and RAID modules can be batch configured out of band.
· The configurable parameters are numerous, including 500+ options for HDM and 1100+ options for the BIOS. The feature also supports modifying RAID levels.
· The exported configuration file structure can be read, edited, and saved.
· The exported HDM configuration items supports self-annotation, enhancing users' understanding of the configuration.
· It allows for batch deployment of multiple servers with the same configuration. The feature simplifies operation and greatly improves the O&M efficiency.
· This feature supports password export and import. The exported passwords are displayed in ciphertext format.
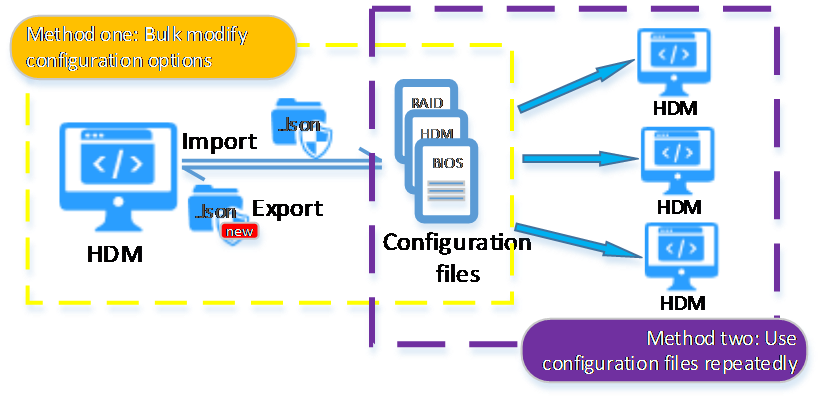
Configuration files support the following use cases, as shown in Figure 22:
· Export configuration file, make modifications, and then import it for bulk setting modification.
· Use the same configuration file for servers of the same model to achieve fast configuration and deployment of large-scale devices.
· After replacing the system board or restoring the factory default settings, you can use the exported configuration file to easily restore the custom settings.
Figure 21 Configuration file import and export
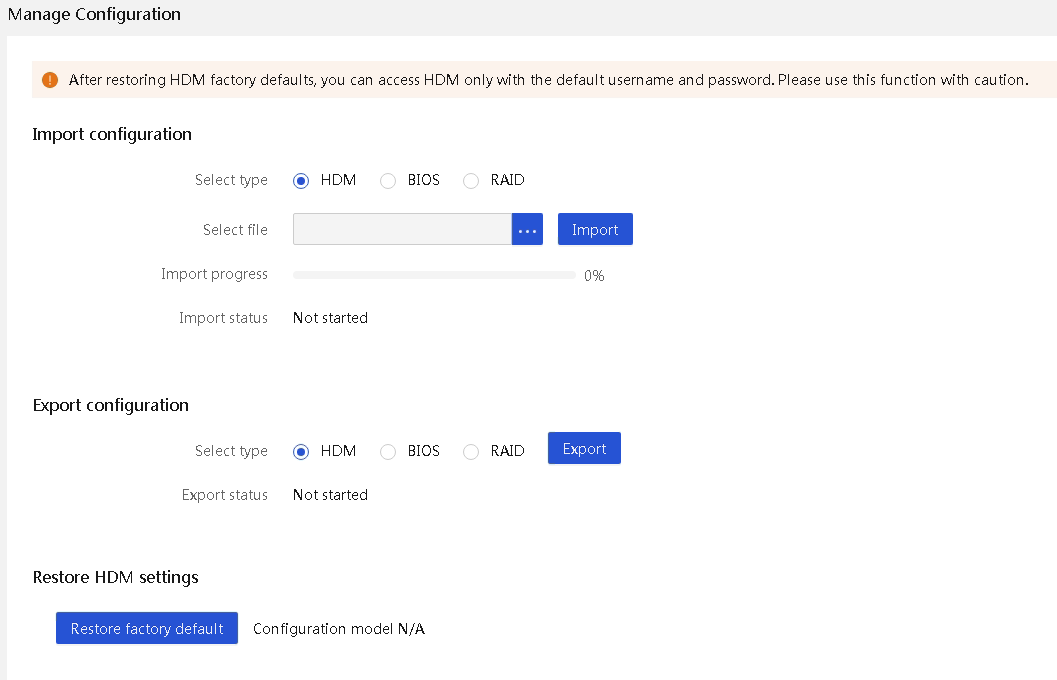
Figure 22 Use cases of configuration file import and export
Restoring HDM factory defaults
Restoring HDM settings can restore HDM to the factory defaults and can be used for HDM reconfiguration.
BIOS option configuration
HDM supports the following functions for convenient out-of-band setting of the BIOS options:
· The Web interface supports displaying BIOS options in a structured way, as shown in Figure 23 and Figure 24. The Web interface is consistent with the BIOS setup utility, which is user-friendly.
· HDM supports one-key modification of the BIOS configuration template for different server application scenarios, thereby automatically changing all related BIOS configurations. The supported application scenarios are as shown in Figure 25.
HDM supports multiple out-of-band settings methods, with powerful configuration capabilities:
· Support configuration using IPMI commands.
· Support Redfish command to configure BIOS options, and provide parameter descriptions for all supported options in the user manual.
· Support batch configuration import and export from webpage or Redfish interface for 1100+ options.
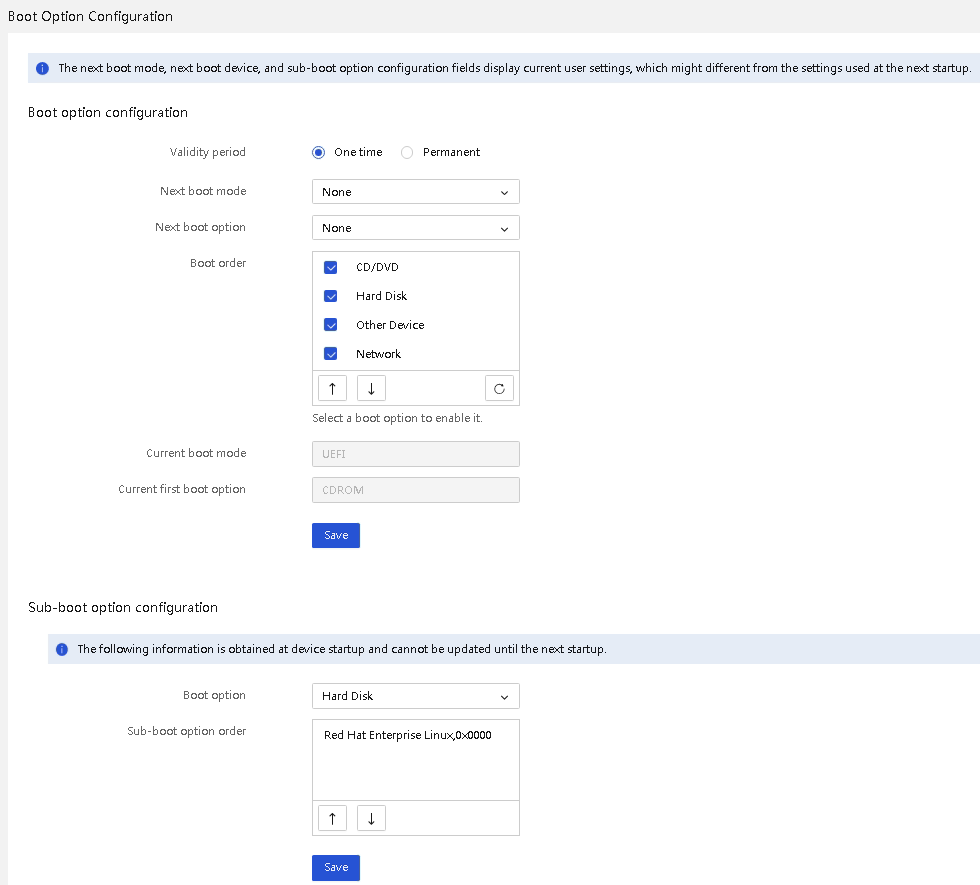
· Support configuring boot option settings, including configuring validity period, next boot mode, next boot device, boot order, and boot suboption order, as shown in Figure 26. This achieves flexible and easy-to-use boot control.
Figure 23 BIOS configuration interface
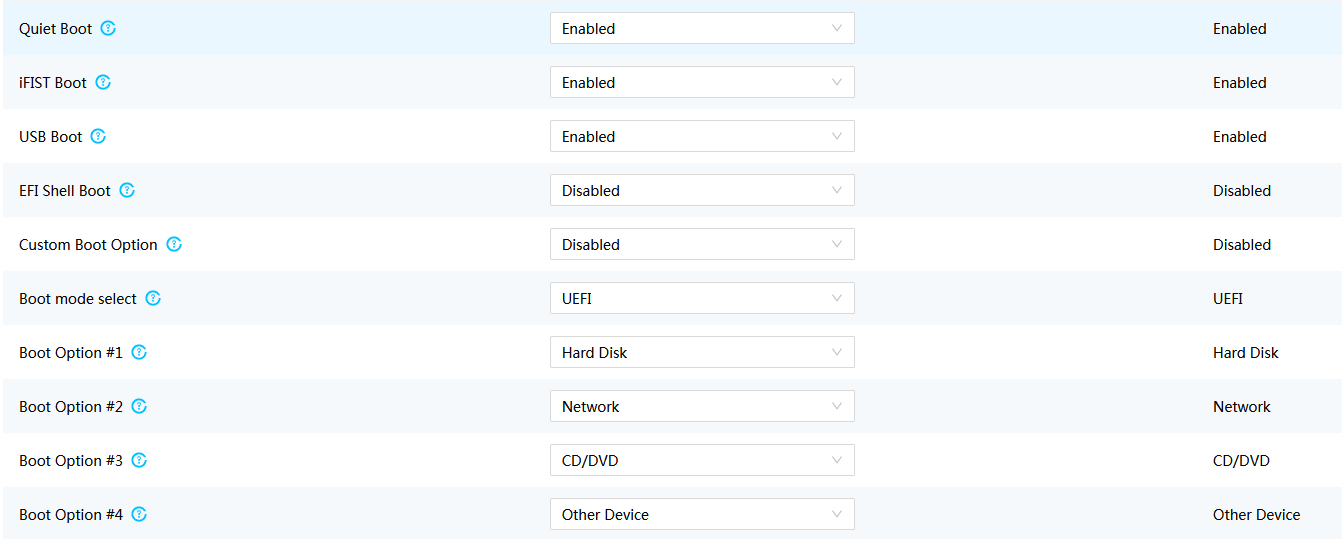
Figure 24 BIOS setup utility

Figure 25 BIOS configuration template
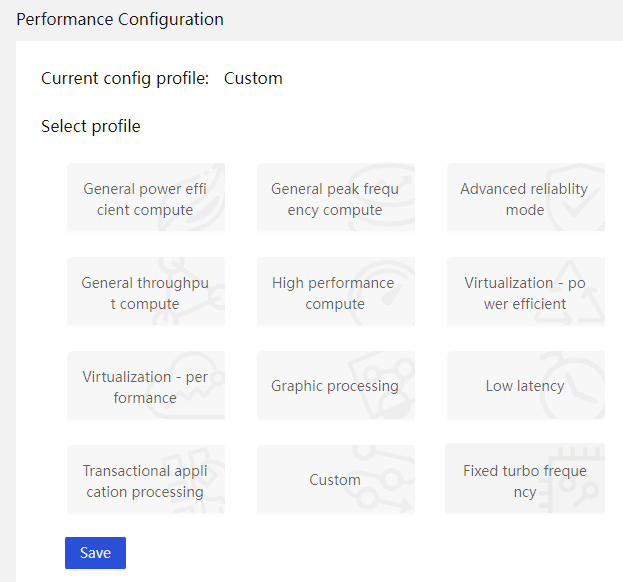
Figure 26 Configuring boot options
Firmware deployment
Service functions related to HDM upgrade include the following:
· Query firmware versions of HDM, BIOS, CPLD, PSU, LCD, NIC, RAID controllers, and storage drives.
· Upgrade of HDM firmware without service interruption or power-off.
· Same HDM firmware image for multiple products, without the need to differentiate versions, reducing the difficulty of upgrading.
· Signed bin file firmware upgrade to ensure that the image is intact.
· Uninterrupted upgrade by using a REPO package (iso format), realizing firmware upgrade for multiple components at once (PSU, LCD, NIC, RAID controller, storage drive, HDM, BIOS, and CPLD).
· Support feature package upgrade.
· Support patch package upgrade.
· Support scheduled upgrade.
· Support firmware backup to firmware repository.
· Support firmware in the firmware repository to take effect.
· Support abnormal firmware detection.
· Support firmware dump through HDM and using Agent tool to upgrade Option cards.
· Support automatic recovery of HDM and BIOS firmware anomalies.
· Support CPLD restart without power-off.
Golden image
To improve system reliability, HDM uses a Golden Image to implement BMC primary and backup partitions. Each time the HDM firmware is upgraded, only the primary partition image is upgraded, while the Golden Image remains at the factory version. When a flash misoperation or storage block damage occurs during the operation in the primary partition, HDM can automatically switch to the Golden Image to recover the abnormal image of the primary partition and automatically switch back to the primary partition.
Upgrade firmware
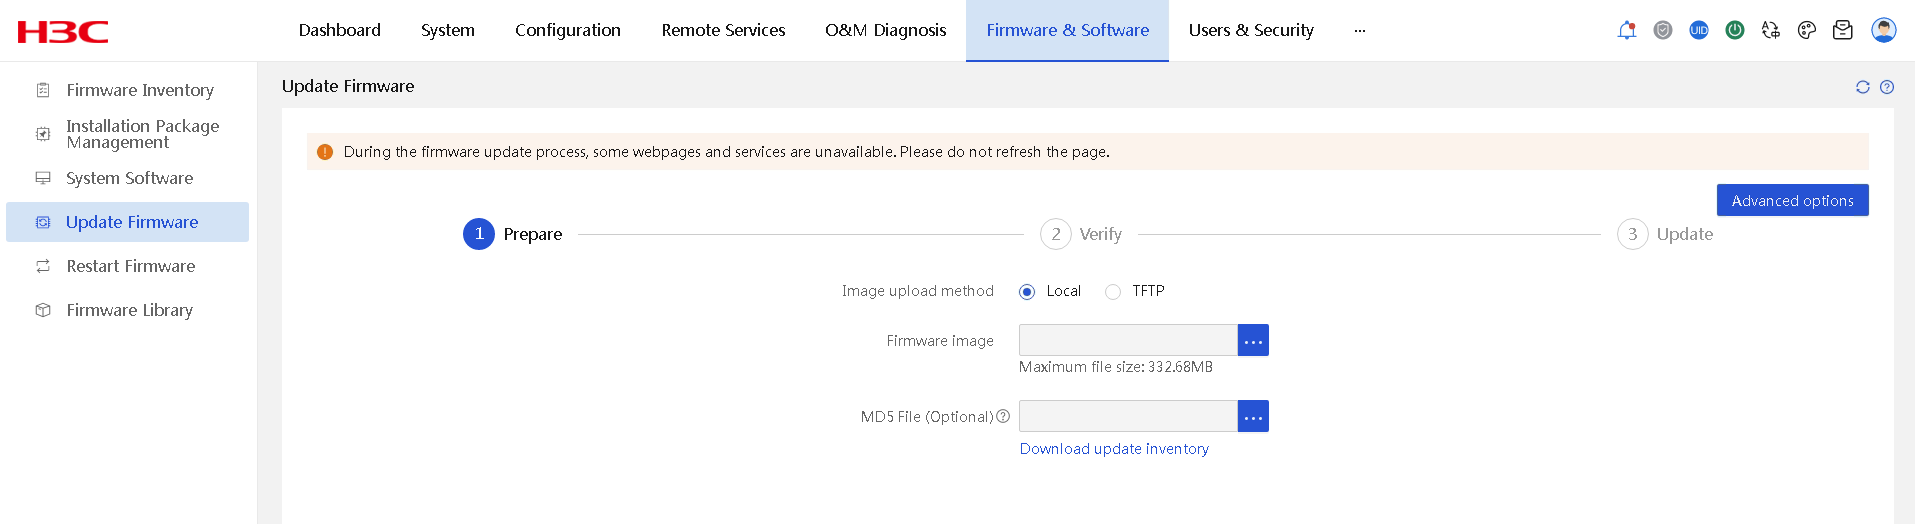
Support firmware upgrades for HDM, BIOS, CPLD, PSU, LCD, RAID controller, drive, network adapter, and GPU. Support feature package upgrades. Support patch package upgrades. Support upgrade by using bin, run, and iso files. Support REPO upgrade, which can simultaneously update firmware of various components such as HDM, BIOS, CPLD, PSU, storage controller, network adapter, and drive on the server. Support upgrading via Redfish URL and various firmware upload methods including HTTP, HTTPS, NFS, TFTP, CIFS, and SFTP.
The firmware information page that opens after verification supports selecting a backup and setting the upgrade execution time. HDM and BIOS firmware upgrades support the manual and auto activation methods and support configuration reservation or overwriting after HDM and BIOS upgrades.
1. Image backup
If you select to enable backup on the firmware information confirmation page, HDM will automatically back up the firmware image file in use to the firmware repository.
2. Scheduled tasks
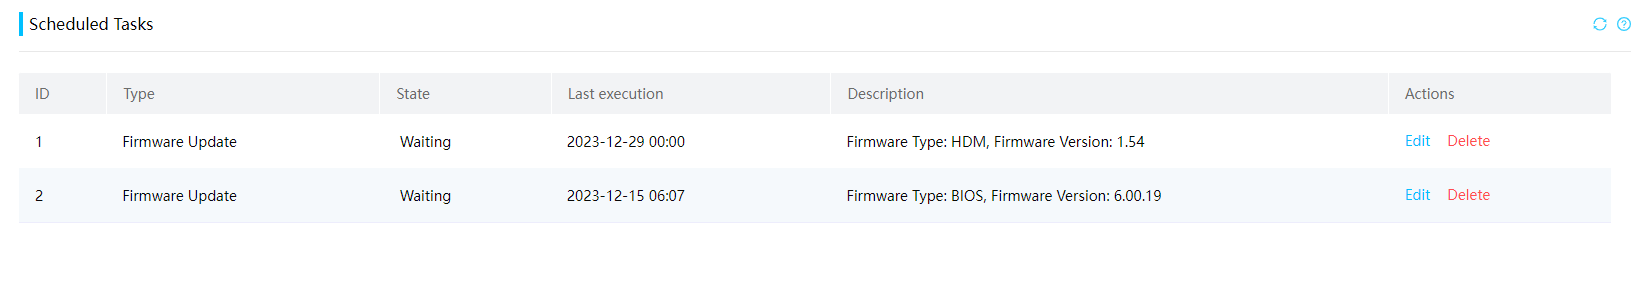
On the firmware information confirmation page, you can choose to set the upgrade time. HDM will save the task in the background and perform the upgrade task at the preset time. Scheduled upgrade tasks support simultaneous issuance of multiple tasks. During the period before the predetermined time, they do not affect the normal issuance of other upgrade tasks. Figure 27 shows successfully issued upgrade tasks.
3. BIOS self-upgrade
When you update the BIOS firmware, you can choose to reserve the user settings or overwrite the user settings. HDM only uploads the firmware file of the BIOS to eMMC. When the host restarts later, the BIOS will retrieve the firmware file from eMMC through HDM and upgrade the firmware itself to implement the relevant configuration strategy.
4. Incremental feature package, cold patches, and hot patches
The installation packages contain the following types: feature packages and patch packages (including cold patches and hot patches), as shown in Table 3.
Table 3 Installation package Introduction
|
Installation package type |
Application scenarios |
Advantages |
Limitations |
|
|
Feature packages |
An incremental service package of the HDM system can add enhanced service functions. |
· Incremental services are automatically enabled without interruption to basic services. · The amount of code modified incrementally can be very large. HDM supports incremental upgrades for large features. |
The release cycle is long, depending on product planning. |
|
|
Patch packages |
Hot patches |
A patch can be used to resolve on-site issues that require urgent troubleshooting. It can provide real-time fault repair without interrupting services. |
· Real-time fault modification without any service interruption. · The patch release cycle is short. It may take 3 to 10 days to deliver a hot patch to the target site. |
· Modification amount is limited, typically requiring no more than 500 lines of code modification. · Certain specific functions of the system do not support hot patching. |
|
Cold patches |
A patch can be used to resolve on-site issues that require urgent troubleshooting. The faulty service is a upper-layer service, and the service process can be restarted. |
· Faulty service recovers within seconds without impacting other services. · The patch release cycle is short. It may take 3 to 10 days to deliver a cold patch to the target site. |
Basic core service processes that do not support restart cannot support cold patches. |
|
Feature packages and patches can provide the following advantages:
¡ HDM firmware diversity. In addition to the basic firmware, delivery of feature packages and patch packages expand the application scenarios.
¡ Timeliness of HDM firmware delivery. The basic firmware delivery cycle is one calendar month at least. Patch packages can respond to on-site fault repairs in a timely manner.
¡ Customized rapid adaptation for customers can be achieved. Customized features can be fast implemented through feature or patch packages.
5. Upgrade risk notification
¡ If HDM has HDM or BIOS upgrade tasks to take effect, the Web interface will display the corresponding notification on these tasks.
¡ If HDM has scheduled tasks, the Web interface will display the corresponding notification on these tasks, including upgrade time, version, and the method of upgrade implementation.
¡ When multiple scheduled tasks exist, HDM will prioritize displaying the content of a task with the closest upgrade time. In the event of multiple tasks scheduled for the same time, priority will be given to the task that was registered earlier.
¡ When both HDM and BIOS upgrade tasks exist simultaneously, HDM will prioritize displaying the BIOS upgrade tasks.
¡ The upgrade risk notification bar is fixed on the webpage, and appears on any tab of the webpage when an upgrade task is to take effect.
Figure 28 Upgrade risk notification
6. Firmware security
¡ Firmware startup security: BMC firmware implements redundant backup mechanism of Golden Image. When a Flash misoperation or storage block damage occurs during operation, you can automatically switch HDM to the backup firmware for operation.
¡ Firmware update security: All externally released firmware versions, including HDM and BIOS, have a signing mechanism. When firmware is packaged, the SHA512 algorithm is used to digest it, and the digest is encrypted using RSA4096. During firmware upgrade, tampering is prevented by verifying the signature. Only firmware with a valid signature is allowed to be upgraded onto the device.
¡ Firmware operation security: During operation, the area where the image is located is write-protected and requires a special method to perform write operations. At the same time, the system verifies the integrity of the image file during each startup and restores the image if necessary.
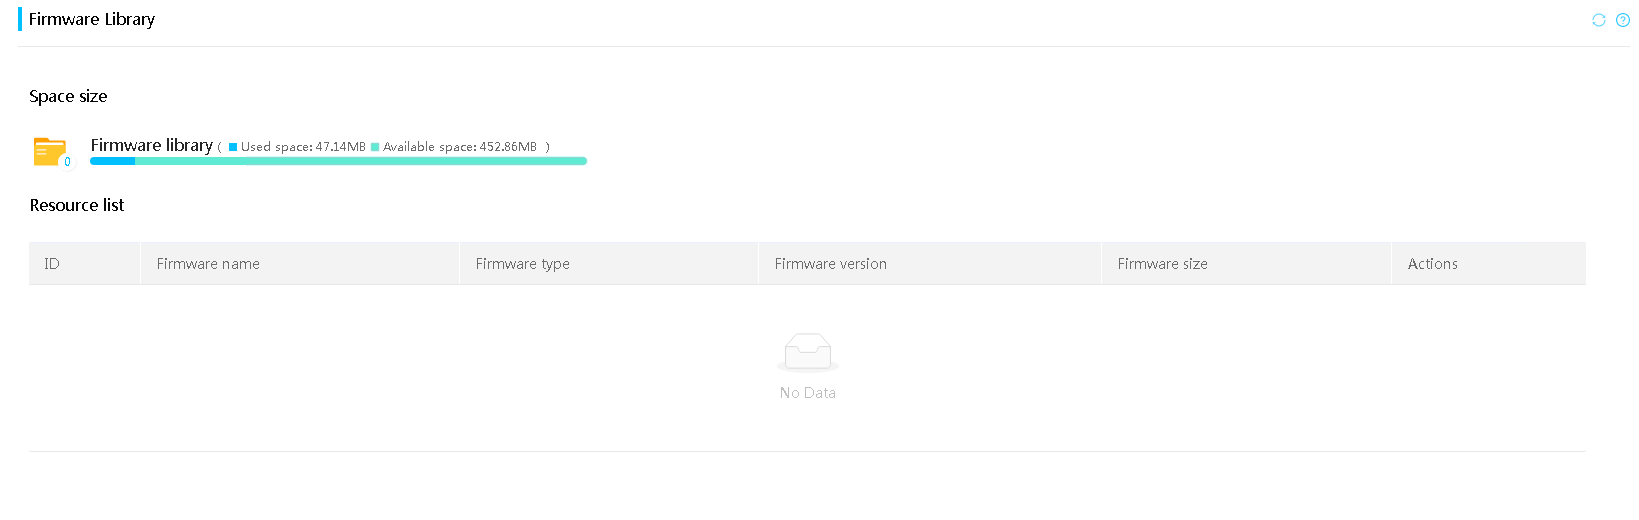
Firmware repository
At firmware upgrade, if the backup function is enabled, HDM will automatically back up the firmware image file to the firmware repository. After a successful backup, users can view information about the backup firmware image files on the firmware repository page. When the available capacity is insufficient, users cannot continue to back up new images. You can manually delete firmware image files to free up more available space. Users can choose to click Apply corresponding to the target image file to enable the image. Then, the system automatically accesses the firmware update page for firmware upgrade.
Figure 29 Firmware repository
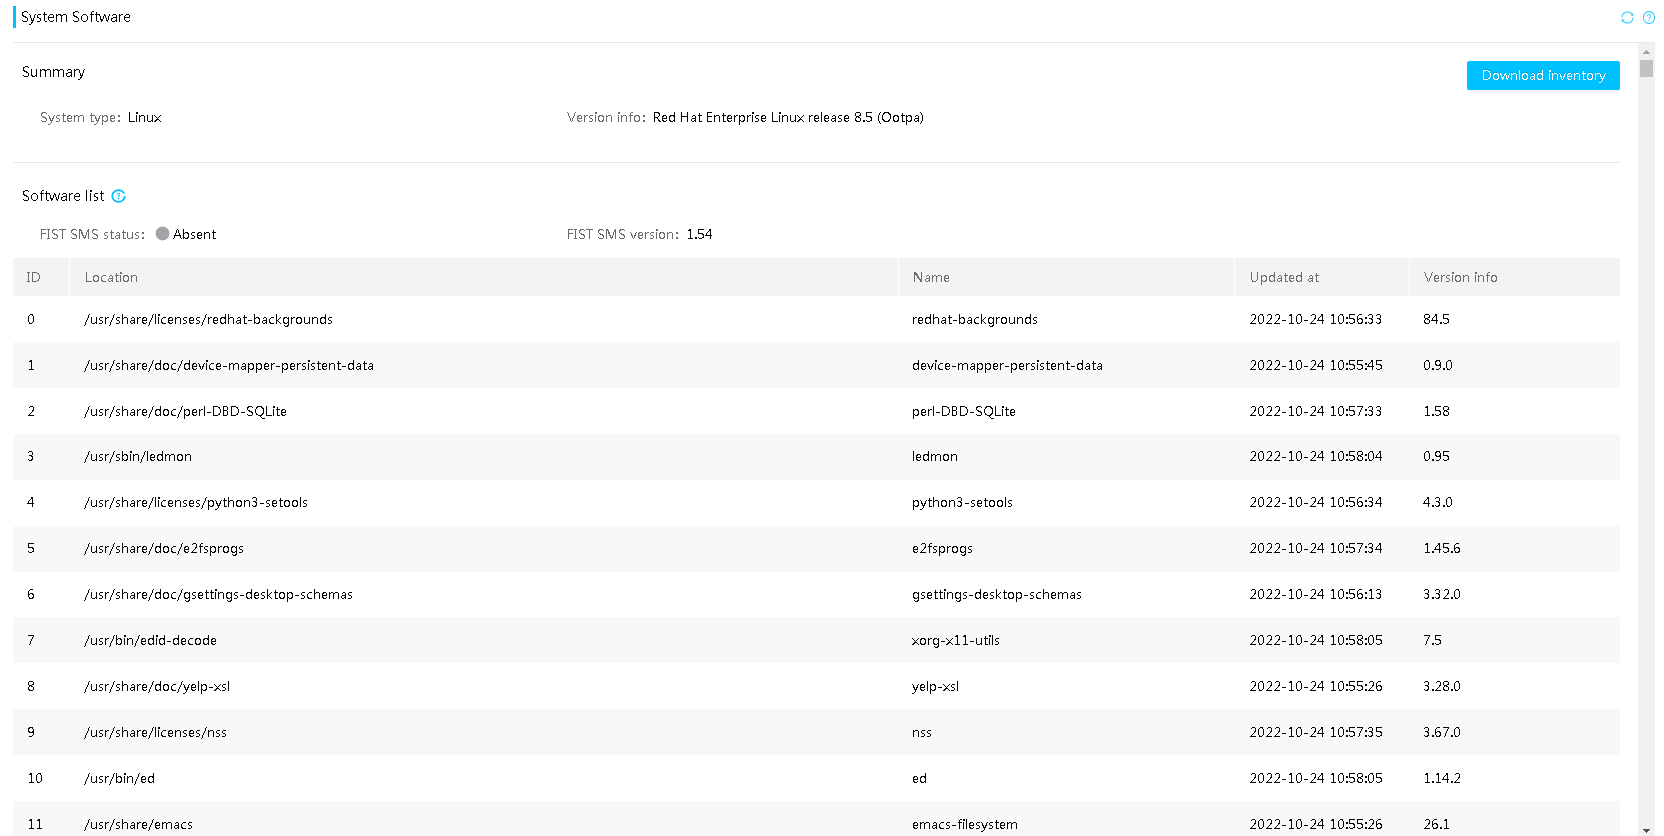
Software inventory
Users can view and download software information on the system software page of the current server operating system, including location, name, version, and update time (dependent on FIST SMS).
Figure 30 Software inventory page
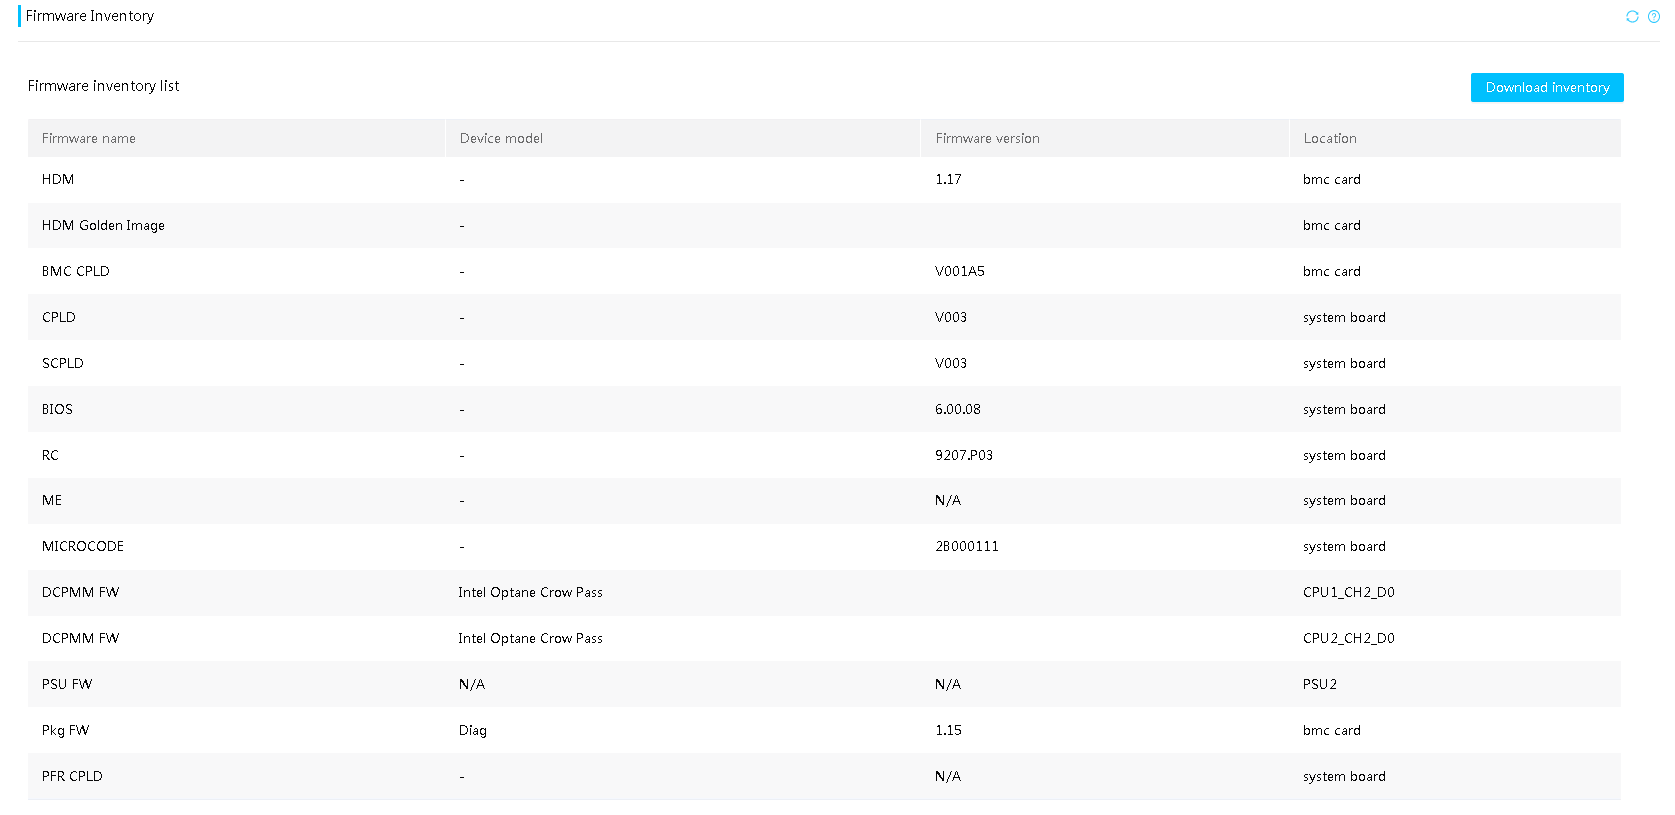
Firmware inventory
Users can view and download information about firmware installed on the current server, including firmware name, firmware version, and location, in the firmware inventory.
Figure 31 Firmware inventory page
Firmware restart
The HDM interface supports restarting BMC and CPLD.
· Users can restart BMC through this function when the BMC firmware requires to be updated or when the BMC firmware malfunctions. All sessions or connections will be interrupted during the restart, and will return to normal after relogin.
· To restart the CPLD due to CPLD firmware update or CPLD firmware exception, you can use this feature to restart the CPLD firmware, so that the new firmware takes effect immediately or the CPLD firmware returns to normal. The CPLD reset service will be affected.
Functions related to device migration and retirement
HDM supports one-click, secure, reliable, and convenient restoration of server components to the default state through out-of-band user data clearing. This achieves secure retirement of servers. For more information, see the secure erasure chapter in the security management section.
Application scenarios
Suggestions for first-time device mounting
After the device is mounted, check and confirm the following information as a best practice to see if any adjustments must be made based on the factory default configuration:
· Connection solution for the out-of-band network.
· Configuration of the time synchronization solution.
· Performance template and security consultant configuration according to the focus.
· BMC service, user, and permission configuration.
· Status of the device and whether the specifications meet the requirements after installation.
· Whether firmware upgrade is required.
Batch firmware upgrade with service interruption
At the beginning of the deployment phase, if the factory firmware version does not meet the requirements, a unified redeployment or large-scale upgrade is required. If the services have not been enabled or allow for long interruptions, use the REPO package to automatically upgrade all firmware through one click. Alternatively, use UniSystem to deploy all servers in bulk.
The REPO upgrade process takes a long time and will trigger the restart of components and hosts. However, it can be implemented automatically in the background with a single click and upgrade the firmware of the whole server to the designated compatible state.
Firmware upgrade with service guaranteed
If only certain firmware requires upgrade in on-site maintenance, use the firmware package of the designated component. Supported components include network adapters and RAID controllers. After updating the BMC firmware, restart the corresponding component to complete the process. Components such as CPLD and BIOS require a whole system restart after the firmware update.
In addition, you can use the scheduled upgrade function to set time with a low service volume (such as the early morning) to start the upgrade process.
Firmware upgrade without service interruption
In a critical service environment, the following strategies are offered to meet the expectation of firmware upgrade without affecting on-site operations:
· BMC firmware can be directly updated if BMC out-of-band monitoring can be temporarily interrupted. BMC restart only takes 1 minute to restore BMC services.
· To upgrade the BIOS firmware, if the new firmware is not required immediately, you can delay the time when the new firmware takes effect and allow the firmware to take effect at the next server restart.
Server management capabilities
Background
Most servers need to provide highly reliable services with stable processing capabilities. This indicates enhanced stability, reliability, security, and maintainability, as well as higher management capabilities.
Broadly speaking, deployment, monitoring, and diagnostics are all part of device management. Of course, identifying on-site materials from smart diagnosis system (SDS) logs during maintenance, access control for BMC, configurations for BIOS or BMC, and maintenance for various components also fall under device management.
HDM supports the following management functions for server devices:
· Asset management: Allows users to easily identify and manage their assets.
· Device management:
¡ HDM can manage server hardware, including but not limited to CPUs, memory, hard drives, PCIe modules, power supplies, and fans.
¡ HDM can monitor an operating system's status, for example, detecting the system running status through resource usage rates. To obtain more detailed resource usage rate information, collaboration between HDM and FIST SMS is required.
¡ Event log management: A server's operation should be stable. HDM provides event logs and early warnings, which help operation and maintenance personnel know abnormal events, identify issue root causes, and quickly resolve issues. Early warnings can help effectively reduce the probability of system downtime.
¡ Operation log management: HDM logs various operations, such as logins, logouts, firmware updates, component replacements (such as, CPU, memory, hard drive, and power supply), configuration import/export, and system locks. These logs directly display changes and reasons of changes in configurations, components, and versions during normal server use.
¡ Remote control: HDM provides convenient remote control, allowing users to view and control systems directly from the HDM page.
¡ Firmware inventory management: The firmware inventory summarizes firmware information for various server components. Through the Redfish interface, users can easily obtain firmware version information for all servers managed by HDM in the data center, facilitating unified query and upgrade.
· Component management:
¡ Component information management: HDM can obtain, display, and monitor both static and dynamic information about components. The information is displayed on the HDM page. Users can also actively monitor reporting of information or pushing of content through IPMI/Redfish/SNMP Agent, which includes various event log warnings. During the server's operating cycle, through periodic sampling data, HDM uses sensors as carriers, draws the dynamic change trends for various components. For example, the temperature sensor displays the trends of components in running status.
¡ Power supply and consumption management.
· Host management:
¡ HDM supports the KVM, H5 KVM, VNC, and JViewer remote consoles. It also supports operations such as power control, screen capture, and video recording.
¡ Virtual media: HDM supports mounting for floppy drive, CD/DVD, and hard drive/USB device virtual media, as well as folder mounting.
· Unified control:
¡ HDM supports managing servers in bulk. It supports the operations such as adding devices, deleting devices, viewing device information (IP, product name, serial number, health status, server power status, and UID status), accessing HDM, power operations, and accessing H5 KVM.
Technical key points
Asset management
Each proprietary component of H3C servers is assigned a unique material serial number during design. If a component has an EEPROM, FRU information is written into it at the factory. For a purchased component, we provide a unique material identification solution based on the basic information provided by the component, such as model, serial number, part number, and original vendor information.
We assign each server a device-level serial number (combining serial numbers for three items into one) for distinguishing between servers. Additionally, we provide a solution for writing asset information, facilitating writing user-defined information into asset tags for server asset management.
Device management
HDM's device management mainly covers the following aspects:
· Identification of the connection topology of various components on the device.
· Server power supply and power consumption management.
· Cooling solutions, including liquid cooling and fan control.
· Power on/off management:
¡ AC power control and customized power-on delay policy.
¡ Support for disabling physical power button.
¡ Based on hardware design, HDM can support a power supply policy for modules in S5 status located at specific PCIe slots. After you enable this policy, the smart Ethernet adapter installed in such a slot can be powered on, and the corresponding fans regulate their speeds to ensure the cooling needs of the smart Ethernet adapter.
¡ Support for power-on sequence control, for example, the power-on sequence control for the smart Ethernet adapter and system host.
Component management
To prevent operational mistakes, HDM supports displaying mark information for various components, including sensors, event logs, and mark information in component location information.
HDM-supported mark and location information meet the following requirements:
· The mark information displayed on HDM is consistent with that on the server.
· The component mark information displayed by various HDM APIs is consistent.
· Provides visual layout consistent with the installation layout of the server's CPUs and memory modules.
· Provides a visual temperature graph for temperature sensors whose layout locations are consistent with those on the server.
HDM supports management on various components, such as CPU, memory, storage cards, hard drives, power supplies, fans, network adapters, and GPU cards. The supported functions include:
· Out-of-band information reading, historical information storage, and predictions based on historical data in specific scenarios.
· Out-of-band settings, such as out-of-band management of storage cards that support it, and setting the active or standby mode for power supplies.
· Event reporting and handling, especially maintainability events, which involve collecting contextual information.
· Life expectancy prediction for some components, such as hard drives that support obtaining SMART information.
The server supports reading the following information about key server components through the out-of-band management interface.
Table 4 Key server component information
|
Component type |
Information provided by the out-of-band management interface |
Remarks |
|
Processor (CPU) |
· Fully configured CPUs and present CPUs · Slot number · Vendor · Model · Clock speed and maximum frequency · Number of cores and number of threads · Health status · Multi-level cache size · Architecture · PPIN (Intel) |
N/A |
|
Memory |
· Fully configured memory modules and present memory modules · Location · Working frequency and maximum frequency · Capacity · Memory standard and memory Type · ECC state · Vendor name and part number · Health status |
N/A |
|
Drive |
· Fully configured CPUs and present CPUs · Hard drive location · Vendor (Manufacturer) · Model · Interface type and protocol · Capacity · Health status · Remaining life (for SSD hard drives) · Hard drive SMART information |
N/A |
|
PCIe module |
· Module manufacturer and chip vendor · Firmware version · Resource location (CPU and riser card where the module is located) · Basic information of the network adapter, including port name, port number, MAC address, and port type · Network port information, including MAC address, root BDF, BDF (with port numbers), maximum speed, connection speed, connection status, interface type, LLDP status, and LLDP configuration · Network adapter port traffic (when FIST SMS is installed) · Health status |
Common network adapters include: · Onboard network adapters · Mezz network adapters · PCIe standard form network adapters · OCP form network adapters · Intelligent network adapters The information that can be obtained depends on the actually installed PCIe modules. |
|
Heat dissipation device: fan |
· Fully configured fans and present fans · Fan location · Model · Speed and rate ratio · Health status |
Fan information is not available on the HDM page for immersion liquid cooling models and non-HDM controlled fan models. |
|
Cooling device: liquid cooling module |
· Full configured modules and present modules · Leak detection and disconnection detection |
Supported only for liquid cooling models. |
|
Optical transceiver module |
· Temperature information acquisition · Temperature involvement in speed regulation |
Requires that both network adapters and optical transceiver modules support information acquisition. |
|
Power supply |
· Fully configured power supplies and present power supplies · Power location · Vendor · Model · Rated power · Input voltage · Output voltage · Current power value and health status |
Not available for blade servers and chassis model servers. |
The server supports managing the power control policies through the out-of-band management interface, including:
· Supports obtaining the total power consumption of the server.
· Supports remote power-on, power-off, and reset.
· Supports obtaining the server power on/off status.
· Supports the power capping technology. You can enable and disable power capping, set the power cap value, and specify whether to enable shutdown on capping failure.
Host management
HDM supports the following host management functions:
· Identification of components: Obtaining TPM presence status and presence status of dual SD modules.
· In-band information management: Obtaining BIOS version, ME version, BKC version information, Post codes, host address space, SMBIOS information, operating system version, and host operating status.
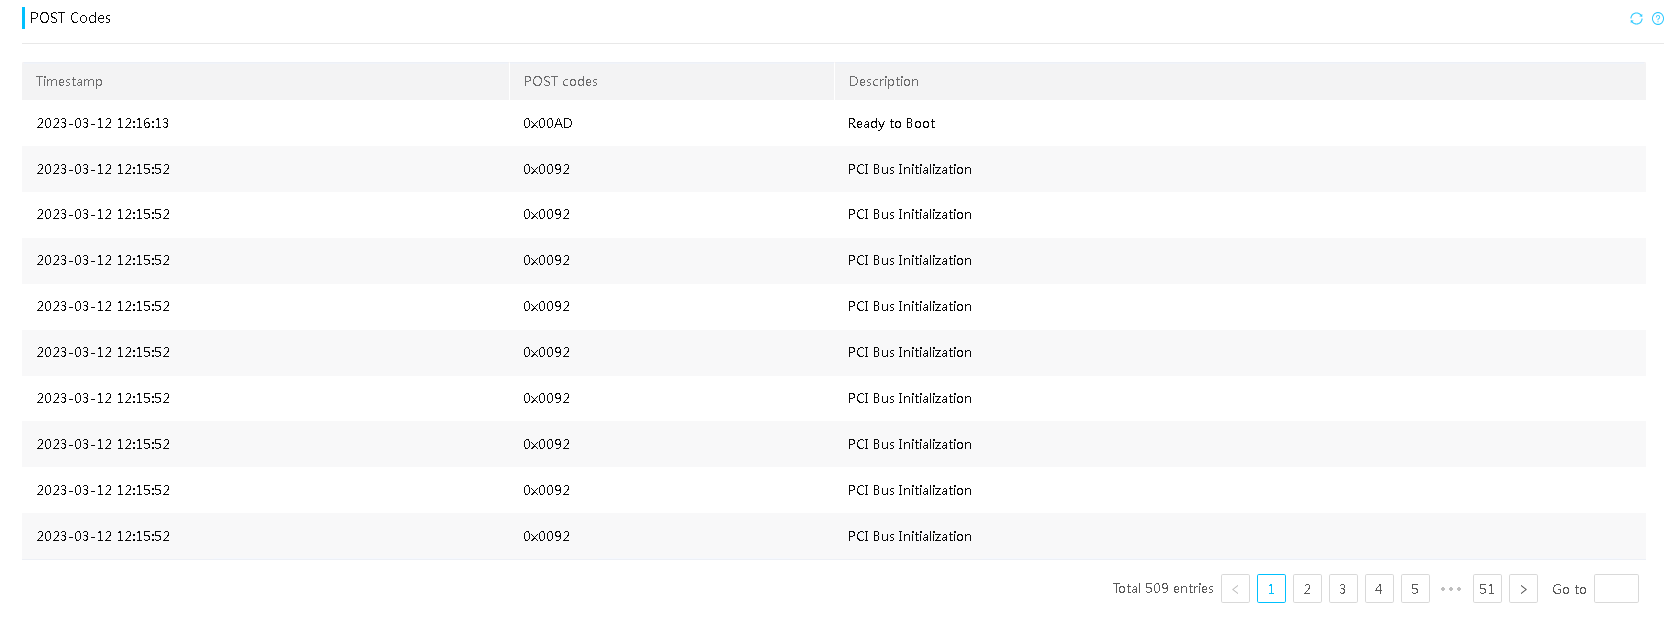
¡ HDM supports displaying POST codes in clear text, as shown in Figure 32. It directly displays the description of each POST code, allowing users to quickly identify the fault location and type. This facilitates targeted troubleshooting, saves time, and provides a user-friendly experience.
Figure 32 BIOS POST code in clear text
For in-band management features that require implementation through the OS Agent, the server need to provide relevant firmware, hardware drivers, and development interfaces to ensure that third-party management software can implement related in-band management features. HDM supports obtaining the following information through in-band management:
· Server CPU usage.
· Total memory capacity, used memory capacity, and memory usage rate of the server.
· Network port transmission rate and reception rate.
· Network adapter firmware version number.
· Optical transceiver module DDM information.
· IPv4 and IPv6 address lists of server network ports.
· Network MAC address and network port name.
Application scenarios
Recommendations for enhancing reliability performance
HDM supports the following configurations to enhance the overall server reliability:
· Start policy upon IERR occurrences.
· Isolation policy upon memory failures.
· Customized power-on delay.
· Security monitoring information.
· Online detection of power supplies, fans, and mode switching.
· Fan cooling policy.
· HDM's reliability.
Server monitoring capabilities
Background
To meet daily operation and maintenance demands, servers need to provide interfaces for continuous monitoring by network management systems to ensure normal operation of devices. When a server device encounters an anomaly, it must actively report the fault to the external maintenance system for quick detection and prompt troubleshooting. The server also needs to monitor some key resources in itself for troubleshooting purposes.
Based on the monitoring requirements in various scenarios, HDM provides the following main features:
· Provides multiple interfaces for continuous monitoring of server hardware by external systems to realize these features:
¡ Allows viewing current and history statuses.
¡ Provides device status and server status.
¡ Supports monitoring of components, and in particular, provides features such as component lifetime prediction and fault warnings.
· Provides a comprehensive logging solution to meet requirements in various scenarios.
¡ Provides users with standardized and component-based event logs, operation logs logging the operations of all parties, audit logs for secure use, and component replacement logs.
¡ Full lifecycle level operation parameter records provided by SDS logs.
¡ Supports offline logging and remote diagnostic analysis.
· Uniform, industry-standard, and comprehensive alarm channels across product lines:
¡ Standardized interfaces that meet the management requirements on IPMI, Redfish, and SNMP.
¡ A direct alarm mechanism on the server based on emails and logs.
· Compatible with mainstream network management systems for easy incorporation of server devices.
· Provide comprehensive host monitoring capabilities. For more information, see related descriptions.
Technical key points
System health status
On HDM, you can obtain the overall health status of the system and the health status of each component on the system. Health statuses are displayed through the Web, health LEDs, LCD panels, and the intelligent security bezel.
Figure 33 Summary information on the Web interface

On the Dashboard page, you can view the overall health status and summary alarm information of the server.
The overall health status of the server depends on the health status of the relevant components, such as the processor, memory, fan, power supply, storage, PCIe modules, temperature sensors, system board, backplane, and adapter cards.
Component monitoring
· Provides static data query interfaces for each component, continuously monitors dynamic data, senses abnormal events, and triggers corresponding diagnostic analysis based on event types.
· Provides a user-friendly Web page for easily viewing various dimensional information related to components.
· Supports multi-level monitoring of multi-role components (such as PCIe-based network and RAID devices), redundant components (such as power supplies and fans), combined components (such as RAID controllers, supercapacitors, OCP cards, and corresponding fans), multi-unit components (such as memory and hard drives).
· Monitoring information is summarized by level. The final system health status is determined based on the impact on the device.
Sensors
Temperature monitoring displays the distribution maps and values of temperature sensors for various components in the server chassis. Physical structure diagrams are also provided as references, as shown in Figure 34. The temperature graphs use colors between green and red to show the temperature distribution inside the server chassis and use circles to represent sensors. You can hover over a circle to view the target sensor's name, status, temperature reading, and threshold. Green indicates 0°C (32°F). As the temperature gets higher, the color gets warmer until it changes to red. The coordinates' meanings are as follows:
· X: Sensor's position on the X-axis.
· Y: Sensor's position on the Y-axis.
· Z: Node to which the sensor belongs. (Different Z values are displayed in models with multi-node and multi-layer designs.)
Figure 34 Temperature heatmaps
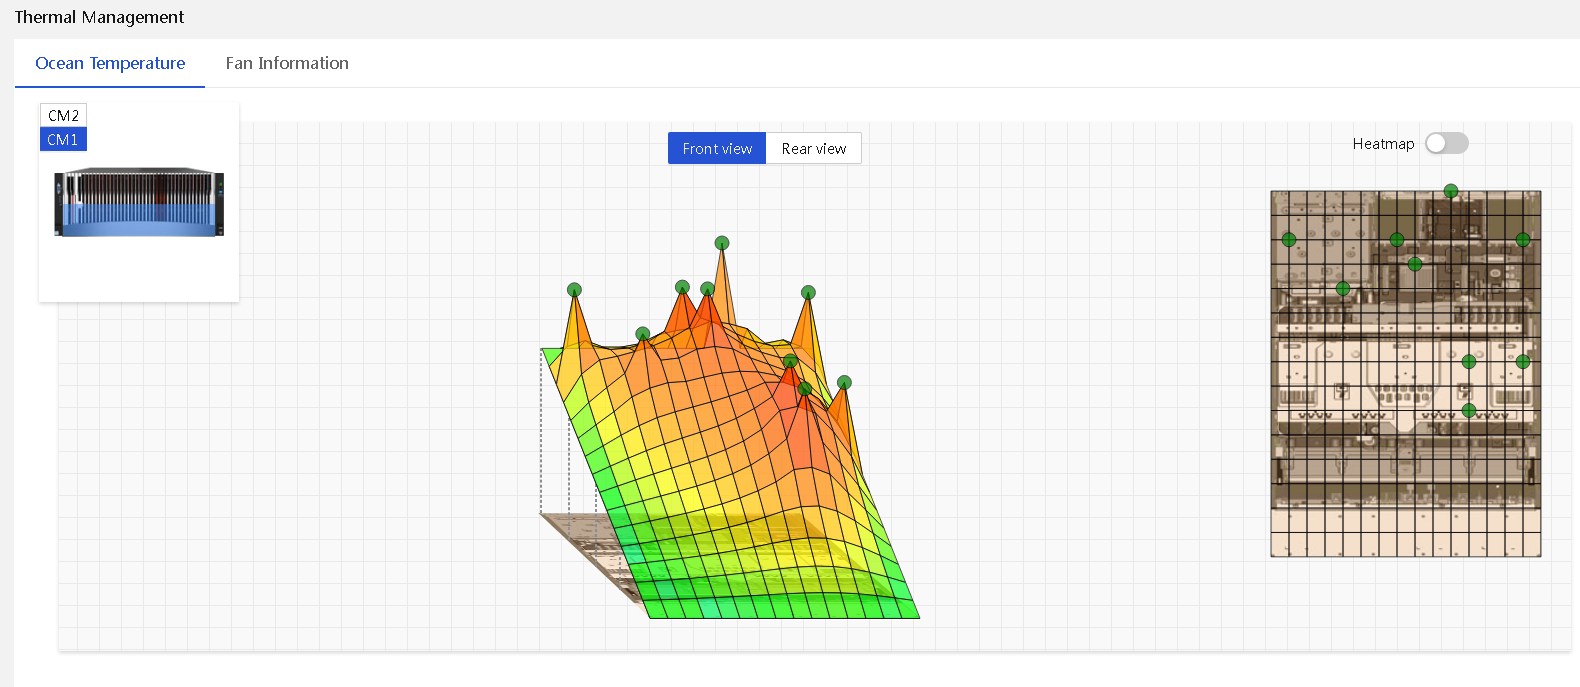
On HDM, you can view the readings of a sensor (temperature, current, voltage, fan speed, or power) in a line chart during the past 24 hours, past 7 days, or past 30 days. You can hover over the lines in the chart to view the maximum, average, and minimum readings during the statistics collection period.
Figure 35 Sensor reading chart
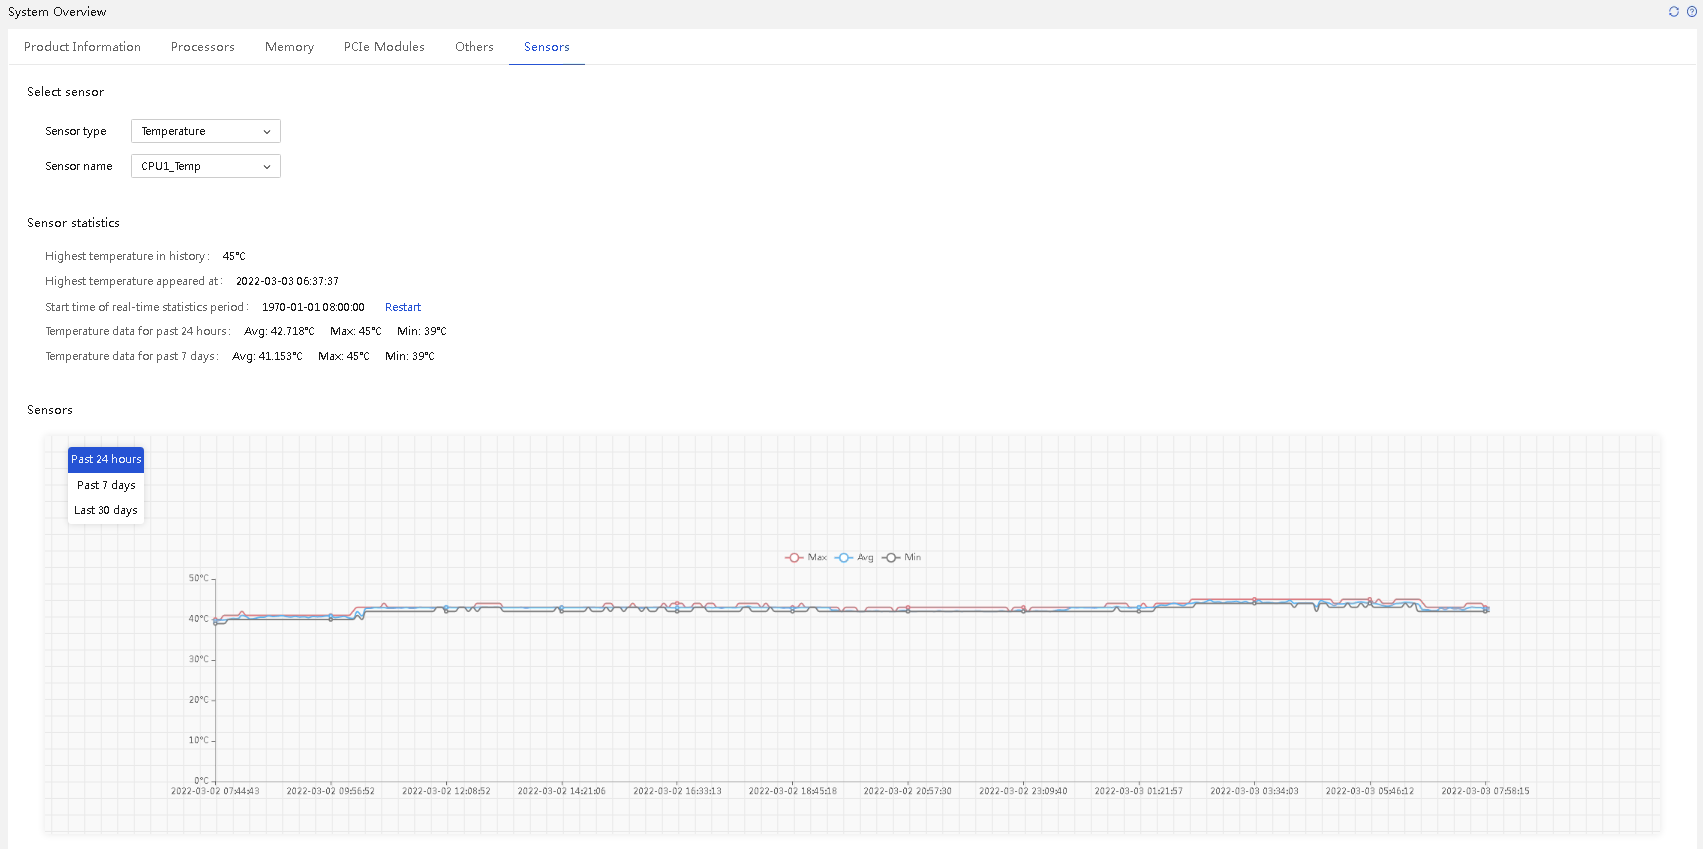
For sensors that have not sampled data or have encountered monitoring anomalies for a long time, the system assigns labels such as not sampled and unavailable. Not sampled is commonly seen in the first sampling point after HDM is started. Unavailable is commonly seen in known (unmonitored scenarios) or abnormal (monitoring failures caused by link anomalies) sensor unavailability situations.
HDM supports identifying the configuration of the server, dynamically generates sensors that need to be monitored based on the identification results, and monitors these sensors. For parts that can be physically installed at the reserved positions but have not been installed, you can view the sensors related to reserved status. For parts that cannot be physically installed (such as uninstalled Riser modules or backplanes), no extra sensors are generated, which saves monitoring resources to some extent.
Standard log output
H3C's event log implementation has the following characteristics:
· Compatibility: Uses standard IPMI logs to ensure that all logs can be detected through IPMI commands.
· Pairs each alarm trigger with the corresponding alarm clear event, facilitating external management operations.
· Clear text: All event logs can be read directly.
· Component-specific: Each alarm log is linked to its corresponding component, which can be used for quick identification and localization.
· Full lifecycle records: Records all event logs to meet the requirements of event log recording during normal warranty period.
· Flexible external interfaces and integration capabilities: Supports multiple interfaces for reporting fault information, facilitating integration with upper-level operation and maintenance systems.
Simultaneous monitoring through multiple channels
· Server alarm channels
Alarms can be reported through the following channels on the server:
¡ Hardware LEDs, mainly displayed on the front and rear panels of the server, including the LEDs on each component, intelligent security bezel LEDs, LCD panel LEDs, and system-level hardware LEDs.
¡ Software device health LEDs, mainly displayed on the Web page and can be queried through IPMI commands.
¡ Event log-based alarm information, including event logs in SEL, SDS logs and event logs in SDS for internal positioning, and information variants displayed through various monitoring channels (mainly including SNMP trap, SMTP, Redfish, and remote rsyslog), and internal log information.
¡ Sensor-based alarm information.
¡ Alarm information in the BIOS and OS.
When an abnormal event occurs, it can be monitored by one or more of the above-mentioned channels. The monitoring capability depends on whether the hardware has the ability to report events and whether the reporting channels are smooth (have been implemented and have no exceptions). HDM receives abnormal information, processes anomalies, and identifies the fault types in combination with the context. The processed information will be sent to multiple interfaces, making it externally accessible. In transmission through different channels, the information will be mapped and converted, which might cause information loss and inconsistency. To avoid these issues, you must clarify the related rules.
· Event logs
Event logs are implemented as defined by the IPMI standard, and accessed and parsed using the standard ipmitool from the outside. This is a standard measure in early server management. HDM supports event log-based monitoring and provides component descriptions based on event logs available to users.
Event logs collaborate with SMTP, SNMP, Redfish, and syslog, and act as the trigger and data sources for these alarm channels, but they have the following differences:
¡ SNMP adds features such as OID, SN, and extended description information on the basis of event logs.
¡ Syslog messages describe the extended information of event logs and are transmitted externally.
· Hardware health LEDs
When the front system board fails, the CPLD logic will light the hardware health LED and provide feedback on the CPLD register. The software senses hardware faults monitored by the logic by querying and responding to interruptions. After processing the faults, if the software identifies an anomaly that the user needs to be aware of, it outputs event logs and marks the sensor status. The information is then further transmitted to the software LED. The alarm status is written back to the logic, which is ultimately reflected in the hardware LED status.
Before BMC starts, hardware lighting is controlled by the system board. After BMC starts, it is controlled by the BMC.
· Software health LED
The software health LED indicates the current health status of a device (hardware). It reflects the combined health status of various components, including memory, CPU, system board, PCIe, power supply, heat dissipation, storage, and temperature/current/voltage (essentially the system board and various cards).
The memory, CPU, and PCIe information is primarily transmitted by the BIOS. BIOS can transmit memory information during both the post and runtime stages.
The following restrictions and guidelines apply to the software health LED:
¡ The health LED is associated with only the alarm type event logs.
¡ Alarms with the minor severity level are not associated with the health LED.
¡ Pure software alarm information is not associated with the health LED.
¡ The device's health status is determined by combining the health status of each component and evaluating the impact of component faults on the system.
¡ The software health status is written back to the hardware health LED, ensuring consistency between the hardware and software health LED statuses.
· Sensors
Sensors are used to describe the current information of a given object (presence, readings, and anomaly indicators) and can identify the monitoring status of an object. According to the IPMI standard that defines the implementation of sensors, external parties can obtain sensor information through the ipmitool open-source tool. Sensors can be classified into continuous (threshold-based) and discrete (non-threshold-based) categories. Continuous sensors are used to monitor continuous physical data (such as temperature, voltage, current, rotation speed, and power) on hardware. Discrete sensors mainly serve as the subject of event logs, providing feedback on monitoring results for various hardware monitoring points.
Sensors report changing events through event logs, allowing users to know the triggering or clearing of events, and identify the source and type of faults based on the information contained in the event logs. Sensor names are usually strings that can reflect the location information of the components.
Sensor-related elements include sensor name, sensor status, and sensor reading. The main functions of a sensor are as follows:
¡ The sensor name identifies the associated component or its physical mark.
¡ The sensor status indicates the status of the corresponding monitored object (which is not necessarily a hardware component).
¡ You can combine the readings of a continuous sensor with the sensor's unit to have a complete understanding of the sensor's values (for example, 35 degrees C, 220 Volts, or 5400 RPM). Discrete sensor readings indicate whether individual events are in a triggered or cleared state.
· Other channels
When BIOS or OS detects hardware anomalies during runtime, it outputs the error information through traditional OS channels such as serial ports and VGA channels. HDM provides the one-click download feature. The downloaded files include the Smart Hardware Diagnosis (SHD) results and bootlog startup information.
Application scenarios
Monitoring capability configuration
The following monitoring solutions are provided:
· Monitoring through IPMI.
· Email monitoring through SMTP.
· Monitoring through syslog messages.
· Monitoring through SNMP traps.
· Monitoring through the Redfish API interface.
· Offline analysis.
Log parsing method
The main application scenarios for logs include:
· Developers and maintenance personnel perform offline analysis based on downloaded SDS logs.
· During production, you can use in-band commands to obtain SEL from out-of-band sources so as to determine whether any fault information exists.
· iService generates device health reports based on event logs, sensor status, and SHD results.
· Web pages extract SHD and history information from logs for display.
SDS logs
To achieve offline diagnosis without compromising user privacy, SDS logs monitor and record data from the BMC and host throughout their entire lifecycle. The recorded information mainly includes:
· Static information of the device that can be used to construct the topology structure of the device and understand the parameter information of each component.
· Event Logs, including raw SEL and clear-text SDS logs.
· MCA failure parsing results. Specifically, results of diagnostic analysis based on 400+ built-in rules.
· SHD, including smart diagnostic log information for each hardware component.
· Device operation records, including operation logs, upgrade logs, and restart reason analysis logs.
· Configuration information for devices such as the BIOS, BMC, and RAID.
· Host running data, including BIOS's POST code, smbios, bootlog.
· Data based on restart events.
· BMC runtime data.
· Log information used for internal fault diagnosis.
· Sensor history data information.
External parties can take the following operations to parse and obtain related information based on offline version of SDS:
· Downloading SDS logs by day, month, time period, or all SDS logs, viewing the download progress in real-time, and analyzing device static information based on SDS logs.
· Knowing the fault symptoms. For example, obtaining causes for restart events (one of the key events) and time when the restart occurred.
· Sorting operation logs, audit logs, event logs (SDL), and SHD logs chronologically to obtain the log information before and after the fault occurred.
· Analyzing imported external rules to determine the location of the fault.
Smart diagnosis system
Background
Servers must run reliably to avoid impacting the service. However, electronic components have a certain failure rate, causing equipment to work abnormally and produce various abnormal behaviors. Different abnormal behaviors have different impacts on user businesses. H3C improves equipment reliability and fault diagnosis capabilities throughout the entire process and in all aspects through design, production, processing and after-sales service. Smart diagnostic system(SDS) integrated within HDM provides a unified fault report format for all monitored parts. With over 1500 fault diagnosis cases integrated internally, the system achieves an accuracy rate of over 95% in fault reporting. Ensure that accurate fault information is provided when an abnormal fault occurs, so that O&M engineers can handle the problem appropriately and resume service as soon as possible.
1. Easier to manage H3C servers
¡ The multilayer interface facilitates docking with a variety of external O&M systems.
¡ The standard IPMI and Redfish interfaces are used to present alarm and monitoring data externally.
¡ Provides a public cloud management platform.
2. Reduce downtime and allow devices to run more reliably
¡ To reduce the likelihood of unexpected shutdowns. MRT intelligent repair prevents over 40% of unplanned memory downs.
¡ Detect faults in key parts early to make potential mistakes more controllable.
3. Reduce operational costs and quickly restore services
¡ SDS accelerates problem location and shortens fault recovery time.
¡ Get all the logs at once to avoid multiple interruptions.
Architecture
HDM SHD is a full life-cycle smart device diagnosis system of H3C HDM server (red brand), which can quickly and accurately identify and diagnose the failures of the main hardware components on a server.
Overview
SHD collects basic hardware fault information, including sensors, CPLDs, and event log, identifies the causes based on history diagnosis database, and generates a diagnosis report. The diagnosis report provides information about the faulty module, time of fault occurrence, fault type, fault description, possible causes, diagnosis criteria, and solutions. The diagnostic results are presented in various ways to meet the diverse usage requirements of different types of users in various dimensions.
The diagnosis feature involves the connection with the external network management system. The fault alarm diagnosis function is considered from the perspective of out-of-band management software. Its main framework is as shown in Figure 36.
Figure 36 SDS fault diagnosis diagram
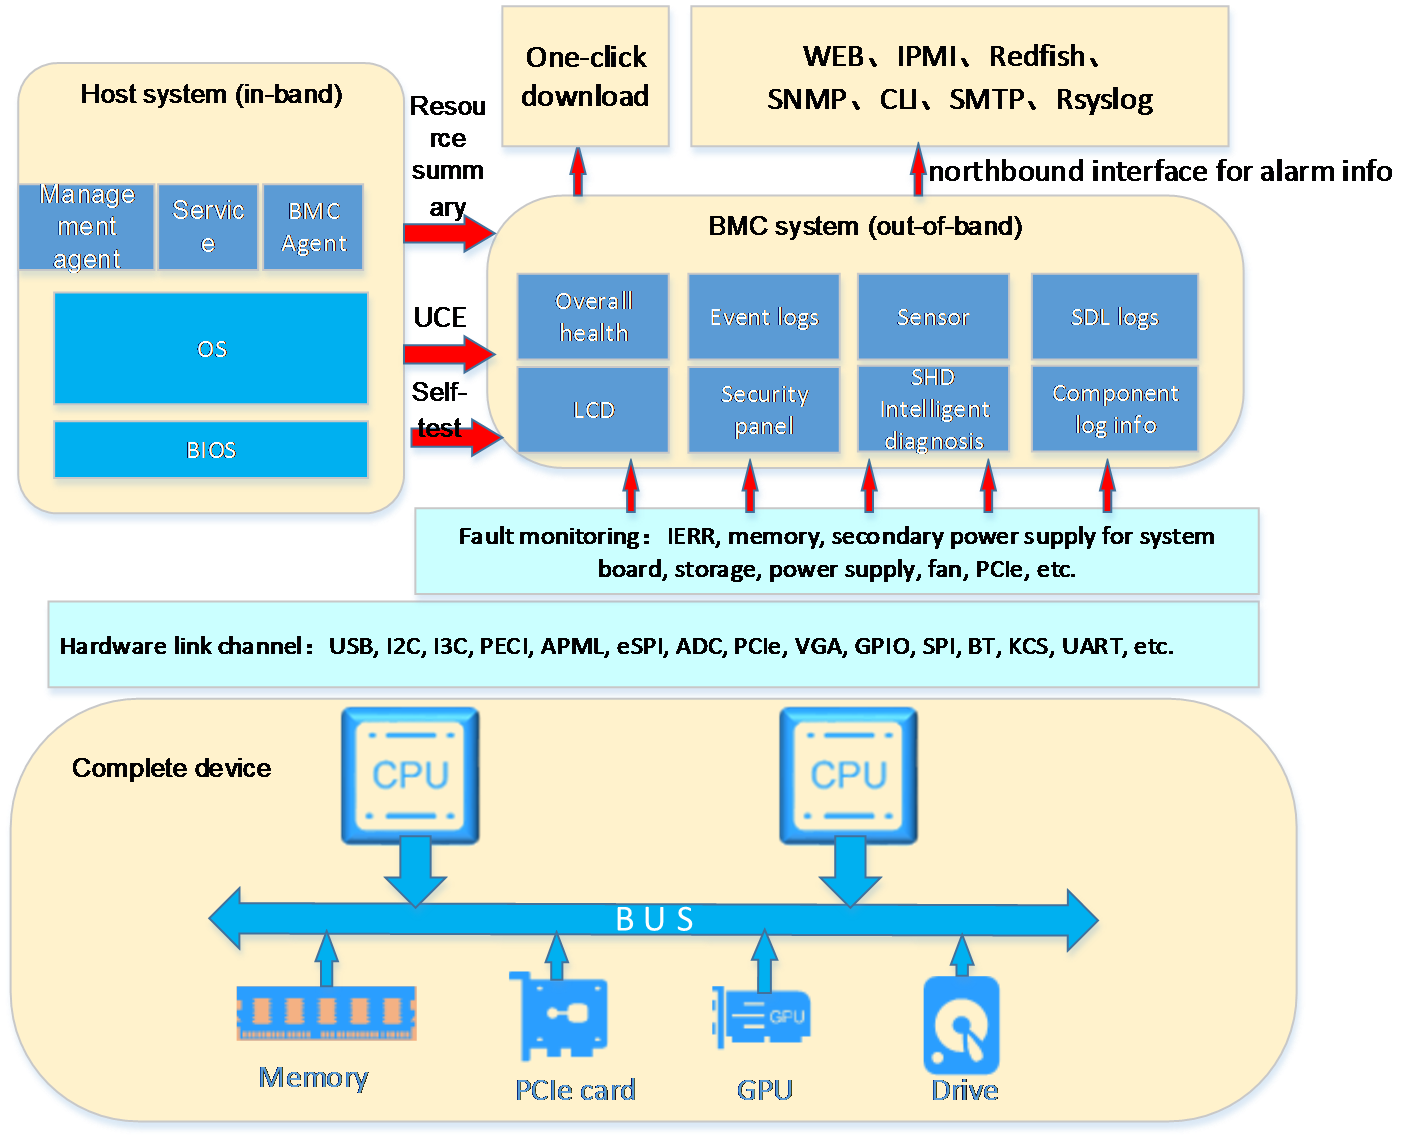
SHD provides an all-round monitoring on the main components of a server, and the following hardware faults can be detected and diagnosed:
· MCA faults, including faults on processors, memory, PCIe modules, or system boards.
· Power supply faults, including faults on current, voltage, temperatures, power supply fans, IIC, and current sharing.
· System board faults, including faults on secondary power supplies, fans, network adapters, electrical current, voltage, and temperature sensors.
· PCIe module faults, including faults on network adapters, riser cards, and NCSI channels.
· Storage controller faults, including faults on storage controllers, cables, expander modules, cache, supercapacitor, and drives.
At the same time, SHD offers a number of auxiliary fault diagnosis functions, which are mainly presented as log records and maintainability functions. Auxiliary diagnosis includes server system screenshots, HDM serial port logs, host serial port logs, IPMI process debugging logs, HDM restart reason records, plaintext display of BIOS self-test codes, and other logs when the fault occurs. With these auxiliary fault diagnosis functions, user can better understand the situation on the scene when a fault occurs.
Technical key points
Comprehensive fault source awareness and failure mode analysis
1. Alarms triggered by server
SDS have various methods to monitor the server information, especially the hardware monitoring information. The main alarms on the current server include:
¡ Alarm information transmitted by BIOS and OS.
¡ ME's monitoring of the CPU.
¡ Alarms obtained directly through the out-of-band access capability of the component.
¡ Alarm information discovered through monitoring signals with CPLD.
¡ In addition to alarms generated by hardware devices, alarms can also be generated within the monitoring software.
2. Fault types that need to be treated differently
Due to different server usage scenarios, different types of alarms generated in the system need to be handled differently. The types of faults that need differentiated treatments include:
¡ Historical device faults: Alarm has been cleared. The current system is running normally. The firmware is isolated. Business has been reduced and resumed.
¡ Redundant component faults: The system is operational, but redundant parts such as fans and power supply are missing.
¡ Software faults.
¡ Assembling class faults.
¡ Non-hardware entity faults.
Alarm severity levels
If a server component fails or the server operates incorrectly for some reasons, such as downtime or power outage, HDM generates alarms of different types for different faulty modules and generates log at the same time.
The alarm severity levels include:
· Info—The event does not affect the system and no action is required. Examples include normal state changes and alarm removed events.
· Minor—The event has minor impact on the system, but it requires prompt action to avoid an escalation in severity.
· Major—The event has serious impact on some subsystems and might result in service interruption.
· Critical—The event might result in system crash or shutdown. Immediate action is required.
The following types of faults can be detected:
· Processor faults—IERR errors, self-test errors, configuration errors (including processor UPI errors, IOH UPI errors, processor core errors, and IOH core errors), and MCERR errors.
· Memory faults—Correctable errors, uncorrectable errors, memory pre-alarm on ADDDC and inspection UCE-to-CE errors, Intel MRT-based memory fault prediction and memory intelligent repair, overtemperature errors, and POST training failure.
· Power supply faults—Power presence detected, power supply input lost (AD/DC), predictive failure, and power supply self-test errors.
· Fan faults—Fan presence detected, faulty fan, and downgrading failure.
· Storage faults—Drive presence detected, faulty drive, predictive failure, critical array error, and failed array error.
· Overtemperature faults—Overtemperature conditions on processors, memory, air inlets, power supplies, and drives.
· Voltage faults—Voltage and current faults on the system board and other server boards.
· Bus faults—Faults on the I2C, IPMB, or QPI/UPI bus.
Host-centric fault diagnosis
Based on the analysis of the live network, it is found that the faults in the host-centered information records are mainly related to the service.
· Bootlog mechanism records the key parameters of each startup.
· Analysis of host restart reasons is supported
· Analysis of host downtime anomalies is supported.
· The web page can display the migration process of host status.
Alarm processing mechanism
The fault diagnosis processing module is the core of SHD. It collects and analyzes data from various dimensions of hardware, BIOS, BMC, and operating systems. It researches and analyzes corresponding standards, code implementations, and real-world fault data. It gradually improves and forms a fault diagnosis system, covering dimensions such as fault identification, self-healing, isolation, repair, pre-alarm, and handling.
H3C has a professional big data training team and platform. H3C continues to collect key component training samples required for AI training and continues to train the data based on the industry's advanced machine learning technology. The developed models are fully deployed on HDM, UniSystem, and cloud operation and maintenance systems. It realizes real-time monitoring of all server components, all statuses, and all out-of-band operating status, making operation and maintenance work easier and more proactive.
1. Identify the fault
The module extensively monitors the server and presents faults based on built-in rules. It accurately identifies faults down to the specific component level, with an accuracy rate of over 95%. Perform the following methods:
¡ Continuously monitor the overall system working environment of the server, each component, and the host state. Thoroughly record various potential and risky events during the server operation.
¡ The system has over 1500 built-in fault detection points, covering all known mistake points of every component.
¡ Using built-in expert rules for diagnosis, and the accuracy can reach over 95% by validating at the component level.
2. Fault self-healing
The module attempts to perform self-healing operations on detected server faults, improving device serviceability duration. The methods of implementation include:
¡ Fully use the RAS capability of the hardware to automatically recover or isolate faults from CE errors and recoverable UCE errors.
¡ Adopt redundancy technology to ensure the security of BMC and BIOS firmware, and automatically perform restoration during a fault.
¡ Adopt the restart restoration mechanism to reboot and restore faults in I2C and BMC SD, which do not disrupt the service.
Fault self-recovery is implemented in some scenarios to avoid unexpected downtime or business migration caused by some repairable errors and to prevent interference with production activities.
3. Fault isolation
Isolating discovered faults within the module can reduce the impact on the current system and allow the service to continue running while reducing specifications.
¡ In some memory fault scenarios, ADDDC, PPR, and Soft Page Offline of Linux OS can be used to isolate the faulty memory area to avoid system downtime caused by subsequent access to the area.
¡ Upon startup, memory, CPU, and PCIE faults are detected and can be automatically isolated. The server can still start up and enter the system.
Isolate some faults and use derated configuration to start the system to meet some needs for continued service and business migration.
4. Fault repair
The module fully explores the potential of each device component, automatically repairs some faults, and quickly fixes certain faults. This reduces or even eliminates disruptions to the currently running business.
¡ On the Intel platform, HDM uses the MRT method to monitor DDR5 memory chip health in real time, predict faults, and translate faulty memory row-column addresses to system memory page physical addresses. Then, HDM reports this address information to the OS through the BIOS to isolate faulty memory pages, achieving efficient intelligent fault repair and reducing system crashes.
¡ BMC supports patch operations, which can quickly fix some minor issues.
In some scenarios, online upgrades of CPU microcode and BMC are supported to meet requirements for fault repair when certain services cannot be stopped.
5. Predictive alarming
The module uses advanced AI technology to monitor and process system operation data to detect potential faulty components in advance, allowing users to have strategic control over potential risks.
¡ The module supports monitoring the life of NVMe drives and predicting end-of-life faults.
¡ The module supports SMART threshold predictive alarming for SATA HDD drives.
¡ The module supports using BIOS inspection and ADDDC, and can inspect and predict memory faults.
Fault reporting
HDM supports real-time monitoring of hardware and system fault statuses, and proactively reports fault event logs. The reporting channels include SNMP Trap, SMTP, Redfish event subscription, and remote Syslog.
At the same time, SDS logs can also be used to implement offline fault reporting and diagnosis capabilities. By using the one-click collection function of HDM, you can view diagnostic reports in SDS log to obtain detailed information about hardware faults.
Fault diagnosis
MCA fault diagnosis (for servers with Intel processors)
Machine Check Architecture (MCA) is an important part of SHD. MCA fault diagnosis supports fault detection and diagnosis on processors, memory, PCIe modules, and system board. SHD applies a polling detection mechanism to monitor and diagnose MCA errors. That is, after detecting CATERR or MSMI signals during the polling process, SHD informs Autonomous CrashDump (ACD) to collect basic on-site hardware fault information in an out-of-band manner. Based on the collected data and history hardware fault diagnosis database, SHD locates and analyses hardware faults, generates diagnosis reports, and reports SEL logs. Figure 37 describes the workflow of the MCA fault diagnosis mechanism.
Figure 37 MCA fault diagnosis diagram
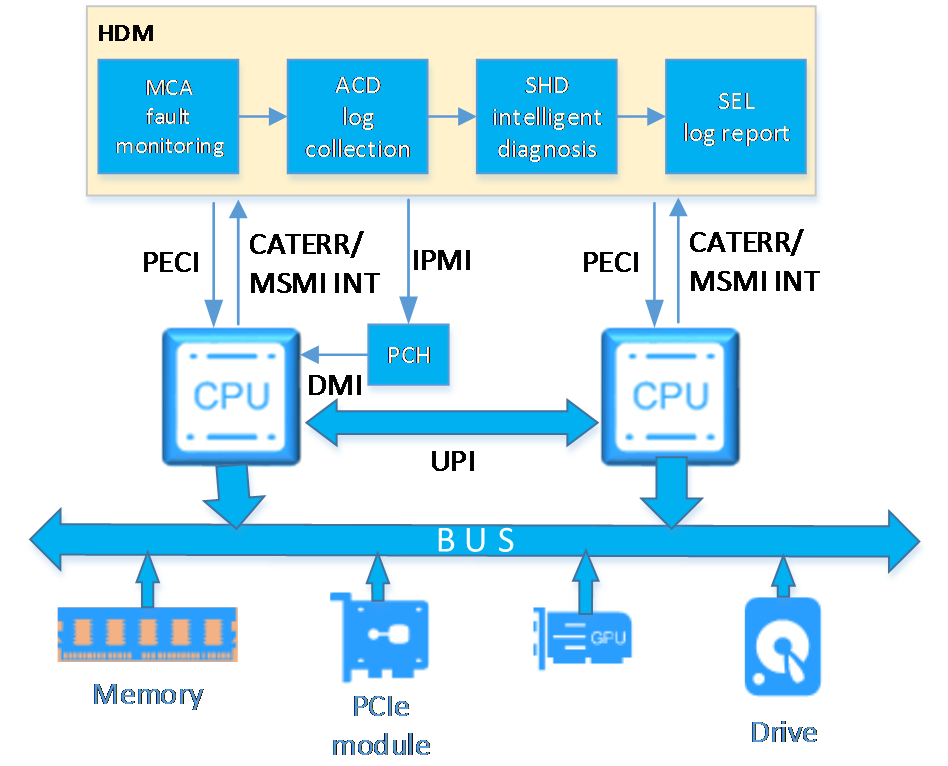
1. Processor fault detection
Processor faults might be caused by internal errors inside the processors or by external errors from memory and PCIe modules. MCA fault diagnosis can detect errors occurring on the internal modules of the processors, including fetch units (IFUs), data cache units (DCUs), and data translation lookaside buffers (DTLBs). MCA fault diagnosis can identify error types, comprehensively analyzes suspected error sources, and locates the faulty component. The following are common types of processor faults
¡ Cache uncorrectable errors, including read errors, write errors, and prefetch errors.
¡ Watchdog timeout errors, such as three-strike timeout errors.
¡ UPI uncorrectable errors.
¡ Power control module errors inside the processors.
¡ Processor access timeout.
2. Memory fault detection
Memory faults include correctable errors and uncorrectable errors. An uncorrectable memory error in the system will seriously affect the services. MCA fault diagnosis focuses on detection and diagnosis of uncorrectable errors. MCA fault diagnosis focuses on detection and diagnosis of uncorrectable errors. It analyzes memory error addresses recorded by the error recording module, identifies the faulty DIMM, and locates the specific processor, channel, and DIMM. The following is common types of uncorrectable memory errors:
¡ Incorrect memory access addresses or memory access commands.
¡ Memory write or read errors.
¡ Memory cache control errors.
¡ Memory timeout errors.
3. PCIe fault detection
MCA fault diagnosis can analyzes PCIe error addresses recorded by the error recording module, identify the faulty PCIe module, and locate the specific processor and slot.
The following is common types of PCIe faults:
¡ Unsupported Request (UR).
¡ Malformed TLP.
¡ Completer Abort (CA).
¡ Completion Timeout (CTO).
¡ Poisoned TLP.
¡ ACS Violation.
¡ Flow Control Protocol errors.
¡ Data Link Protocol errors.
¡ Surprise Down errors.
MCA fault diagnosis (for servers with AMD processors)
For AMD products, HDM integrates ADDC and APML. When the OS crashes, HDM uses the ADDDC tool to collect crash data from the CPU through APML in an out-of-band manner. HDM collects raw CPER file information, processes it into plaintext, and records it persistently. The recorded data can be used by professionals to perform analysis upon post-crash environment data.
HDM accepts the relevant AMD MCA data transmitted by the OBIS and parses the data to obtain the following information:
1. Processor fault detection:
¡ Uncorrectable and correctable processor errors. MCA fault diagnosis can locate an error on a specific socket.
¡ Errors in the SMN registers. An error that might trigger a cold system restart is recorded in the SMN registers. MCA fault diagnosis can locate an error on a specific socket.
2. Memory fault detection
¡ ECC and non-ECC memory errors. MCA fault diagnosis can locate an ECC memory error on a DIMM, or a non-ECC memory error on a channel.
¡ MEM training errors and MEM test errors. MCA fault diagnosis can locate an error on a DIMM.
3. PCIe fault detection
¡ PCIe correctable and uncorrectable errors. MCA fault diagnosis can locate an error on a slot.
Memory fault diagnosis
In order to enhance memory reliability, we have conducted in-depth cooperation with memory and processor suppliers to explore memory RAS features. We monitor the entire life cycle of memory in servers, aiming to enhance memory reliability. The technical points adopted by HDM in memory RAS are as follows:
1. HDM integrated Intel MRT memory intelligent repair.
Intel MRT predicts fault locations based on micro-memory fault distribution. It can use the OS offline capability to proactively address fault points and enhance memory reliability, thus improving system stability further.
¡ Prediction model with guiding policies
The prediction model trained on the features of Intel CPUs and DDR memory manufacturers, achieves higher accuracy compared to traditional prediction models.
¡ Optimize the offline feature of the OS
The memory prediction results can also be linked with the OS to isolate and repair faulty pages. This operation can prevent faults from evolving into uncorrectable errors that might cause system crashes.
¡ Reduce unnecessary DIMM replacements
By analyzing memory errors, predicting potential memory faults, and accurately identifying memory locations in logs and webpages, it can effectively help engineers to identify DIMM accuracy.
2. Fully integrate the RAS features related to Intel memory
Intel RAS features can be configured to enable ADDC, memory spare, memory mirror and other technical features according to the requirements of the application scenario. By leveraging space, we can further enhance the reliability of memory and even boost performance.
3. Fully integrate the monitoring capability inherent in DDR5
For example, the On-die ECC feature is enabled by default to promptly correct ECC mistakes inherent in the memory on-site (mostly caused by cosmic rays and the impact of external high-speed particles).
The out-of-band continuously monitors the PMIC unit on the memory via the I3C bus in real time, thus controlling the working environment of the memory in real time.
By sampling and analyzing ECS, we can verify whether any mutations exist in the ECS results and predict whether the memory failure occurs.
4. Support out-of-band monitoring of dynamic memory information
HDM adds support for monitoring key sensors for memory temperature and voltage.
5. Support memory authentication and anti-counterfeiting
HDM adds support for identifying whether a DIMM is H3C certified. The authentication result for a H3C-certified DIMM is as shown in Figure 38. A non-H3C-certified DIMM does not have authentication result as shown in Figure 39.
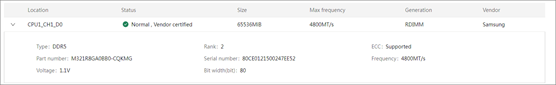
Figure 39 Non-H3C-certified DIMMs

Power supply fault diagnosis
SHD uses the interrupt reporting and polling mechanism to monitor power supplies, and can identify 11 of 24 power supply fault types. The 11 fault types include the following:
· Power supply absence.
· Input voltage faults, including input undervoltage alarm and protection, no input and poor power cord connection.
· Power supply fan fault.
· Temperature anomaly in the air inlet, including overtemperature alarm and protection and low-temperature alarm and protection.
· Output voltage faults, including overvoltage alarm and protection and low-voltage alarm and protection.
· Output current faults, including overcurrent alarm and protection.
· Flashing power supply LEDs at 1 Hz, which indicates a power failure.
· Abnormal IIC communication.
· Incorrect EEPROM information, including incorrect FRU information or absence of H3C certification.
· Power supply models not matched.
· Load balancing not achieved.
System board fault diagnosis
The system board integrates server hardware options. SHD identifies more than 70 types of system board-related faults, including:
· Faults on secondary power supplies in the server, including secondary power supplies for processors and other boards.
· Fan absence and abnormal PWM speed control.
· Temperature anomaly on the chassis, processors, or other boards.
· Abnormal voltage or current.
PCIe fault diagnosis
SHD mainly identifies the faults on network adapters and riser cards. More than 40 types of faults can be located, including:
· Network adapter faults, including power supply fault or temperature anomaly absence on H3C mLOM network adapters and 25-GE FLOM network adapters, and network adapter absence.
· Abnormal presence of riser cards.
· Abnormal NCSI channel change.
Storage controller fault diagnosis
SHD identifies and diagnoses the faults on the PMC and LSI storage controllers by analyzing the event log about the storage controllers. A hundred types of faults can be located, including:
· Storage controller startup faults.
· Cable connection faults.
· Memory faults.
· Supercapacitor faults.
· Drive faults.
· Power fail safeguard module faults.
Predictive alarming
HDM supports active predictive alarms on the components such as processors, memory, drive, storage controllers, network adapters, and power supplies.
· Processors—Predictive alarming on correctable configuration errors, overtemperature errors, UPI bus errors, and DMA errors.
· Memory—Predictive alarming on correctable ECC memory errors, inspection errors, and ADDDC pre-alarm.
· Drives—Predictive alarming on predictive failure, media errors, and Predfail for HDDs and SSDs, predictive alarming on bad sectors for HDDs only, and predictive alarming and monitoring on remaining SSD or NVMe life.
· RAID card—Detection and predictive alarming on correctable bus errors for PCIe links of the RAID card. Alarming on battery pre-failure (low voltage) on the array card.
· Network adapters—Detection and predictive alarming on correctable bus errors for PCIe links of network adapters.
· Power supplies—Alarming on predictive faults, including predictive failure, load imbalance, power cap value exceeding correction time limit, and predictive alarming on power supply self-test errors.
Remote diagnosis
Support remote diagnosis of the host, include:
· Analyze host information using serial port logs, blue screen snapshots, and blue screen recording functions.
· Support remote debugging methods such as ASD (Intel) and iHDT (AMD).
List of supported faults
The main alarms supported by each component are as follows:
Table 5 Faults
|
Component type |
Key alarms supported |
|
BMC |
Alarms generated when the power consumption of the system board and each expansion board backplane, riser card, and fan board exceeds the upper and lower thresholds. |
|
BMC |
Alarms generated when the voltage of the system board and each expansion board backplane, riser card, and fan board exceeds the upper and lower thresholds. |
|
BMC |
Alarms generated when the current of the system board and each expansion board backplane, riser card, and fan board exceeds the upper and lower thresholds. |
|
BMC |
Alarming on the BMC management system processor with a self-test function. |
|
BMC |
BMC sets major and critical alarm thresholds for all monitored voltages, electricity, and temperatures. |
|
BMC |
Alarm and log when each voltage, current, or power consumption sensor fails to read. |
|
BMC |
Monitoring and alarming of RAID controller status. |
|
BMC |
Monitoring and alarming of RAID card BBU (capacitor) status. |
|
BMC |
Monitoring and alarming of network card status. |
|
BMC |
Monitoring and alarming of the transceiver module's link status on the network card. |
|
BMC |
Alarming on electronic tag reading failure. |
|
BMC |
Alarming on BIOS or firmware ROM damage. |
|
BMC |
TPM or TCM detection and alarm. |
|
BMC |
Video controller detection and alarm. |
|
BMC |
Monitoring and alarming of BMC NAND Flash status. |
|
CPU |
Any change in the state of any processor triggers an HDM alarm and be logged. |
|
Processor |
The core voltage of the CPU, CPU_VCORE is being monitored in real time for power consumption. |
|
Processor |
CPU Thermal Throttling |
|
Processor |
Detection and alarm of internal processor errors. |
|
Processor |
Processor PCIe MMIO resource detection and alarm. |
|
Processor |
Processor Mismatch |
|
PCIe |
PCIe Advanced Error Reporting |
|
PCIe |
Reporting of Corrected Errors in PCIe |
|
PCIe |
PCIe Link CRC Error Check and Retry |
|
PCIe |
PCIe |
|
PCIe |
PCIe Stop and Scream |
|
PCIe |
Hot Plugging in PCI Express |
|
PCIe |
Any change in the state of a PCI or PCIE card triggers an alarm on the fault diagnosis panel and be logged. |
|
PCIe |
Detection and alarm of PCIe card self-test state. |
|
PCIe |
Detection and alarm of PCIe card initialization state. |
|
PCIe |
Detection and alarm of PCIe retimer or switch. |
|
System |
For components that support hot swapping, the hot swap signal should have an isolation circuit to avoid EOS damage to the device during hot swapping. |
|
System |
Detection for failure or freeze when accessing the shared bus (such as IIC). |
|
System |
Alarms on the CPLD online upgrade interface. |
|
System |
CPLD custom bus alarm. |
|
System |
Monitoring and alarming of state of expansion boards such as backplanes, Expanders, and Risers. |
|
System |
Detection and alarm of mounting ear in-place status. |
|
System |
Detection and alarm of power cable status. |
|
System |
System configuration mismatch alarm. |
|
System |
Watchdog detection and alarm. |
|
System |
Designed Error Records |
|
System |
Recovery of Machine Check Architecture (MCA) - Non-Execution Path* |
|
System |
Enhanced Machine Check Architecture (EMCA): Generation 1. |
|
System |
Enhanced Machine Check Architecture (EMCA): Gen2* |
|
System |
LCD state inspection and alarm. |
|
UPI |
Intel UPI Link Level Retry* |
|
UPI |
UPI link CRC verification |
|
UPI |
Source Text: Intel UPI Protocol is protected using a 32-bit CRC. |
|
UPI |
Intel® UPI corrected and uncorrected faults, Thresholding for Corrected Errors (KTI, PCIe)* |
|
UPI |
Intel UPI Viral Mode* |
|
Power supply |
The power cap value set by the system software cannot exceed the rated power value of one of the minimum PSUs in the configured power module. |
|
Power supply |
Failed Power Supply Unit (PSU) Identification |
|
Power supply |
A power module pull-out alarm. |
|
Power supply |
A power supply redundancy insufficient alarm. |
|
Power supply |
An alarm that the power supply cannot be identified. |
|
Power supply |
The internal fan of the power supply stalls. |
|
Power supply |
An alarm for a communication failure between the power supply and the system. |
|
Power supply |
An overvoltage protection alarm for the power module. |
|
Power supply |
An input overvoltage alarm for the power module. |
|
Power supply |
An input undervoltage protection alarm for the power module. |
|
Power supply |
An input undervoltage alarm for the power module. |
|
Power supply |
An output overvoltage protection alarm for the power module. |
|
Power supply |
An output overvoltage alarm for the power module. |
|
Power supply |
An output undervoltage protection alarm for the power module. |
|
Power supply |
An output undervoltage alarm for the power module. |
|
Power supply |
The power module is present but not powered on or power input is lost. |
|
Power supply |
An overtemperature protection alarm for the power module. |
|
Power supply |
An overtemperature alarm for the power module. |
|
Power supply |
A mixed power module alarm for different models. |
|
Power supply |
Monitoring the power-off reasons of the system. |
|
Power supply |
Monitoring and alarming of power supply PG/PWROK. |
|
Power supply |
Power-on timeout alarm. |
|
Power supply |
Monitoring and alarm for voltage drop of slow-start circuit MOS tube. |
|
Fan |
Any change in the presence of a fan (chassis) should trigger an HDM alarm and be logged. |
|
Fan |
Any change in the rotational speed of a fan (chassis) should trigger an HDM alarm and be logged. |
|
Fan |
Alarm for fan cable fault. |
|
Fan |
Alarm for fan unit and system board communication failure. |
|
Fan |
Fan failure isolation strategy during system startup. |
|
Key integrated circuit (IC) |
CPLD failure alarm. |
|
Key integrated circuit (IC) |
RTC failure alarm. |
|
Key integrated circuit (IC) |
EEPROM failure alarm. |
|
Key integrated circuit (IC) |
Alarm for timed detection of FLASH and SSRAM failure. |
|
Key integrated circuit (IC) |
PCH failure alarm. |
|
Key integrated circuit (IC) |
Clock detection and alarm. |
|
Environment |
The actual working temperature of the device exceeding the minor or critical alarm threshold should trigger an alert through HDM and be recorded in the log. |
|
Environment |
The actual operating temperature of the device exceeds the fatal alarm threshold, an alarm should be triggered through HDM and recorded in the log. |
|
Environment |
During the monitoring process, temperature alarms and anomaly protection, such as resets and power-downs, should be logged and the causes for the protection should be saved before the protection measures are implemented. |
|
Environment |
Alarm for failure of device access to temperature sensor. |
|
Environment |
Abnormal temperature sensor reading data alarm. |
|
Memory |
Memory Thermal Throttling* |
|
Memory |
Memory Address Parity Protection |
|
Memory |
Memory Demand and Patrol Scrubbing |
|
Memory |
Recovery from Mem SMBus hang |
|
Memory |
Data Scrambling |
|
Memory |
Memory Self-Refresh |
|
Memory |
Reporting on Memory Corrected Errors |
|
Memory |
The core voltage of CPU0_DDR_VDD and power consumption are being monitored in real time. |
|
Memory |
Memory PFA |
|
Memory |
Any changes in memory location and status should be alerted through the fault diagnosis panel and recorded in the log. |
|
Memory |
Any incident causing the BIOS to disable a rank in a memory module or a channel in a DDR controller due to a mistake must be logged in the SEL. |
|
Memory |
Detailed information on memory ECC errors is recorded in the log. |
|
Memory |
BIOS must provide a threshold that can set the number of ECCs. When the number of ECCs in the system exceeds the threshold, BIOS will log into the SEL. |
|
Memory |
Monitoring and alarm for NVDIMM status. |
|
Memory |
Detection and alarm for memory types. |
|
Memory |
Detection and alarm for memory compatibility. |
|
Memory |
Detection and alarm for memory Initialization. |
|
Drive |
Any drive read or write failure should trigger an alarm. |
|
Drive |
Real-time SMART detection of drives. When a fault occurs, an alarm is issued and recorded in a timely manner. |
|
Drive |
Any drive disconnection should trigger a high-level alarm to prompt the user for maintenance. |
|
Drive |
Logical drive detection and alarm. |
|
Drive |
Detection and alarm for drive configuration. |
|
Drive |
RAID status detection and alarm. |
|
Drive |
SSD drive lifespan detection and alarm. |
Note: The items marked with an asterisk (*) are related to processor architecture.
Application scenario
UniSystem obtains device logs in bulk
H3C UniSystem supports bulk management of HDM and provides patrol reports based on HDM intelligent diagnostics. UniSystem can complete batch server equipment management and remotely download server batch SDS logs in one package to meet customers' operation and maintenance needs.
To facilitate customers to download SDS logs in bulk quickly and conveniently, H3C provides an out-of-band bulk download tool for SDS logs. This function can be achieved through the out-of-band interface provided by HDM using script method, without the need for installation and deployment.
Remote fault reporting
UniSystem supports call home (remote repair) function, including manual and automatic remote fault reporting. When a managed server failure is detected, remote fault reporting can be performed. Multiple remote fault reporting modes are supported, including immediate reporting, periodic reporting and fault-triggered reporting.
Figure 40 Framework diagram for fault reporting
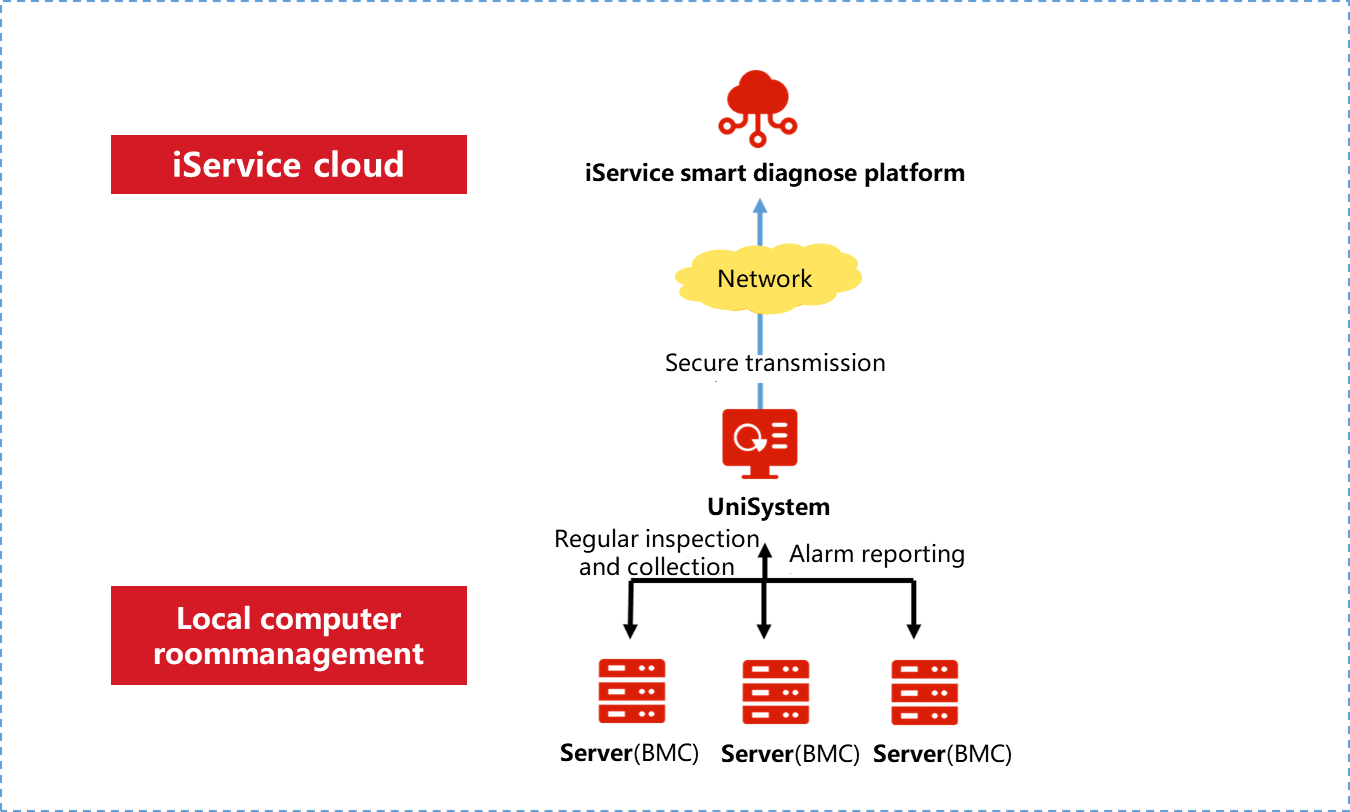
FIST/HDM directly connects to iService to complete the device fault reporting process. Users must purchase an iService account. After purchase, you can periodically transfer logs, automatically upload to the cloud after a fault, benefit from intelligent cloud-based operations, and predict faults.
Host monitoring capabilities
The main purpose of servers is to provide storage, computing, and even communication services for user business. These service capabilities are mainly achieved through the operating system and its applications. At the same time, monitoring the operational status of the host is also very necessary to meet the following two requirements:
· Monitoring requirement: During operation and maintenance management, by monitoring the host information, the operation status of the business can be understood, so as to carry out targeted optimization processing.
· Fault record requirement: Track key events and their context to quickly find the root cause when potential problems occur.
To achieve the above monitoring purposes, HDM operates in conjunction with BIOS and FIST SMS, iFIST software to provide the following functions:
· Manages the lifecycle of the host.
· Provides Bootlog function, for easy understanding of the context information of each startup.
· Records the complete host address space list to conveniently view changes in device parameters and detect abnormalities.
· Analyzes the reasons for the host restart, quickly pinpointing the faulty component.
· Collects downtime context, especially after an abnormal restart, for remedial collection to deal with some extreme scenarios.
· Through BMC, provides the ability to deploy OS and configure BIOS/components, and configure graphics card parameters.
· Helps understanding the internal status of the system through BMC (requires FIST SMS support).
· Provides host capacity monitoring and prediction (requires FIST SMS support).
Optimization points of the host's operational capacity
1. HDM supports a VRAM size of 64M, with a maximum supported resolution of 1920×1200 32bpp@60Hz. It allows the onboard graphics card to be disabled via BIOS, and can display the host output through the KVM and panel VGA interface.
2. You can obtain hard drive slot and PCIE card slot information through the band.
Host lifecycle management
HDM comprehensively monitors server startup and operations. It records and presents information on a per-startup basis through standard sensors and event logs, comparison of information between two startups, firmware drift detection, timeout monitoring, timely logging of BIOS sent logs, extraction of suspicious failure contexts, etc. Within authorized access, it maximally records the behaviors of a host for convenient subsequent troubleshooting.
Figure 41 States of a host restart
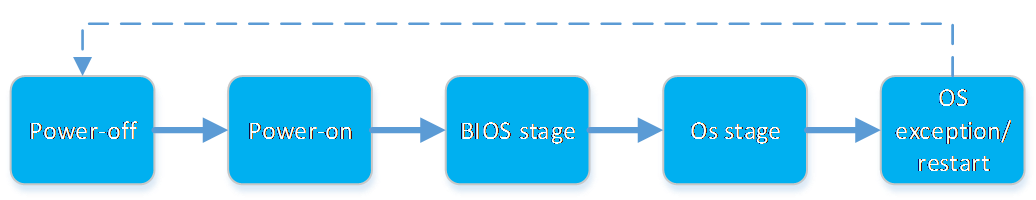
In fact, errors can occur at any of the above stages, which can cause the system to start up abnormally or even crash.
The IPMI standard sensor defines the events corresponding to the key stages of the host. During implementation, HDM fully expands based on the above information.
· Stage identification, which identifies the current startup state.
· Abnormal startup record.
· Startup timeout monitoring.
· Power module status transition record.
· Running exceptions.
On the basis of supporting standard information, HDM further expands the records, mainly including the following:
· Host serial port logging.
· Collection of fault context logs.
· Address space and device information retrieval.
After the host is powered on, HDM performs the following:
· Identifies the CPU type, PCIe devices, and memory devices. Organizes device topology relationships and topology information for each device based on memory map information passed by BIOS.
· Provides interface to power-on events on the host and handles events registered by various modules. For example, the resolution of the previous abnormal event and the update of some sensor information.
· Records the time when the BIOS was started.
· Describes the address space information of the host (for easy troubleshooting and analysis later).
The various states, durations, reasons for restart, and fault records that the host will record during the restart process are shown in Figure 42.
Figure 42 Host status progress
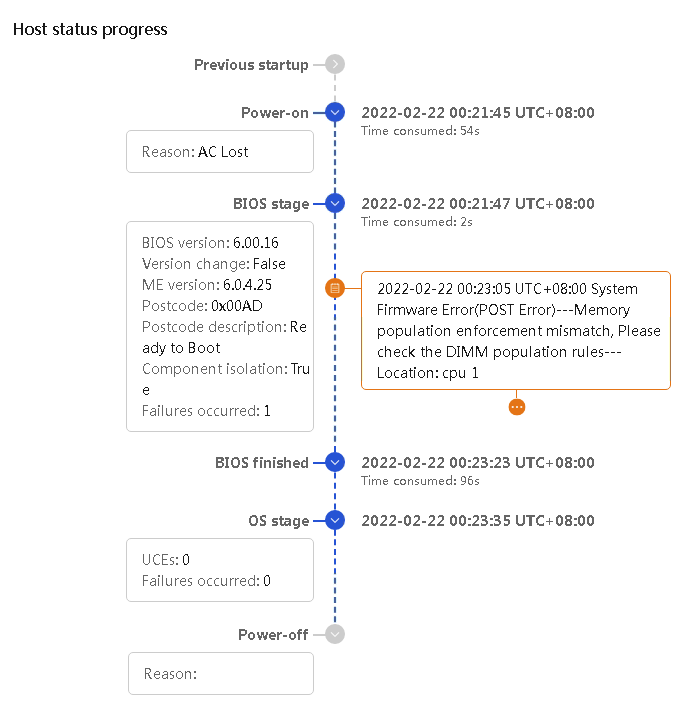
Bootlog function
When the host restarts, it is necessary to collect the bootlog information, which mainly includes device information, configuration information, and log information, in order to facilitate the quick identification of the restart cause. External assistance can be used to locate fault differences by comparing the difference in device information between two consecutive host restarts. The current Bootlog can be obtained through SDS logs and email alerts.
Figure 43 Bootlog record information

Bootlog related information is recorded in SDS log.
Host restart reasons
A host restart event severely affects business and requires to identify the cause quickly, for example, identify whether it is a software issue, an operational issue, or a hardware issue. Get more detailed information to quickly narrow down the problem and identify the faulty unit.
· Power on: The process of turning on the host that was previously in a powered off state. For the convenience of subsequent implementation, the power-on actions intervened by the user are considered as a new round of startup operations, independent of the previous state.
· System crash: The system has become unresponsive, but has not powered down. Manual or BMC automated power-down operations are required.
· Turn off (power down): The system enters a state where the DC power supply is cut off.
· Restart: In general, for users, as long as there is a host restart event, it is considered a host restart. Segmenting further, it includes two scenarios: host restart and host shutdown. More specifically, restart includes warm reset, soft reset, power cycle, and other restart methods.
For changes in power supply state, the industry has reached a consensus to implement according to existing standard definitions. HDM design conforms to ACPI, Redfish, and IPMI-defined descriptions.
· ACPI state transition.
· User interface defined in IPMI.
· Status definition in Redfish.
System resources monitoring
HDM supports continuous monitoring of host resource usage from multiple perspectives, internally records the historical usage of each resource, and provides a unified external presentation interface. Monitoring types include:
· CPU-level monitoring uses the CUPS mechanism of the CPU to monitor resource usage at the CPU level.
· OS-level monitoring relies on FIST SMS to monitor resources at the OS level. It can detect the usage of resources in the in-band operating system, such as CPU occupancy, memory usage, drive usage, network usage, etc.
· Provides historical data on resource usage and forecasts data for the future. Based on historical data used by some resources, establishes an AI prediction model that can predict and display future data on the page, so as to prevent and handle faults in advance.
· Provides thresholds and alarm mechanisms for some resources.
· Displays drive average IO latency, which can be used to evaluate IO performance on corresponding drive partitions.
Figure 44 Host resource monitoring information
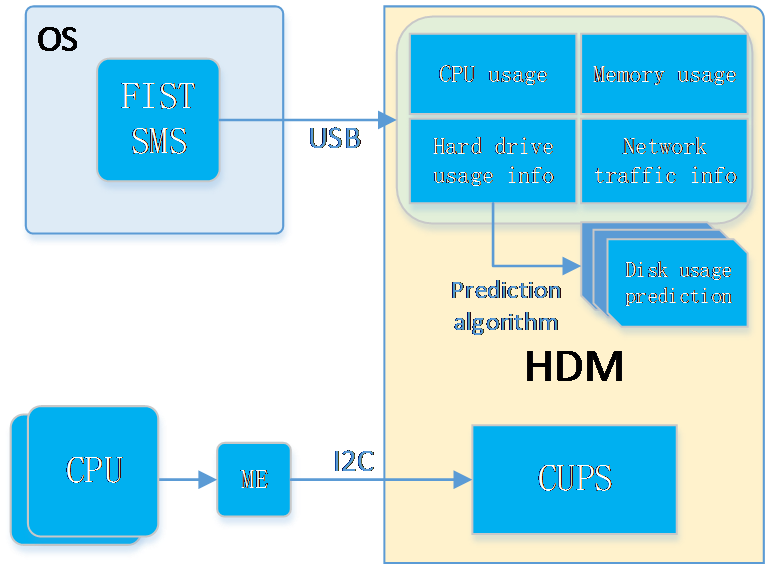
On the system resources page for HDM O&M and diagnosis, you can view the monitoring information about system resources. When FIST SMS is present, you can view abundant resource usage information and historical trends for CPUs, memory, drives, GPUs, and network adapters, as well as models and interface rates of peripheral devices It also supports setting alarm thresholds for CPU, memory, and drive usage. The system will generate alarms when the resource usage rates exceed the alarm thresholds. When the resource usage recovers to normal, the system will clear the alarm.
Figure 45 Resource summary when FIST SMS is present
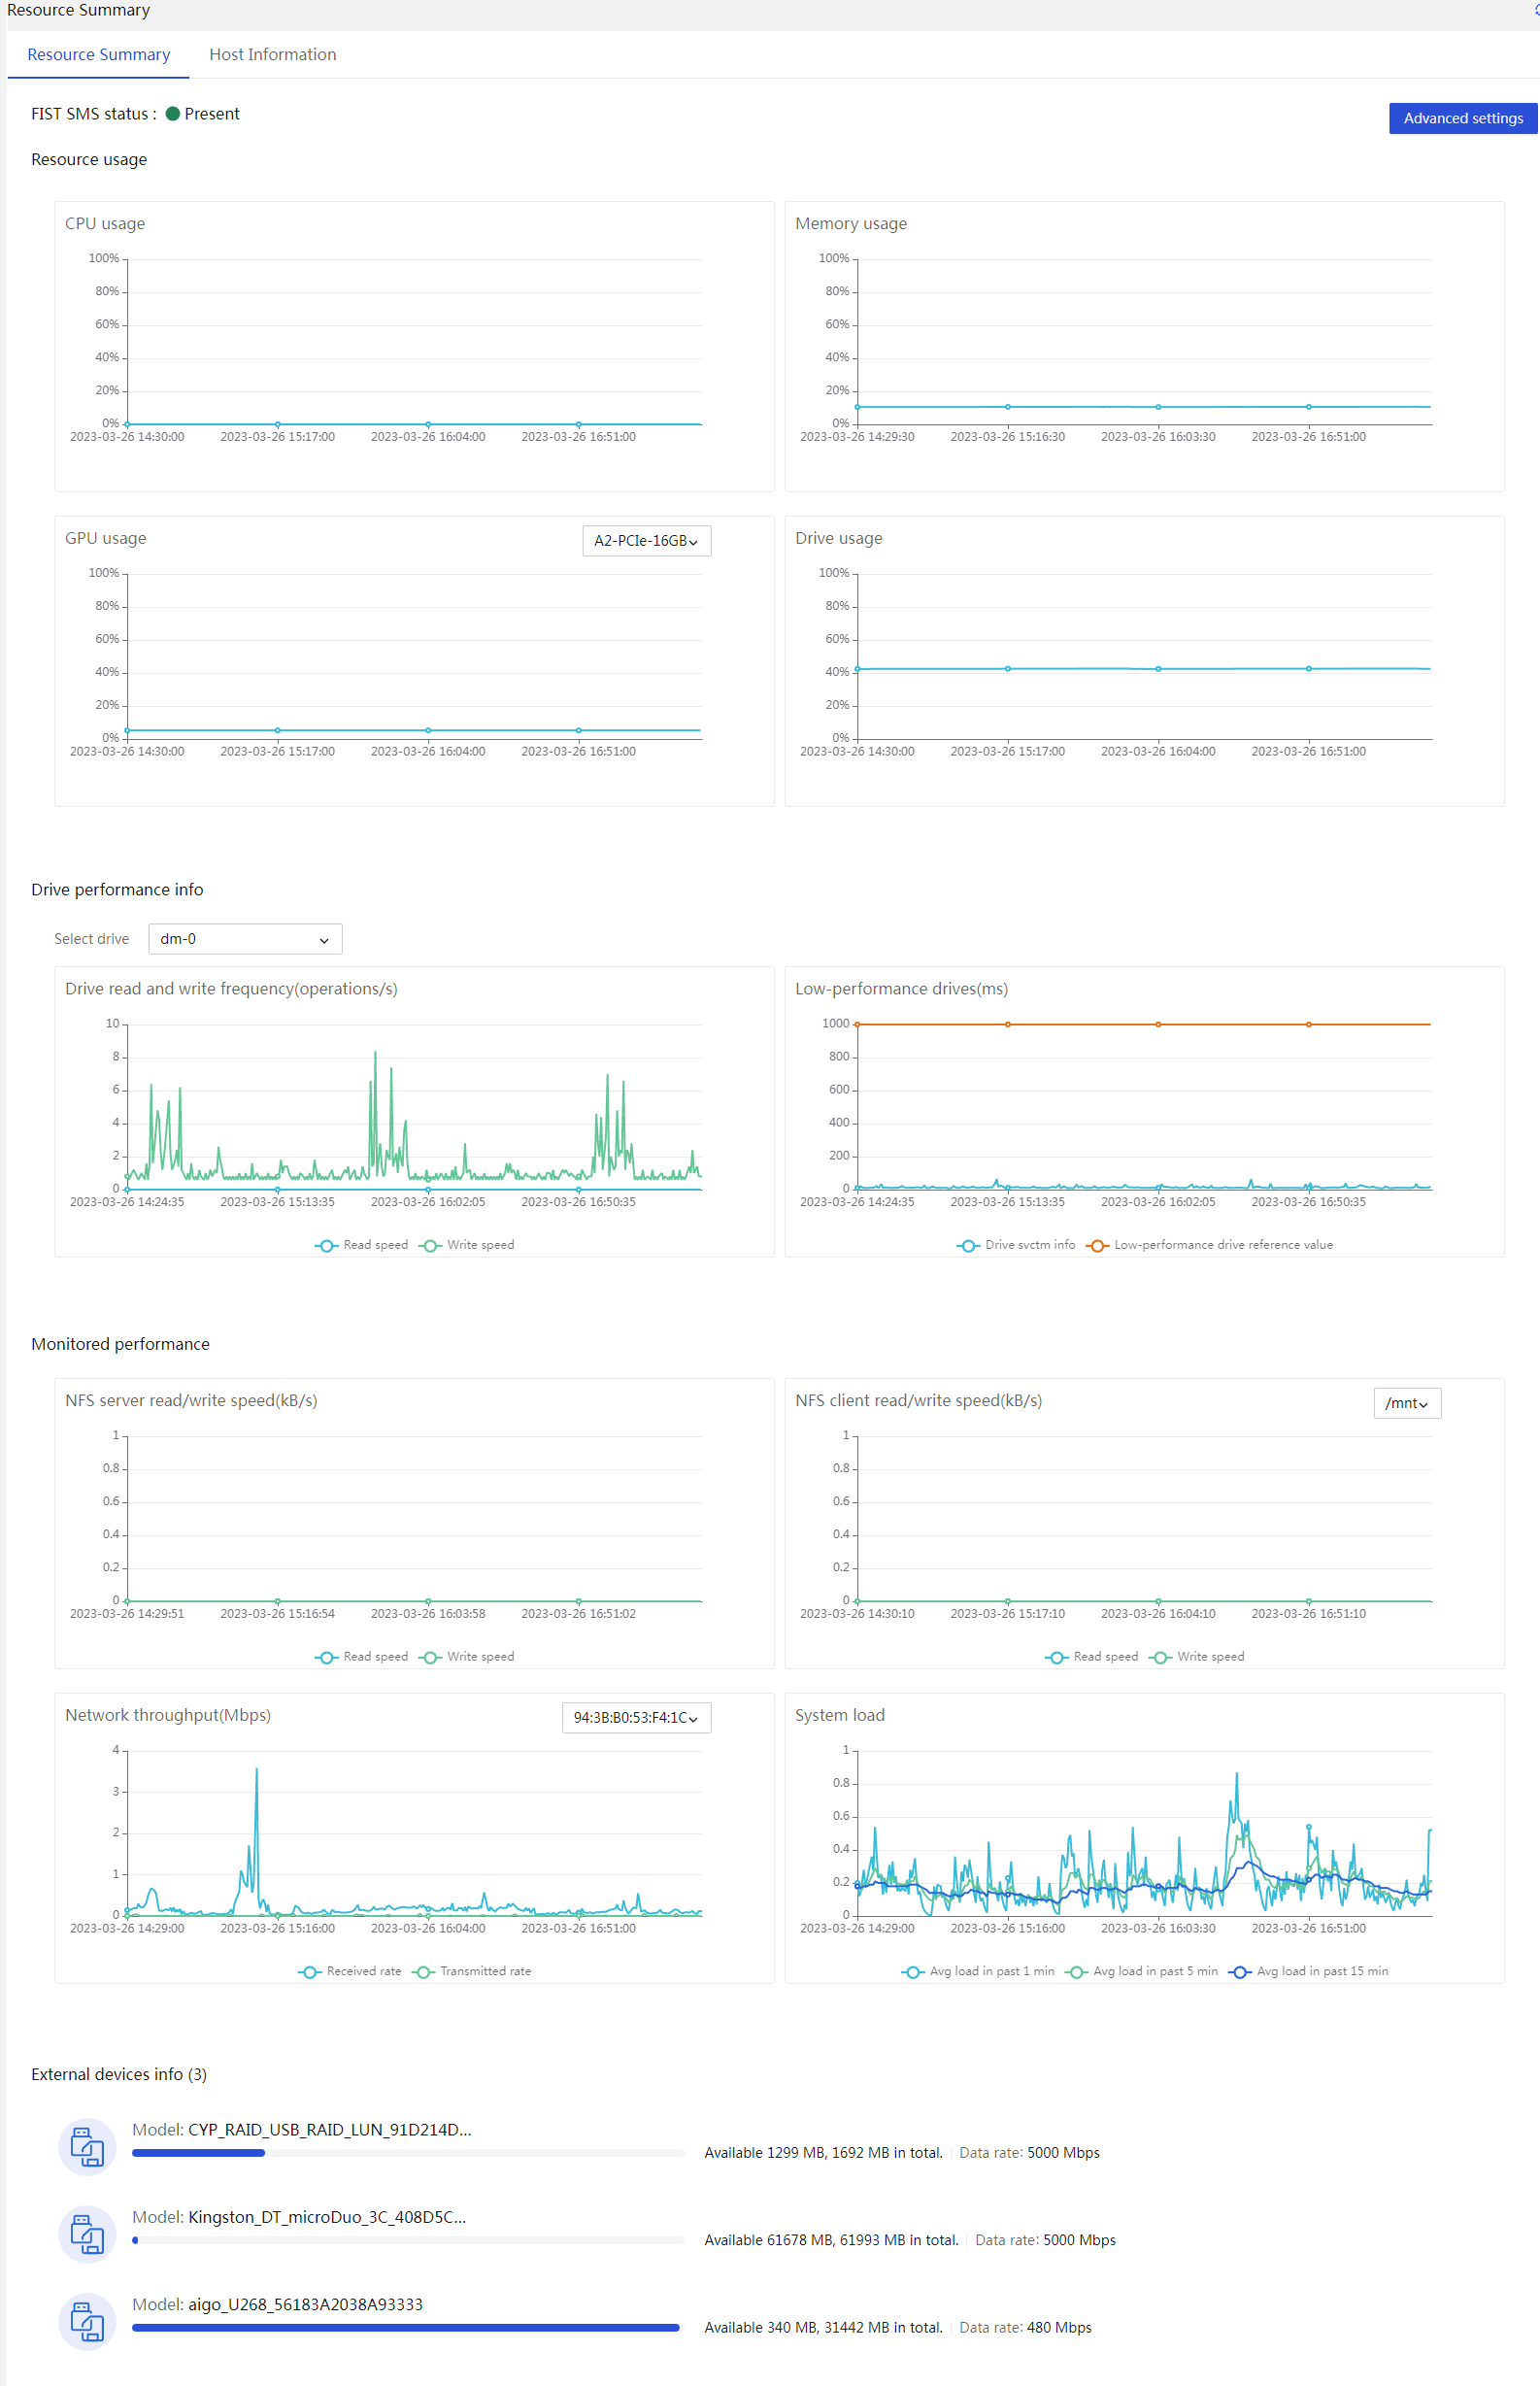
Figure 46 Setting thresholds when FIST SMS is present
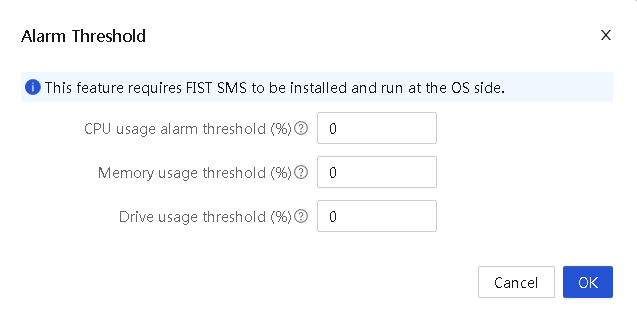
Host watchdog mechanism
In order to prevent the host BIOS and OS from hanging, HDM provides the ability to monitor and handle the watchdog on the host, and it can perform corresponding actions based on user-defined policies when BIOS or OS anomalies are detected.
The main service processes are as follows:
1. Enables the corresponding timer through the BIOS and OS kernel switches.
2. HDM monitors the corresponding Watchdog status.
3. HDM processes timeouts based on user-defined strategies: ignore, restart, shut down, timed interrupt, etc.
FIST SMS
FIST System Management Service (FIST SMS) is an agentless management software that provides support for HDM device management. FIST SMS can provide a broader range of server information, such as operating system information, utilization, and software installation inventory to provide customers with enhanced hardware monitoring and management through operating system information and alert information.
FIST SMS can effectively enhance the monitoring capability of HDM out-of-band monitoring on the host side. At the same time, based on the virtual channel between FIST SMS and HDM, it can fully supplement the host-side monitoring and control capability of HDM and effectively reduce the impact on the host side. HDM can obtain resource usage information and host software list, such as the name and version information of software drivers.
To meet the demand for centralized operation and maintenance management, FIST SMS supports log transfer function. It supports transferring fault logs of HDM to the OS side, and supports two ways of customizing transfer path and file, as well as transferring to OS system management logs. It also supports customizing the format and level of log storage to meets users' personalized customization needs.
After installation, FIST supports the following functions:
· Host software list.
· Get internal resource usage of the OS.
· Link up and down information of network card ports.
· Drive capacity prediction.
· GPU usage and system load.
The working principle of FIST SMS: FIST SMS enhances the out-of-band monitoring capabilities of HDM and also provides the ability to monitor server hardware failures on the OS side. This allows users to detect faults as soon as they occur, enabling prompt business migration and load balancing, effectively reducing the impact of business failures.
Figure 47 FIST SMS hierarchy
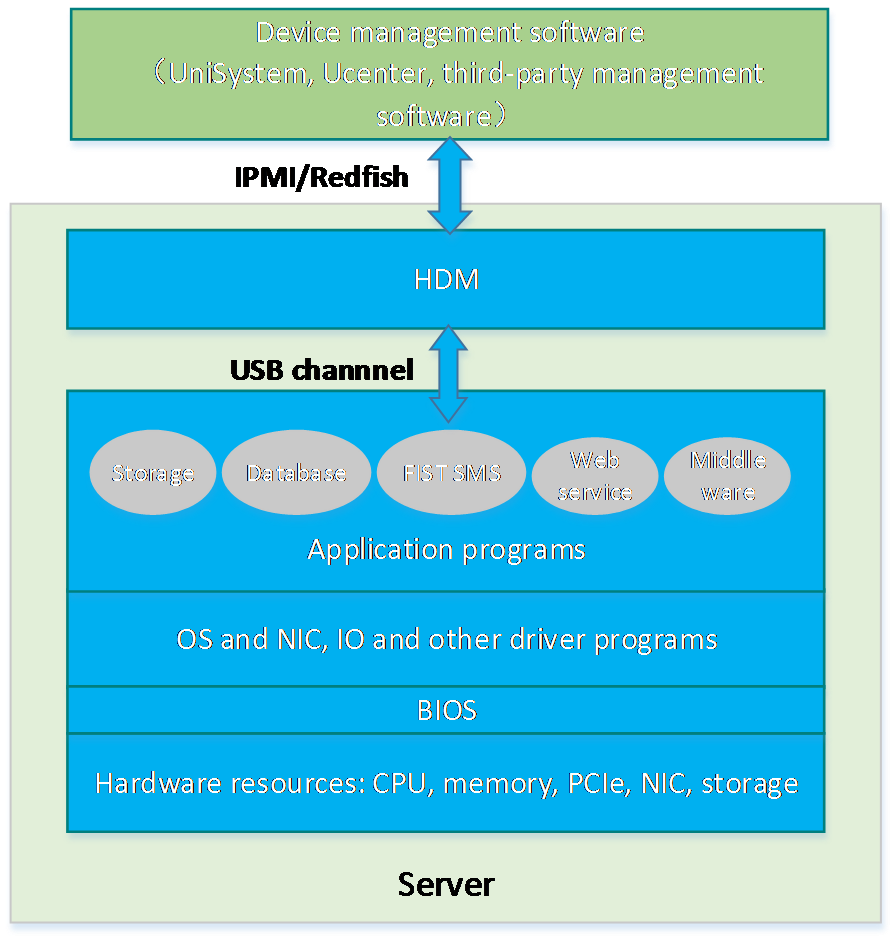
After FIST SMS is installed, HDM can obtain additional information as shown in Table 6.
Table 6 Information list obtained by FIST SMS
|
Information name |
Without FIST SMS installed |
With FIST SMS installed |
|
OS level CPU usage |
/ |
Yes |
|
OS level memory usage |
/ |
Yes |
|
OS level network throughput |
/ |
Yes |
|
Drive usage |
/ |
Yes |
|
GPU usage |
/ |
Yes |
|
System load |
/ |
Yes |
|
NFS client read/write speed |
/ |
Yes |
|
NFS server read/write speed |
/ |
Yes |
|
Peripherals information |
/ |
Yes |
|
Transceiver module information |
/ |
Yes |
|
Drive capacity prediction |
/ |
Yes |
|
Software list |
/ |
Yes |
Capacity prediction
In order to provide customers with more time for planned changes and hard drive upgrades, HDM offers logical drive capacity prediction and warning functions, using the Holt-Winter time-series forecasting algorithm to predict the current system's logical drive capacity 7 to 21 days in advance. Predicting in advance guides users to plan for stocking and manage materials rationally.
Note: To use this feature, install and run FIST SMS in the operating system.
Figure 48 Drive capacity prediction
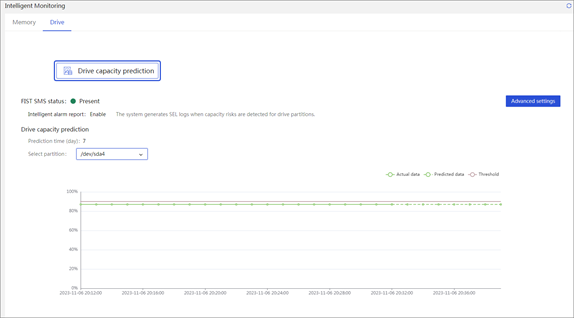
Host security
Different users have different security requirements for HDM access to the host.
· Usually, the default HDM user has all access rights to the host.
· In scenarios such as bare metal, strict auditing and control of out-of-band access through in-band is required.
The host has default access rights to HDM, for example:
· Upgrade HDM within the band.
· Operate the features provided by HDM through the BT or KCS channel inside the device, such as shutting down the server and configuring storage media.
HDM is designed with fully consideration of different application scenarios. It provides corresponding features to meet the application needs, which have been validated at multiple data centers. Main features include the following:
· Operation log recording, convenient for subsequent auditing.
· Provide command access control through the IPMI blacklist and whitelist mechanism.
Maintenance
Operation log
The operation log includes audit log entries, firmware update log entries, hardware update log entries, and configuration log entries.
· Audit log entries record HDM administrative events for security auditing.
· Firmware update log entries record HDM firmware updates as well as their results.
· Hardware update log entries record hardware updates as well as their results.
· Configuration log entries record user configuration operations as well as their results.
A log entry contains timestamp, host name, and other details, as shown in Figure 49. The severity levels of the events include success and failure.
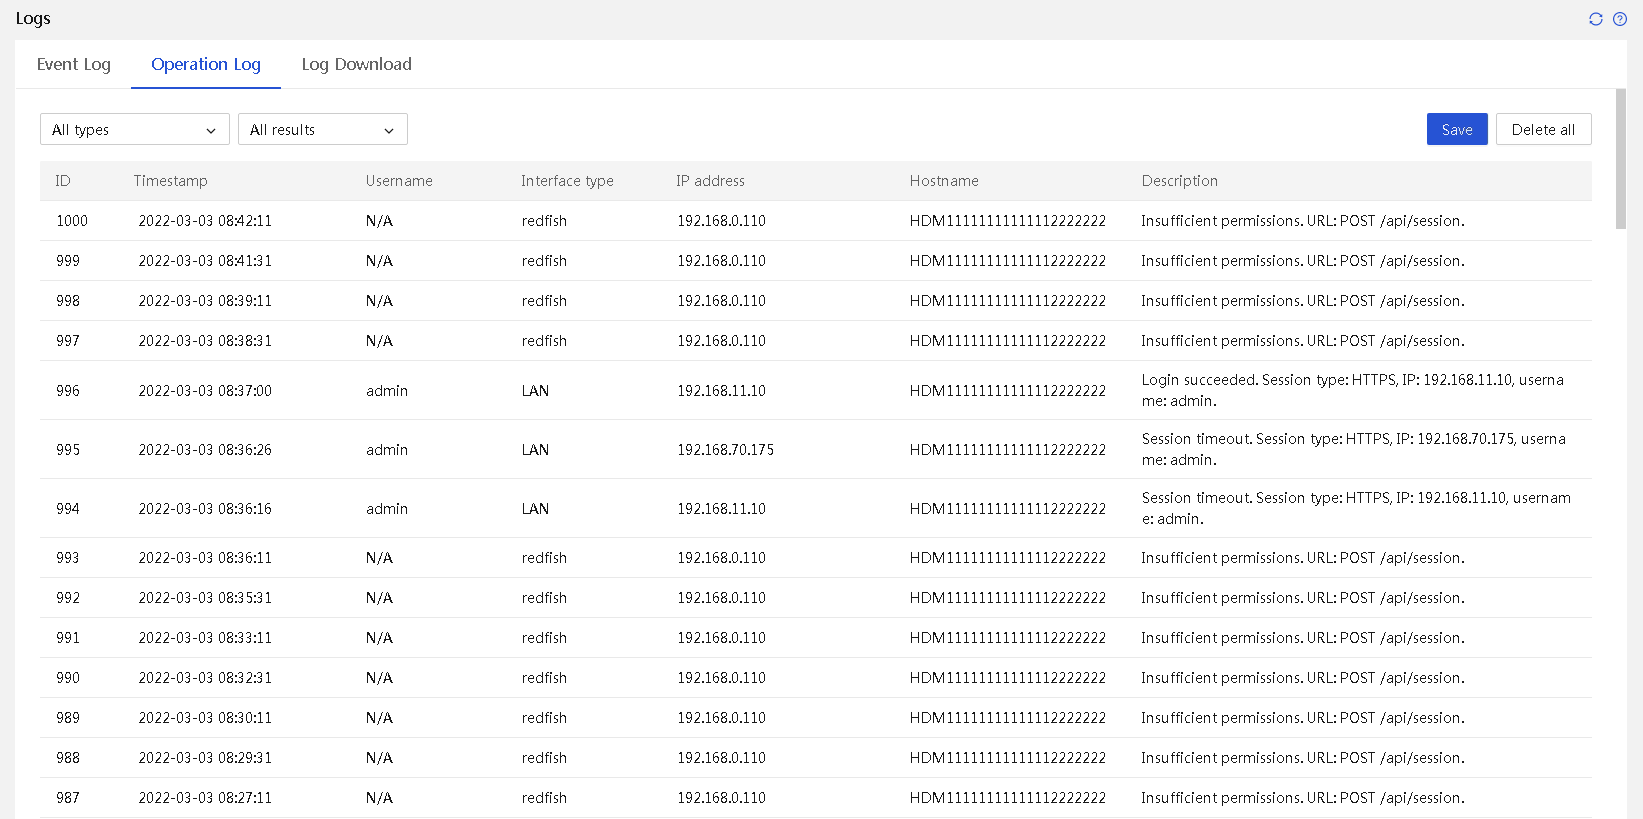
Event log
The event log records events reported by server sensors. The severity levels of events include the following:
· Info—The event does not adversely affect the system. No action is required. Examples of informational events include expected state change events and alarm removed events.
· Minor—The event has minor impacts on the system. Prompt action is required to avoid an escalation in severity.
· Major—The event might cause part of the system to fail and result in service interruption. Immediate action is required.
· Critical—The event might result in system outage or power failure. Immediate action is required.
You can filter events by sensor name, severity level, and log generation time.
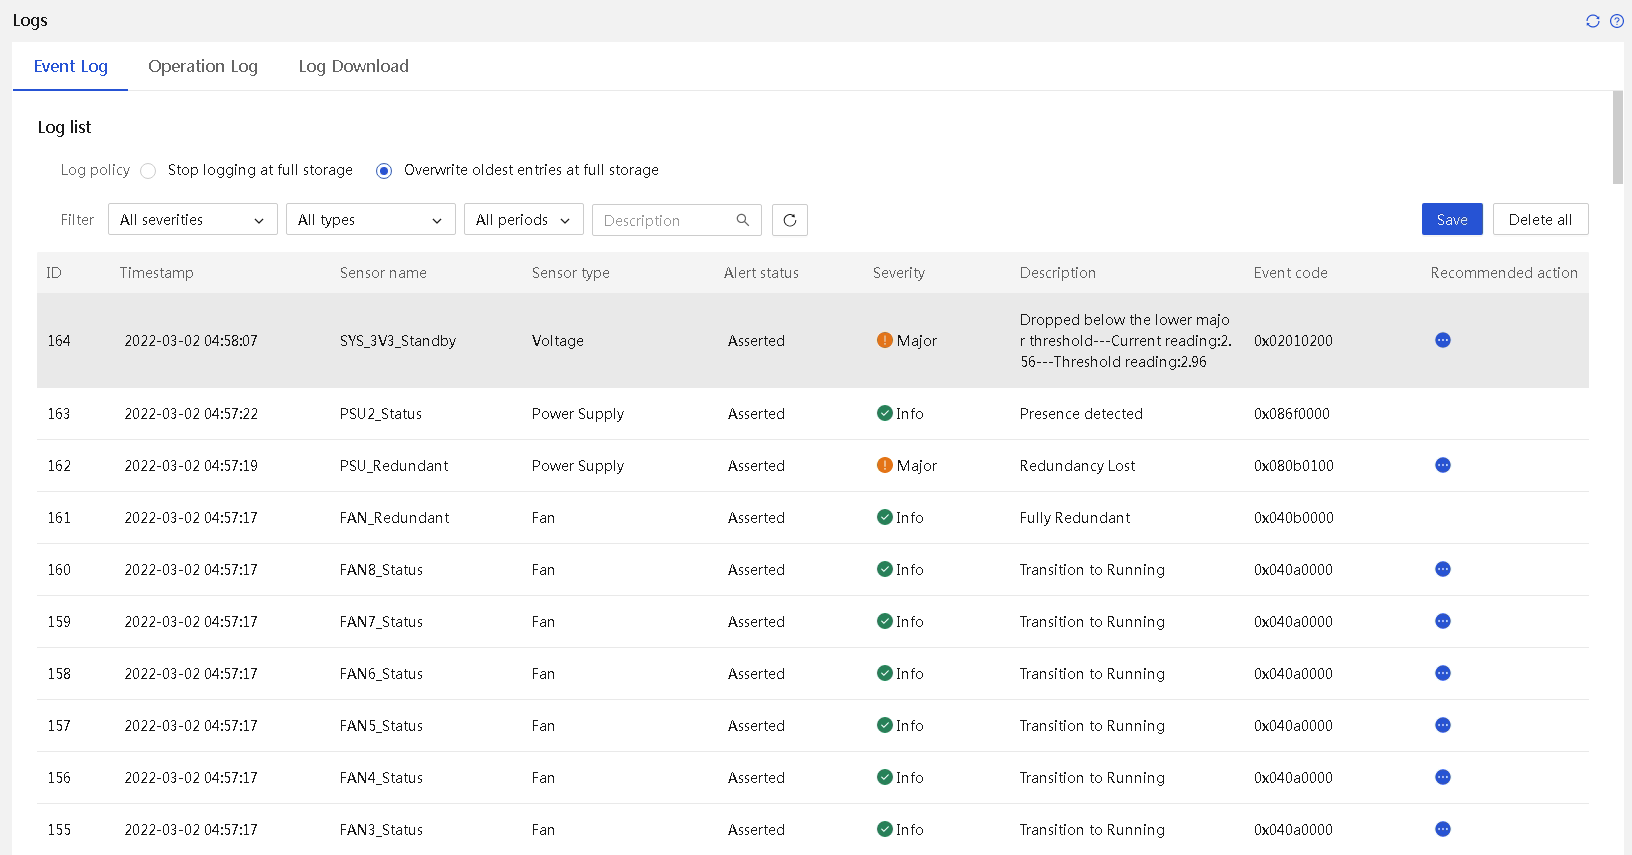
Event code
An event code identifies a unique event log entry in HDM. Users can locate the fault type on the device through an event code for the convenience to query related log manuals for more details.
Recommended action
The HDM Web interface provides the actions recommended for a system event. This facilitates fault location and repair because users can immediately obtain troubleshooting suggestions for related faults.
Figure 51 Viewing recommended actions
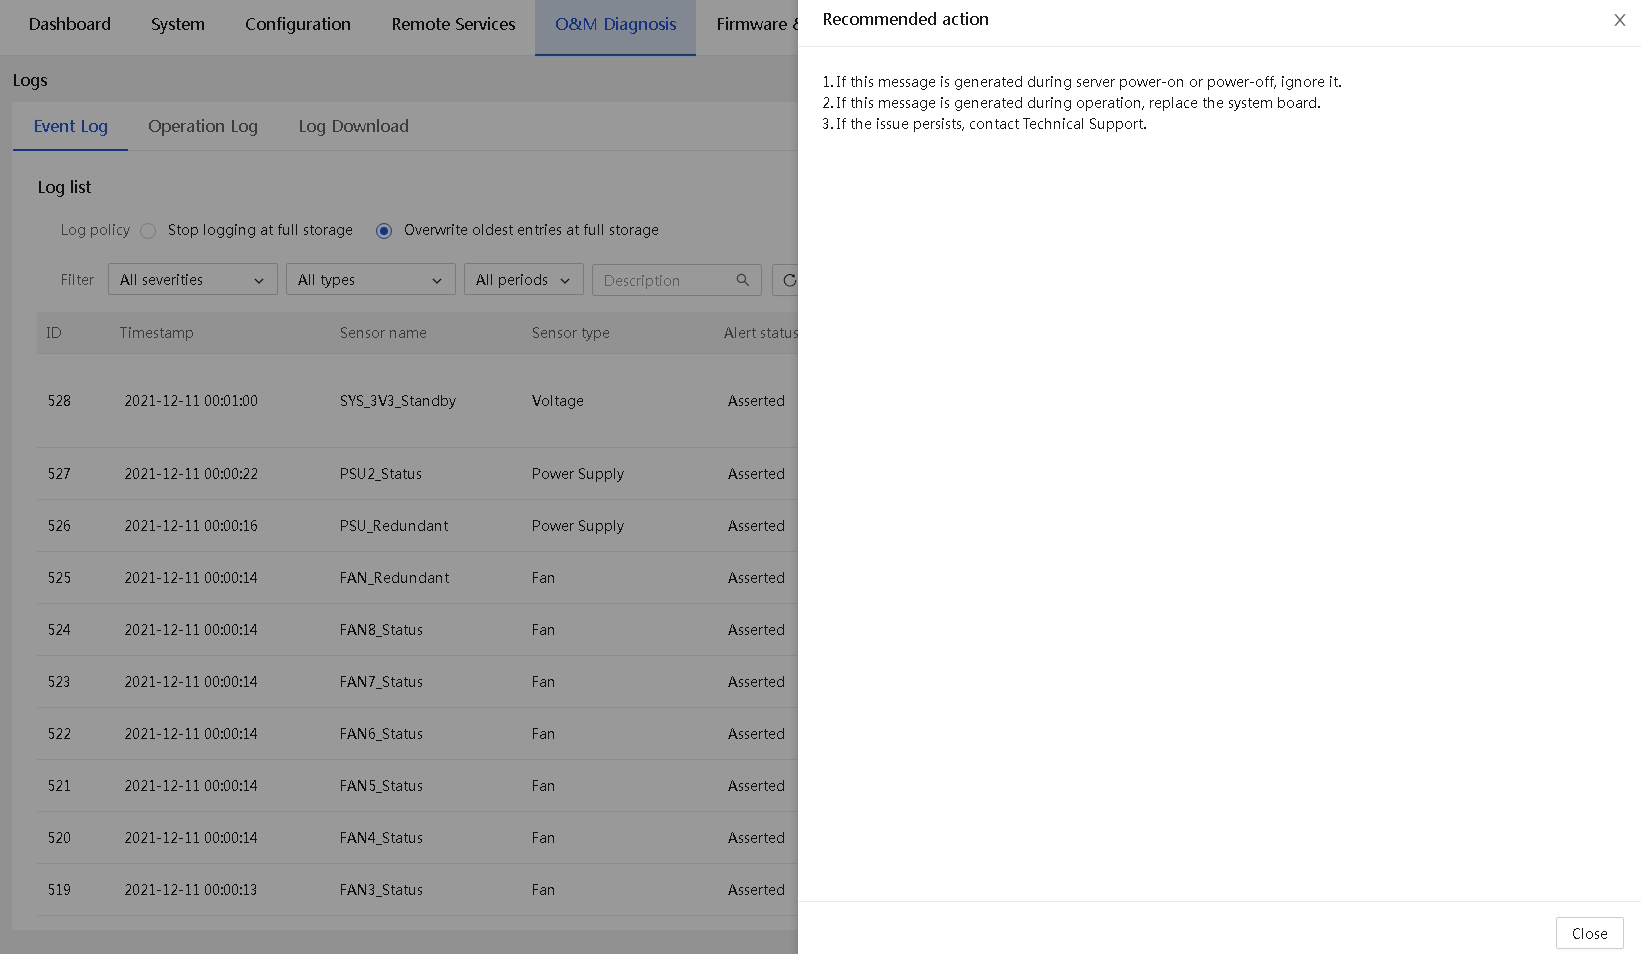
Serial port connection
HDM supports selecting the serial port to connect to when the SOL feature is enabled. SOL connection allows the system to redirect access from the local serial port on the server panel to remote access of the specified serial port, and receive the input of the remote network devices. The administrators can view the system serial port output on the local device in real time, and change the SOL connection mode locally.
SOL connection configuration from HDM
You can set an SOL connection mode on the HDM Web interface, including connection to the BIOS or OS.
Recording of serial port information
HDM supports real-time recording of system serial port output and saves the data to the internal storage media. If an error occurs, you can download the data to the local device for analysis.
Black box (log download)
This feature enables users to download records about event log entries, hardware information, and SDS diagnostic information throughout the lifecycle of the server. You can view the downloaded log to obtain server operation status. To decode SDS logs completely, contact Technical Support. As a best practice, add contact information at log downloading.
Figure 52 SDS log download
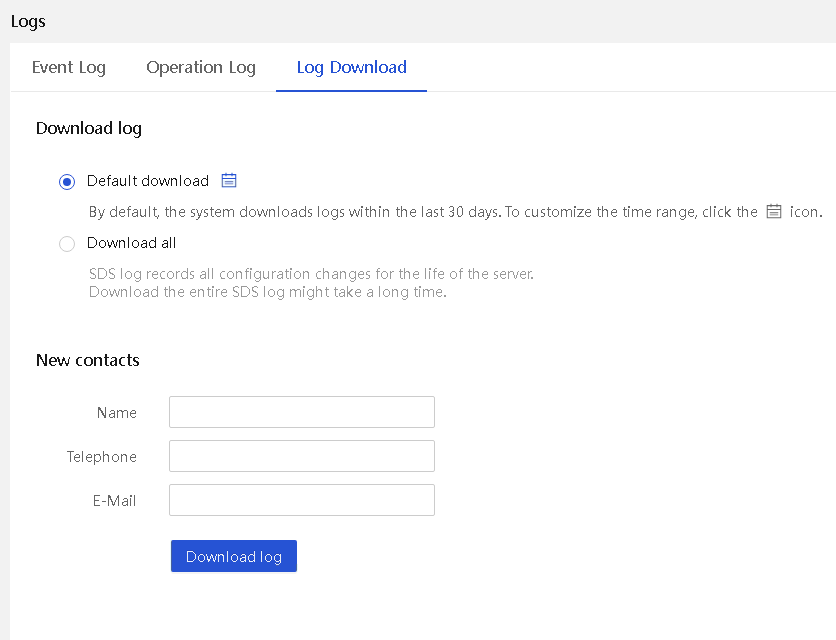
The commonly collected log contents and their corresponding paths are shown in Table 7.
|
Log content |
File path |
|
Firmware version information |
static\firmware_version.json |
|
BMC system configuration information |
dump\bmcsys_info |
|
Server hardware information |
static\hardwareinfo.xml |
|
BMC reboot reason record, including serial port reboot, HDM restart, HDM partition switchover, IPMI command restart, AC lost or UID long-press restart, and WDT timeout restart |
sdmmc0p4\log\sysmanage\bmc_reboot.log |
|
Detailed records of HDM and system restarts |
sdmmc0p4\log\emerg.log |
|
Records of BMC system process restarts |
sdmmc0p4\log\proj\debug_system_manage.log |
|
BIOS restart process records: Record the POST codes generated during the BIOS restart process, and parse the POST codes before the BOOTOS stage |
dump\bios_info\biosprocess.log |
|
CSV format file records in the event directory: A CSV file is a plaintext format for recording event logs. You can view the corresponding files in the event directory. It mainly stores all the log information collected in SEL logs, audit logs, update logs, and SDL logs from SDS in CSV files. Users can directly view the CSV file when checking the logs. Host restart logs in the osboot directory: Record host configuration logical status, serial port logs, hardware configuration, and POST code information during the OS restart. Hardware intelligent diagnostic logs in the shd directory: Record detailed information of intelligent diagnostic logs for components such as MCA and power fault diagnostic log information. |
daily\sds_ByDate\00001(serial number)_20240106(YYYYMMDD)\event |
|
daily\sds_ByDate\00001(serial number)_20240106(YYYYMMDD)\osboot |
|
|
daily\sds_ByDate\00001(serial number)_20240106(YYYYMMDD)\shd |
|
|
CPLD register information |
sdmmc0p4\log\cplddump.log |
|
For information about user-related operations, see the operation logs |
sdmmc0p4\log\operate.log |
|
Sensor information, including the input and output voltage and current |
static\sensor_info.ini |
|
FRU configuration information |
static\FruInfo.ini |
|
System board configuration information |
static\board_cfg.ini |
|
Network configuration information |
static\net_cfg.ini |
|
NVMe information |
static\NVMe_info.txt |
|
Power supply configuration information |
static\psu_cfg.ini |
|
BMC configuration information, including network, SMTP, and SNMP |
static\bmc.json |
|
BIOS configuration information |
static\bios.json |
|
coredump information records |
sdmmc0p4\crash |
|
Internal operation status of BMC |
dump\bmcsys_info |
|
BIOS/OS-related information |
dump\bios_info |
|
dump\os_info |
|
|
Hardware-related information |
dump\hw_info |
Intelligent security bezel
The intelligent security bezel is available only for G6 servers.
As shown in Figure 53, the decorative LEDs on the intelligent security bezel can operate in three colors, white, amber, and red to indicate the server health status or power load. Users can obtain status or fault information directly from the decorative LEDs to facilitate on-site inspection or fault location. For more information, see Table 8.
Figure 53 Intelligent security bezel
Table 8 Intelligent security bezel status
|
Description |
Decorative LED status |
|
|
Standby |
Standby |
Steady white (the middle three groups of LED beads). |
|
Startup |
Post phase |
The white LEDs gradually light up from the middle towards both sides, reflecting the post progress. |
|
Post finished |
The white LEDs light up in turn from the middle to both sides three times. |
|
|
Operation |
Normal (with load level indicated) |
The white LEDs blink in breathing mode at 0.2 Hz. The number of lit up LED beads indicates the load level. As the overall power load (PSU) increases, more LED beads light up from the middle towards both sides. The load levels are as follows: · Empty load (below 10%) · Light load (10% to 50%) · Medium load (50% to 80%) · Heavy load (above 80%) |
|
Pre-alerting |
Slow flashing white at 1 Hz. |
|
|
Major fault |
Flashing amber at 1 Hz. |
|
|
Critical fault (including power supply fault) |
Flashing red at 1 Hz. |
|
|
Remote management |
Remote management is in progress, or HDM is performed out-of-band firmware upgrade. Do not power off the system. |
Flashing white (all LEDs) at 1 Hz. |
|
HDM is rebooting |
Flashing white (some LEDs) at 1 Hz. |
|
BSoD screenshots
This feature automatically takes a bluescreen of death (BSoD) screenshot upon a system crash of Windows and saves the screenshot in the storage space for future troubleshooting. You can view BSoD screenshots from HDM. HDM supports taking screenshots upon MCA failure.
HDM can save a maximum of 10 BSoD screenshots in the specified format. Before enabling this feature, make sure the KVM service has been enabled for your user account.
Figure 54 BSoD screenshot
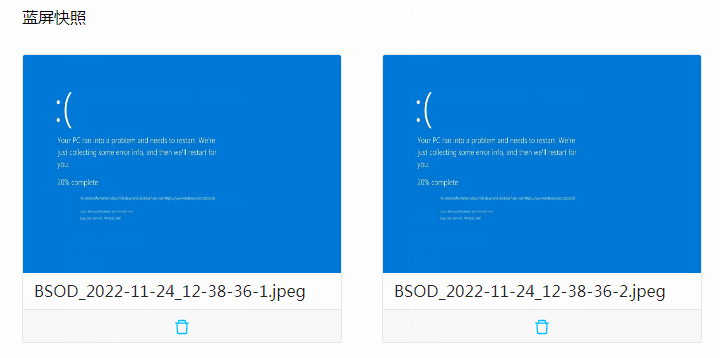
Video replay
With this feature enabled, when a severe OS exception occurs, such as crash, restart, and shutdown, the system records server operations performed before the exception. You can replay these videos to analyze or troubleshoot the recorded events.
On the video replay page of HDM, you can play, download, and delete the recorded videos, as shown in Figure 55.
The system supports a maximum of three video files. Before enabling this feature, make sure the KVM service has been enabled for your user account.
Figure 55 Configuring video replay settings
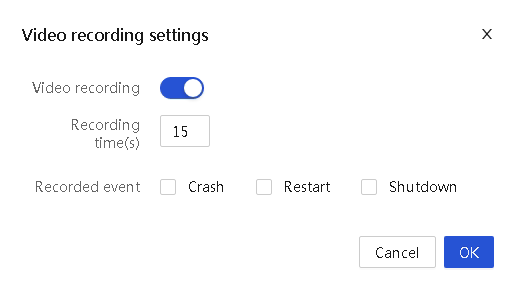
Alert policies
NMI debug
Non Maskable Interrupt (NMI) debug enables HDM to send an NMI to the OS to collect kernel stack information and send the information to the console for locating system exceptions.
MCA policy
Machine Check Architecture (MCA) allow you to configure whether to restart the server automatically when an IERR occurs. IERRs include processor errors, memory errors, and PCIe errors.
Figure 56 Setting the MCA policy
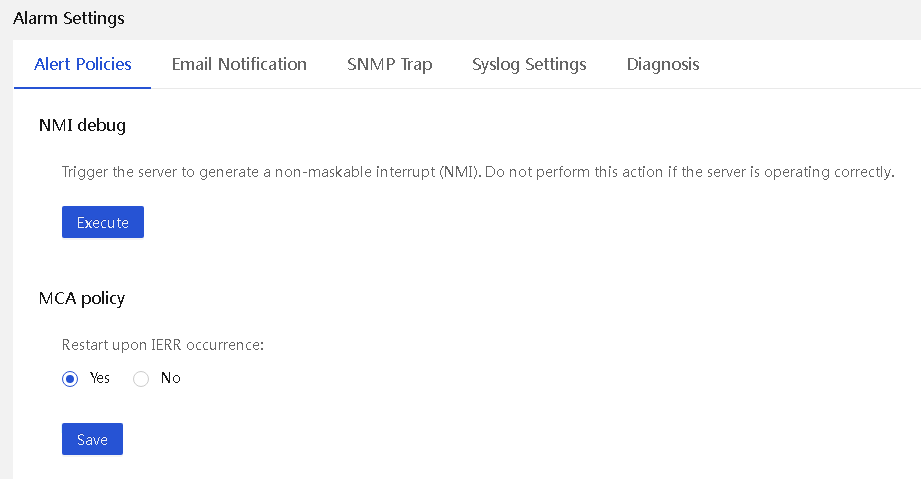
ASD
Users can remotely perform JTAG debugging on Intel processors without purchasing an Intel-specific debugger or connecting the debugger to the target server. JTAG debugging can collect register information about the server components, including processors, memory, PCIe modules, and USB devices, to help locate hardware issues. ASD is also called remote XDP.
Figure 57 ASD diagram
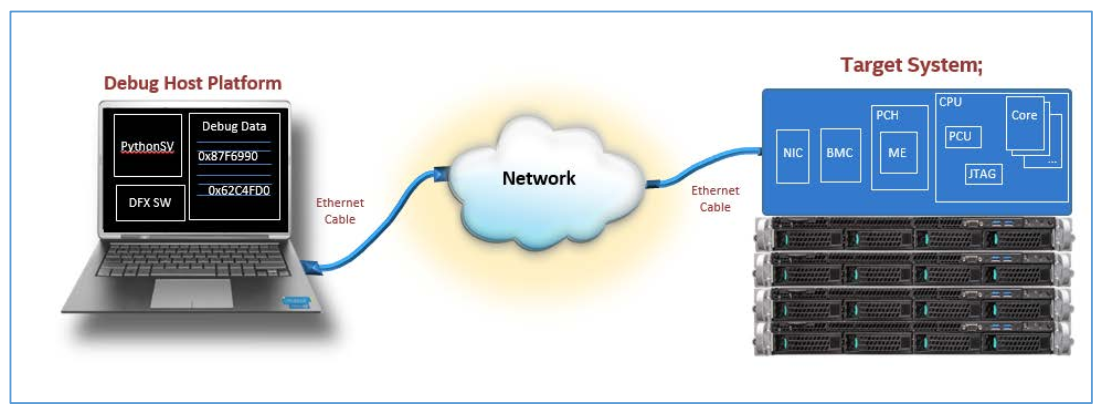
To set up the debugging environment, perform the following tasks:
1. Enable the ASD service from HDM.
2. Install PVT on the local PC.
3. Install Python and download Cscripts provided by Intel.
4. Open CMD and execute commands in the cscripts directory.
ACD
HDM integrates the Intel Autonomous Crash-Dump (ACD) feature for servers with Intel processors. As shown in Figure 58, when an MCA error occurs, ACD collects MCA and processor-related register information, including information about processor, memory, and PCIe faults in an out-of-band manner. Then, ACD saves the information in JSON format for CScripts analysis. This enhances the ability to locate MCA errors for the Intel platform.
HDM supports enabling ACD through the IPMI interface.

iHDT
The iHDT service performs JTAG debugging remotely for AMD processors in an out-of-band manner through Hardware Debug Tool (HDT) provided by AMD, and collects processor, memory, and PCIe information, as shown in Figure 59.
The iHDT service is available for AMD servers. Before using the iHDT service, enable it from HDM.
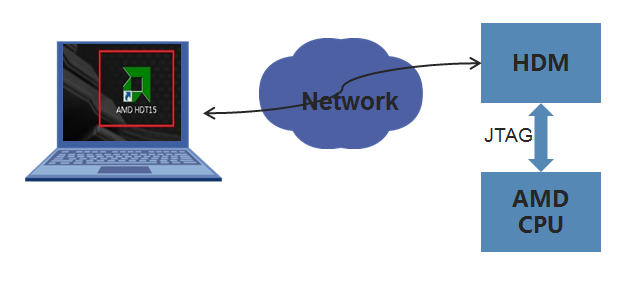
Alarm settings
Remote syslog
HDM allows a remote syslog server to obtain operation log, event log, host console log, and sensor information. You can configure the remote syslog server's port number, transmission protocol, log type, and host identifier parameters, as shown in Figure 60.
The transmission protocol can be UDP, TCP, and TLS encrypted transmission. The TLS encrypted transmission supports both one-way and two-way authentication.
The supported log types include operation log, event log, security log, console log, and sensor log.
Figure 60 Remote syslog configuration
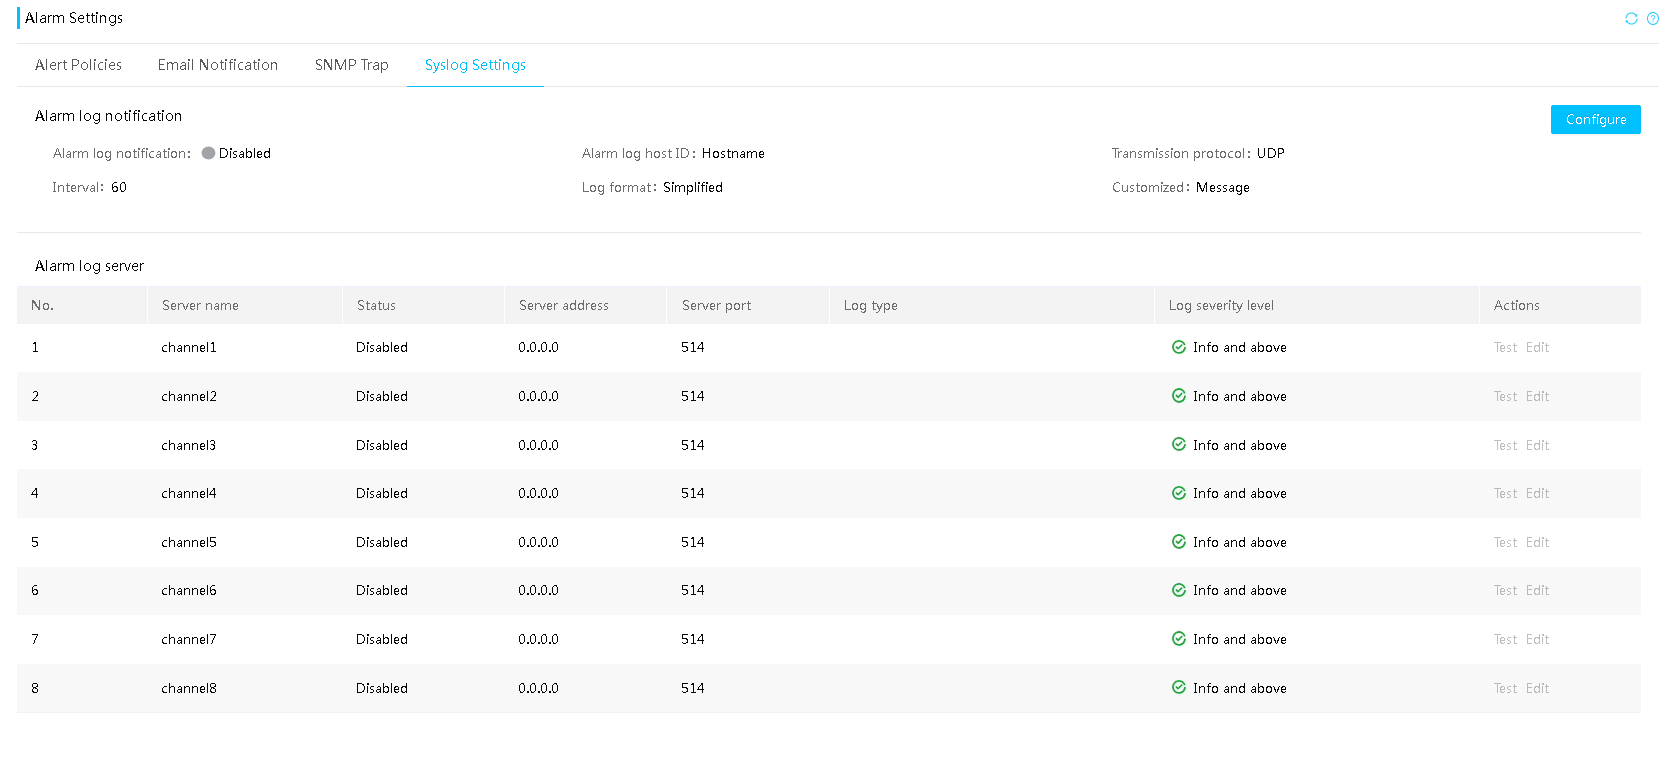
Alert emails
HDM supports sending alert emails to report generated event logs from the server to specified users, helping them monitor the server's operation status. The SMTP server address can be an IPv4 address, IPv6 address, or domain name. HDM supports sending alert emails to anonymous and authenticated users, and you can configure a maximum of 15 recipient users.
HDM can report alert events based on the severity level. Severity levels are Info and above, Minor and above, Major and above, and Critical and above.
Figure 61 Alert email configuration
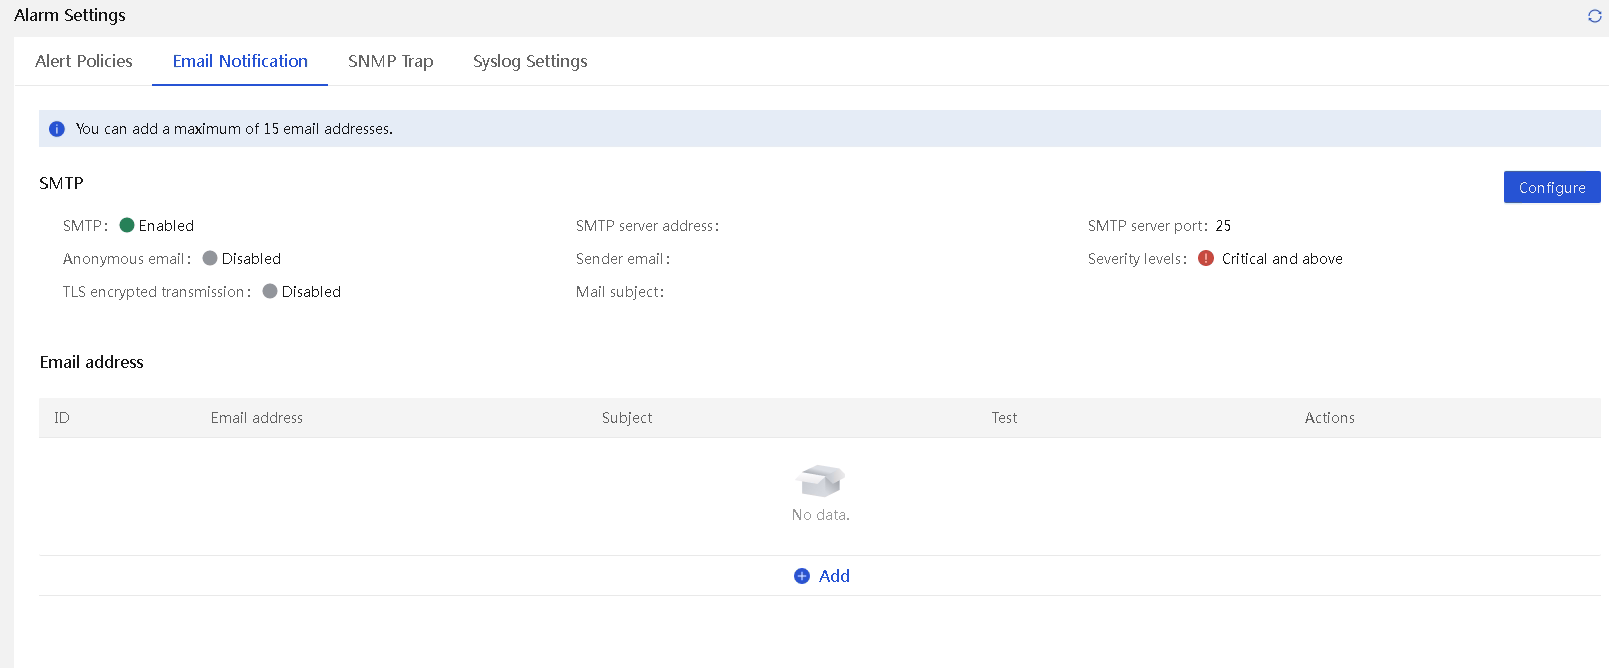
SNMP traps
HDM allows sending the generated event logs from the server to specified users via SNMP traps, helping them monitor the server's operation status.
HDM can send SNMP traps to a server based on the severity level. Severity levels are Info and above, Minor and above, Major and above, and Critical and above. You can configure SNMP traps in node mode, event mode, or event code OID mode.
· Node mode—Alarms for a module (classified by sensor type) corresponds to the same OID. Users can determine which module has a problem through the OID.
· Event mode—Based on node mode, each event alarm for each module has its own OID. Users can determine the type of module failure based on the alarm OID.
· Event code OID mode—The event code is used as the ID of the event.
Figure 62 SNMP trap configuration
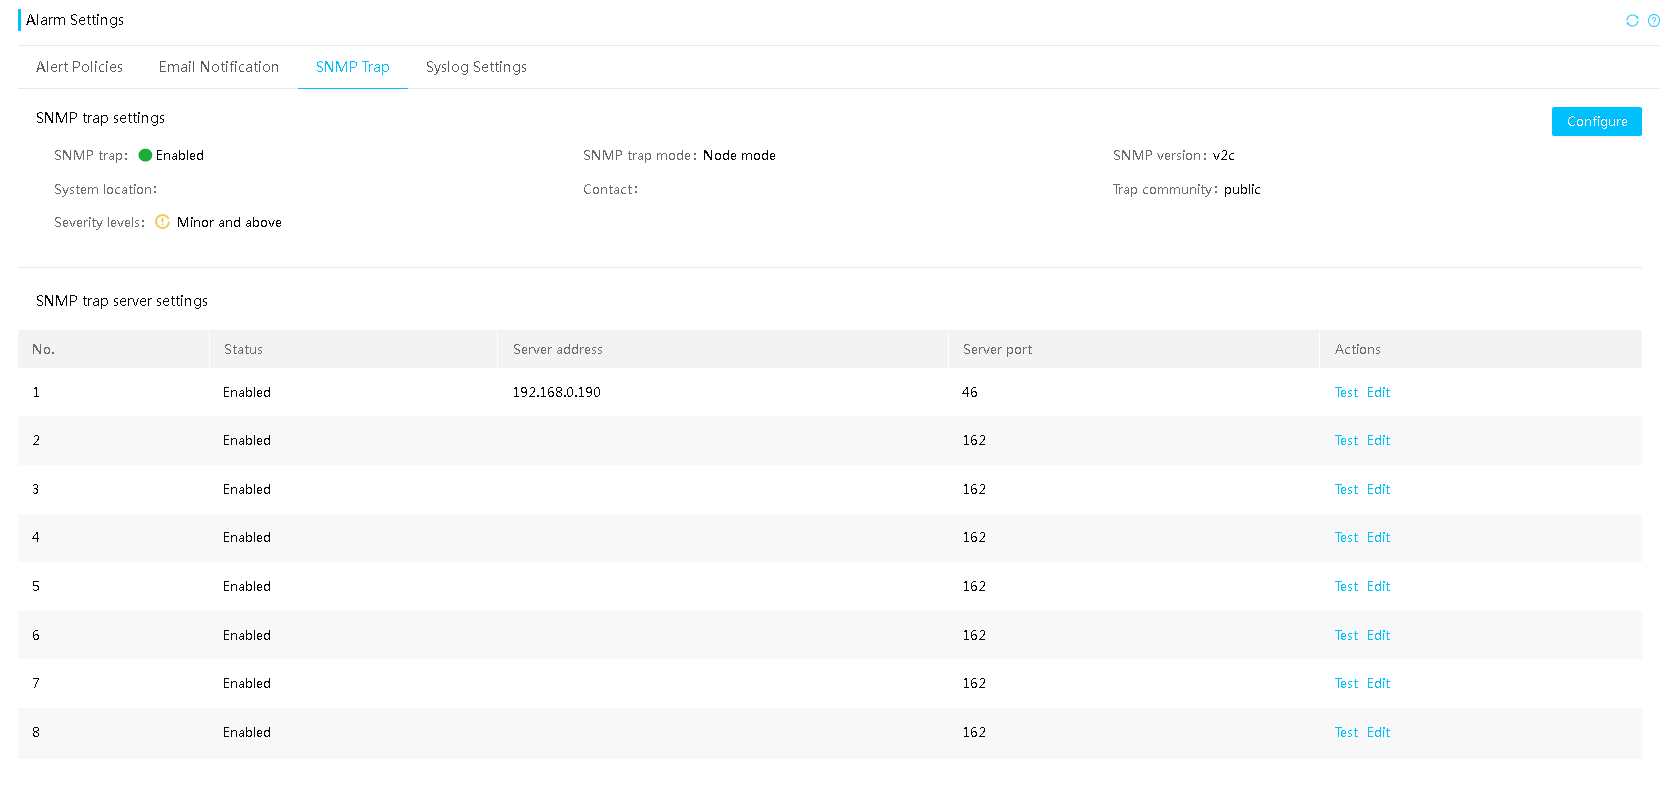
Power black box
Power black box data collected by HDM when power faults occur, includes data from the last five faults for each power supply. The fault information is saved in the non-volatile memory of the power supply and can be accessed for an extended period, ensuring that the data will not get lost.
Black box data includes fault time and fault causes. The data is included in the device fault diagnosis log SDS. You can obtain power black information by collecting the device fault diagnosis log SDS.
HDM system maintainability
HDM watchdog
HDM monitors the running status of all processes in its own system by using the watchdog feature. Each process sends a heartbeat packet to the monitoring module at regular intervals. If no heartbeat packet is detected consecutively, the system will trigger the fault recovery mechanism.
After HDM startup, the system monitors heartbeat packets every minute for the first ten minutes. If no heartbeat packets are detected twice consecutively, HDM switches to the secondary image. After ten minutes of HDM startup, the system monitors heartbeat packets every two minutes. If no heartbeat packet is detected, the process is considered abnormal, triggering an automatic HDM restart for recovery.
HDM restart reason recording
After each startup, HDM records its own reboot reasons in the device fault diagnosis log (SDS). Possible HDM restart reasons include HDM version upgrade, AC power outage, HDM factory default restoration, kernel abnormal restart, long press UID, and watchdog timeout restart.
HDM eMMC card monitoring
HDM periodically monitors the lifespan status of the emcee card, collects eMMC card information, and analyzes its lifespan. Every time the predicted lifespan changes, an SDL monitoring log will be generated, describing the changes in predicted lifespan. HDM also generates an SDL monitoring log when it detects the reserved block consumption surpasses 80% or 90%. When HDM predicts that the card lifespan is about to be depleted (remaining 10%) or has been depleted, an SDL monitoring log will also be generated.
HDM memory monitoring
The HDM SOC chip supports ECC and UECC technologies. When the number of memory ECC errors or UCE errors reaches a certain threshold in HDM, SDL logs are generated and HDM is restarted.
Local O&M
USB Wi-Fi
A chassis ear on G6 servers is integrated with a USB Type-C connector that can be connected to a third-party USB Wi-Fi module to provide hotspots for HDM. Users can log in to HDM by using mobile phones or portable devices, and perform operations and inspections with the HDM Mobile app or other tools.
Currently, only Xiaomi Portable Wi-Fi and 360 Portable Wi-Fi are supported. Use Type-C to USB convertor to connect the portable Wi-Fi devices.
To enhance security, only two clients are allowed to connect simultaneously.
The Wi-Fi password is not encrypted by default to enable plug-and-play.
As shown in Figure 63, you can configure the Wi-Fi state, WLAN name, encryption method, password, scheduled shutdown time, WLAN management interface IP address, and DHCP server address pool from HDM.
HDM supports Web, Redfish, IPMI, SSH, and Telnet on WLAN interfaces.
Figure 63 WLAN management configuration
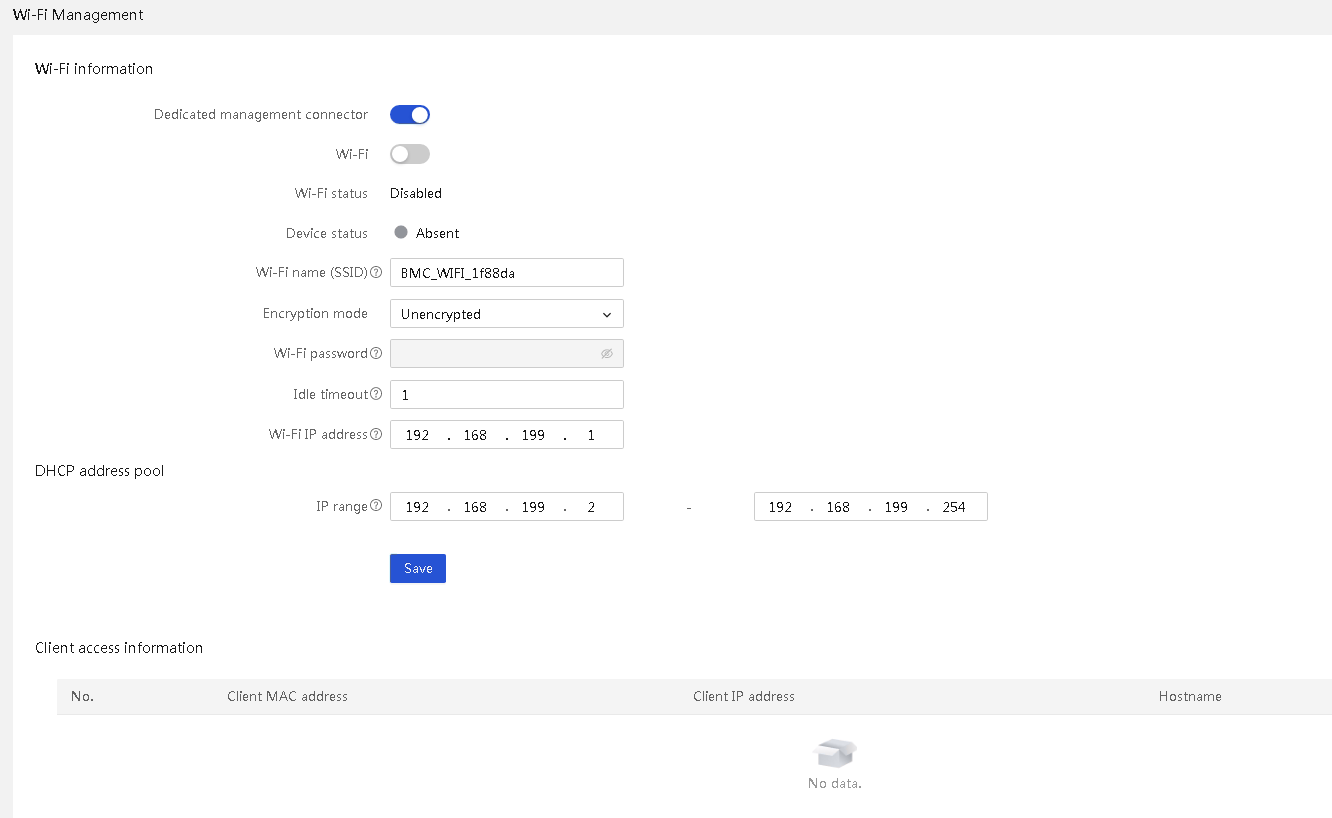
Service USB device
A chassis ear on G6 servers is integrated with a USB Type-C connector that is connected directly to HDM. As shown in Figure 64, a USB device connected to the Type-C connector can operate as a service USB device. After HDM identifies the USB device connected to the Type-C connector and determines whether to use the USB device for log download.
A service USB device is a USB device burned with the image file of the USB diagnostic tool. You can use Unitool to make a service USB device.
Figure 64 USB Type-C connector on G6 servers

Component management
FRU and asset information management
Asset information management collects the serial number of a component. HDM supports the collection of component serial numbers on servers and provides IPMI, Redfish, and SNMP Agent interfaces to integrate with customers' asset management systems or O&M systems. HDM enables users to conduct asset inventory quickly and efficiently, and improves the value of asset data.
Network adapter management
HDM provides out-of-band management for network adapters supporting NCSI over MCTP (over PCIe or I2C) and OCP network adapters. It provides access to port information of the network adapters, including MAC address, PCIe address, resource ownership, maximum and negotiated rates, link status, interface type, and LLDP status. HDM also supports out-of-band firmware upgrades for some network adapters to meet the requirements of different operational scenarios.
Figure 65 Network adapter information
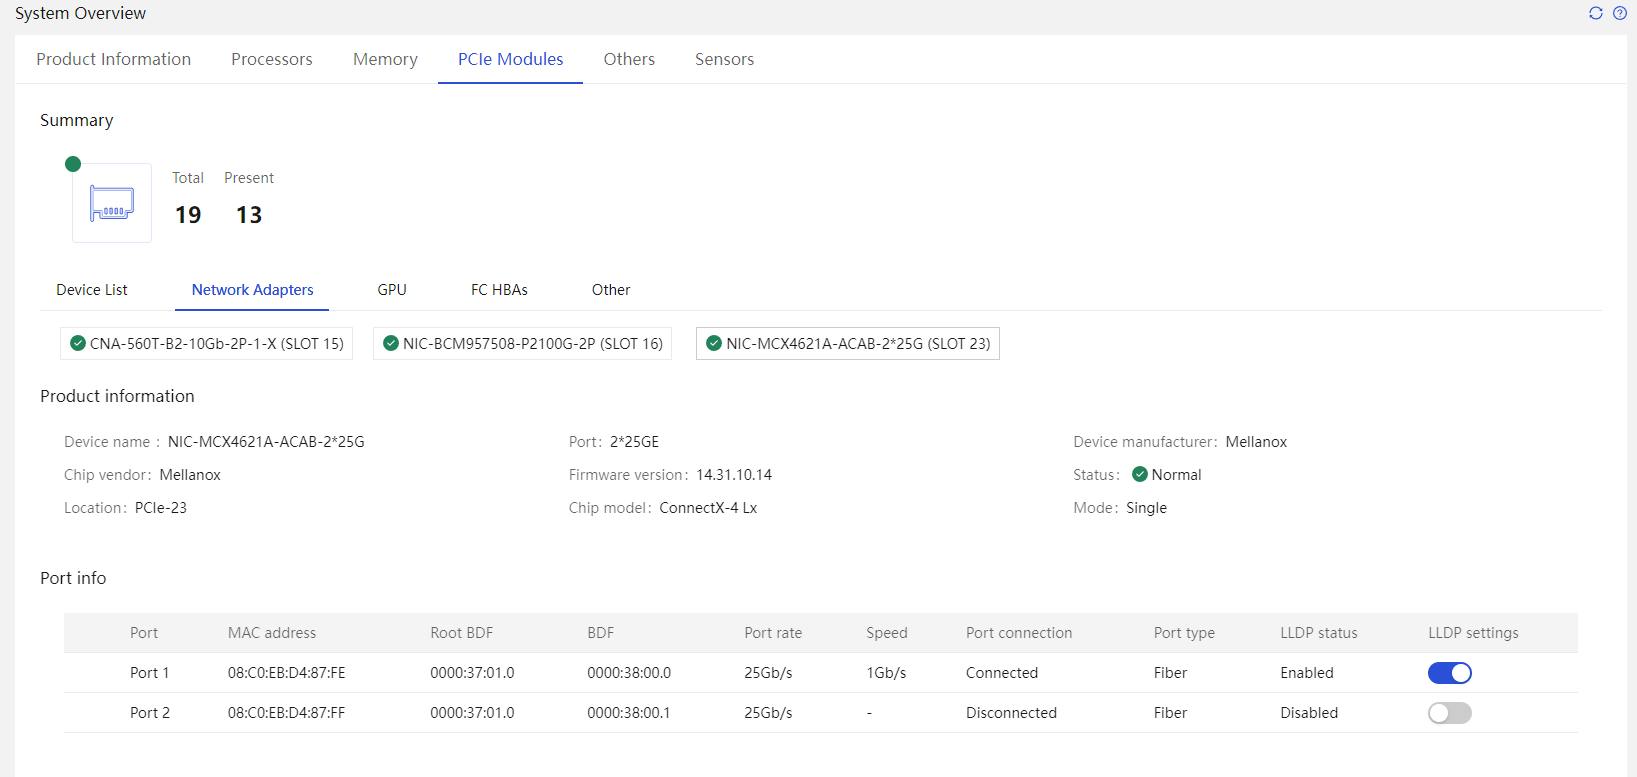
FC HBA management
HDM enables out-of-band management for some FC HBAs via MCTP over PCIe. It supports real-time retrieval of WWNN, WWPN, temperature, health status, link status, and speed of FC HBAs. It also supports out-of-band firmware upgrades for certain FC HBA models.
Figure 66 FC HBA information
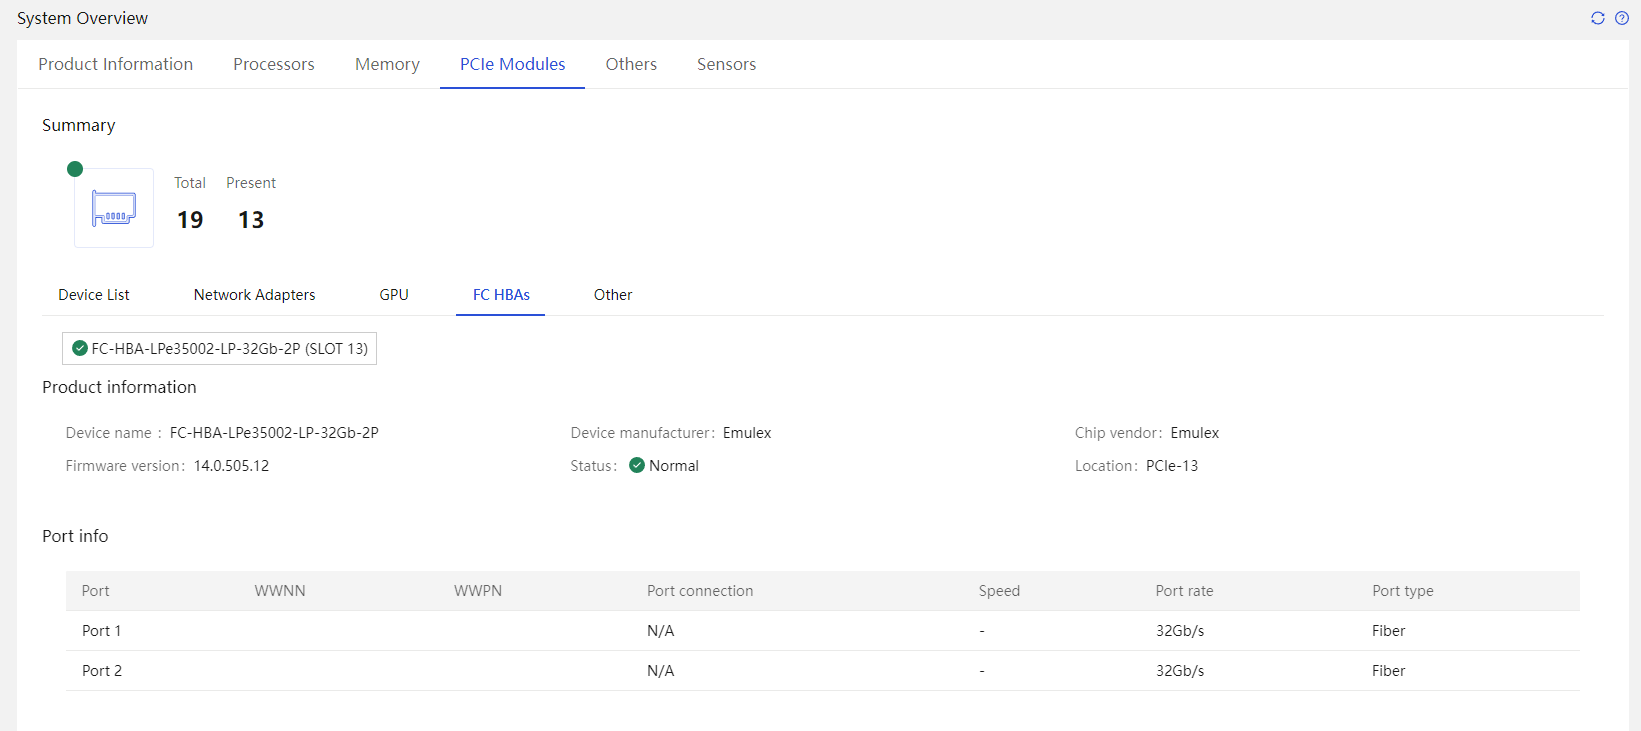
GPU management
HDM's out-of-band management for GPUs can obtain information such as product name, manufacturer name, vendor ID, firmware version, number of internal GPUs, temperature values for each internal GPU, and power consumption.
A driver is required for the NVIDIA GPU.
Figure 67 GPU information
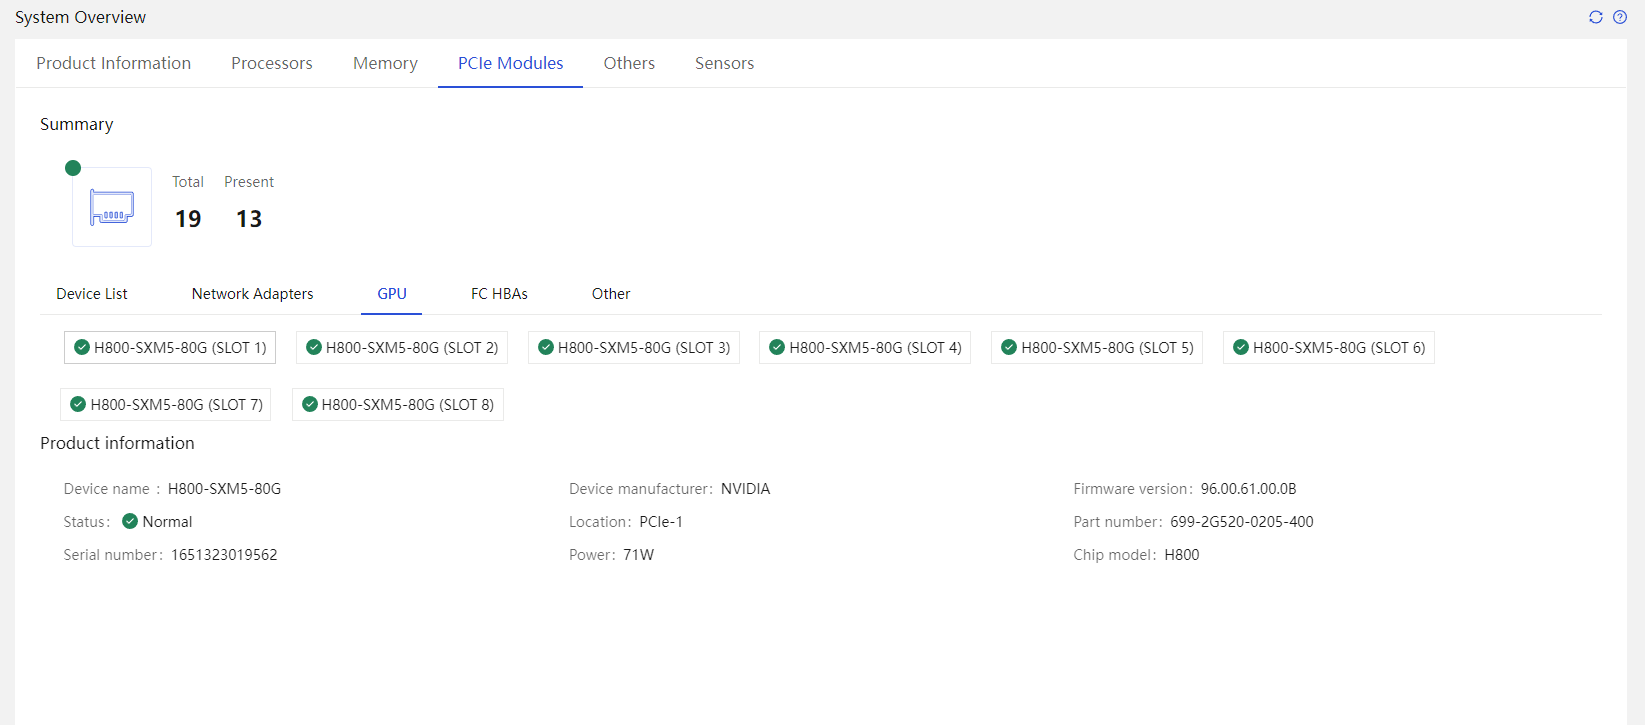
Intel On Demand
Intel provides On Demand, an IT solution allowing custom license import without processor replacement. This aims to save material costs while meeting the requirements on dynamic enterprise resource allocation.
HDM supports obtaining the current Intel CPU On Demand capability set and the currently activated capability set. It also supports activating Intel CPU-supported features by uploading the licenses obtained from Intel and downloading CPU status reports in an out-of-band manner.
Figure 68 Intel On Demand management interface
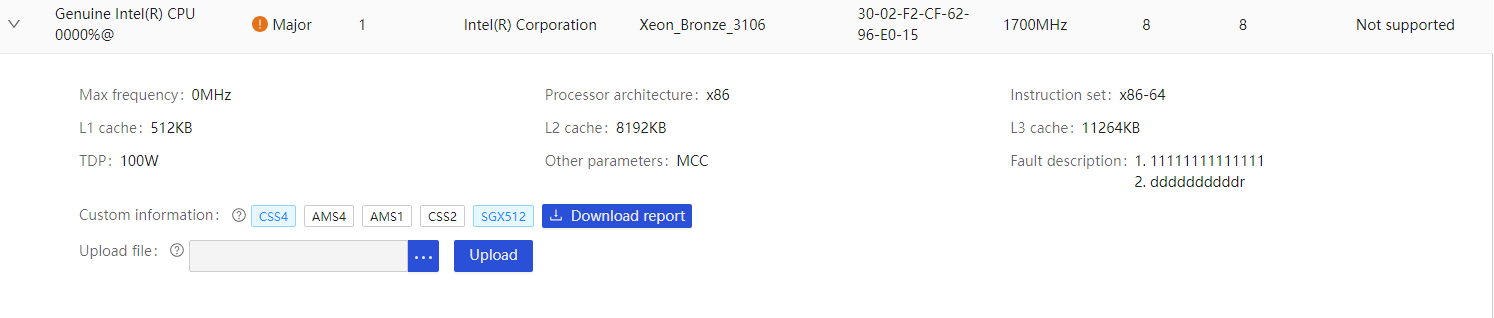
Storage management
The storage management module of HDM enables out-of-band management for storage controllers and drives. Its main features include:
· Storage controller management.
· Logical drive management.
· Physical drives management.
· Storage maintainability
Storage controller management
HDM supports obtaining information about storage controllers, including the number of storage controllers, device name, manufacturer, firmware version, interface type, interface speed, manufacturer serial number, cache capacity, mode, supported raid levels, super capacitor status, and flash card status, as shown in Figure 69.
Figure 69 Storage controller management
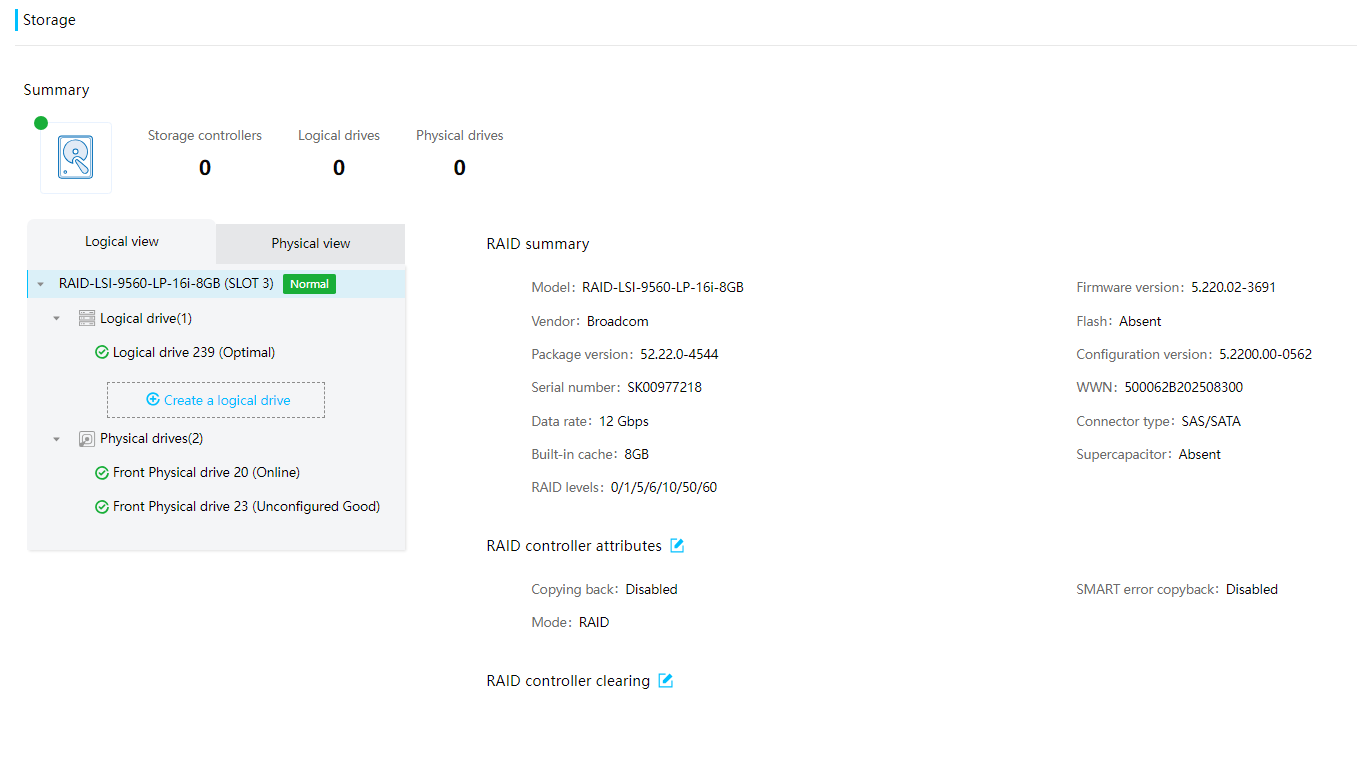
HDM supports out-of-band firmware upgrades for LSI and PMC storage controllers that are in MCTP Over PCIe out-of-band management mode.
HDM supports configuring properties of storage controllers, including the following:
· Copyback configuration.
· SMART error copyback configuration.
· Mode switching.
· JBOD status switch.
HDM provides cleanup operations on storage controllers, including one-click cleanup of foreign status for all logical and physical drives managed by a controller. Figure 70 shows RAID controller information.
Figure 70 RAID controller information
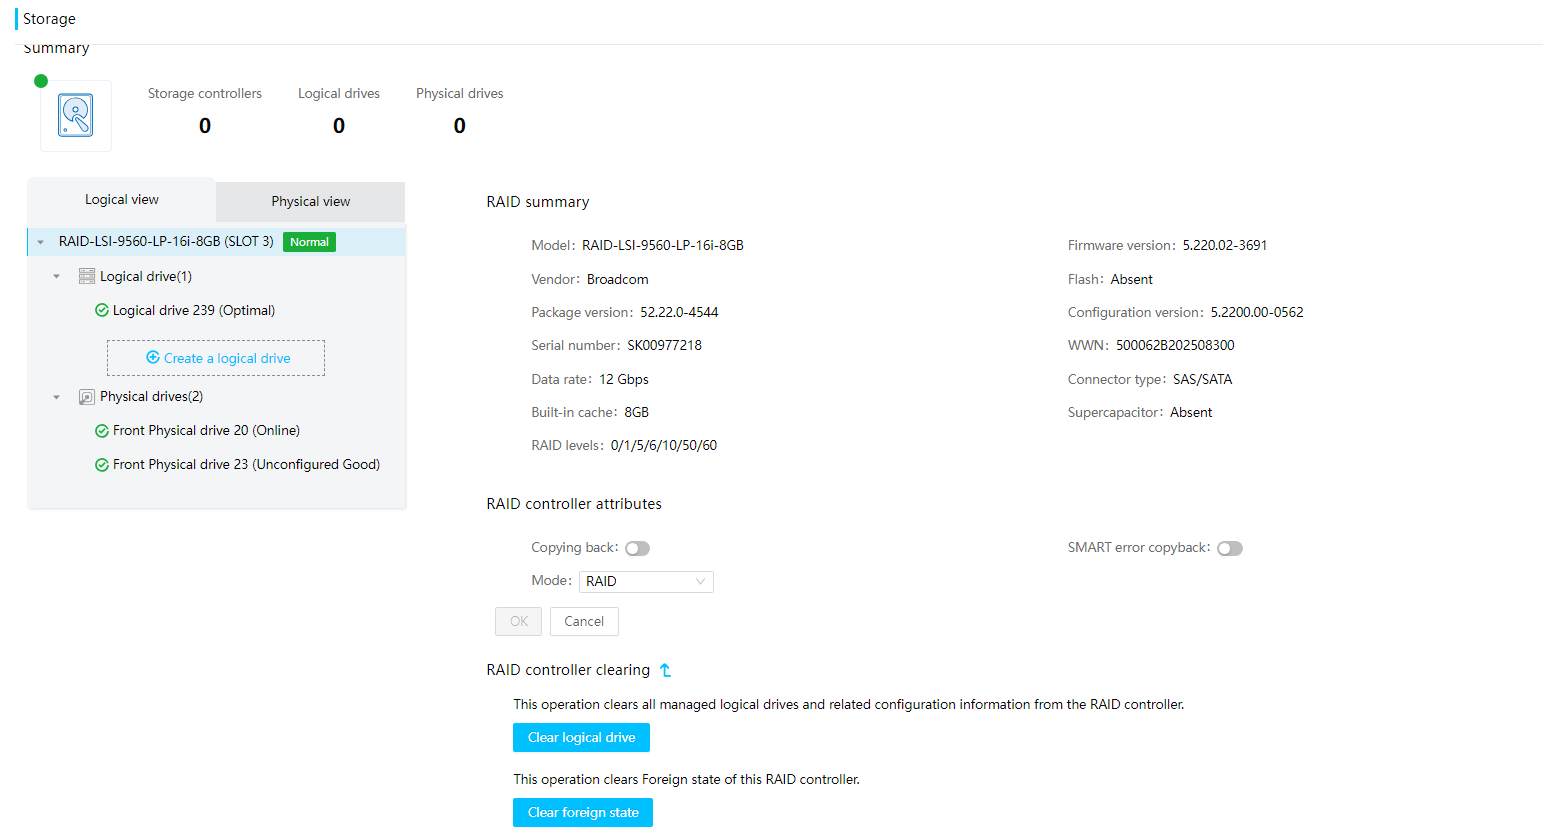
Logical drive management
HDM supports obtaining information about logical drives on storage controllers, including logical drive name, status, RAID level, capacity, boot drive status, stripe size, read policy, write policy, cache policy, default read policy, default write policy, physical drive cache policy, access policy, list of member drives, member drive capacity, and member drive attributes, as shown in Figure 71.
Figure 71 Logical drive information
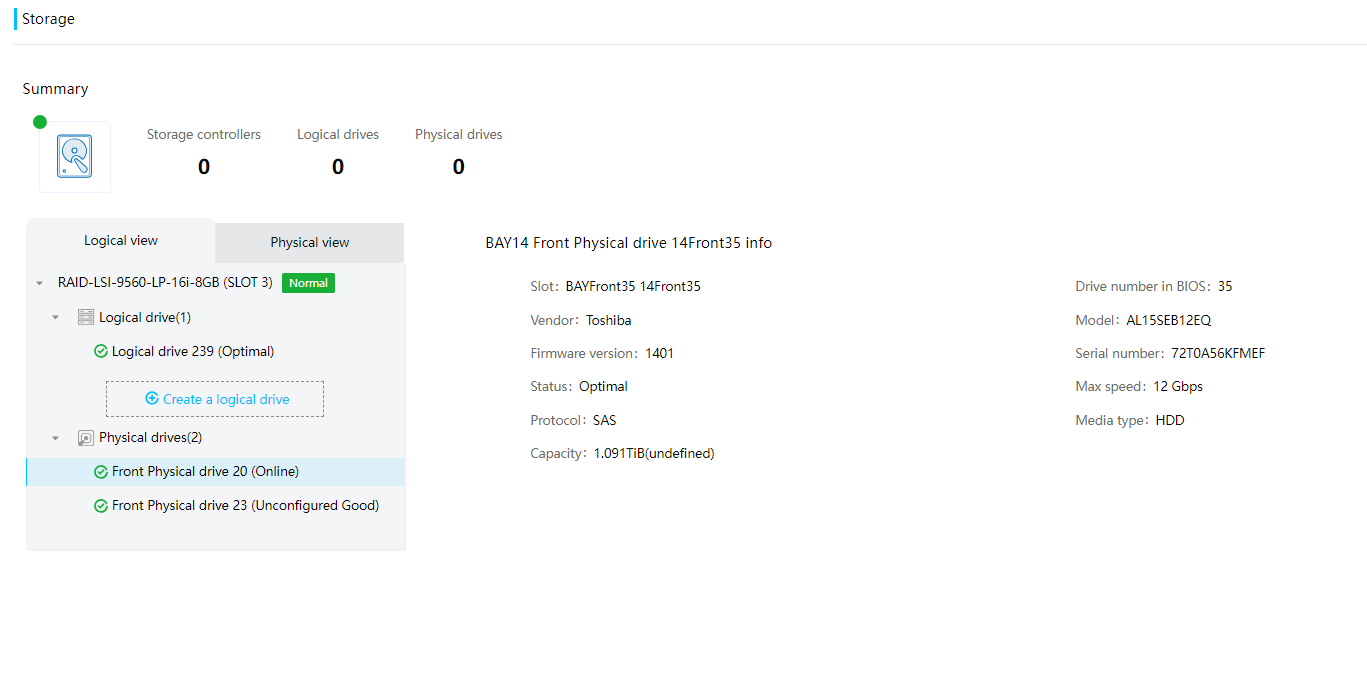
HDM supports configuration of logical drive attributes, including out-of-band creation of logical drives, modification of the default read policy, default write policy, physical drive cache policy, and access policy, as well as RAID configuration export. Attribute configuration require storage controller support for out-of-band RAID configuration.
Figure 72 Logical drive creation
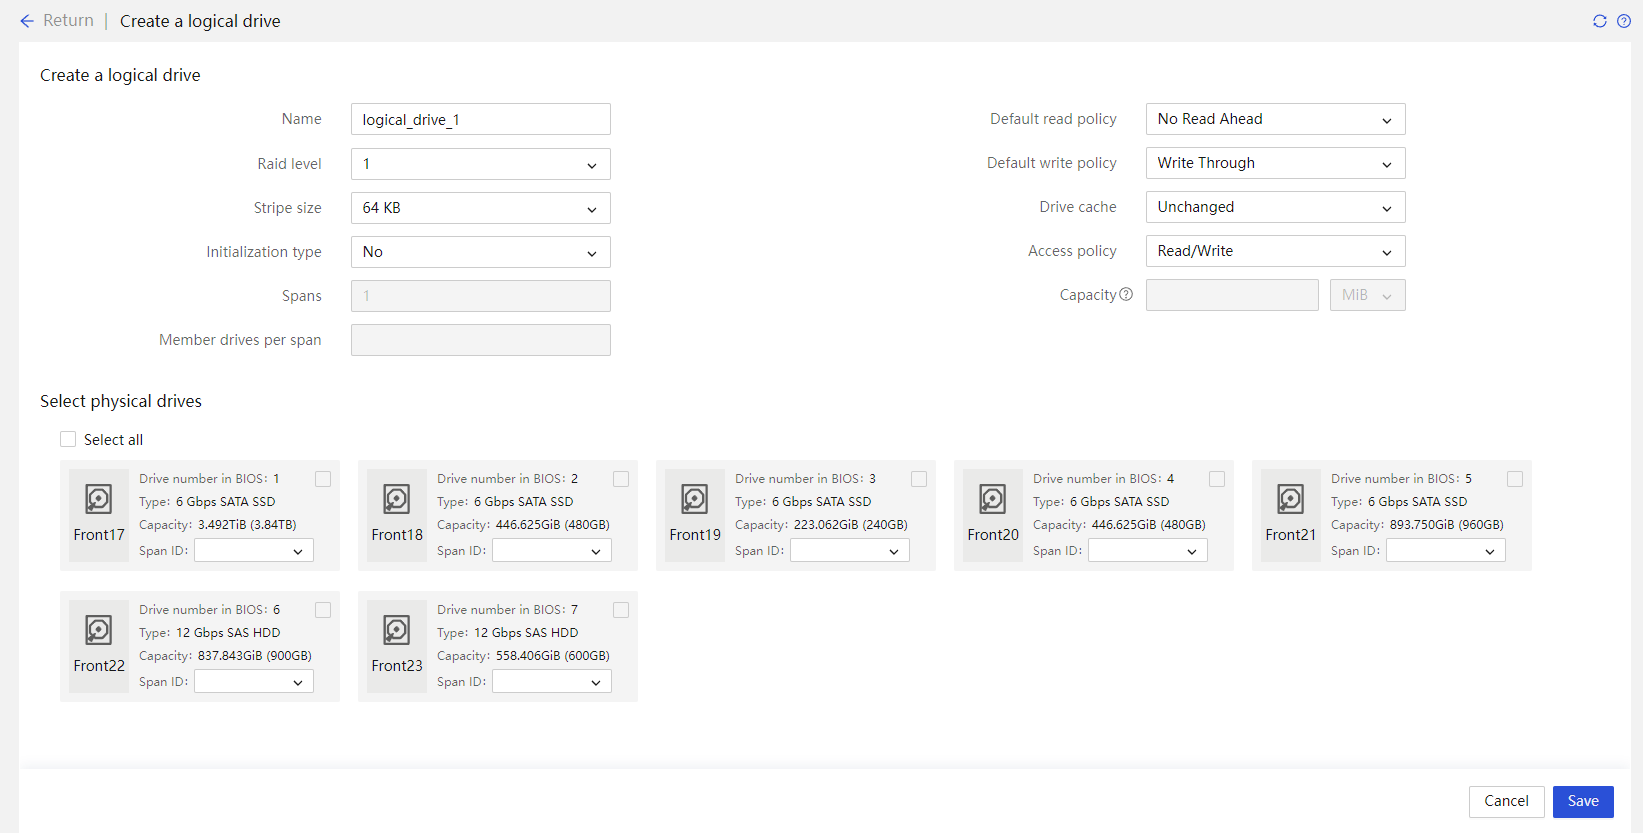
Figure 73 Logical drive attributes

HDM supports RAID configuration import and export.
As shown in Figure 74, HDM supports identity verification for logical drive deletion to prevent accidental or unauthorized deletion that might result in data loss or leakage. Only authorized users can delete data, which protects data security.
Figure 74 Identity verification for logical drive deletion

Physical drive management for a storage controller
HDM supports obtaining physical drive information for PMC and LSI storage controllers, including slot number, manufacturer name, model, firmware version, serial number, status, maximum rate, protocol, media type, capacity, rebuild progress, HDD SMART information (requires storage controller support), and SSD remaining lifespan percentage (requires storage controller support).
HDM supports configuring physical drive information for a storage controller, including:
· Configuration of the physical drive status.
· Hot spare configuration, such as global hot spare, dedicated hot spare, and roaming hot spare.
· Configuration of drive location LEDs.
Figure 75 Physical drive in logical view
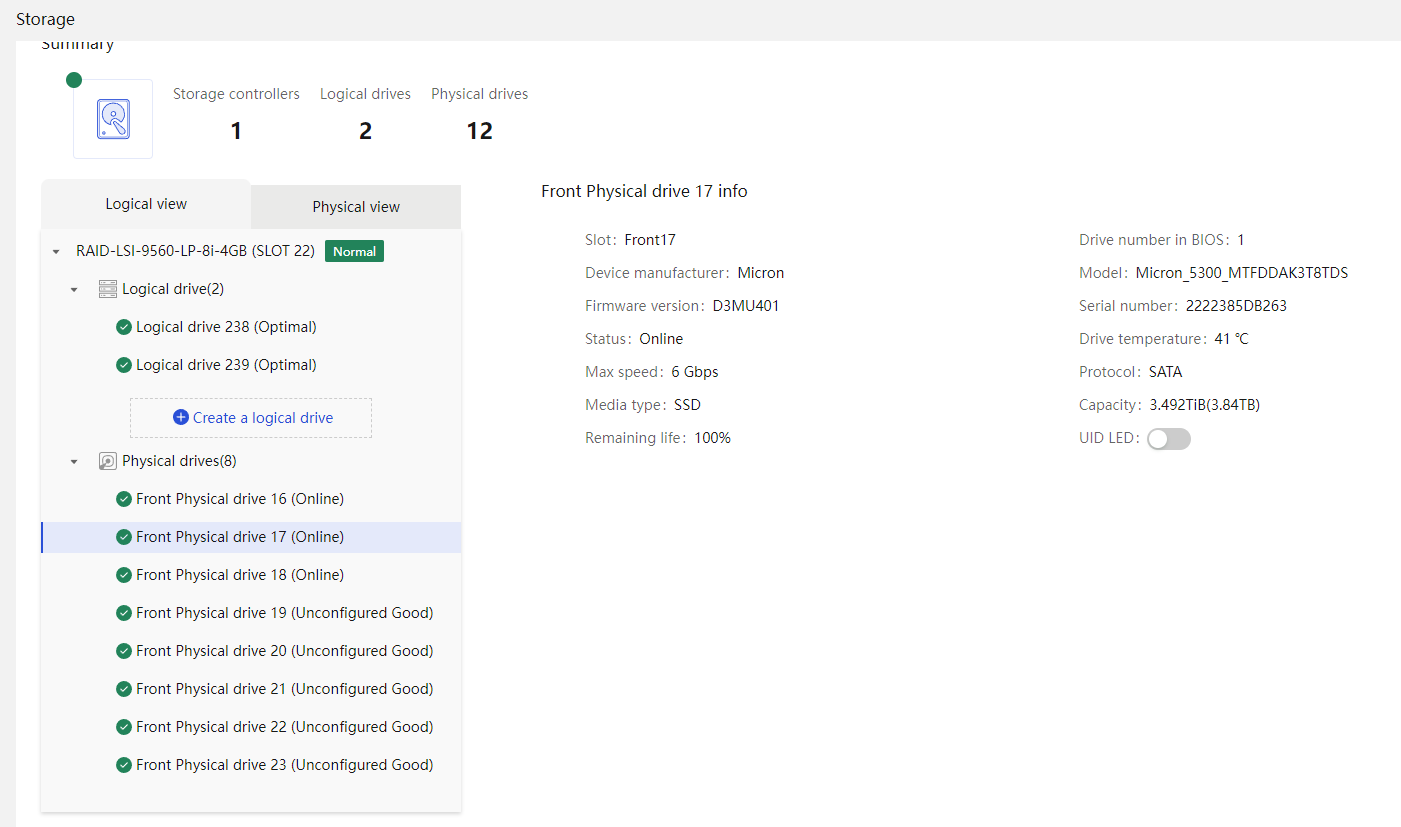
Figure 76 Physical drive information in physical view
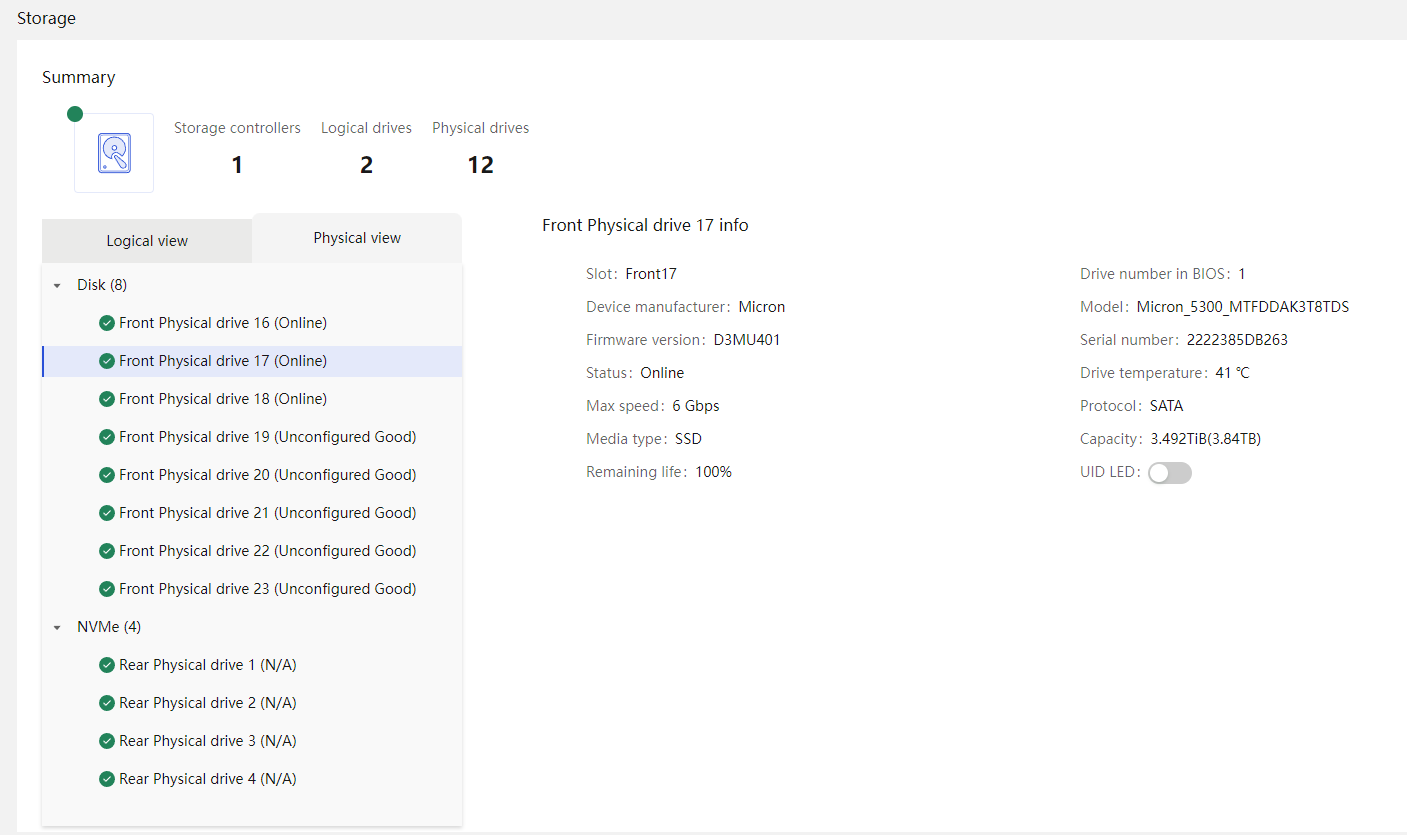
NVMe drive
HDM supports obtaining NVMe drive information, including product name, manufacturer, status, firmware version, serial number, model, interface type, capacity, physical slot, PCIe slot, remaining lifespan, maximum rate, media type, and predicted remaining lifespan in days, as shown in Figure 77.
Figure 77 NVMe drive information

HDM supports predicting the remaining lifespan of NVMe drives.
HDM monitors the operation status and performance metrics of NVMe drives to regularly collect data on the remaining lifespan percentage. The collected data is normalized for each time period, analyzed, and modeled to determine the trend in percentage changes. By analyzing this trend, HDM can provide an estimate of the remaining lifespan of a drive in days. Compared to traditional percentage data, the predicted remaining lifespan in days offers a more intuitive understanding for users to make decisions.
HDM supports locating NVMe drives by lighting up location LEDs.
HDM supports creating logical drives.
Marvell M.2 storage controller management
HDM supports obtaining Marvell storage controller information, including storage controller name, firmware version, vendor, interface type, supported RAID levels, and health status, as shown in Figure 78.
Figure 78 Marvell storage controller information
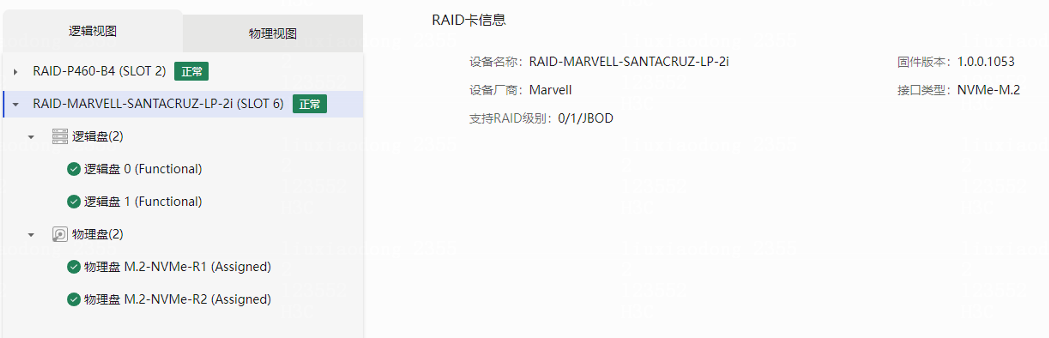
HDM supports obtaining information of logical drives for a Marvell storage controller, including logical drive name, status, level, capacity, stripe size, and member drive information. As shown in Figure 79, HDM supports monitoring logical drive faults to identify logical drive downgrade and fault status and generate alarms in time.
Figure 79 Marvell logical drive information
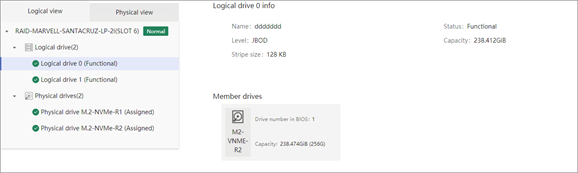
HDM supports obtaining M.2 physical derive information under the Marvell storage controller, including slot number, BIOS number, vendor, model, firmware version, serial number, status, drive temperature, protocol, media type, capacity, remaining lifespan, temperature, and drive SMART information, as shown in Figure 80. HDM also supports monitoring physical drive faults to identify physical drive faults and generate alarms in time. In addition, HDM supports sending alarm notification on physical drive remaining lifespan to notify users to replace a drive before its lifespan is exhausted to prevent data loss.
Figure 80 Marvell physical drive information
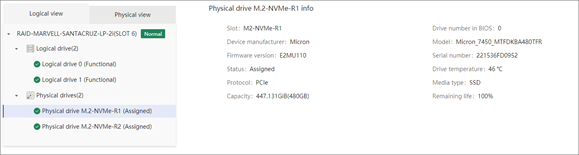
Embedded drive management
HDM supports obtaining information about onboard physical drives (SATA and M.2) without relying on RAID controller management. The information includes the physical slot, model, firmware version, capacity, maximum rate, and media type of the drive, as shown in Figure 81.
Figure 81 Embedded drive information
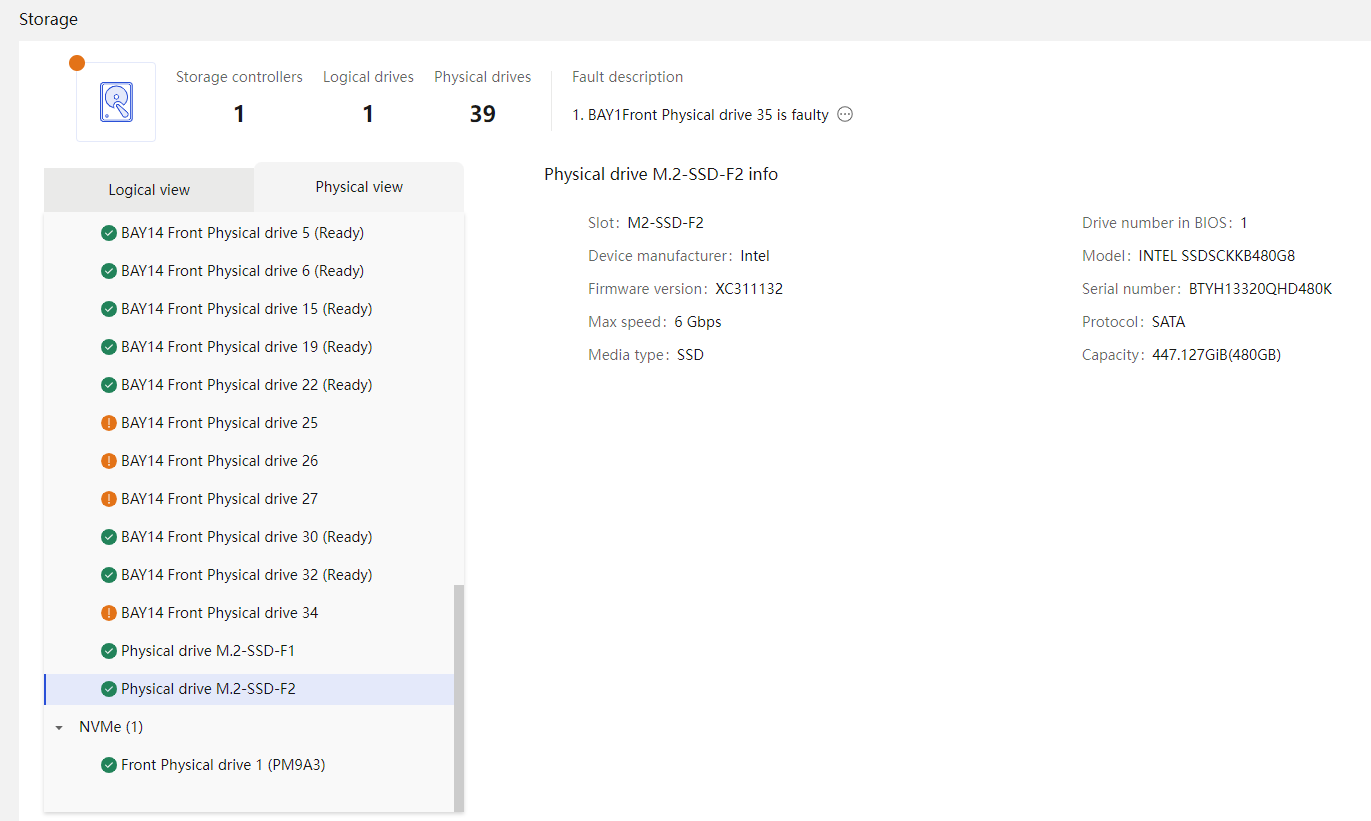
Drive location LEDs
The drive location LED function applies to drives managed by storage controllers, onboard drives directly connected to the motherboard, and onboard NVMe drives. This function caters to different user needs to enhance drive management efficiency and accuracy, and expand the usage of drive LEDs.
Figure 82 Drive location LED for a storage controller
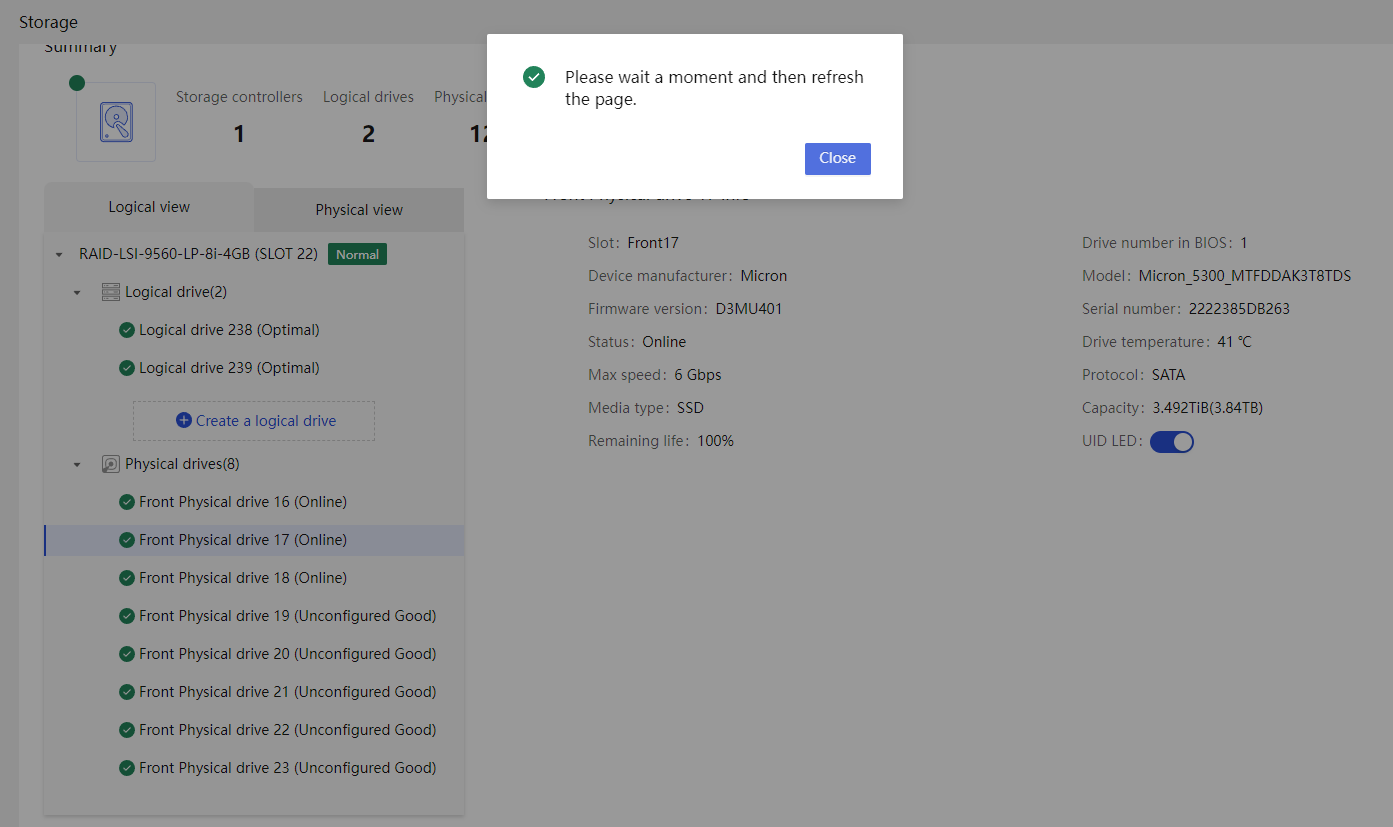
Figure 83 Drive location LED for onboard drives
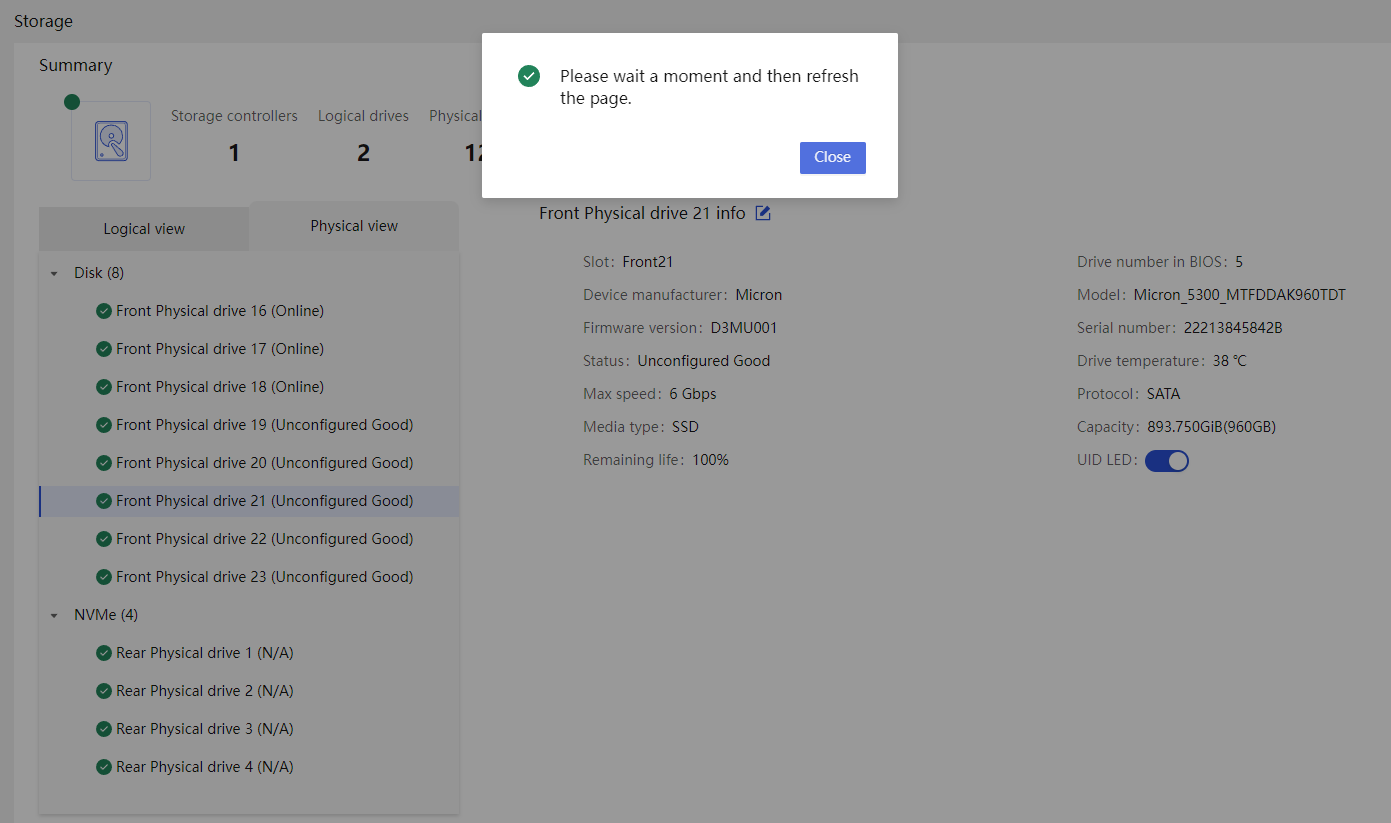
Figure 84 Drive location LED for onboard NVMe drives
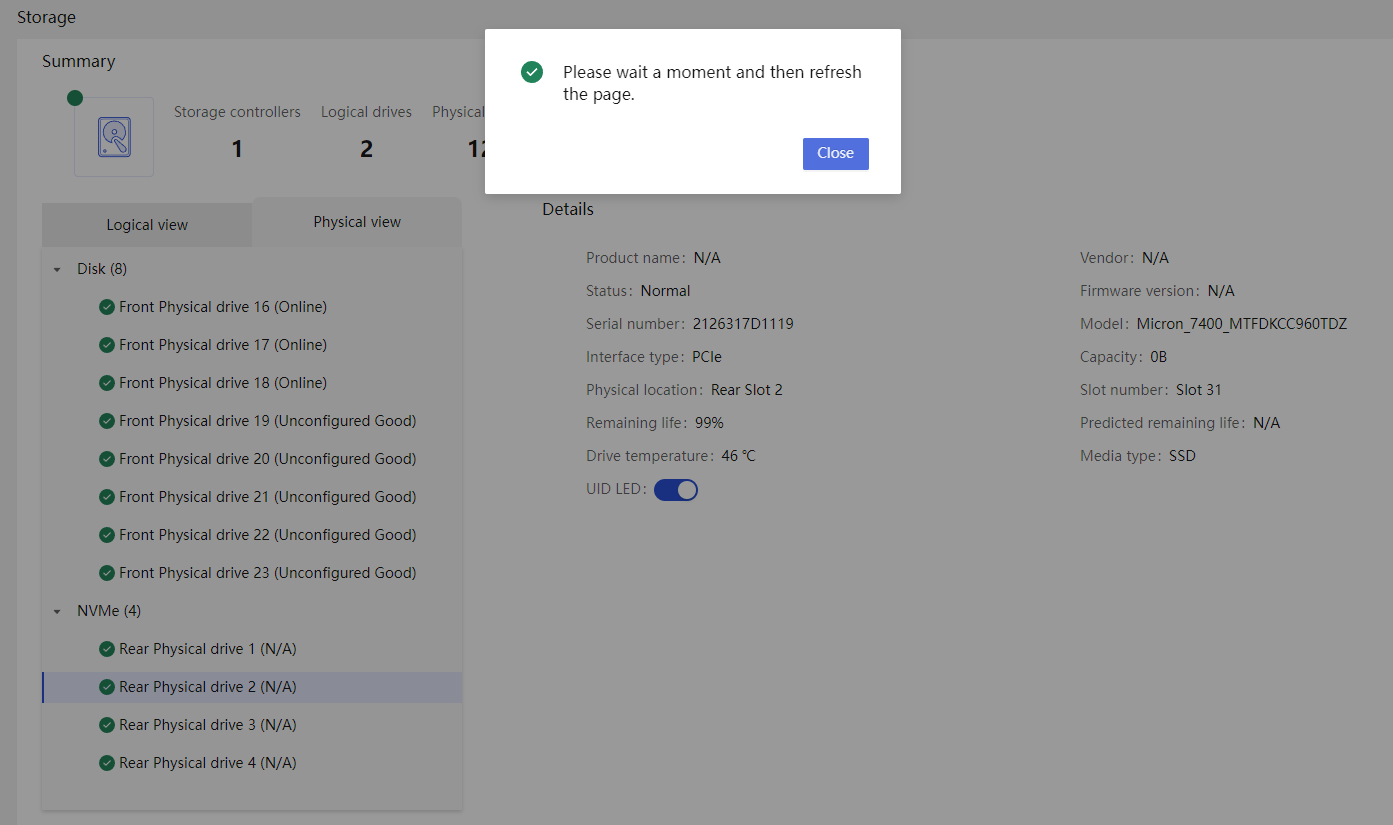
Storage maintainability
Fault alarms
HDM can detect the presence, failures, pre-failures, and array failures of drives.
· HDDs—Monitors HDDs and generates alarms for physical failures, pre-failures, configuration errors, abnormal firmware status, media errors, pre-failure conditions, UNC errors, bad sectors, missed drive status, and critical/failed array states.
· SSDs—Monitors SSDs and generates alarms for physical failures, pre-failures, configuration errors, abnormal firmware status, media errors, pre-failure conditions, UNC errors, and missed drive status, as well as SSD wear life and remaining reserved blocks.
· NVMe drives—Monitors NVMe drives and generates alarms for NVMe drive wear life.
· Storage controller—Generates storage controller failure alarms.
· BBU—Generates alarms for BBU failures, pre-failures (low voltage), and not-in-place BBUs.
Figure 85 Physical drive alarms
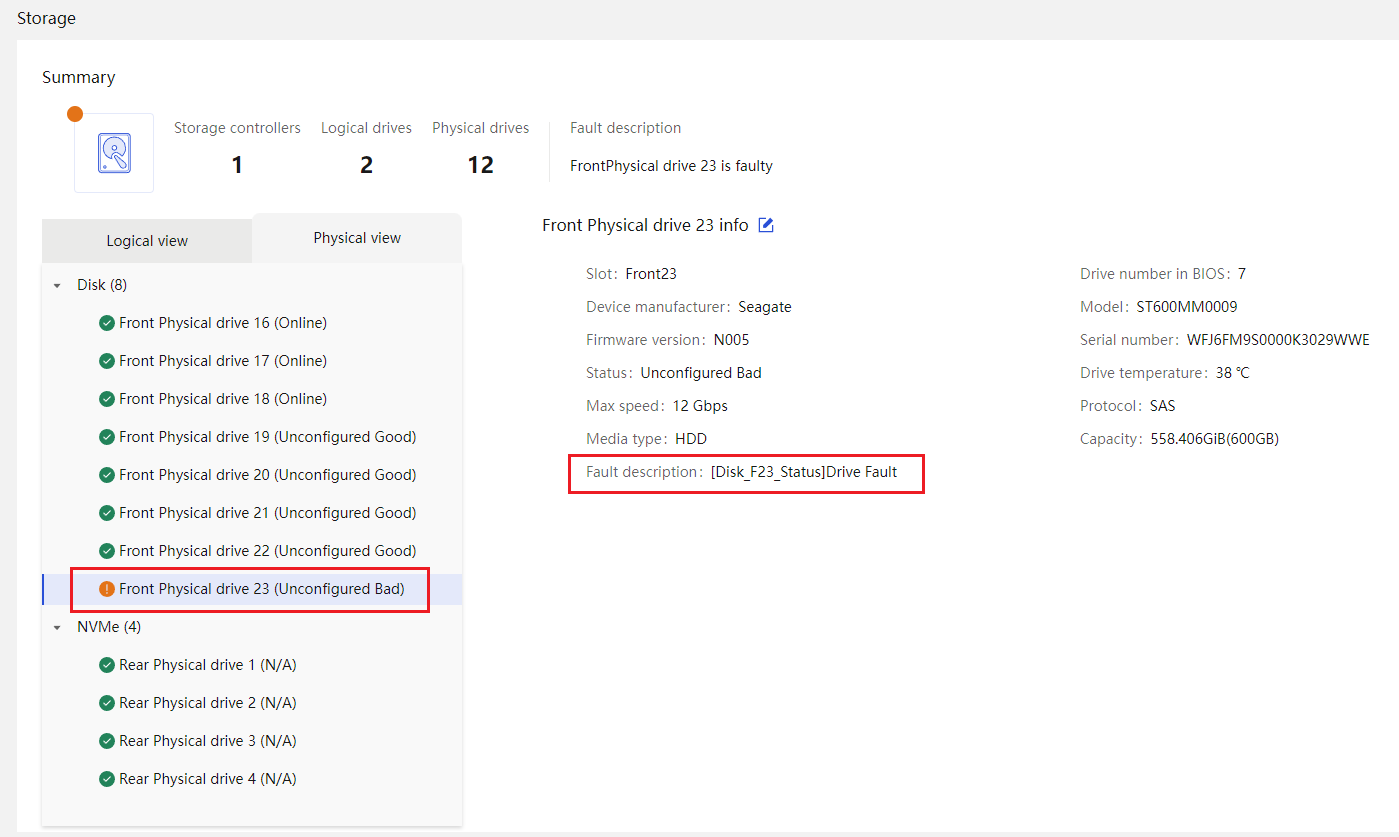
Logical drive alarms
HDM can obtain the current status of logical drives through the storage controllers and determine if the drive status is normal. In case of an abnormal status, corresponding alarms will be reported via SEL to notify users to handle the issue promptly.
Figure 86 Logical drive alarms
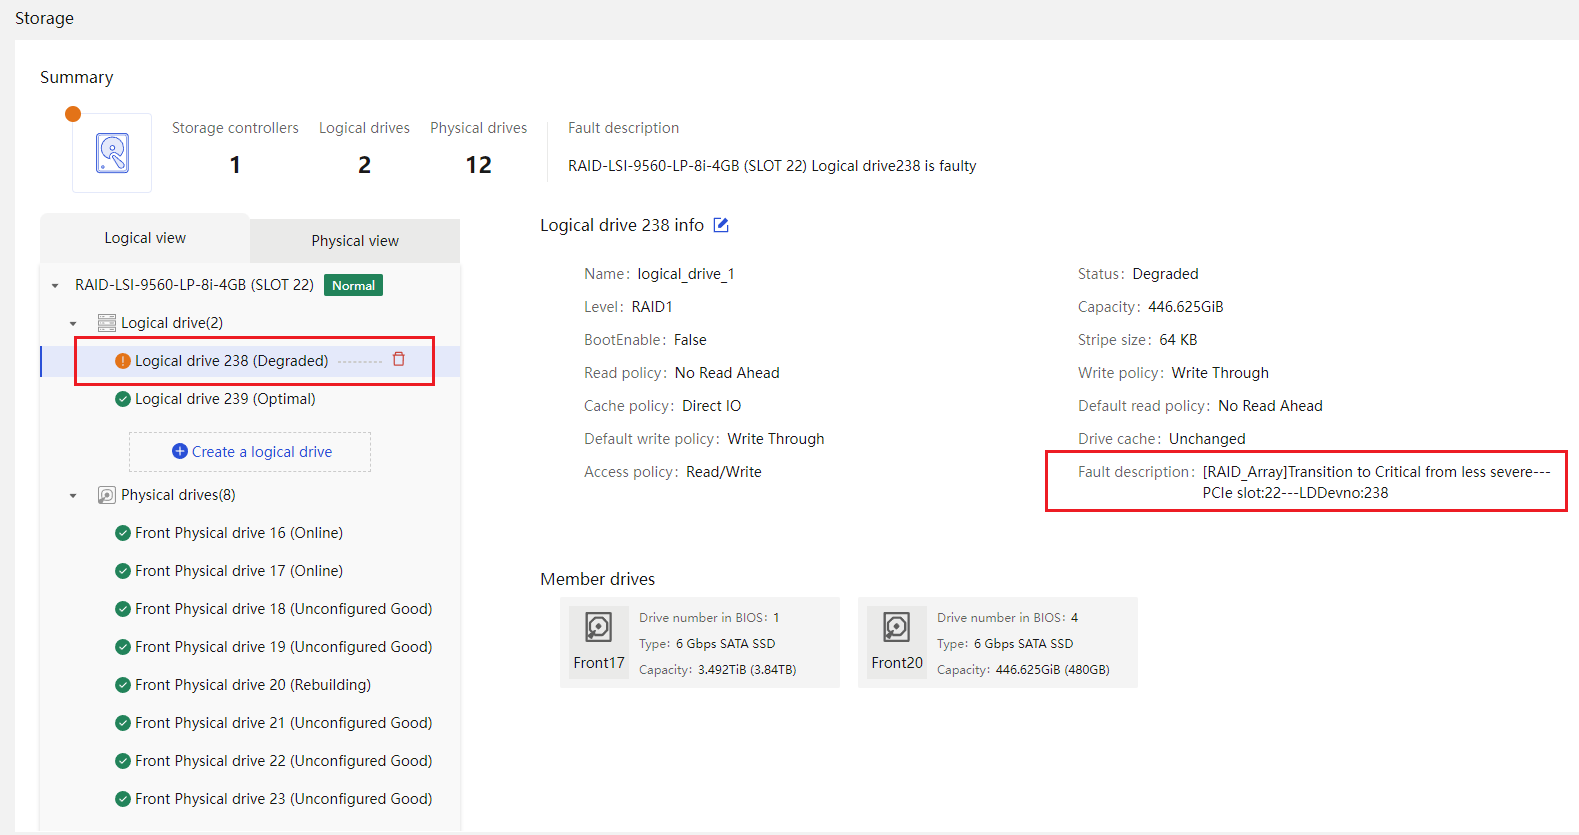
Graphical display of SMART parameters for HDD drives
HDM can display SMART parameter data graphically, including attribute, current value, threshold, and raw data information, for each drive.
Figure 87 Drive SMART information monitoring
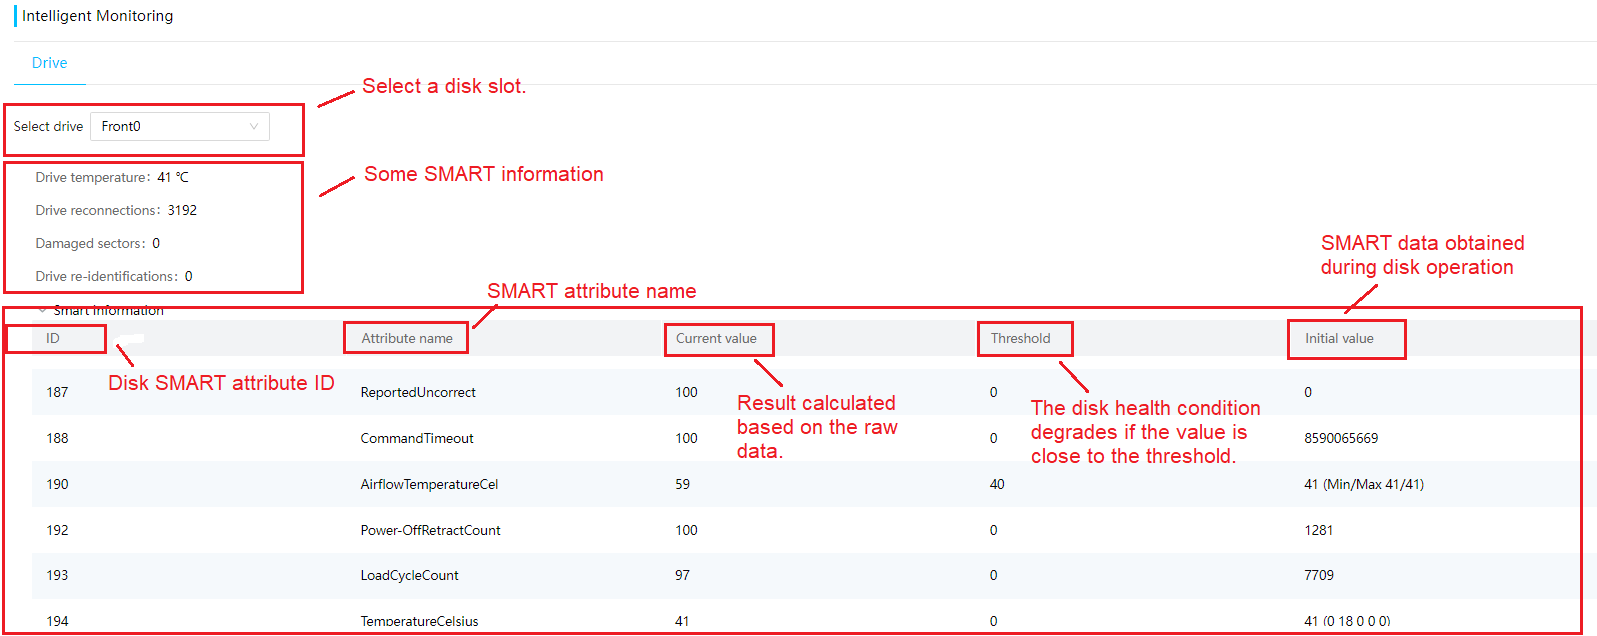
HDM supports collecting SMART data from HDD drives and using KPI trend prediction algorithms to predict the SMART data parameter trends for the next 1 day. The predictions are displayed graphically on the Web interface.
Figure 88 Drive SMART information prediction
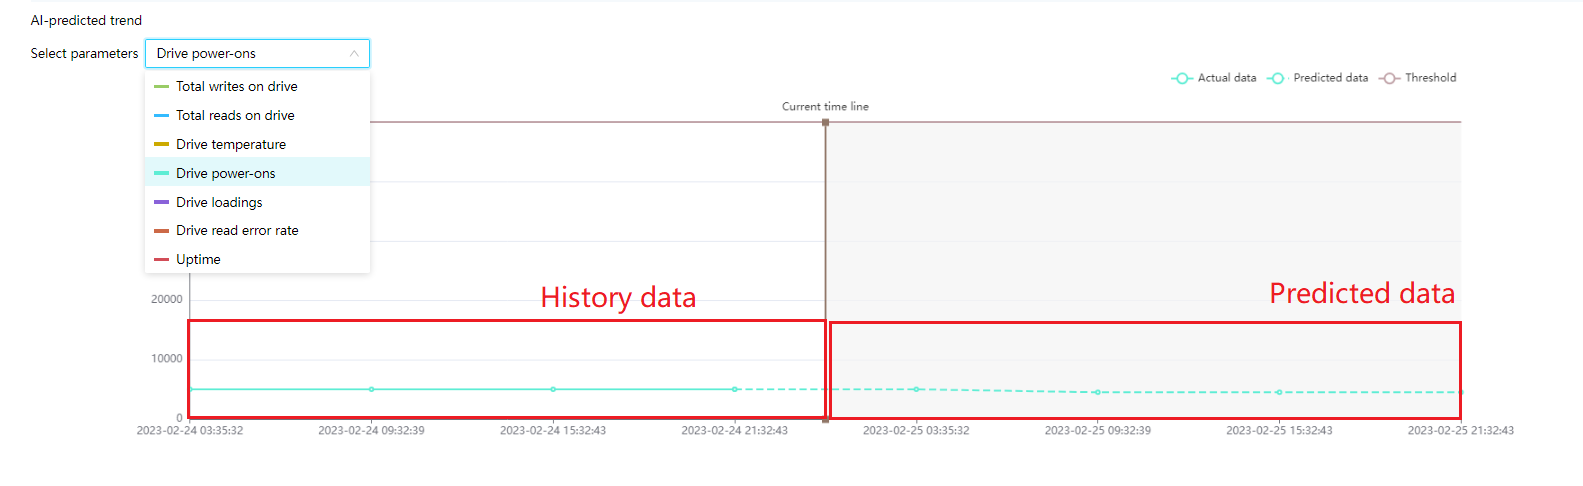
NVMe/SSD remaining lifespan alarms
HDM can display the real-time remaining lifespan percentage of NVMe and SSD drives. When the lifespan of an NVMe or SSD drive reaches the alarm threshold, HDM will report a pre-alarm, notifying the user to replace the drive promptly to prevent data loss and drive failure. Users can flexibly set their own alarm thresholds as needed.
Figure 89 NVMe/SSD remaining lifespan alarms
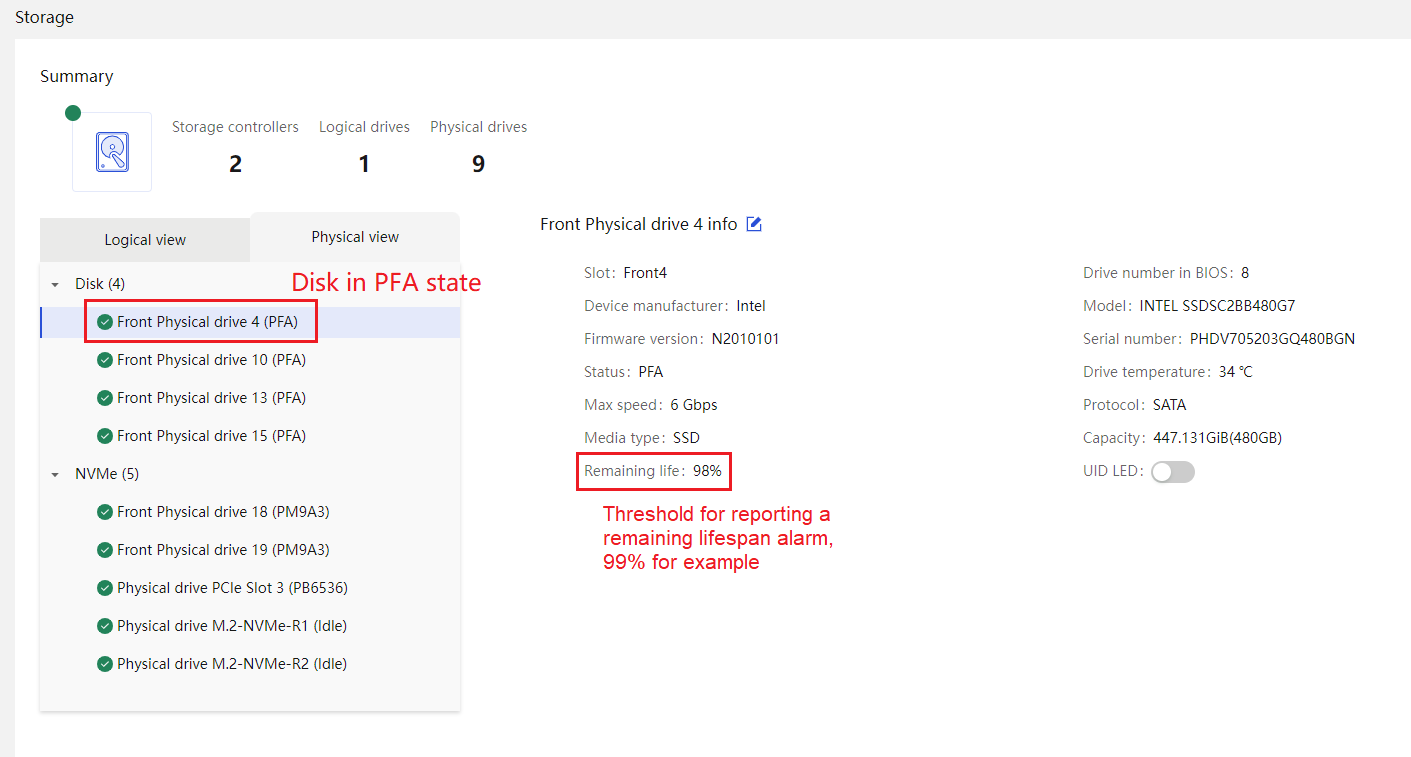
Drive pre-failure alarms
The drives managed by storage controllers support pre-failure alarms, allowing the server to detect potential failure signs and report alarms in advance. This helps reduce downtime and service interruptions, improving system availability and reliability.
SHD logging and diagnosis
SHD can obtain PMC storage controller log information through the PBSI channel, including over 60 types of storage-related faults. SHD can also obtain PMC storage controller log information through the MCTP (over PCIe) channel, including over 10 types of storage-related faults.
SHD can obtain LSI storage controller log information to provide over 500 logs related to RAID controllers, BBUs, physical drives, logical drives, and backplane faults.
SHD diagnosis supports diagnosing PMC and LSI RAID/HBA log information, identifying the corresponding error causes, and providing solutions. Supported modules include RAID controllers, cables, BBUs, and storage media.
SMART information collection and diagnosis
HDM can obtain SMART information from SAS/SATA HDD and SSD drives and provide fault diagnosis based on HDD SMART information.
Storage controller log
You can obtain storage controller log (except 9300, 9311, 9400, and 9500) through one-click download.
Misconnection detection
HDM can detect misconnected hardware cables, including AUX port cables, SAS cables, and onboard NVMe cables. This feature helps to identify and resolve cable-related faults in a timely manner.
Storage protocol stack
MCTP Over PCIe
Management Component Transport Protocol (MCTP) over PCIe is a protocol for communication between management components. It enables transferring and interacting management information between different devices over the PCIe bus. MCTP over PCIe uses the PCIe transport layer and defines MCTP message format on the PCIe transaction layer for communication between management components. This protocol allows management components to implement monitoring, configuration, management, fault diagnosis, and efficiently transmit various management information in the system.
HDM supports MCTP over PCIe on both Intel and AMD Genoa platforms. This indicates that HDM supports managing components using MCTP over PCIe on AMD models, including but not limited to the following:
· Creating/deleting RAID settings for PMC storage controllers in an out-of-band manner.
· Configuring logical drive attributes.
· Out-of-band upgrade of storage controllers and drives.
· Out-of-band upgrade of LSI storage controllers and drives.
· Out-of-band upgrade of network adapters.
HDM's MCTP over PCIe solution enables unified management on Intel and AMD processor architectures, providing flexible and scalable options for customers. It helps customers uniformly manage and monitor their systems across different hardware platforms, enhancing system stability and reliability.
MCTP Over I2C
MCTP Over I2C is a management component transport protocol that runs on the I2C hardware bus. It differs from the MCTP Over PCIe protocol mainly in the physical channel.
HDM supports out-of-band management of Marvell storage controllers and network adapters through the MCTP Over I2C protocol. The out-of-band management method is more flexible and offers more options. On the server platforms or devices where MCTP Over PCIe is not supported, using MCTP over I2C ensures the proper functioning of out-of-band features for related devices, meeting diverse customer needs.
NVMe-MI
NVMe Management Interface (NVMe-MI) is specifically for managing NVMe devices, allowing the system to manage and monitor connected NVMe devices, including NVMe SSD drives and other storage devices. NVMe-MI defines a set of commands and data structures for device management, monitoring, and error logging.
HDM supports out-of-band management on Marvell storage controllers and some NVMe drives through NVMe-MI, including obtaining basic information for Marvell storage controllers, logical drives, and physical drives, and fault status monitoring, as well as obtaining SMART information for some NVMe drives.
GPU management
Displaying basic GPU information
HDM supports displaying basic information of GPUs on the PCIe tab, including the model, manufacturer, firmware version, health status, location, part number, serial number, power, and chip model of GPUs.
Figure 90 Displaying basic GPU information
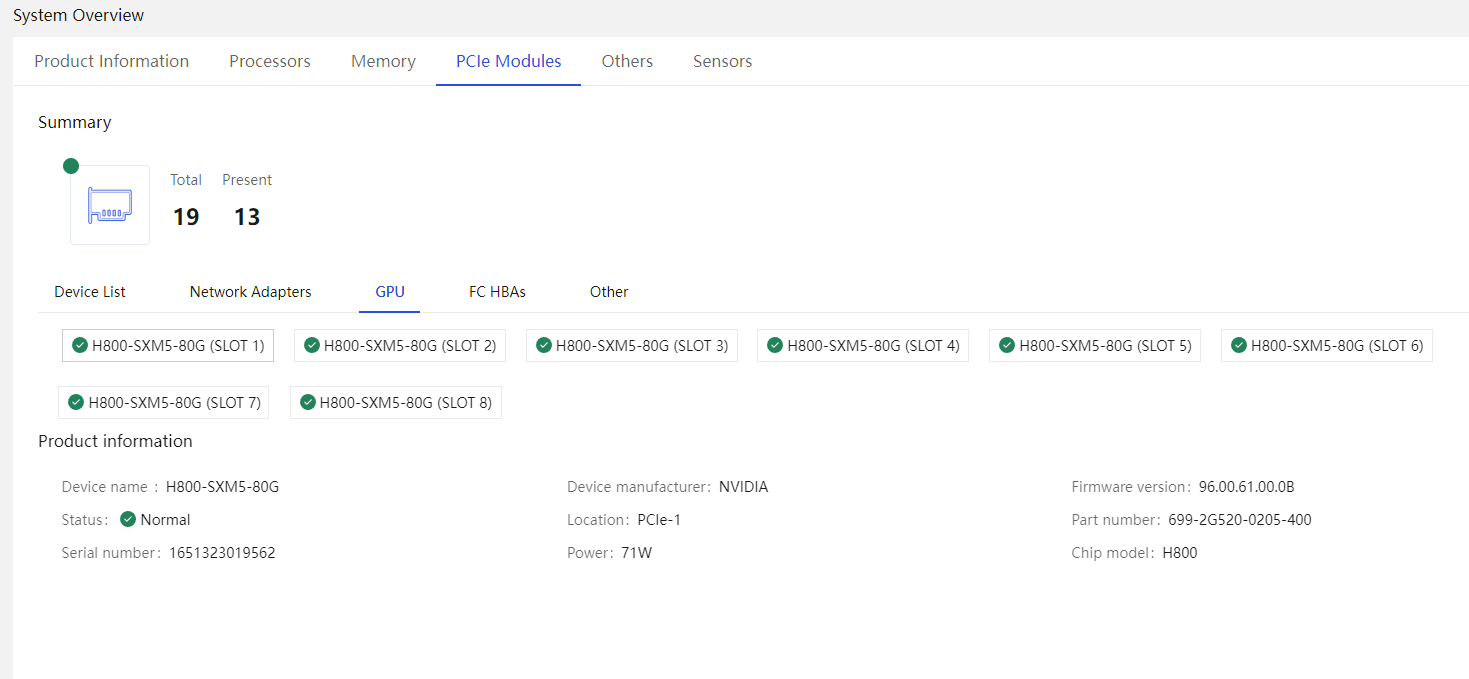
GPU module out-of-band upgrade
HDM supports out-of-band bulk upgrade of firmware of all nodes within the GPU module. The firmware includes HMC, FPGA, GPU, NVSwitch, PCIeSwitch, and PCIeRetimer.
Figure 91 GPU firmware information
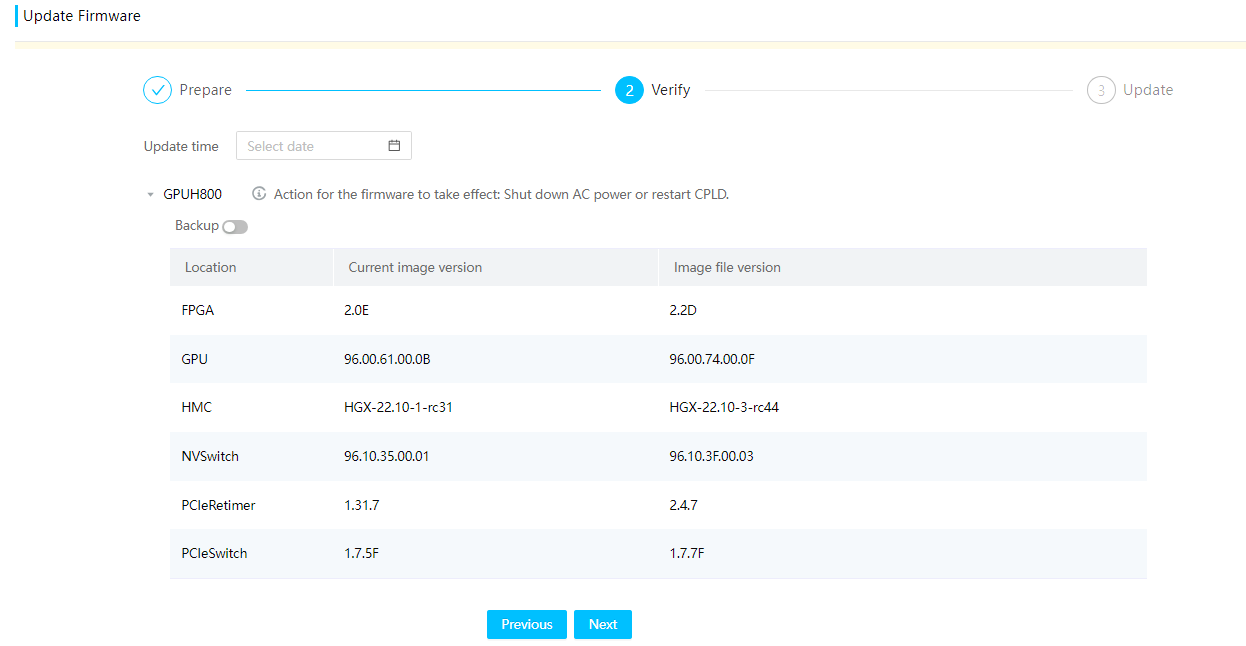
Out-of-band upgrade for the GPU module has the following benefits:
· Supports bulk upgrade of firmware of multiple GPU nodes, which prevents uncontrollable module issues caused by mismatched component firmware, greatly improving the efficiency and stability of GPU maintenance.
· Supports image pool backup, enabling firmware replacement with just one click.
GPU node power capping
GPU power capping, also known as GPU power limit, is a GPU management technology. It can limit the Thermal Design Power (TDP) of the GPU, enabling the GPU to remain stable even with limited heat sinks. Setting the power cap for the GPU is a crucial task as it can limit the power consumption of the GPU, prevent overheating, and increase the stability and reliability of the GPU.
Figure 92 Setting the power cap value for the GPU node
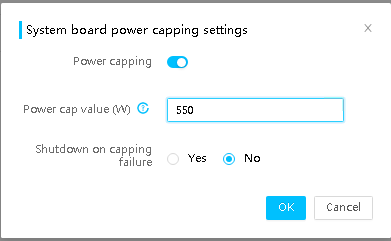
GPU module fault diagnosis
HDM allows you to export all abnormal statuses and self-inspection reports of components on the GPU module by downloading SDS from the Web interface with just one click.
You can view the alarm events generated by the GPU module through the Redfish interface, and filter the alarm events by alarm level. Depending on out-of-band fault monitoring capability of GPUs, HDM supports various alarm events, including overheating, abnormal GPU in-place status, Power_good status anomaly, PCIe interface status anomaly, ECC/UCE, severe NVLink/NVSwitch errors, XID error messages, HMC service anomaly, PCIe recoverable errors, and HMC recovery upon a restart.
You can monitor the GPU usage in real-time (FIST SMS installation required).
Energy efficiency management
As the scale of current data centers continues to expand, their energy consumption is also increasing, with server energy consumption occupying a high proportion. Therefore, achieving energy efficiency in servers is crucial for the efficient operation of data centers.
HDM, by integrating multiple intelligent energy-saving technologies, can effectively reduce server energy consumption, enhance cabinet power usage and deployment density, and help promote the green development of the new infrastructure industry. In addition, HDM, in combination with multiple H3C liquid-cooled servers, provides support such as leak detection to ensure normal operation of customer's liquid-cooled data centers.
HDM can monitor component-level energy consumption for CPU, memory, fans, and drives.
From HDM, you can monitor power consumption data in real-time through multiple interfaces such as Redfish, IPMI, SNMP. You can control device power on and off, set the server system startup policy after AC power is restored, and configure power capping and power supply operating mode.
HDM also supports a variety of functions, including history power consumption statistics, energy-saving settings, fan management, and performance optimization.
Powering on or powering off the server
You can power on or off the server from the HDM Web interface.
Figure 93 Powering on or powering off the server
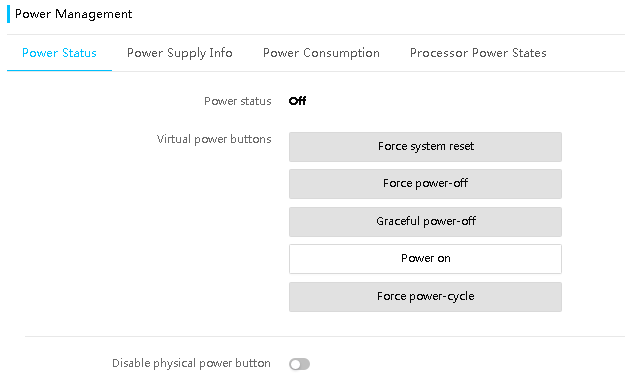
The following power options are available for you to control the power status of the server.
· Force system reset: Cold reset of the server. HDM directly pulls PCH to reset the system, bypassing the normal operating system shutdown process.
· Force power-off: Shuts down the server without waiting for OS response, bypassing the normal operating system shutdown process. The effect is equivalent to long-pressing the power button on the server panel.
· Graceful power-off: Safely shutdown of the server. HDM sends an ACPI interrupt to the OS. If the OS supports the ACPI service, it will first go through the normal operating system shutdown (closing all running processes) before powering down to the system. If the OS does not support the ACPI service, it waits until the power-down timeout and then forcibly shut down the system. The effect is equivalent to short-pressing the power button on the server panel.
· Power on: Starts up the server.
· Force power-cycle: Powers off and then powers on the server.
· Disable physical power button: Used for disabling the physical power button. After this option is turned on, the physical power button function is disabled, preventing service interruption caused by accidental triggering of the power button on site.
Configuring the server system startup policy after power-on
This task configures the server system startup policy after power-on. Options include:
· Always power on: After power on, the server system will automatically start.
· Always power off: After power on, the server system remains off.
· Restore last power state: After power on, the server system will return to the state before the last power outage. The server is in this mode by default.
· Power-on delay: Startup delay time. Options are 15s, 30s, 45s, 60s, and random (1 to 120s). Startup delay can be used for staggered power-on of servers, to reduce instantaneous power consumption during the server boot process in the equipment room.
Figure 94 Configuring the server system startup policy after power-on
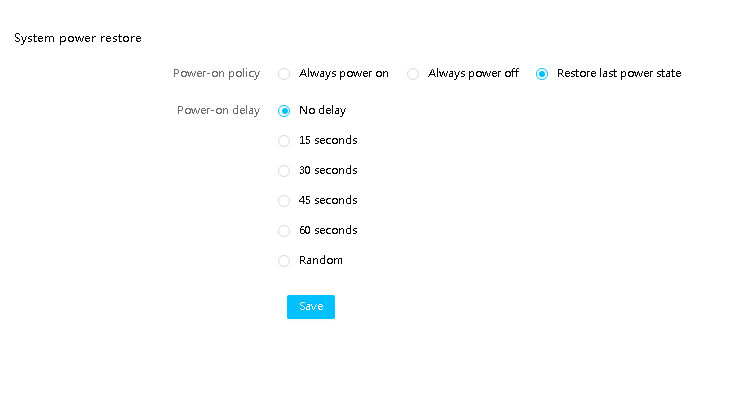
The final command to start up the system is controlled by HDM. After power-on, the standby power supply on the system board is supplied first. Then, the HDM starts and determines whether to start the system based on the startup policy.
Power capping
The power capping function works by setting an expected upper limit for the system power. When the system power exceeds this limit, actions are triggered, which ensures reasonable distribution of the power within the chassis.
Actions in case of capping failure include:
· Event logging: A log is recorded in the system event file after a capping failure. This action is executed by default.
· Shutdown (optional): After a capping failure, the system will perform a forced power-down operation.
Figure 95 System board power capping settings

HDM supports intelligent power capping and emergency power capping for data center servers through collaboration with UniSystem.
Intelligent power capping enables intelligent adjustment of the power capping values of servers based on their service characteristics, which assists in optimizing customer service deployments.
Figure 96 Intelligent power capping settings
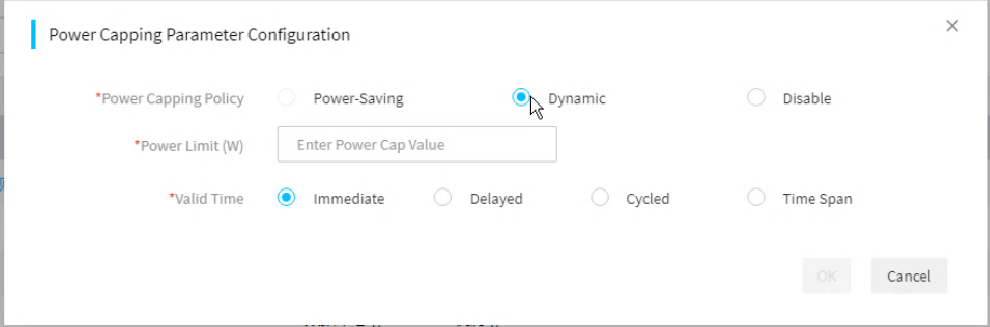
With emergency one-click power capping, you can set the power capping value for each server with just one click in the event of an urgent power failure in the data center. This can quickly reduce the power consumption of the data center servers, ensure the power supply for key, core service servers, and prevent significant losses of customers.
Figure 97 Emergency one-click power capping settings

Power supply operating mode
Under the premise that the power consumption of services is met, you can configure some power supplies to operate in hot standby mode to improve the power conversion efficiency. From HDM, you can set the operating mode for server power supplies. Options are Load balancing and Active/standby.
In Active/standby mode, you must specify a minimum of one active power supply and a minimum of one standby power supply.
· If the active power supply fails, the standby power supply becomes active to supply power.
· If the actual power consumption of the active power supply exceeds 62% of its maximum rated power consumption, the standby power supply becomes active to supply power.
In load balancing mode, all present power supplies are in active mode, achieving load sharing.
Figure 98 Power supply operating mode settings
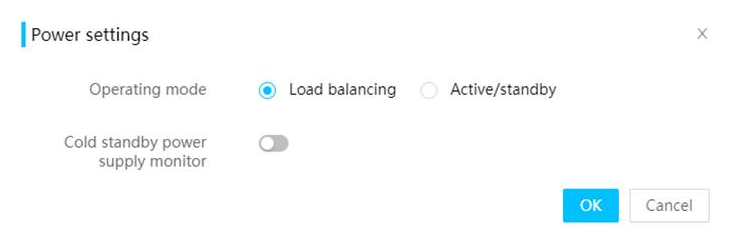
Cold standby power supply monitor
After cold standby power supply monitor (inspection) is enabled, all present cold standby power supplies will be tested once a month to ensure that they can output power correctly when they are operating in active mode. During the inspection, the power supply mode will be switched to load balancing mode to check if the overall output of the power supply group is normal. If abnormal, an SEL alarm will be reported.
· If the inspection result is normal, the power supply operating mode will revert to the user-configured mode.
· If the inspection result is abnormal, the power supply operating mode will remain in load balancing mode.
To enable cold backup power supply inspection, make sure the following conditions are met:
· The power supply group is healthy with no alarms present.
· The number of present power supplies in the group is two or more.
You can enable cold backup power supply inspection in both the power supply operating modes.
Cold backup power supply inspection ensures health and stability of the power supplies and can improve the reliability and stability of the system.
Dynamic active/standby power supply mode
In intelligent power saving mode (dynamic active/standby power supply mode), HDM will dynamically adjust the power supply operating mode in real time based on the total power of the server to ensure that the power supply subsystem maintains normal operation of the server with the highest efficiency, and achieves the goal of energy saving and consumption reduction. When the total power of the server is high, the power supplies will automatically switch to load balancing mode. When the total power of the server is low, the power supplies will automatically switch to the active/standby mode.
Figure 99 Dynamic active/standby power supply mode settings

|
|
NOTE: Only the server models with two power supplies support this feature currently. |
Historical power consumption statistics
HDM can provide accurate power consumption monitoring and offer statistics through curves, enabling administrators to gain in-depth understanding of the actual usage of power and cooling resources. Users can optimize server energy efficiency based on historical data.
The page supports displaying power consumption information for the most recent 30 days.
Figure 100 Historical power consumption statistics
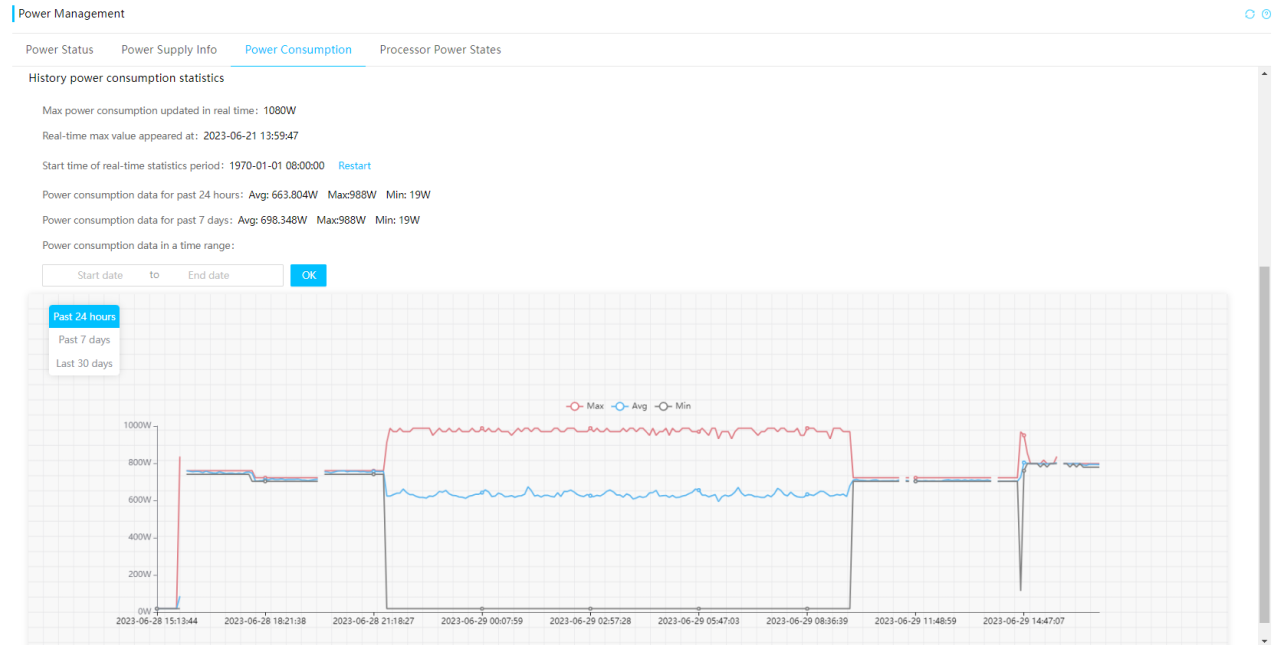
Energy-saving settings
From HDM, you can set the power performance mode, including performance mode, energy-saving mode, and balanced mode with just one click, to meet needs of different customers or scenarios for server performance, power consumption, and noise.
You can reduce the system power consumption by adjusting the maximum operating frequency (P-state) of the CPU. HDM provides multiple adjustment levels for flexible selection to meet the needs of different products.
Figure 101 Energy-saving settings
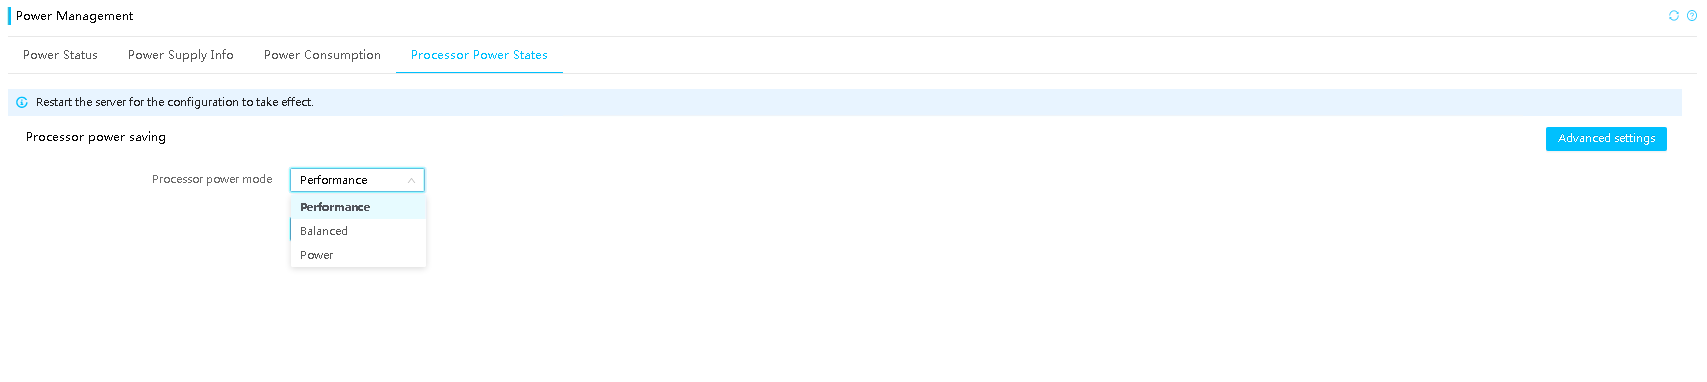
Fan management
HDM supports using both MS algorithm and PID controller algorithm to adjust fan speeds. The PID controller algorithm is more precise.
MS algorithm
You can directory use MS algorithm to specify fan speeds at different temperatures in the .xml configuration file.
PID algorithm
PID algorithm is used to calculate the optimized fan speed in real time by using sensor speed parameters and sensor temperature readings in the .xml configuration file. It can adjust fan speeds in a more precise way. The PID controller algorithm operates as shown in Figure 102.
Figure 102 PID controller algorithm
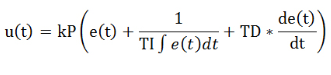
Figure 103 shows the simulation diagram of fan speed adjustment with the PID algorithm. If the DTS temperature increases or decreases, the fan speed will increase or decrease accordingly.
Figure 103 Fan speed adjustment with PID algorithm
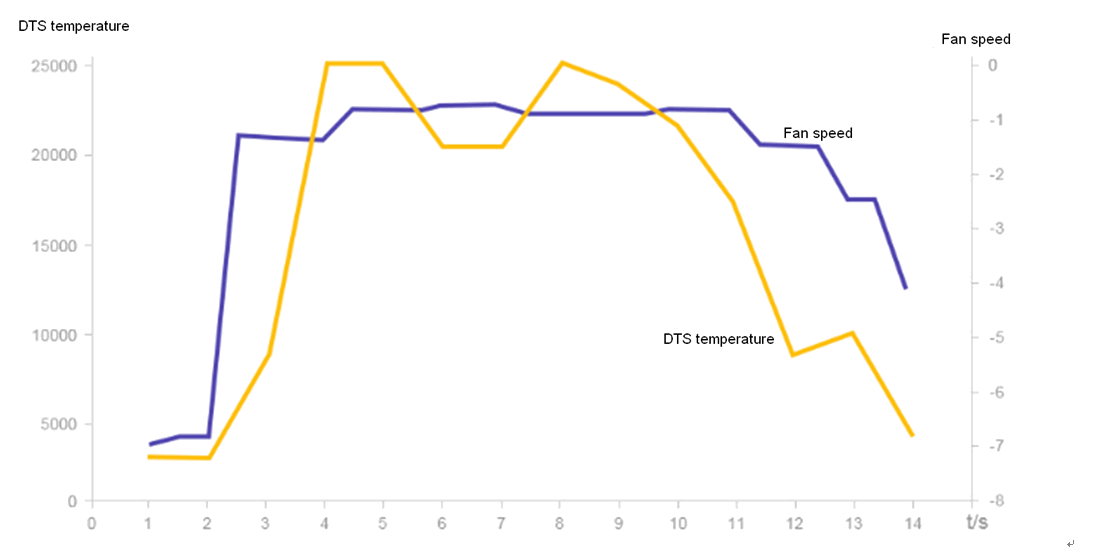
Fan speed mode
Users can configure fan speed control settings according to different scenarios. The system supports manual setting of fixed fan speed, automatic speed control based on load and cooling conditions, and setting of fan speed modes as needed.
· Silent—Enables the fans to run at the lowest speed required by heat dissipation of the server. This mode is suitable for scenarios with high noise requirements.
· Balanced—Enables the fans to run at a higher speed to provide balanced noise control and cooling performance.
· Powerful—Enables the fans to run at the highest possible speed. This mode is suitable for scenarios where the server requires high cooling performance. For example, the server is busy and key components, such as processors, are heavily loaded, or the ambient temperature changes frequently.
· Custom—Specifies a customized fan speed level in the range of 1 to 20. A higher level represents a higher speed and larger noise.
Performance optimization
The default BIOS settings on the server achieve a balance between performance and energy efficiency. These settings can be adjusted to match specific application workloads, helping customers improve application performance. This feature is supported only on Intel models, and some functions are license-controlled.
Performance configuration
BIOS configuration profiles are a collection of BIOS configuration options to adapt to expected server applications. HDM provides more than 10 BIOS configuration profiles to help users deploy BIOS settings that are most suitable for their own application scenarios.
Figure 104 Performance configuration
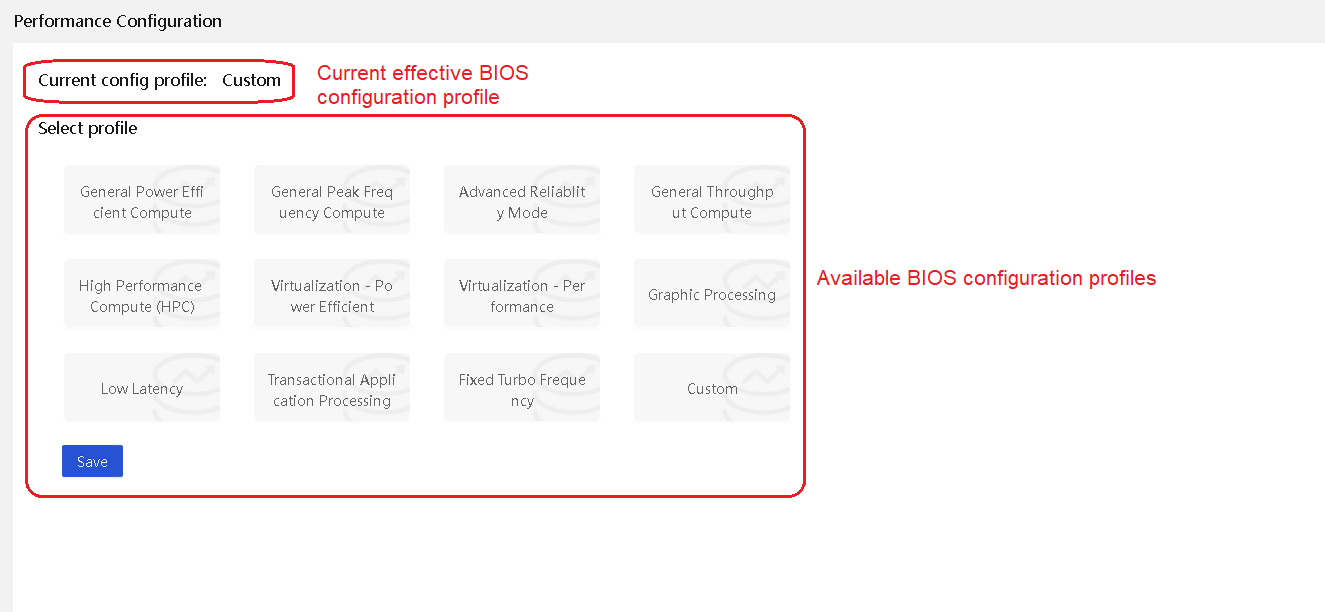
HDM provides the following BIOS configuration profiles to assist users in setting the BIOS based on workload-specific configuration profiles. When the configuration profile matches the deployed workload, the performance can be higher than just using the BIOS default values.
· General Power Efficient Compute
Applicable to most applications and focuses more on power-saving. This profile enables processors to operate in power-saving status and processor chips to enter sleep mode and disables virtualization configuration. It is a common power-saving configuration.
· General Peak Frequency Compute
Applicable to scenarios that require processors or memory to support workloads. It enables the maximum frequency on a single core. By disabling power-saving and virtualization configuration, this profile enables processor cores to operate in C0/C1 active status.
· Advanced Reliability Mode
Improves maintainability by adopting performance polices to reduce waiting time caused by wake-up and decrease the system's response time when errors occur. As a best practice, use X4 memory and enable ADDDC Sparing. ADDDC function is not supported when X8 granular memory is configured.
· General Throughput Compute
Suitable for scenarios that require continuous maximum workload throughput. This profile enables processors to operate continuously across all available cores at the maximum usage. It improves the average access speed to LLC by enabling SNC. Access to some workloads via Non Uniform Memory Access (NUMA) improves performance and enables optimal throughput.
· High Performance Compute
Applicable to scenarios that require high-performance configuration. Typically used in cluster environments, where each node operates at maximum efficiency to address large-scale workloads. This profile disables support for virtualization IO when virtualization is not deployed on the server and disables power-saving related settings.
· Virtualization-Power Efficient
Applicable to virtualization scenarios that give priority to power saving. This profile enables all available virtual options and allows processor chips to enter sleep mode.
· Virtualization Performance
Applicable to virtualization scenarios that have high performance requirements. This profile enables all virtualization-related options to support virtualization, and allows the system to operate at a higher frequency by disabling power-saving options to obtain a higher speed.
· Graphic Processing
Applicable to GPU servers. GPUs typically rely on the maximum bandwidth between I/O and memory. This profile disables power management functions that affect the link between I/O and memory and disables virtualization to ensure peer-to-peer communication.
· Low Latency
Suitable for applications that require the minimum compute latency. To reduce overall compute latency, this profile disables power management and other management features that might cause compute latency by sacrificing the maximum running speed and throughput.
· Transactional Application Processing
Applicable to service application scenarios such as database systems. It can balance peak frequency and throughput requirements.
· Fixed Turbo Frequency
Applicable to scenarios where fixed turbo frequency is used. This profile is implemented in an out-of-band manner. The OS does not participate in frequency adjustment.
· AI Optimized
Applicable to scenarios involving artificial intelligence inference or training on a large amount of computing resources. This profile boosts server performance for artificial intelligence inference or training application scenarios by locking the CPU at its highest performance level..
· Custom
Uses the BIOS default settings. Users can modify option settings according to their own needs.
Performance consultant
Adjusting BIOS settings based on server resource usage to improve workload performance is often not intuitive and costly. To resolve this issue, HDM provides the performance consultant feature. Performance consultant monitors a number of important server performance indicators and provides recommended workload profiles.
The recommended workload profiles are based on the actual server resources used for the workloads. This feature relies on the performance configuration and allows users to customize settings further.
Performance consultant uses a multi-stage approach to analyze system behaviors during workload operation.
· Performance consultant maps the workloads to a set of usage or behavioral characteristics reports by analyzing performance monitoring indicators. These characteristics might be simple (such as high memory usage) but are the starting point for identifying potential resource usage bottlenecks.
· Use of the BIOS profile recommended by performance consultant can produce more ideal effects.
Performance consultant enables users to understand the characteristics of their workloads, and then recommends configuration profiles based on the characteristics of the workloads.
Figure 105 Recommending profiles for the workload
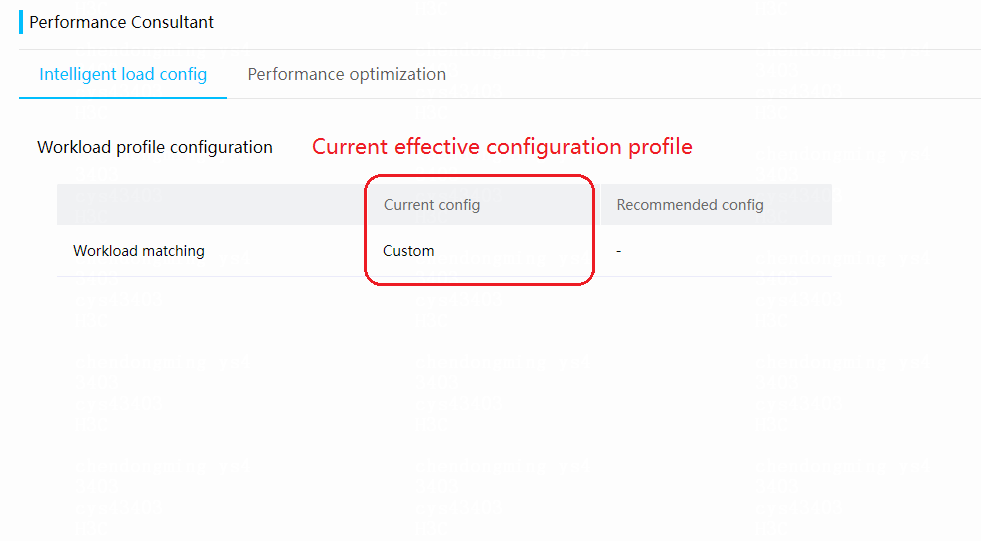
Remote control
KVM
KVM allows you to monitor and control remote devices in real time by using the local client. You can operate remote devices through KVM.
Figure 106 KVM diagram
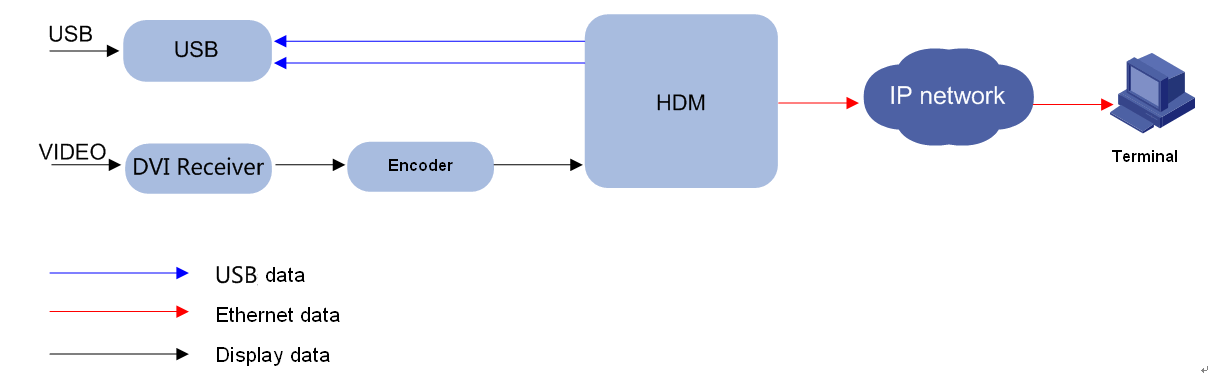
H5 KVM
Compared with KVM, H5 KVM does not require any plug-ins. You can access the H5 KVM remote console over HTTPS to manage the server remotely. H5 KVM supports dual CD image mounting.
HDM supports access to H5 KVM by entering IP address, username, and password in the format of https://ip_addr/viewer.html?u=user_name&p=user_passord in the address bar of a browser.
Figure 107 Example of direct access to H5 KVM
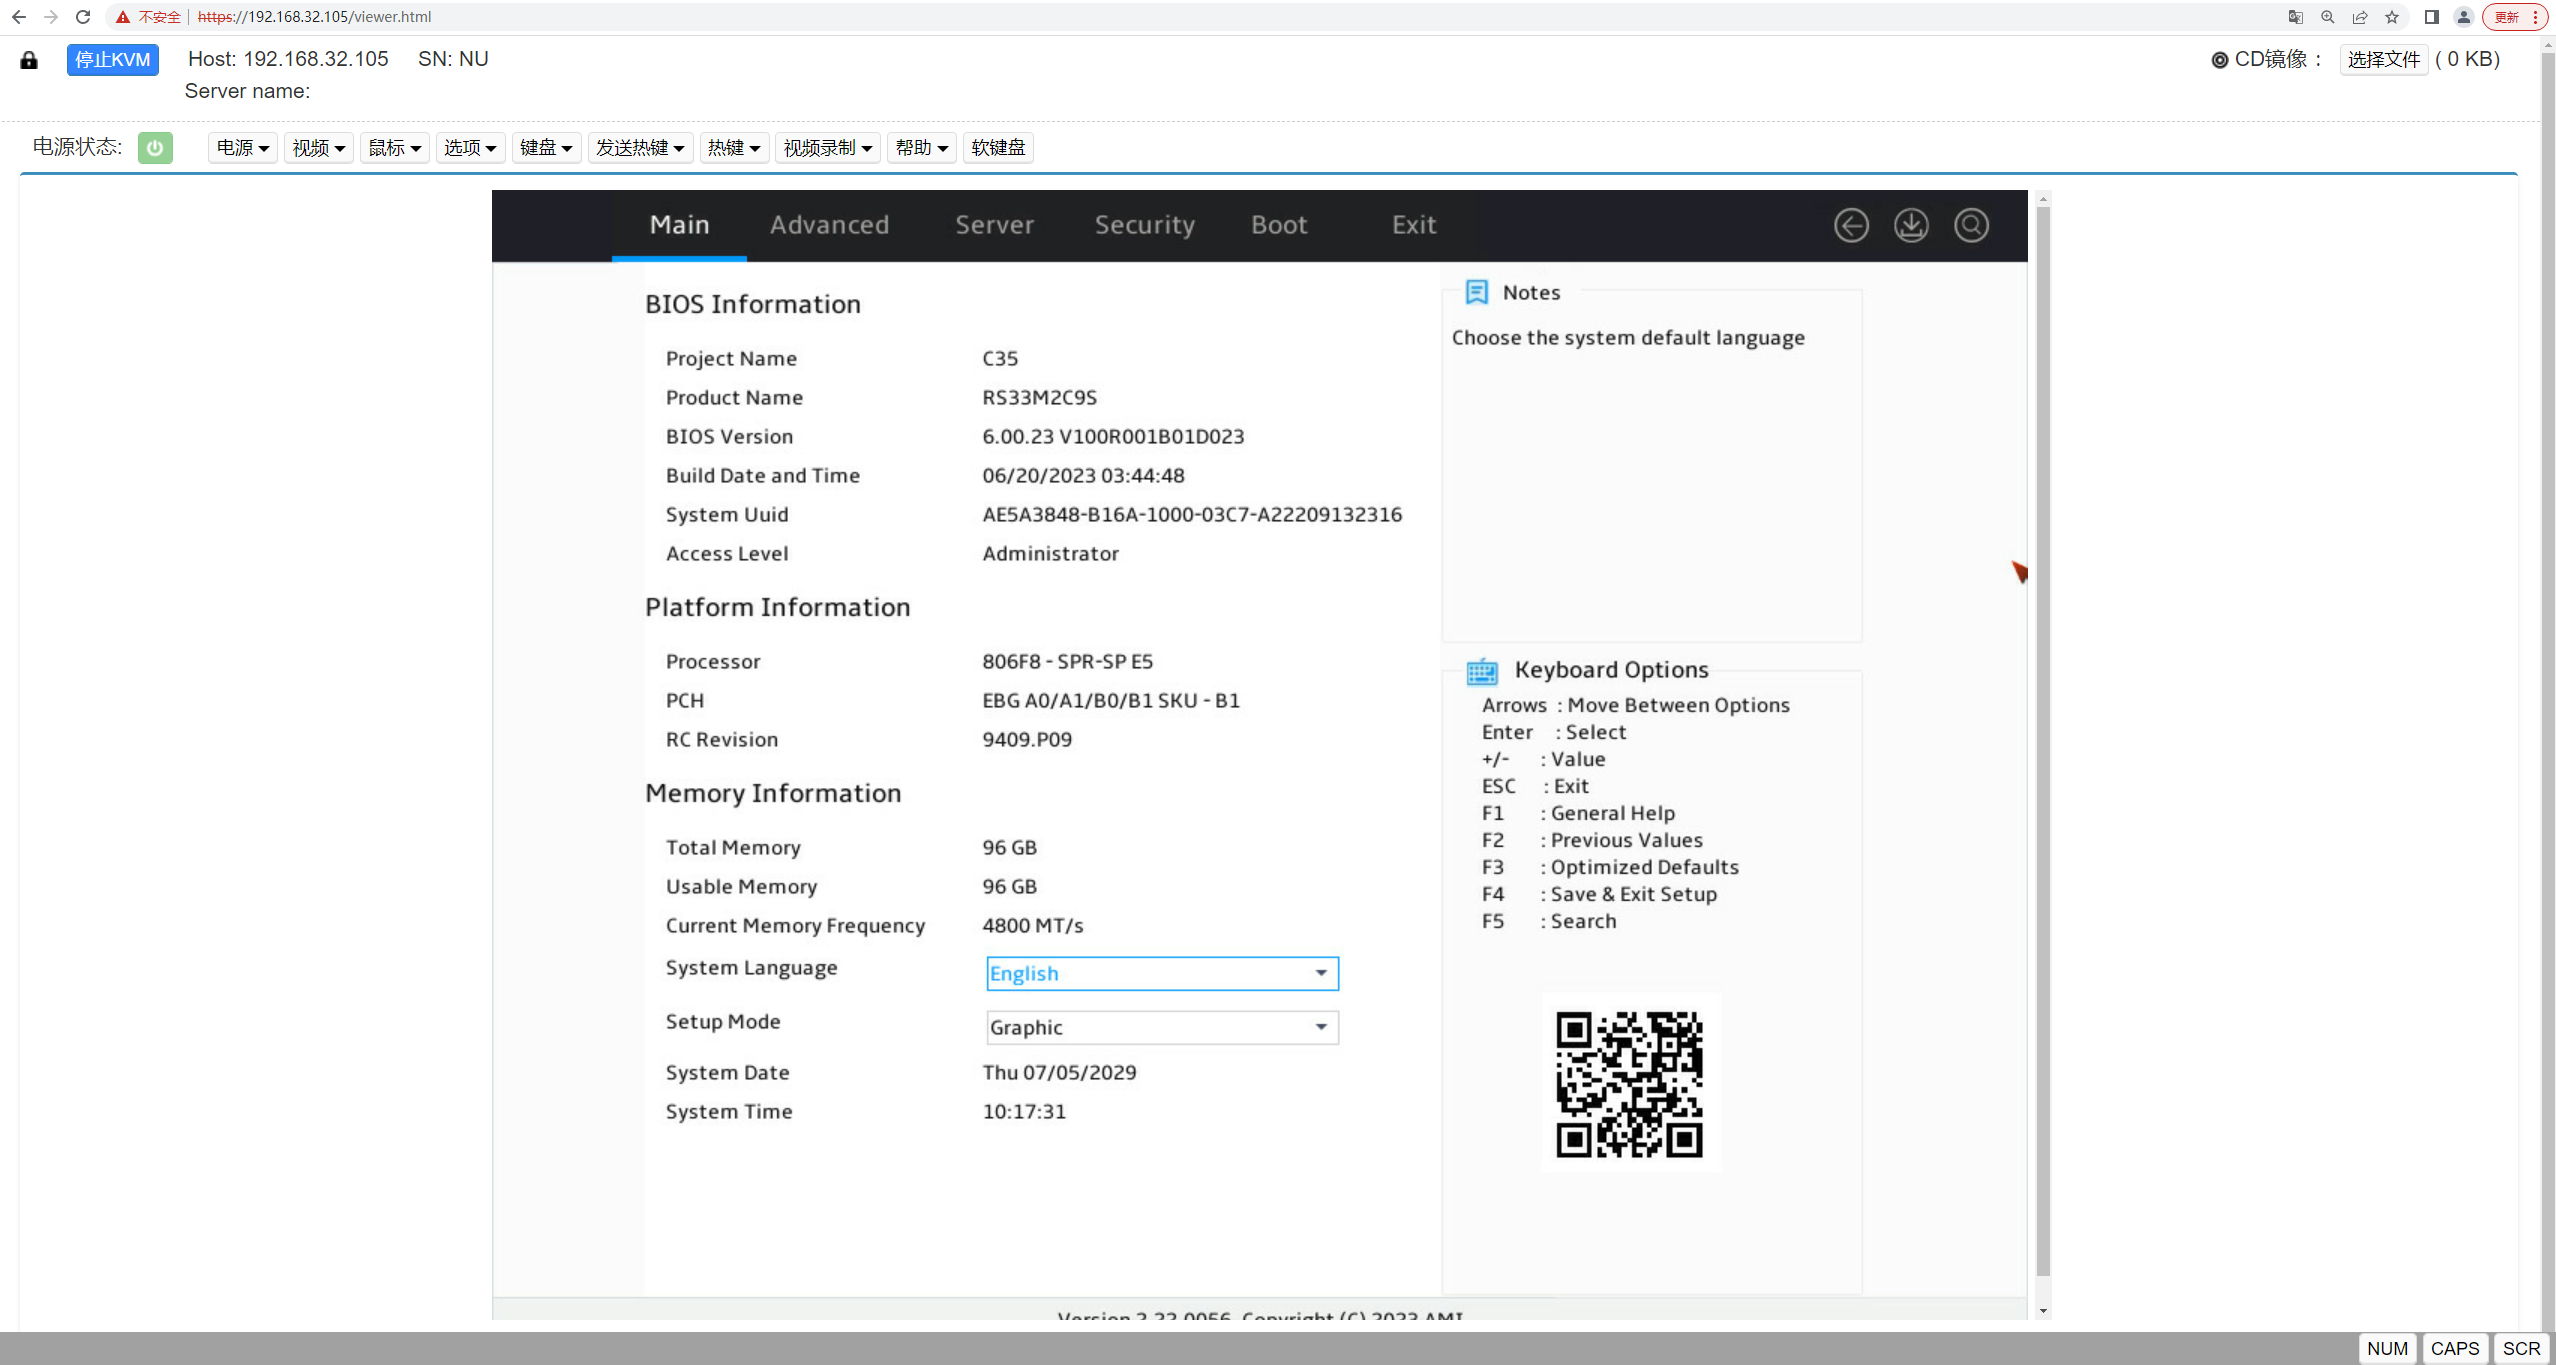
KVM launch mode
The following KVM launch modes are available. To enable or disable KVM, navigate to the Remote Services > Services page.
· Dedicated mode—A dedicated mode allows for only one remote console session and grants the user with the full access permission.
· Shared mode—A shared mode allows for a primary session and multiple secondary sessions. If you are the primary user, the system assigns you with the full access permission. If you are a secondary user, you have only the read-only permission and can only view videos, take screenshots, and record videos.
Figure 108 Selecting a KVM launch mode
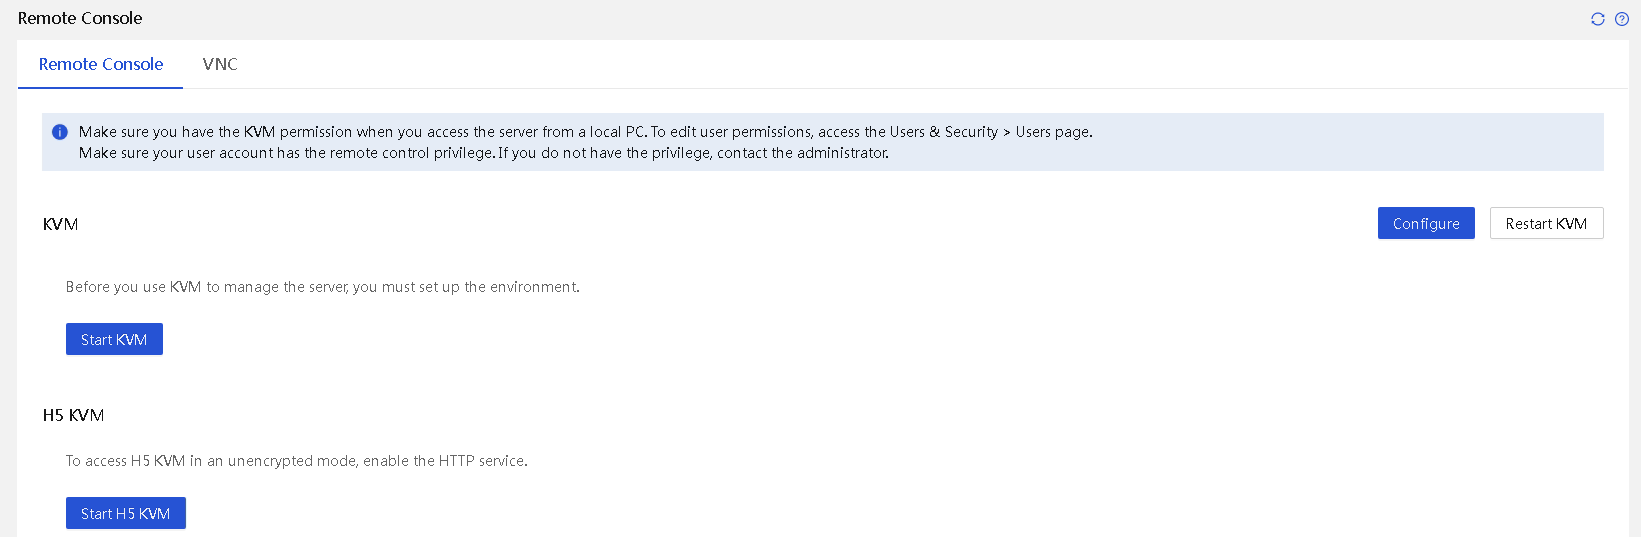
To change the KVM enabling status, navigate to the Remote Services > Services page. If you enable KVM, you can also select the KVM port.
· Secure service port: To enhance data transmission security, enable the encryption mode after you select this option to ensure secure communication between the client and server.
· Insecure service port: To improve timeliness of data transmission, disable the encryption mode after you select this option to facilitate large-volume data transmission.
Figure 109 Editing the KVM service
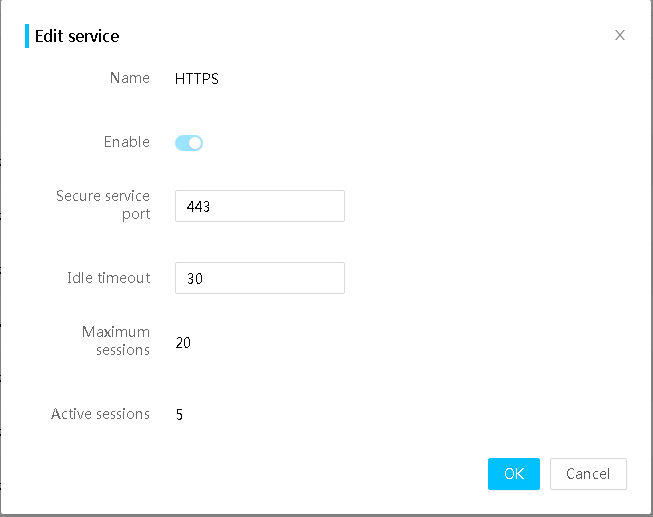
Virtual media
The virtual media feature allows you to use a virtual USB DVD-ROM drive or a floppy drive to remotely access the local media over the network. The local media might be the DVD-ROM drive, floppy drive, DVD-ROM image file, floppy drive image file, or hard drive folder. The virtual media data can be encrypted by using the aes128-cbc encryption algorithm. To use virtual media is to virtualize the media devices on the local client to the media devices on the remote server over the network.
The following virtual storage media are available:
· CD/DVD drives.
· ISO files and IMG files.
· Virtual folders mounted to the server from the local PC.
· USB keys.
Screen capture from KVM
You can capture the screenshots of a KVM remote console, and save the screenshots in .jpeg format to the local PC.
Figure 110 Capturing the screenshots
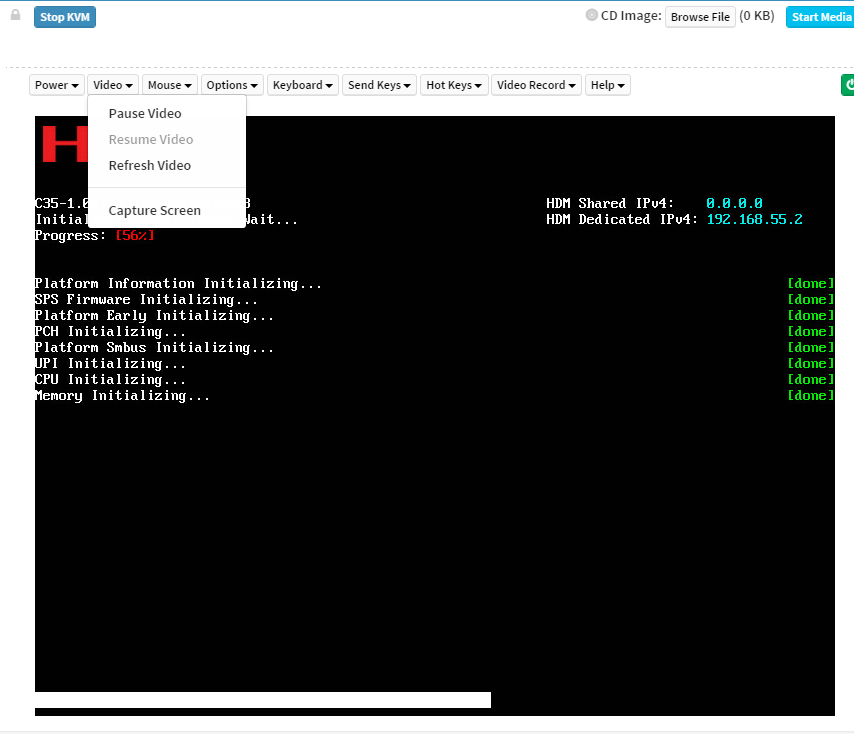
Video recording from KVM
You can record videos on the KVM remote console, and save the screenshots in .avi format on the local PC. The videos can record virtual KVM operations to ensure security or meet other special requirements. When video recording is enabled, the KVM remote console automatically records all information displayed on the screen and all operations that have been performed to a self-defined video file. You can play the videos by using the local player.
Figure 111 Configuring video recording from KVM
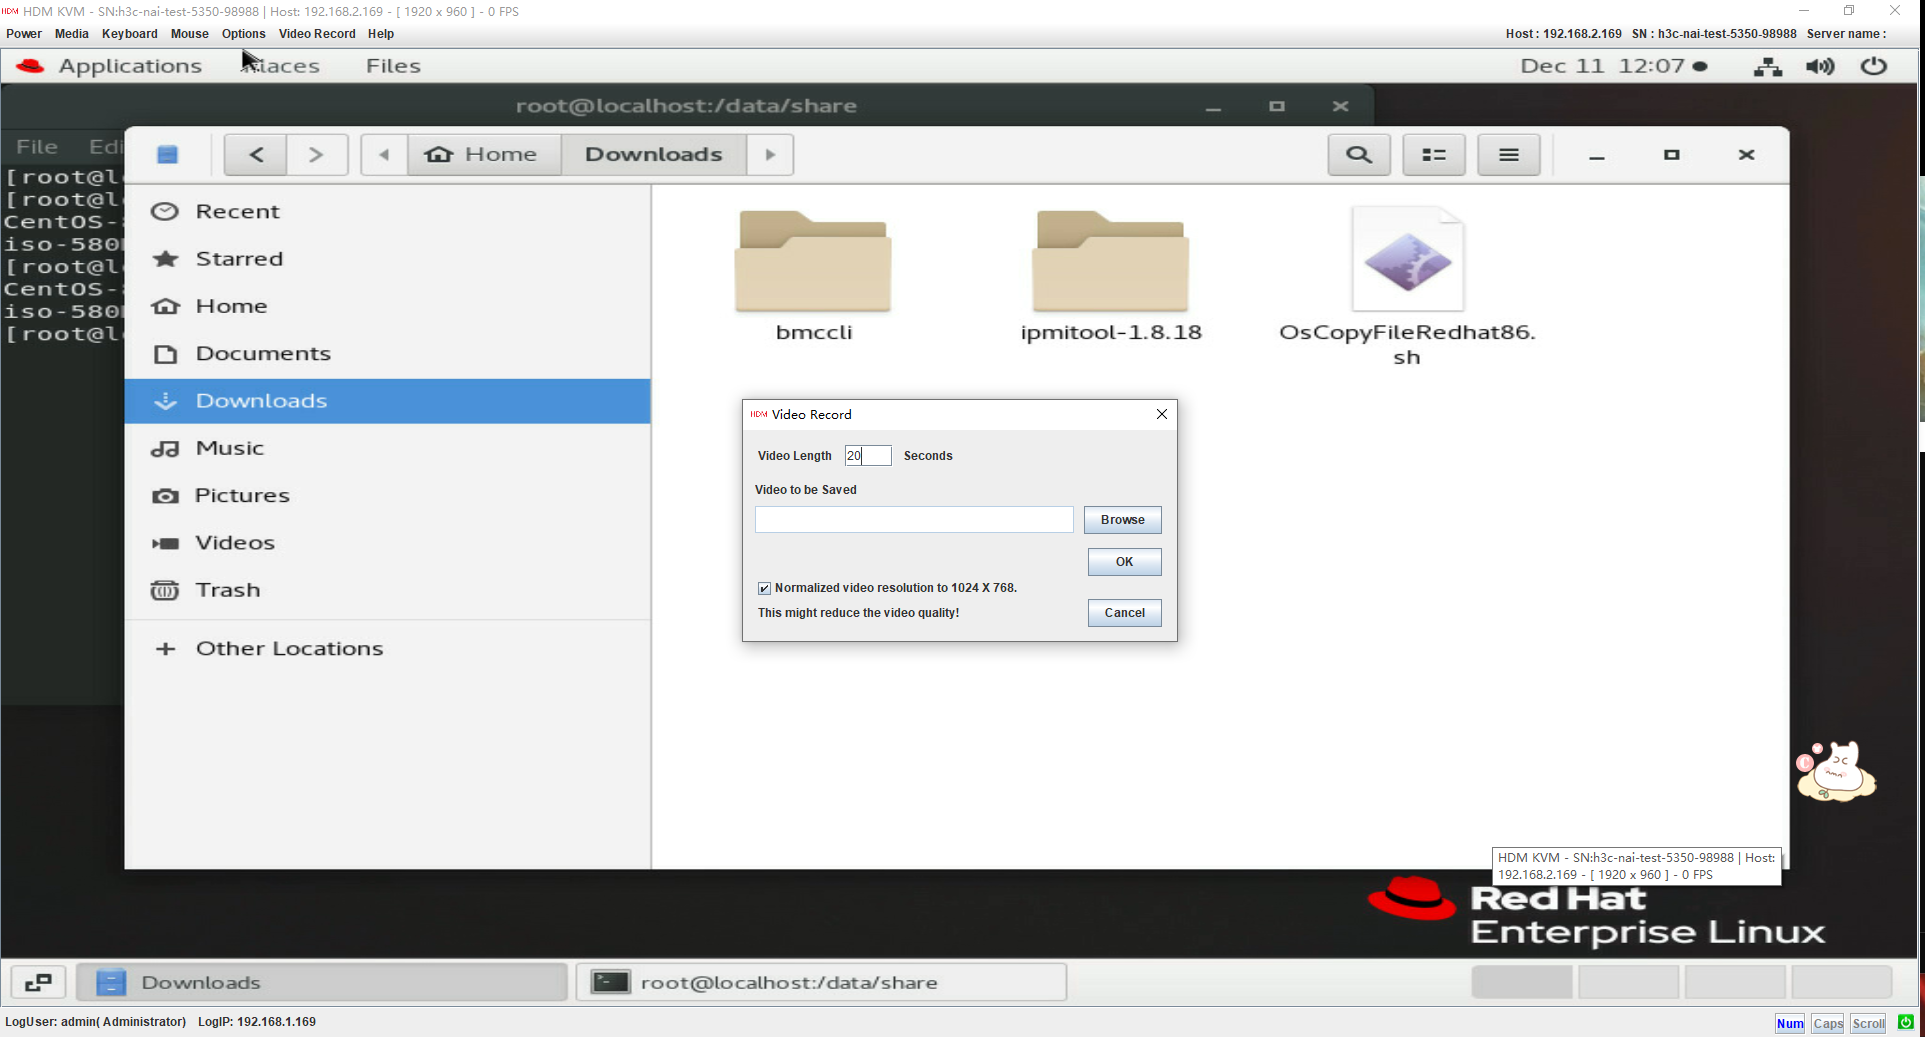
Hardware support
Differential frames and hardware cursors are supported to enhance KVM transmission performance.
VNC
About VNC
Virtual Network Console (VNC) transmits the original images of the server to the client. VNC allows you to access and manage the server from a local PC without logging in to HDM.
A VNC system includes a VNC server, a VNC client, and the VNC protocol:
· VNC server—Runs on the HDM side to capture and share the server screen, and has no relation with the operating system running status.
· VNC client—Also VNC viewer. The VNC client is installed on the local PC and connects remotely to the VNC server. The third-party VNC client can be RealVNC, TightVNC, or NoVNC.
HDM supports both IPv4 and IPv6 VNC sessions.
VNC session modes
HDM supports a maximum of two concurrent VNC sessions, and the following session modes are available:
· Shared mode—Supports a maximum of two concurrent VNC sessions. Both sessions have access to the mouse and keyboard and have the control of the server's OS.
· Exclusive mode—Supports only one VNC session. If a session in shared mode is connected, and you try to establish a session in exclusive mode, the session in the shared mode will be forcibly disconnected. If a VNC session already exists, the subsequent requests for another VNC session will be refused.
The session mode used in a VNC system is determined by the VNC client.
Viewing VNC sessions
You can view the VNC session from the Remote Services > Services page of HDM. The IP address for the VNC session is the IP address of the VNC client. Both IPv4 and IPv6 addresses are supported by the VNC client.
Figure 112 VNC session information
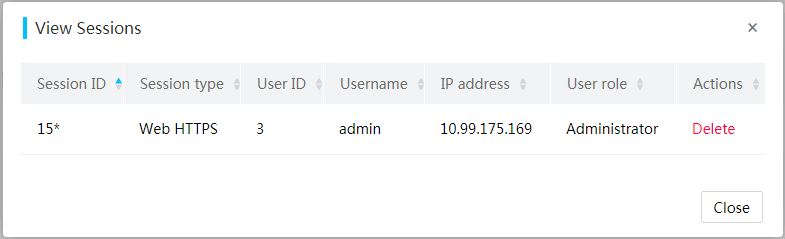
Configuring VNC
This feature allows you to enable or disable password complexity check. If password complexity check is enabled, a password must be 8 characters in length. If password complexity check is disabled, a password must be 1 to 8 characters in length.
Figure 113 VNC settings
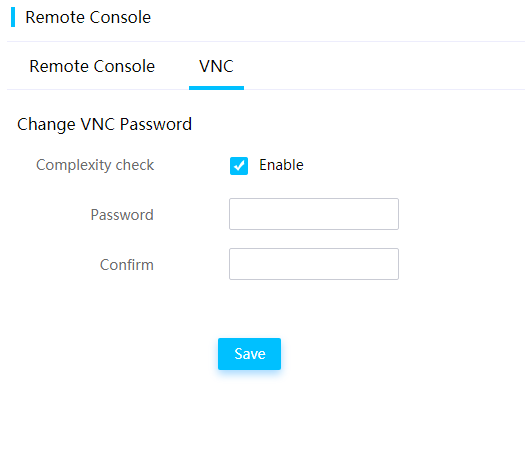
JViewer client
The JViewer client can access and control the server without the need to log into the HDM. This client is compatible with both Windows and Linux operating systems, and it retains server connection settings for future user logins. To ensure security, the password in the configuration is saved after being processed using the SM4 national encryption algorithm.
Figure 114 JViewer client
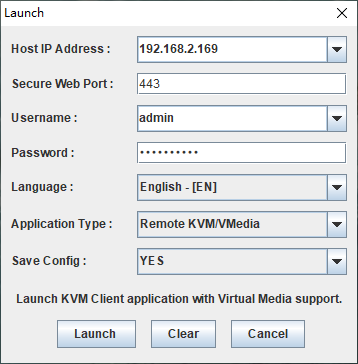
Security management
HDM not only provides operational convenience but also secures the system through a series of security technologies, ensuring the secure operation of servers. The safe operation of servers is critical for the secure operation of the entire data center. HDM's security technologies include software security, firmware security, interface security, and sensitive data security.
Figure 115 HDM security technologies
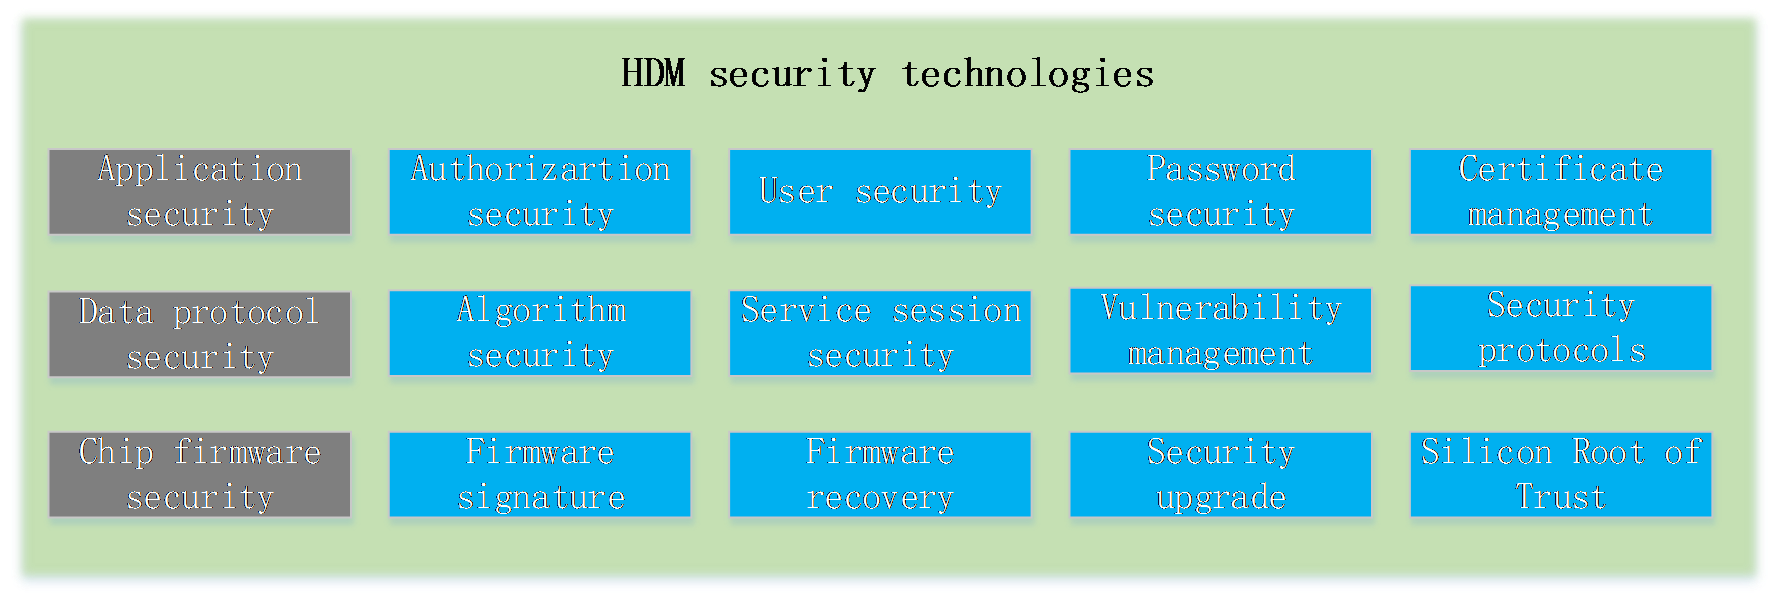
Security mechanism
The server's out-of-band management firmware supports the following security mechanisms:
Log management
For all user access, the system will log all information for subsequent management and analysis by administrators. Log management is the information hub of the device, receiving logs generated by various modules. It can output the received logs to the console, monitoring terminals, and log hosts according to modules and levels. This provides strong support for administrators to monitor device operations and diagnose network faults, ensuring the safe operation and log tracking of the TOE.
Certificate and key management
HDM supports SSL certificate encryption and certificate replacement. You can replace a certificate on the webpage.
As a best practice to improve security, use your own certificate and public-private key pair, and update the certificate promptly to ensure its validity.
HDM also supports the import of LDAP certificates and provides authentication encryption for data transmission, which enhances system security.
Protocol and data transmission security
To prevent protocol and port attacks, HDM opens the minimum number of network service ports. It closes network service ports that are not in use, and closes network service ports for debugging when the services are officially in use. Ports for unsafe protocols are closed by default.
HDM supports KVM encryption for secure data transmission when using a remote console. It also supports encryption for virtual media data transmission, ensuring data transmission security. It uses NCSI to isolate the management plane from the service plane for servers. HDM can share the same NIC with the service plane through the NCSI out-of-band network port feature. On the physical layer, the management plane and the service plane share interfaces. On the software layer, the management plane and the service plane are isolated by VLANs and are invisible to each other.
Access control and user authentication
HDM implements login control based on scenarios, controlling server management interface’ access to the minimum scope in terms of the time, location (IP/MAC), and user. HDM also controls login based on the Web interface. You can set up an allowlist with login rules as needed, supporting a maximum of three login rules. Once a login rule is matched, the login is permitted. HDM ensures account security through features such as password complexity, weak password dictionary, maximum password validity, minimum password validity, inactivity limit, emergency login user, disabling history passwords, and account lockout threshold.
Exception handling
The system conducts intelligent diagnostics for devices throughout their entire lifecycle, mainly including fault data collection, real-time fault analysis, fault prediction and warning, and presenting the results of analysis and prediction. Furthermore, based on the settings of the network management system, HDM will actively send traps to inform system administrators for proactive prevention.
Periodic self-inspection
The system periodically inspects components such as the CPU, memory, and hard drives of the TOE, and responds in real time to alarms that exceed the thresholds. It also supports server statistics collection and visualization, and multi-dimensional threshold control for hardware security and performance adjustment.
Security standards supported by HDM
The standards formulated with the participation of HDM are as shown in Table 9.
Table 9 Standards with the participation of HDM
|
ID |
Title |
Standards |
|
1 |
Information security technology—Technique requirements and evaluation criteria for server security |
China National Standards - GB/T 39680-2020 |
|
2 |
Technique requirements for green computing server trust |
Industry Standards - GCC 1001-2020 |
|
3 |
Technique requirements for green computing server baseboard management controller (BMC) |
Industry Standards - GCC 3002-2020 |
|
4 |
General detection method for network key device security |
Group Standards - T/TAF 088-2021 |
Certifications obtained by HDM include:
· Evaluation Assurance Level (EAL) 4 certificate
· Software copyright certificate
· China Telecommunication Technology Labs (CTTL) certificate
HDM has obtained the strictest standard certificate of the China Cybersecurity Review Technology and Certification Center (CCRC), the highest EAL 4 certificate. In the certification process, CCRC adopted a type test + factory inspection + post-certification supervision model, not only verifying the security and reliability of H3C HDM, but also ensuring the full process stability and reliability of software products through factory inspection and post-certification supervision. This makes HDM a trustworthy and reliable server remote management system for users.
Chassis intrusion detection
When the server's unboxing detection module triggers the unboxing signal, the software receives the signal sent by the hardware GPIO pin, triggering a software interrupt, and then determines whether the current signal is an unboxing or a boxing signal. When the unboxing or boxing signal is confirmed, the HDM generates an event log via the sensor.
Figure 116 Unboxing detection module

Hardware encryption
HDM's SOC chip supports a hardware security acceleration module, which internally supports hardware data encryption through the use of a HACE encryption engine. By replacing software encryption with hardware encryption, HDM can avoid complicated encryption operations, enhancing the encryption efficiency.
This feature is mainly used in authentication, data encryption and decryption, and other security applications to implement AES, DES, 3DES, RC4, MD5, SHA1, SHA224, SHA256, HMAC-MD5, HMAC-SHA1, HMAC-SHA224, and HMAC-SHA256 algorithms.
Silicon root of trust
Intel PFR provides firmware protection, detection, and recovery features, enhancing system security and reliability. The mechanism is to place the root of trust on the PFR CPLD of the Intel processor and platform, using this silicon root of trust to verify and recover HDM-Uboot. Then, HDM-Uboot will further verify and recover HDM firmware, thus achieving security and trust for the entire system. The mechanism is illustrated as shown in Figure 117.
Figure 117 Mechanism of silicon root of trust
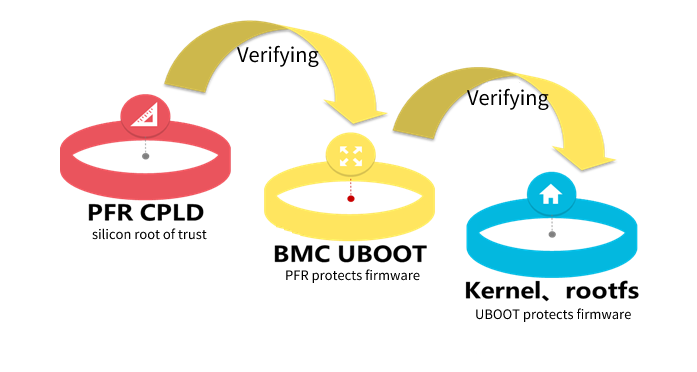
After the PFR firmware protection feature is enabled, PFR will verify the firmware image file when HDM starts up.
· If the primary image passes verification, HDM will directly boot from the primary image.
· After you enable boot from backup image upon verification failure, if HDM detects firmware damage in the primary image, it will verify the backup image. Once the backup image passes verification, HDM will boot from the backup image.
· If both the primary and backup images are detected to be corrupted, and the corruption in the primary image does not affect the normal startup, HDM will still boot from the primary image.
· If the primary image is detected to be corrupted and affects normal startup, and the boot from backup image upon verification failure is disabled, HDM will be unable to start.
Figure 118 PFR firmware protection
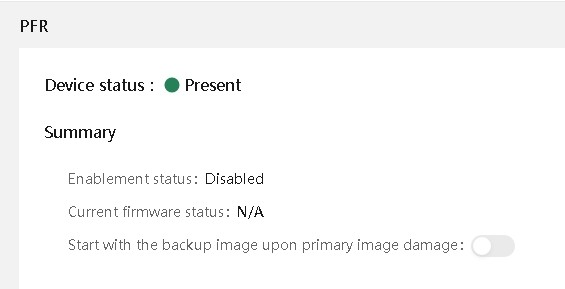
Firmware security
Firmware startup security
1. Dual-image backup
For critical firmware, such as the Flash area where the HDM image is stored, a dual-image setup is used. If a Flash misoperation or storage block damage occurs during operation, HDM can switch to the backup image.
2. Abnormal firmware recovery
For critical firmware, both HDM and BIOS images support abnormal recovery mechanisms. When HDM experiences an abnormal restart or incomplete startup during operation in the primary image, it actively switches to the Golden Image to restore the primary image and then switch back. When detecting a power-up timeout or incomplete startup of the BIOS, HDM actively restores the BIOS firmware image and powers on the BIOS again.
Firmware update security
1. Firmware signature encryption
All externally released HDM and BIOS firmware versions come with a signature mechanism. During firmware packaging, the firmware is summarized by using the SHA256 algorithm and is encrypted with RSA2048. During firmware upgrade, tampering is prevented through signature verification, and only firmware that meets signature requirements is allowed to be upgraded to the device.
2. Restoration of upgrade tasks upon restart
HDM supports restoration of a firmware upgrade task upon abnormal restart. This mechanism ensures that the upgrade process will not be interrupted due to a machine abnormal power-down or HDM abnormal restart. After HDM restarts, it will continue to execute the component upgrade tasks that were not completed before the restart.
Firmware running security
During system operation, the area where the image is located is write-protected and requires a special method to carry out write operations. Simultaneously, the integrity of the image file is checked every time the host starts, and recovery is performed when necessary.
Link security
HTTPS links
HDM offers a Web-based visual management interface, which can be accessed via HTTPS to ensure that data accessed through HDM cannot be spied on. HDM currently supports TLSv1.0, TLSv1.1, and TLSv1.2. The supported security algorithm suites include:
· RSA_WITH_AES_128_CBC_SHA256.
· RSA_WITH_AES_256_CBC_SHA256.
· RSA_WITH_CAMELLIA_256_CBC_SHA.
· RSA_WITH_AES_128_GCM_SHA256.
· RSA_WITH_AES_256_GCM_SHA384.
Due to the security risks of TLSv1.1 and below, HDM's HTTPS links use the TLSv1.2 secure transmission protocol by default.
Virtual KVM
To ensure that the information of the server connected to by the user is not leaked on the link, and that the information of the interaction process is not monitored, data are encrypted when being transmitted through the KVM link channel with the secure port enabled.
At the same time, in the H5 KVM mode, the single port authentication feature is supported. The functions related to virtual KVM and virtual media are exported through the web service interface, which can reduce the open web interfaces to minimize security risks.
Virtual media
To ensure secure access to virtual media and prevent data from being intercepted on the link, data is transmitted encrypted through a secure port.
VNC
When a session is established between the VNC client and VNC server, the IP address (IPv4/IPv6) of the remote computer and the VNC password are required. The server sends a 16-byte random code to the client, and the client encrypts this random string using the VNC password as a key with DES encryption and sends it to the server for verification. During the ongoing access, the decision to encrypt the data in the link can be made based on the selected connection type.
In certain versions, you can choose the following types of VNC secure connections as needed:
· VNC over SSH. (Data is transmitted through an SSH channel.)
· VNC over stunnel. (Data is transmitted through a TLS/SSL channel established by stunnel.)
SMTP alert emails
TLS-encrypted transmission ensures the confidentiality and integrity of alert emails sent via SMTP.
Syslog alerts
To ensure the security and trustworthiness of traffic between devices and the syslog server, TLS one-way authentication and TLS two-way authentication are supported during data transmission. This provides an additional layer of security for users logging into the syslog organization's network or application and can also authenticate device connections that do not follow the login process.
SDS logs
To prevent the leakage of sensitive information during the packaging of SDS logs, encryption is performed on contents such as fault diagnosis logs, boot logs, periodic collected statistics (such as temperature sensing, and power), and internal debugging logs. The SDSViewer installed with the license is required for viewing the logs.
Firewall
HDM provides the firewall feature to achieve scenario-based login management. This feature is applicable to Web, SSH, SNMP v1/v2c/v3, and IPMI LAN interface login control. HDM can control server management interface access in the minimum range from five dimensions: time, IP address and IP protocol version (IPv4/IPv6), MAC, port, and protocol (TCP/UDP). By setting firewall denylist and allowlist rules, HDM allows access from certain devices.
· Denylist rules deny access from certain devices in terms of the IP address, IP address range, and MAC address. You can set the validity period for denylist rules. Devices that do not match any denylist rules can access HDM. HDM supports a maximum of 20 denylist rules.
· Allowlist rules permit access from certain devices in terms of the IP address, IP address range, MAC address, and protocol (UDP/TCP). You can set the validity period for allowlist rules. After you configure allowlist rules, devices that do not match allowlist rules cannot access HDM. HDM supports a maximum of 20 allowlist rules.
Figure 119 Firewall information
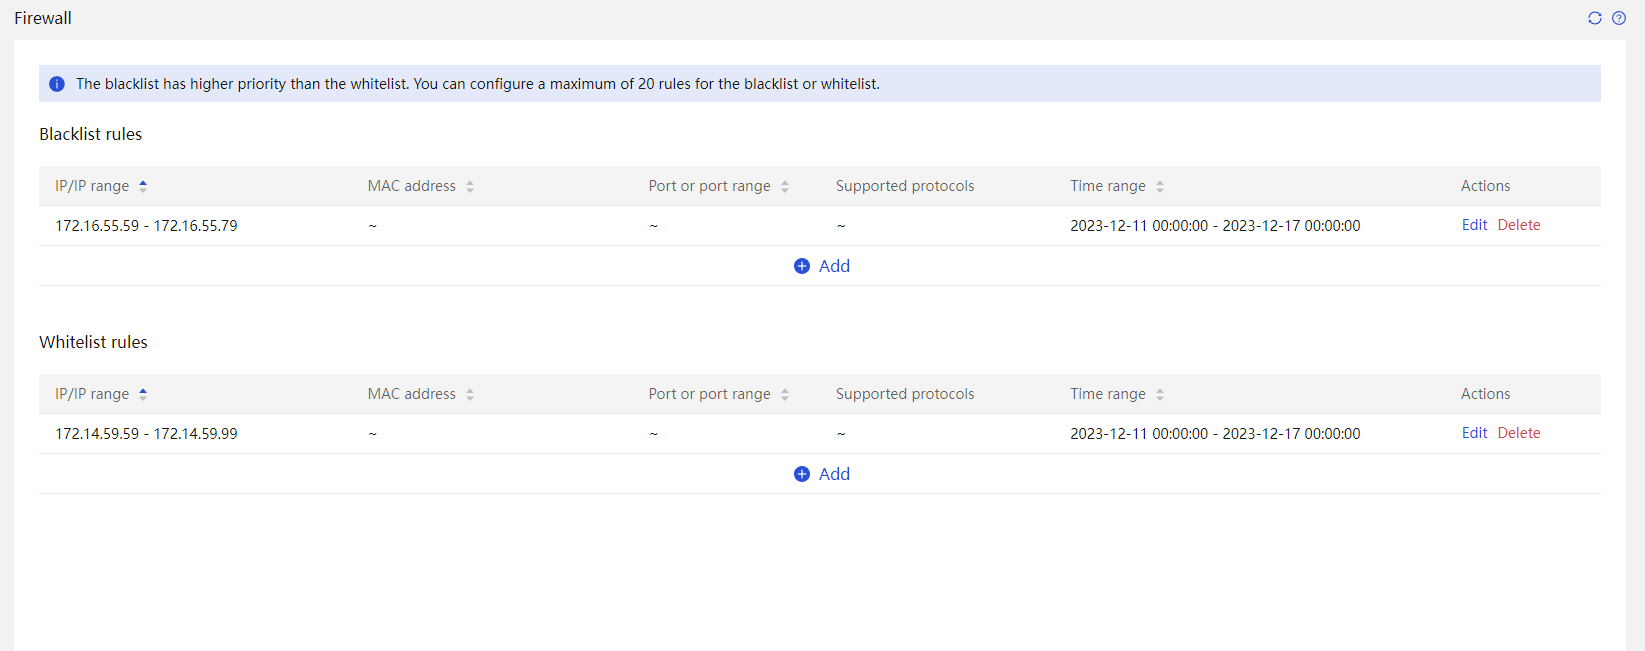
You can configure a user login allowlist as needed. Once a login rule is matched, the login is permitted. The login rules apply to all local users and LDAP user groups.
The denylist has a higher priority than the allowlist. If the IP address of the device is both in the denylist and allowlist, the access is denied.
Service management
To meet customers' service and security requirements, HDM provides switches to control the availability of service ports. The services supported by HDM for viewing and modification include CD-Media, FD-Media, HD-Media, IPMI, KVM, SSDP, ASD (Remote_XDP)|iHDT, SNMP, SSH, Telnet, VNC, and Web.
Figure 120 HDM service information
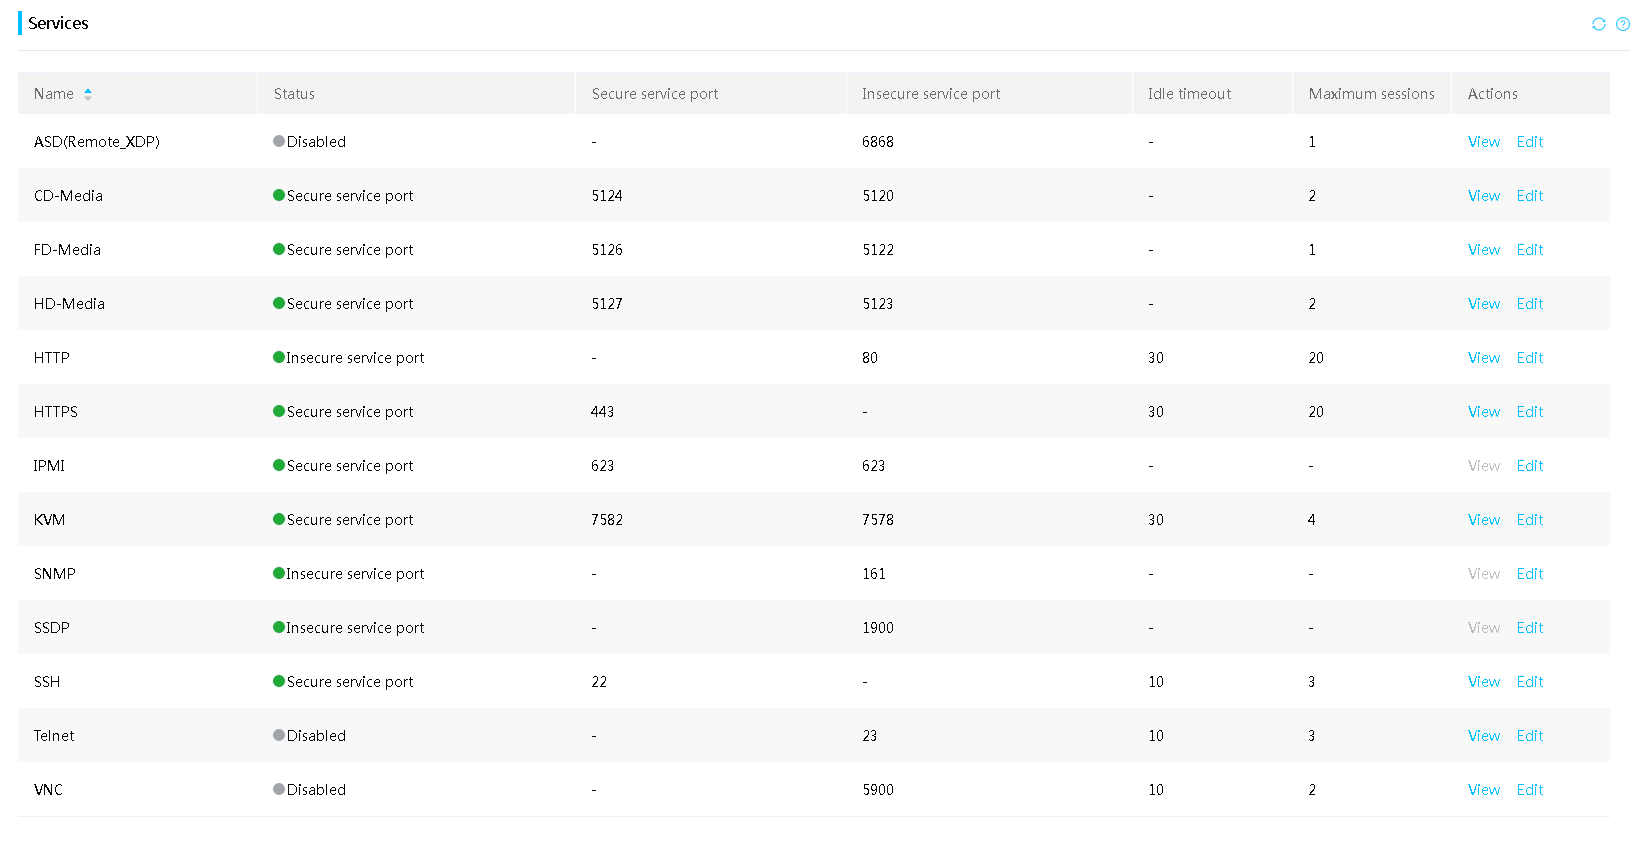
SSL certificate management
Secure Sockets Layer (SSL) is a protocol for securely transmitting private data over the Internet by using TCP-based application layer protocols, such as HTTP. It uses keys to encrypt and decrypt data. Using SSL, the Web server and client can have secure data transmission by verifying the identity of the data source and ensuring data integrity.
Figure 121 SSL certificate information
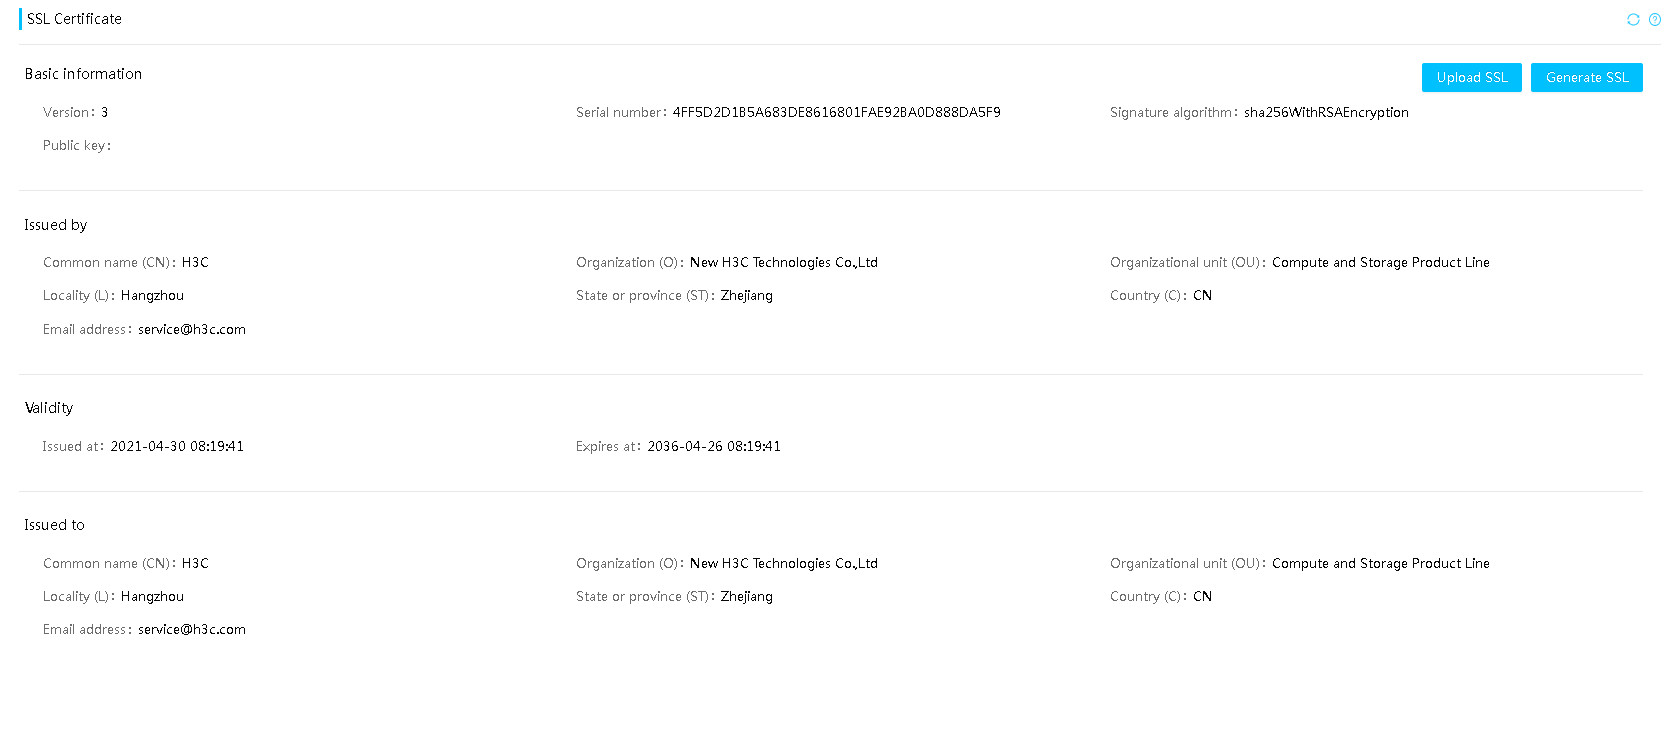
For SSL certificate management, HDM supports the following operations:
· View detailed information about the current SSL certificate, including the user, issuer, validity period, and serial number.
· Upload SSL certificate.
· Generate SSL certificate.
HDM comes with an SSL certificate. As a best practice to improve security, replace the default SSL certificate with your own certificate and public key pair.
SSH key pairs
SSH public key authentication is suitable for automated configuration tools. SSH public key authentication does not require password interaction, and the key length is long, making it difficult to guess. To enhance security, disable password authentication for SSH after enabling SSH public key authentication.
Figure 122 SSH secret key
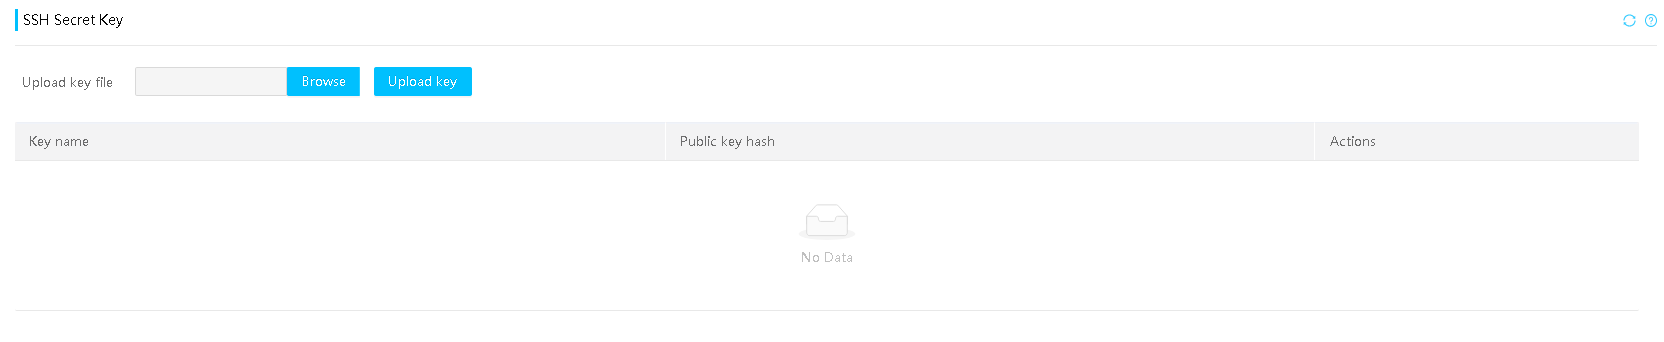
HDM supports uploading an SSH secret key and binding the SSH secret key to a local user for HDM login. At access attempts, you must also enter the password for the key if a password is specified during key generation on the BMC CLI client. If no password is specified, you can directly log in to the BMC CLI. In the current software version, RSA, ECDSA, and ED25519 keys are supported. The length of an SSH key varies by key format as follows:
· For RSA SSH keys, the length can be 1024, 2048, or 4096 bytes.
· For ECDSA SSH keys, the length can be 256, 384, or 521 bytes.
· For ED25519 SSH keys, the length can only be 256 bytes.
Account security
Account security includes password complexity check, maximum password validity, disabling history passwords, account lockout threshold, account lockout duration, and weak password check. Access the Users & Security > Users > Settings page to configure password policies.
· Complexity check: If this feature is enabled, passwords must meet the following complexity requirements:
¡ 8 to 40 characters in length. Case sensitive. Valid characters are letters, digits, spaces, and the following special characters: ` ~ ! @ # $ % ^ & * ( ) _ + - = [ ] \ { } | ; ’ : ” , . / < > ?
¡ Must contain characters from at least two of the following categories: uppercase letters, lowercase letters, and digits.
¡ Must contain at least one space or special character.
¡ Cannot be identical to the username or the reverse of the username.
¡ Must meet the requirement set by the password history count parameter.
· Maximum password age: Maximum number of days that a password can be used. When a password is about to expire, HDM prompts the user to change the password.
· Password history count: Number of unique passwords that a user must create before an old password can be reused.
· Account lockout threshold: Number of consecutive login failures that will cause a user account to be locked.
· Account lockout duration: Amount of time before a locked account can be used again.
· Weak password check: Use the weak password dictionary to identify whether a user-configured password is a weak password. After this feature is enabled, a user-configured password cannot be in the weak password dictionary.
Figure 123 HDM password configuration interface
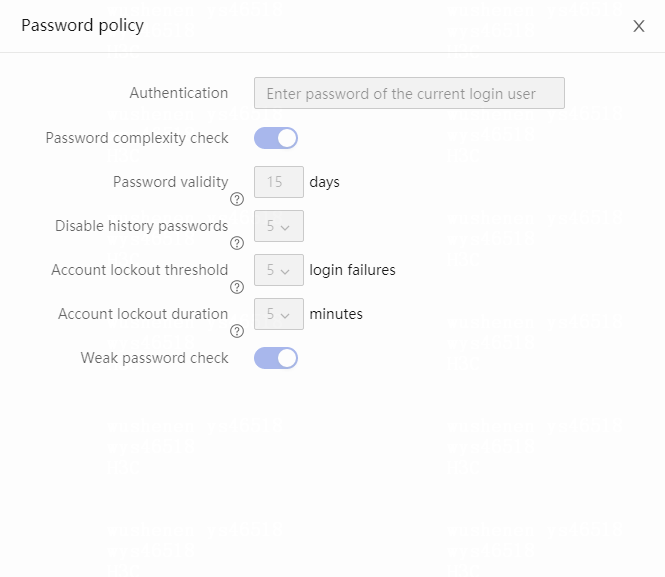
· Weak password dictionary management: You can import and export weak password dictionary. With complexity check and weak password check both enabled, a user-configured password cannot be in the weak password dictionary.
Figure 124 Weak password dictionary management
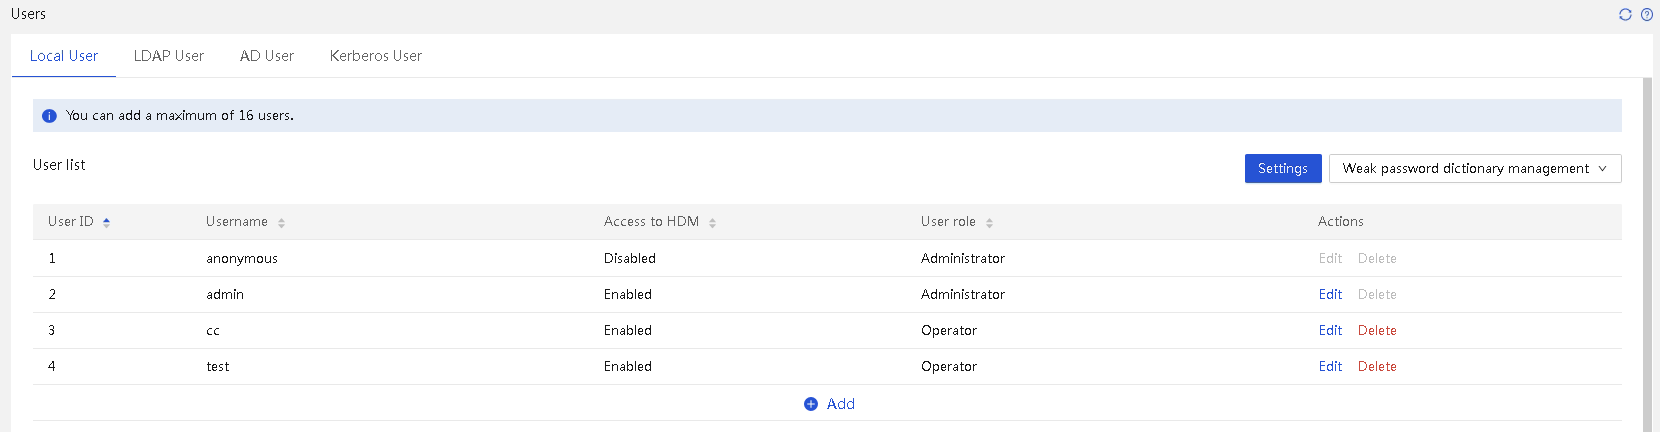
Privilege management
Different customers have different requirements for managing privileges. It is not only necessary to support the roles of administrator, operator, and common user, but also to define the privileges for different features. HDM provides user-oriented privilege management, which can control privileges of features such as KVM, VMedia, Web, IPMI, and SNMP through IPMI, Redfish or Web.
HDM supports up to 16 different local users. You can configure local users and domain users (including LDAP and AD users) on the user configuration page, allowing these users to access the HDM web interface.
The access privileges that a user has depend on the role group to which it belongs. Different role groups are assigned feature privileges that match their characteristics, allowing them to operate corresponding HDM functional modules. HDM supports the following role groups:
· Administrator: The user has all privileges of configuration and control in HDM.
· Operator: Compared to the administrator, has all configuration and control privileges except user management and maintenance diagnostics and has configuration privileges for daily basic operations for certain functions.
· User: Has read-only access rights and cannot modify HDM configuration.
· CustomRoleN: Name of the custom user role. The system supports a maximum of five custom user roles. Administrators can configure the privileges that custom users have.
HDM divides all functions and interfaces (Redfish, IPMI) into different privilege modules to enhance the security of the interfaces. The privilege modules include user configuration, general configuration, remote control, remote media, security configuration, power control, maintenance and diagnostics, self-configuration, and query module. Different privilege modules involve main functions, as shown in Table 10.
Table 10 privilege module design function description
|
privilege module name |
Description of privilege module functionality |
|
User accounts |
Configure local users, LDAP users, AD users, OTP authentication, certificate authentication, SSH key, and secure erasure, import/export configurations, and perform unified control |
|
Maintenance |
Clear event logs, manage installation package, update firmware, manage firmware library, manage scheduled tasks, restore HDM settings, restart HDM, restart CPLD, and manage service USB device settings |
|
Remote console |
Manage storage, hard drive partitioning, system resource monitoring, KVM (except for power control and image mounting), VNC password settings, system startup items, UID LED, SOL connection mode, MCA policy and security panel |
|
Remote media |
Configure virtual media settings and mount media images from KVM |
|
Security |
Configure services, firewall, SSL, login security information |
|
Power control |
Manage power, fan settings, NMI control, and physical power button control |
|
Base configuration |
Configure network ports, NTP, SNMP, LLDP, DNS, and Syslog, and set asset tags |
|
Password modification |
Modify the current user's password |
|
System audit |
View and save event logs and operation logs, and manage SDS log downloading |
|
Information query |
All information query menus and features |
Figure 125 User privilege configuration page
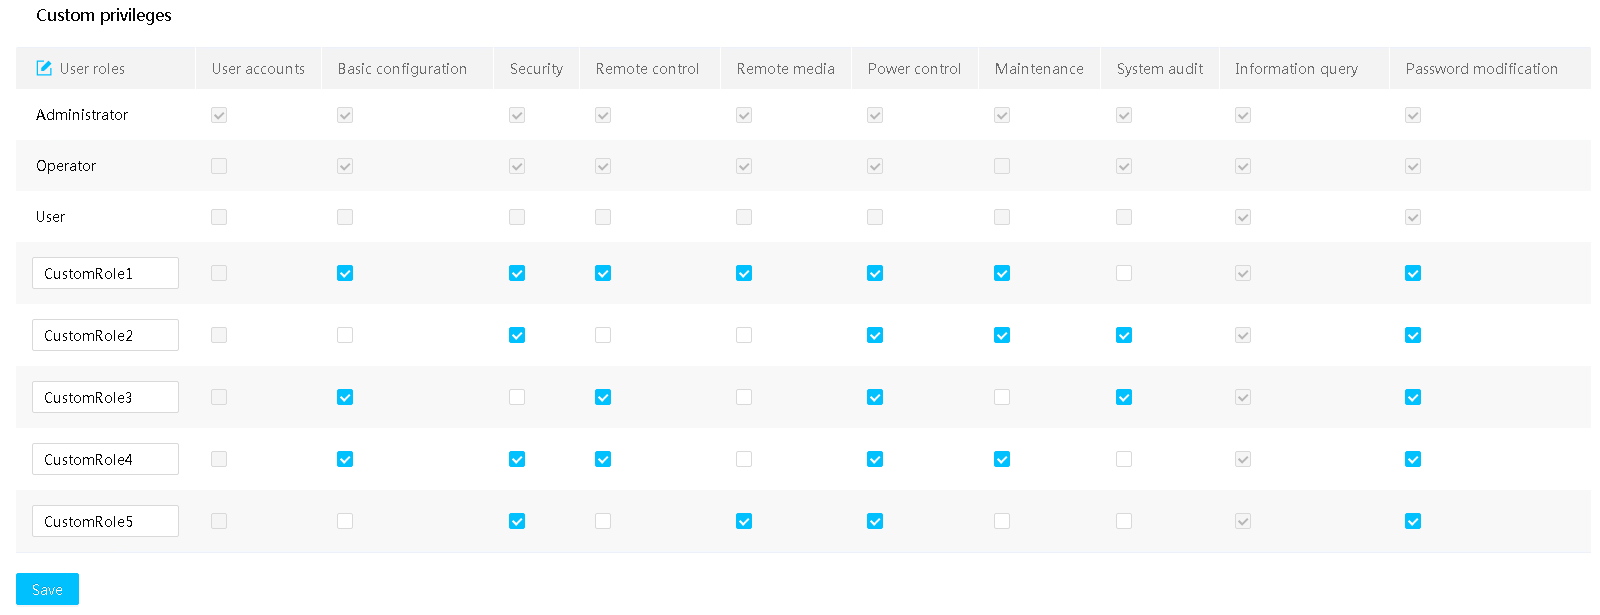
Two-factor authentication
Traditional platform login only requires the username and password. User passwords are the only protection barrier for the system, and security management is relatively weak. Two-factor authentication requires not only the username and password but also another factor for login to the management system. This improves HDM reliability for security and avoids user information leakage.
HDM supports two-factor authentication methods, certificate authentication and OTP authentication. You cannot enable both of them at the same time. Enable two-factor authentication with caution, because after you enable two-factor authentication, the system will disable interfaces or services such as Telnet, SSH, VNC, IPMI, Redfish, SNMPv3, and SOL.
OTP authentication
HDM uses one-time password (OTP) authentication and uses RADIUS. OTP requires a static password and a dynamic password for each login attempt to provide enhanced network security. HDM supports DKEY token and can collaborate with an OTP server to provide two-factor authentication for user login. With this feature configured, a user must enter the correct username, static password, and dynamic password obtained from a mobile phone or hardware token to log in to HDM, as shown in Figure 126.
Figure 126 OTP two-factor authentication network diagram
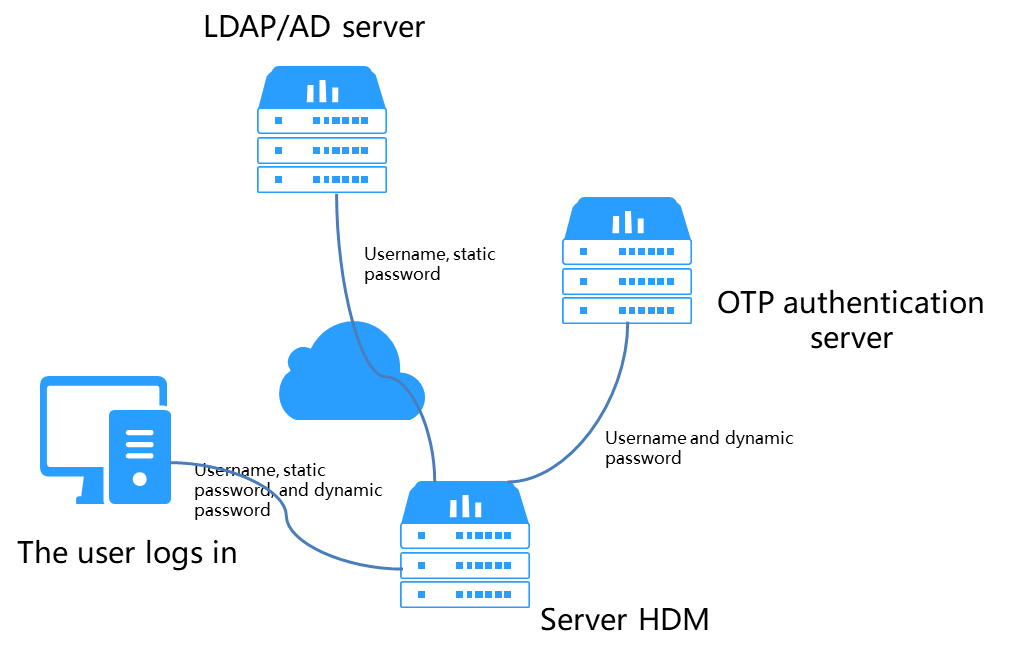
After you enable two-factor authentication, the login page of HDM will have an additional dynamic password input field, as shown in Figure 127.
Figure 127 Login page with two-factor authentication enabled

Certificate authentication
To improve HDM reliability for security and avoid user information leakage, HDM provides certificate authentication that requires a client certificate and client private key for each login.
Figure 128 Certificate two-factor authentication
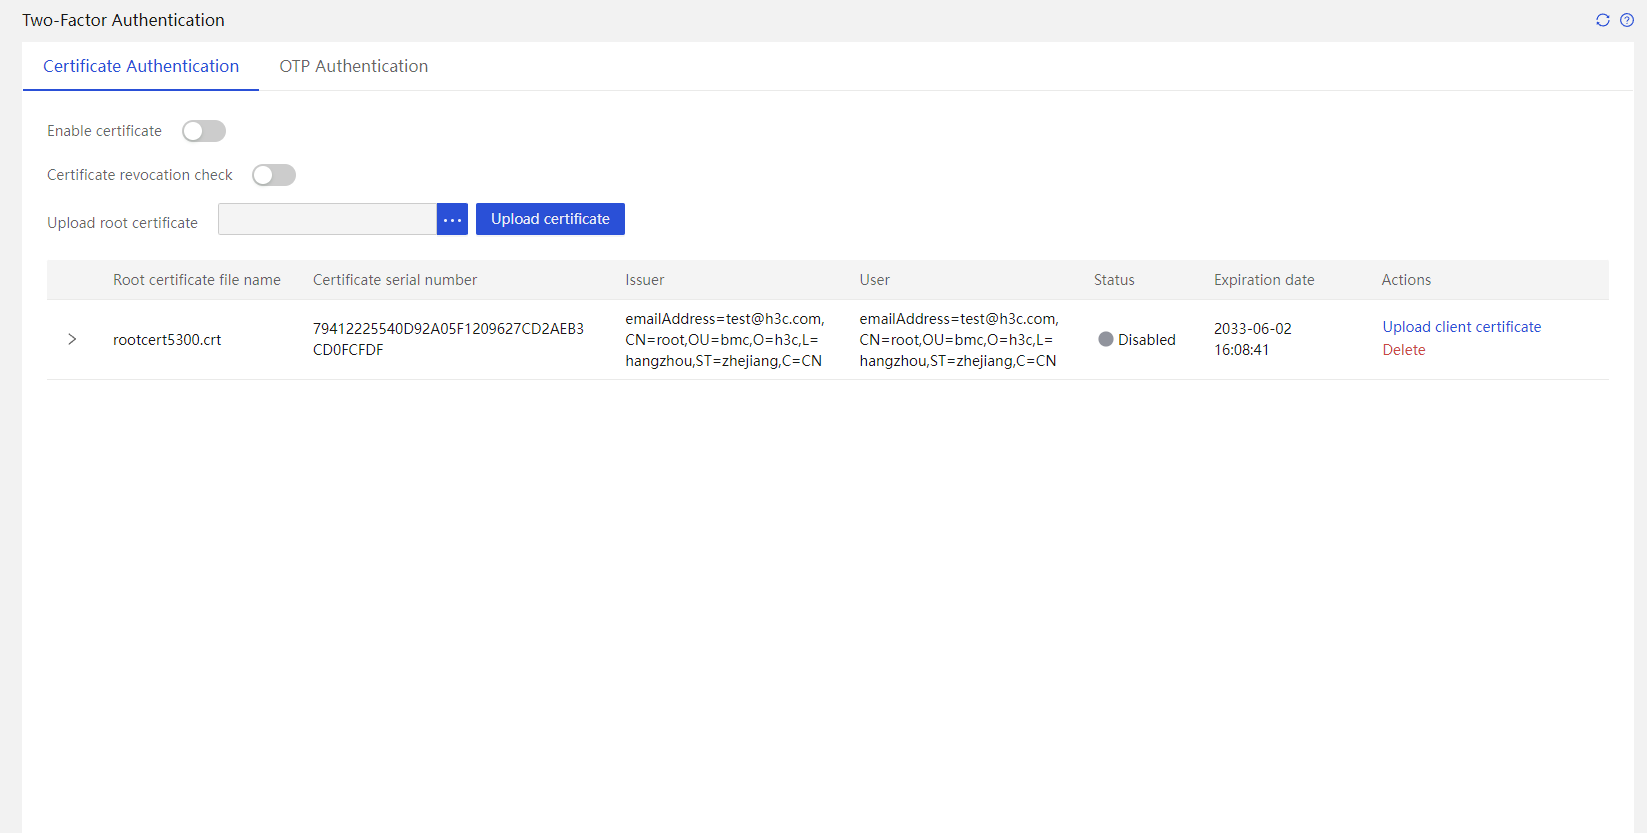
After applying for the root certificate and client certificate file from the certification authority, you can upload them to HDM through certificate authentication, and bind a local HDM user to each client certificate. After successful binding, open a browser and upload the client private key certificate. Once the private key certificate is uploaded, you can enter the HDM login page and select the client certificate as prompted, and then log in to HDM as the local user bound to the client certificate, as shown in Figure 129.
Figure 129 Certificate authentication process

You can upload a maximum of 20 root certificates and 16 client certificates for each root certificate. HDM supports a maximum of 20 client certificates for uploading, and each client certificate can bind to only one HDM local user. You must upload Base64 coded root certificate and client certificate in the format of .cer, .crt, or .pem. The browser only supports client private keys in the .p12 format.
Before enabling certificate revocation check, make sure the Web server and the Online Certificate Status Protocol (OCSP) server can reach each other. To avoid authentication failures, bind the HDM local user who has privileges to access the HDM Web interface.
Secondary authentication
For critical management operations such as user configuration, privilege configuration, and public key import, a secondary authentication will be performed on logged-in users. Only after authentication is passed can important operations be carried out. This prevents unauthorized users from performing malicious or accidental operations while the user logs in without tearing down the connection.
Figure 130 Secondary authentication page

LDAP domain users
Lightweight Directory Access Protocol (LDAP) enables you to efficiently access and maintain distributed directory information services over an IP network. By utilizing the existing authentication and authorization modes in LDAP, repetitive user configuration tasks are avoided, improving management efficiency and enhancing centralized management of access authentication, thus improving the security of HDM.
LDAP also supports role-based access control, which assigns corresponding privileges to certain roles. As a best practice, use role groups for role-based access control instead of assigning the highest level of privileges (the administrator) to all users.
HDM also supports importing LDAP certificates to ensure the integrity of SSL encryption, enhancing the login security of LDAP domain users Figure 132.
Figure 131 LDAP server operating mechanism
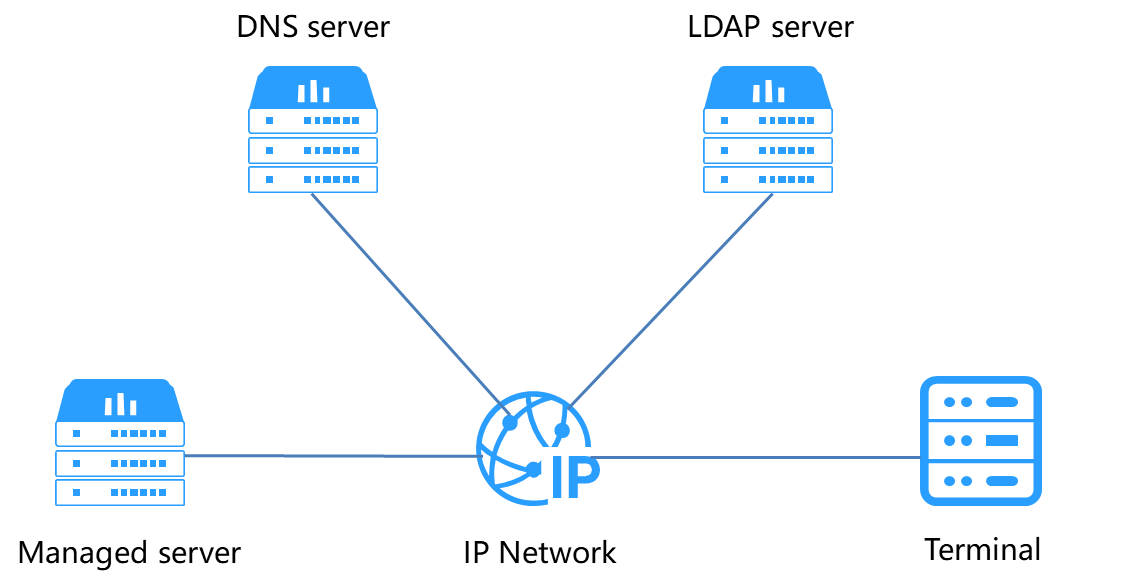
Figure 132 Importing an LDAP certificate
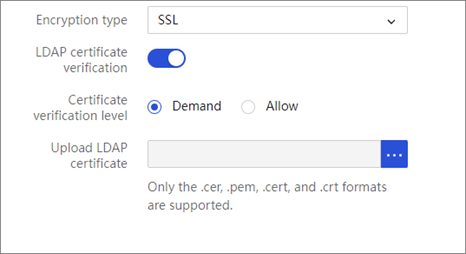
LDAP advantages:
· Scalable: Accounts can be dynamically managed on the LDAP server and the changes take effect on all HDMs.
· Secure: User password policies are implemented on the LDAP server. LDAP Supports SSL.
· Real-time: Account updates on the LDAP server will be immediately applied to all HDMs.
· Efficient: User management, privilege allocation, and validity period management of all HDM can be centralized on the directory server to avoid a large number of repetitive user configuration tasks and improve management efficiency.
AD domain users
Active Directory (AD) refers to the directory service in the Windows server operating system. It provides centralized organization management and access to network resources, making network topology and protocols transparent to users.
AD is divided into domains for management. With this structure, it can be expanded as the company grows.
HDM supports AD authentication. You can enable AD authentication and configure AD groups, as shown in Figure 133. After the configuration is completed, users can directly access HDM using the username and password configured on the AD directory server.
Figure 133 Configuring the AD server
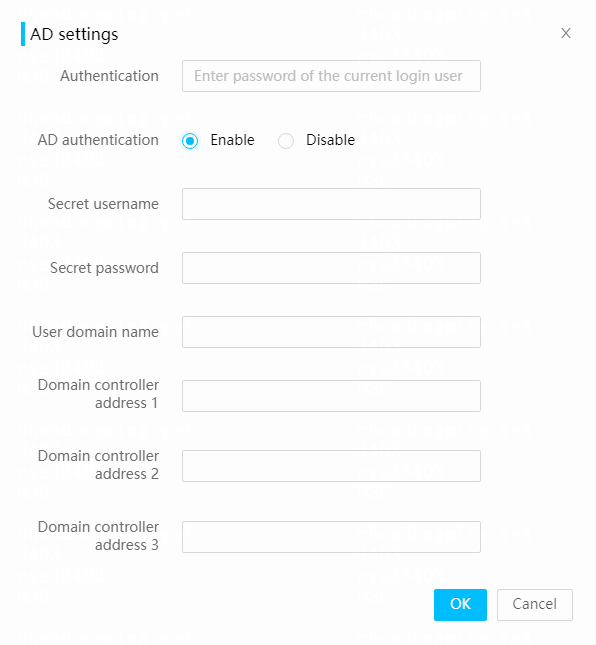
Kerberos
Kerberos is a network authentication protocol that provides strict identity verification services, ensuring the authenticity and security of the identities of the communicating parties. The authentication process of this protocol does not rely on the authentication of the host operating system, does not require trust based on the host address, does not require physical security of all hosts on the network. It assumes that the data packets transmitted on the network can be read, modified, and inserted arbitrarily. Kerberos performs authentication services through traditional cryptographic techniques such as shared keys.
The Kerberos authentication feature of HDM requires licenses. After you enable Kerberos and configure related parameters, you can directly access HDM using the username and password configured on the Kerberos directory server. After configuring Kerberos on a domain-joined PC, you can access HDM directly through single-node login without entering any username or password. Its privileges are determined by the privileges of the user's role group.
1. Centralized authentication management
KDC domain authentication service can be used for centralized management, simply by configuring user policies on the domain server for easy expansion. Data center devices share the same set of policies, and changes to authentication policies take effect immediately on the internal network, thereby facilitating management.
Figure 134 Kerberos authentication process
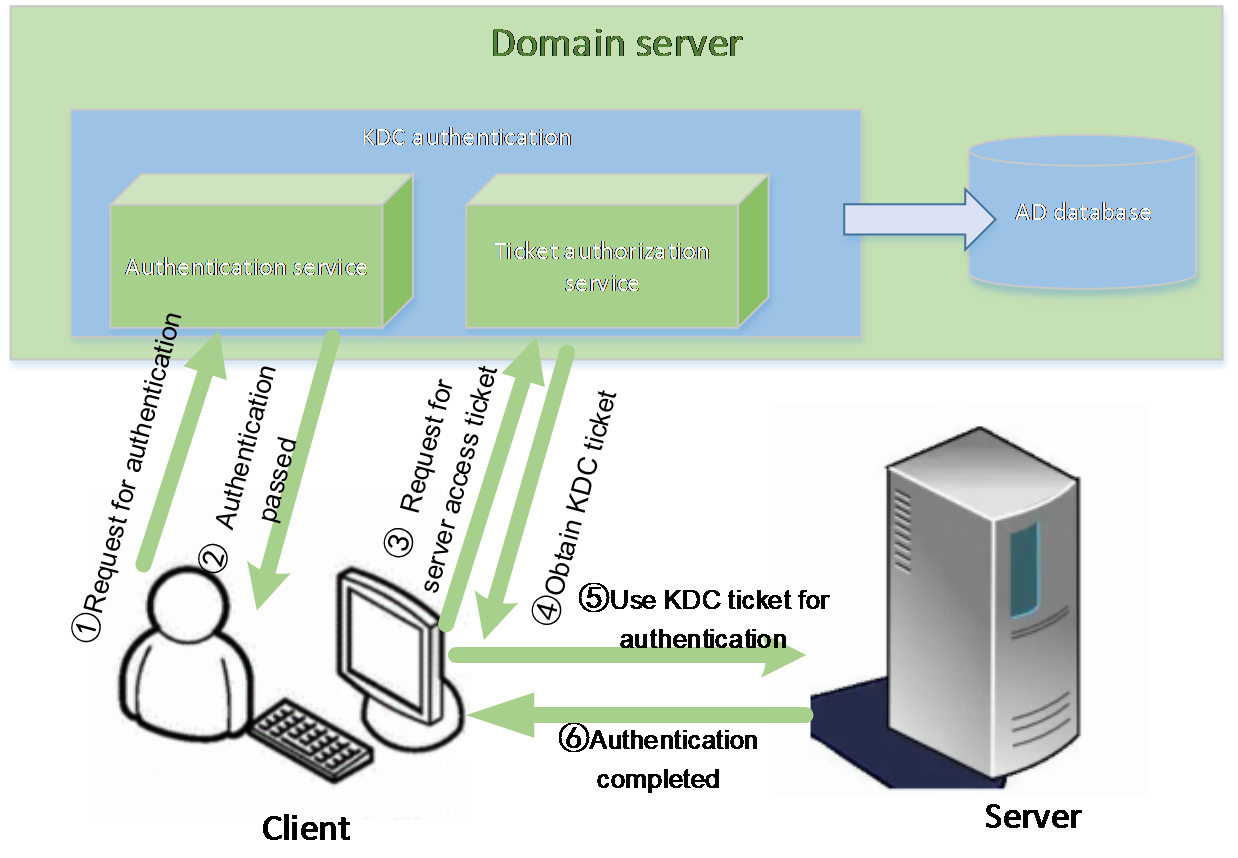
2. Single sign-on
HDM integrates Kerberos and enables users to log in to the server once and to access all HDMs in the network without entering the password again. The Kerberos-based single sign-on feature ensures that keys are not transferred over the network during authentication. A key is generated for each session, which becomes invalid after the session ends, making it more secure. When a user logs in to a service, Kerberos generates a ticket granting ticket (TGT) and automatically sends the service ID and TGT to the authentication center, obtaining a key. This key is then used to encrypt the user's account information for login to the server, eliminating the need for password input and making the operation more convenient. This is especially useful when thousands of servers are deployed in different regions and frequently switching between multiple servers is required.
3. User group management
A maximum of five user groups with different permissions are supported. Kerberos role group permissions are assigned based on SIDs. Each group has a unique SID, making the Kerberos authentication process more secure.
Figure 135 Adding a Kerbeoros role group
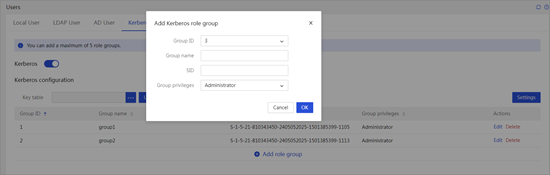
Security monitoring information
Security monitoring information allows you to view the status of important security settings and verify whether potential risks exist for HDM static security settings. When risks are detected, you can use this feature to view details and suggestions. As shown in Figure 136, HDM comprehensively evaluates the security of the current system from the aspects of account authentication security and application service security, and provides corresponding risk level prompts.
The current security instruments have the following four risk levels:
· No risk exists for security settings.
· Security monitoring is disabled.
· Risks are ignored for all security settings.
· Risks exist for security settings.
Figure 136 Safety instrument information display
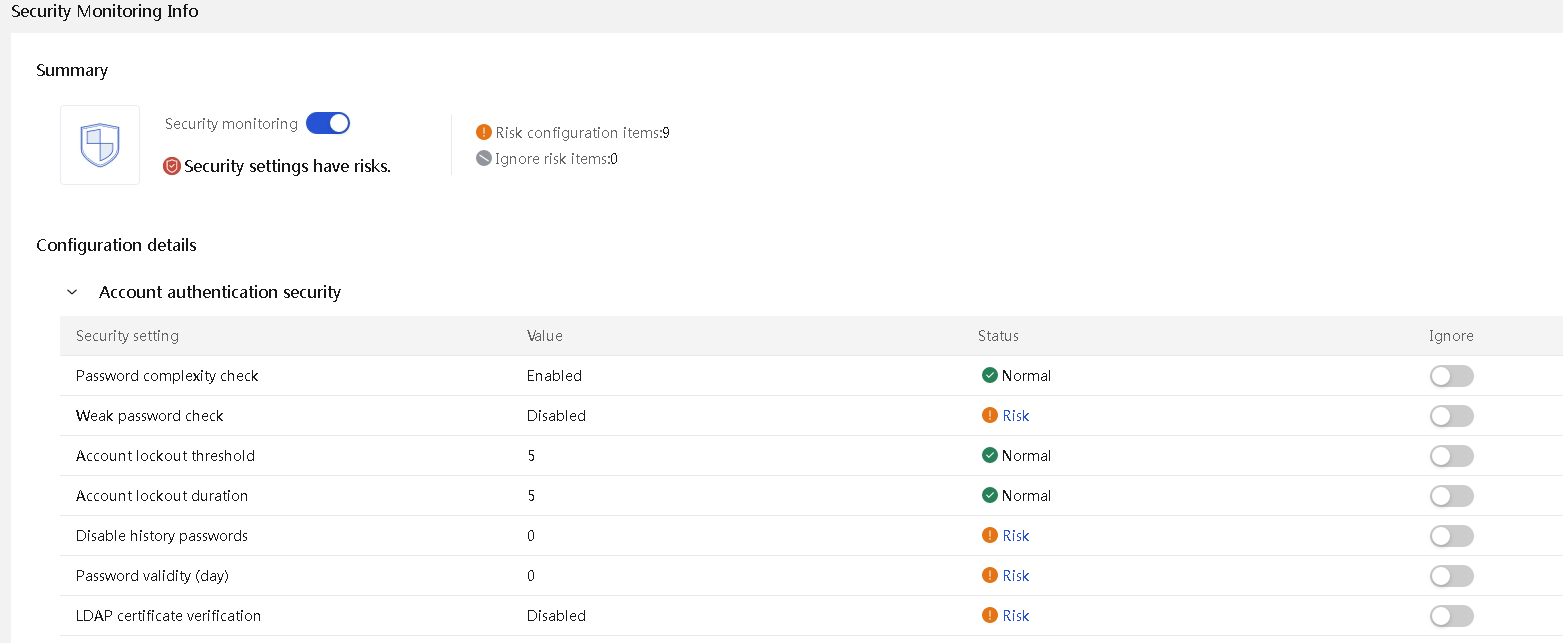
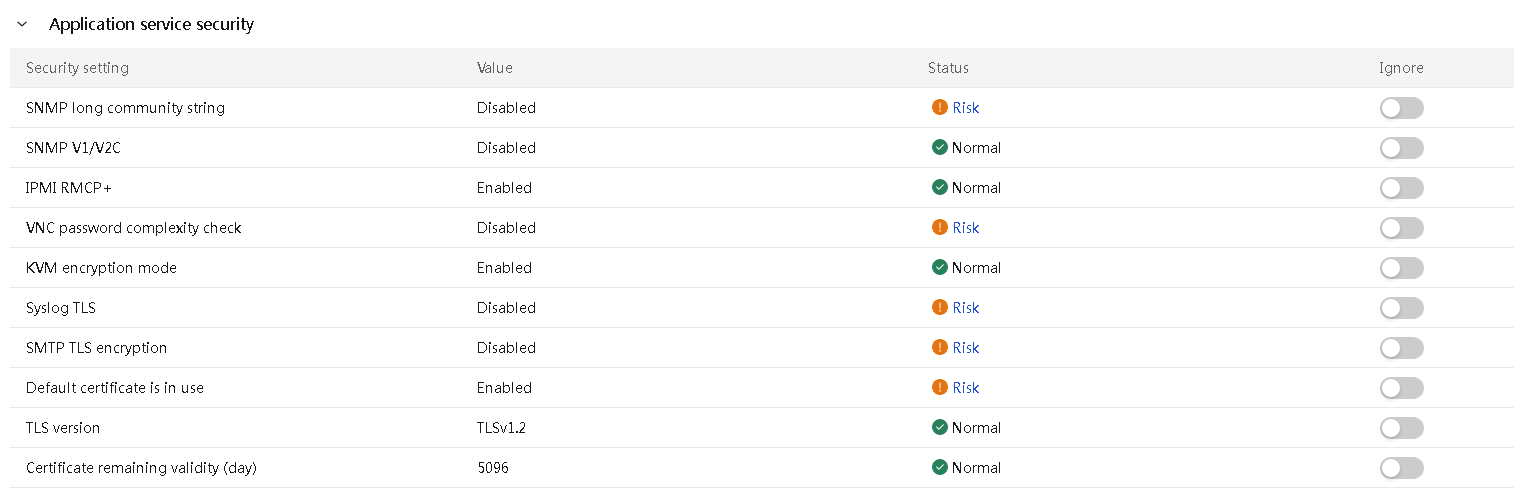
When a security setting is in risk status, to view the warning for the setting, click Risk in the Status column.
Figure 137 HDM security risk status
![]()
Figure 138 HDM security risk tip
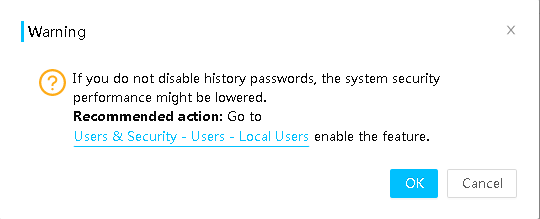
Secure erasure
The secure erasure feature can erase HDM, the BIOS, and storage data for the server to avoid data leakage when the server service life terminates or the server operation is terminated. A license is required for this feature.
Figure 139 Secure erasure page
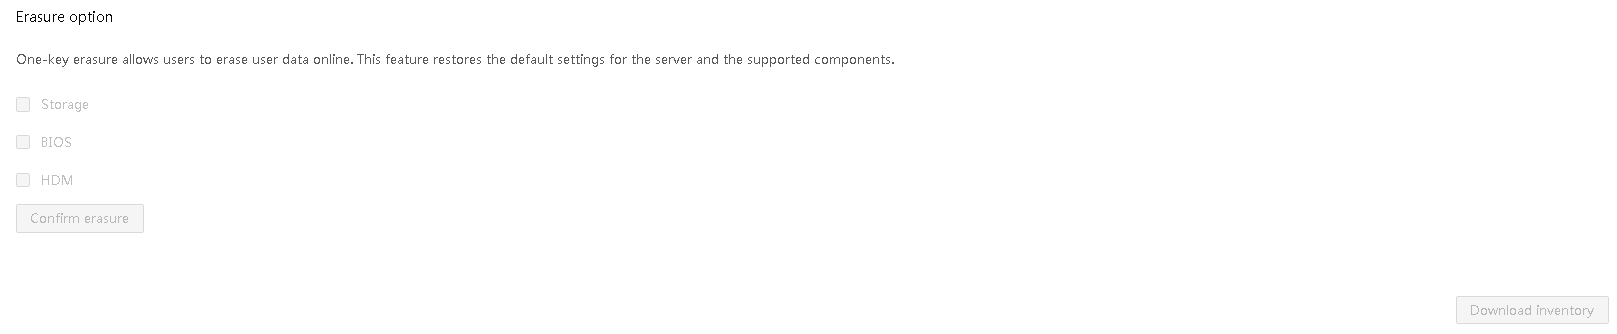
Table 11 shows the erase results for components:
|
Item |
Erase result |
|
HDM |
Restore HDM factory defaults. SDS logs and flash card data are erased. |
|
BIOS |
· Restore to the BIOS default settings. · The administrator and user passwords for the BIOS are erased. The BIOS does not require a password for the user whose password is erased to enter the BIOS Setup utility at next restart. · The server power-on password is erased from the BIOS. |
|
No-volatile DRAM (NVDIMM) |
Data in NVDIMMs that are not in memory mode is erased. After the erasure, all NVDIMMs operate in memory mode. |
|
Storage controller |
All logical drives managed by the RSTe RAID controller and VROC controller will be deleted. All logical drives managed by the RAID-P460-B2 storage controller will be deleted. |
|
Drive |
All data in the drive is deleted. |
|
SD card |
All data in the SD card is deleted. |
To ensure a successful erase, make sure the server uses iFIST-1.38 or later.
System lock
The system lock feature locks specific server features, configurations, and firmware version to avoid mistaken or malicious modification. A license is required for this feature. This feature provides lock objects including power control, hardware configuration, BIOS configuration, in-band access and out-of-band access, HDM configuration, and firmware version, as shown in Figure 140. For more information about lock objects, see Table 12.
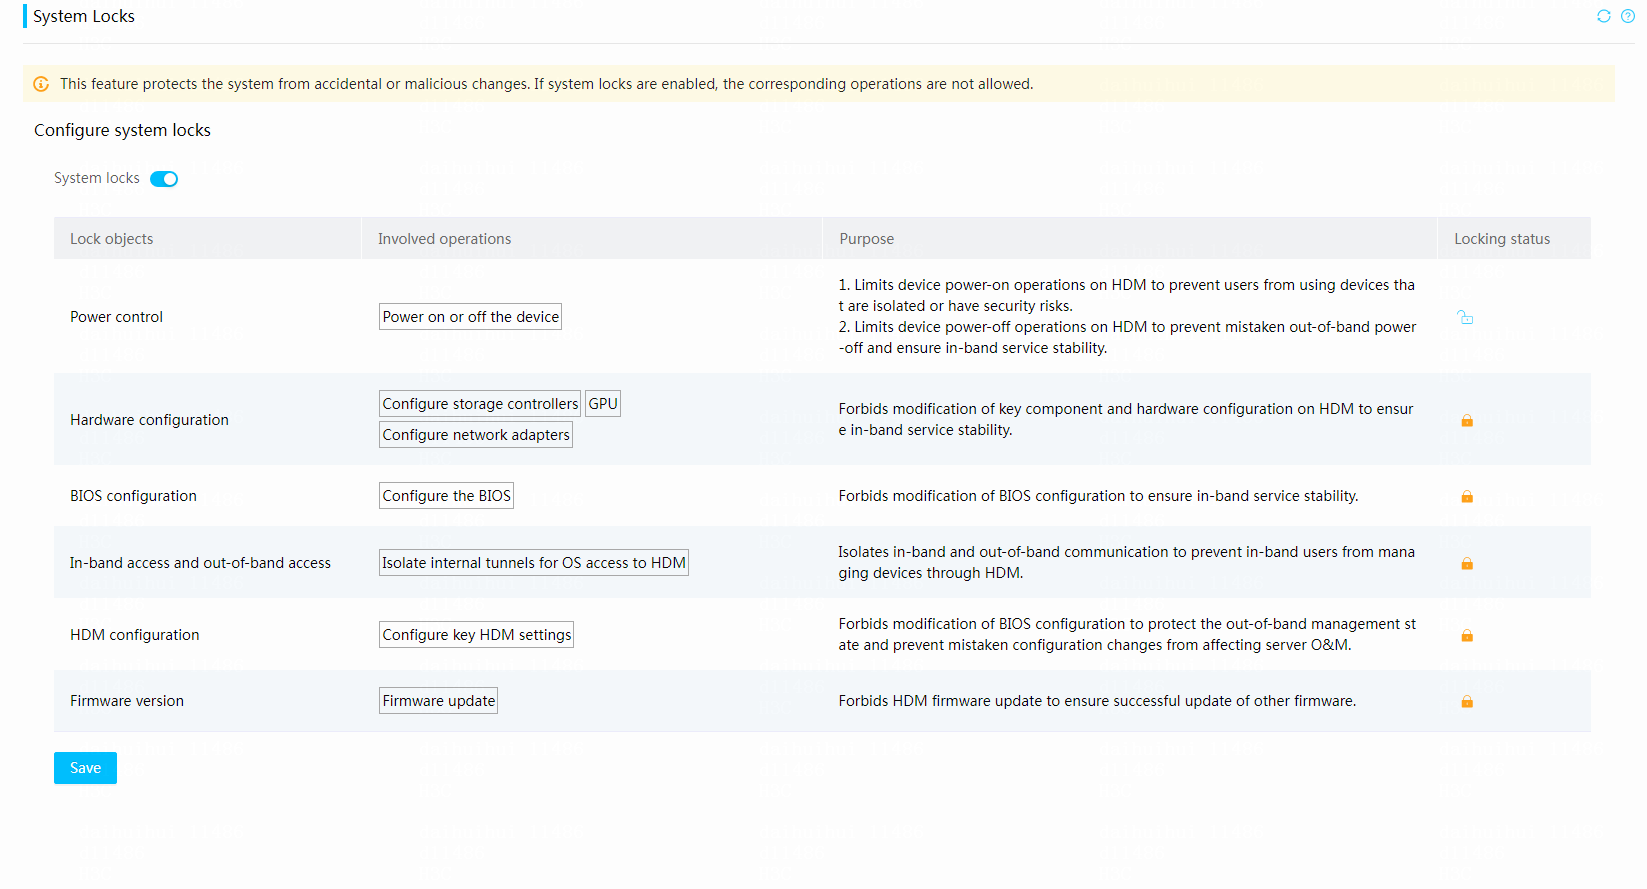
|
System lock object |
Description |
|
Power control |
Controls system reset from HDM or by pressing the physical button. |
|
Firmware version |
Controls firmware version update from HDM. |
|
Hardware configuration |
Controls storage controller, GPU, and network configuration from HDM. Options include: · Configure storage controllers, GPUs, and network adapters. · Import RAID configuration files. · Perform storage secure erasing. |
|
BIOS configuration |
Controls BIOS configuration from HDM. Options include: · Configure the BIOS settings. · Import BIOS configuration files. · Update the BIOS with user-defined settings restored or forcibly restored. · Perform BIOS secure erasing. |
|
HDM configuration |
Controls remote modification of HDM configuration. Options include: · Configure user settings (except for export configuration and perform unified control) · Configure general settings (except for event log clearing and video play) · Configure security settings (except for configuring login security information) · Power control (except for power on or power off the server and NMI control) · Remote control (configure MCA policies) · Maintenance (restore the factory defaults of HDM and update HDM with the factory defaults restored) |
|
In-band access and out-of-band access |
Isolates internal tunnels for OS access to HDM, allowing HDM to operate in an independent environment. |
Acronyms
|
Acronym |
Full name |
|
HDM |
Hardware Device Management |
|
BMC |
Baseboard management controller |
|
iFIST |
integrated Fast Intelligent Scalable Toolkit |
|
FIST SMS |
Fast Intelligent Scalable Toolkit's System Management Service |
|
BIOS |
Basic Input Output System |
|
MCTP |
Management Component Transport Protocol |
|
ME |
Management Engine |
|
RAID |
Redundant Arrays of Independent Disks |
|
RAS |
Reliability, Availability, Serviceability |
|
SEL |
System Event Log |
|
VGA |
Video Graphics Array |
|
IPMI |
Intelligent Platform Management Interface |
|
SDS |
Smart Diagnosis System |
|
EEPROM |
Electrically Erasable Programmable Read-Only Memory |
|
SN |
Serial Number |
|
PN |
Part Number |
|
SSD |
Solid State Drive |
|
LLDP |
Link Layer Discovery Protocol |
|
SSDP |
Simple Service Discovery Protocol |
|
PCIe |
Peripheral Component Interconnect Express |
|
SHD |
Smart Hardware Diagnosis |
|
ADDC |
Autonomous Debug Data Collection |
|
APML |
Advanced Platform Management Link |
