- Table of Contents
- Related Documents
-
| Title | Size | Download |
|---|---|---|
| 06-Device | 1.30 MB |
Contents
Configuring basic device settings
Configuring idle timeout period
Generating the diagnostic information file
Configuring the time zone and daylight saving time
System time configuration example
Setting buffer capacity and refresh interval
Setting operation parameters for a port
Displaying port operation parameters
Displaying a specified operation parameter for all ports
Displaying all the operation parameters for a port
Port management configuration example
Terminologies of port mirroring
Port mirroring classification and implementation
Recommended configuration procedures
Configuring ports for a mirroring group
Local port mirroring configuration example
Switching the user access level to the management level
Setting the traffic statistics generating interval
Viewing port traffic statistics
Setting the traffic statistics generating interval
Recommended configuration procedure
Configuring a statistics entry
Displaying RMON history sampling information
Configuring energy saving on a port
Recommended configuration procedure
Configuring SNMP trap function
Displaying SNMP packet statistics
SNMPv1/v2c configuration example
Displaying interface statistics
Displaying interface statistics
Configuring a management IP address
The device basic information feature allows you to perform the following operations:
· Set the system name of the device. The configured system name is displayed on the top of the navigation bar.
· Set the idle timeout period for logged-in users. The system logs an idle user off the Web for security purpose after the configured period.
Configuring system name
1. From the navigation tree, select Device > Basic.
The system name configuration page appears.
Figure 1 Configuring the system name
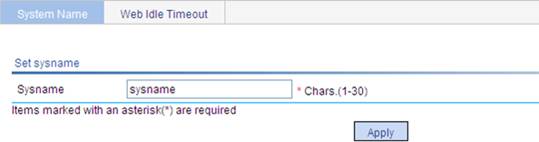
Enter the system name.
Click Apply.
Configuring idle timeout period
1. From the navigation tree, select Device > Basic.
2. Click the Web Idle Timeout tab.
The page for configuring idle timeout period appears.
Figure 2 Configuring the idle timeout period

Set the idle timeout period for logged-in users.
Click Apply.
Upgrading software
|
|
IMPORTANT: Software upgrade takes some time. Avoid performing any operation on the Web interface during the upgrading procedure. Otherwise, the upgrade operation might be interrupted. |
A boot file, also known as the system software or device software, is an application file used to boot the device. Software upgrade allows you to obtain a target application file from the local host and set the file as the boot file to be used at the next reboot. In addition, you can select whether to reboot the device to bring the upgrade software into effect.
To upgrade software:
1. From the navigation tree, select Device > Device Maintenance.
The Software Upgrade tab appears.
Figure 3 Software upgrade configuration page
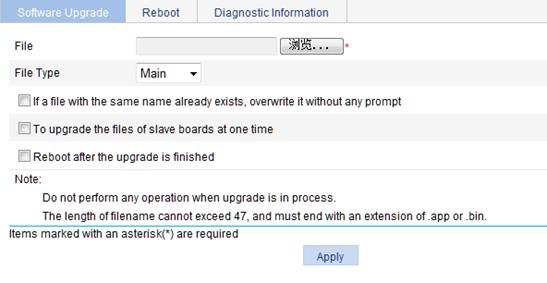
2. Configure software upgrade parameters, as described in Table 1.
3. Click Apply.
|
Item |
Description |
|
File |
Path and filename of the local application file, which must be suffixed with the .app or .bin extension. |
|
File Type |
Type of the boot file for the next boot: · Main—Boots the device. · Backup—Boots the device when the main boot file is unavailable. |
|
If a file with the same name already exists, overwrite it without any prompt |
Specify whether to overwrite the file with the same name. If you do not select the option, when a file with the same name exists, a dialog box appears, telling you that the file already exists and you cannot continue the upgrade. |
|
To upgrade files of slave boards at one time |
The device does not support this option. |
|
Reboot after the upgrade finished |
Specify whether to reboot the device to make the upgraded software take effect after the application file is uploaded. |
Rebooting the device
|
|
CAUTION: Before rebooting the device, save the configuration. Otherwise, all unsaved configuration will be lost after device reboot. |
1. From the navigation tree, select Device > Device Maintenance.
2. Click the Reboot tab.
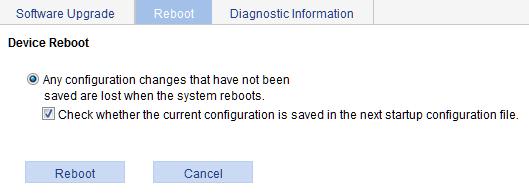
3. Clear the box before "Check whether the current configuration is saved in the next startup configuration file" or keep it selected.
4. Click Apply.
A confirmation dialog box appears.
5. Click OK.
¡ If you select Check whether the current configuration is saved in the next startup configuration file, the system will check the configuration before rebooting the device. If the check succeeds, the system reboots the device. If the check fails, a dialog box appears, telling you that the current configuration and the saved configuration are inconsistent, and the device is not rebooted. In this case, save the current configuration manually before you can reboot the device.
¡ If you do not select the box, the system reboots the device directly.
6. Log in to the Web interface again after the device reboots.
Generating the diagnostic information file
Each functional module has its own running information. Generally, you view the output for each module one by one. To receive as much information as possible in one operation during daily maintenance or when system failure occurs, the diagnostic information module allows you to save the running statistics of multiple functional modules to a file named default.diag, and then you can locate problems faster by checking this file.
To generate the diagnostic information file:
1. From the navigation tree, select Device > Device Maintenance.
2. Click the Diagnostic Information tab.
Figure 5 Diagnostic information
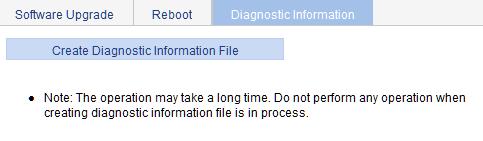
3. Click Create Diagnostic Information File.
The system begins to generate a diagnostic information file.
4. Click Click to Download.
The File Download dialog box appears.
5. Select to open this file or save this file to the local host.
Figure 6 The diagnostic information file is created

The generation of the diagnostic file takes a period of time. During this process, do not perform any operation on the Web page.
After the diagnostic file is generated successfully, you can view this file on the page you enter by selecting Device > File Management, or downloading this file to the local host. For more information, see "Managing files."
System time overview
You must configure a correct system time so that the device can work properly with other devices. System time allows you to display and set the device system time, system zone, and daylight saving time on the Web interface.
The device supports setting system time through manual configuration and automatic synchronization of NTP server time.
Defined in RFC 1305, the NTP synchronizes timekeeping among distributed time servers and clients. NTP can keep consistent timekeeping among all clock-dependent devices within the network, and ensure a high clock precision so that the devices can provide diverse applications based on consistent time.
Configuration guidelines
The synchronization process takes some time. Therefore, the clock status might be unsynchronized after your configuration. In this case, refresh the page to view the clock status and system time later on.
If the system time of the NTP server is ahead of the system time of the device, and the difference between them exceeds the Web idle time specified on the device, all online Web users are logged out because of timeout.
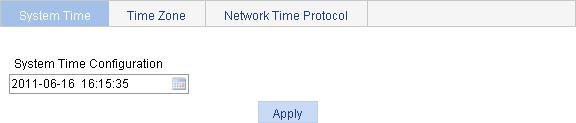
Displaying the system time
To view the current system date and time, select Device > System Time from the navigation tree to enter the System Time tab.
Figure 7 System time configuration page
Configuring the system time
1. From the navigation tree, select Device > System Time.
The System Time tab appears.
2. Click the System Time Configuration text to open a calendar.
Figure 8 Calendar page

3. Either enter the system date and time in the field, or select the date and time in the calendar, where you can do one of the following:
¡ Click Today. The date setting in the calendar is synchronized to the current local date configuration, and the time setting does not change.
¡ Select the year, month, date, and time, and then click OK.
4. Click Apply on the system time configuration page to save your configuration.
Configuring network time
1. From the navigation tree, select Device > System Time.
2. Click the Network Time Protocol tab.
The network time configuration page appears.
Figure 9 Network time configuration page
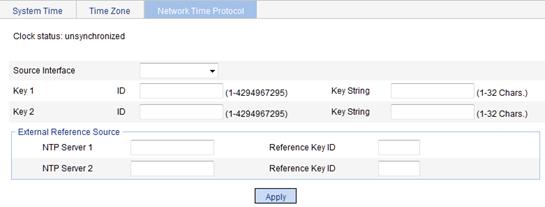
3. Configure the network time, as described in Table 2.
4. Click Apply.
|
Item |
Description |
|
|
Clock status |
Display the synchronization status of the system clock. |
|
|
Source Interface |
Set the source interface for an NTP message. If you do not want the IP address of a certain interface on the local device to become the destination address of response messages, specify the source interface for NTP messages. This makes the source IP address in the NTP messages the primary IP address of this interface. If the specified source interface is down, the source IP address is the primary IP address of the egress interface. |
|
|
Key 1 |
Set NTP authentication key. Enable the NTP authentication feature for a system running NTP in a network where there is a high security demand. This feature improves the network security by means of client-server key authentication. This prohibits a client from synchronizing with a device that has failed authentication. You can set two authentication keys, each of which is composed of a key ID and key string. · ID is the ID of a key. · Key string is a character string for MD5 authentication key.. |
|
|
Key 2 |
||
|
External Reference Source |
NTP Server 1/Reference Key ID. |
Specify the IP address of an NTP server, and configure the authentication key ID used for the association with the NTP server. The device synchronizes its time to the NTP server only if the key provided by the server is the same as the specified key. You can configure two NTP servers. The clients will choose the optimal reference source.
The IP address of an NTP server is a unicast address, and cannot be a broadcast or a multicast address, or the IP address of the local clock source. |
|
NTP Server 2/Reference Key ID. |
||
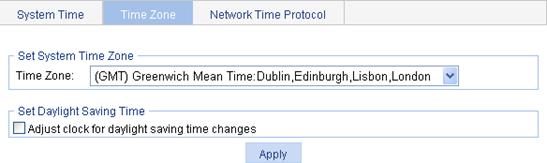
Configuring the time zone and daylight saving time
1. From the navigation tree, select Device > System Time.
2. Click Time Zone.
The page for setting time zone appears.
Figure 10 Setting the time zone
3. Configure the time zone and daylight saving time.
4. Click Apply.
|
Item |
Description |
|
Time Zone |
Set the time zone for the system. |
|
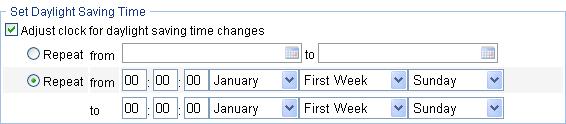
Adjust clock for daylight saving time changes |
Adjust the system clock for daylight saving time changes, which means adding one hour to the current system time. Click Adjust clock for daylight saving time changes to expand the option, as shown in Table 3Figure 11. You can configure the daylight saving time changes in the following ways: 1. Specify that the daylight saving time starts on a specific date and ends on a specific date. The time range must be greater than one day and smaller than one year. For example, configure the daylight saving time to start on August 1st, 2006 at 06:00:00 a.m., and end on September 1st, 2006 at 06:00:00 a.m. 2. Specify that the daylight saving time starts and ends on the corresponding specified days every year. The time range must be greater than one day and smaller than one year. For example, configure the daylight saving time to start on the first Monday in August at 06:00:00 a.m., and end on the last Sunday in September at 06:00:00 a.m. |
Figure 11 Setting the daylight saving time
System time configuration example
Network requirements
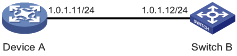
As shown in Figure 12, the local clock of Device A is set as the reference clock. Switch B operates in client mode, and uses Device A as the NTP server. Configure NTP authentication on Device A and Switch B.
Configuring date and time
1. Configure the local clock as the reference clock, with the stratum of 2. Enable NTP authentication, set the key ID to 24, and specify the created authentication key aNiceKey is a trusted key. (Details not shown.)
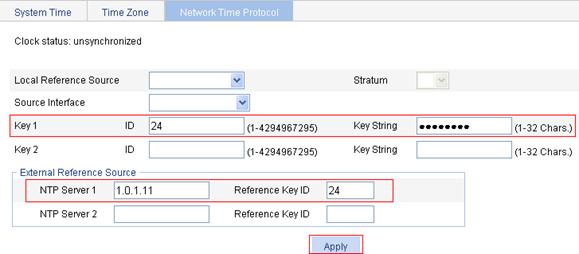
2. On Switch B, configure Device A as the NTP server.
a. Select Device > System Time from the navigation tree.
b. Click the Network Time Protocol tab.
c. Enter 24 in the ID field, enter aNiceKey in the Key String field for key 1, enter 1.0.1.11 in the NTP Server 1 field, and enter 24 in the Reference Key ID field.
d. Click Apply.
Figure 13 Configuring Device A as the NTP server of Switch B
Verifying the configuration
After the above configuration, you will see that the current system date and time on Device A is the same as those on Switch B.
System logs record network and device information, including running status and configuration changes. With system logs, administrators can take corresponding actions against network problems and security problems.
The system sends system logs to the following destinations:
· Console
· Monitor terminal, a terminal that has logged in to the device through the AUX or VTY user interface
· Log buffer
· Log host
· Web interface
Displaying syslogs
1. From the navigation tree, select Device > Syslog.
The page for displaying syslogs appears. You can perform the following tasks:
¡ Click Reset to clear all system logs saved in the log buffer on the Web interface.
¡ Click Refresh to manually refresh the page.
¡ Set the refresh interval on the Log Setup page to enable the system to automatically refresh the page periodically.
For more information, see "Setting buffer capacity and refresh interval."
Figure 14 Displaying syslogs
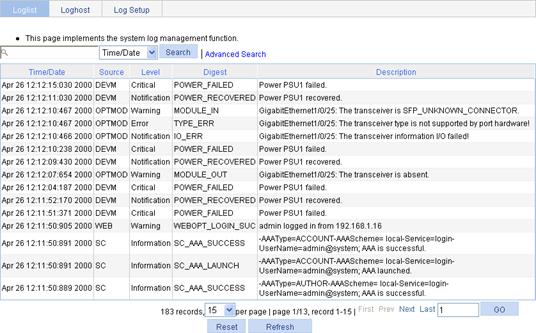
2. View system logs.
Table 4 Field description
|
Field |
Description |
|
Time/Date |
Displays the time/date when the system log was generated. |
|
Source |
Displays the module that generated the system log. |
|
Level |
Displays the severity level of the system log. The information is classified into eight levels by severity: · Emergency—The system is unusable. · Alert—Action must be taken immediately. · Critical—Critical condition. · Error—Error condition. · Warning—Warning condition. · Notification—Normal but significant condition. · Information—Informational message. · Debug—Debug-level message. |
|
Digest |
Displays the brief description of the system log. |
|
Description |
Displays the content of the system log. |
Configuring the log host
1. From the navigation tree, select Device > Syslog.
2. Click the Loghost tab.
The log host configuration page appears.
Figure 15 Setting the log host
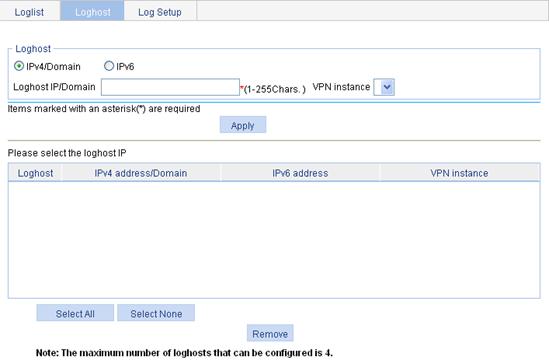
3. Configure the log host, as described in Table 5.
4. Click Apply.
|
Item |
Description |
|
|
IPv4/Domain |
Set the IPv4 address or domain name of the log host, and select the VPN instance name of the VPN to which the flow logging server belongs.. |
· You can specify up to four log hosts. · The device does not support VPN instances. |
|
Loghost IP/Domain |
||
|
VPN instance |
||
|
IPv6 |
Set the IPv6 address of the log host. The device does not support IPv6 addresses. |
|
|
Loghost IP |
||
Setting buffer capacity and refresh interval
1. From the navigation tree, select Device > Syslog.
2. Click the Log Setup tab.
The syslog configuration page appears.
Figure 16 Syslog configuration page
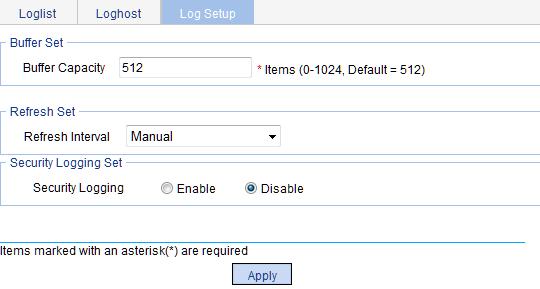
3. Configure buffer capacity and refresh interval, as described in Table 6.
4. Click Apply.
|
Item |
Description |
|
Buffer Capacity |
Set the number of logs that can be stored in the log buffer. |
|
Refresh Interval |
Set the log refresh interval. You can select manual refresh or automatic refresh: · Manual—Click Refresh to view latest log information. · Automatic—Select to refresh the Web interface every 1 minute, 5 minutes, or 10 minutes. |
|
Security Logging |
Enable or disable the security logging saving function. |
Administrators can back up, restore, save, or reset the device configuration.
Backing up the configuration
Configuration backup allows you to perform the following operations:
· Open and view the configuration file (.cfg or .xml file) for the next startup.
· Back up the configuration file (.cfg or .xml file) for the next startup to the host of the administrator.
|
|
IMPORTANT: H3C recommends that you back up both the .cfg and .xml configuration files. If you back up only the .cfg configuration file, some configuration information might not be restored when, for example, the configuration is mistakenly removed. |
To back up the configuration:
1. From the navigation tree, select Device > Configuration.
The Backup page appears.
Figure 17 Backing up the configuration
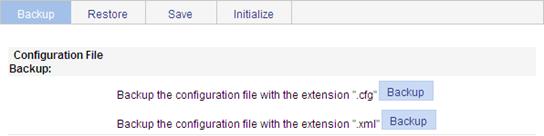
2. Click the upper Backup button.
The file download dialog box appears.
3. Select to view the .cfg file or to save the file to the local host.
4. Click the lower Backup button.
The file download dialog box appears.
5. Select to view the .xml file or to save the file to the local host.
Restoring the configuration
Configuration restore allows you to perform the following operations:
· Upload the .cfg file on the host of the administrator to the device for the next startup.
· Upload the .xml file on the host of the administrator to the device for the next startup, and delete the previous .xml configuration file that was used for the next startup.
The restored configuration takes effect at the next boot of the device.
To restore the configuration:
1. From the navigation tree, select Device > Configuration.
2. Click the Restore tab.
The configuration restore page appears.
Figure 18 Restoring the configuration
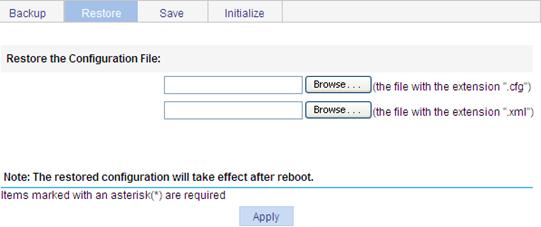
3. Click the upper Browse button.
The file upload dialog box appears.
4. Select the .cfg file to be uploaded, and click OK.
5. Click the lower Browse button.
The file upload dialog box appears.
6. Select the .xml file to be uploaded, and click OK.
Saving the configuration
The save configuration module allows administrators to save the running configuration to the configuration file (.cfg file or .xml file) to be used at the next startup.
To save the configuration, follow these guidelines:
· Saving the configuration takes some time.
· Only one administrator can save the configuration at a moment. If one administrator saves the configuration while the system is saving the configuration as required by another administrator, the system prompts the second administrator to try later.
This module supports saving the configuration in either of the following two modes: fast or common.
To save the configuration in fast mode, click the Save button at the upper right of the auxiliary area.
Figure 19 Saving the configuration
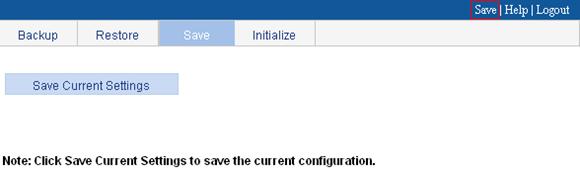
To save the configuration in common mode:
1. From the navigation tree, select Device > Configuration.
2. Click the Save tab.
3. Click Save Current Settings.
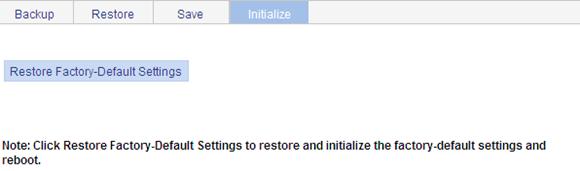
Resetting the configuration
This operation will restore the device's factory defaults, deletes the current configuration file, and reboots the device.
To reset the configuration:
1. From the navigation tree, select Device > Configuration.
2. Click the Initialize tab.
3. Click Restore Factory-Default Settings to restore the factory defaults.
Figure 20 Resetting the configuration
The file management function allows you to manage the files on the storage media.
Displaying files
1. From the navigation tree, select Device > File Management.
Figure 21 File management page
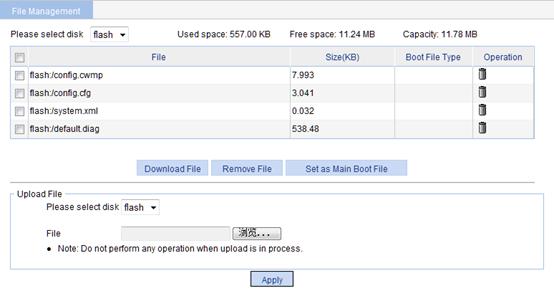
2. From the Please select disk list, select a medium.
Two categories of information are displayed:
¡ Medium Information, including the used space, free space, and the capacity of the medium.
¡ File information, including all files on the medium, the file sizes, and the boot file types (Main or Backup).
Downloading a file
1. From the navigation tree, select Device > File Management.
The file management page appears, as shown in Figure 21.
2. From the Please select disk list, select the medium where the file to be downloaded resides.
3. Select the file from the list.
Only one file can be downloaded at a time.
4. Click Download File.
The File Download dialog box appears.
5. Open the file or save the file to a specified path.
Uploading a file
|
|
IMPORTANT: Uploading a file takes some time. H3C recommends that you not perform any operation on the Web interface during the upload. |
1. From the navigation tree, select Device > File Management.
The file management page appears, as shown in Figure 21.
2. In the Upload File area, select the medium for saving the file from the Please select disk list.
3. Click Browse to navigate to the file to be uploaded.
4. Click Apply.
Removing a file
1. From the navigation tree, select Device > File Management.
2. The file management page appears, as shown in Figure 21.
3. Perform one of the following tasks:
¡ Click the ![]() icon of a file to remove the file.
icon of a file to remove the file.
¡ Select a file from the file list and click Remove File.
To remove multiple files, repeat step 2, or select the files from the file list and click Remove File.
Specifying the main boot file
1. From the navigation tree, select Device > File Manage.
2. The file management page appears, as shown in Figure 21.
3. From the Please select disk list, select the medium that holds the application file to be used as the main boot file.
4. From the file list, select the application file (with the extension .bin or .app).
5. Click Set as Main Boot File.
You can use the port management feature to set and view the operation parameters of a Layer 2 Ethernet port and an aggregate interface.
· For a Layer 2 Ethernet port, these operation parameters include its state, rate, duplex mode, link type, PVID, description, MDI mode, flow control settings, MAC learning limit, and storm suppression ratios.
· For an aggregate interface, these operation parameters include its state and MAC learning limit.
Setting operation parameters for a port
1. From the navigation tree, select Device > Port Management.
2. Click the Setup tab.
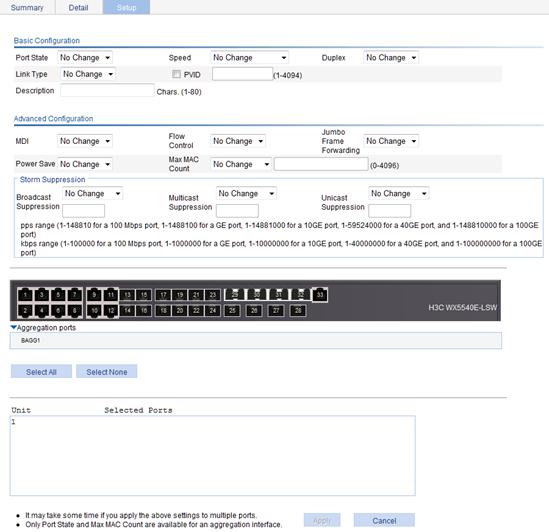
3. Set the operation parameters for the port, as described in Table 7.
4. Click Apply.
|
Item |
Description |
|
Port State |
Enable or disable the port. Sometimes, after you modify the operation parameters of a port, you must disable and then enable the port to have the modifications take effect. |
|
Speed |
Set the transmission rate of the port. Available options include: · 10—10 Mbps. · 100—100 Mbps. · 1000—1000 Mbps. · Auto—auto-negotiation. · Auto 10—auto-negotiated to 10 Mbps. · Auto 100—auto-negotiated to 100 Mbps. · Auto 1000—auto-negotiated to 1000 Mbps. · Auto 10 100—auto-negotiated to 10 or 100 Mbps. · Auto 10 1000—auto-negotiated to 10 or 1000 Mbps. · Auto 100 1000—auto-negotiated to 100 or 1000 Mbps. · Auto 10 100 1000—auto-negotiated to 10, 100, or 1000 Mbps. |
|
Duplex |
Set the duplex mode of the port: · Auto—auto-negotiation. · Full—full duplex. · Half—half duplex. |
|
Link Type |
Set the link type of the current port, which can be access, hybrid, or trunk. For more information, see "Configuring VLANs." To change the link type of a port from trunk to hybrid, or vice versa, you must first set its link type to access. |
|
PVID |
Set the default VLAN ID of the interface. For more information about setting the PVID, see "Configuring VLANs." To make sure a link properly transmits packets, the trunk or hybrid ports at the two ends of the link must have the same PVID. |
|
Description |
Set the description of the port. |
|
MDI |
Set the MDI mode of the port. You can use two types of Ethernet cables to connect Ethernet devices: crossover cable and straight-through cable. To accommodate these two types of cables, an Ethernet port can operate in one of the following three MDI modes: across, normal, and auto. An Ethernet port is composed of eight pins. By default, each pin has its particular role. For example, pin 1 and pin 2 are used for transmitting signals, and pin 3 and pin 6 are used for receiving signals. You can change the pin roles by setting the MDI mode. · For an Ethernet port in across mode, pin 1 and pin 2 are used for transmitting signals. and pin 3 and pin 6 are used for receiving signals. The pin roles are not changed. · For an Ethernet port in auto mode, the pin roles are decided through auto negotiation. · For an Ethernet port in normal mode, the pin roles are changed. Pin 1 and pin 2 are used for receiving signals. Pin 3 and pin 6 are used for transmitting signals. To enable normal communication, you must connect the local transmit pins to the remote receive pins. Configure the MDI mode depending on the cable types. · Normally, the auto mode is recommended. The other two modes are used only when the device cannot determine the cable type. · When straight-through cables are used, the local MDI mode must be different from the remote MDI mode. · When crossover cables are used, the local MDI mode must be the same as the remote MDI mode, or the MDI mode of at least one end must be set to auto. |
|
Flow Control |
Enable or disable flow control on the port. With flow control enabled at both sides, when traffic congestion occurs on the ingress port, the ingress port sends a Pause frame notifying the egress port to temporarily suspend the sending of packets. The egress port is expected to stop sending any new packet when it receives the Pause frame. In this way, flow control helps to avoid dropping of packets. Flow control works only after it is enabled on both the ingress and egress ports. |
|
Jumbo Frame Forwarding |
Enable or disable the forwarding of jumbo frames. |
|
Power Save |
Enable or disable auto power down on the port. With auto power down enabled, when an Ethernet port does not receive any packet for a certain period, it automatically enters the power save mode and resumes its normal state upon the arrival of a packet. |
|
Max MAC Count |
Set the MAC learning limit on the port. Available options include: · User Defined—Select this option to set the limit manually. · No Limited—Select this option to set no limit. |
|
Broadcast Suppression |
Set broadcast suppression on the port. You can suppress broadcast traffic by percentage or by PPS, as follows: · ratio—Sets the maximum percentage of broadcast traffic to the total bandwidth of an Ethernet port. When you select this option, you must enter a percentage in the box below. · pps—Sets the maximum number of broadcast packets that can be forwarded on an Ethernet port per second. When you select this option, you must enter a number in the box below. · kbps—Sets the maximum number of kilobits of broadcast traffic that can be forwarded on an Ethernet port per second. When you select this option, you must enter a number in the box below. Do not configure this item if the storm constrain function for broadcast traffic is enabled on the port. Otherwise, the suppression result will be unpredictable. To set storm constrain for broadcast traffic on a port, select Device > Storm Constrain. |
|
Multicast Suppression |
Set multicast suppression on the port. You can suppress multicast traffic by percentage or by PPS as follows: · ratio—Sets the maximum percentage of multicast traffic to the total bandwidth of an Ethernet port. When you select this option, you must enter a percentage in the box below. · pps—Sets the maximum number of multicast packets that can be forwarded on an Ethernet port per second. When you select this option, you must enter a number in the box below. · kbps—Sets the maximum number of kilobits of multicast traffic that can be forwarded on an Ethernet port per second. When you select this option, you must enter a number in the box below. Do not configure this item if the storm constrain function for multicast traffic is enabled on the port. Otherwise, the suppression result will be unpredictable. To set storm constrain for multicast traffic on a port, select Device > Storm Constrain. |
|
Unicast Suppression |
Set unicast suppression on the port. You can suppress unicast traffic by percentage or by PPS as follows: · ratio—Sets the maximum percentage of unicast traffic to the total bandwidth of an Ethernet port. When you select this option, you must enter a percentage in the box below. · pps—Sets the maximum number of unicast packets that can be forwarded on an Ethernet port per second. When you select this option, you must enter a number in the box below. · kbps—Sets the maximum number of kilobits of unicast traffic that can be forwarded on an Ethernet port per second. When you select this option, you must enter a number in the box below. Do not configure this item if the storm constrain function for unicast traffic is enabled on the port. Otherwise, the suppression result will be unpredictable. To set storm constrain for unicast traffic on a port, select Device > Storm Constrain. |
|
Selected Ports |
Interface or interfaces that you have selected from the chassis front panel and the aggregate interface list below, for which you have set operation parameters. You can set only the state and MAC learning limit for an aggregate interface. |
If you set operation parameters that a port does not support, you are notified of invalid settings and might fail to set the supported operation parameters for the port or other ports.
Displaying port operation parameters
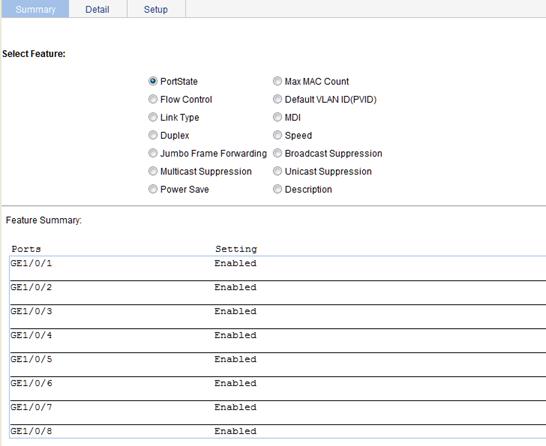
Displaying a specified operation parameter for all ports
1. From the navigation tree, select Device > Port Management.
The Summary page appears.
2. Click the button of a parameter you want to view.
The parameter information for all the ports is displayed in the lower part of the page.
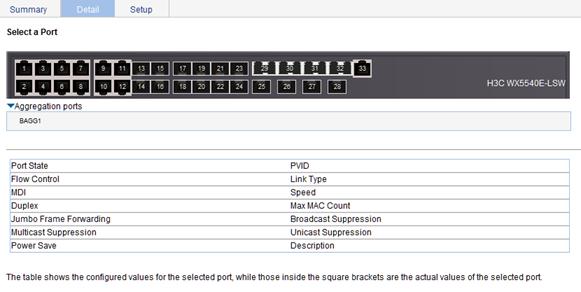
Displaying all the operation parameters for a port
1. From the navigation tree, select Device > Port Management.
2. Click the Detail tab.
3. On the chassis front panel, select a port whose operation parameters you want to view.
The operation parameter settings of the selected port are displayed on the lower part of the page. Whether the parameter takes effect is displayed in the square brackets.
Port management configuration example
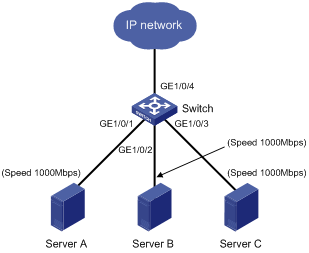
Network requirements
As shown in Figure 25:
· Server A, Server B, and Server C are connected to GigabitEthernet 1/0/1, GigabitEthernet 1/0/2, and GigabitEthernet 1/0/3 of the switch, respectively. The rates of the network adapters of these servers are all 1000 Mbps.
· The switch connects to the external network through GigabitEthernet 1/0/4 whose rate is 1000 Mbps.
To avoid congestion at the egress port, GigabitEthernet 1/0/4, configure the rate of GigabitEthernet 1/0/1, GigabitEthernet 1/0/2, and GigabitEthernet 1/0/3 as 100 Mbps.
Configuring the switch
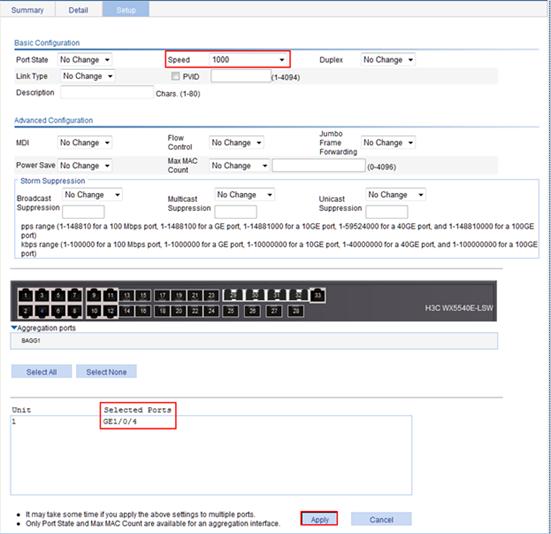
1. Set the rate of GigabitEthernet 1/0/4 to 1000 Mbps:
a. From the navigation tree, select Device > Port Management.
b. Click the Setup tab.
c. From the Speed list, select 1000.
d. On the chassis front panel, select 4.
4 represents port GigabitEthernet 1/0/4.
e. Click Apply.
Figure 26 Configuring the rate of GigabitEthernet 1/0/4
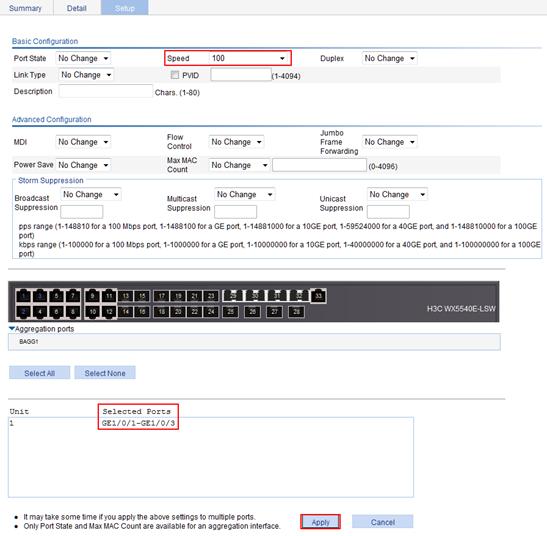
2. Batch configure the rate of GigabitEthernet 1/0/1, GigabitEthernet 1/0/2, and GigabitEthernet 1/0/3 as 100 Mbps:
a. On the Setup tab, select 100 from the Speed list.
b. On the chassis front panel, select 1, 2, and 3.
1, 2, and 3 represent ports GigabitEthernet 1/0/1, GigabitEthernet 1/0/2, and GigabitEthernet 1/0/3.
c. Click Apply.
Figure 27 Batch configuring port rate
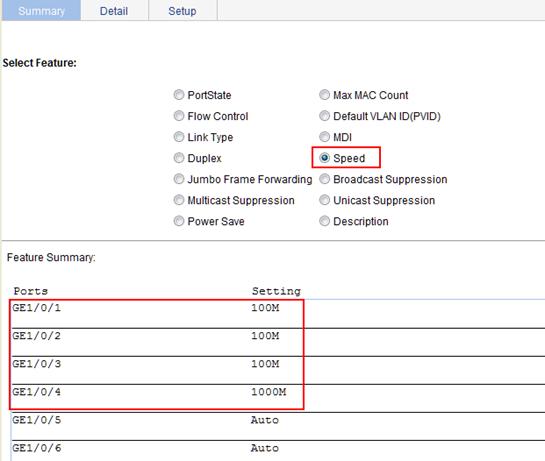
3. Display the rate settings of ports:
a. Click the Summary tab.
b. Click the Speed button to display the rate information of all ports on the lower part of the page, as shown in Figure 28.
Figure 28 Displaying the rate settings of ports
Overview
Port mirroring refers to the process of copying the packets passing through a port/VLAN/CPU to the monitor port connecting to a monitoring device for packet analysis.
Terminologies of port mirroring
Mirroring source
The mirroring source can be one or more monitored ports, called source ports. The device where the ports reside is called a "source device." Packets (called "mirrored packets") passing through them are copied to a port connecting to a monitoring device for packet analysis.
Mirroring destination
The mirroring destination is the destination port (also known as the monitor port) of mirrored packets and connects to the data monitoring device. The device where the monitor port resides is called the "destination device." The monitor port forwards the mirrored packets to its connecting monitoring device.
A monitor port might receive multiple duplicates of a packet in some cases because it can monitor multiple mirroring sources. For example, assume that Port 1 is monitoring bidirectional traffic on Port 2 and Port 3 on the same device. If a packet travels from Port 2 to Port 3, two duplicates of the packet will be received on Port 1.
Mirroring direction
The mirroring direction indicates that the inbound, outbound, or bidirectional traffic can be copied on a mirroring source:
· Inbound—Copies packets received on a mirroring source.
· Outbound—Copies packets sent out of a mirroring source.
· Bidirectional—Copies packets both received and sent on a mirroring source.
Mirroring group
Port mirroring is implemented through mirroring groups, which fall into local, remote source, and remote destination mirroring groups. For more information about the mirroring groups, see "Port mirroring classification and implementation."
Remote probe VLAN
Used for Layer 2 remote port mirroring, a remote probe VLAN specially transmits mirrored packets to the destination device. For more information, see "Port mirroring classification and implementation."
Port mirroring classification and implementation
According to the locations of the mirroring source and the mirroring destination, port mirroring includes local port mirroring and remote port mirroring.
Local port mirroring
In local port mirroring, the mirroring source and the mirroring destination are on the same device. A mirroring group that contains the mirroring source and the mirroring destination on the device is called a "local mirroring group."
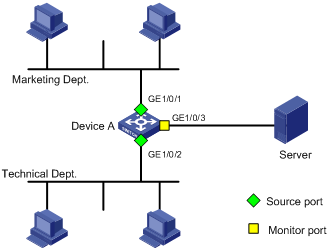
Figure 29 Local port mirroring implementation
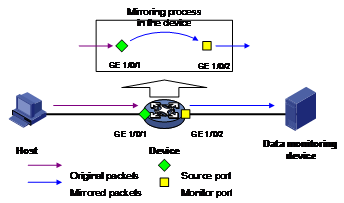
As shown in Figure 29, the source port GigabitEthernet 1/0/1 and monitor port GigabitEthernet 1/0/2 reside on the same device. Packets of GigabitEthernet 1/0/1 are copied to GigabitEthernet 1/0/2, which then forwards the packets to the data monitoring device for analysis.
Configuration guidelines
When you configure port mirroring, follow these guidelines:
· You can configure multiple source ports, but only one monitor port for a local mirroring group.
· You can configure multiple source ports for a remote source mirroring group and only one monitor port for a remote monitor mirroring group.
· A port can serve as a source port for multiple mirroring groups, but cannot serve as the monitor port for another mirroring group.
· To ensure normal operation of mirroring, do not enable the spanning tree feature on the monitor port.
· Use a monitor port for port mirroring only. This is to make sure the data monitoring device receives and analyzes only the mirrored traffic rather than a mix of mirrored traffic and normally forwarded traffic.
Recommended configuration procedures
To configure local port mirroring:
|
Step |
Remarks |
|
1. Configure a local mirroring group. |
Required. For more information, see "Configuring a mirroring group." Select the mirroring group type local in the Type list. |
|
2. Configure mirroring ports for the mirroring group. |
Required. For more information, see "Configuring ports for a mirroring group." Select the port type Mirror Port. |
|
3. Configure the monitor port for the mirroring group. |
Required. For more information, see "Configuring ports for a mirroring group." Select the port type Monitor Port. |
Configuring a mirroring group
1. From the navigation tree, select Device > Port Mirroring.
2. Click the Add tab.
The page for adding a mirroring group appears.
Figure 30 Adding a mirroring group
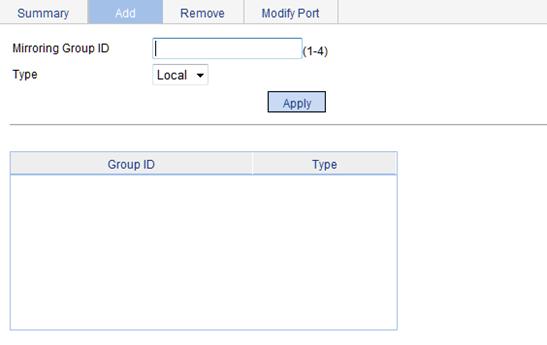
3. Configure the mirroring group, as described in Table 8.
4. Click Apply.
|
Item |
Description |
|
Mirroring Group ID |
ID of the mirroring group to be added. The range for the mirroring group ID varies with devices. |
|
Type |
Specify the type of the mirroring group to be added: Local means adding a local mirroring group. |
Configuring ports for a mirroring group
1. From the navigation tree, select Device > Port Mirroring.
2. Click the Modify Port tab.
The page for configuring ports for a mirroring group appears.
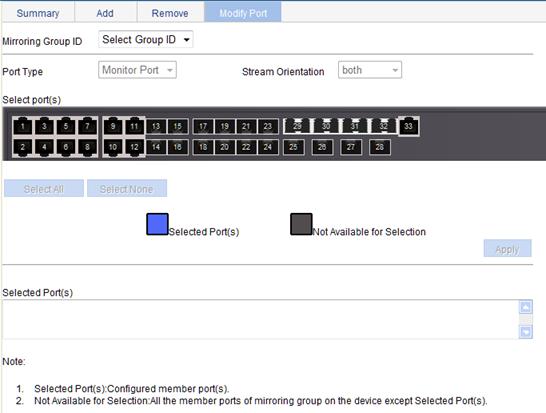
3. Configure ports for the mirroring group, as described in Table 9.
4. Click Apply.
A progress dialog box appears.
5. After the success notification appears, click Close.
|
Item |
Description |
|
|
Mirroring Group ID |
ID of the mirroring group to be configured. The available groups were added previously. Select a Local mirroring group ID to configure ports for the local mirroring group. |
|
|
Port Type |
Set the type of the port to be configured. |
Configure ports for a local mirroring group: · Monitor Port—Configures the monitor ports for the local mirroring group. · Mirror Port—Configures mirroring ports for the local mirroring group. |
|
Stream Orientation |
When you select Remote Source from the Type of the mirroring group list, set the direction of the traffic monitored by the monitor port of the mirroring group: · both—Mirrors both received and sent packets on mirroring ports. · inbound—Mirrors only packets received by mirroring port. · outbound—Mirrors only packets sent by mirroring ports. |
|
|
Select port(s) |
Click the ports to be configured on the chassis front panel. If aggregate interfaces are configured on the device, the page displays a list of aggregate interfaces below the chassis front panel. You can select aggregate interfaces from this list and configure them as mirroring ports of a port mirroring group. |
|
Local port mirroring configuration example
Network requirements
As shown in Figure 32, Configure local port mirroring on Switch A to monitor the packets received and sent by the Marketing department and Technical department.
Configuring local port mirroring
1. Add a local mirroring group:
a. From the navigation tree, select Device > Port Mirroring.
b. Click the Add tab.
The page for add mirroring groups appears.
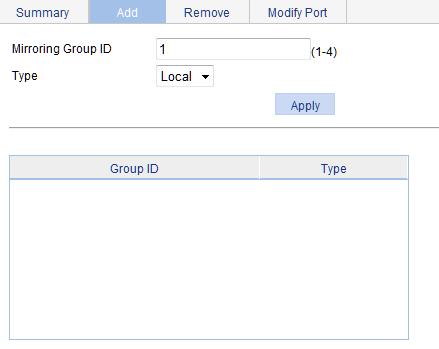
c. Enter 1 for Mirroring Group ID.
d. From the Type list, select Local.
e. Click Apply.
Figure 33 Adding a local mirroring group
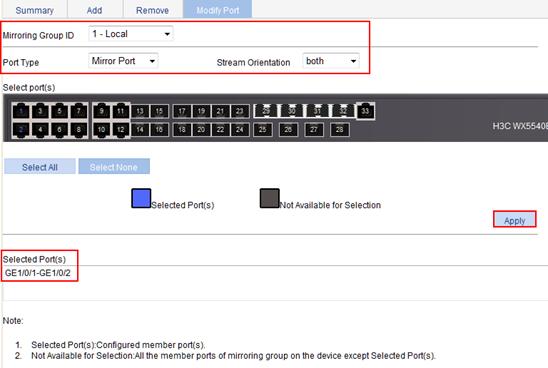
2. Configure the mirroring ports as GigabitEthernet 1/0/1 and GigabitEthernet 1/0/2:
a. Click the Modify Port tab to enter the page.
b. From the Mirroring Group ID list, select 1 – Local.
c. From the Port Type list, select Mirror Port.
d. From the Stream Orientation list, select both.
e. On the chassis front panel, select 1 (GigabitEthernet 1/0/1) and 2 (GigabitEthernet 1/0/2),
f. Click Apply.
A configuration progress dialog box appears.
g. After the success notification appears, click Close.
Figure 34 Configuring the mirroring ports
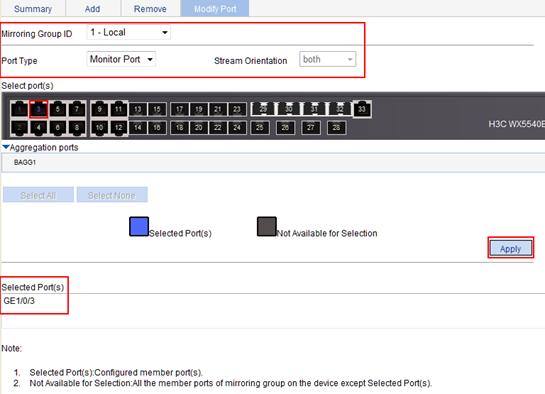
3. Configure the monitor port as GigabitEthernet 1/0/3:
a. Click the Modify Port tab to enter the page.
b. From the Mirroring Group ID list, select 1 – Local.
c. From the Port Type list, select Monitor Port.
d. On the chassis front panel, select 3 (GigabitEthernet 1/0/3).
e. Click Apply.
A configuration progress dialog box appears.
f. After the success notification appears, click Close.
Figure 35 Configuring the monitor port
In the user management part, you can perform the following operations:
· Add a local user, and specify the password, access level, and service types for the user.
· Set the super password for non-management level users to switch to the management level.
· Switch the current Web user access level to the management level.
Adding a local user
1. From the navigation tree, select Device > Users.
2. Click the Create tab.
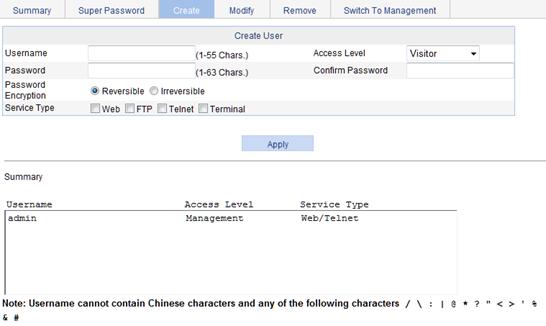
3. Configure a local user, as described in Table 10.
4. Click Apply.
|
Item |
Description |
|
Username |
Enter a username for the user. |
|
Access Level |
Select an access level for the user. Users of different levels can perform different operations. User levels, in order from low to high, are as follows: · Visitor—Users of this level can perform only ping and traceroute operations. They can neither access the data on the device nor configure the device. · Monitor—Users of this level can perform ping and traceroute operations and access the data on the device, but they cannot configure the device. · Configure—Users of this level can perform ping and traceroute operations, access data on the device, and configure the device, but they cannot upgrade the host software, add/delete/modify users, or back up or restore the configuration file. · Management—Users of this level can perform any operations on the device. |
|
Password |
Set the password for the user. |
|
Confirm Password |
Enter the same password again. Otherwise, the system will prompt that the two passwords are not consistent when you apply the configuration. |
|
Service Type |
Select the service types for the user to use, including Web, FTP, Telnet, and terminal. You must select at least one service type. |
Setting the super password
A management level user can set the password for non-management level users to switch to the management level. If you do not configure the password, users cannot switch to the management level from a lower level.
To set the super password:
1. From the navigation tree, select Device > Users.
2. Click the Super Password tab.
Figure 37 Setting the super password
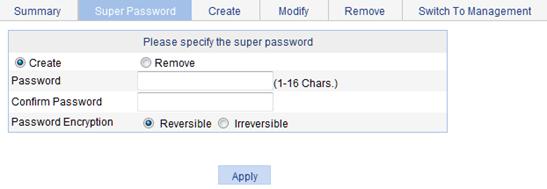
3. Configure a super password, as described in Table 11.
4. Click Apply.
|
Item |
Description |
|
Create/Remove |
Select the operation type: · Create—Configure or change the super password. · Remove—Remove the current super password. |
|
Password |
Set the password for non-management level users to switch to the management level. |
|
Confirm Password |
Enter the same password again. Otherwise, the system will prompt that the two passwords are not consistent when you apply the configuration. |
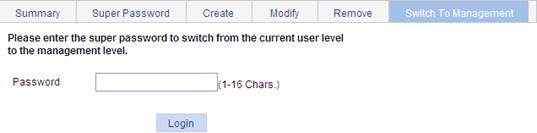
Switching the user access level to the management level
This function allows a user to switch from the current user level to the management level. To switch to the management level, a user must provide the correct super password.
The switchover operation does not change the access level configured for the user. The access level switchover of a user is only effective for the current login. When the user logs in to the Web interface again, the access level of the user is still the original level.
To switch to the management level:
1. From the navigation tree, select Device > Users.
2. Click the Switch To Management tab.
3. Enter the correct super password.
4. Click Login.
Figure 38 Switching to the management level
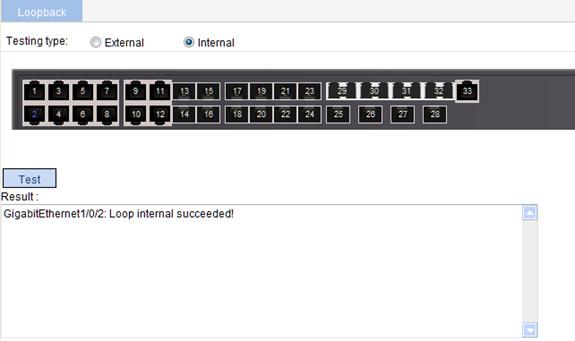
You can check whether an Ethernet port works normally by performing the Ethernet port loopback test, during which the port cannot forward data packets normally.
Ethernet port loopback test can be one of the following types:
· Internal loopback test—Self loop is established in the switching chip to check whether there is a chip failure related to the functions of the port.
· External loopback test—A loopback plug is used on the port. Packets forwarded by the port will be received by itself through the loopback plug. The external loopback test can be used to check whether there is a hardware failure on the port.
Configuration guidelines
When you configure a loopback test, follow these guidelines:
· You can perform an internal loopback test but not an external loopback test on a port that is physically down. You can perform neither test on a port that is manually shut down.
· The system does not allow Rate, Duplex, Cable Type, and Port Status configuration on a port under a loopback test.
· An Ethernet port operates in full duplex mode when the loopback test is performed. It restores its original duplex mode after the loopback test.
Configuration procedure
1. From the navigation tree, select Device > Loopback.
The loopback test configuration page appears.
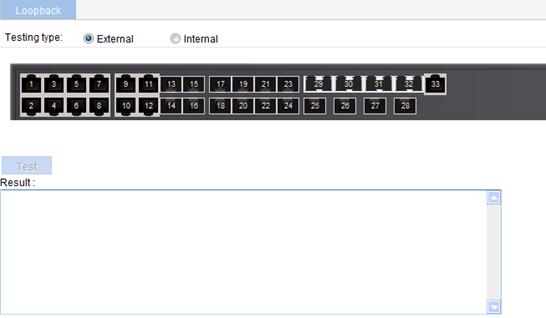
2. Select an External or Internal option for loopback test type.
3. On the chassis front panel, select an Ethernet interface.
4. Click Test.
After the test is complete, the loopback test result is displayed.
Figure 40 Loopback test result
Overview
You can use the Virtual Cable Test (VCT) function to check the status of the cable connected to an Ethernet port on the device. The result is returned in less than 5 seconds. The test covers whether short circuit or open circuit occurs on the cable and the length of the faulty cable.
The optical interface of a Combo port does not support this feature.
A link in the up state goes down and then up automatically if you perform this operation on one of the Ethernet interfaces forming the link.
Testing cable status
1. From the navigation tree, select Device > VCT.
The page for testing cable status appears.
2. On the chassis front panel, select the port you want to test.
3.
Click Test.
The test result is returned within five seconds and
displayed in the Result field.
Figure 41 Testing the status of the cable connected to an Ethernet port
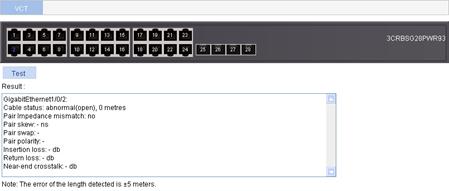
The result displays the cable status and length. The cable status can be normal, abnormal, abnormal (open), abnormal (short), or failure.
¡ When a cable is normal, the cable length displayed is the total length of the cable.
¡ When a cable is abnormal, the cable length displayed is the length between the current port and the location where fault occurs.
¡ The cable length detected can have an error of up to 5 meters.
With the flow interval module, you can view the number of packets and bytes sent and received by a port, and the bandwidth use of the port over the specified interval.
Setting the traffic statistics generating interval
1. From the navigation tree, select Device > Flow interval.
2. Click the Interval Configuration tab.
Figure 42 Setting the traffic statistics generating interval
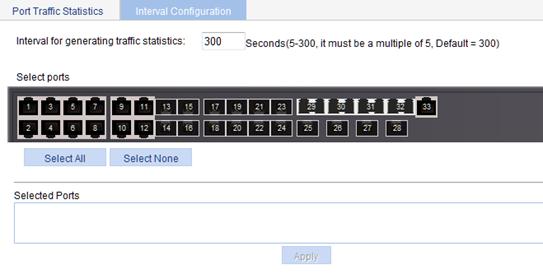
3. Set the traffic statistics generating interval, as described in Table 12.
|
Item |
Remarks |
|
Interval for generating traffic statistics |
Set the interval for generating port traffic statistics. |
|
Select ports |
Select ports from the chassis front panel to apply the interval to them. |
Viewing port traffic statistics
1. From the navigation tree, select Device > Flow interval.
The Port Traffic Statistics tab appears.
2. View the number of packets and bytes sent and received by each port, and the bandwidth use of each port over the last interval.
Figure 43 Port traffic statistics
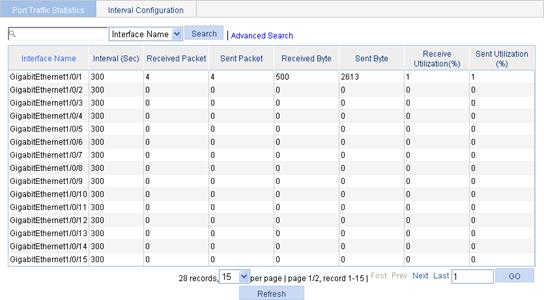
When the bandwidth utilization is lower than 1%, 1% is displayed.
The storm constrain function limits traffic of a port within a predefined upper threshold to suppress packet storms in an Ethernet. With this function enabled on a port, the system detects the amount of broadcast traffic, multicast traffic, and unknown unicast traffic reaching the port periodically. When a type of traffic exceeds the threshold for it, the function, as configured, blocks or shuts down the port. Also, it has an optional setting of sending trap messages and logs.
Alternatively, you can configure the storm suppression function to control a specific type of traffic. For more information about the storm suppression function, see "Managing ports." As the storm suppression function and the storm constrain function are mutually exclusive, do not enable them at the same time on an Ethernet port. For example, with unknown unicast storm suppression enabled on a port, do not enable storm constrain for unknown unicast traffic on the port.
· Block—Blocks the port. The port is blocked and stops forwarding the traffic of this type until the type of traffic drops down below the lower threshold. A port blocked by the storm constrain function can still forward other types of traffic and collect statistics for the blocked traffic.
· Shutdown—Shuts down the port. The port is shut down and stops forwarding all types of traffic. It cannot automatically restore even when the type of traffic drops down below the lower threshold. To bring up the port, select Device > Port Management to configure the port (see "Managing ports"), or cancel the storm constrain setting on the port.
Setting the traffic statistics generating interval
When you set the traffic statistics generating interval, follow these guidelines:
· The traffic statistics generating interval set here is the interval used by the storm constrain function for measuring traffic against the traffic thresholds. It is different from the interval set in the flow interval module, which is used for measuring the average traffic sending and receiving rates over a specific interval.
· For network stability sake, set the traffic statistics generating interval for the storm constrain function to the default or a greater value.
To set the traffic statistics generating interval:
1. From the navigation tree, select Device > Storm Constrain.
2. In the Interval for generating traffic statistics field, enter the traffic statistics generating interval for storm constrain.
3. Click Apply.
Figure 44 The storm constrain tab
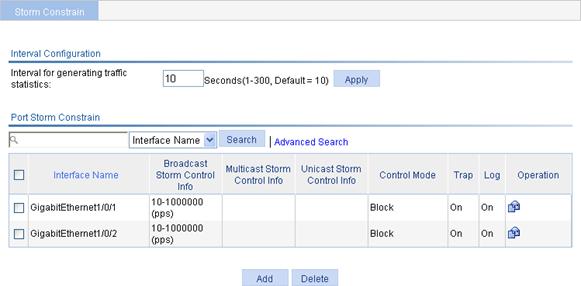
Configuring storm constrain
1. From the navigation tree, select Device > Storm Constrain.
2. In the Port Storm Constrain area, click Add.
The page for adding port storm constrain configuration appears.
Figure 45 Adding storm constrain settings for ports

3. Set the storm constraint function, as described in Table 13.
4. Click Apply.
|
Item |
Remarks |
|
Control Mode |
Specify the action to be performed when a type of traffic exceeds the upper threshold. Available options include: · None—Performs no action. · Block—Blocks the traffic of this type on a port when the type of traffic exceeds the upper threshold. · Shutdown—Shuts down the port when a type of traffic exceeds the traffic threshold. The port stops forwarding traffic as a result. After being enabled, the storm constrain function requires a full traffic statistics generating interval (in seconds) to collect traffic data. it analyzes the data in the next interval. If you enable the function when the packet storm is present, it is normal that a period longer than one traffic statistics generating interval is required for a control action to happen. Nevertheless, the action will be taken within two intervals. |
|
Broadcast Threshold |
Set the broadcast, multicast, and unknown unicast thresholds: · None—Performs no storm constrain for the selected port or ports. · pps—Specifies the storm constrain upper threshold and lower threshold in pps. · ratio—Specifies the storm constrain upper threshold and lower threshold in percentage of received packets to the transmission capability of each selected port. · kbps—Specifies the storm constrain upper threshold and lower threshold in kbps. When you configure the broadcast, multicast, and unknown unicast thresholds, follow these guidelines: · On a port, you can set the thresholds for broadcast, multicast, and unknown unicast traffic at the same time. To set storm constrain on a port successfully, you must specify the thresholds for at least a type of traffic. · When you select the pps option, the upper threshold and lower threshold ranges depend on the interface type, as shown in the pps range description on the page. |
|
Multicast Threshold |
|
|
Unicast Threshold |
|
|
Trap |
Select or clear the box to enable or disable the system to send trap messages both when an upper threshold is crossed and when the lower threshold is crossed after that. |
|
Log |
Select or clear the box to enable or disable the system to output logs both when an upper threshold is crossed and when the lower threshold is crossed after that. |
|
Select ports |
Select ports from the chassis front panel to apply the storm constrain settings to them. |
Overview
Remote Monitoring (RMON) is an enhancement to SNMP for remote device management and traffic monitoring. An RMON monitor, typically the RMON agent embedded in a network device, periodically or continuously collects traffic statistics for the network attached to a port, and when a statistic crosses a threshold, logs the crossing event and sends a trap to the management station.
RMON uses SNMP traps to notify NMSs of exceptional conditions. RMON SNMP traps report various events, including traffic events such as broadcast traffic threshold exceeded. In contrast, SNMP standard traps report device operating status changes such as link up, link down, and module failure.
RMON enables proactive monitoring and management of remote network devices and subnets. The managed device can automatically send a trap when a statistic crosses an alarm threshold, and the NMS does not need to constantly poll MIB variables and compare the results. As a result, network traffic is reduced.
Working mechanism
RMON monitors typically take one of the following forms:
· Dedicated RMON probes. NMSs can obtain management information from RMON probes directly and control network resources. In this approach, NMSs can obtain all RMON MIB information.
· RMON agents embedded in network devices. NMSs exchange data with RMON agents by using basic SNMP operations to gather network management information. Because this approach is resource intensive, most RMON agent implementations provide only four groups of MIB information: alarm, event, history, and statistics.
H3C devices provide the embedded RMON agent function. You can configure your device to collect and report traffic statistics, error statistics, and performance statistics.
RMON groups
Among the RFC 2819 defined RMON groups, H3C implements the statistics group, history group, event group, and alarm group supported by the public MIB. H3C also implements a private alarm group, which enhances the standard alarm group.
Ethernet statistics group
The statistics group defines that the system collects various traffic statistics on an interface (only Ethernet interfaces are supported), and saves the statistics in the Ethernet statistics table (ethernetStatsTable) for future retrieval. The interface traffic statistics include network collisions, CRC alignment errors, undersize/oversize packets, broadcasts, multicasts, bytes received, and packets received.
After you create a statistics entry for an interface, the statistics group starts to collect traffic statistics on the interface. The statistics in the Ethernet statistics table are cumulative sums.
History group
The history group defines that the system periodically collects traffic statistics on interfaces and saves the statistics in the history record table (ethernetHistoryTable). The statistics include bandwidth utilization, number of error packets, and total number of packets.
The history statistics table record traffic statistics collected for each sampling interval. The sampling interval is user-configurable.
Event group
The event group defines event indexes and controls the generation and notifications of the events triggered by the alarms defined in the alarm group and the private alarm group. The events can be handled in one of the following ways:
· Log—Logs event information (including event name and description) in the event log table of the RMON MIB, so the management device can get the logs through the SNMP Get operation.
· Trap—Sends a trap to notify an NMS of the event.
· Log-Trap—Logs event information in the event log table and sends a trap to the NMS.
· None—No action.
Alarm group
The RMON alarm group monitors alarm variables, such as the count of incoming packets (etherStatsPkts) on an interface. After you define an alarm entry, the system gets the value of the monitored alarm variable at the specified interval. If the value of the monitored variable is greater than or equal to the rising threshold, a rising event is triggered. If the value of the monitored variable is smaller than or equal to the falling threshold, a falling event is triggered. The event is then handled as defined in the event group.
If an alarm entry crosses a threshold multiple times in succession, the RMON agent generates an alarm event only for the first crossing. For example, if the value of a sampled alarm variable crosses the rising threshold multiple times before it crosses the falling threshold, only the first crossing triggers a rising alarm event, as shown in Figure 46.
Figure 46 Rising and falling alarm events

Recommended configuration procedure
Configuring the RMON statistics function
The RMON statistics function can be implemented by either the Ethernet statistics group or the history group, but the objects of the statistics are different, as follows:
· A statistics object of the Ethernet statistics group is a variable defined in the Ethernet statistics table, and the recorded content is a cumulative sum of the variable from the time the statistics entry is created to the current time. Perform the tasks in Table 14 to configure RMON Ethernet statistics function.
· A statistics object of the history group is the variable defined in the history record table, and the recorded content is a cumulative sum of the variable in each period. Perform the tasks in Table 15 to configure RMON history statistics function.
Table 14 RMON statistics group configuration task list
|
Task |
Remarks |
|
Required. You can create up to 100 statistics entries in a statistics table. After you create a statistics entry on an interface, the system collects various traffic statistics on the interface, including network collisions, CRC alignment errors, undersize/oversize packets, broadcasts, multicasts, bytes received, and packets received. The statistics are cleared at a reboot.
You can create only one statistics entry on one interface. |
Table 15 RMON history group configuration task list
|
Task |
Remarks |
|
Required. You can create up to 100 history entries in a history table. After an entry is created, the system periodically samples the number of packets received/sent on the current interface. It saves the statistics as an instance under the leaf node of the etherHistoryEntry table.
When you create an entry, if the value of the specified sampling interval is identical to that of the existing history entry, the system considers their configurations are the same and the creation fails. |
Configuring the RMON alarm function
To send traps to the NMS when an alarm is triggered, configure the SNMP agent as described in "Configuring SNMP" before configuring the RMON alarm function.
Perform the tasks in Table 16 to configure RMON alarm function.
Table 16 RMON alarm configuration task list
|
Task |
Remarks |
|
Required. You can create up to 100 statistics entries in a statistics table. As the alarm variables that can be configured through the Web interface are MIB variables that defined in the history group or the statistics group, configure the RMON Ethernet statistics function or the RMON history statistics function on the monitored Ethernet interface. After you create a statistics entry on an interface, the system collects various traffic statistics on the interface, including network collisions, CRC alignment errors, undersize/oversize packets, broadcasts, multicasts, bytes received, and packets received. The statistics are cleared at a reboot.
You can create only one statistics entry for one interface. |
|
|
Required. You can create up to 60 event entries for an event table. An event entry defines event indexes and the actions the system takes, including log the event, send a trap to the NMS, take no action, and log the event and send a trap to the NMS.
You cannot create an entry if the values of the specified alarm variable, sampling interval, sampling type, rising threshold and falling threshold are identical to those of an existing entry in the system. |
|
|
Required. You can create up to 60 alarm entries for an alarm table. With an alarm entry created, the specified alarm event is triggered when an abnormity occurs. The alarm event defines how to deal with the abnormity.
You cannot create an entry if the values of the specified event description, owners, and actions are identical to those of an existing entry in the system. |
Displaying RMON running status
After you configure the RMON statistics function or the alarm function, you can view RMON running status and verify the configuration by performing tasks in Table 17.
Table 17 Displaying RMON running status
|
Task |
Remarks |
|
View the interface statistics during the period from the time the statistics entry is created to the time the page is displayed. The statistics are cleared after the device reboots. |
|
|
After you create a history control entry on an interface, the system calculates the information of the interface periodically and saves the information to the etherHistoryEntry table. You can perform this task to view the entries in this table. When you configure the history group, the system specifies the number of history sampling records that can be displayed and the history sampling interval. |
|
|
If you configure the system to log an event after the event is triggered when you configure the event group, the event is recorded in the RMON log. Perform this task to display the details of the log table. |
Configuring a statistics entry
1. From the navigation tree, select Device > RMON.
The Statistics tab page appears.
Figure 47 Statistics entry
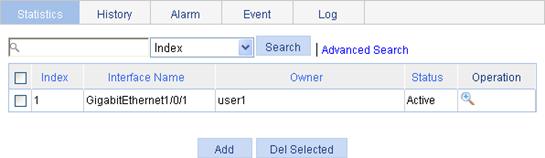
2. Click Add.
The page for adding a statistics entry appears.
Figure 48 Adding a statistics entry
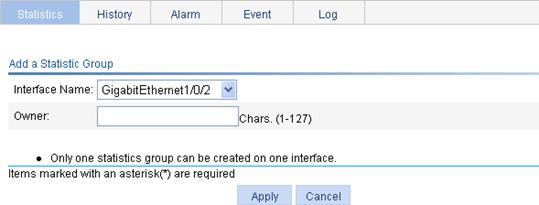
3. Configure a statistic entry, as described in Table 18.
4. Click Apply.
|
Item |
Description |
|
Interface Name |
Select the name of the interface on which the statistics entry is created. Only one statistics entry can be created on one interface. |
|
Owner |
Set the owner of the statistics entry. |
Configuring a history entry
1. From the navigation tree, select Device > RMON.
2. Click the History tab.
The History tab page appears.
Figure 49 History entry
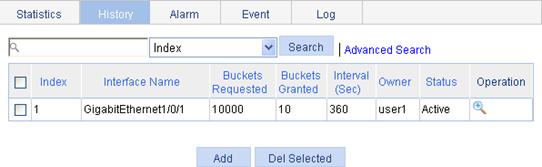
3. Click Add.
The page for adding a history entry appears.
Figure 50 Adding a history entry
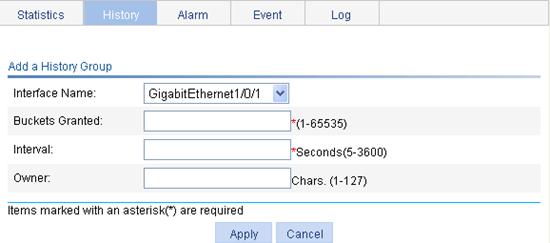
4. Configure a history entry, as described in Table 19.
5. Click Apply.
|
Item |
Description |
|
Interface Name |
Select the name of the interface on which the history entry is created. |
|
Buckets Granted |
Set the capacity of the history record list corresponding to this history entry (the maximum number of records that can be saved in the history record list). If the current number of the entries in the table has reached the maximum number, the system deletes the earliest entry to save the latest one. The statistics include total number of received packets on the current interface, total number of broadcast packets, and total number of multicast packets in a sampling period. |
|
Interval |
Set the sampling period. |
|
Owner |
Set the owner of the entry. |
Configuring an event entry
1. From the navigation tree, select Device > RMON.
2. Click the Event tab.
The Event tab page appears.
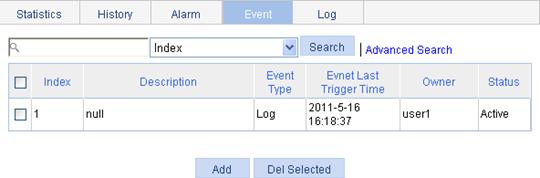
3. Click Add.
The page for adding an event entry appears.
Figure 52 Adding an event entry
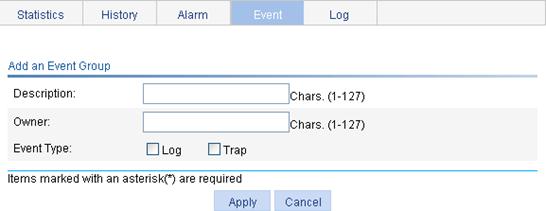
4. Configure an event entry, as described in Table 20.
5. Click Apply.
|
Item |
Description |
|
Description |
Set the description for the event. |
|
Owner |
Set the entry owner. |
|
Event Type |
Set the actions that the system takes when the event is triggered: · Log—The system logs the event. · Trap—The system sends a trap in the community name of null. If you select both Log and Trap, the system logs the event and sends a trap. If neither is selected, the system takes no action. |
Configuring an alarm entry
1. From the navigation tree, select Device > RMON.
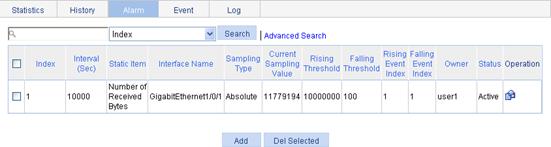
2. Click the Alarm tab.
The Alarm tab page appears.
Figure 53 Alarm entry
3. Click Add.
The page for adding an alarm entry appears.
Figure 54 Adding an alarm entry
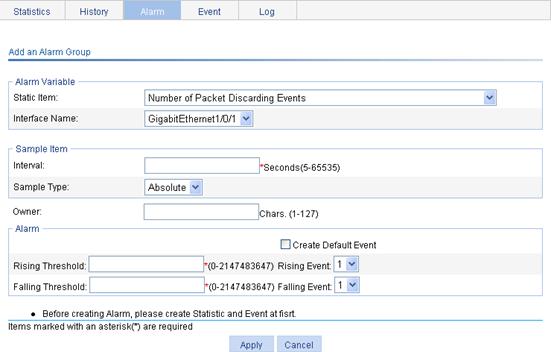
4. Configure an alarm entry, as described in Table 21.
5. Click Apply.
|
Item |
Description |
|
Alarm variable: |
|
|
Static Item |
Set the traffic statistics that are collected and monitored. For more information, see Table 22. |
|
Interface Name |
Set the name of the interface whose traffic statistics are collected and monitored. |
|
Sample Item: |
|
|
Interval |
Set the sampling interval. |
|
Sample Type |
Set the sampling type: · Absolute—Absolute sampling to obtain the value of the variable when the sampling time is reached. · Delta—Delta sampling to obtain the variation value of the variable during the sampling interval when the sampling time is reached. |
|
Owner: |
Set the owner of the alarm entry. |
|
Alarm: |
|
|
Create Default Event |
Select whether to create a default event. The description of the default event is default event, the action is log-and-trap, and the owner is default owner. If there is no event, you can create the default event. And when the value of the alarm variable is higher than the alarm rising threshold or lower than the alarm falling threshold, the system adopts the default action, that is, log-and-trap. |
|
Rising Threshold |
Set the alarm rising threshold. |
|
Rising Event |
Set the action that the system takes when the value of the alarm variable is higher than the alarm rising threshold. If you select the Create Default Event box, this option is not configurable. |
|
Falling Threshold |
Set the alarm falling threshold. |
|
Falling Event |
Set the action that the system takes when the value of the alarm variable is lower than the alarm falling threshold. If you select the Create Default Event box, this option is not configurable. |
Displaying RMON statistics
1. From the navigation tree, select Device > RMON.
The page in Figure 47 appears.
2.
Click the ![]() icon of the
statistics entry of an interface.
icon of the
statistics entry of an interface.
The page for displaying RMON statistics appears.
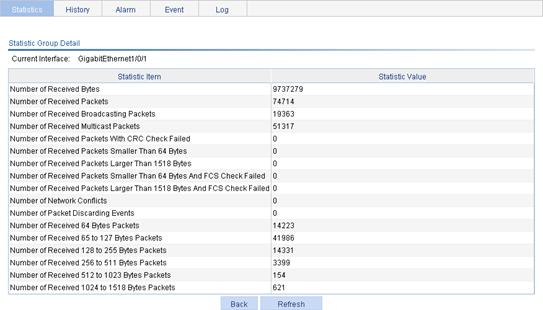
3. View statistics items on the current interface.
Table 22 Field description
|
Field |
Description |
|
Number of Received Bytes |
Total number of octets received by the interface, corresponding to the MIB node etherStatsOctets. |
|
Number of Received Packets |
Total number of packets received by the interface, corresponding to the MIB node etherStatsPkts. |
|
Number of Received Broadcasting Packets |
Total number of broadcast packets received by the interface, corresponding to the MIB node etherStatsBroadcastPkts. |
|
Number of Received Multicast Packets |
Total number of multicast packets received by the interface, corresponding to the MIB node etherStatsMulticastPkts. |
|
Number of Received Packets With CRC Check Failed |
Total number of packets with CRC errors received on the interface, corresponding to the MIB node etherStatsCRCAlignErrors. |
|
Number of Received Packets Smaller Than 64 Bytes |
Total number of undersize packets (shorter than 64 octets) received by the interface, corresponding to the MIB node etherStatsUndersizePkts. |
|
Number of Received Packets Larger Than 1518 Bytes |
Total number of oversize packets (longer than 1518 octets) received by the interface, corresponding to the MIB node etherStatsOversizePkts. |
|
Number of Received Packets Smaller Than 64 Bytes And FCS Check Failed |
Total number of undersize packets (shorter than 64 octets) with CRC errors received by the interface, corresponding to the MIB node etherStatsFragments. |
|
Number of Received Packets Larger Than 1518 Bytes And FCS Check Failed |
Number of oversize packets (longer than 1518 octets) with CRC errors received by the interface, corresponding to the MIB node etherStatsJabbers. |
|
Number of Network Conflicts |
Total number of collisions received on the interface, corresponding to the MIB node etherStatsCollisions. |
|
Number of Packet Discarding Events |
Total number of drop events received on the interface, corresponding to the MIB node etherStatsDropEvents. |
|
Number of Received 64 Bytes Packets |
Total number of received packets with 64 octets on the interface, corresponding to the MIB node etherStatsPkts64Octets. |
|
Number of Received 65 to 127 Bytes Packets |
Total number of received packets with 65 to 127 octets on the interface, corresponding to the MIB node etherStatsPkts65to127Octets. |
|
Number of Received 128 to 255 Bytes Packets |
Total number of received packets with 128 to 255 octets on the interface, corresponding to the MIB node etherStatsPkts128to255Octets. |
|
Number of Received 256 to 511 Bytes Packets |
Total number of received packets with 256 to 511 octets on the interface, corresponding to the MIB node etherStatsPkts256to511Octets. |
|
Number of Received 512 to 1023 Bytes Packets |
Total number of received packets with 512 to 1023 octets on the interface, corresponding to the MIB node etherStatsPkts512to1023Octets. |
|
Number of Received 1024 to 1518 Bytes Packets |
Total number of received packets with 1024 to 1518 octets on the interface, corresponding to the MIB node etherStatsPkts1024to1518Octets. |
Displaying RMON history sampling information
1. From the navigation tree, select Device > RMON.
2. Click the History tab.
The page in Figure 49 appears.
3.
Click the ![]() icon of a history entry.
icon of a history entry.
The page for displaying RMON history sampling information appears.
Figure 56 RMON history sampling information
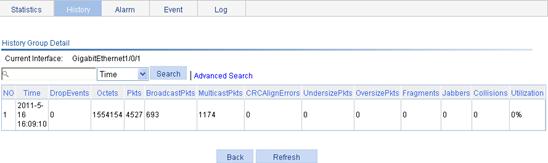
4. View history sampling information on the current interface.
Table 23 Field description
|
Field |
Description |
|
NO |
Number of the entry in the system buffer. Statistics are numbered chronologically when they are saved to the system buffer. |
|
Time |
Time at which the information is saved. |
|
DropEvents |
Dropped packets during the sampling period, corresponding to the MIB node etherHistoryDropEvents. |
|
Octets |
Number of octets received during the sampling period, corresponding to the MIB node etherHistoryOctets. |
|
Pkts |
Number of packets received during the sampling period, corresponding to the MIB node etherHistoryPkts. |
|
BroadcastPkts |
Number of broadcasts received during the sampling period, corresponding to the MIB node etherHistoryBroadcastPkts. |
|
MulticastPkts |
Number of multicasts received during the sampling period, corresponding to the MIB node etherHistoryMulticastPkts. |
|
CRCAlignErrors |
Number of packets received with CRC alignment errors during the sampling period, corresponding to the MIB node etherHistoryCRCAlignErrors. |
|
UndersizePkts |
Number of undersize packets received during the sampling period, corresponding to the MIB node etherHistoryUndersizePkts. |
|
OversizePkts |
Number of oversize packets received during the sampling period, corresponding to the MIB node etherHistoryOversizePkts. |
|
Fragments |
Number of fragments received during the sampling period, corresponding to the MIB node etherHistoryFragments. |
|
Jabbers |
Number of jabbers received during the sampling period, corresponding to the MIB node etherHistoryJabbers. |
|
Collisions |
Number of collision packets received during the sampling period, corresponding to the MIB node etherHistoryCollisions. |
|
Utilization |
Bandwidth utilization during the sampling period, corresponding to the MIB node etherHistoryUtilization. |
Displaying RMON event logs
1. From the navigation tree, select Device > RMON.
2. Click the Log tab.
The page for displaying log information appears.
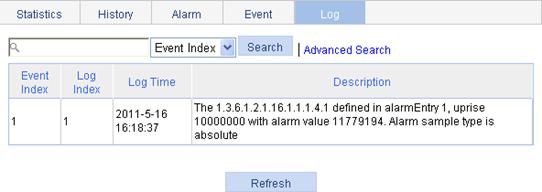
3. View log information for all event entries.
In this example, event 1 has generated one log, which is triggered because the alarm value (11779194) exceeds the rising threshold (10000000). The sampling type is absolute.
RMON configuration example
Network requirements
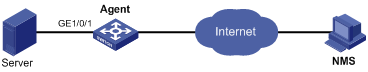
As shown in Figure 58, create an entry in the RMON Ethernet statistics table to gather statistics on GigabitEthernet 1/0/1 with the sampling interval being ten seconds, and perform corresponding configurations so that the system logs the event when the number of bytes received on the interface more than 1000 or less than 100.
Configuration procedure
1. Configure RMON to gather statistics for GigabitEthernet 1/0/1:
a. From the navigation tree, select Device > RMON.
The Statistics tab page appears.
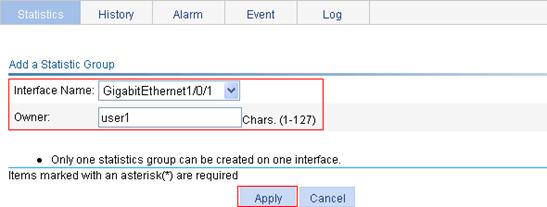
b. Click Add.
The page in Figure 59 appears.
c. From the Interface Name list. select GigabitEthernet1/0/1.
d. In the Owner field, enter user1.
e. Click Apply.
Figure 59 Adding a statistics entry
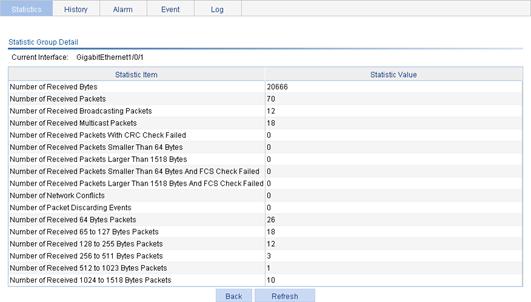
2. Display RMON statistics for GigabitEthernet 1/0/1:
a. Click the icon ![]() corresponding to GigabitEthernet 1/0/1.
corresponding to GigabitEthernet 1/0/1.
b. View this information, as shown in Figure 60.
Figure 60 Displaying RMON statistics
3. Create an event to start logging after the event is triggered:
a. Click the Event tab.
b. Click Add.
The page in Figure 61 appears.
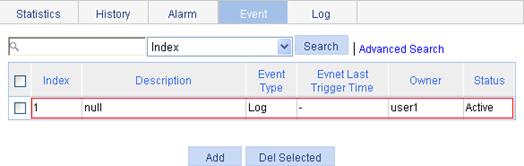
c. Enter user1-rmon in the Owner field, select the box before Log, and click Apply.
The page displays the event entry, and you can see that the entry index of the new event is 1, as shown in Figure 62.
Figure 61 Configuring an event group

Figure 62 Displaying the index of an event entry
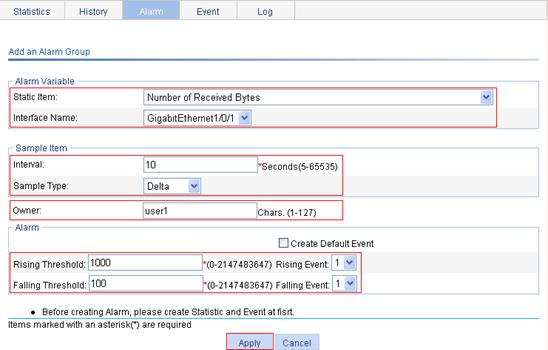
4. Configure an alarm group to sample received bytes on GigabitEthernet 1/0/1. When the received bytes exceed the rising or falling threshold, logging is enabled:
a. Click the Alarm tab.
b. Click Add.
The page in Figure 63 appears.
c. Select Number of Received Bytes from the Static Item list, select GigabitEthernet1/0/1 from the Interface Name list, enter 10 in the Interval field, select Delta from the Simple Type list, enter user1 in the Owner field, enter 1000 in the Rising Threshold field, select 1 from the Rising Event list, enter 100 in the Falling Threshold field, select 1 from the Falling Event list, and click Apply.
Figure 63 Configuring an alarm group
Verifying the configuration
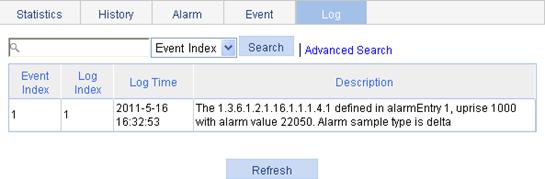
After the above configuration, when the alarm event is triggered, you can view the log information about event 1 on the Web interface.
1. From the navigation tree, select Device > RMON.
2. Click the Log tab.
The page displaying log information appears. The information indicates that event 1 has generated one log, which is triggered because the alarm value (22050) exceeds the rising threshold (1000). The sampling type is absolute.
Figure 64 Log information for event 1
Energy saving enables a port to work at the lowest transmission speed, disable PoE, or go down during a specific time range on certain days of a week. The port resumes when the effective time period ends.
Configuring energy saving on a port
1. From the navigation tree, select Device > Energy Saving.
The energy saving configuration page appears.
2. Click a port.
Figure 65 Energy saving configuration page
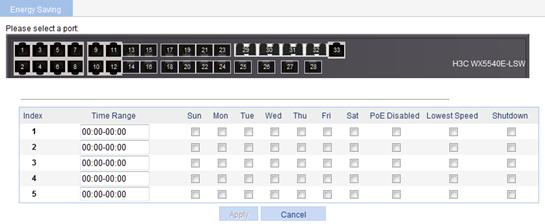
3. Configure an energy saving policy for the port, as described in Table 24.
4. Click Apply.
|
Item |
Description |
|
Time Range |
Set the time period when the port is in the state of energy saving.
· Up to five energy saving policies with different time ranges can be configured on a port. · Specify the start time and end time in units of 5 minutes, such as 08:05 to 10:15. Otherwise, the start time is postponed and the end time is brought forward so that they meet the requirements. For example, if you set the time range to 08:08 to 10:12, the effective time range is 08:10 to 10:10. |
|
Sun through Sat |
|
|
PoE Disabled |
Disable PoE on the port. |
|
Lowest Speed |
Set the port to transmit data at the lowest speed. If you configure the lowest speed limit on a port that does not support 10 Mbps, the configuration cannot take effect. |
|
Shutdown |
Shut down the port. An energy saving policy can have all the three energy saving schemes configured, of which the shutdown scheme takes the highest priority. |
This chapter provides an overview of the Simple Network Management Protocol (SNMP) and guides you through the configuration procedure.
Overview
SNMP is an Internet standard protocol widely used for a management station to access and operate the devices on a network, regardless of their vendors, physical characteristics and interconnect technologies.
SNMP enables network administrators to read and set the variables on managed devices for state monitoring, troubleshooting, statistics collection, and other management purposes.
SNMP mechanism
The SNMP framework comprises the following elements:
· SNMP manager—Works on an NMS to monitor and manage the SNMP-capable devices in the network.
· SNMP agent—Works on a managed device to receive and handle requests from the NMS, and send traps to the NMS when some events, such as interface state change, occur.
· Management Information Base (MIB)—Specifies the variables (for example, interface status and CPU usage) maintained by the SNMP agent for the SNMP manager to read and set.
Figure 66 Relationship between an NMS, agent and MIB
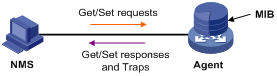
A MIB stores variables called "nodes" or "objects" in a tree hierarchy and identifies each node with a unique OID. An OID is a string of numbers that describes the path from the root node to a leaf node. For example, the object B in Figure 67 is uniquely identified by the OID {1.2.1.1}.
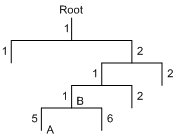
SNMP provides the following basic operations:
· Get—The NMS retrieves SNMP object nodes in an agent MIB.
· Set—The NMS modifies the value of an object node in an agent MIB.
· Notifications—Includes traps and informs. SNMP agent sends traps or informs to report events to the NMS. The difference between these two types of notification is that informs require acknowledgement but traps do not. The device supports only traps.
SNMP protocol versions
H3C supports SNMPv1, SNMPv2c, and SNMPv3. An NMS and an SNMP agent must use the same SNMP version to communicate with each other.
· SNMPv1—Uses community names for authentication. To access an SNMP agent, an NMS must use the same community name as set on the SNMP agent. If the community name used by the NMS is different from the community name set on the agent, the NMS cannot establish an SNMP session to access the agent or receive traps and notifications from the agent.
· SNMPv2c—Uses community names for authentication. SNMPv2c is compatible with SNMPv1, but supports more operation modes, data types, and error codes.
· SNMPv3—Uses a user-based security model (USM) to secure SNMP communication. You can configure authentication and privacy mechanisms to authenticate and encrypt SNMP packets for integrity, authenticity, and confidentiality.
Recommended configuration procedure
SNMPv3 differs from SNMPv1 and SNMPv2c in configurations. The following describes their configuration procedures separately.
Table 25 SNMPv1 or SNMPv2c configuration task list
|
Step |
Remarks |
|
Required. The SNMP agent function is disabled by default.
If SNMP agent is disabled, all SNMP agent-related configurations are removed. |
|
|
Optional. After creating SNMP views, you can specify an SNMP view for an SNMP community to limit the MIB objects that can be accessed by the SNMP community. |
|
|
Required. |
|
|
Optional. Allows you to configure that the agent can send SNMP traps to the NMS, and configure information about the target host (usually the NMS) of the SNMP traps. The SNMP agent sends traps to inform the NMS of important events, such as a reboot. By default, an agent is allowed to send SNMP traps to the NMS. |
|
|
Optional. |
Table 26 SNMPv3 configuration task list
|
Step |
Remarks |
|
Required. The SNMP agent function is disabled by default.
If SNMP agent is disabled, all SNMP agent-related configurations are removed. |
|
|
Optional. After creating SNMP views, you can specify an SNMP view for an SNMP group to limit the MIB objects that can be accessed by the SNMP group. |
|
|
Required. After creating an SNMP group, you can add SNMP users to the group when creating the users. Therefore, you can realize centralized management of users in the group through the management of the group. |
|
|
Required. Before creating an SNMP user, you need to create the SNMP group to which the user belongs.
After you change the local engine ID, the existing SNMPv3 users become invalid, and you must re-create the SNMPv3 users. For more information about engine ID, see "Enabling SNMP agent." |
|
|
Optional. Allows you to configure that the agent can send SNMP traps to the NMS, and configure information about the target host (usually the NMS) of the SNMP traps. The SNMP agent sends traps to inform the NMS of important events, such as a reboot. By default, an agent is allowed to send SNMP traps to the NMS. |
|
|
Optional. |
Enabling SNMP agent
1. From the navigation tree, select Device > SNMP.
The SNMP configuration page appears.
Figure 68 Setup tab
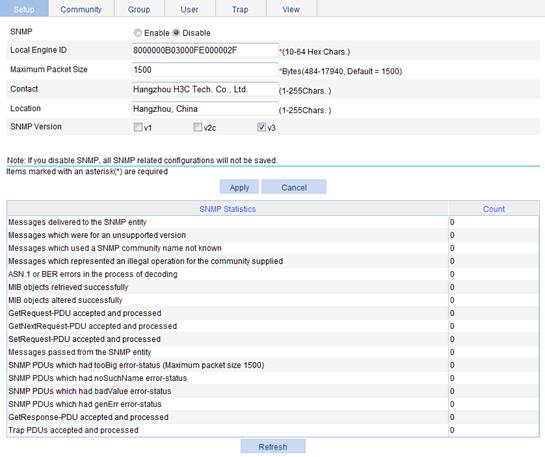
2. Configure SNMP settings on the upper part of the page, as described in Table 27.
3. Click Apply.
|
Item |
Description |
|
SNMP |
Specify to enable or disable SNMP agent. |
|
Local Engine ID |
Configure the local engine ID. The validity of a user after it is created depends on the engine ID of the SNMP agent. If the engine ID when the user is created is not identical to the current engine ID, the user is invalid. |
|
Maximum Packet Size |
Configure the maximum size of an SNMP packet that the agent can receive or send. |
|
Contact |
Set a character string to describe contact information for system maintenance. If the device is faulty, the maintainer can contact the manufacture factory according to the contact information of the device. |
|
Location |
Set a character string to describe the physical location of the device. |
|
SNMP Version |
Set the SNMP version run by the system. |
Configuring an SNMP view
Creating an SNMP view
1. From the navigation tree, select Device > SNMP.
2. Click the View tab.
The View tab appears.
Figure 69 View tab
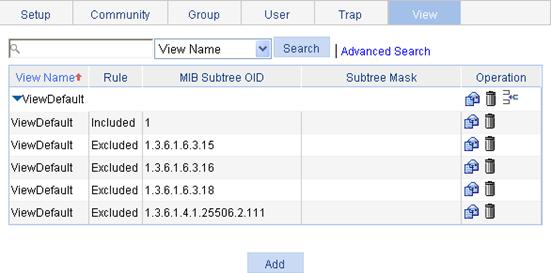
3. Click Add.
The Add View window appears.
Figure 70 Creating an SNMP view (1)
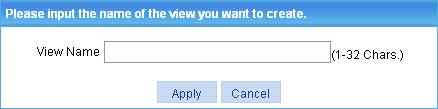
4. Enter the view name.
5. Click Apply.
The page in Figure 71 appears.
Figure 71 Creating an SNMP view (2)
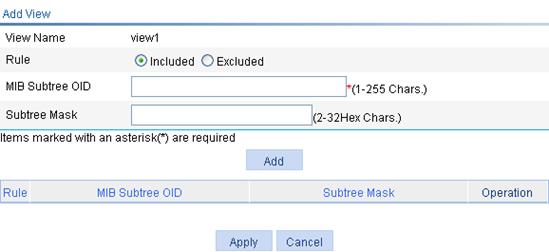
6. Configure the parameters, as described in Table 28.
7. Click Add to add the rule into the list box at the lower part of the page.
8. Repeat steps 6 and 7 to add more rules for the SNMP view.
9. Click Apply.
To cancel the view, click Cancel.
|
Item |
Description |
|
View Name |
Set the SNMP view name. |
|
Rule |
Select to exclude or include the objects in the view range determined by the MIB subtree OID and subtree mask. |
|
MIB Subtree OID |
Set the MIB subtree OID (such as 1.4.5.3.1) or name (such as system). MIB subtree OID identifies the position of a node in the MIB tree, and it can uniquely identify a MIB subtree. |
|
Subtree Mask |
Set the subtree mask, a hexadecimal string. Its length must be an even number in the range of 2 to 32. If no subtree mask is specified, the default subtree mask (all Fs) will be used for mask-OID matching. |
Adding rules to an SNMP view
1. From the navigation tree, select Device > SNMP.
2. Click the View tab.
The page in Figure 69 appears.
3.
Click the ![]() icon of the target view.
icon of the target view.
The Add rule for the view ViewDefault window appears.
Figure 72 Adding rules to an SNMP view
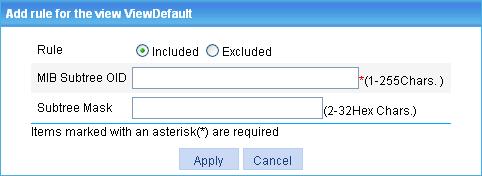
4. Configure the parameters, as described in Table 28.
5. Click Apply.
|
|
NOTE: You can modify the rules of a view in the
page you enter by clicking the |
Configuring an SNMP community
1. From the navigation tree, select Device > SNMP.
2. Click the Community tab.
The Community tab appears.
Figure 73 Configuring an SNMP community
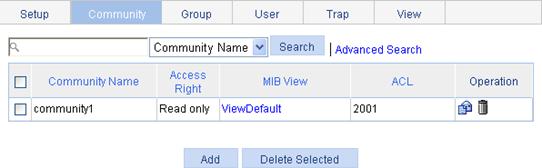
3. Click Add.
The Add SNMP Community page appears.
Figure 74 Creating an SNMP Community
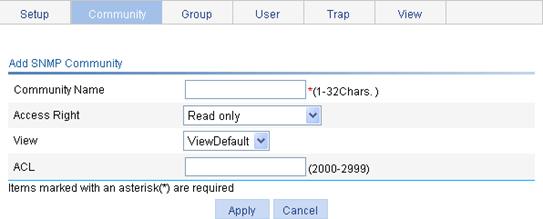
4. Configure the SNMP community, as described in Table 29.
5. Click Apply.
|
Item |
Description |
|
Community Name |
Set the SNMP community name. |
|
Access Right |
Configure SNMP NMS access right: · Read only—The NMS can perform read-only operations to the MIB objects when it uses this community name to access the agent. · Read and write—The NMS can perform both read and write operations to the MIB objects when it uses this community name to access the agent. |
|
View |
Specify the view associated with the community to limit the MIB objects that can be accessed by the NMS. |
|
ACL |
Associate the community with a basic ACL to allow or prohibit the access to the agent from the NMS with the specified source IP address. |
Configuring an SNMP group
1. From the navigation tree, select Device > SNMP.
2. Click the Group tab.
The Group tab appears.
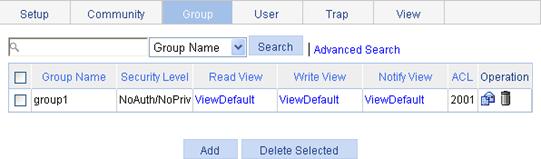
3. Click Add.
The Add SNMP Group page appears.
Figure 76 Creating an SNMP group
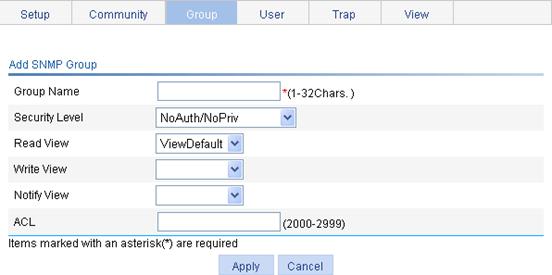
4. Configure SNMP group, as described in Table 30.
5. Click Apply.
|
Item |
Description |
|
Group Name |
Set the SNMP group name. |
|
Security Level |
Select the security level for the SNMP group: · NoAuth/NoPriv—No authentication no privacy. · Auth/NoPriv—Authentication without privacy. · Auth/Priv—Authentication and privacy.
For an existing SNMP group, its security level cannot be modified. |
|
Read View |
Select the read view of the SNMP group. |
|
Write View |
Select the write view of the SNMP group. If no write view is configured, the NMS cannot perform the write operations to all MIB objects on the device. |
|
Notify View |
Select the notify view of the SNMP group, that is, the view that can send trap messages. If no notify view is configured, the agent does not send traps to the NMS. |
|
ACL |
Associate a basic ACL with the group to restrict the source IP address of SNMP packets, that is, you can configure to allow or prohibit SNMP packets with a specific source IP address, so as to restrict the intercommunication between the NMS and the agent. |
Configuring an SNMP user
1. From the navigation tree, select Device > SNMP.
2. Click the User tab.
The User tab appears.
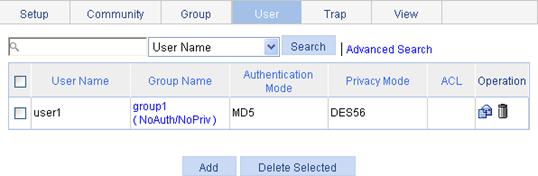
3. Click Add.
The Add SNMP User page appears.
Figure 78 Creating an SNMP user
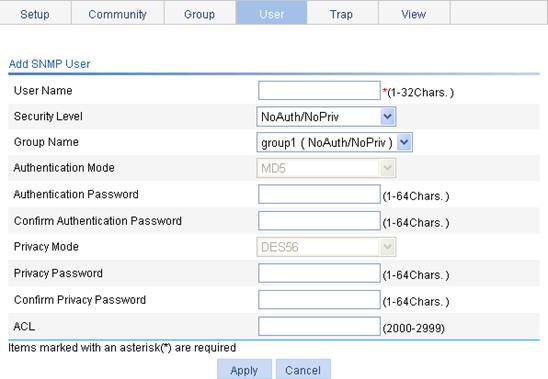
4. Configure the SNMP user, as described in Table 31.
5. Click Apply.
|
Item |
Description |
|
User Name |
Set the SNMP user name. |
|
Security Level |
Select the security level for the SNMP group. The available security levels are: · NoAuth/NoPriv—No authentication no privacy. · Auth/NoPriv—Authentication without privacy. · Auth/Priv—Authentication and privacy. |
|
Group Name |
Select an SNMP group to which the user belongs: · When the security level is NoAuth/NoPriv, you can select an SNMP group with no authentication no privacy. · When the security level is Auth/NoPriv, you can select an SNMP group with no authentication no privacy or authentication without privacy. · When the security level is Auth/Priv, you can select an SNMP group of any security level. |
|
Authentication Mode |
Select an authentication mode (including MD5 and SHA) when the security level is Auth/NoPriv or Auth/Priv. |
|
Authentication Password |
Set the authentication password when the security level is Auth/NoPriv or Auth/Priv. The confirm authentication password must be the same with the authentication password. |
|
Confirm Authentication Password |
|
|
Privacy Mode |
Select a privacy mode (including DES56, AES128, and 3DES) when the security level is Auth/Priv. |
|
Privacy Password |
Set the privacy password when the security level is Auth/Priv. The confirm privacy password must be the same with the privacy password. |
|
Confirm Privacy Password |
|
|
ACL |
Associate a basic ACL with the user to restrict the source IP address of SNMP packets, that is, you can configure to allow or prohibit SNMP packets with a specific source IP address, so as to allow or prohibit the specified NMS to access the agent by using this user name. |
Configuring SNMP trap function
1. From the navigation tree, select Device > SNMP.
2. Click the Trap tab.
The Trap tab appears.
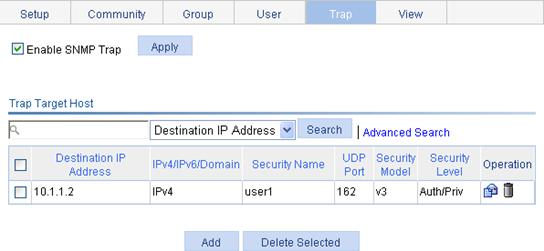
3. Select Enable SNMP Trap.
4. Click Apply to enable the SNMP trap function.
5. Click Add.
The page for adding a target host of SNMP traps appears.
Figure 80 Adding a target host of SNMP traps
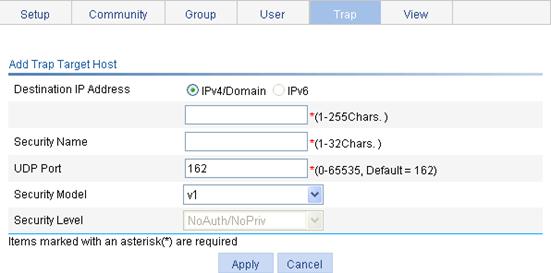
6. Configure the settings for the target host, as described in Table 32.
7. Click Apply.
|
Item |
Description |
|
Destination IP Address |
Set the destination IP address. Select the IP address type: IPv4/domain name or IPv6, and then enter the corresponding IP address or domain name in the field according to the IP address type. The device does not support IPv6 addresses. |
|
Security Name |
Set the security name, which can be an SNMPv1 community name, an SNMPv2c community name, or an SNMPv3 user name. |
|
UDP Port |
Set UDP port number.
The default port number is 162, which is the SNMP-specified port used for receiving traps on the NMS. Generally (such as using IMC or MIB Browser as the NMS), you can use the default port number. To change this parameter to another value, you need to make sure that the configuration is the same with that on the NMS. |
|
Security Model |
Select the security model, that is, the SNMP version. Make sure that the SNMP version is the same with that on the NMS; otherwise, the NMS cannot receive any trap. |
|
Security Level |
Set the authentication and privacy mode for SNMP traps when the security model is selected as v3. The available security levels are: no authentication no privacy, authentication but no privacy, and authentication and privacy. When the security model is selected as v1 or v2c, the security level is no authentication no privacy, and cannot be modified. |
Displaying SNMP packet statistics
From the navigation tree, select Device > SNMP.
The page for displaying SNMP packet statistics appears.
Figure 81 SNMP packet statistics
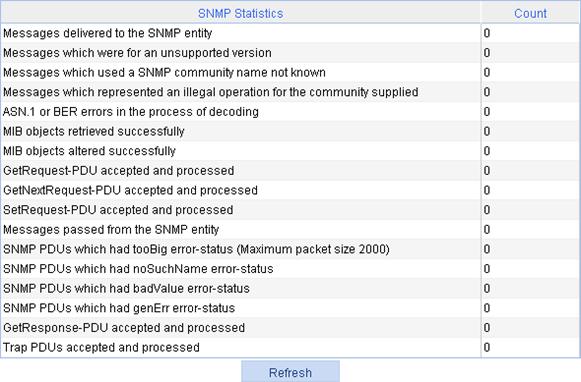
SNMPv1/v2c configuration example
Network requirements
As shown in Figure 82, the NMS at 1.1.1.2/24 uses SNMPv1 or SNMPv2c to manage the switch (agent) at 1.1.1.1/24, and the switch automatically sends traps to report events to the NMS.
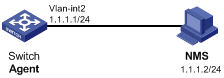
Configuring the agent
1. Enable SNMP:
a. From the navigation tree, select Device > SNMP.
The SNMP configuration page appears.
Figure 83 Configuring the SNMP agent
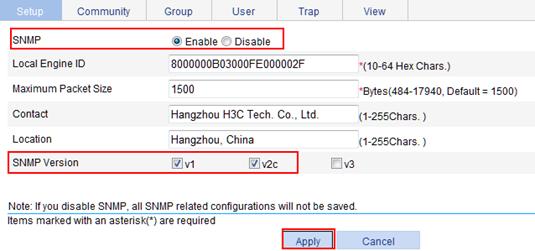
b. Select the Enable option, and select the v1 and v2 options.
c. Click Apply.
2. Configure a read-only community:
a. Click the Community tab.
b. Click Add.
The Add SNMP Community page appears.
Figure 84 Configuring an SNMP read-only community
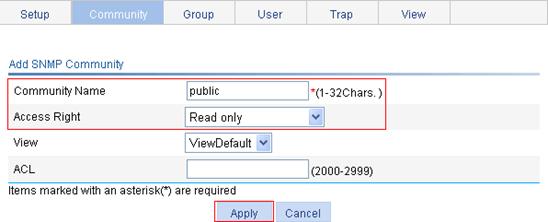
c. In the Community Name field, enter public.
d. From the Access Right list, select Read only.
e. Click Apply.
3. Configure a read and write community:
a. On the Community tab page, click Add.
The Add SNMP Community page appears.
Figure 85 Configuring an SNMP read and write community
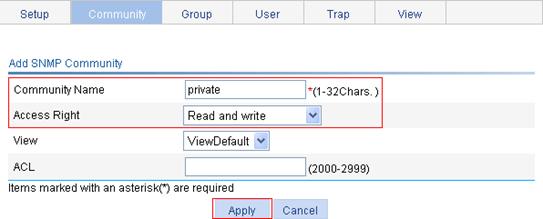
b. In the Community Name field, enter private.
c. From the Access Right list, select Read and write.
d. Click Apply.
4. Enable SNMP traps:
a. Click the Trap tab.
The Trap tab page appears.
Figure 86 Enabling SNMP traps

b. Select the box of Enable SNMP Trap.
c. Click Apply.
5. Configure a target host SNMP traps:
a. Click Add on the Trap tab page.
The page for adding a target host of SNMP traps appears.
Figure 87 Adding a trap target host
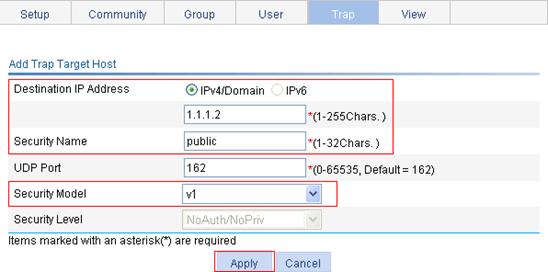
b. Select the IPv4/Domain option, enter 1.1.1.2 in the following field, type public in the Security Name field, and select v1 from the Security Model list.
c. Click Apply.
Configuring the NMS
|
|
IMPORTANT: The configuration on the NMS must be consistent with that on the agent. Otherwise, you cannot perform corresponding operations. |
To configure the NMS:
1. Configure the SNMP version for the NMS as v1 or v2c.
2. Create a read-only community and name it public.
3. Create a read and write community and name it private.
For more information about configuring the NMS, see the NMS manual.
Verifying the configuration
Verify that the NMS can access and set some MIB variables on the AC.
Shut down and bring up an idle interface on the AC, and verify that the NMS can receive the link traps from the AC.
SNMPv3 configuration example
Network requirements
As shown in Figure 88, the NMS (1.1.1.2/24) uses SNMPv3 to monitor and manage the interface status of the AP (the agent) at 1.1.1.1/24, and the AP automatically sends traps to report events to the NMS.
The NMS and the agent perform authentication when they set up an SNMP session. The authentication algorithm is MD5 and the authentication key is authkey. The NMS and the AP also encrypt the SNMP packets between them by using the DES56 algorithm and the privacy key prikey.
Configuring the agent
1. Enable SNMP agent:
a. From the navigation tree, select Device > SNMP.
The SNMP configuration page appears.
Figure 89 Configuring the SNMP agent
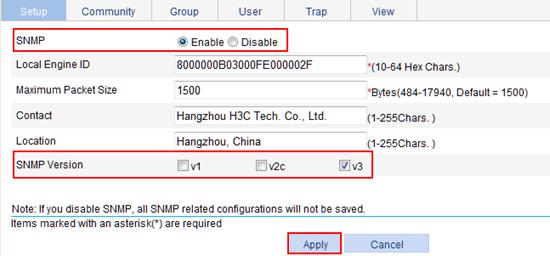
b. Select the Enable option, and select the v3 option.
c. Click Apply.
2. Configure an SNMP view:
a. Click the View tab.
b. Click Add.
The page for creating an SNMP view appears.
Figure 90 Creating an SNMP view (1)
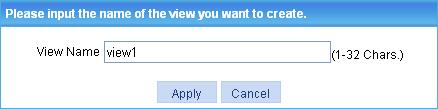
c. Type view1 in the View Name field.
d. Click Apply.
The page in Figure 91 appears.
e. Select the Included option, enter the MIB subtree OID interfaces, and click Add.
f. Click Apply.
A configuration progress dialog box appears.
g. Click Close after the configuration process is complete.
Figure 91 Creating an SNMP view (2)
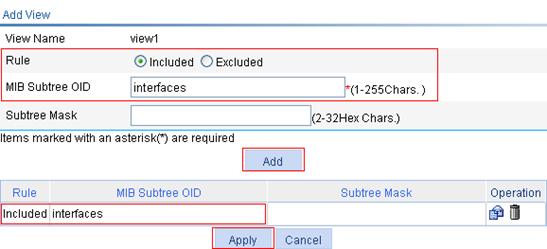
3. Configure an SNMP group:
a. Click the Group tab.
b. Click Add.
The page in Figure 92 appears.
c. Enter group1 in the Group Name field, select view1 from the Read View list, select view1 from the Write View list.
d. Click Apply.
Figure 92 Creating an SNMP group
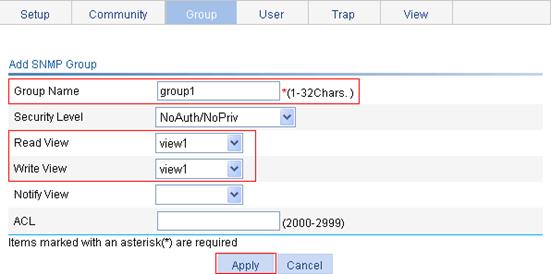
4. Configure an SNMP user:
a. Click the User tab.
b. Click Add.
The page in Figure 93 appears.
c. Enter user1 in the User Name field, select Auth/Priv from the Security Level list, select group1 from the Group Name list, select MD5 from the Authentication Mode list, enter authkey in the Authentication Password and Confirm Authentication Password fields, select DES56 from the Privacy Mode list, and enter prikey in the Privacy Password and Confirm Privacy Password fields.
d. Click Apply.
Figure 93 Creating an SNMP user
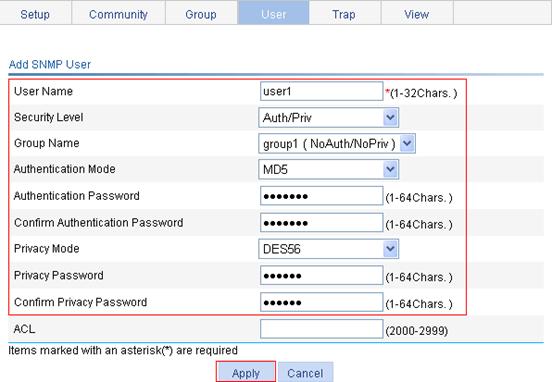
5. Enable SNMP traps:
a. Click the Trap tab.
The Trap tab page appears.
Figure 94 Enabling SNMP traps
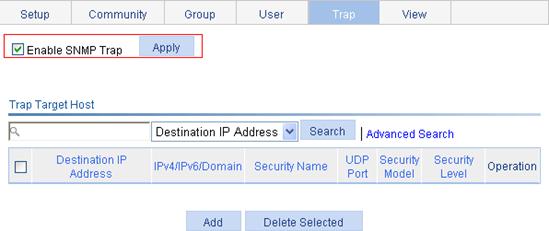
b. Select the box of Enable SNMP Trap.
c. Click Apply.
6. Configure a target host SNMP traps:
a. On the Trap tab page, click Add.
The page for adding a target host of SNMP traps appears.
Figure 95 Adding a trap target host
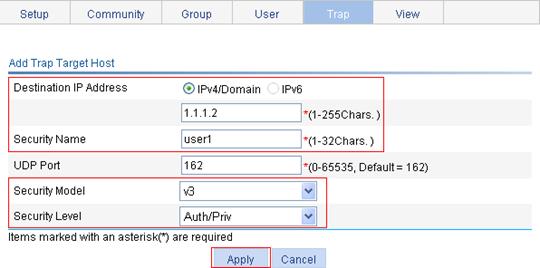
b. Select the IPv4/Domain option, enter 1.1.1.2 in the following field, enter user1 in the Security Name field, select v3 from the Security Model list, and select Auth/Priv from the Security Level list.
c. Click Apply.
Configuring the NMS
|
|
IMPORTANT: The configuration on NMS must be consistent with that on the agent. Otherwise, you cannot perform corresponding operations. |
To configure the NMS:
1. Specify the SNMP version for the NMS as v3.
2. Create an SNMP user user1.
3. Enable both authentication and privacy functions
4. Use MD5 for authentication and DES56 for encryption.
5. Set the authentication key to authkey and the privacy key to prikey.
For more information about configuring the NMS, see the NMS manual.
Verifying the configuration
Verify that the NMS can access and set some MIB variables on the AC.
Shut down and bring up an idle interface on the AC, and verify that the NMS can receive the link traps from the AC.
Overview
The interface statistics module displays statistics about the packets received and sent through interfaces.
Displaying interface statistics
From the navigation tree, select Device > Interface Statistics. The interface statistics display page appears.
Figure 96 Interface statistics display page
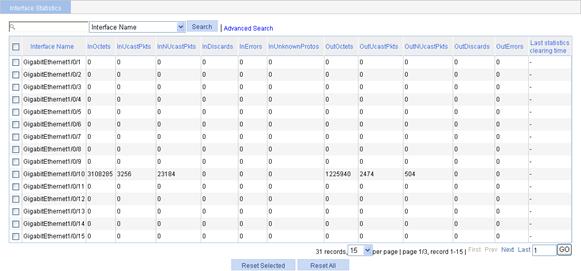
Table 33 Details about the interface statistics
|
Field |
Description |
|
InOctets |
Total octets of all packets received on the interface. |
|
InUcastPkts |
Number of received unicast packets. |
|
InNUcastPkts |
Number of received non-unicast packets. |
|
InDiscards |
Number of valid packets discarded in the inbound direction. |
|
InErrors |
Number of received invalid packets. |
|
InUnknownProtos |
Number of received unknown protocol packets. |
|
OutOctets |
Total octets of all packets sent through the interface. |
|
OutUcastPkts |
Number of unicast packets sent through the interface. |
|
OutNUcastPkts |
Number of non-unicast packets sent through the interface. |
|
OutDiscards |
Number of valid packets discarded in the outbound direction. |
|
OutErrors |
Number of invalid packets sent through the interface. |
Overview
In OAA, an Open Application Platform (OAP) module and the device work as one device. For an SNMP UDP domain-based NMS, the device and the OAP module are separate SNMP agents. They have different software systems and manage their own MIB objects. To access an SNMP agent, the NMS must obtain the IP address of the management interface on the agent.
By default, the OAP module does not have an IP address. You need to assign an IP address to the OAP module before you specify the IP address as the management IP address on the Web interface.
Configuring a management IP address
1. From the navigation tree, select Device > OAP Management.
The OAP management configuration page appears.
Figure 97 OAP Management configuration page
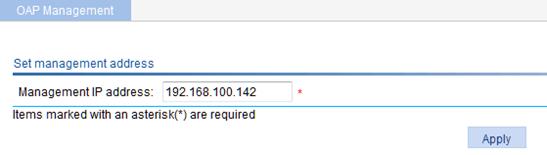
2. In the Management IP address field, enter the IP address that was assigned to the OAP module.
3. Click Apply.
