- Table of Contents
-
- 12-Network Management and Monitoring Configuration Guide
- 00-Preface
- 01-System Maintenance and Debugging Configuration
- 02-NQA Configuration
- 03-NTP Configuration
- 04-Clock Monitoring Configuration
- 05-IPC Configuration
- 06-SNMP Configuration
- 07-RMON Configuration
- 08-Sampler Configuration
- 09-Mirroring Configuration
- 10-NetStream Configuration
- 11-IPv6 NetStream Configuration
- 12-Protocol Packet Statistics Configuration
- 13-Information Center Configuration
- 14-Flow Logging Configuration
- Related Documents
-
| Title | Size | Download |
|---|---|---|
| 07-RMON Configuration | 153.83 KB |
Configuring the RMON statistics function·
Configuring the RMON Ethernet statistics function
Configuring the RMON history statistics function
Configuring the RMON alarm function
Displaying and maintaining RMON
Ethernet statistics group configuration example
History group configuration example
Alarm group configuration example
RMON overview
Introduction
Remote Monitoring (RMON) provides functions including statistics collection and alarm generation for network management stations (NMSs) to monitor and manage devices. The statistics collection function enables a managed device to periodically or continuously track traffic information, such as the count of incoming packets and the count of incoming oversized packets, for the networks attached to its ports. The alarm function enables a managed device to monitor the value of a specified MIB variable, log the event and send a trap to the management device when the value reaches the threshold, such as the port rate reaches a certain value or the potion of broadcast packets received in the total packets reaches a certain value.
Both RMON and SNMP are for remote network management.
· RMON is implemented on the basis of the SNMP, and is an enhancement to SNMP. RMON sends traps to the management device to notify the abnormality of the alarm variables by using the SNMP trap packet sending mechanism. Although trap is also defined in SNMP, it is usually used to notify the management device whether some functions on managed devices operate normally and the change of physical status of interfaces. Traps in RMON and those in SNMP have different monitored targets, triggering conditions, and report contents.
· RMON provides an efficient means of monitoring subnets and allows SNMP to monitor remote network devices in a more proactive, effective way. The RMON protocol defines that when an alarm threshold is reached on a managed device, the managed device sends a trap to the management device automatically, so the management device does not need to get the values of MIB variables for multiple times and compare them, thus greatly reducing the communication traffic between the management device and the managed device. In this way, you can manage a large scale of network easily and effectively.
Working mechanism
RMON allows multiple monitors (management devices). A monitor provides the following methods for data gathering:
· Using RMON probes. Management devices can obtain management information from RMON probes directly and control network resources. In this approach, RMON NMSs can obtain all RMON MIB information.
· Embedding RMON agents in network devices such as routers, switches, and hubs to provide the RMON probe function. Management devices exchange data with RMON agents using basic SNMP commands to gather network management information, which, due to system resources limitation, may not cover all MIB information but four groups of information, alarm, event, history, and statistics, in most cases.
The SR8800 routers adopt the second way and realize the RMON agent function. With the RMON agent function, the management device can obtain the traffic that flows among the managed devices on each connected network segments; obtain information about error statistics and performance statistics collection for network management.
RMON groups
Among the RMON groups defined by RMON specifications (RFC 2819), the device uses the statistics group, history group, event group, and alarm group supported by the public MIB. In addition, H3C also defines and implements a private alarm group, which enhances the functions of the alarm group. This section describes the five kinds of groups in general.
Ethernet statistics group
The statistics group defines that the system collects statistics of various traffic information on an interface (at present, only Ethernet interfaces are supported) and saves the statistics in the Ethernet statistics table (ethernetStatsTable) for query convenience of the management device. It provides statistics about network collisions, CRC alignment errors, undersize/oversize packets, broadcasts, multicasts, bytes received, packets received, and so on.
After the creation of a statistics entry on an interface, the statistics group starts to collect traffic statistics on the interface. The result of the statistics is a cumulative sum.
History group
The history group defines that the system periodically collects statistics of traffic information on an interface and saves the statistics in the history record table (ethernetHistoryTable) for query convenience of the management device. The statistics include bandwidth utilization, number of error packets, and total number of packets.
A history group collects statistics on packets received on the interface during each period, which can be configured at the command line interface (CLI).
Event group
The event group defines event indexes and controls the generation and notifications of the events triggered by the alarms defined in the alarm group and the private alarm group. The events can be handled in one of the following ways:
· Log—Logging event related information (the occurred events, contents of the event, and so on) in the event log table of the RMON MIB of the device, and thus the management device can check the logs through the SNMP Get operation.
· Trap—Sending a trap to notify the occurrence of this event to the network management station (NMS).
· Log-Trap—Logging event information in the event log table and sending a trap to the NMS.
· None—No action.
Alarm group
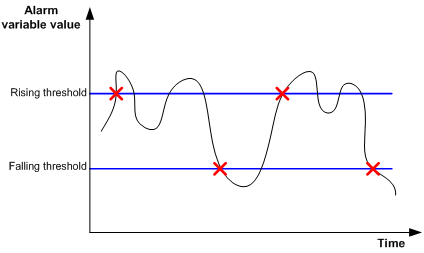
The RMON alarm group monitors specified alarm variables, such as total number of received packets (etherStatsPkts) on an interface. After you define an alarm entry, the system gets the value of the monitored alarm variable at the specified interval. When the value of the monitored variable is greater than or equal to the rising threshold, a rising event is triggered; when the value of the monitored variable is smaller than or equal to the lower threshold, a lower event is triggered. The event is then handled as defined in the event group.
If the value of a sampled alarm variable overpasses the same threshold multiple times, only the first one can cause an alarm event. In other words, the rising alarm and falling alarm are alternate. As shown in Figure 1, the value of an alarm variable (the black curve in the figure) overpasses the threshold value (the blue line in the figure) for multiple times, and multiple crossing points are generated, but only crossing points marked with the red crosses can trigger alarm events.
Figure 1 Rising and falling alarm events
Private alarm group
The private alarm group calculates the values of alarm variables and compares the result with the defined threshold, thereby realizing a more comprehensive alarming function.
The system handles the prialarm alarm table entry (as defined by the user) in the following ways:
· Periodically samples the prialarm alarm variables defined in the prialarm formula.
· Calculates the sampled values based on the prialarm formula.
· Compares the result with the defined threshold and generates an appropriate event.
|
|
NOTE: If the count result of the private alarm group overpasses the same threshold multiple times, only the first one can cause an alarm event. In other words, the rising alarm and falling alarm are alternate. |
Configuring the RMON statistics function
RMON statistics function can be implemented by either the Ethernet statistics group or the history group, but the objects of the statistics are different, you can configure a statistics group or a history group accordingly.
· A statistics object of the Ethernet statistics group is a variable defined in the Ethernet statistics table, and the recorded content is a cumulative sum of the variable from the time the statistics entry is created to the current time. For detailed configuration, see “Configuring the RMON Ethernet statistics function.”
· A statistics object of the history group is the variable defined in the history record table, and the recorded content is a cumulative sum of the variable in each period. For detailed configuration, see “Configuring the RMON history statistics function.”
Configuring the RMON Ethernet statistics function
To configure the RMON Ethernet statistics function:
|
Step |
Command |
|
1. Enter system view. |
system-view |
|
2. Enter Ethernet interface view. |
interface interface-type interface-number |
|
3. Create an entry in the RMON statistics table. |
rmon statistics entry-number [ owner text ] |
|
|
NOTE: · Only one statistics entry can be created on one interface. · You can create up to 100 statistics entries for the device. |
Configuring the RMON history statistics function
To configure the RMON history statistics function:
|
Step |
Command |
|
1. Enter system view. |
system-view |
|
2. Enter Ethernet interface view. |
interface interface-type interface-number |
|
3. Create an entry in the RMON history control table. |
rmon history entry-number buckets number interval sampling-interval [ owner text ] |
|
|
NOTE: · The entry-number must be globally unique and cannot be used on another interface; otherwise, the operation fails. · You can configure multiple history entries on one interface, but the values of the entry-number arguments must be different, and the values of the sampling-interval arguments must be different too; otherwise, the operation fails. · You can create up to 100 history entries for the device. · When you create an entry in the history table, if the specified buckets number argument exceeds the history table size supported by the device, the entry is created. However, the validated value of the buckets number argument that corresponds to the entry is the history table size supported by the device. |
Configuring the RMON alarm function
Configuration prerequisites
· To enable the managed devices to send traps to the NMS when the NMS triggers an alarm event, configure the SNMP agent as described in the chapter “SNMP configuration” before configuring the RMON alarm function.
· If the alarm variable is the MIB variable defined in the history group or the Ethernet statistics group, make sure that the RMON Ethernet statistics function or the RMON history statistics function is configured on the monitored Ethernet interface; otherwise, the creation of the alarm entry fails, and no alarm event is triggered.
Configuration procedure
To configure the RMON alarm function:
|
Step |
Command |
Remarks |
|
1. Enter system view. |
system-view |
N/A |
|
2. Create an event entry in the event table. |
rmon event entry-number [ description string ] { log | log-trap log-trapcommunity | none | trap trap-community } [ owner text ] |
N/A |
|
3. Create an entry in the alarm table or private alarm table. |
· Create an entry in the alarm table: · Create an entry in the private alarm table: |
Use at least one command. |
|
|
NOTE: · A new entry cannot be created if its parameters are identical with the corresponding parameters of an existing entry. See Table 1 for the parameters to be compared for different entries. · The system limits the total number of each type of entries (See Table 1 for the detailed numbers). When the total number of an entry reaches the maximum number of entries that can be created, the creation fails. |
Table 1 Restrictions on the configuration of RMON
|
Entry |
Parameters to be compared |
Maximum number of entries that can be created |
|
Event |
Event description (description string), event type (log, trap, logtrap or none) and community name (trap-community or log-trapcommunity) |
60 |
|
Alarm |
Alarm variable (alarm-variable), sampling interval (sampling-interval), sampling type (absolute or delta), rising threshold (threshold-value1) and falling threshold (threshold-value2) |
60 |
|
Prialarm |
Alarm variable formula (alarm-variable), sampling interval (sampling-interval), sampling type (absolute, changeratio or delta), rising threshold (threshold-value1) and falling threshold (threshold-value2) |
50 |
Displaying and maintaining RMON
|
Task |
Command |
Remarks |
|
Display RMON statistics. |
display rmon statistics [ interface-type interface-number ] [ | { begin | exclude | include } regular-expression ] |
Available in any view |
|
Display RMON history control entry and history sampling information. |
display rmon history [ interface-type interface-number ] [ | { begin | exclude | include } regular-expression ] |
Available in any view |
|
Display RMON alarm configuration information. |
display rmon alarm [ entry-number ] [ | { begin | exclude | include } regular-expression ] |
Available in any view |
|
Display RMON prialarm configuration information. |
display rmon prialarm [ entry-number ] [ | { begin | exclude | include } regular-expression ] |
Available in any view |
|
Display RMON events configuration information. |
display rmon event [ entry-number ] [ | { begin | exclude | include } regular-expression ] |
Available in any view |
|
Display log information for the specified or all event entries. |
display rmon eventlog [ event-number ] [ | { begin | exclude | include } regular-expression ] |
Available in any view |
RMON configuration examples
Ethernet statistics group configuration example
Network requirements
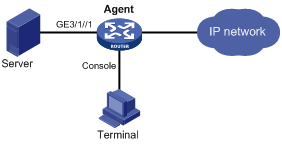
As shown in Figure 2, Agent is connected to a configuration terminal through its console port and to Server through Ethernet cables.
Gather performance statistics on received packets on GigabitEthernet 3/1/1 through RMON Ethernet statistics table, and thus the administrator can view the statistics on packets received on the interface at any time.
Configuration procedure
# Configure RMON to gather statistics for interface GigabitEthernet 3/1/1.
<Sysname> system-view
[Sysname] interface GigabitEthernet 3/1/1
[Sysname-GigabitEthernet3/1/1] rmon statistics 1 owner user1-rmon
After the above configuration, the system gathers statistics on packets received on GigabitEthernet 3/1/1.
To view the statistics of the interface:
# Execute the display command.
<Sysname> display rmon statistics GigabitEthernet 3/1/1
EtherStatsEntry 1 owned by user1-rmon is VALID.
Interface : GigabitEthernet3/1/1<ifIndex.3>
etherStatsOctets : 21657 , etherStatsPkts : 307
etherStatsBroadcastPkts : 56 , etherStatsMulticastPkts : 34
etherStatsUndersizePkts : 0 , etherStatsOversizePkts : 0
etherStatsFragments : 0 , etherStatsJabbers : 0
etherStatsCRCAlignErrors : 0 , etherStatsCollisions : 0
etherStatsDropEvents (insufficient resources): 0
Packets received according to length:
64 : 235 , 65-127 : 67 , 128-255 : 4
256-511: 1 , 512-1023: 0 , 1024-1518: 0
# Obtain the value of the MIB node directly by executing the SNMP Get operation on the NMS through software. (Details not shown)
History group configuration example
Network requirements
As shown in Figure 3, Agent is connected to a configuration terminal through its console port and to Server through Ethernet cables.
Gather statistics on received packets on GigabitEthernet 3/1/1 every one minute through RMON history statistics table, and thus the administrator can view whether data burst happens on the interface in a short time.
Configuration procedure
# Configure RMON to periodically gather statistics for interface GigabitEthernet 3/1/1.
<Sysname> system-view
[Sysname] interface GigabitEthernet 3/1/1
[Sysname-GigabitEthernet3/1/1] rmon history 1 buckets 8 interval 60 owner user1
After the above configuration, the system periodically gathers statistics on packets received on GigabitEthernet 3/1/1: the statistical interval is 1 minute, and statistics of the last 8 times are saved in the history statistics table.
To view the statistics of the interface:
# Execute the display command.
[Sysname-GigabitEthernet3/1/1] display rmon history
HistoryControlEntry 2 owned by null is VALID
Samples interface : GigabitEthernet3/1/1<ifIndex.3>
Sampled values of record 1 :
dropevents : 0 , octets : 834
packets : 8 , broadcast packets : 1
multicast packets : 6 , CRC alignment errors : 0
undersize packets : 0 , oversize packets : 0
fragments : 0 , jabbers : 0
collisions : 0 , utilization : 0
Sampled values of record 2 :
dropevents : 0 , octets : 962
packets : 10 , broadcast packets : 3
multicast packets : 6 , CRC alignment errors : 0
undersize packets : 0 , oversize packets : 0
fragments : 0 , jabbers : 0
collisions : 0 , utilization : 0
Sampled values of record 3 :
dropevents : 0 , octets : 830
packets : 8 , broadcast packets : 0
multicast packets : 6 , CRC alignment errors : 0
undersize packets : 0 , oversize packets : 0
fragments : 0 , jabbers : 0
collisions : 0 , utilization : 0
Sampled values of record 4 :
dropevents : 0 , octets : 933
packets : 8 , broadcast packets : 0
multicast packets : 7 , CRC alignment errors : 0
undersize packets : 0 , oversize packets : 0
fragments : 0 , jabbers : 0
collisions : 0 , utilization : 0
Sampled values of record 5 :
dropevents : 0 , octets : 898
packets : 9 , broadcast packets : 2
multicast packets : 6 , CRC alignment errors : 0
undersize packets : 0 , oversize packets : 0
fragments : 0 , jabbers : 0
collisions : 0 , utilization : 0
Sampled values of record 6 :
dropevents : 0 , octets : 898
packets : 9 , broadcast packets : 2
multicast packets : 6 , CRC alignment errors : 0
undersize packets : 0 , oversize packets : 0
fragments : 0 , jabbers : 0
collisions : 0 , utilization : 0
Sampled values of record 7 :
dropevents : 0 , octets : 766
packets : 7 , broadcast packets : 0
multicast packets : 6 , CRC alignment errors : 0
undersize packets : 0 , oversize packets : 0
fragments : 0 , jabbers : 0
collisions : 0 , utilization : 0
Sampled values of record 8 :
dropevents : 0 , octets : 1154
packets : 13 , broadcast packets : 1
multicast packets : 6 , CRC alignment errors : 0
undersize packets : 0 , oversize packets : 0
fragments : 0 , jabbers : 0
collisions
: 0 , utilization : 0
# Obtain the value of the MIB node directly by executing the SNMP Get operation on the NMS through software. (Details not shown)
Alarm group configuration example
Network requirements
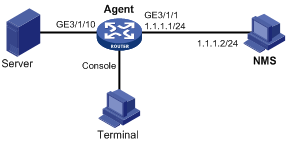
As shown in Figure 4, Agent is connected to a console terminal through its console port and to an NMS across Ethernet.
Do the following:
· Connect GigabitEthernet 3/1/10 to the FTP server. Gather statistics on traffic of the server on GigabitEthernet 3/1/10 with the sampling interval being five seconds. When traffic is above or below the thresholds, Agent sends the corresponding traps to the NMS.
· Execute the display rmon statistics command on Agent to display the statistics, and query the statistics on the NMS.
Configuration procedure
# Configure the SNMP agent. (Note that parameter values configured on the agent must be the same as the following configured on the NMS: suppose SNMPv1 is enabled on the NMS, the read community name is public, the write community name is private, the IP address of the NMS is 1.1.1.2, authentication protocol is MD5, authorization password is authkey, the privacy protocol is DES56, and the privacy password is prikey.)
<Sysname> system-view
[Sysname] snmp-agent
[Sysname] snmp-agent community read public
[Sysname] snmp-agent community write private
[Sysname] snmp-agent sys-info version v1
[Sysname] snmp-agent trap enable
[Sysname] snmp-agent target-host trap address udp-domain 1.1.1.2 params securityname public
# Configure RMON to gather statistics on interface GigabitEthernet 3/1/10.
[Sysname] interface GigabitEthernet 3/1/10
[Sysname-GigabitEthernet3/1/10] rmon statistics 1 owner user1
[Sysname-GigabitEthernet3/1/10] quit
# Create an RMON alarm entry that when the delta sampling value of node 1.3.6.1.2.1.16.1.1.1.4.1 exceeds 100 or is lower than 50, event 1 is triggered to send traps.
[Sysname] rmon event 1 trap public owner user1
[Sysname] rmon alarm 1 1.3.6.1.2.1.16.1.1.1.4.1 5 delta rising-threshold 100 1 falling-threshold 50 1
# Display the RMON alarm entry configuration.
<Sysname> display rmon alarm 1
AlarmEntry 1 owned by null is Valid.
Samples type : delta
Variable formula : 1.3.6.1.2.1.16.1.1.1.4.1<etherStatsOctets.1>
Sampling interval : 5(sec)
Rising threshold : 100(linked with event 1)
Falling threshold : 50(linked with event 2)
When startup enables : risingOrFallingAlarm
Latest value : 0
# Display statistics for interface GigabitEthernet 3/1/10.
<Sysname> display rmon statistics GigabitEthernet 3/1/10
EtherStatsEntry 1 owned by user1-rmon is VALID.
Interface : GigabitEthernet3/1/10<ifIndex.3>
etherStatsOctets : 57329 , etherStatsPkts : 455
etherStatsBroadcastPkts : 53 , etherStatsMulticastPkts : 353
etherStatsUndersizePkts : 0 , etherStatsOversizePkts : 0
etherStatsFragments : 0 , etherStatsJabbers : 0
etherStatsCRCAlignErrors : 0 , etherStatsCollisions : 0
etherStatsDropEvents (insufficient resources): 0
Packets received according to length:
64 : 7 , 65-127 : 413 , 128-255 : 35
256-511: 0 , 512-1023: 0 , 1024-1518: 0
After completing the configuration, you may query alarm events on the NMS. On the monitored device, alarm event messages are displayed when events occur. The following is a sample output:
[Sysname]
#Aug 27 16:31:34:12 2005 Sysname RMON/2/ALARMFALL:Trap 1.3.6.1.2.1.16.0.2 Alarm table 1 monitors 1.3.6.1.2.1.16.1.1.1.4.1 with sample type 2,has sampled alarm value 0 less than(or =) 50.