- Table of Contents
-
- 03-System Management Configuration Guide
- 00-Preface
- 01-Basic device management configuration
- 02-Device hardening configuration
- 03-Hardware resource management configuration
- 04-PoE configuration
- 05-Process monitoring and maintenance configuration
- 06-Information center configuration
- 07-OAP module configuration
- Related Documents
-
| Title | Size | Download |
|---|---|---|
| 03-Hardware resource management configuration | 150.54 KB |
Hardware resource management tasks at a glance
Configuring CPU usage tracking
Displaying CPU usage monitoring information
Setting memory alarm thresholds
Displaying memory usage monitoring information
Binding EM resources for matching ACL rules
Setting the temperature alarm thresholds
Displaying device temperature information
Setting the port status detection timer
Verifying and diagnosing transceiver modules
Diagnosing transceiver modules
Displaying power information for transceiver modules
Configuring transceiver health check
Managing hardware resources
This chapter describes routine device hardware resource management tasks, including monitoring CPU and memory usage, displaying power supply and fan operating status, and configuring basic device operating parameters.
Hardware resource management tasks at a glance
All hardware resource management tasks are optional. You can perform any of the tasks in any order.
¡ Configuring CPU usage tracking
¡ Displaying CPU usage monitoring information
¡ Setting memory alarm thresholds
¡ Displaying memory usage monitoring information
· Monitoring device temperature
¡ Setting the temperature alarm thresholds
¡ Displaying device temperature information
· Setting the port status detection timer
· Verifying and diagnosing transceiver modules
¡ Verifying transceiver modules
¡ Diagnosing transceiver modules
· Configuring transceiver health check
· Displaying device hardware information
· Displaying device hardware electronic label information
Monitoring CPU usage
Configuring CPU usage alarm
About this task
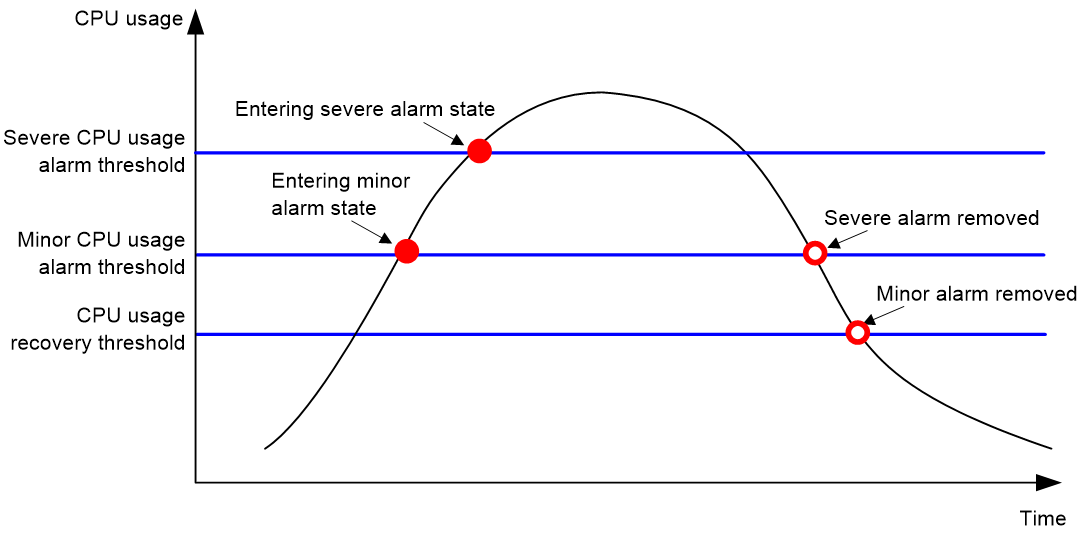
The device samples CPU usage at 1-minute intervals, and compares the samples with CPU usage thresholds to identify the CPU usage status and send alarms or notifications accordingly.
The device supports the following CPU usage thresholds:
· Minor threshold—If the CPU usage increases to or above the minor threshold but is less than the severe threshold, the CPU usage enters minor alarm state. The device sends minor alarms periodically until the CPU usage increases above the severe threshold or the minor alarm is removed.
· Severe threshold—If the CPU usage increases above the severe threshold, the CPU usage enters severe alarm state. The device sends severe alarms periodically until the severe alarm is removed.
· Recovery threshold—If the CPU usage decreases below the recovery threshold, the CPU usage enters recovered state. The device sends a recovery notification.
CPU usage alarms and notifications can be sent to NETCONF, SNMP, and the information center to be encapsulated as NETCONF events, SNMP traps and informs, and log messages. For more information about NETCONF and SNMP, see Network Management and Monitoring Configuration Guide. For more information about information center, see "Configuring the information center."
Figure 1 CPU alarms and alarm-removed notifications
Procedure
1. Enter system view.
system-view
2. Set the CPU usage alarm thresholds.
monitor cpu-usage threshold severe-threshold [ minor-threshold minor-threshold recovery-threshold recovery-threshold ] [ slot slot-number [ cpu cpu-number ] ]
By default, the CPU usage alarm threshold is 99%.
|
|
CAUTION: If you set the severe CPU usage alarm threshold to a too low value, the device will reach the threshold easily. Normal service processing will be affected. |
3. Set the CPU usage alarm resending intervals.
monitor resend cpu-usage { minor-interval minor-interval | severe-interval severe-interval } * [ slot slot-number [ cpu cpu-number ] ]
By default, the minor CPU usage alarm resending interval and severe CPU usage alarm resending interval are 300 seconds and 60 seconds, respectively.
Configuring CPU usage tracking
About this task
After you enable CPU usage tracking, the system samples CPU usage at intervals and saves the samples to a buffer. You can use the display cpu-usage history command to view the recent CPU usage.
Procedure
1. Enter system view.
system-view
2. Set the sampling interval for CPU usage tracking.
monitor cpu-usage interval interval [ slot slot-number [ cpu cpu-number ] ]
By defau
lt, the sampling interval for CPU usage tracking is 1 minute.
3. Enable CPU usage tracking.
monitor cpu-usage enable [ slot slot-number [ cpu cpu-number ] ]
By default, CPU usage tracking is enabled.
Displaying CPU usage monitoring information
Perform display tasks in any view.
· Display CPU usage monitoring settings.
display cpu-usage configuration [ slot slot-number [ cpu cpu-number ] ]
· Display the current CPU usage statistics.
display cpu-usage [ control-plane] [ summary ] [ slot slot-number [ cpu cpu-number ] ]
· Display the historical CPU usage statistics in a coordinate system.
display cpu-usage history [ job job-id ] [ slot slot-number [ cpu cpu-number ] ]
Monitoring memory usage
Setting memory alarm thresholds
About this task
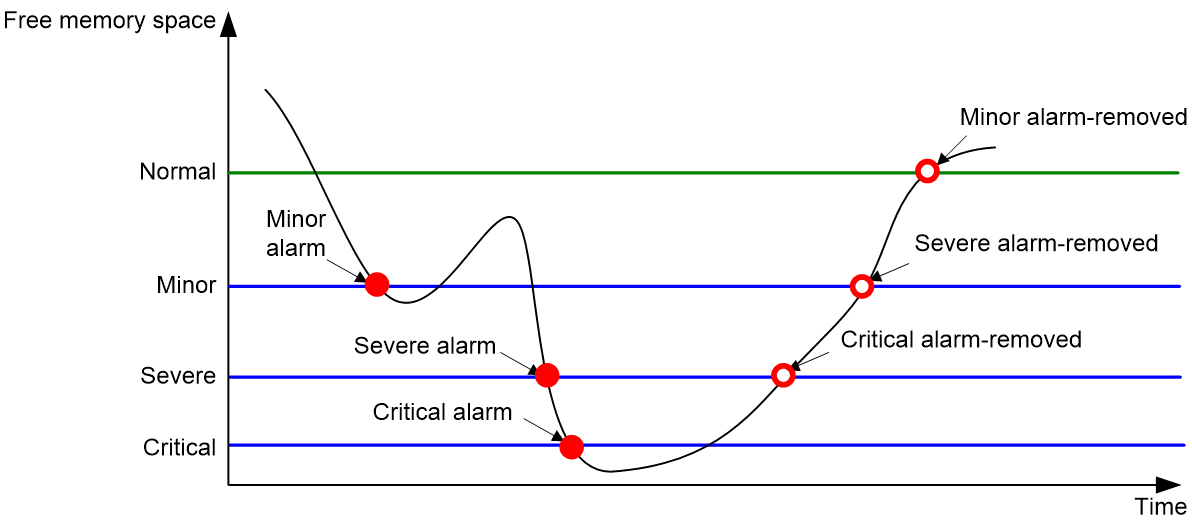
To ensure correct operation and improve memory efficiency, the system monitors the amount of free memory space in real time. If the amount of free memory space reaches the minor, severe, or critical alarm threshold, the system issues an alarm to affected service modules and processes.
You can use the display memory command to display memory usage information.
As shown in the following table and figure, the system supports these free-memory thresholds:
· Normal state threshold.
· Minor alarm threshold.
· Severe alarm threshold.
· Critical alarm threshold.
Table 1 Memory alarm notifications and memory alarm-removed notifications
|
Notification |
Triggering condition |
Remarks |
|
Minor alarm notification |
The amount of free memory space decreases to or below the minor alarm threshold. |
After generating and sending a minor alarm notification, the system does not generate and send any additional minor alarm notifications until the minor alarm is removed. |
|
Severe alarm notification |
The amount of free memory space decreases to or below the severe alarm threshold. |
After generating and sending a severe alarm notification, the system does not generate and send any additional severe alarm notifications until the severe alarm is removed. |
|
Critical alarm notification |
The amount of free memory space decreases to or below the critical alarm threshold. |
After generating and sending a critical alarm notification, the system does not generate and send any additional critical alarm notifications until the critical alarm is removed. |
|
Critical alarm-removed notification |
The amount of free memory space increases above the severe alarm threshold. |
N/A |
|
Severe alarm-removed notification |
The amount of free memory space increases above the minor alarm threshold. |
N/A |
|
Minor alarm-removed notification |
The amount of free memory space increases above the normal state threshold. |
N/A |
Figure 2 Memory alarm notifications and alarm-removed notifications
The sending intervals for memory alarms are as follows:
· If the amount of the free memory space has been over the early-warning alarm threshold for 1 hour, an early-warning alarm notification is sent.
· If the amount of the free memory space has been over the minor alarm threshold for 12 hour, a minor alarm notification is sent.
· If the amount of the free memory space has been over the severe alarm threshold for 3 hour, a severe alarm notification is sent.
· If the amount of the free memory space has been over the critical alarm threshold for 1 hour, a critical alarm notification is sent.
Restrictions and guidelines
If a memory alarm occurs, delete unused configuration items or disable some features to increase the free memory space. Because the memory space is insufficient, some configuration items might not be able to be deleted.
The system will restart a card if one of the following conditions is met:
· After a critical alarm occurs, the remaining free-memory value has been smaller than the critical alarm threshold for 30 seconds.
· The interval between two consecutive critical alarms is shorter than 30 seconds.
· The critical alarm has occurred three times within three minutes.
· After a critical alarm occurs, the system will periodically sample free memory space and predict if the free memory space will be exhausted within 30 seconds. If the prediction result indicates that the free memory space will be exhausted within 30 seconds, the system will restart the card.
Once the free memory space reaches the early warning, minor, severe, or critical alarm threshold, the device will display the current memory usage information when you log in to the device through console or Telnet login, or execute every command.
Procedure
1. Enter system view.
system-view
2. Set the memory usage threshold.
memory-threshold [ slot slot-number [ cpu cpu-number ] ] usage memory-threshold
By default, the memory usage threshold is 100%.
3. Set the free-memory thresholds.
memory-threshold [ slot slot-number [ cpu cpu-number ] ] [ ratio ] minor minor-value severe severe-value critical critical-value normal normal-value
The default settings are as follows:
¡ Minor alarm threshold—256 MB.
¡ Severe alarm threshold—192 MB.
¡ Critical alarm threshold—128 MB.
¡ Normal state threshold—320 MB.
Monitoring DMA memory
About this task
To ensure correct operation of services that use Direct Memory Access (DMA) memory, the system monitors the amount of free DMA memory space regularly. If the amount of free DMA memory space decreases to or below the alarm threshold, the system generates a notification that the DMA memory space is insufficient. If the amount of free DMA memory space increases above the normal state threshold, the system generates a notification that the DMA memory space is sufficient.
DMA memory alarm notifications are sent to NETCONF, SNMP, and the information center to be encapsulated as NETCONF events, SNMP traps and informs, and log messages. For more information about NETCONF, SNMP, and information center, see Network Management and Monitoring Configuration Guide.
Procedure
1. Enter system view.
system-view
2. Set the DMA memory thresholds.
memory-threshold dma [ slot slot-number [ cpu cpu-number ] ] [ ratio ] critical critical-value normal normal-value
By default, the DMA memory alarm threshold is 2048 KB, and the normal state threshold is 4096 KB.
3. Set the DMA memory alarm resending interval.
monitor resend memory-threshold dma critical-interval critical-interval [ slot slot-number [ cpu cpu-number ] ]
By default, the DMA memory alarm resending interval is 300 seconds.
Displaying memory usage monitoring information
Perform display tasks in any view.
· Display memory usage information.
display memory [ summary ] [ slot slot-number [ cpu cpu-number ] ]
· Display DMA memory usage statistics.
display memory dma [ slot slot-number [ cpu cpu-number ] ]
· Display memory alarm thresholds and statistics.
display memory-threshold [ slot slot-number [ cpu cpu-number ] ]
· Display DMA memory alarm information.
display memory-threshold dma [ slot slot-number [ cpu cpu-number ] ]
Monitoring disk usage
About this task
This feature enables the device to periodically sample the usage of a disk and compare the usage with the threshold. If the disk usage exceeds the threshold, the device sends an alarm notification.
Disk usage alarm notifications are sent to NETCONF, SNMP, and the information center to be encapsulated as NETCONF events, SNMP traps and informs, and log messages. For more information about NETCONF, SNMP, and information center, see Network Management and Monitoring Configuration Guide.
Procedure
1. Enter system view.
system-view
2. Set the disk usage sampling interval.
monitor disk-usage interval interval
By default, the disk usage sampling interval is 300 seconds.
3. Set the disk usage threshold.
monitor disk-usage [ slot slot-number ] disk disk-name threshold threshold-value
By default, the disk usage threshold is 90%.
Binding EM resources for matching ACL rules
About this task
This feature allows the device to deploy the specified types of ACL rules through the EM engine, increasing the number of ACL rules the device supports. The EM engine can deploy the ACL rules for matching the following types of services: IPSG, MQC destination IPv4 address, INOF, static AC, dynamic AC, MAC-based VLAN, and IPFIX. For more information about ACL rules, see ACL configuration in ACL and QoS Configuration Guide.
When ACL rules are bound to an EM resource pool, the device will use EM resources for packet matching. EM resources are a type of forwarding entry resource on the device, stored in the same hardware space as MAC addresses and routing tables. Using EM resources for packet matching can increase the device's packet matching specifications.
For example, an ACL rule for matching the IPFIX service includes protocol carried by IPv4 + source IPv4 address + destination IPv4 address + source port number + destination port number. If the device only configures a type of ACL rule that includes protocol carried by IPv4 + source IPv4 address + destination IPv4 address + source port number + destination port number, but does not bind that type of ACL rule to an EM resource pool, the device uses TCAM resources for packet matching. However, TCAM resources are limited. To resolve this issue, after configuring ACL rules that includes protocol carried by IPv4 + source IPv4 address + destination IPv4 address + source port number + destination port number, bind this type of ACL rule for the IPFIX service to an EM resource pool. Then, the device will use EM resources to perform packet matching for the IPFIX service.
Restrictions and guidelines
To clear all ACL rules bound to an EM resource pool, execute the hardware-resource { EM0 | EM1 } null command.
The ACL rules for matching MQC destination IPv4 addresses through EM resources supports only the Layer 2 port inbound direction and are only suitable for scenarios that do not differentiate ACL rules or CB pair priorities.
The EM1 resource pool does not support binding any types of ACL rules.
In IRF mode, after EM0 resource pool binding, manually save the configuration to the subordinate device to prevent configuration loss upon restart.
Procedure
1. Enter system view.
system-view
2. Bind a type of ACL rule to EM resources.
hardware-resource { EM0 | EM1 } { null | ipsg | mqc-dstipv4 | inof | static-ac | dynamics-ac | mac-vlan | ipfix } slot slot-number
Verifying and maintaining EM binding configuration
To display types of ACL rules bound to EM resources, execute the following command in any view:
display hardware-resource [ EM0 | EM1 ] slot slot-number
Monitoring device temperature
Setting the temperature alarm thresholds
About this task
The device monitors its temperature based on the following thresholds:
· Low-temperature threshold.
· High-temperature warning threshold.
· High-temperature alarming threshold.
When the device temperature drops below the low-temperature threshold or reaches the high-temperature warning or alarming threshold, the device performs the following operations:
· Sends log messages and traps.
· Sets LEDs on the device panel.
Procedure
1. Enter system view.
system-view
2. Configure the temperature alarm thresholds.
temperature-limit slot slot-number { hotspot } sensor-number lowlimit warninglimit [ alarmlimit ]
The defaults vary by temperature sensor model. To view the defaults, execute the undo temperature-limit and display environment commands in turn.
The high-temperature alarming threshold must be higher than the high-temperature warning threshold, and the high-temperature warning threshold must be higher than the low-temperature threshold.
Displaying device temperature information
To display device temperature information, execute the following command in any view:
display environment [ slot slot-number ]
Monitoring fans
Displaying fan information
Hardware and feature compatibility
Only the S5580X-EI switch series supports using the display device manuinfo fan command to display electronic label information for a fan tray.
Procedure
Perform display tasks in any view.
· Display fan tray operating status information.
display fan [ slot slot-number [ fan-id ] ]
· Display electronic label information for a fan tray.
display device manuinfo slot slot-number fan fan-id
Setting the port status detection timer
About this task
In networks with loop detection or spanning tree protocols, some protocols (such as STP and DLDP) automatically disable a port. The device starts a port status detection timer when a port is shut down by a protocol. If the port has been in down state before the timer expires, the device will set the port status to the port's physical status.
Procedure
1. Enter system view.
system-view
2. Set the port status detection timer.
shutdown-interval time
The default is 30 seconds.
Verifying and diagnosing transceiver modules
Verifying transceiver modules
About this task
You can use one of the following methods to verify the genuineness of a transceiver module:
· Display the key parameters of a transceiver module, including its transceiver type, connector type, central wavelength of the transmit laser, transfer distance, and vendor name.
· Display its electronic label. The electronic label is a profile of the transceiver module and contains the permanent configuration, including the serial number, manufacturing date, and vendor name. The data was written to the transceiver module or the device's storage component during debugging or testing of the transceiver module or device.
The device regularly checks transceiver modules for their vendor names. If a transceiver module does not have a vendor name or the vendor name is not H3C, the device repeatedly outputs traps and log messages. For information about logging rules, see "Configuring the information center."
Procedure
To verify transceiver modules, execute the following commands in any view:
· Display the key parameters of transceiver modules.
display transceiver interface [ interface-type interface-number ]
· Display the electrical label information of transceiver modules.
display transceiver manuinfo interface [ interface-type interface-number ]
Diagnosing transceiver modules
About this task
The device provides the alarm and digital diagnosis functions for transceiver modules. When a transceiver module fails or is not operating correctly, you can perform the following tasks:
· Check the alarms that exist on the transceiver module to identify the fault source.
· Examine the key parameters monitored by the digital diagnosis function, including the temperature, voltage, laser bias current, TX power, and RX power.
Procedure
To diagnose transceiver modules, execute the following commands in any view:
· Display transceiver alarms.
display transceiver alarm interface [ interface-type interface-number ]
· Display the current values of the digital diagnosis parameters on transceiver modules.
display transceiver diagnosis interface [ interface-type interface-number ]
Displaying power information for transceiver modules
To display power information for transceiver modules, execute the following command in any view:
display transceiver power [ interface interface-type interface-number ]
Configuring transceiver health check
About this task
The transceiver health is calculated based on the weights of five diagnosis parameters of transceiver modules, including temperature, voltage, bias current, transmit power, and receive power.
Transceiver health check enables the device to automatically check transceiver module status, and calculate transceiver health and diagnosis parameter health based on the configured weights of diagnosis parameters.
After transceiver health check is enabled and the weights for transceiver health calculation are configured, you can use the display transceiver health command to view transceiver health information. A greater health value indicates a healthier status.
Restrictions and guidelines
The sum of the weights of temperature, voltage, bias current, transmit power, and receive power for transceiver health calculation must be 100.
Procedure
1. Enter system view.
system-view
2. Enable transceiver health check.
transceiver health check enable
By default, transceiver health check is disabled.
3. Configure the weights for transceiver health calculation.
transceiver health weight temp temp-weight voltage voltage-weight bias bias-weight rxpower rxpower-weight txpower txpower-weight
The default settings are as follows:
¡ Temperature weight: 15.
¡ Voltage weight: 5.
¡ Bias current weight: 30.
¡ Receive power weight: 10.
¡ Transmit power weight: 40.
Verifying transceiver health check
To verify transceiver health check, execute the following command in any view:
display transceiver health interface [ interface-type interface-number ]
Displaying device hardware information
To display device hardware information, execute the following command in any view:
display device [flash | usb ] [ slot slot-number [ subslot subslot-number ] | verbose ]
Displaying device hardware electronic label information
To display hardware electronic label information for the device, execute the following command in any view:
display device manuinfo [ slot slot-number ]