- Table of Contents
- Related Documents
-
| Title | Size | Download |
|---|---|---|
| 01-Text | 4.08 MB |
Hardware requirements (physical server)
Server requirements for SeerCollector deployment
Software package authentication
Analyzer deployment tasks at a glance
Deploying Unified Platform and optional components
System disk and ETCD disk planning
Manually creating data disk partitions
Application installation packages required for deploying Unified Platform
Analyzer application package instructions
(Optional.) Clearing known_hosts information recorded by each node
Deploying Analyzer for Unified Platform of versions earlier than E0713
Deploying Analyzer for Unified Platform of E0713 and later versions
Accessing the Analyzer interface
Installing a license on the license server
Obtaining the license information
Upgrading Analyzer from E61xx to E65xx
Upgrading Analyzer from E62xx or E63xx to E65xx or from E65xx to a later version
Checking the running status of each server
How can I configure security policies if multiple enabled NICs are configured with IP addresses?
How can I change the SSH port of a cluster node?
What should I do if the analyzer fails to be deployed or upgraded?
Why is Vertica unavailable after the node or cluster IP is changed?
Why the Analyzer menu not visible after an operator logs in?
How to check if NUMA nodes are allocated memory?
How to check if hyper-threading is enabled?
How to enable hardware virtualization function?
How to change the file system type of a data disk partition to ext4?
What should I do if the deployment of the Analyzer-Platfom component fails?
Introduction
Analyzer focuses on the value mining of machine data. Based on big data technologies, Analyzer finds out valuable information from massive data to help enterprises in networking, service O&M, and business decision making. Analyzer collects device performance, user access, and service traffic data in real time and visualizes network operation through big data analysis and artificial intelligence algorithms. It can predict potential network risks and generate notifications.
· Campus—Based on user access and network usage data collected by Telemetry, the campus analyzer uses Big Data and AI technologies to analyze network health issues, discovers the root causes for degraded experience, and provides optimization suggestions. This improves user experience.
· WAN—Acting as the core engine for smart O&M in a WAN, the WAN analyzer collects network state, log, and traffic data from multiple dimensions, uses Big Data and AI technologies to summarize and analyze the data, and thus provides health evaluation, traffic analysis, capacity forecast, and fault diagnosis functions for the entire network.
· DC—The DC analyzer collects full-time network device operation information and establishes a health evaluation system for the entire DC network. The system brings TCP/UDP session analysis, application visibility and analysis, chip-level cache monitoring, and packet loss analysis in the DC, providing full support for all-round DC O&M, high availability, and low latency.
Concepts
· SeerCollector—Required if you use TCP/UDP flow analysis and INT flow analysis features of Analyzer.
· COLLECTOR—Public collector component that provides collection services through protocols such as SNMP, GRPC, and NETCONF.
Pre-installation preparation
Server requirements
Analyzer is deployed on Unified Platform, which can be deployed on physical servers or VMs. As a best practice, deploy Unified Platform on physical servers. See Table 1 for the deployment modes.
|
Deployment mode |
Required servers |
Description |
|
Single-node deployment |
1 |
Unified Platform is deployed on one node, which is the master node. Analyzer is deployed on Unified Platform. Use single-node deployment only in small networks that do not require high availability. |
|
Three-master cluster deployment |
3+N |
· Unified Platform is deployed on three master nodes. · Analyzer-alone deployment ¡ 3+N (N ≥ 0) mode: Deploy Analyzer alone on one or multiple of the three master nodes and N worker nodes. · Controller+Analyzer converged deployment ¡ 3-master mode—Deploy Controller and Analyzer on the three master nodes of Unified Platform cluster. ¡ 3+1 mode—Deploy Unified Platform and Controller on the three master nodes, and deploy Analyzer on a worker node. ¡ 3+N mode (N ≥ 3)—Deploy Unified Platform and controller on the three master nodes, and deploy Analyzer on N worker nodes. |
To install Unified Platform on a server, make sure the server meets the following requirements:
· Uses the x86-64(Intel64/AMD64) CPU architecture.
· Uses HDDs (SATA/SAS) or SSDs as system and data disks. As a best practice, set up RAID 5 arrays if possible.
· Has a RAID controller with 1 GB or higher write cache and supports power fail protection.
· Supports operating system CentOS 7.6 or later.
Select hardware (physical server or VM) based on the network scale and service load. Application flows bring the most service load in the network.
|
|
IMPORTANT: · The compatible CPU architecture varies by analyzer version. For more information, see the corresponding release notes. · When the total disk capacity is fixed, the more disks, the better the read/write performance. For example, six 2 TB disks provide better read/write performance than three 4 TB disks. · To use the TCP stream analysis and INT stream analysis features, you must deploy SeerCollector. For more information, see "Server requirements for SeerCollector deployment." |
Hardware requirements (physical server)
Physical server requirements in the campus scenario
Different business scales have similar requirements for network ports in campus scenarios, which are as follows:
· As a best practice, use different network ports for the southbound collection network and the northboud network. If only one network port is available, you can configure the two networks to share the port.
· Normal mode: Use two 1Gbps or above network ports. As a best practice, use a 10Gbps or above northbound network port.
· Redundant mode: Use bonding mode2 or mode4. Use four 1Gbps or above network ports, each two forming a Linux Bonding group. As a best practice, use a 10Gbps or above northbound network port.
Table 2 Physical server requirements for Unified Platform+Analyzer deployment in the campus scenario (single-node deployment)
|
Node settings |
Maximum resources that can be managed |
||
|
Node name |
Node quantity |
Minimum node requirements |
|
|
Analyzer |
1 |
· CPU: 20 cores (total physical cores), 2.0 GHz. · Memory: 192 GB. · System disk: 2.4 TB (after RAID setup). · Data disk: 2 TB (after RAID setup). Two drives of the same type are required. · ETCD disk: 50 GB (after RAID setup). Installation path: /var/lib/etcd · Storage controller: 1 GB cache, powerfail safeguard supported with a supercapacitor installed. |
· 2000 online users. · 400 switches, ACs and APs in total. |
|
Analyzer |
1 |
· CPU: 20 cores (total physical cores), 2.0 GHz. · Memory: 192 GB. · System disk: 2.4 TB (after RAID setup). · Data disk: 2 TB (after RAID setup). Two drives of the same type are required. · ETCD disk: 50 GB (after RAID setup). Installation path: /var/lib/etcd · Storage controller: 1 GB cache, powerfail safeguard supported with a supercapacitor installed. |
· 5000 online users. · 1000 switches, ACs and APs in total. |
|
Analyzer |
1 |
· CPU: 20 cores (total physical cores), 2.0GHz. · Memory: 192 GB. · System disk: 2.4 TB (after RAID setup). · Data disk: 3 TB (after RAID setup). Two drives of the same type are required. · ETCD disk: 50 GB (after RAID setup). Installation path: /var/lib/etcd · Storage controller: 1 GB cache, powerfail safeguard supported with a supercapacitor installed. |
· 10000 online users. · 2000 switches, ACs and APs in total. |
|
Analyzer |
1 |
· CPU: 24 cores (total physical cores), 2.0 GHz. · Memory: 224 GB. · System disk: 3 TB (after RAID setup). · Data disk: 4 TB (after RAID setup). Three drives of the same type are required. · ETCD disk: 50 GB (after RAID setup). Installation path: /var/lib/etcd · Storage controller: 1 GB cache, powerfail safeguard supported with a supercapacitor installed. |
· 20000 online users. · 4000 switches, ACs and APs in total. |
|
Analyzer |
1 |
· CPU: 28 cores (total physical cores), 2.0 GHz. · Memory: 256 GB. · System disk: 3 TB (after RAID setup). · Data disk: 5 TB (after RAID setup). Four drives of the same type are required. · ETCD disk: 50 GB (after RAID setup). Installation path: /var/lib/etcd · Storage controller: 1 GB cache, powerfail safeguard supported with a supercapacitor installed. |
· 40000 online users. · 8000 switches, ACs and APs in total. |
|
Analyzer |
1 |
· CPU: 32 cores (total physical cores), 2.0 GHz. · Memory: 288 GB. · System disk: 3 TB (after RAID setup). · Data disk: 7 TB (after RAID setup). Five drives of the same type are required. · ETCD disk: 50 GB (after RAID setup). Installation path: /var/lib/etcd · Storage controller: 1 GB cache, powerfail safeguard supported with a supercapacitor installed. |
· 60000 online users. · 12000 switches, ACs and APs in total. |
|
Analyzer |
1 |
· CPU: 40 cores (total physical cores), 2.0 GHz. · Memory: 384 GB. · System disk: 3 TB (after RAID setup). · Data disk: 11 TB (after RAID setup). Eight drives of the same type are required. · ETCD disk: 50 GB (after RAID setup). Installation path: /var/lib/etcd · Storage controller: 1 GB cache, powerfail safeguard supported with a supercapacitor installed. |
· 100000 online users. · 20000 switches, ACs and APs in total. |
|
Node settings |
Maximum resources that can be managed |
||
|
Node name |
Node quantity |
Minimum requirements per node |
|
|
Analyzer |
3 |
· CPU: 20 cores (total physical cores), 2.0 GHz. · Memory: 128 GB · System disk: 2.4 TB (after RAID setup) · Data disk: 2 TB (after RAID setup). Two drives of the same type are required. · ETCD disk: 50 GB (after RAID setup). Installation path: /var/lib/etcd · Storage controller: 1 GB cache, powerfail safeguard supported with a supercapacitor installed. |
· 2000 online users. · 400 switches, ACs and APs in total. |
|
Analyzer |
3 |
· CPU: 20 cores (total physical cores), 2.0 GHz. · Memory: 128 GB. · System disk: 2.4 TB (after RAID setup). · Data disk: 2 TB (after RAID setup). Two drives of the same type are required. · ETCD disk: 50 GB (after RAID setup). Installation path: /var/lib/etcd · Storage controller: 1 GB cache, powerfail safeguard supported with a supercapacitor installed. |
· 5000 online users. · 1000 switches, ACs and APs in total. |
|
Analyzer |
3 |
· CPU: 20 cores (total physical cores), 2.0 GHz. · Memory: 128 GB. · System disk: 2.4 TB (after RAID setup). · Data disk: 2 TB (after RAID setup). Two drives of the same type are required. · ETCD disk: 50 GB (after RAID setup). Installation path: /var/lib/etcd · Storage controller: 1 GB cache, powerfail safeguard supported with a supercapacitor installed. |
· 10000 online users. · 2000 switches, ACs and APs in total. |
|
Analyzer |
3 |
· CPU: 20 cores (total physical cores), 2.0 GHz. · Memory: 160 GB. · System disk: 3 TB (after RAID setup). · Data disk: 3 TB (after RAID setup). Three drives of the same type are required. · ETCD disk: 50 GB (after RAID setup). Installation path: /var/lib/etcd · Storage controller: 1 GB cache, powerfail safeguard supported with a supercapacitor installed. |
· 20000 online users. · 4000 switches, ACs and APs in total. |
|
Analyzer |
3 |
· CPU: 24 cores (total physical cores), 2.0 GHz. · Memory: 192 GB. · System disk: 3 TB (after RAID setup). · Data disk: 4 TB (after RAID setup). Three drives of the same type are required. · ETCD disk: 50 GB (after RAID setup). Installation path: /var/lib/etcd · Storage controller: 1 GB cache, powerfail safeguard supported with a supercapacitor installed. |
· 40000 online users. · 8000 switches, ACs and APs in total. |
|
Analyzer |
3 |
· CPU: 28 cores (total physical cores), 2.0 GHz. · Memory: 224 GB. · System disk: 3 TB (after RAID setup). · Data disk: 5 TB (after RAID setup). Four drives of the same type are required. · ETCD disk: 50 GB (after RAID setup). Installation path: /var/lib/etcd · Storage controller: 1 GB cache, powerfail safeguard supported with a supercapacitor installed. |
· 60000 online users. · 12000 switches, ACs and APs in total. |
|
Analyzer |
3 |
· CPU: 32 cores (total physical cores), 2.0 GHz. · Memory: 256 GB. · System disk: 3 TB (after RAID setup). · Data disk: 8 TB (after RAID setup). Six drives of the same type are required. · ETCD disk: 50 GB (after RAID setup). Installation path: /var/lib/etcd · Storage controller: 1 GB cache, powerfail safeguard supported with a supercapacitor installed. |
· 100000 online users. · 20000 switches, ACs and APs in total. |
Physical server requirements in the DC scenario
Table 4 Physical server requirements for Unified Platform+Analyzer deployment in the DC scenario (single-node deployment) (x86-64(Intel64/AMD64))
|
Node settings |
Maximum number of devices |
Maximum number of TCP connections |
Remarks |
||
|
Node name |
Node quantity |
Minimum node requirements |
|||
|
Analyzer |
1 |
· CPU: 20 cores (total physical cores), 2.0 GHz. · Memory: 256 GB. · System disk: 1.92 TB (after RAID setup).As a best practice, use HDDs with a rotation speed of 7.2K RPM or above or use SSDs. · Data disk: 8 TB (after RAID setup). Three drives of the same type are required. As a best practice, use HDDs with a rotation speed of 7.2K RPM or above or use SSDs. · ETCD disk: 50 GB SSDs (after RAID setup). As a best practice, use HDDs with a rotation speed of 7.2K RPM or above or use SSDs. Installation path: /var/lib/etcd · Storage controller: 1GB cache, powerfail safeguard supported with a supercapacitor installed. · NICs: ¡ Non-bonding mode: 2 × 10 Gbps interfaces. ¡ Bonding mode (recommended mode: mode 2 or mode 4): 4 × 10 Gbps interfaces, each two forming a bonding interface. |
50 |
1000 VMs, 2000 TCP streams/sec. |
2 TCP streams/sec per VM. |
Table 5 Physical server requirements for Unified Platform+Analyzer deployment in the DC scenario (single-node deployment) (Hygon x86-64 servers)
|
Node settings |
Maximum number of devices |
Maximum number of TCP connections |
Remarks |
||
|
Node name |
Node quantity |
Minimum node requirements |
|||
|
Analyzer |
1 |
· CPU: 48 cores (total physical cores), 2 × Hygon C86 7265,24 cores,2.2 GHz · Memory: 256 GB. · System disk: 1.92 TB (after RAID setup). As a best practice, use HDDs with a rotation speed of 7.2K RPM or above or use SSDs. · Data disk: 8 TB (after RAID setup). Three drives of the same type are required. As a best practice, use HDDs with a rotation speed of 7.2K RPM or above or use SSDs. · ETCD disk: 50 GB SSDs (after RAID setup). As a best practice, use HDDs with a rotation speed of 7.2K RPM or above or use SSDs. Installation path: /var/lib/etcd · Storage controller: 1GB cache, powerfail safeguard supported with a supercapacitor installed. · NICs: ¡ Non-bonding mode: 2 × 10 Gbps interfaces. ¡ Bonding mode (recommended mode: mode 2 or mode 4): 4 × 10 Gbps interfaces, each two forming a bonding interface. |
50 |
1000 VMs, 2000 TCP streams/sec. |
2 TCP streams/sec per VM. |
|
|
NOTE: If Kylin system is selected, the IP address must be configured for NIC Bonding, otherwise the NIC Bonding cannot be used. |
Table 6 Physical server requirements for Unified Platform+Analyzer deployment in the DC scenario (single-node deployment) (Kunpeng ARM server)
|
Node settings |
Maximum number of devices |
Maximum number of TCP connections |
Remarks |
||
|
Node name |
Node quantity |
Minimum node requirements |
|||
|
Analyzer |
1 |
· CPU: 64 cores (total physical cores), 2 × Kunpeng 920 5232, 32 cores, 2.6 GHz · Memory: 256 GB. · System disk: 1.92 TB (after RAID setup). As a best practice, use HDDs with a rotation speed of 7.2K RPM or above or use SSDs. · Data disk: 8 TB (after RAID setup). Three drives of the same type are required. As a best practice, use HDDs with a rotation speed of 7.2K RPM or above or use SSDs. · ETCD disk: 50 GB SSDs (after RAID setup). As a best practice, use HDDs with a rotation speed of 7.2K RPM or above or use SSDs. Installation path: /var/lib/etcd · Storage controller: 1GB cache, powerfail safeguard supported with a supercapacitor installed. · NICs: ¡ Non-bonding mode: 2 × 10 Gbps interfaces. ¡ Bonding mode (recommended mode: mode 2 or mode 4): 4 × 10 Gbps interfaces, each two form a bonding interface. |
50 |
1000 VMs, 2000 TCP streams/sec. |
2 TCP streams/sec per VM. |
Table 7 Physical server requirements for Unified Platform+Analyzer deployment in the DC scenario (single-node deployment) (Phytium ARM server)
|
Node settings |
Maximum number of devices |
Maximum number of TCP connections |
Remarks |
||
|
Node name |
Node quantity |
Minimum node requirements |
|||
|
Analyzer |
1 |
· CPU: 128 cores (total physical cores), 2 × Phytium S2500, 64 cores, 2.1 GHz · Memory: 256 GB. · System disk: 1.92 TB (after RAID setup). · Data disk: 8 TB (after RAID setup). Three drives of the same type are required. · ETCD disk: 50 GB SSDs (after RAID setup). · Storage controller: 1GB cache, powerfail safeguard supported with a supercapacitor installed. · NICs: ¡ Non-bonding mode: 2 × 10 Gbps interfaces. ¡ Bonding mode (recommended mode: mode 2 or mode 4): 4 × 10 Gbps interfaces, each two form a bonding interface. |
50 |
1000 VMs, 2000 TCP streams/sec. |
2 TCP streams/sec per VM. |
|
Node settings |
Maximum number of devices |
Maximum number of TCP connections |
Remarks |
||
|
Node name |
Node quantity |
Minimum node requirements |
|||
|
Analyzer |
3 |
· CPU: 20 cores (total physical cores), 2.0 GHz. · Memory: 192 GB. · System disk: 1.92 TB (after RAID setup). As a best practice, use HDDs with a rotation speed of 7.2K RPM or above or use SSDs. · Data disk: 8 TB (after RAID setup). Three drives of the same type are required. As a best practice, use HDDs with a rotation speed of 7.2K RPM or above or use SSDs. · ETCD disk: 50 GB SSDs (after RAID setup). As a best practice, use HDDs with a rotation speed of 7.2K RPM or above or use SSDs. Installation path: /var/lib/etcd · Storage controller: 1GB cache, powerfail safeguard supported with a supercapacitor installed. · NICs: ¡ Non-bonding mode: 2 × 10 Gbps interfaces. ¡ Bonding mode (recommended mode: mode 2 or mode 4): 4 × 10 Gbps interfaces, each two form a bonding interface. |
50 |
1000 VMs, 2000 TCP streams/sec. |
2 TCP streams/sec per VM. |
|
3 |
· CPU: 24 cores (total physical cores), 2.0 GHz. · Memory: 256 GB. · System disk: 1.92 TB (after RAID setup). As a best practice, use HDDs with a rotation speed of 7.2K RPM or above or use SSDs. · Data disk: 12 TB (after RAID setup). Five drives of the same type are required. As a best practice, use HDDs with a rotation speed of 7.2K RPM or above or use SSDs. · ETCD disk: 50 GB SSDs (after RAID setup). As a best practice, use HDDs with a rotation speed of 7.2K RPM or above or use SSDs. Installation path: /var/lib/etcd · Storage controller: 1GB cache, powerfail safeguard supported with a supercapacitor installed. · NICs: ¡ Non-bonding mode: 2 × 10 Gbps interfaces. ¡ Bonding mode (recommended mode: mode 2 or mode 4): 4 × 10 Gbps interfaces, each two form a bonding interface. |
100 |
3000 VMs, 6000 TCP streams/sec. |
2 TCP streams/sec per VM. |
|
|
3 |
· CPU: 32 cores (total physical cores), 2.0 GHz. · Memory: 256 GB. · System disk: 1.92 TB (after RAID setup). As a best practice, use HDDs with a rotation speed of 7.2K RPM or above or use SSDs. · Data disk: 24 TB (after RAID setup). Seven drives of the same type are required. As a best practice, use HDDs with a rotation speed of 7.2K RPM or above or use SSDs. · ETCD disk: 50 GB (after RAID setup). As a best practice, use HDDs with a rotation speed of 7.2K RPM or above or use SSDs. Installation path: /var/lib/etcd · NICs: ¡ Non-bonding mode: 2 × 10 Gbps interfaces. ¡ Bonding mode (recommended mode: mode 2 or mode 4): 4 × 10 Gbps interfaces, each two form a bonding interface. |
200 |
6000 VMs, 12000 TCP streams/sec. |
2 TCP streams/sec per VM. |
|
Table 9 Physical server requirements for Unified Platform+Analyzer deployment in the DC scenario (cluster deployment) (Hygon x86-64 server)
|
Node settings |
Maximum number of devices |
Maximum number of TCP connections |
Remarks |
||
|
Node name |
Node quantity |
Minimum node requirements |
|||
|
Analyzer |
3 |
· CPU: 48 cores (total physical cores), 2 × Hygon C86 7265,24 cores,2.2 GHz · Memory: 256 GB. · System disk: 1.92 TB (after RAID setup). As a best practice, use HDDs with a rotation speed of 7.2K RPM or above or use SSDs. · Data disk: 24 TB (after RAID setup). Seven drives of the same type are required. As a best practice, use HDDs with a rotation speed of 7.2K RPM or above or use SSDs. · ETCD disk: 50 GB SSDs (after RAID setup). As a best practice, use HDDs with a rotation speed of 7.2K RPM or above or use SSDs. Installation path: /var/lib/etcd · NICs: ¡ Non-bonding mode: 2 × 10 Gbps interfaces. ¡ Bonding mode (recommended mode: mode 2 or mode 4): 4 × 10 Gbps interfaces, each two form a bonding interface. |
200 |
5000 VMs, 10000 TCP streams/sec. |
2 TCP streams/sec per VM. |
Table 10 Physical server requirements for Unified Platform+Analyzer deployment in the DC scenario (cluster deployment) (Kunpeng ARM server)
|
Node settings |
Maximum number of devices |
Maximum number of TCP connections |
Remarks |
||
|
Node name |
Node quantity |
Minimum node requirements |
|||
|
Analyzer |
3 |
· CPU: 64 cores (total physical cores), 2 × Kunpeng 920 5232, 32 cores, 2.6 GHz · Memory: 256 GB. · System disk: 1.92 TB (after RAID setup). As a best practice, use HDDs with a rotation speed of 7.2K RPM or above or use SSDs. · Data disk: 24 TB (after RAID setup). Seven drives of the same type are required. As a best practice, use HDDs with a rotation speed of 7.2K RPM or above or use SSDs. · ETCD disk: 50 GB SSDs (after RAID setup). As a best practice, use HDDs with a rotation speed of 7.2K RPM or above or use SSDs. Installation path: /var/lib/etcd · NICs: ¡ Non-bonding mode: 2 × 10 Gbps interfaces. ¡ Bonding mode (recommended mode: mode 2 or mode 4): 4 × 10 Gbps interfaces, each two form a bonding interface. |
200 |
5000 VMs, 10000 TCP streams/sec. |
2 TCP streams/sec per VM. |
Table 11 Physical server requirements for Unified Platform+Analyzer deployment in the DC scenario cluster deployment (Phytium ARM server)
|
Node settings |
Maximum number of devices |
Maximum number of TCP connections |
Remarks |
||
|
Node name |
Node quantity |
Minimum node requirements |
|||
|
Analyzer |
3 |
· CPU: 128 cores (total physical cores), 2 × Phytium S2500, 64 cores, 2.1 GHz · Memory: 256 GB. · System disk: 1.92 TB (after RAID setup). · Data disk: 12 TB (after RAID setup). Seven drives of the same type are required. · ETCD disk: 50 GB SSDs (after RAID setup). · NICs: ¡ Non-bonding mode: 2 × 10 Gbps interfaces. ¡ Bonding mode (recommended mode: mode 2 or mode 4): 4 × 10 Gbps interfaces, each two form a bonding interface. |
100 |
2000 VMs, 4000 TCP streams/sec. |
2 TCP streams/sec per VM. |
|
Analyzer |
3 |
· CPU: 128 cores (total physical cores), 2 × Phytium S2500, 64 cores, 2.1 GHz · Memory: 256 GB. · System disk: 1.92 TB (after RAID setup). · Data disk: 24 TB (after RAID setup). Seven drives of the same type are required. · ETCD disk: 50 GB SSDs (after RAID setup). · NICs: ¡ Non-bonding mode: 2 × 10 Gbps interfaces. ¡ Bonding mode (recommended mode: mode 2 or mode 4): 4 × 10 Gbps interfaces, each two form a bonding interface. |
200 |
5000 VMs, 10000 TCP streams/sec. |
2 TCP streams/sec per VM. |
|
|
NOTE: You can calculate the overall TCP streams per second based on the total number of VMs in the DC (2 streams/sec per VM) to determine the required hardware specifications. |
Physical server requirements in the WAN scenario
In the WAN scenario, Analyzer must be deployed together with Controller. You cannot deploy Analyzer alone and must first deploy the security controller. For converged deployment hardware requirements, see the hardware configuration guide for AD-NET Hardware Configuration Guide.
Hardware requirements (VM)
VM requirements in the campus scenario
Different business scales have similar requirements for network ports in campus scenarios, which are as follows:
· As a best practice, use different network ports for the southbound collection network and the northboud network. If only one network port is available, you can configure the two networks to share the port.
· Normal mode: Use two 1Gbps or above network ports. As a best practice, use a 10Gbps or above northbound network port.
· Redundant mode: Use bonding mode2 or mode4. Use four 1Gbps or above network ports, each two forming a Linux Bonding group. As a best practice, use a 10Gbps or above northbound network port.
|
Node settings |
Maximum resources that can be managed |
||
|
Node name |
Node quantity |
Minimum node requirements |
|
|
Analyzer |
1 |
· vCPU: 20 × 2 cores, 2.0 GHz. · Memory: 192 GB. · System disk: 2.4 TB. · Data disk: 2 TB. The random read/write speed cannot be lower than 100 M/s and shared storage is not supported. · ETCD disk: 50 GB. Installation path: /var/lib/etcd · NICs: ¡ Non-bonding mode: 2 × 10 Gbps interfaces. ¡ Bonding mode (recommended mode: mode 2 or mode 4): 4 × 10 Gbps interfaces, each two form a bonding interface. |
· 2000 online users. · 400 switches, ACs and APs in total. |
|
Analyzer |
1 |
· vCPU: 20 × 2 cores, 2.0 GHz. · Memory: 192 GB. · System disk: 2.4 TB. · Data disk: 2 TB. The random read/write speed cannot be lower than 100 M/s and shared storage is not supported. · ETCD disk: 50 GB. Installation path: /var/lib/etcd · NICs: ¡ Non-bonding mode: 2 × 10 Gbps interfaces. ¡ Bonding mode (recommended mode: mode 2 or mode 4): 4 × 10 Gbps interfaces, each two form a bonding interface. |
· 5000 online users. · 1000 switches, ACs and APs in total. |
|
Analyzer |
1 |
· vCPU: 20 × 2 cores, 2.0 GHz. · Memory: 192 GB. · System disk: 2.4 TB. · Data disk: 3 TB. The random read/write speed cannot be lower than 100 M/s and shared storage is not supported. · ETCD disk: 50 GB. Installation path: /var/lib/etcd · NICs: ¡ Non-bonding mode: 2 × 10 Gbps interfaces. ¡ Bonding mode (recommended mode: mode 2 or mode 4): 4 × 10 Gbps interfaces, each two form a bonding interface. |
· 10000 online users. · 2000 switches, ACs and APs in total. |
|
Analyzer |
1 |
· vCPU: 24 × 2 cores, 2.0 GHz. · Memory: 224 GB. · System disk: 3 TB. · Data disk: 4 TB. The random read/write speed cannot be lower than 100 M/s and shared storage is not supported. · ETCD disk: 50 GB. Installation path: /var/lib/etcd · NICs: ¡ Non-bonding mode: 2 × 10 Gbps interfaces. ¡ Bonding mode (recommended mode: mode 2 or mode 4): 4 × 10 Gbps interfaces, each two form a bonding interface. |
· 20000 online users. · 4000 switches, ACs and APs in total. |
|
Analyzer |
1 |
· vCPU: 28 × 2 cores, 2.0 GHz. · Memory: 256 GB. · System disk: 3 TB. · Data disk: 5 TB. The random read/write speed cannot be lower than 100 M/s and shared storage is not supported. · ETCD disk: 50 GB. Installation path: /var/lib/etcd · NICs: ¡ Non-bonding mode: 2 × 10 Gbps interfaces. ¡ Bonding mode (recommended mode: mode 2 or mode 4): 4 × 10 Gbps interfaces, each two form a bonding interface. |
· 40000 online users. · 8000 switches, ACs and APs in total. |
|
Analyzer |
1 |
· vCPU: 32 × 2 cores, 2.0 GHz. · Memory: 288 GB. · System disk: 3 TB (after RAID setup). · Data disk: 7 TB. The random read/write speed cannot be lower than 100 M/s and shared storage is not supported. · ETCD disk: 50 GB. Installation path: /var/lib/etcd · NICs: ¡ Non-bonding mode: 2 × 10 Gbps interfaces. ¡ Bonding mode (recommended mode: mode 2 or mode 4): 4 × 10 Gbps interfaces, each two form a bonding interface. |
· 60000 online users. · 12000 switches, ACs and APs in total. |
|
Analyzer |
1 |
· vCPU: 40 × 2 cores, 2.0 GHz. · Memory: 384 GB. · System disk: 3 TB. · Data disk: 11 TB. The random read/write speed cannot be lower than 100 M/s and shared storage is not supported. · ETCD disk: 50 GB. Installation path: /var/lib/etcd · NICs: ¡ Non-bonding mode: 2 × 10 Gbps interfaces. ¡ Bonding mode (recommended mode: mode 2 or mode 4): 4 × 10 Gbps interfaces, each two form a bonding interface. |
· 100000 online users. · 20000 switches, ACs and APs in total. |
|
Node settings |
Maximum resources that can be managed |
||
|
Node name |
Node quantity |
Minimum requirements per node |
|
|
Analyzer |
3 |
· vCPU: 20 × 2 cores, 2.0 GHz. · Memory: 128 GB. · System disk: 2.4 TB. · Data disk: 2 TB. The random read/write speed cannot be lower than 100 M/s and shared storage is not supported. · ETCD disk: 50 GB. Installation path: /var/lib/etcd · NICs: ¡ Non-bonding mode: 2 × 10 Gbps interfaces. ¡ Bonding mode (recommended mode: mode 2 or mode 4): 4 × 10 Gbps interfaces, each two form a bonding interface.. |
· 2000 online users. · 400 switches, ACs and APs in total. |
|
Analyzer |
3 |
· vCPU: 20 × 2 cores, 2.0 GHz. · Memory: 128 GB. · System disk: 2.4 TB. · Data disk: 2 TB. The random read/write speed cannot be lower than 100 M/s and shared storage is not supported. · ETCD disk: 50 GB. Installation path: /var/lib/etcd · NICs: ¡ Non-bonding mode: 2 × 10 Gbps interfaces. ¡ Bonding mode (recommended mode: mode 2 or mode 4): 4 × 10 Gbps interfaces, each two form a bonding interface. |
· 5000 online users. · 1000 switches, ACs and APs in total. |
|
Analyzer |
3 |
· vCPU: 20 × 2 cores, 2.0 GHz. · Memory: 128 GB. · System disk: 2.4 TB. · Data disk: 2 TB. The random read/write speed cannot be lower than 100 M/s and shared storage is not supported. · ETCD disk: 50 GB. Installation path: /var/lib/etcd · NICs: ¡ Non-bonding mode: 2 × 10 Gbps interfaces. ¡ Bonding mode (recommended mode: mode 2 or mode 4): 4 × 10 Gbps interfaces, each two form a bonding interface. |
· 10000 online users. · 2000 switches, ACs and APs in total. |
|
Analyzer |
3 |
· vCPU: 20 × 2 cores, 2.0 GHz. · Memory: 160 GB. · System disk: 3 TB. · Data disk: 3 TB. The random read/write speed cannot be lower than 100 M/s and shared storage is not supported. · ETCD disk: 50 GB (after RAID setup). Installation path: /var/lib/etcd · NICs: ¡ Non-bonding mode: 2 × 10 Gbps interfaces. ¡ Bonding mode (recommended mode: mode 2 or mode 4): 4 × 10 Gbps interfaces, each two form a bonding interface. |
· 20000 online users. · 4000 switches, ACs and APs in total. |
|
Analyzer |
3 |
· vCPU: 24 × 2 cores, 2.0 GHz. · Memory: 192 GB. · System disk: 3 TB. · Data disk: 4 TB. The random read/write speed cannot be lower than 100 M/s and shared storage is not supported. · ETCD disk: 50 GB. Installation path: /var/lib/etcd · NICs: ¡ Non-bonding mode: 2 × 10 Gbps interfaces. ¡ Bonding mode (recommended mode: mode 2 or mode 4): 4 × 10 Gbps interfaces, each two form a bonding interface. |
· 40000 online users. · 8000 switches, ACs and APs in total. |
|
Analyzer |
3 |
· vCPU: 28 × 2 cores, 2.0 GHz. · Memory: 224 GB. · System disk: 3 TB. · Data disk: 5 TB. The random read/write speed cannot be lower than 100 M/s and shared storage is not supported. · ETCD disk: 50 GB. Installation path: /var/lib/etcd · NICs: ¡ Non-bonding mode: 2 × 10 Gbps interfaces. ¡ Bonding mode (recommended mode: mode 2 or mode 4): 4 × 10 Gbps interfaces, each two form a bonding interface. |
· 60000 online users. · 12000 switches, ACs and APs in total. |
|
Analyzer |
3 |
· vCPU: 32 × 2 cores, 2.0 GHz. · Memory: 256 GB. · System disk: 3 TB. · Data disk: 8 TB. The random read/write speed cannot be lower than 100 M/s and shared storage is not supported. · ETCD disk: 50 GB. Installation path: /var/lib/etcd · NICs: ¡ Non-bonding mode: 2 × 10 Gbps interfaces. ¡ Bonding mode (recommended mode: mode 2 or mode 4): 4 × 10 Gbps interfaces, each two form a bonding interface. |
· 100000 online users. · 20000 switches, ACs and APs in total. |
VM requirements in the DC scenario
|
Node settings |
Maximum number of devices |
Maximum number of TCP connections |
Remarks |
||
|
Node name |
Node quantity |
Minimum node requirements |
|||
|
Analyzer |
1 |
· vCPU: 20 × 2 cores, 2.0 GHz. · Memory: 256 GB. · System disk: 1.92 TB. · Data disk: 8 TB. The random read/write speed cannot be lower than 200 M/s and shared storage is not supported. · ETCD disk: 50 GB SSDs. Installation path: /var/lib/etcd · NICs: ¡ Non-bonding mode: 2 × 10 Gbps interfaces. ¡ Bonding mode (recommended mode: mode 2 or mode 4): 4 × 10 Gbps interfaces, each two form a bonding interface. |
50 |
1000 VMs, 2000 TCP streams/sec. |
2 TCP streams/sec per VM. |
|
Node settings |
Maximum number of devices |
Maximum number of TCP connections |
Remarks |
||
|
Node name |
Node quantity |
Minimum single-node requirements |
|||
|
Analyzer |
3 |
· vCPU: 20 × 2 cores, 2.0 GHz. · Memory: 192 GB. · System disk: 1.92 TB. · Data disk: 8 TB. The random read/write speed cannot be lower than 200 M/s and shared storage is not supported. · ETCD disk: 50 GB. Installation path: /var/lib/etcd · NICs: ¡ Non-bonding mode: 2 × 10 Gbps interfaces. ¡ Bonding mode (recommended mode: mode 2 or mode 4): 4 × 10 Gbps interfaces, each two form a bonding interface. ¡ 10 GE bandwidth for inter-cluster communication |
50 |
1000 VMs, 2000 TCP streams/sec. |
2 TCP streams/sec per VM. |
|
3 |
· vCPU: 24 × 2 cores, 2.0 GHz. · Memory: 256 GB. · System disk: 1.92 TB. · Data disk: 12 TB. The random read/write speed cannot be lower than 200 M/s and shared storage is not supported. · ETCD disk: 50 GB. Installation path: /var/lib/etcd · NICs: ¡ Non-bonding mode: 2 × 10 Gbps interfaces. ¡ Bonding mode (recommended mode: mode 2 or mode 4): 4 × 10 Gbps interfaces, each two form a bonding interface. ¡ 10 GE bandwidth for inter-cluster communication |
100 |
3000 VMs, 6000 TCP streams/sec. |
2 TCP streams/sec per VM. |
|
|
3 |
· vCPU: 32 × 2 cores, 2.0 GHz. · Memory: 256 GB. · System disk: 1.92 TB. · Data disk: 12 TB. The random read/write speed cannot be lower than 200 M/s and shared storage is not supported. · ETCD disk: 50 GB. Installation path: /var/lib/etcd · NICs: ¡ Non-bonding mode: 2 × 10 Gbps interfaces. ¡ Bonding mode (recommended mode: mode 2 or mode 4): 4 × 10 Gbps interfaces, each two form a bonding interface. ¡ 10 GE bandwidth for inter-cluster communication |
200 |
6000 VMs, 12000 TCP streams/sec. |
2 TCP streams/sec per VM. |
|
|
|
NOTE: · You can calculate the overall TCP streams per second based on the total number of VMs in the DC (2 streams/sec per VM) to determine the required hardware specifications. · Make sure the CPU, memory, and disk capacity meet the requirements and sufficient physical resources are reserved. Overcommitment is not supported. · Only H3C CAS virtualization is supported and CAS virtualization must use local storage. Make sure the physical drive capacity meet the disk size requirements after RAID setup. A minimum of three drives of the same type is required for RAID setup. · DC collectors do not support deployment on VMs. |
VM requirements in the WAN scenario
In the WAN scenario, Analyzer must be deployed together with Controller. Analyzer cannot be deployed alone and you must deploy the security controller first. For converged deployment hardware requirements, see AD-NET Hardware Configuration Guide.
Operating system requirements
The following operating systems are supported:
· Common_Linux-1.1.2_V9R1B07D014
· H3Linux 2.0.2
· Red Hat Enterprise Linux 8.4
· Red Hat Enterprise Linux 8.6
· Red Hat Enterprise Linux 8.8
· Kylin Linux Advanced Server release V10SP2
|
|
IMPORTANT: · All nodes in the cluster must be installed with the same operating system version. · Kylin V10SP2, UOS V20, Red Hat Enterprise Linux 8.4, Red Hat Enterprise Linux 8.6 and Red Hat Enterprise Linux 8.8 needs to be prepared by the user. |
Software requirements
Analyzer runs on Unified Platform. Before deploying Analyzer, deploy Unified Platform.
Server requirements for SeerCollector deployment
|
|
IMPORTANT: · To use the TCP/UDP and INT stream analysis functions provided by Analyzer, you must deploy SeerCollector. · The menu path for managing the SeerCollector collector in the Analyzer on the management page is [Analysis>Analysis Options>Collector>Collector Parameters>SeerCollector]. · If the SeerCollector collector uses an Intel brand CPU, please make sure that the model is E5-2690 v4 or higher (you can execute the lscpu command to check the specific CPU model), otherwise the SeerCollector collector will not function properly. |
Hardware requirements
SeerCollector must be installed on a physical server. Hardware configuration requirements are as follows.
Table 16 SeerCollector server hardware requirements (x86-64(Intel64))
|
Item |
Requirements |
|
CPU |
Intel(R) Xeon(R) CPU (as a best practice, use the Platinum or Gold series), 2.0 GHz, 20+ virtual cores. |
|
Memory |
128 GB. |
|
Disk |
System disk: 2 × 600 GB HDDs (SAS/SATA) or SSDs in RAID 1 mode. |
|
NIC |
1 × 10 Gbps collection interface + 1 × 10 Gbps management interface. · The collection interface must support the DPDK technology, and you cannot configure it in bonding mode. The management network interface can be configured in bonding mode. · As a best practice, use an Intel 82599 NIC as the collection NIC for an x86 server. Plan in advance which NIC is used for collection, record information of the NIC (name, MAC), and plan and set the IP address for it. After the configuration is deployed, the collection NIC is managed by DPDK and will not be displayed in the Linux kernel command output. · You can also use an Mellanox 4[ConnectX-3] NIC as the collection NIC. As a best practice, use one of the two Mellanox 4[ConnectX-3] models: Mellanox technologies MT27710 family,and Mellanox technologies MT27700. If an Mellanox 4[ConnectX-3] NIC is used for the collection NIC, you must use other types of NICs as the management NIC. An ARM server supports only Mellanox NICs currently. · Do not configure DPDK binding for the management network interface. |
|
|
NOTE: · The SeerCollector collector needs to ensure that the NUMA node corresponding to the collected NIC has been allocated memory, otherwise the NIC cannot be recognized, which will cause the SeerCollector to fail to run. Please refer to section How to check if NUMA nodes are allocated memory?. If memory is not allocated, please try to adjust the position of the memory module to ensure that the corresponding NUMA node is allocated memory. · "If SeerCollector collector is used on Hygon servers, hyper-threading cannot be manually turned off. Please refer to section How to check if hyper-threading is enabled?. · If SeerCollector is used on Hygon servers, after the first installation of the operating system, hardware virtualization needs to be enabled. Otherwise, DPDK NIC cannot receive packets normally. Please refer to section How to enable hardware virtualization function?. · For SeerCollector used on Phytium servers, it is necessary to ensure that the first 16 cores correspond to the NUMA nodes that are allocated memory (for example, if a NUMA node has 8 cores, node 1 is cores 0 to 7, and node 2 is cores 8 to 15, then node 1 and node 2 need to be allocated memory). Please refer to section How to check if NUMA nodes are allocated memory?. |
Table 17 SeerCollector server hardware requirements (Hygon x86-64 server)
|
Item |
Requirements |
|
CPU |
CPU: 48 cores (total physical cores), 2 × Hygon C86 7265,24 cores,2.2 GHz |
|
Memory |
The total capacity must be 128 GB or greater, and a minimum of eight memory modules are required (for example, eight 16-GB memory modules are required to provide a capacity of 128 GB). |
|
Disk |
System disk: 2 × 600 GB HDDs (SAS/SATA) or SSDs in RAID 1 mode. |
|
NIC |
1 × 10 Gbps collection interface + 1 × 10 Gbps management interface. · The collection interface must support the DPDK technology, and you cannot configure it in bonding mode. The management network interface can be configured in bonding mode. · As a best practice, use an Intel 82599 NIC as the collection NIC for an x86 server. Plan in advance which NIC is used for collection, record information of the NIC (name, MAC), and plan and set the IP address for it. After the configuration is deployed, the collection NIC is managed by DPDK and will not be displayed in the Linux kernel command output. · You can also use an Mellanox 4[ConnectX-3] NIC as the collection NIC. As a best practice, use one of the two Mellanox 4[ConnectX-3] models: Mellanox technologies MT27710 family,and Mellanox technologies MT27700. If an Mellanox 4[ConnectX-3] NIC is used for the collection NIC, you must use other types of NICs as the management NIC. An ARM server supports only Mellanox NICs currently. · Do not configure DPDK binding for the management network interface. |
Table 18 SeerCollector server hardware requirements(Kunpeng ARM server)
|
Item |
Requirements |
|
CPU |
CPU: 64 cores (total physical cores), 2 × Kunpeng 920 5232, 32 cores, 2.6 GHz |
|
Memory |
128 GB. |
|
Disk |
System disk: 2 × 600 GB HDDs (SAS/SATA) or SSDs in RAID 1 mode. |
|
NIC |
1 × 10 Gbps collection interface + 1 × 10 Gbps management interface. · The collection interface must support the DPDK technology, and you cannot configure it in bonding mode. The management network interface can be configured in bonding mode. · As a best practice, use an Intel 82599 NIC as the collection NIC for an x86 server. Plan in advance which NIC is used for collection, record information of the NIC (name, MAC), and plan and set the IP address for it. After the configuration is deployed, the collection NIC is managed by DPDK and will not be displayed in the Linux kernel command output. · You can also use an Mellanox 4[ConnectX-3] NIC as the collection NIC. As a best practice, use one of the two Mellanox 4[ConnectX-3] models: Mellanox technologies MT27710 family,and Mellanox technologies MT27700. If an Mellanox 4[ConnectX-3] NIC is used for the collection NIC, you must use other types of NICs as the management NIC. An ARM server supports only Mellanox NICs currently. · Do not configure DPDK binding for the management network interface. |
Table 19 SeerCollector server hardware requirements(Phytium ARM server)
|
Item |
Requirements |
|
CPU |
CPU: 128 cores (total physical cores), 2 × Phytium S2500, 64 cores, 2.1 GHz |
|
Memory |
128 GB. |
|
Disk |
System disk: 2 × 600 GB HDDs (SAS/SATA) or SSDs in RAID 1 mode. |
|
NIC |
1 × 10 Gbps collection interface + 1 × 10 Gbps management interface. · The collection interface must support the DPDK technology, and you cannot configure it in bonding mode. The management network interface can be configured in bonding mode. · As a best practice, use an Intel 82599 NIC as the collection NIC for an x86 server. Plan in advance which NIC is used for collection, record information of the NIC (name, MAC), and plan and set the IP address for it. After the configuration is deployed, the collection NIC is managed by DPDK and will not be displayed in the Linux kernel command output. · You can also use an Mellanox 4[ConnectX-3] NIC as the collection NIC. As a best practice, use one of the two Mellanox 4[ConnectX-3] models: Mellanox technologies MT27710 family,and Mellanox technologies MT27700. If an Mellanox 4[ConnectX-3] NIC is used for the collection NIC, you must use other types of NICs as the management NIC. An ARM server supports only Mellanox NICs currently. · Do not configure DPDK binding for the management network interface. |
|
|
NOTE: · The compatible CPU architecture varies by Analyzer version. For the compatible CPU architecture, see the release notes. · A SeerCollector server must provide two interfaces: one data collection interface to receive mirrored packets from the network devices and one management interface to exchange data with Analyzer. · If using the Kylin system, an IP address must be configured for the network card bond, otherwise the bond network card will be unavailable. |
Table 20 NICs available for SeerCollector (x86-64(Intel64))
|
Vendor |
Chip |
Model |
Series |
Applicable version |
|
Intel |
JL82599 |
H3C UIS CNA 1322 FB2-RS3NXP2D, 2-Port 10GE Optical Interface Ethernet Adapter (SFP+) |
CNA-10GE-2P-560F-B2 |
All versions |
|
JL82599 |
H3C UIS CNA 1322 FB2-RS3NXP2DBY, 2-Port 10GE Optical Interface Ethernet Adapter (SFP+) |
CNA-10GE-2P-560F-B2 |
All versions |
|
|
X550 |
H3C UNIC CNA 560T B2-RS33NXT2A, 2-Port 10GE Copper Interface Ethernet Adapter, 1*2 |
N/A |
All versions |
|
|
X540 |
UN-NIC-X540-T2-T-10Gb-2P (copper interface network adapter) |
N/A |
All versions |
|
|
X520 |
UN-NIC-X520DA2-F-B-10Gb-2P |
N/A |
All versions |
|
|
Mellanox |
MT27710 Family [ConnectX-4 Lx] |
NIC-ETH540F-LP-2P |
Mellanox Technologies MT27710 Family |
All versions |
|
MT27712A0-FDCF-AE[ConnectX-4Lx] |
NIC-620F-B2-25Gb-2P |
|
All versions |
|
|
Mellanox Technologies MT28908 Family [ConnectX-6] |
IB-MCX653105A-HDAT-200Gb-1P |
Mellanox Technologies MT28908 Family |
E6508 and later |
|
|
Broadcom |
BCM57414 |
NetXtreme-E 10Gb/25Gb RDMA Ethernet Controller(rev 01) |
|
All versions |
Table 21 System disk partition planning
|
RAID |
Partition name |
Mounting point |
Minimum capacity |
Remarks |
|
2*600GB, RAID1 |
/dev/sda1 |
/boot/efi |
200 MB |
EFI System Partition This partition is required only in UEFI mode. |
|
/dev/sda2 |
/boot |
1024 MB |
N/A |
|
|
/dev/sda3 |
/ |
590 GB |
N/A |
|
|
/dev/sda4 |
swap |
4 GB |
Swap partition |
|
|
IMPORTANT: · SeerCollector does not require storing data in data disks. · If the system disk is greater than 1.5 TB, you can use automatic partitioning for the disk. If the system disk is smaller than or equal to 1.5 TB, partition the disk manually as described in Table 21. |
Table 22 Operating systems and processors supported by SeerCollector
|
Processor |
Operating system |
Kernel version |
Remarks |
|
Hygon (x86) |
H3Linux 1.3.1 |
5.10.38-21.hl05.el7.x86_64 |
All versions |
|
H3Linux 1.1.2 |
3.10.0-957.27.2.el7.x86_64 |
All versions |
|
|
Kylin V10SP2 |
4.19.90-24.4.v2101.ky10.x86_64 |
All versions |
|
|
H3Linux 2.0.2 |
5.10.0-60.72.0.96.hl202.x86_64 |
E6505 and later |
|
|
5.10.0-136.12.0.86.4.nos1.x86_64 |
E6507 and later |
||
|
Intel (X86) |
Kylin V10SP2 |
4.19.90-24.4.v2101.ky10.x86_64 |
All versions |
|
H3Linux 1.1.2 |
3.10.0-957.27.2.el7.x86_64 |
All versions |
|
|
3.10.0-1160.31.1.hl09.el7.x86_64 |
E6505 and later |
||
|
H3Linux 2.0.2 |
5.10.0-60.18.0.50.1.hl202.x86_64 |
E6310 and later |
|
|
5.10.0-136.12.0.86.4.hl202.x86_64 |
E6505 and later |
||
|
5.10.0-136.12.0.86.4.nos1.x86_64 |
E6507 and later |
||
|
Red Hat Enterprise Linux 8.8 |
4.18.0-477.13.1.el8_8.x86_64 |
E6508 and later |
|
|
Kunpeng (ARM) |
Kylin V10 |
4.19.90-11.ky10.aarch64 |
All versions |
|
Kylin V10SP2 |
4.19.90-24.4.v2101.ky10.aarch64 |
All versions |
|
|
H3Linux 2.0.2 |
5.10.0-60.72.0.96.hl202.aarch64 |
E6310 and later |
|
|
Phytium (ARM) |
Kylin V10SP2 |
4.19.90-24.4.v2101.ky10.aarch64 |
All versions |
|
|
NOTE: To view the kernel version, use compression software (for example, WinRAR) to open the .iso file. Then, access the Packages directory, and identify the file named in the kernel-version.rpm format, where version indicates the kernel version. For example, file path Packages\kernel-3.10.0-957.27.2.el7.x86_64.rpm corresponds to kernel version 3.10.0-957.27.2.el7.x86_64. |
Operating system requirements
|
|
IMPORTANT: · To avoid configuration failures, make sure a SeerCollector server uses an H3Linux_K310_V112 operating system or later. · If SeerCollector needs to reinstall or update the operating system, it must be uninstalled first. |
As a best practice, use the operating system coming with Unified Platform.
Installing SeerCollector
Please install SeerCollector according to Hardware requirements and Operating system requirements for SeerCollector.
Other requirements
· Disable the firewall and disable auto firewall startup:
a. Execute the systemctl stop firewalld command to disable the firewall.
b. Execute the systemctl disable firewalld command to disable auto firewall startup.
c. Execute the systemctl status firewalld command to verify that the firewall is in inactive state.
The firewall is in inactive state if the output from the command displays Active: inactive (dead).
[root@localhost ~]# systemctl status firewalld
firewalld.service - firewalld - dynamic firewall daemon
Loaded: loaded (/usr/lib/systemd/system/firewalld.service; disabled; vendor preset: enabled)
Active: inactive (dead)
Docs: man:firewalld(1)
· To avoid conflicts with the service routes, access the NIC configuration file whose name is prefixed ifcfg in the /etc/sysconfig/network-scripts/ directory, change the value of the DEFROUTE field to no, and then save the file.
Client requirements
You can access Analyzer from a Web browser without installing any client. As a best practice, use a Google Chrome 70 or later Web browser.
Pre-installation checklist
Table 23 Pre-installation checklist
|
Item |
Requirements |
|
|
Server |
Hardware |
· The hardware (including CPUs, memory, disks, and NICs) settings are as required. · The servers for analyzer and SeerCollector deployment support operating system CentOS 7.6 or its higher versions. |
|
Software |
RAID arrays have been set up on the disks of the servers. |
|
|
Client |
The Web browser version is as required. |
|
|
Server and OS compatibility |
To view the compatibility matrix between H3C servers and operating systems, click http://www.h3c.com/en/home/qr/default.htm?id=65 |
|
|
|
NOTE: For general H3Linux configuration, see CentOS 7.6 documents. |
Software package authentication
After uploading installation packages, first perform MD5 verification on each software package to ensure its integrity and correctness.
1. Identify the uploaded installation packages.
[root@node1~]# cd /opt/matrix/app/install/packages/
[root@node1~]# ls
BMP_Report_E0722_x86.zip UDTP_Core_E0722_x86.zip
…
2. Obtain the MD5 value of an installation package, for example, UDTP_Core_E0722_x86.zip.
[root@node1~]# md5sum UDTP_Core_E0722_x86.zip
2b8daa20bfec12b199192e2f6e6fdeac UDTP_Core_E0722_x86.zip
3. Compare the obtained MD5 value with the MD5 value released with the software. If they are the same, the installation package is correct.
Analyzer network planning
Network overview
|
|
· The solution supports single-stack southbound networking. · Configure the network when you install the Analyzer-Collector component. For more information, see deploying components in "Deploying Analyzer." · To avoid address conflict, make sure the southbound network IP address pool does not contain the VIP address of the northbound service. · To use the device-based simulation feature of the WAN simulation analysis component, configure IP settings for WAN simulation analysis as described in "Network planning." |
· Northbound network—Northbound service VIP of Unified Platform. The cluster uses the network to provide services.
· Southbound network—Network that the COLLECTOR component and SeerCollector use to receive data from devices. Make sure the southbound network and a device from which data is collected are reachable to each other. The following southbound network schemes are available:
¡ Integrated southbound and northbound network—No independent southbound network is configured for analyzers. Cloud deployment supports only this southbound network scheme.
¡ Single-stack southbound network—Create one IPv4 or IPv6 network as the southbound network.
¡ Dual-stack southbound network—Create one IPv4 network and one IPv6 network as the southbound networks to collect information from both IPv4 and IPv6 devices.
· Simulation network—Network used to manage simulated virtual devices and the DTN server when the Analyzer-Simulation and DTN_MANAGER components are deployed in the WAN scenario.
|
|
NOTE: · Northbound network is for users to access the backend through the Web interface. As a network for communication between cluster nodes, it requires high bandwidth and the northbound network should be capable of achieving a bandwidth of 10Gbps. · Southbound network is for service data reporting. It is a service network and generally not exposed to external access. The network has a large amount of traffic and a high bandwidth requirement. The use of a southbound network isolates service data and management data. Subnet isolation is achieved if the northbound and southbound networks use different NICs and subnets. · If the same NIC and different subnets are used, only subnet isolation is achieved. If the same subnet and the same NIC (integrated northbound and southbound) are used, no isolation is provided. You can configure subnets and NICs as needed. For example, in a production environment, management network and service network use different subnets, and the management network use the fortress machine to monitor the service situation. |
|
|
NOTE: You can use the same NIC and same network segment for the southbound network and northbound network. As a best practice, use different NICs and network segments for the southbound network and northbound network when the NICs and network segment resources are sufficient. Use the single-stack southbound network or dual-stack southbound network solution as needed. |
Network planning
Plan the network for different scenarios as follows:
· DC—Deploy one SeerCollector and plan IP settings for SeerCollector.
· Campus—By default, SeerCollector is not required. To use TCP stream analysis, deploy one SeerCollector and plan IP settings for the SeerCollector.
· WAN—No SeerCollector is required.
· WAN—To deploy the simulation component application and use the device-based simulation feature, plan IP settings for the simulation network.
Integrated southbound and northbound network
In the integrated southbound and northbound network scheme, no independent network is created for the analyzer to collect data. The analyzer uses the network of Unified Platform.
In single-node mode, plan network settings for one analyzer and one SeerCollector, as shown in Table 24.
|
Network |
IP address type |
IP address quantity |
Description |
NIC requirements |
|
Network 1 |
Unified Platform cluster node IP address |
One IPv4 address |
IP address of the server where Unified Platform is deployed. |
See "Server requirements." |
|
Northbound service VIP of Unified Platform |
One IPv4 address |
IP address that Unified Platform uses to provide services. Determined during Unified Platform deployment. |
||
|
Data reporting IP address of SeerCollector |
One IPv4 address |
IP address that the SeerCollector uses to report collected data to the analyzer. |
NIC on SeerCollector. |
|
|
Network 2 |
Data collecting IP address of SeerCollector |
Two IPv4 addresses |
One IP address for receiving mirrored packets from network devices and one floating IP address (used only in cluster mode) of SeerCollector for device discovery. Make sure that you can use the mirrored packet receiving address to reach the device service port. |
Independent DPDK NIC on SeerCollector. |
In cluster mode, plan network settings for three analyzers and one SeerCollector, as shown in Table 25.
Table 25 Analyzer network planning in cluster mode (integrated southbound and northbound network)
|
Network |
IP address type |
IP address quantity |
Description |
NIC requirements |
|
Network 1 |
Unified Platform cluster node IP address |
Three IPv4 addresses |
IP addresses of the servers where Unified Platform is deployed. |
See "Server requirements " |
|
Northbound service VIP of Unified Platform |
One IPv4 address |
IP address that Unified Platform uses to provide services. Determined during Unified Platform deployment. |
||
|
Data reporting IP address of SeerCollector |
One IPv4 address |
IP address that SeerCollector uses to report collected data to the analyzer. |
NIC on SeerCollector. |
|
|
Network 2 |
Data collecting IP address of SeerCollector |
Two IPv4 addresses |
One IP address for receiving mirrored packets from network devices and one floating IP address (used only in cluster mode) of SeerCollector for device discovery. Make sure that you can use the mirrored packet receiving address to reach the device service port. |
Independent DPDK NIC on SeerCollector. |
Single-stack southbound network
In the single-stack southbound network scheme, configure an independent IPv4 or IPv6 network for data collection. The IP version of the southbound collecting IP address must be the same as that of the collector's data collecting IP address.
In single-node deployment mode, plan network settings for one analyzer and one SeerCollector, as shown in Table 26.
Table 26 Analyzer network planning in single-node deployment mode (single-stack southbound network)
|
Network |
IP address type |
IP address quantity |
Description |
NIC requirements |
|
Network 1 |
Unified Platform cluster node IP address |
One IPv4 address. |
IP address of the server where Unified Platform is deployed. |
See "Server requirements." |
|
Northbound service VIP of Unified Platform |
One IPv4 address. |
IP address that Unified Platform uses to provide services. Determined during Unified Platform deployment. |
||
|
Data reporting IP address of SeerCollector |
One IPv4 address. |
IP address that SeerCollector uses to report collected data to the analyzer. |
NIC on SeerCollector. |
|
|
Network 2 |
Data collecting IP address of SeerCollector |
Two IPv4 addresses. |
One IP address for receiving mirrored packets from network devices and one floating IP address (used only in cluster mode) of SeerCollector for device discovery. Make sure that you can use the mirrored packet receiving address to reach the device service port. |
Independent DPDK NIC on SeerCollector. |
|
Network 3 |
Southbound collecting IP address |
Four IPv4 or IPv6 addresses. |
Addresses of the container additional networks (one active collecting network and one passive collecting network). One container address and one cluster VIP for each network. |
See "Server requirements." |
In cluster mode, plan network settings for three analyzers and one SeerCollector, as shown in Table 27.
Table 27 Analyzer network planning in cluster mode (single-stack southbound network)
|
Network |
IP address type |
IP address quantity |
Description |
NIC requirements |
|
Network 1 |
Unified Platform cluster node IP address |
Three IPv4 addresses. |
IP addresses of the servers where Unified Platform is deployed. |
See "Server requirements." |
|
Northbound service VIP of Unified Platform |
One IPv4 address. |
IP address that Unified Platform uses to provide services. Determined during Unified Platform deployment. |
See "Server requirements." |
|
|
Data reporting IP address of SeerCollector. |
One IPv4 address. |
IP address that SeerCollector uses to report collected data to the analyzer. |
NIC on SeerCollector. |
|
|
Network 2 |
Data collecting IP address of SeerCollector |
Two IPv4 addresses. |
One IP address for receiving mirrored packets from network devices and one floating IP address (used only in cluster mode) of SeerCollector for device discovery. Make sure that you can use the mirrored packet receiving address to reach the device service port. |
Independent DPDK NIC on SeerCollector. |
|
Network 3 |
Southbound collecting IP address |
Eight IPv4 or IPv6 addresses. |
Addresses of the container additional networks (one active collecting network and one passive collecting network). Three container addresses and one cluster VIP for each network. |
See "Server requirements." |
|
|
NOTE: If SeerCollector is deployed, make sure the southbound collecting IP address and the data collecting IP address of SeerCollector are of the same IP version. |
Dual-stack southbound network
In the dual-stack southbound network scheme, configure an independent dual-stack network for data collection.
In single-node deployment mode, plan network settings for one analyzer and one SeerCollector, as shown in Table 28.
Table 28 Analyzer network planning in single-node deployment mode (dual-stack southbound network)
|
Network |
IP address type |
IP address quantity |
Description |
NIC requirements |
|
Network 1 |
Unified Platform cluster node IP address |
One IPv4 address. |
IP address of the server where Unified Platform is deployed. |
See "Server requirements." |
|
Northbound service VIP of Unified Platform |
One IPv4 address. |
IP address that Unified Platform uses to provide services. Determined during Unified Platform deployment. |
See "Server requirements." |
|
|
Data reporting IP address of SeerCollector. |
One IPv4 address. |
IP address that SeerCollector uses to report collected data to the analyzer. |
NIC on SeerCollector. |
|
|
Network 2 |
Data collecting IP address of SeerCollector |
Two IPv4 addresses. |
One IP address for receiving mirrored packets from network devices and one floating IP address (used only in cluster mode) of SeerCollector for device discovery. Make sure that you can use the mirrored packet receiving address to reach the device service port. |
Independent DPDK NIC on SeerCollector. |
|
Network 3 |
Southbound collecting IPv4 address |
Four IPv4 addresses. |
Addresses of the container additional networks (one active collecting network and one passive collecting network). One container address and one cluster VIP for each network. |
See "Server requirements." |
|
Network 4 |
Southbound collecting IPv6 address |
Four IPv6 addresses. |
Addresses of the container additional networks (one active collecting network and one passive collecting network). One container address and one cluster VIP for each network. |
See "Server requirements." |
In cluster mode, plan network settings for three analyzers and one SeerCollector, as shown in Table 29.
Table 29 Analyzer network planning in cluster mode (dual-stack southbound network)
|
Network |
IP address type |
IP address quantity |
Description |
NIC requirements |
|
Network 1 |
Unified Platform cluster node IP address |
Three IPv4 addresses. |
IP addresses of the servers where Unified Platform is deployed. |
See "Server requirements." |
|
Northbound service VIP of Unified Platform |
One IPv4 address. |
IP address that Unified Platform uses to provide services. Determined during Unified Platform deployment. |
See "Server requirements." |
|
|
Data reporting IP address of SeerCollector. |
One IPv4 address. |
IP address that SeerCollector uses to report collected data to the analyzer. |
NIC on SeerCollector. |
|
|
Network 2 |
Data collecting IPv4 address of SeerCollector |
Two IPv4 addresses. |
One IP address for receiving mirrored packets from network devices and one floating IP address (used only in cluster mode) of SeerCollector for device discovery. Make sure that you can use the mirrored packet receiving address to reach the device service port. |
Independent DPDK NIC on SeerCollector. |
|
Network 3 |
Southbound collecting IPv4 address |
Eight IPv4 addresses. |
Addresses of the container additional networks (one active collecting network and one passive collecting network). Three container addresses and one cluster VIP for each network. |
See "Server requirements." |
|
Network 4 |
Southbound collecting IPv6 address |
Eight IPv6 addresses. |
Addresses of the container additional networks (one active collecting network and one passive collecting network). Three container addresses and one cluster VIP for each network. |
See "Server requirements." |
Single-stack simulation network
In single-node deployment mode, only one simulation analyzer and one DTN_MANAGER node are deployed. Their network settings are planned as shown in Table 30.
Table 30 Analyzer network planning in single-node deployment mode (single-stack silumation network)
|
Network |
IP address type |
IP address quantity |
Description |
NIC requirements |
|
Network 1 |
WAN simulation analysis IP address |
Three IPv4 addresses. |
One IP address for connecting DTN_MANAGER and the DTN server. The other two IP addresses for device-based simulation network connection. |
WAN simulation analysis NICs. To use the device-based simulation feature, use independent DPDK NICs. |
Deployment workflow
Analyzer deployment tasks at a glance
1. (Required.) Prepare servers
Prepare one or three servers for Unified Platform deployment. For server requirements, see "Server requirements."
2. (Required.) Deploy Unified Platform
a. Install Unified Platform Matrix cluster.
For more information, see H3C Unified Platform Deployment Guide. For information about disk planning, see "Data disk planning."
b. Deploy Unified Platform cluster and applications in the following sequence:
- UDTP_Core
- UDTP_GlusterFS
- UDTP_Middle
- BMP_Alarm
- BMP_Dashboard
- BMP_Report
- BMP_Subscription
- BMP_Template
- BMP_Widget
- BMP_IMonitor (optional)
- BMP_WebSocket (optional)
- BMP_Syslog (optional)
- BMP_Region (optional)
3. (Optional.) Prepare configuration
4. (Required.) Deploy Analyzer
Install Analyzer-Collector during Analyzer deployment.
|
|
IMPORTANT: · In converged deployment where the controller and analyzers are installed in the same cluster, install the controller first. · In campus single-node converged deployment where Unified Platform+vDHCP+SE+EIA+WSM+SA are all deployed, the microservice quantity might exceed the limit. To adjust the maximum number of microservices, see "How do I adjust the maximum microservice quantity in a campus single-node converged deployment scenario?." · In releases earlier than Unified Platform E0711H07, the application package of Analyzer-Collector was placed in Unified Platform release packages. As from SeerAnalyzer E6313, the application package of Analyzer-Collector was placed in SeerAnalyzer release packages. · When you deploy a release earlier than SeerAnalyzer E6313, use the application package of Analyzer-Collector inside Unified Platform release packages earlier than Unified Platform E0711 and E0711H07. In E0711H05, the application package of Analyzer-Collector is placed in package IA-collector-E0711H05_xx. To obtain the Analyzer-Collector application package, decompress package IA-collector-E0711H05_xx. · When you deploy SeerAnalyzer E6313, or later, use the application package of Analyzer-Collector inside the SeerAnalyzer release package. |
Deploying Unified Platform and optional components
Installation processes may differ when using different operating systems. Please refer to H3C Unified Platform Deployment Guide for details. For information on which Unified Platform version is compatible with the Analyzer please refer to the corresponding version manual.
If you need to run the Analyzer on Unified Platform you must partition the hard drive under the guidance of this chapter and deploy all application installation packages required by the Analyzer.
Restrictions and guidelines
|
|
IMPORTANT: After reinstalling and rebuilding a master node, run the following two scripts on any other master node that does not need to be reinstalled: · Navigate to /opt/matrix/app/install/metadata/UCENTER/collection/scripts/fault_migration and execute the sh -x faultMigration.sh $IP command. · Navigate to /opt/matrix/app/install/metadata/SA/scripts/fault_migration/ and execute the ./faultMigration.sh $IP command. The $IP argument is the management IP of the newly created node. If you do not run the above scripts, the itoa-collect-multi container will keep restarting endlessly. |
Please note the following considerations during installation:
· When setting the system date and time, please select the appropriate time zone based on your actual location.
· To ensure successful deployment of core components, do not select Beijing when you select a time zone.
· For disk and partition plans, see "Data disk planning."
· In cases where the built-in NTP server is used, it is necessary to ensure that the system time and current time on all nodes are consistent prior to deploying the cluster. For scenarios where an external NTP server is used as the clock synchronization source, there is no need to modify the system time on nodes.
· If the NTP server is not accessible from the southbound address, it can be added later after the cluster is created. When configuring network settings for interfacing cards, it can be added by modifying the cluster parameters.
· After the cluster deployment is completed, please do not modify the system time, as it may cause the cluster to become abnormal.
· The hostname can only consist of lowercase letters, digits, hyphens and dots, and cannot start or end with either a hyphen or a dot.
· During the establishment of the Matrix cluster, it is necessary to ensure that the hostnames of all nodes within the cluster are unique and comply with the naming rules of a hostname. Failure to comply may cause the cluster to fail to establish.
· After the completion of Matrix cluster deployment, please do not modify the hostname of the operating system.
· When multiple networks are displayed in the network list, do not select the network card that is marked with.
· When there are two or more network cards in the installation environment, the subnet used for the northbound business virtual IP must be consistent with the subnet of the first physical network card displayed by the 'ifconfig' command. Otherwise, the cluster deployment may fail or the Pod may not start.
· The network and hostname configuration page can configure network cards. Please make sure to complete the network card binding configuration before creating the cluster.
· When configuring IPv4 and IPv6 addresses, it is necessary to specify the gateway, otherwise there may be problems when creating the cluster.
· After the completion of the operating system installation, it is recommended not to use the 'ifconfig' command to shutdown or start network cards, otherwise it may cause environment exceptions.
· Matrix uses a separate network port and does not allow the configuration of sub-interfaces and sub-IPs on this network port.
· The IP addresses of other network ports on Matrix nodes cannot be in the same network segment as the IP used to establish the cluster.
· The set operating system password cannot contain the following symbols: $ (quotation mark), \ (escape symbol), ' (single quotation mark), " (double quotation mark).
· When working on Matrix, do not perform the following operations on Unified Platform:
¡ Upload or delete component installation packages.
¡ Deploy, upgrade, or scale components.
¡ Add, modify, or delete networks.
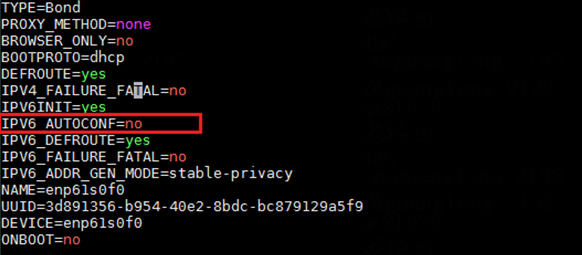
· If H3Linux 2.0.x (Euler operating system) is chosen for deployment, the network card for the southbound network needs to be configured in bond mode and its bond configuration needs to be modified. Otherwise, the use of collection components will be affected.
a. After logging in to the server background with administrator privileges, set the IPV6_AUTOCONF configuration to no in configuration file /etc/sysconfig/network-scripts/ifcfg-xxx (xxx is the name of the bond network card):
b. After the modification is complete, execute the command ‘nmcli c reload && nmcli c up xxx (where xxx is the name of the bond network card)’ in the background.
Figure 1 Configuration modification
· The considerations for modifying the node time are as follows:
¡ When modifying the time zone of all devices imported into SeerAnalyzer, it should be consistent with the time zone of the SeerAnalyzer server.
¡ When modifying the time zone of SeerCollector, it should be consistent with the time zone of the SeerAnalyzer server.
· The disk prepared for GlusterFS application cannot be formatted, otherwise the installation will fail. If the disk has been formatted, it can be repaired by using the 'wipefs -a /dev/disk name' command to clear the disk.
· If you need to use the HTTPS protocol, login to Unified Platform after the application and components are installed, click on the 'System > System Settings > Security Settings' menu item to enter the Security Configuration page, and enable the HTTPS protocol.
· Before deploying SeerAnalyzer and SeerCollector, please execute the command cat /proc/sys/vm/nr_hugepages on each node to check if HugePages is enabled. If the returned result is not 0, please record that value and execute the command echo 0 > /proc/sys/vm/nr_hugepages to temporarily disable HugePages. After the deployment of SeerAnalyzer and SeerCollector is completed, change the digit 0 to the recorded value in the command echo 0 > /proc/sys/vm/nr_hugepages, and execute it on each node to recover the HugePages configuration.
Disk partition planning
Make RAID and partition plans based on the service load and server configuration requirements. Edit the partition names as needed in the production environment.
|
|
NOTE: · For information about exceptional partitions, see the remarks in the tables. · After Analyzer is deployed, you cannot scale out disks. Prepare sufficient disks before deployment. · The Analyzer data disk must have three partitions planned on mount points /sa_data, /sa_data/mpp_data, and /sa_data/kafka_data. To ensure successful deployment, the file system type must be configured as ext4. If you partition the data disk as recommended in "Data disk planning" without editing the file system type, you can edit the file system type as described in "How to change the file system type of a data disk partition to ext4?." · Use independent disks as data disks. |
System disk and ETCD disk planning
|
|
CAUTION: · If the system disk has sufficient space, mount the /var/lib/docker, /var/lib/ssdata, and GlusterFS partitions to the system disk as a best practice. If the system disk does not have sufficient space but the data disk does, you can mount the three partitions to the data disk. Make sure they are mounted to an independent partition in the data disk. · If you reserve sufficient space for the GlusterFS partition in the system disk, the system will create the partition automatically. · A 500GB GlusterFS is required for Unified Platform and analyzer. To deploy other components, calculate the disk space required by the components, and reserve more space for GlusterFS. · /opt/matrix/app/data/base-service/backupRecovery—Used to store service backup data. The partition size depends on the service backup data size of various components. You must obtain the disk capacity for the components, and then perform scale-out or scale-in operations based on the obtained information. |
The system disk is mainly used to store operating system and Unified Platform data. RAID configuration is required and supported RAID modes include RAID1, RAID5, and RAID10. Use Table 31 to plan the system disks if sufficient space is available.
Table 31 System disk and ETCD disk planning
|
Partition name |
Mount point |
Recommended minimum capacity |
Remarks |
|
|
1902 GB |
/dev/sda1 |
/boot/efi |
200 MB |
EFI system partition, which is required only in UEFI mode. |
|
/dev/sda2 |
/boot |
1024 MB |
N/A |
|
|
/dev/sda3 |
/ |
400 GB |
You can increase the partition size as needed when the disk space is sufficient. As a best practice, do not store service data in the root directory. |
|
|
/dev/sda4 |
/var/lib/docker |
400 GB |
You can increase the partition size as needed when the disk space is sufficient. |
|
|
/dev/sda6 |
swap |
4 GB |
Swap partition. |
|
|
/dev/sda7 |
/var/lib/ssdata |
450 GB |
You can increase the partition size as needed when the disk space is sufficient. |
|
|
/dev/sda8 |
N/A |
500 GB |
Reserved for GlusterFS. Not required during operating system installation. |
|
|
/dev/sda9 |
/opt/matrix/app/data/base-service/backupRecovery |
50 GB |
(Optional.) Partition used to store service backup data. If you do not create this partition, backup data will be stored in the root partition. If you create this partition, backup data will be stored in this partition, and the disk space needs to be allocated from the root partition. For example, to set the size of this partition to 50 GB, you need to adjust the size of the root partition from 400 GB to 350 GB. Set the partition size as required by different service requirements. |
|
|
50 GB |
/dev/sdb |
/var/lib/etcd |
50 GB |
The ETCD partition can share a physical disk with other partitions. As a best practice to ensure better performance, configure the ETCD partition on a separate physical disk. |
Data disk planning
|
|
IMPORTANT: High data security risks exist in RAID0 setup. As a best practice, do not configure RAID 0. |
Data disks are mainly used to store Analyzer service data and Kafka data. The disk quantity and capacity requirements vary by network scale. Configure RAID 0 when only one or two data disks are available (not recommended). Configure RAID 5 when three or more data disks are available.
Data disk partition planning for Campus
Table 32 Data disk partition planning for Campus (scheme one)
|
Disk capacity after RAID configuration |
Partition name |
Mount point |
Recommended minimum capacity |
File system type |
|
2 TB |
/dev/sdc1 |
/sa_data |
400 GB |
ext4 |
|
/dev/sdc2 |
/sa_data/mpp_data |
950 GB |
ext4 |
|
|
/dev/sdc3 |
/sa_data/kafka_data |
450 GB |
ext4 |
Table 33 Data disk partition planning for Campus (scheme two)
|
Disk capacity after RAID configuration |
Partition name |
Mount point |
Recommended minimum capacity |
File system type |
|
3 TB |
/dev/sdc1 |
/sa_data |
400 GB |
ext4 |
|
/dev/sdc2 |
/sa_data/mpp_data |
1550 GB |
ext4 |
|
|
/dev/sdc3 |
/sa_data/kafka_data |
750 GB |
ext4 |
Table 34 Data disk partition planning for Campus (scheme three)
|
Disk capacity after RAID configuration |
Partition name |
Mount point |
Recommended minimum capacity |
File system type |
|
4 TB |
/dev/sdc1 |
/sa_data |
400 GB |
ext4 |
|
/dev/sdc2 |
/sa_data/mpp_data |
2200 GB |
ext4 |
|
|
/dev/sdc3 |
/sa_data/kafka_data |
1000 GB |
ext4 |
Table 35 Data disk partition planning for Campus (scheme four)
|
Disk capacity after RAID configuration |
Partition name |
Mount point |
Recommended minimum capacity |
File system type |
|
5 TB |
/dev/sdc1 |
/sa_data |
400 GB |
ext4 |
|
/dev/sdc2 |
/sa_data/mpp_data |
2800 GB |
ext4 |
|
|
/dev/sdc3 |
/sa_data/kafka_data |
1300 GB |
ext4 |
Table 36 Data disk partition planning for Campus (scheme five)
|
Disk capacity after RAID configuration |
Partition name |
Mount point |
Recommended minimum capacity |
File system type |
|
7 TB |
/dev/sdc1 |
/sa_data |
400 GB |
ext4 |
|
/dev/sdc2 |
/sa_data/mpp_data |
4000 GB |
ext4 |
|
|
/dev/sdc3 |
/sa_data/kafka_data |
1900 GB |
ext4 |
Table 37 Data disk partition planning for Campus (scheme six)
|
Disk capacity after RAID configuration |
Partition name |
Mount point |
Recommended minimum capacity |
File system type |
|
8 TB |
/dev/sdc1 |
/sa_data |
400 GB |
ext4 |
|
/dev/sdc2 |
/sa_data/mpp_data |
4600 GB |
ext4 |
|
|
/dev/sdc3 |
/sa_data/kafka_data |
2200 GB |
ext4 |
Table 38 Data disk partition planning for Campus (scheme seven)
|
Disk capacity after RAID configuration |
Partition name |
Mount point |
Recommended minimum capacity |
File system type |
|
11 TB |
/dev/sdc1 |
/sa_data |
400 GB |
ext4 |
|
/dev/sdc2 |
/sa_data/mpp_data |
6400 GB |
ext4 |
|
|
/dev/sdc3 |
/sa_data/kafka_data |
3100 GB |
ext4 |
Data disk partition planning for DC
Table 39 Data disk partition planning for DC (scheme one)
|
Disk capacity after RAID configuration |
Partition name |
Mount point |
Recommended minimum capacity |
File system type |
|
8 TB |
/dev/sdc1 |
/sa_data |
400 GB |
ext4 |
|
/dev/sdc2 |
/sa_data/mpp_data |
4600 GB |
ext4 |
|
|
/dev/sdc3 |
/sa_data/kafka_data |
2200 GB |
ext4 |
Table 40 Data disk partition planning for DC (scheme two)
|
Disk capacity after RAID configuration |
Partition name |
Mount point |
Recommended minimum capacity |
File system type |
|
12 TB |
/dev/sdc1 |
/sa_data |
400 GB |
ext4 |
|
/dev/sdc2 |
/sa_data/mpp_data |
7000 GB |
ext4 |
|
|
/dev/sdc3 |
/sa_data/kafka_data |
3400 GB |
ext4 |
Table 41 Data disk partition planning for DC (scheme three)
|
Disk capacity after RAID configuration |
Partition name |
Mount point |
Recommended minimum capacity |
File system type |
|
24 TB |
/dev/sdc1 |
/sa_data |
400 GB |
ext4 |
|
/dev/sdc2 |
/sa_data/mpp_data |
14200 GB |
ext4 |
|
|
/dev/sdc3 |
/sa_data/kafka_data |
7000 GB |
ext4 |
Data disk partition planning for WAN
Table 42 Data disk partition planning for WAN (scheme one)
|
Disk capacity after RAID configuration |
Partition name |
Mount point |
Recommended minimum capacity |
File system type |
|
2 TB |
/dev/sdc1 |
/sa_data |
400 GB |
ext4 |
|
/dev/sdc2 |
/sa_data/mpp_data |
950 GB |
ext4 |
|
|
/dev/sdc3 |
/sa_data/kafka_data |
450 GB |
ext4 |
Table 43 Data disk partition planning for WAN (scheme two)
|
Disk capacity after RAID configuration |
Partition name |
Mount point |
Recommended minimum capacity |
File system type |
|
4 TB |
/dev/sdc1 |
/sa_data |
400 GB |
ext4 |
|
/dev/sdc2 |
/sa_data/mpp_data |
2200 GB |
ext4 |
|
|
/dev/sdc3 |
/sa_data/kafka_data |
1000 GB |
ext4 |
Manually creating data disk partitions
During operating system deployment, you can create the data disk partitions required for Analyzer deployment. For more information about this task, see "Installing the H3Linux operating system and Matrix" in H3C Unified Platform Deployment Guide. If you do not create those data disk partitions during operating system deployment, you can manually create them after deploying Unified Platform as follows:
1. Verify that the remaining data disk space is sufficient for partition creation on each node that requires Analyzer deployment.
For more information about data disk partition sizes, see "Data disk planning."
2. Create disk partitions.
Execute the fdisk command on a node to create disk partitions.
The following example creates a 400 GB partition on disk sdb.
Figure 2 Creating disk partitions
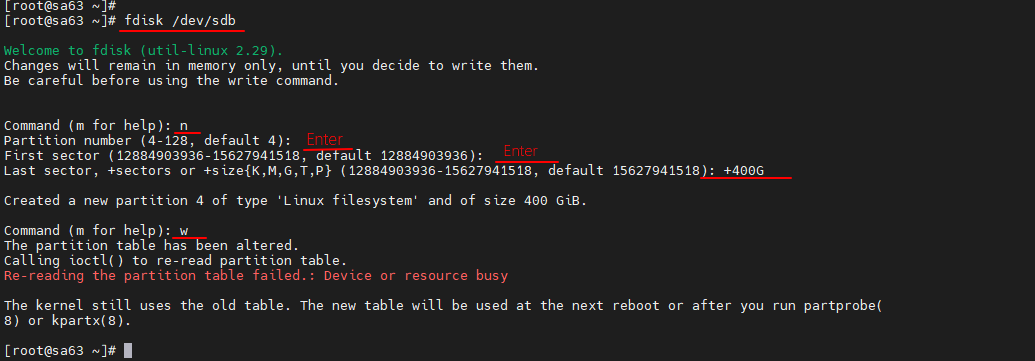
|
|
NOTE: When the system prompts a failure to re-read the disk partition list, use the reboot command to restart the node. |
As shown in Figure 3, partition /dev/sdb1 is created on disk sdb and its capacity is 400 GB.
Figure 3 Viewing the disk partition list
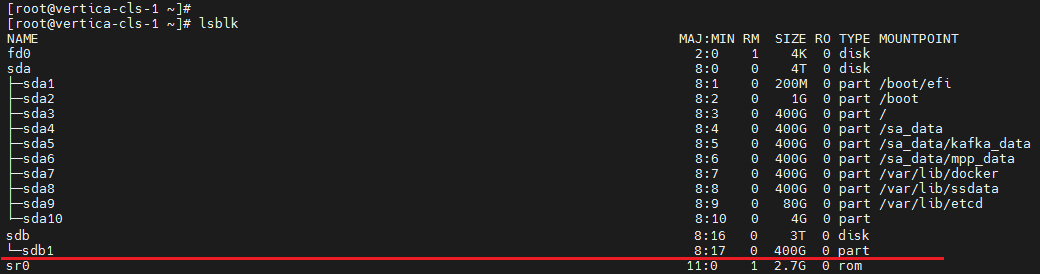
After you execute the fdisk command, the system might prompt the error message shown in Figure 4. To clear this error, execute the command shown in Figure 5 to process the data disk.
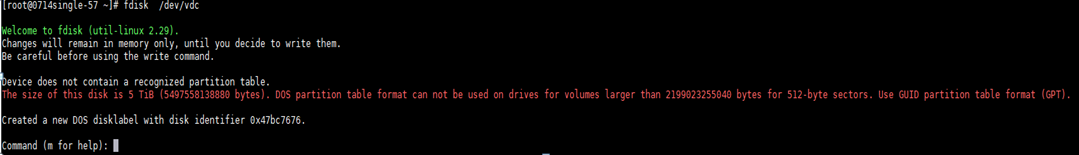
Figure 5 Processing the data disk
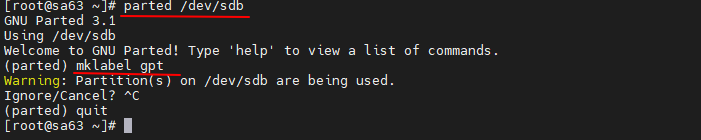
Repeat the previous steps to create the required disk partitions on all nodes that require Analyzer deployment. For more information about data disk partition sizes, see "Data disk planning."
3. Format and mount the disk partitions.
a. Execute the mkfs.ext4 /dev/sdb1 command to format the created disk partitions. Perform this task for all non-ext4 disk partitions. By default, the disk partitions created in the previous steps are in xfs format.
b. Execute the following command to obtain the new UUIDs assigned to the disk partitions. When you specify multiple disk partitions in the command, use the pipe symbol (|) to separate them. This example obtains the new UUIDs assigned to disk partitions sdb1, sdb2, and sdb3.
[root@sa1 ~]# ll /dev/disk/by-uuid | grep -E 'sdb1|sdb2|sdb3'
lrwxrwxrwx. 1 root root 10 Jun 7 15:40 89b86ff9-e7ee-4426-ba01-61e78ca6f4b1 -> ../../sdb1
lrwxrwxrwx. 1 root root 10 Jun 7 15:40 c9da5aba-80b9-4202-ba16-b222462a0329 -> ../../sdb3
lrwxrwxrwx. 1 root root 10 Jun 7 15:40 cac87013-f014-40df-9aca-af76888b1823 -> ../../sdb2
c. Execute the vim /etc/fstab command to update UUIDs of the disk partitions and change their format to ext4.
d. Verify the configuration.
[root@ sa1 ~]# cat /etc/fstab
#
# /etc/fstab
# Created by anaconda on Wed Dec 7 15:44:15 2022
#
# Accessible filesystems, by reference, are maintained under '/dev/disk‘
# See man pages fstab(5), findfs(8), mount(8) and/or blkid(8) for more info
#
UUID=519f9af7-12ce-4567-b62c-2315cad14f56 / xfs defaults 0 0
UUID=83628a24-94f5-4937-b016-64d0f72bd98d /boot xfs defaults 0 0
UUID=3B96-1B3A /boot/efi vfat defaults,uid=0,gid=0,umask=0077,shortname=winnt 0 0
UUID=89b86ff9-e7ee-4426-ba01-61e78ca6f4b1 /sa_data ext4 defaults 0 0
UUID=c9da5aba-80b9-4202-ba16-b222462a0329 /sa_data/kafka_data ext4 defaults 0 0
UUID=cac87013-f014-40df-9aca-af76888b1823 /sa_data/mpp_data ext4 defaults 0 0
UUID=51987141-f160-4886-ad51-bc788ec2176c /var/lib/docker xfs defaults 0 0
UUID=4e91a1b8-4890-4a41-be00-098ded6b8102 /var/lib/etcd xfs defaults 0 0
UUID=2554963b-03e7-4be4-b214-7350f2eb3df9 /var/lib/ssdata xfs defaults 0 0
#UUID=a22041b8-7c7c-4730-bc1f-634306145e36 swap swap defaults 0 0
e. Execute the mount -a command to mount the disk partitions.
The following error messages are a normal phenomenon.
mount: Mount point /sa_data/kafka_data does not exist
mount: Mount point /sa_data/mpp_data does not exist
To clear the above error messages, create those directories that do not exist.
[root@ sa1 ~]# mkdir -p /sa_data/kafka_data
[root@ sa1 ~]# mkdir -p /sa_data/mpp_data
f. Execute the mount -a command again to mount the disk partitions and change the file system type.
g. Repeat the previous steps on all nodes that require Analyzer deployment.
Application installation packages required for deploying Unified Platform
When deploying Unified Platform, please upload the application installation packages shown in Table 44. For specific installation steps, please refer to H3C Unified Platform Deployment Guide.
The required application packages must be deployed during the deployment of Unified Platform Please refer to the 'Application installation packages' section in H3C Unified Platform Deployment Guide for deployment steps.
You can deploy optional application packages on the Matrix page before or after deploying the Analytics component. To ensure successful deployment, make sure the version of optional application packages is the same as that of the required application packages. Please refer to the " Application installation packages" section in H3C Unified Platform Deployment Guide for deployment steps.
The following table shows the naming formats of different installation packages. The version argument represents the version number.
Table 44 Required installation package
|
Installation package name |
Description |
Dependencies |
|
· x86: UDTP_Core_version_x86.zip · ARM: UDTP_Core_version_arm.zip |
Portal, unified authentication, user management, service gateway, help center, privileges, resource identify, license, configuration center, resource group, and log service. |
Middle and GlusterFS packages. |
|
· x86: UDTP_GlusterFS_version_x86.zip · ARM: UDTP_GlusterFS_version_arm.zip |
Local shared storage for a device. |
Middle package. |
|
· x86: UDTP_Middle_version_x86.zip · ARM: UDTP_Middle_version_arm.zip |
Middleware image repository. |
N/A |
|
· x86: BMP_IMonitor_version_x86.zip · ARM: BMP_IMonitor_version_arm.zip |
Self-monitoring service. |
Middle, GlusterFS, and core packages. |
|
· x86: BMP_Alarm_version_x86.zip · ARM: BMP_Alarm_version_arm.zip |
Alarm. |
Report package. |
|
· x86: BMP_Dashboard_version_x86.zip · ARM: BMP_Dashboard_version_arm.zip |
Dashboard framework. |
To use the dashboard application, you must first install the dashboard package and then the widget package. |
|
· x86: BMP_Report_version_x86.zip · ARM: BMP_Report_version_arm.zip |
Report. |
N/A |
|
· x86: BMP_Subscription_version_x86.zip · ARM: BMP_Subscription_version_arm.zip |
Subscription service. |
Report and alarm packages. |
|
· x86: BMP_Template_version_x86.zip · ARM: BMP_Template_version_arm.zip |
Access parameter template and monitor template. |
N/A |
|
· x86: BMP_Widget_version_x86.zip · ARM: BMP_Widget_version_arm.zip |
Platform dashboard widget. |
Dashboard package. To use the dashboard application, you must first install the dashboard package and then the widget package. |
|
· x86: BMP_WebSocket_version_x86.zip · ARM: BMP_WebSocket_version_arm.zip |
Optional. Southbound Websocket. |
N/A |
|
· x86: BMP_Syslog_version_x86.zip · ARM: BMP_Syslog_version_arm.zip |
Optional. Syslog. |
Report and alarm packages. |
|
· x86: BMP_Region_version_x86.zip · ARM: BMP_Region_version_arm.zip |
Optional. Hierarchical management. |
To send alarms, you must also install the report and alarm packages. |
|
|
NOTE: · Unified Platform installation package is not included in any Analyzer packages. Download Unified Platform package yourself as needed. |
Deploying Analyzer
Preparing for deployment
(Optional) Enabling NICs
|
|
CAUTION: As a best practice to avoid environment errors, do not use the ifconfig command to shut down or start the NIC. |
|
|
IMPORTANT: This section uses NIC ethA09-2 as an example. Replace ethA09-2 with the actual NIC name. |
To use multiple NICs, enable the NICs on the server.
To enable a NIC:
1. Log in to the server where Unified Platform is installed.
2. Open and edit the NIC configuration file.
[root@matrix01 /]# vi /etc/sysconfig/network-scripts/ifcfg-ethA09-2
3. Set the BOOTPROTO and ONBOOT fields to none and yes, respectively.
Figure 6 Editing the NIC configuration file
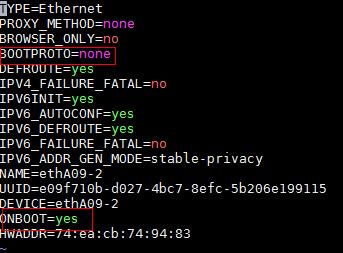
4. Execute the ifdown and ifup commands to restart the NIC.
[root@matrix01 /]# ifdown ethA09-2
[root@matrix01 /]# ifup ethA09-2
5. Execute the ifconfig command to verify that the NIC is in up state.
Analyzer application package instructions
Some Analyzer versions have either the x86 version or the ARM version installation package. Please refer to the release file for the specific package to install.
The following table shows the naming formats of different installation packages. The version argument represents the version number.
Table 45 Required installation package
|
Product name |
Installation package name |
Description |
|
Analyzer
|
· x86: Analyzer-Platform-verison_x86_64.zip · ARM: Analyzer-Platform-verison_arm.zip |
Basic platform component package. |
|
· x86: Analyzer-Telemetry-verison_x86_64.zip · ARM: Analyzer-Telemetry-verison_arm.zip |
Telemetry component package. |
|
|
· x86: Analyzer-AI-verison_x86_64.zip · ARM: Analyzer-AI-verison_arm.zip |
AI-driven forecast component package. |
|
|
· x86: Analyzer-Diagnosis-verison_x86_64.zip · ARM: Analyzer-Diagnosis-verison_arm.zip |
Diagnosis component package. |
|
|
· x86: Analyzer-SLA-verison_x86_64.zip · ARM: Analyzer-SLA-verison_arm.zip |
Service quality Analyzer package. |
|
|
· x86: Analyzer-TCP-verison_x86_64.zip · ARM : Analyzer-TCP-verison_arm.zip |
TCP traffic Analyzer package. |
|
|
· x86: Analyzer-WAN-verison_x86_64.zip · ARM: Analyzer-WAN-verison_arm.zip |
WAN application Analyzer package. |
|
|
· x86: DTN_MANAGER-verison_x86_64.zip |
DTN host management component package. |
|
|
· x86: Analyzer-Simulation-verison_x86_64.zip · ARM: Analyzer-Simulation-verison_arm.zip |
WAN network simulation component package. |
|
|
· x86: Analyzer-User-verison_x86_64.zip · ARM: Analyzer-User-verison_arm.zip |
User Analyzer package. |
|
|
· x86: Analyzer-AV-verison_x86_64.zip · ARM: Analyzer-AV-verison_arm.zip |
Audio and video Analyzer package. |
|
|
· x86: Analyzer-Collector-verison_x86_64.zip · ARM: Analyzer-Collector-verison_arm.zip |
Analyzer-Collector must be installed at analyzer deployment. |
|
|
Cloudnet |
· Versions earlier than Cloudnet E6214: ¡ x86: oasis-version.zip ¡ ARM: oasis-version-arm.zip · Versions Cloudnet E6214 and later versions: ¡ x86: Campus_Cloudnet_version_x86.zip ¡ ARM: oasis-version-arm.zip |
Cloudnet component package (required in the campus scenario.) |
|
|
NOTE: Analyzer: The analyzer installation package is SEERANALYZER-verison.zip. You must decompress the zipped file to obtain the executable file. Collector components: · COLLECTOR: Public collector component. · SeerCollector: Required to use the TCP analysis and INT analysis functions of Analyzer. |
(Optional.) Clearing known_hosts information recorded by each node
If you rebuild nodes after operating system installation and before Analyzer installation, you need to perform one of the following tasks on each node where Analyzer resides. The following tasks clear public key information recorded in known_hosts.
· If the user that performs installation is admin or root, execute the following commands:
rm -rf /root/.ssh/known_hosts
rm -rf /home/admin/.ssh/known_hosts
· If the user that performs installation is neither of admin and root, execute the following commands:
User sa_install is used in this example.
rm -rf /home/sa_install/.ssh/known_hosts
Deploying Analyzer
Restrictions and guidelines
The deployment procedure might differ by Unified Platform version. For more information, see the deployment guide for Unified Platform of the specific version.
You can deploy the scenario settings for Analyzer as needed. After Analyzer is deployed, you cannot deploy other scenarios. If you must deploy other scenarios, remove and re-deploy Analyzer.
You cannot modify the Matrix node or cluster IP address after Analyzer is deployed.
You cannot change the host name after Analyzer is deployed. For more information, see the deployment guide for Unified Platform.
To change the matrix node or cluster IP address at Analyzer deployment, access the Analysis Options > Task Management page to stop all parsing tasks in advance. You might fail to change the IP address if you do not stop all parsing tasks in advance.
To deploy DTN hosts and build a simulation network on Analyzer, see H3C SeerAnalyzer-WAN Simulation Network Operation Guide.
Deploying Analyzer for Unified Platform of versions earlier than E0713
Accessing the component deployment page
Log in to Unified Platform. On the top navigation bar, click System, and then select Deployment from the left navigation pane.
If you are deploying Analyzer for the first time, the component deployment guide page opens.
Figure 7 Component deployment guide
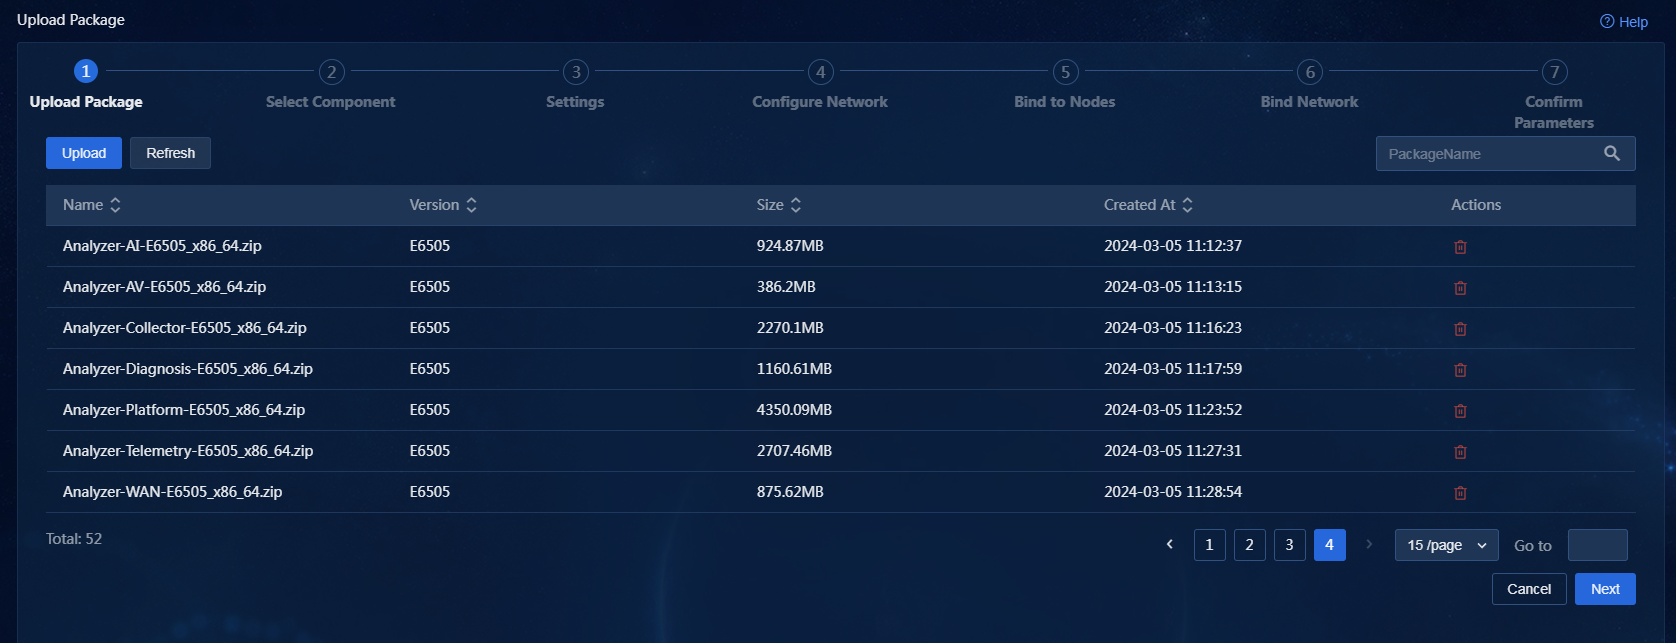
Uploading component installation packages
1. Click Upload.
2. Upload the Analyzer, Analyzer-Collector public collector component, and Cloudnet installation packages, and then click Next.
You must upload the Oasis installation package in the campus scenario.
You can also upload the installation packages at Unified Platform installation.
The WAN scenario does not support deploying Analyzer alone and supports only converged deployment of Analyzer and Controller. And you must install Controller before Analyzer.
Analyzer includes multiple component packages. You can upload them as required by the service scenario.The table conventions are as follows:
¡ Required—For the analyzer to operate correctly in the scenario, the component is required.
¡ Optional—Typically, the component is not installed in the scenario. You can install the component if its functions are required.
¡ N/A—The component is not supported in the scenario.
Table 46 Component and service scenario relations
|
Component |
Description |
Campus |
WAN carrier |
WAN branch |
DC |
|
Analyzer-Platform |
Platform component |
Required |
Required |
Required |
Required |
|
Analyzer-Collector |
Public collector component |
Required |
Required |
Required |
Required |
|
Analyzer-Telemetry |
Telemetry |
Required |
Required |
Required |
Required |
|
Analyzer-WAN |
WAN application analysis |
Optional, not required by default |
Required |
Required |
Optional |
|
Analyzer-Simulation |
WAN network simulation analysis |
N/A |
Optional |
N/A |
N/A |
|
DTN_Manager |
WAN DTN host management |
N/A |
Optional (must work in conjunction with Analyzer-Simulation) |
N/A |
N/A |
|
Analyzer-User |
User analysis |
Required |
N/A |
N/A |
N/A |
|
Analyzer-AV |
Audio and video analysis |
Optional |
Optional |
Optional |
N/A |
|
Analyzer-SLA |
Service quality analysis |
Optional |
Required |
N/A |
Required (SeerCollector required) |
|
Analyzer-TCP |
TCP stream analysis |
Optional (SeerCollector required), not required by default |
N/A |
N/A |
Required (SeerCollector required) |
|
Analyzer-Diagnosis |
Diagnosis and analysis |
Required |
Required |
Required |
Required |
|
Analyzer-AI |
AI-driven forecast |
Required |
Required |
Required |
Required |
|
|
IMPORTANT: · Analyzer-Telemetry is the basis of the WAN, User, AV, SLA, TCP, Diagnosis, and AI components and is required when you deploy any of these components. · DTN_MANAGER must be installed to use device simulation in the WAN carrier network simulation scenario. · Analyzer-WAN must be installed to use NetStream/sFlow in the DC scenario. |
Selecting components
|
|
CAUTION: If SeerCollector is not deployed, unselect the Analyzer-TCP component. |
1. Click the Analyzer tab.
2. Select Analyzer 6.0, and then select the uploaded Analyzer installation package.
Select a scenario as needed. Options include Campus, DC, and WAN.
Figure 8 Default settings in the campus scenario 1
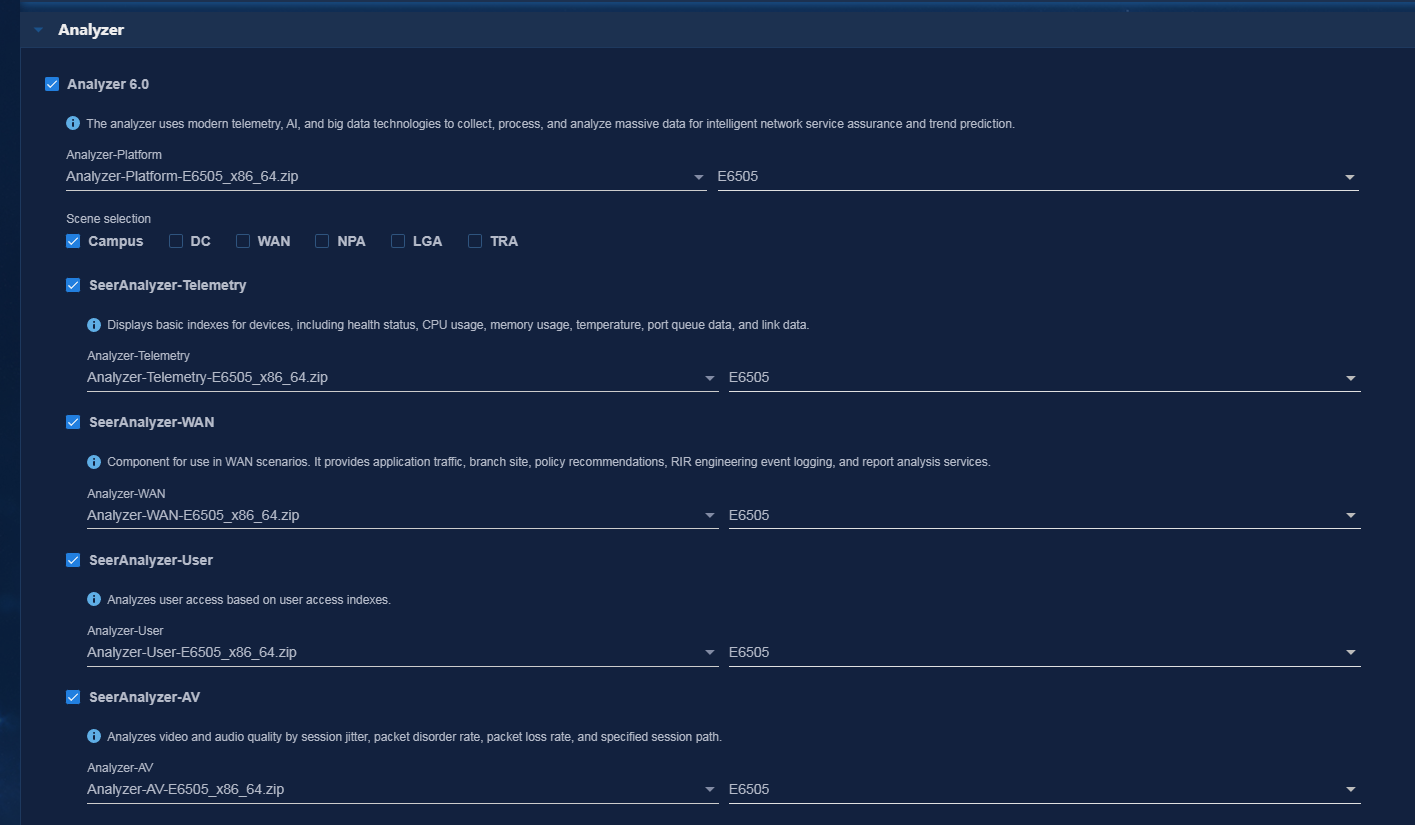
Figure 9 Default settings in the campus scenario 2
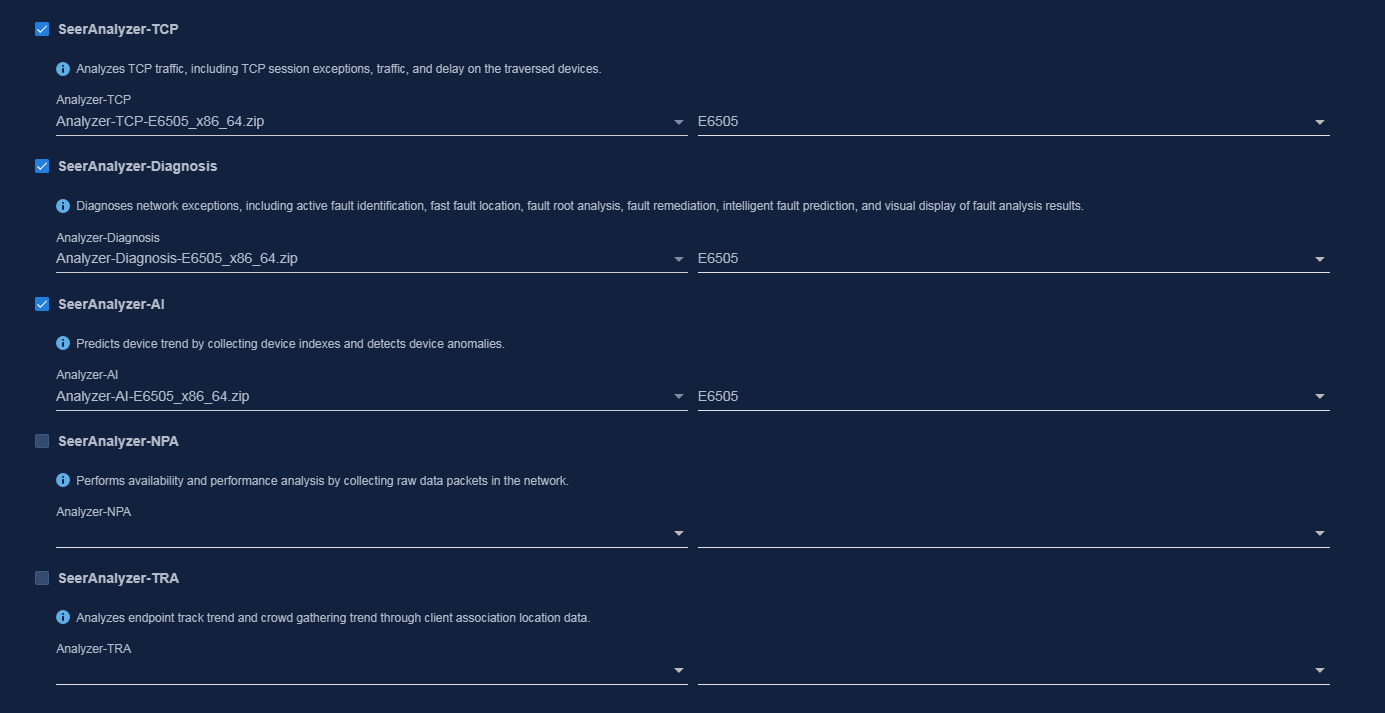
|
|
NOTE: For Campus scenarios, only the following components need to be deployed by default: Platform, Telemetry, Diagnosis, AI, and User. |
Figure 10 Default settings in the DC scenario 1

Figure 11 Default settings in the DC scenario 2
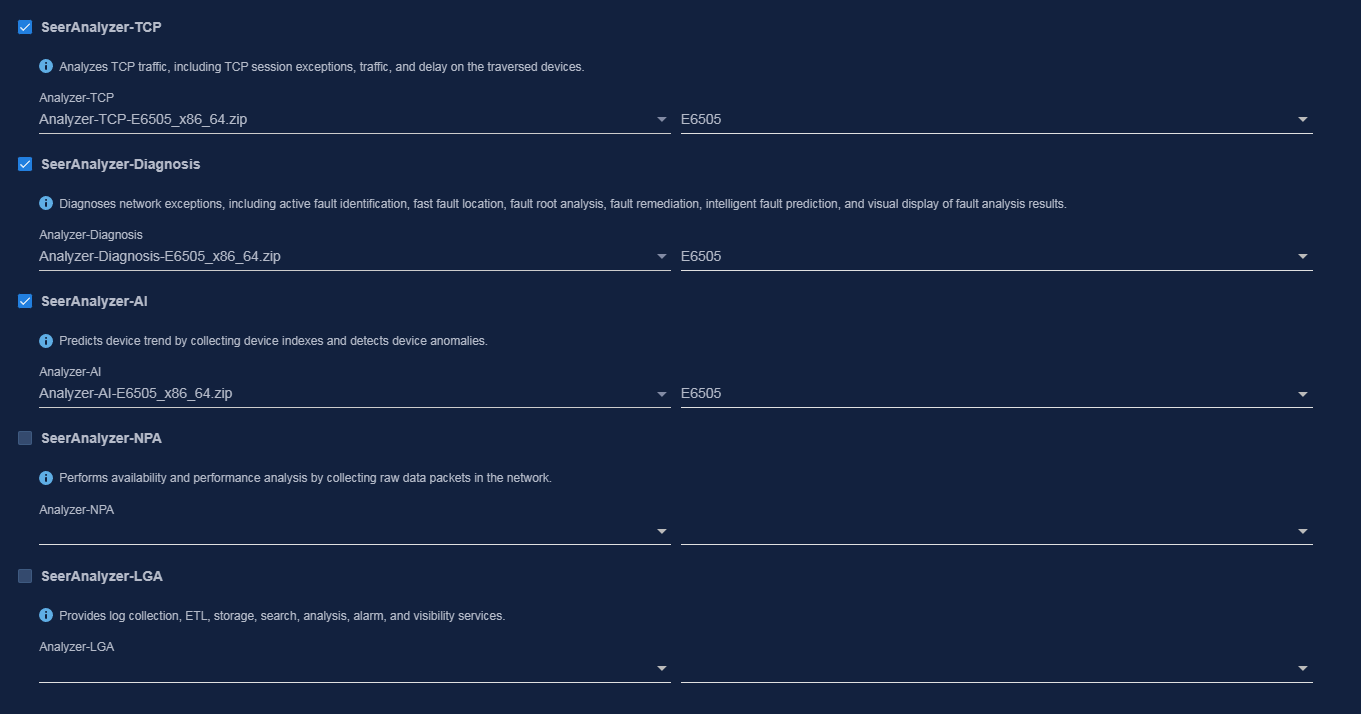
Figure 12 Default settings in the WAN scenario 1
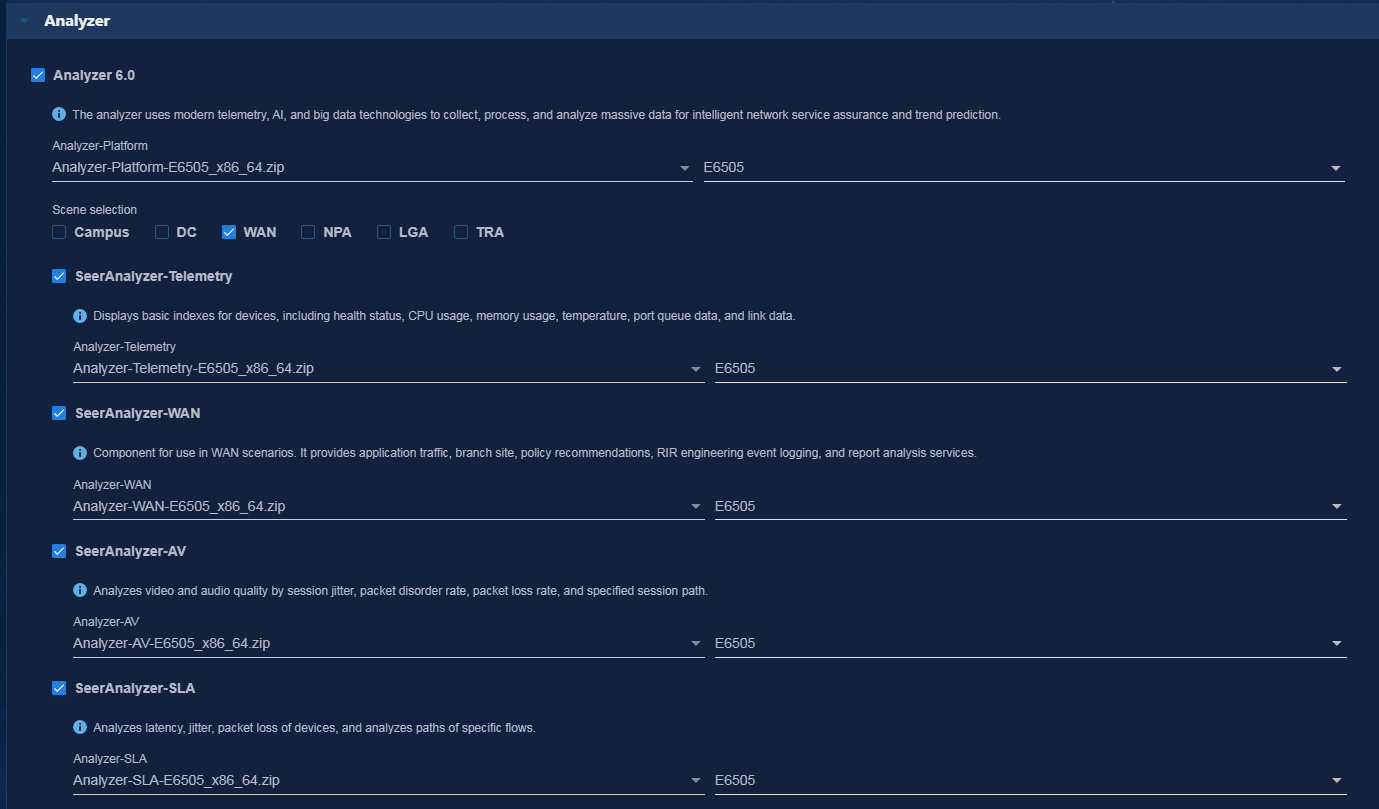
Figure 13 Default settings in the WAN scenario 2
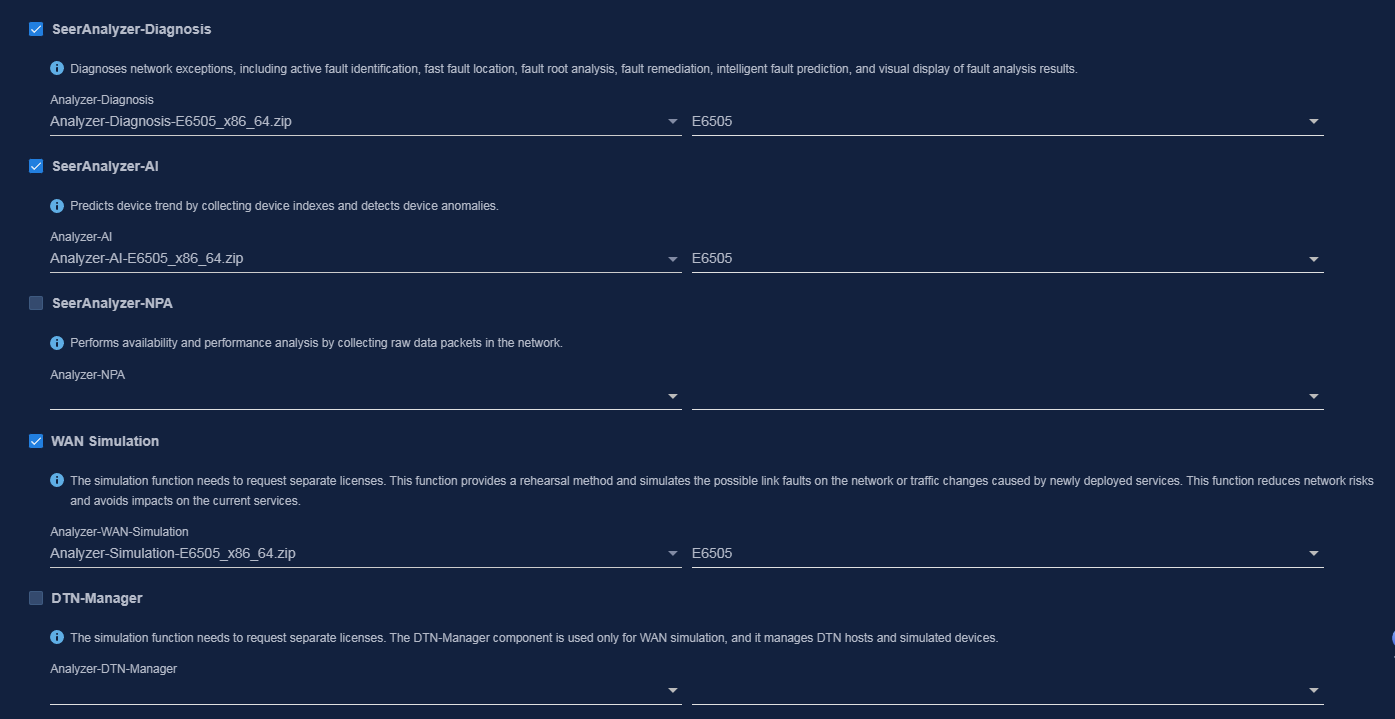
3. Click the Public Service tab, select Oasis Platform, and then select the uploaded Cloudnet installation package.
This step is required in the campus scenario.
4. Click the Public Service tab, select COLLECTOR for gRPC and NETCONF data collection. Select the uploaded Analyzer-Collector installation package, and then select the network scheme based on the network planning. For more information about the network planning, see "Analyzer network planning."
This section uses southbound single-stack as an example.
|
|
NOTE: According to Unified Platform versions, integrated southbound and northbound network might also be referred to as no southbound network. |
5. Click Next.
Figure 14 Selecting components 1
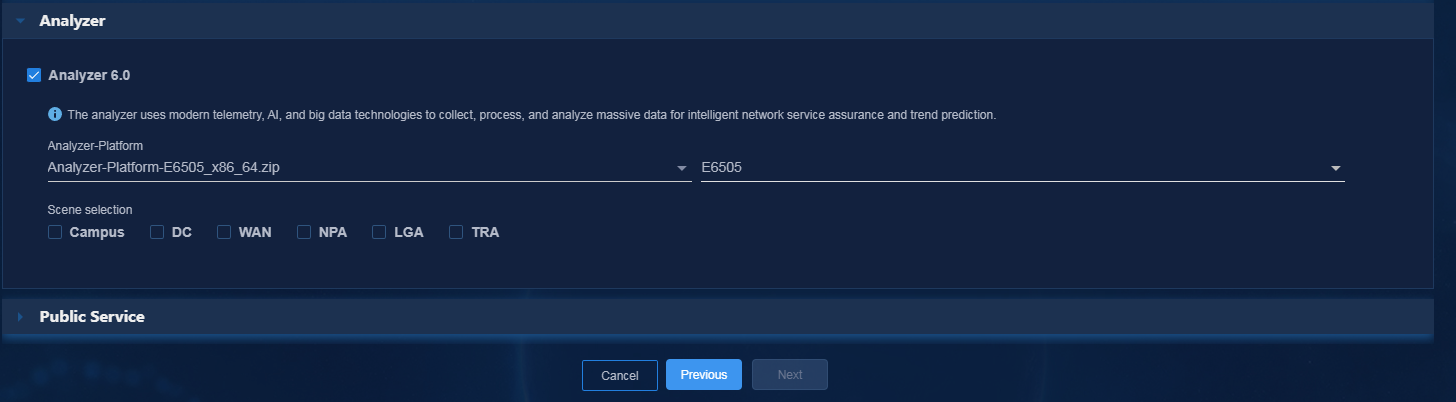
Figure 15 Selecting components 2
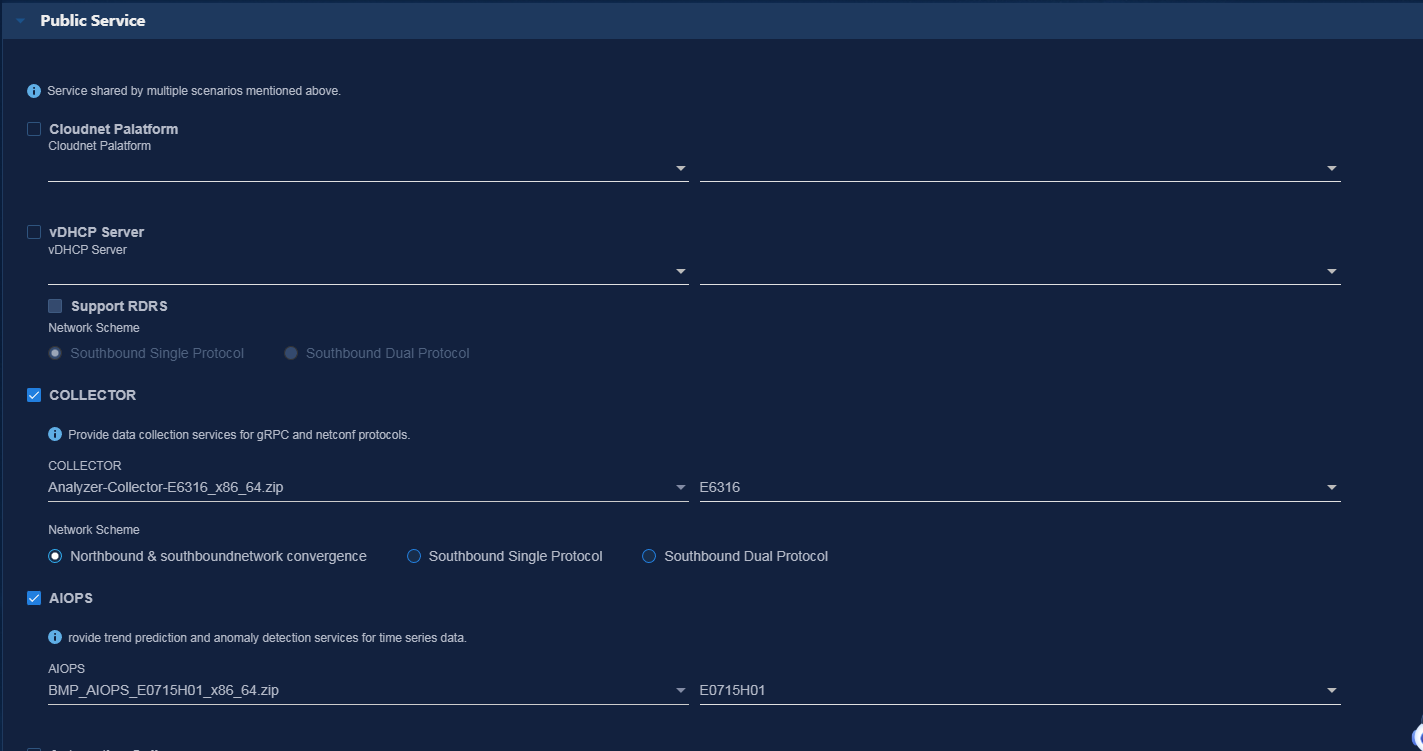
|
|
NOTE: · If the Cloudnet component is not installed in the public service, you can select Analyzer 6.0 to install the Cloudnet component. Components that have been installed will not be reinstalled. · For the analyzer to operate correctly, you must install the COLLECTOR component. |
Configuring parameters
Click Next without editing the parameters.
Configuring network settings
|
|
IMPORTANT: · Network settings are used only for COLLECTOR. COLLECTOR runs on the master node and you must bind network settings to the master node. · If Kylin system is selected, the IP address must be configured for NIC Bonding, otherwise the NIC Bonding cannot be used. |
Configure southbound collecting IP addresses for COLLECTOR. The configuration varies by network scheme:
· If you select the integrated southbound and northbound network (or no southbound network) scheme, click Next. As mentioned above, if conditions permit, isolate the southbound network and northbound network and use the southbound single protocol or southbound dual protocol scheme instead of the integrated southbound and northbound network solution.
· If you select the single-stack southbound network scheme, create an IPv4 or IPv6 network.
· If you select the dual-stack southbound network scheme, create an IPv4 network and an IPv6 network.
In this example, the single-stack southbound network scheme is selected and an IPv4 southbound network is created. After the configuration, click Next.
Figure 16 Configuring network settings
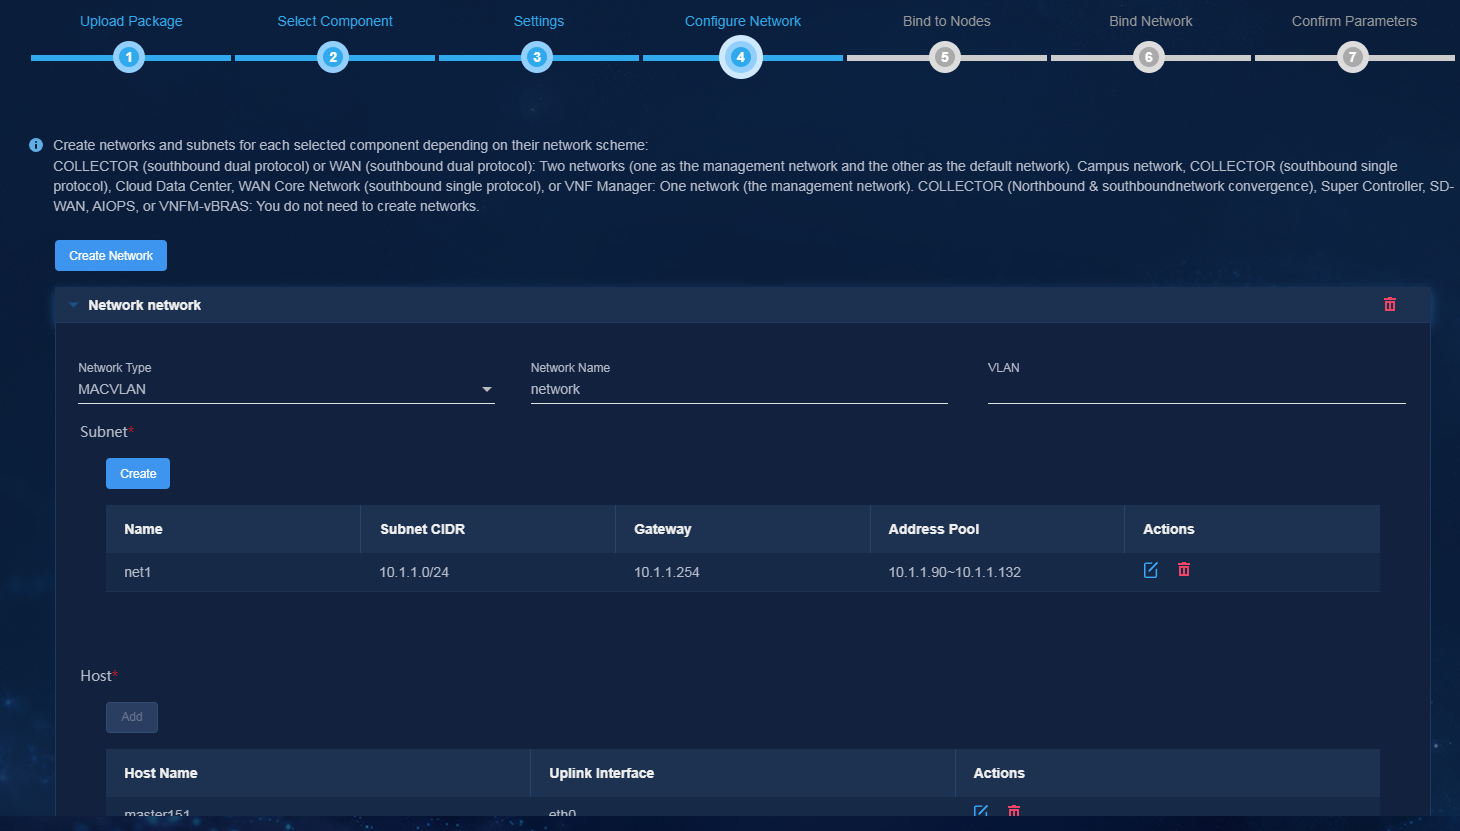
Configuring node bindings
Specify the nodes on which the analyzer is to be deployed. You can select whether to enable the node label feature. As a best practice, enable this feature.
You can use the node label feature to bind some pods to specific physical nodes to prevent the analyzer from preempting other components' resources in the case of insufficient node resources in the converged deployment scenario:
· In single-node mode, Analyzer will be deployed on a single node and the node label feature is not supported.
· In cluster mode, you can select one, three, or more nodes in the cluster for Analyzer deployment if you enable the node label feature. If you do not enable the node label feature, Analyzer is installed on all nodes in the cluster.
· You can specify these four types of physical nodes for pods: Service Nodes, Kafka Nodes, MPP Nodes, and ES Nodes.
¡ Service Nodes—Nodes that need to be specified for the pods to which the service belongs.
¡ Kafka Nodes—Nodes that need to be specified for the pods to which Kafka belongs.
¡ ES Nodes—Nodes that that need to be specified for the pods to which ES belongs.
¡ MPP Nodes—Nodes that that need to be specified for the pods to which Vertica belongs.
The following deployment modes are supported:
· 3+1 mode—Deploy Unified Platform and controller on three master nodes, and deploy Analyzer on a worker node. You must select a worker node for the node label feature.
· 3+3 mode—Deploy Unified Platform and controller on three master nodes, and deploy Analyzer on three worker nodes. You must select three worker nodes for the node label feature.
· 3+N (N ≥ 0)—Deploy Analyzer on any node despite of the node role (master or worker).
After the configuration, click Next.
Figure 17 Configuring node bindings
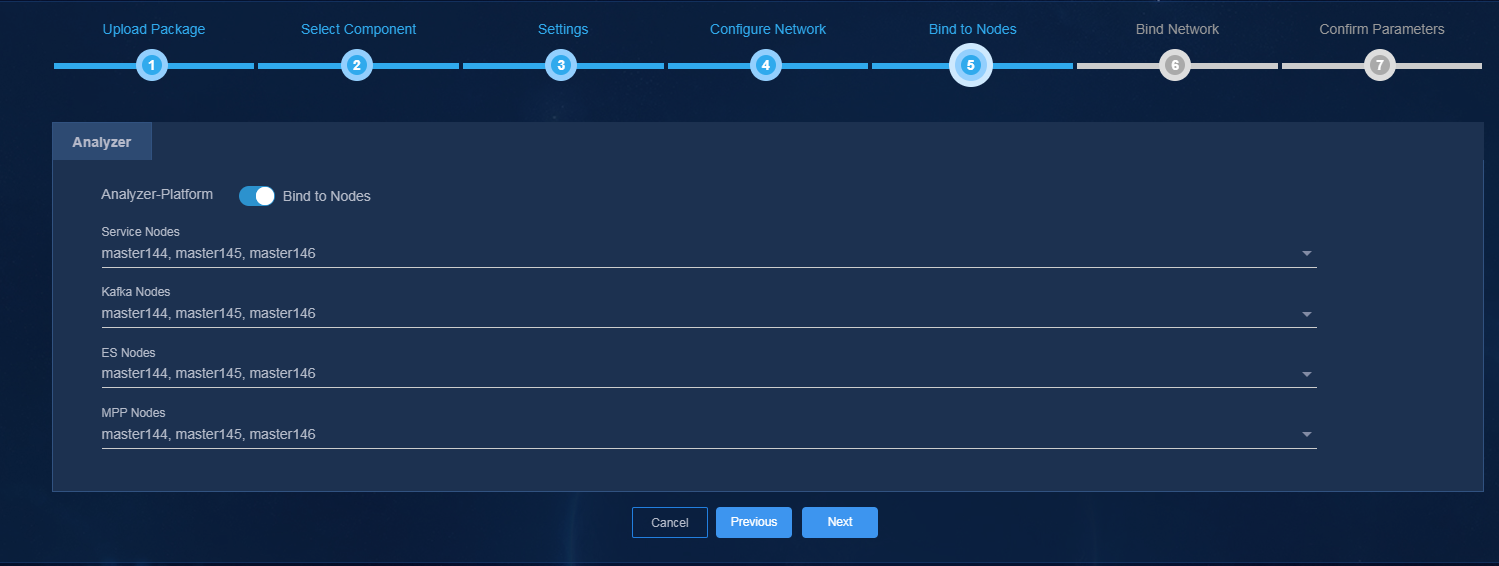
Configuring network bindings
Perform this task to bind a southbound network to COLLECTOR. The configuration varies by network scheme:
· If you select the integrated southbound and northbound network (no southbound network) scheme, skip this step.
· If you select the single-stack southbound network scheme, specify the network as the management network.
· If you select the dual-stack southbound network scheme, specify the IPv4 network as the management network and the IPv6 network as the default network.
After the configuration, click Next.
Figure 18 Configuring network bindings
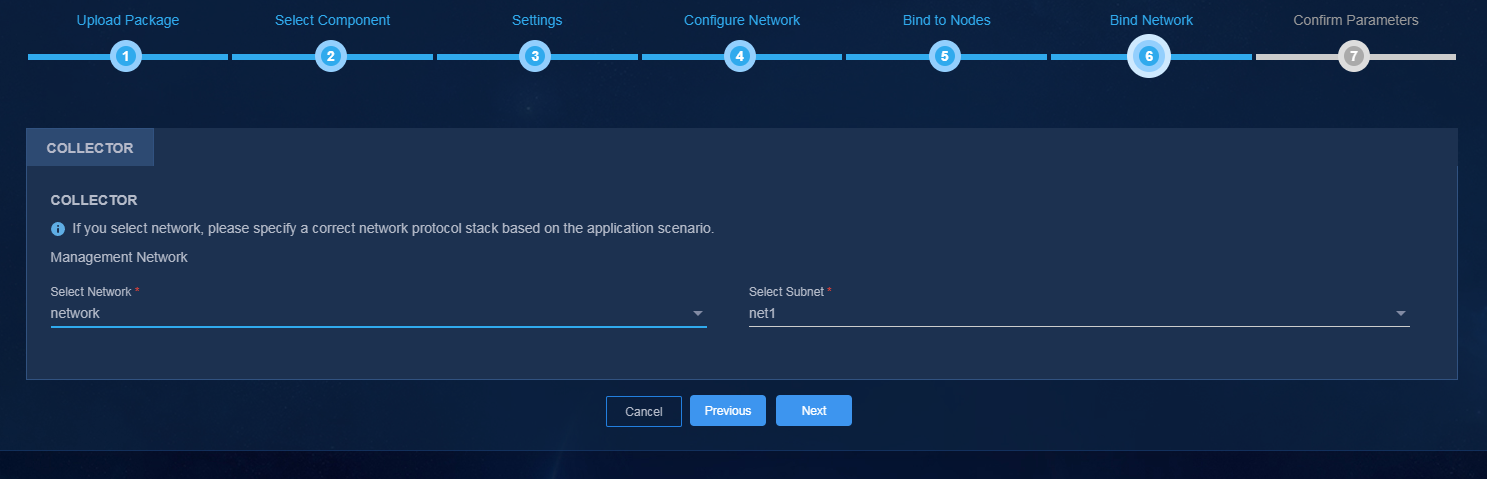
Deploying components
Verify the parameters, and then click Deploy.
View component details
After the deployment, you can view detailed information about the components on the component management page.
Deploying Analyzer for Unified Platform of E0713 and later versions
Accessing the component deployment page
Log in to Matrix. On the top navigation bar, click DEPLOY, and then select Convergence Deployment from the left navigation pane.
If you are deploying Analyzer for the first time, the component deployment guide page opens.
Figure 19 Component deployment guide
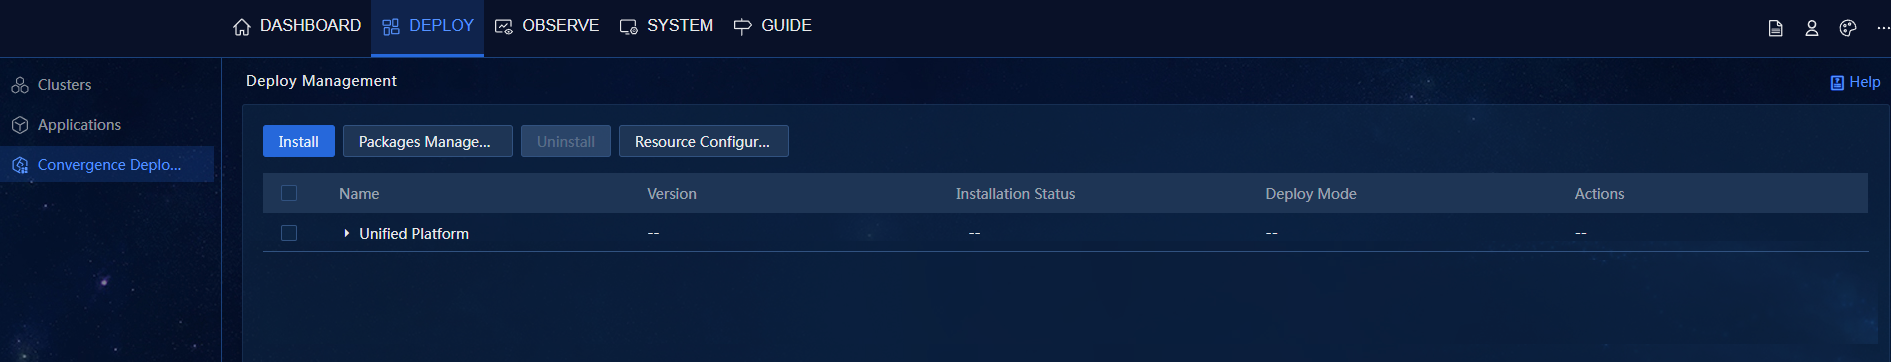
Uploading component installation packages
1. Click Install. On the page that opens, click Upload.
Figure 20 Uploading installation packets
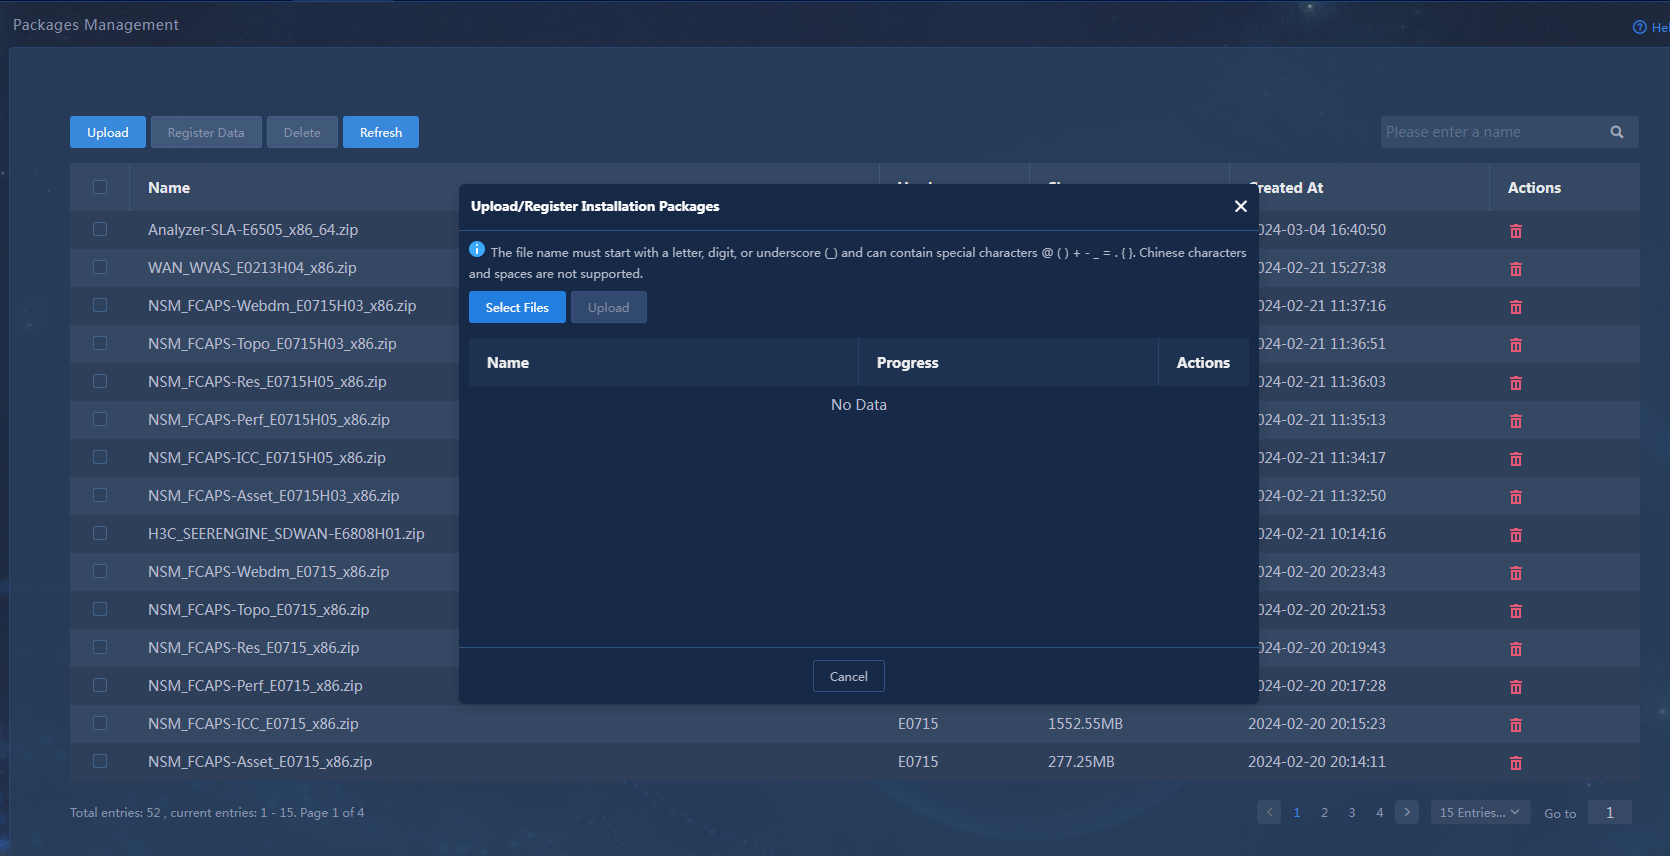
2. Click Select File to select the Analyzer, Analyzer-Collector public collector component, and Cloudnet installation packages, and then click Upload. After uploading, click Next.
You must upload the Cloudnet installation package in the campus scenario.
You can also upload the installation packages at Unified Platform installation.
The WAN scenario does not support deploying Analyzer alone and supports only converged deployment of Analyzer and Controller. You must install Controller before Analyzer.
Analyzer includes multiple component packages. You can upload them as required by the service scenario. See Table 47. The table conventions are as follows:
¡ Required—For the analyzer to operate correctly in the scenario, the component is required.
¡ Optional—Typically, the component is not installed in the scenario. You can install the component if its functions are required.
¡ N/A—The component is not supported in the scenario.
Table 47 Component and service scenario relations
|
Component |
Description |
Campus |
WAN carrier |
WAN branch |
DC |
|
Analyzer-Platform |
Platform component |
Required |
Required |
Required |
Required |
|
Analyzer-Collector |
Public collector component |
Required |
Required |
Required |
Required |
|
Analyzer-Telemetry |
Telemetry |
Required |
Required |
Required |
Required |
|
Analyzer-WAN |
WAN application analysis |
Optional, not required by default |
Required |
Required |
Optional |
|
Analyzer-Simulation |
WAN network simulation analysis |
N/A |
Optional |
N/A |
N/A |
|
DTN_Manager |
WAN DTN host management |
N/A |
Optional (must work in conjunction with Analyzer-Simulation) |
N/A |
N/A |
|
Analyzer-User |
User analysis |
Required |
N/A |
N/A |
N/A |
|
Analyzer-AV |
Audio and video analysis |
Optional |
Optional |
Optional |
N/A |
|
Analyzer-SLA |
Service quality analysis |
Optional |
Required |
N/A |
Required (SeerCollector required) |
|
Analyzer-TCP |
TCP stream analysis |
Optional (SeerCollector required), not required by default |
N/A |
N/A |
Required (SeerCollector required) |
|
Analyzer-Diagnosis |
Diagnosis and analysis |
Required |
Required |
Required |
Required |
|
Analyzer-AI |
AI-driven forecast |
Required |
Required |
Required |
Required |
|
|
IMPORTANT: · Analyzer-Telemetry is the basis of the WAN, User, AV, SLA, TCP, Diagnosis, and AI components and is required when you deploy any of these components. · DTN_MANAGER must be installed to use device simulation in the WAN carrier network simulation scenario. · If you select Yes for vDevice-Based Simulation when configuring the simulation component parameters, you must bind both the simulation component and the DTN manager component to simulation networks. If you do not do that, the vDevice-based simulation feature will be unavailable. · Analyzer-WAN must be installed to use NetStream/sFlow in the DC scenario. |
Selecting components
|
|
CAUTION: · If SeerCollector is not deployed, unselect the Analyzer-TCP component. · You must install the Cloudnet component in the campus scenario. The Convergence Deployment page does not support its installation. You can install it on the DEPLOY > Application page. |
1. In the Analyzer area, select the components based on the service scenario (Campus, DC, or WAN) and its requirements as shown in Table 47.
Figure 21 Selecting analyzers
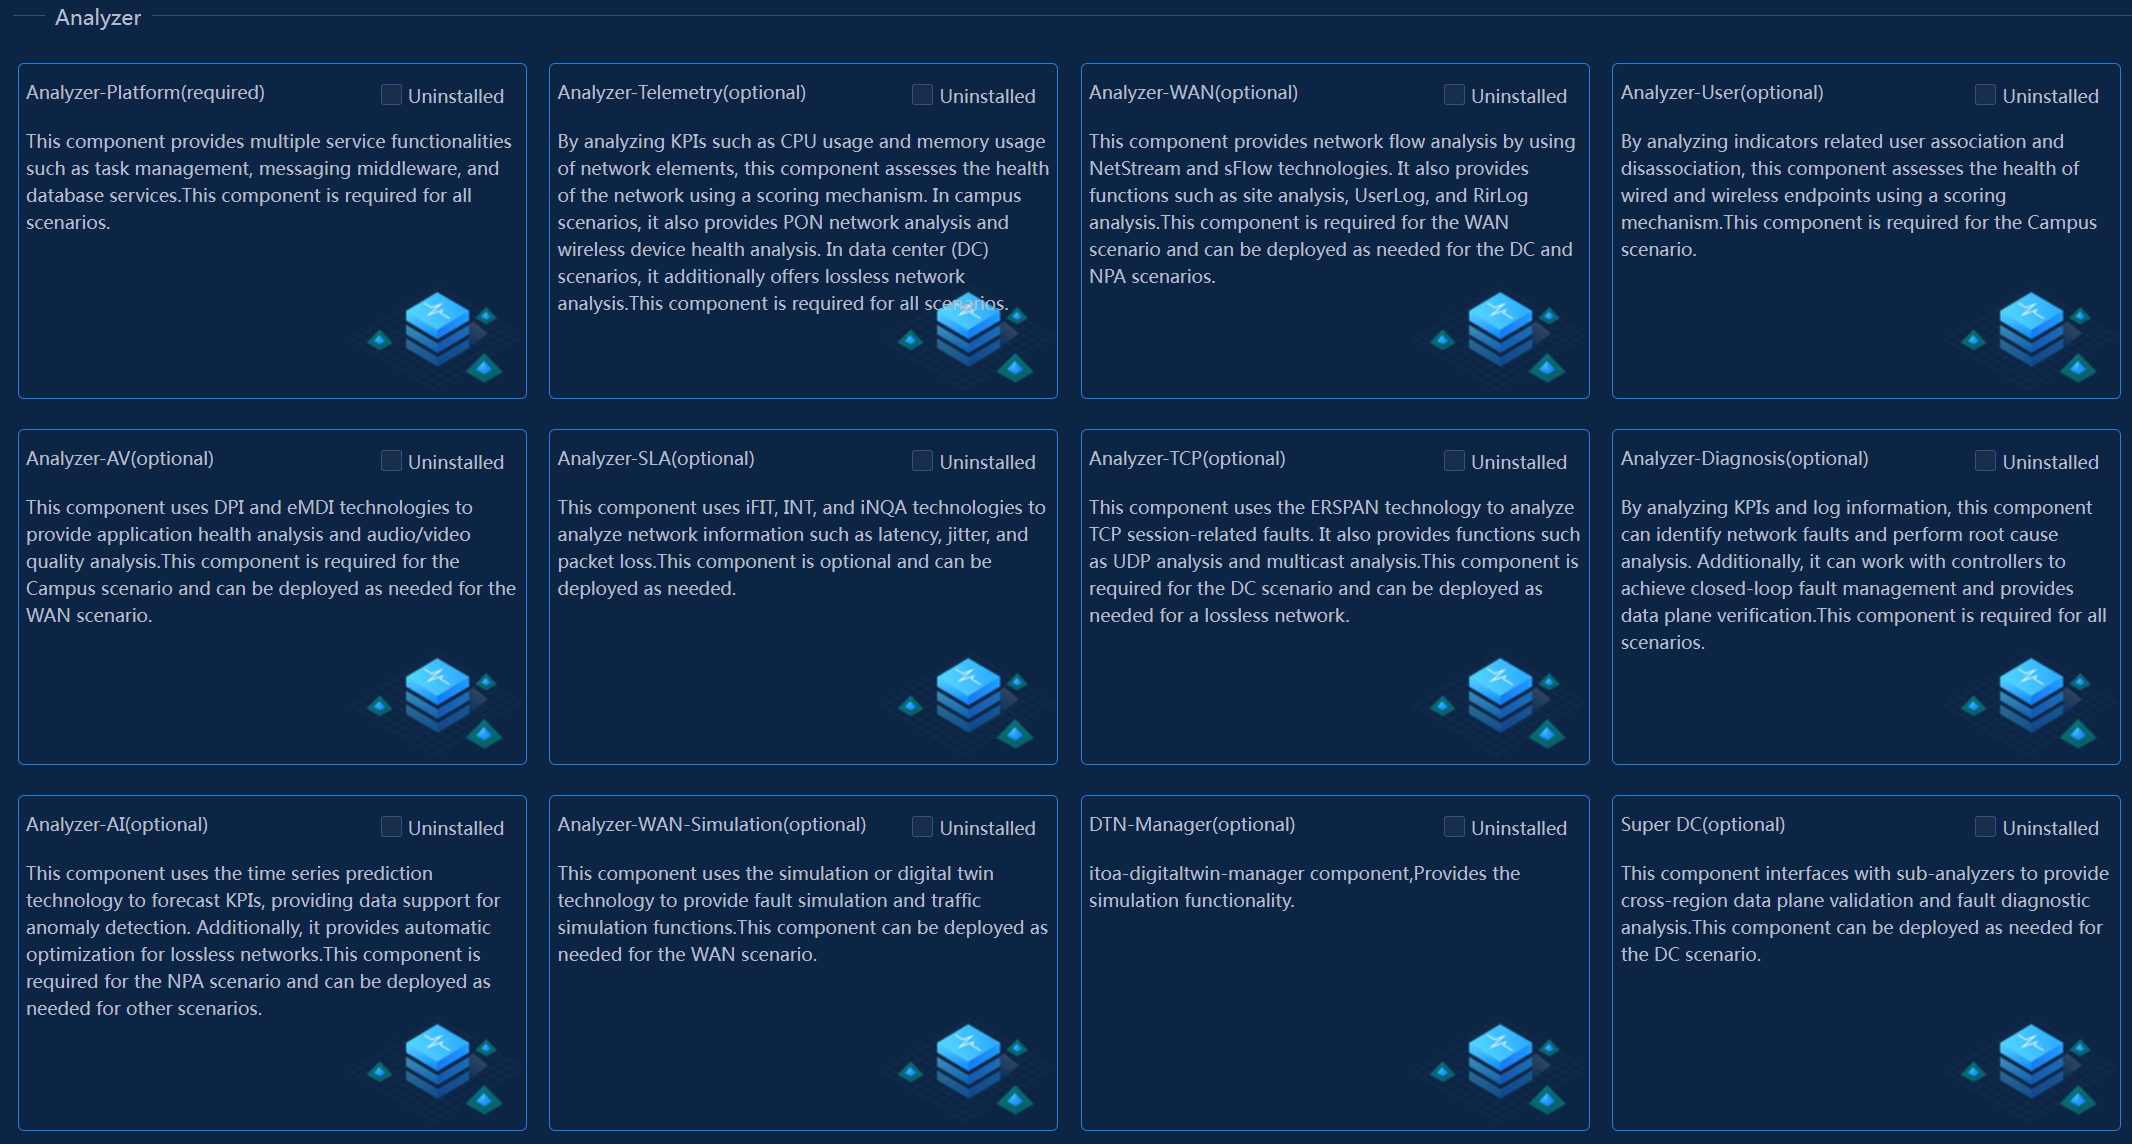
|
|
NOTE: · For Campus scenarios, only the following components need to be deployed by default: Platform, Collector, Telemetry, Diagnosis, AI, and User. · For DC scenarios, only the following components need to be deployed by default: Platform, Collector, Telemetry, Diagnosis, TCP, WAN, AI and SLA. · For WAN carrier scenarios, only the following components need to be deployed by default: Platform, Collector, Telemetry, Diagnosis, WAN, AI, and SLA. · For WAN branch scenarios, only the following components need to be deployed by default: Platform, Collector, Telemetry, Diagnosis, WAN, AI. |
2. In the Public Services area, select Collector for gRPC and NETCONF data collection.
Figure 22 Selecting COLLECTOR

Selecting installation packages
Click Next. Select the installation package for each component.
|
|
NOTE: If installation packages of multiple versions for the same component exist in the environment, you can select the version as needed from the list. |
Figure 23 Selecting installation packages
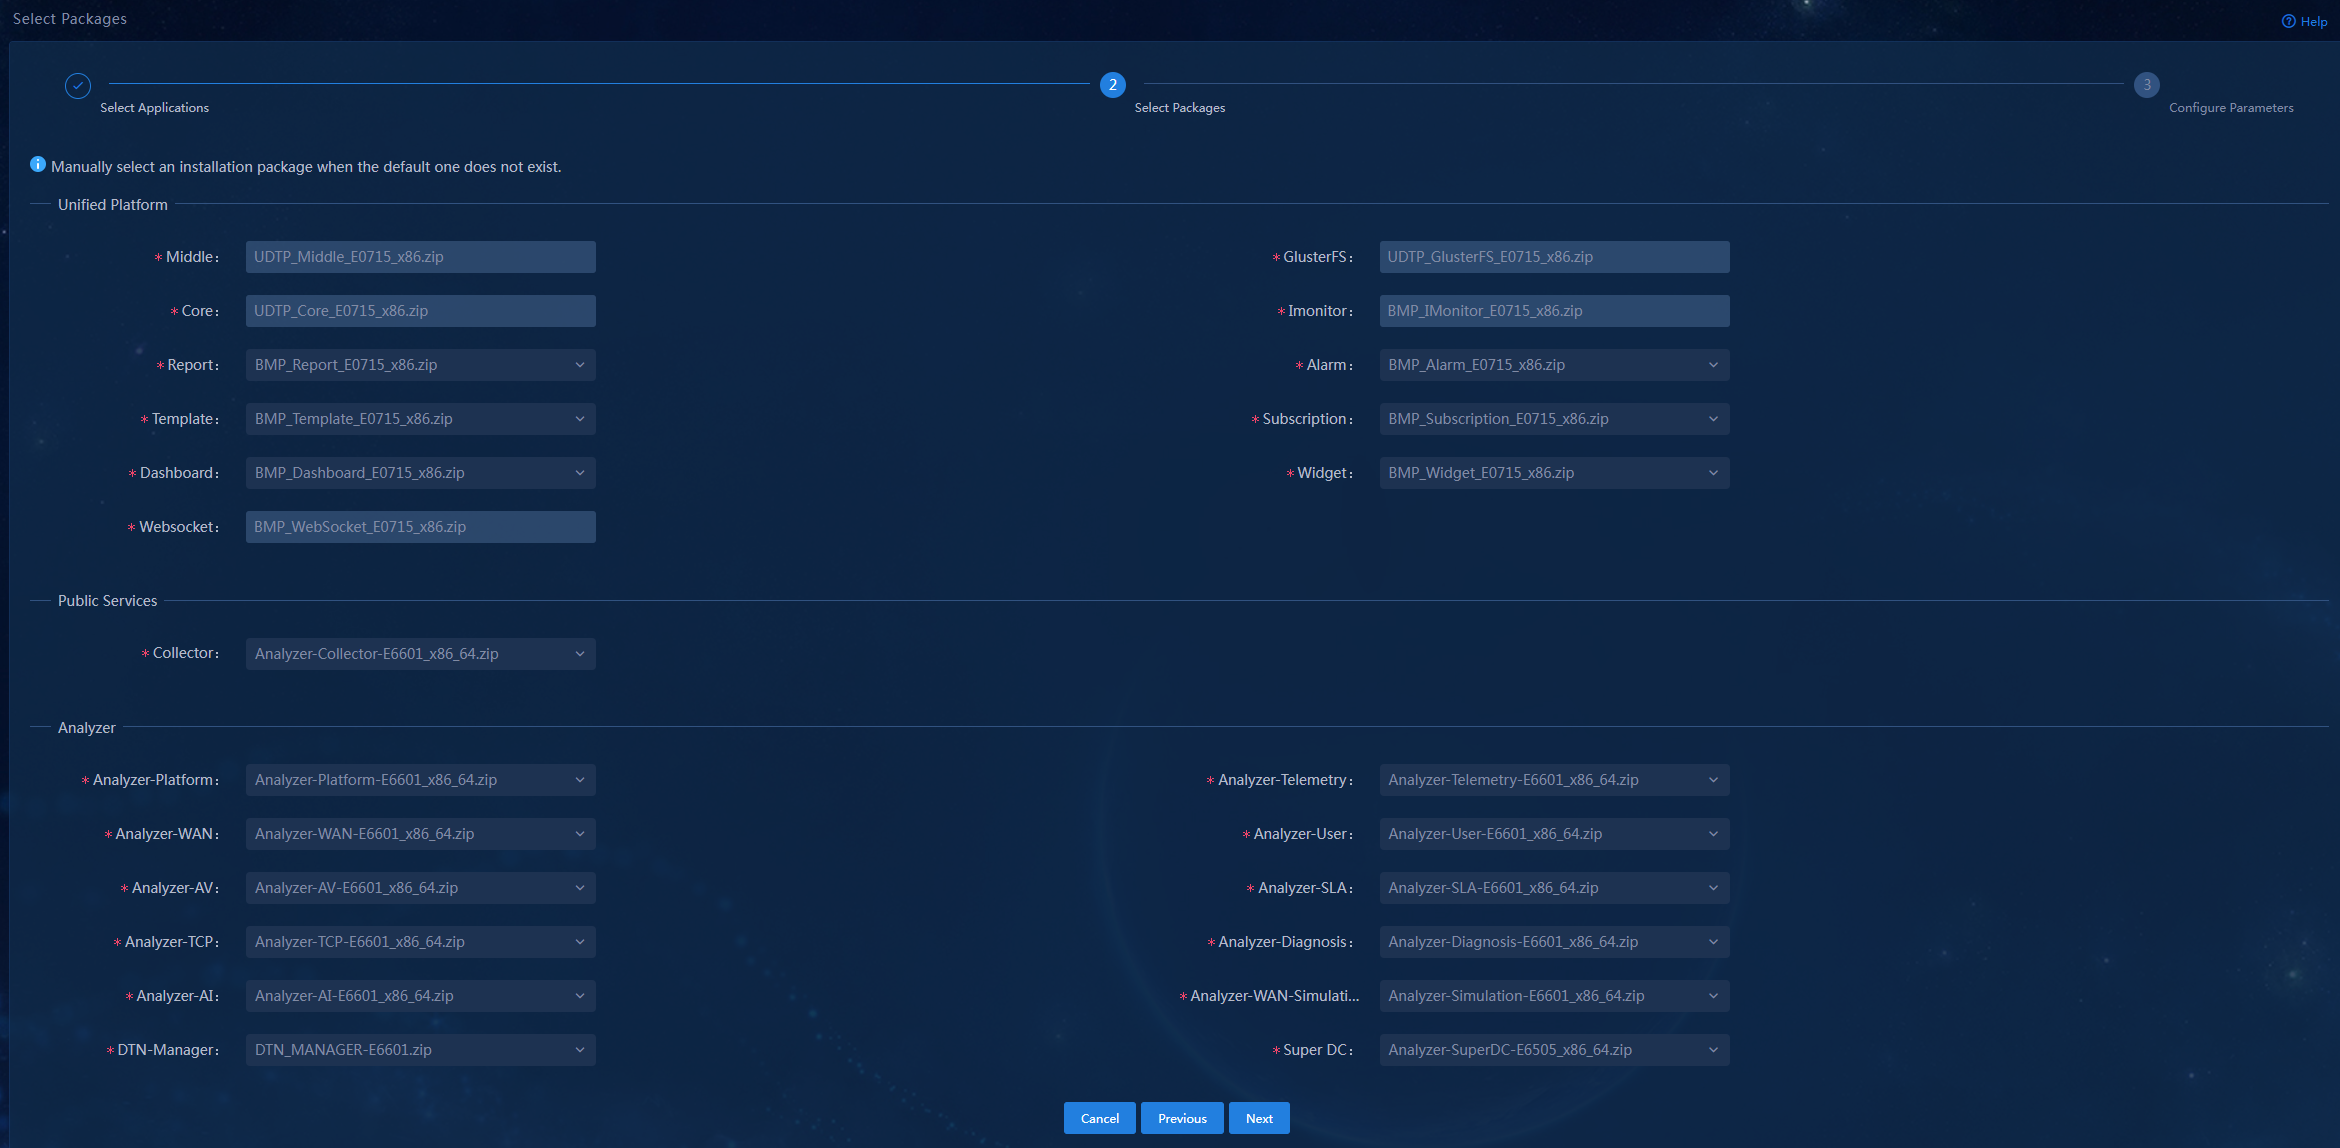
Configuring parameters
|
|
CAUTION: The COLLECTOR, Platform, Analyzer-WAN-Simulation, DTN_MANAGER, and ai-analysis components support parameter configuration. For other components, you do not need to configure parameters. |
1. Click Next. Configure parameters for each component on the corresponding tab.
Figure 24 Configuring parameters for components
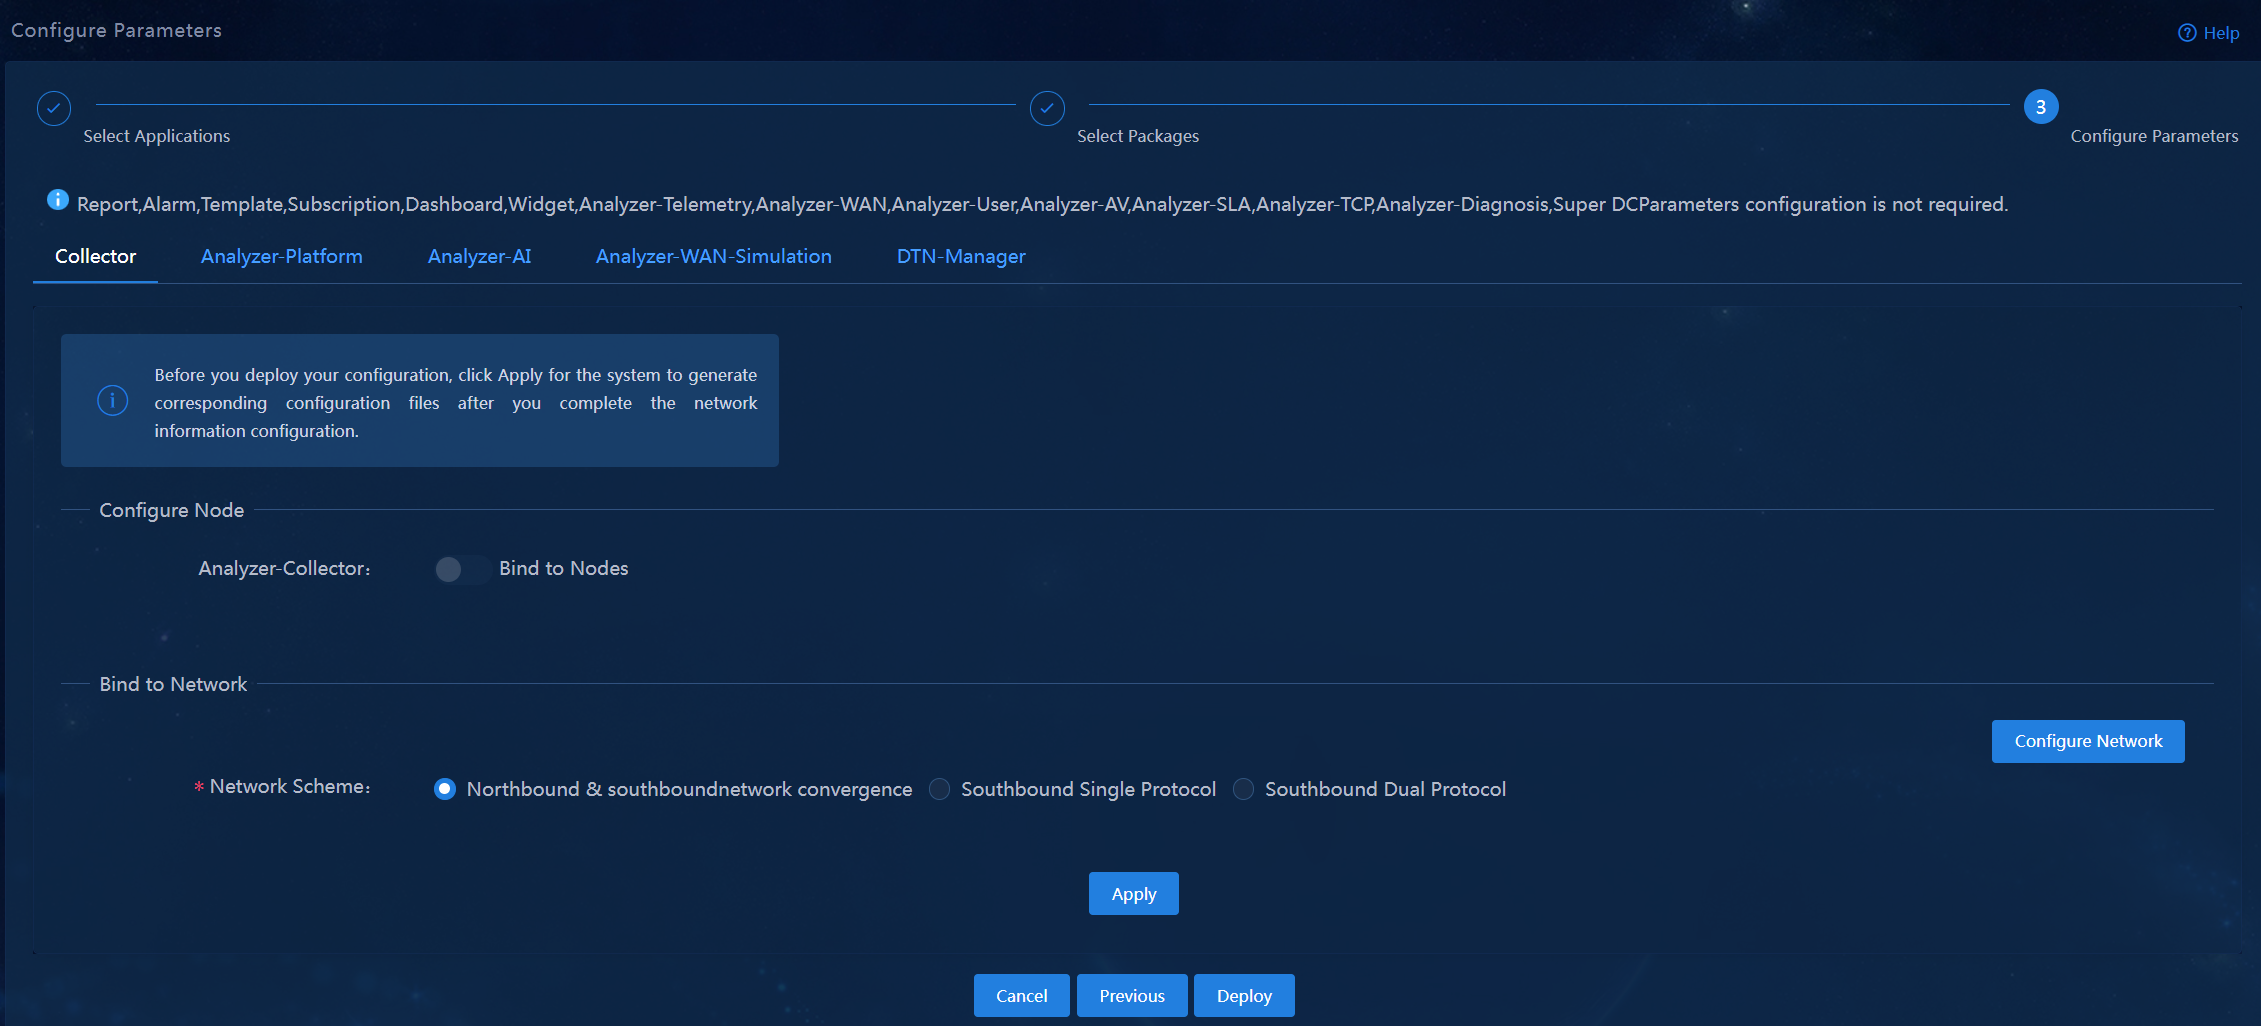
2. Configure parameters for Collector.
Figure 25 Configuring parameters for Collector
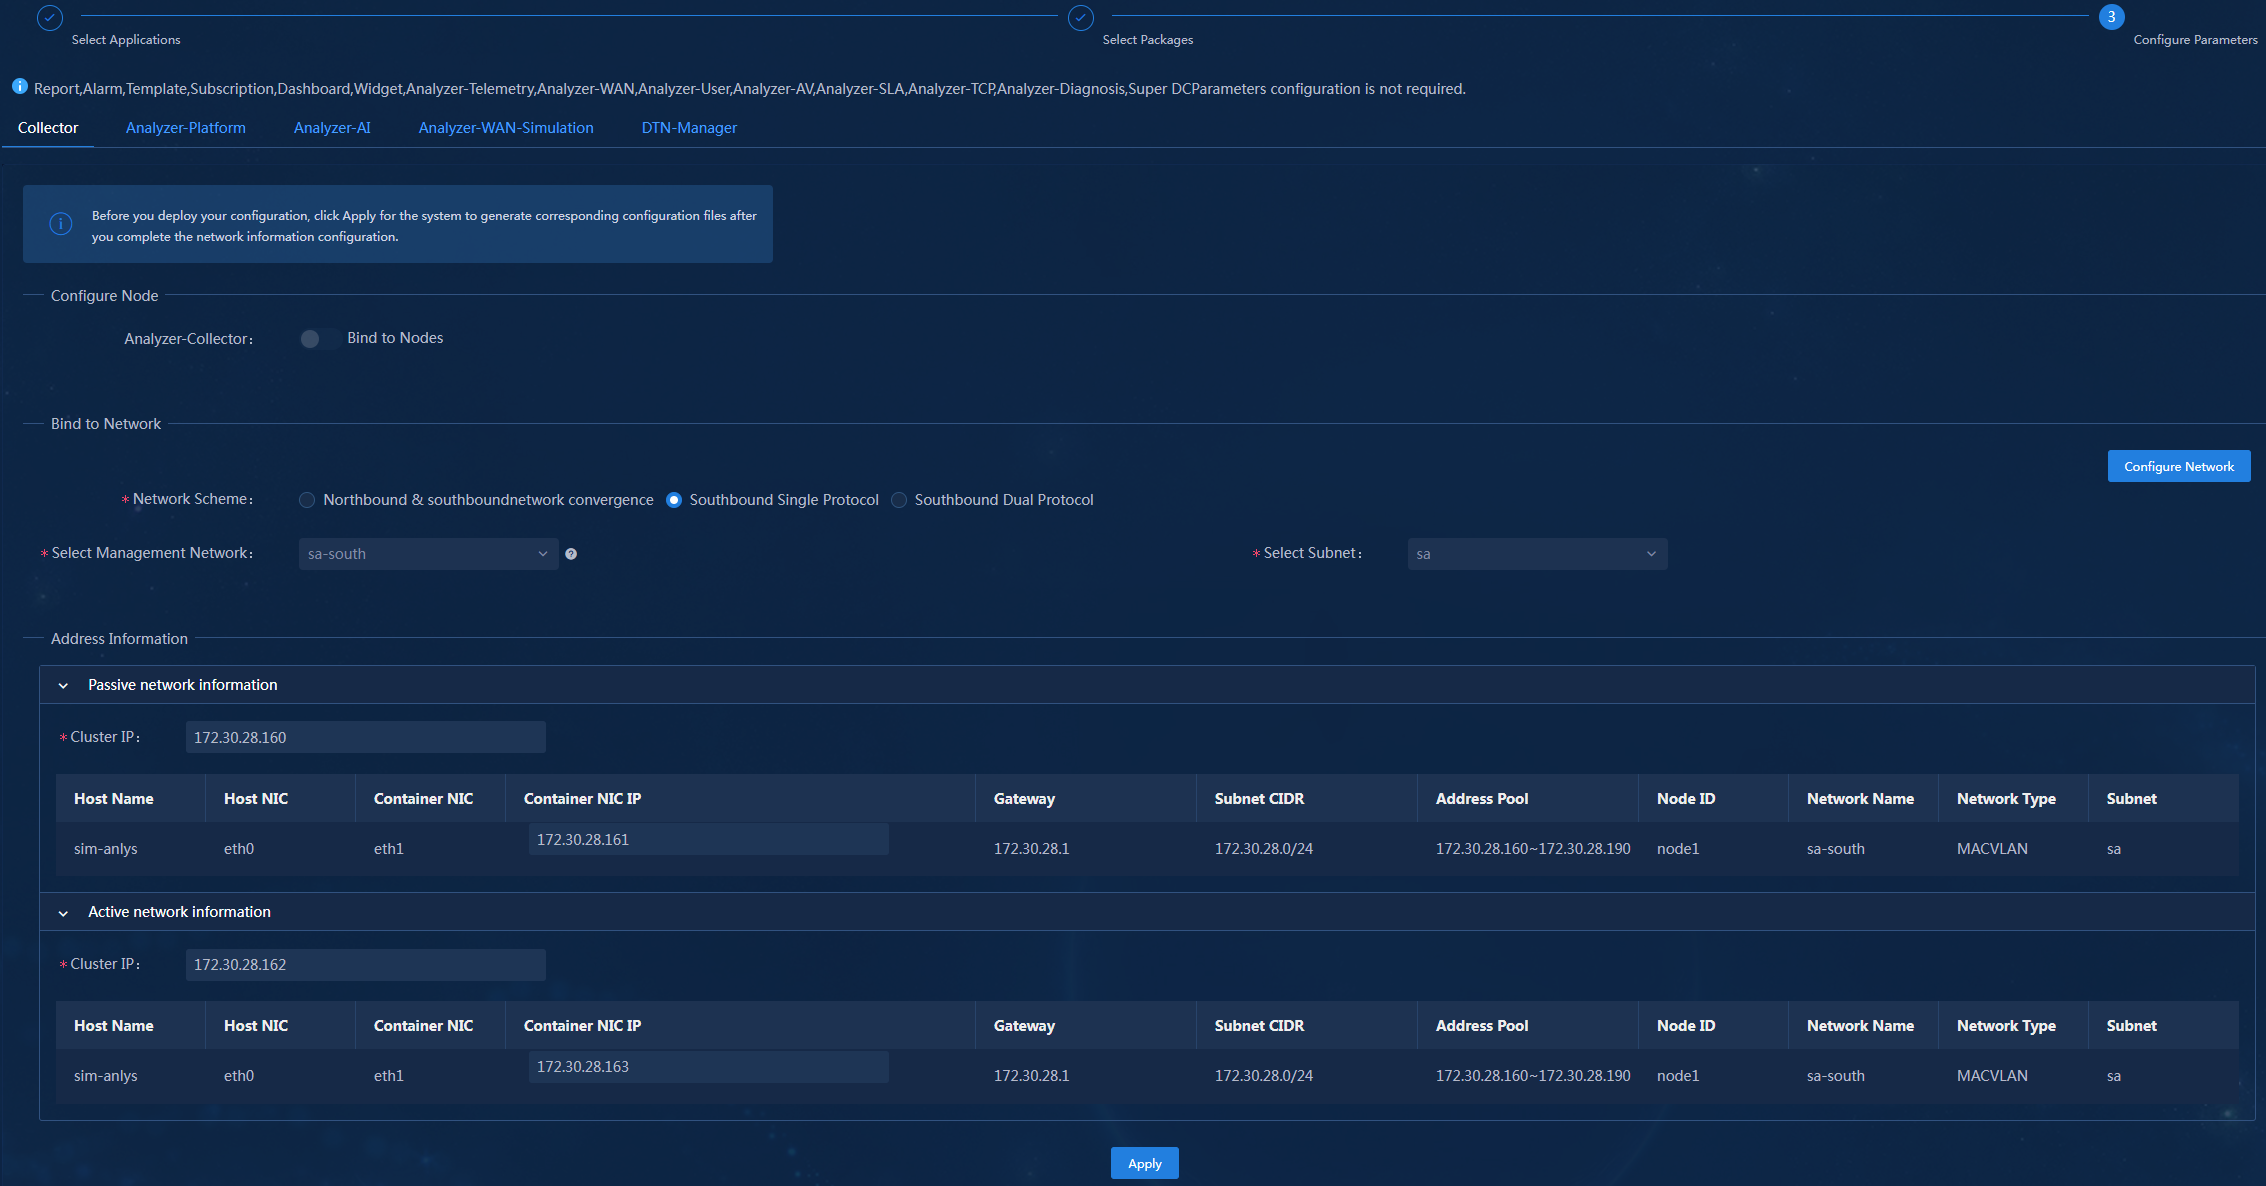
a. Configure node bindings:
In single-node mode, COLLECTOR does not support node binding and is deployed on a master node by default.
In cluster mode, you can select one or three master or worker nodes to deploy COLLECTOR. If you do not enable node binding, COLLECTOR is deployed on a master node by default.
As a best practice in a separate deployment scenario, deploy COLLECTOR on a master node.
As a best practice in a separate deployment scenario, deploy COLLECTOR on a worker node and use the southbound network scheme (a NIC of the worker node is dedicated to COLLECTOR for the southbound network. If you use the integrated southbound and northbound network scheme, certain collection programs still run on a master node because of the dependency on the cluster northbound virtual IP address.
b. Configure network settings as described in "Configuring network settings."
c. Configure network bindings as described in "Configuring network bindings."
d. Click Apply.
3. Configure parameters for the Analyzer-Simulation component.
Figure 26 Configuring parameters for the Analyzer-Simulation component
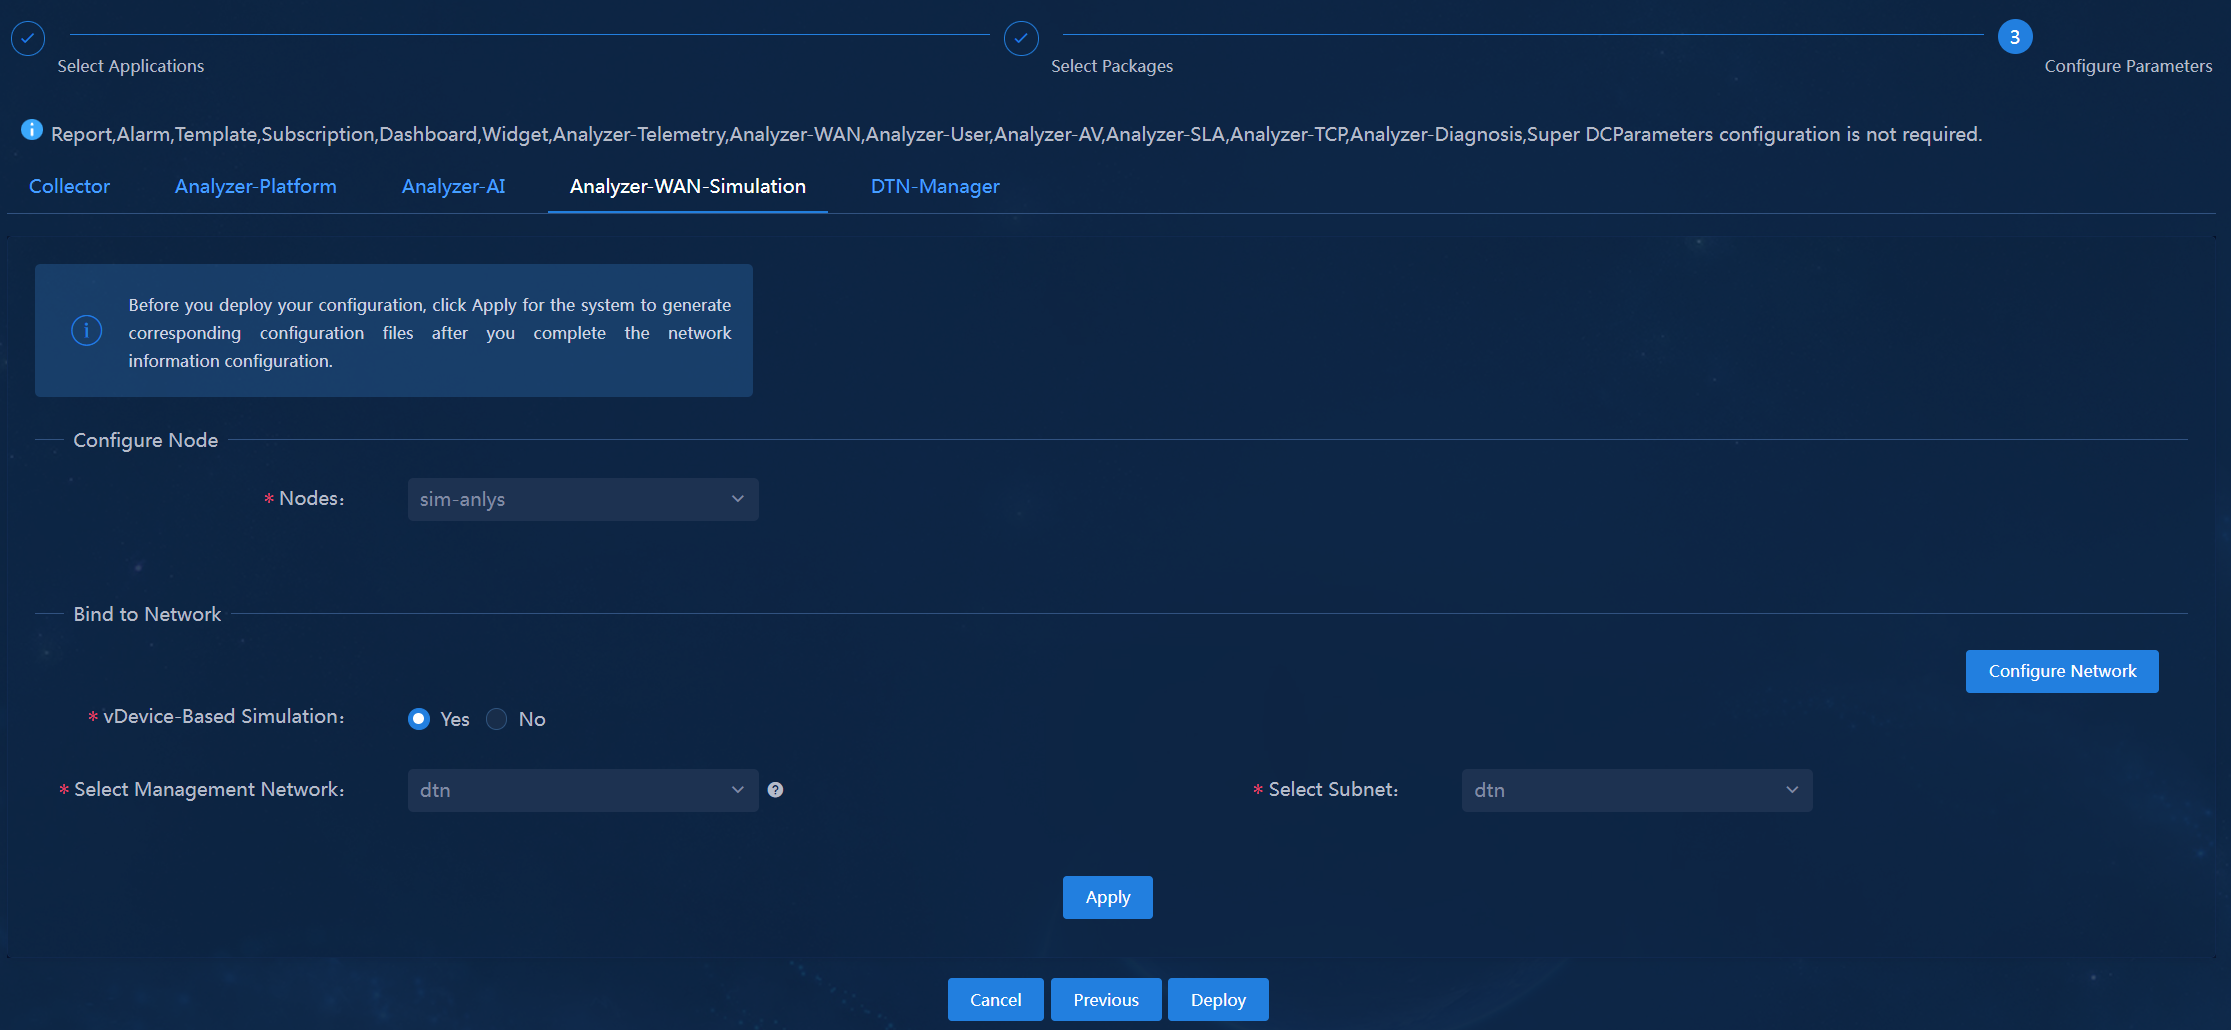
a. Configure node bindings:
Deploy the Analyzer-Simulation component on a master node.
b. Configure network settings as described in "Configuring network settings."
c. Configure network bindings:
If you enable device-based simulation, you must bind a simulation network to the component for connection with simulation devices. If you disable device-based simulation, you do not need to bind a simulation network.
d. Click Apply.
4. Configure parameters for the DTN-Manager component.
If the Analyzer-Simulation component configures "vDevice Based Simulation" as "Yes", then the parameters of the DTN-Manager component need to be configured further.
a. Configure node bindings:
Suggest binding the Analyzer-Simulation component to the same node.
b. Configure network settings as described in "Configuring network settings."
c. Configure network bindings:
Suggest binding the Analyzer-Simulation component to the same network.
d. Click Apply.
Figure 27 Configuring parameters for the DTN-Manager component
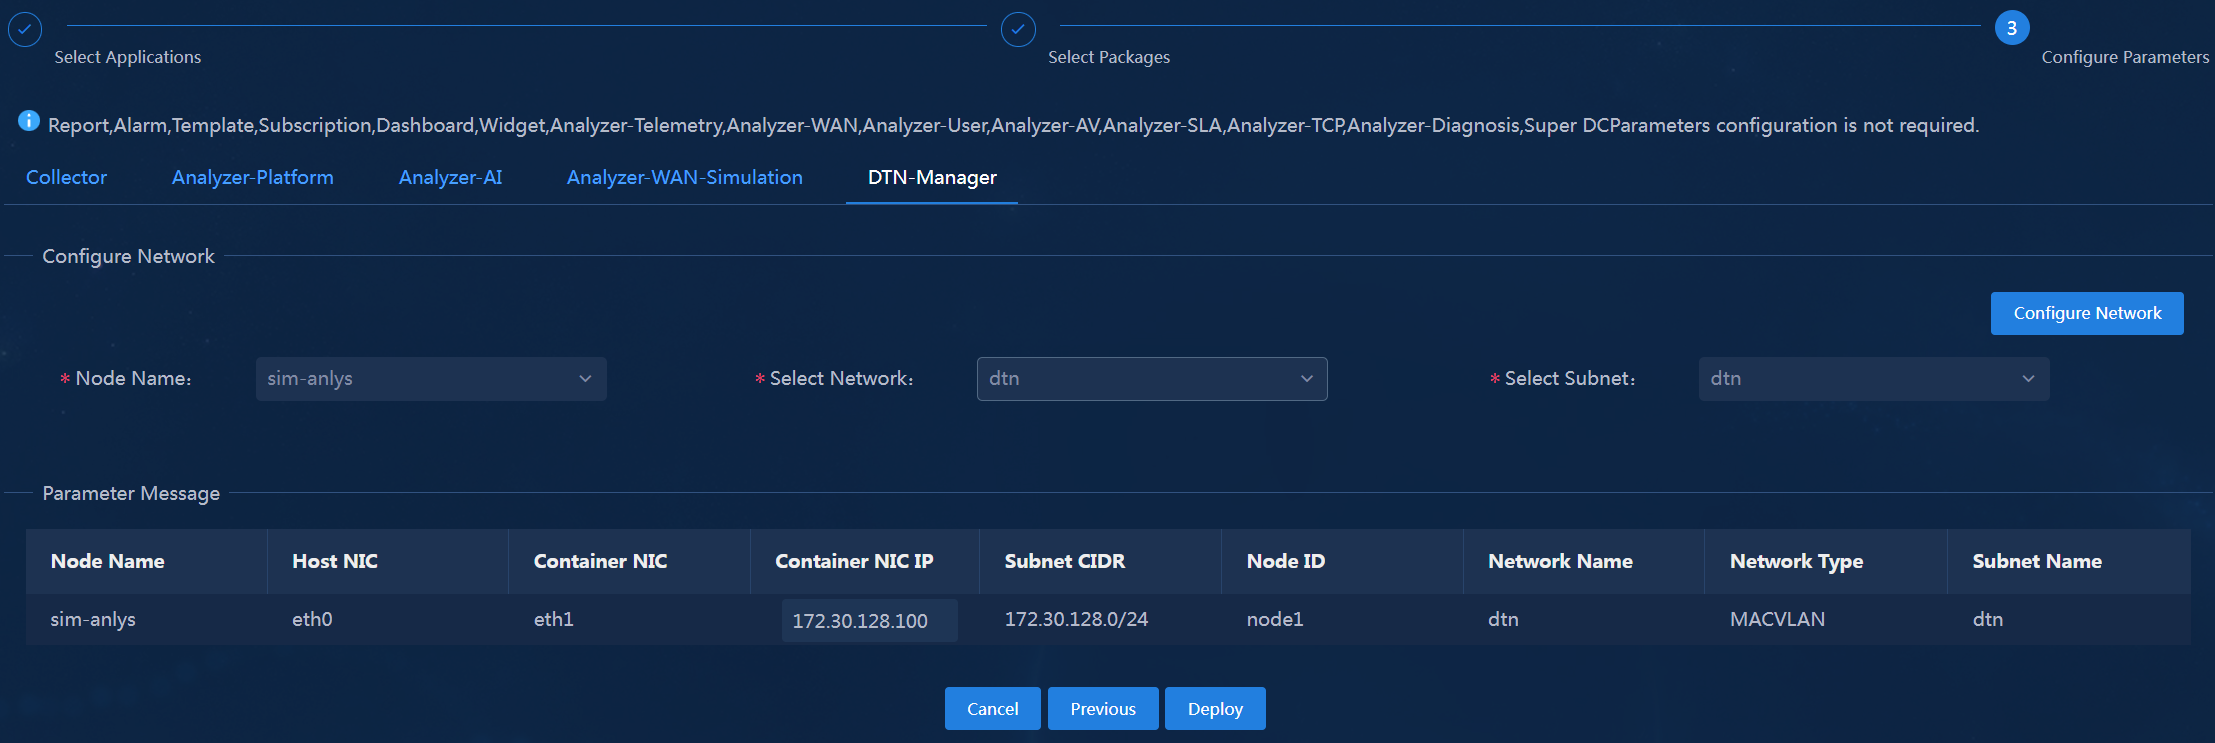
5. Configure parameters for the Analyzer-Platform component.
Figure 28 Configuring parameters for the Analyzer-Platform component
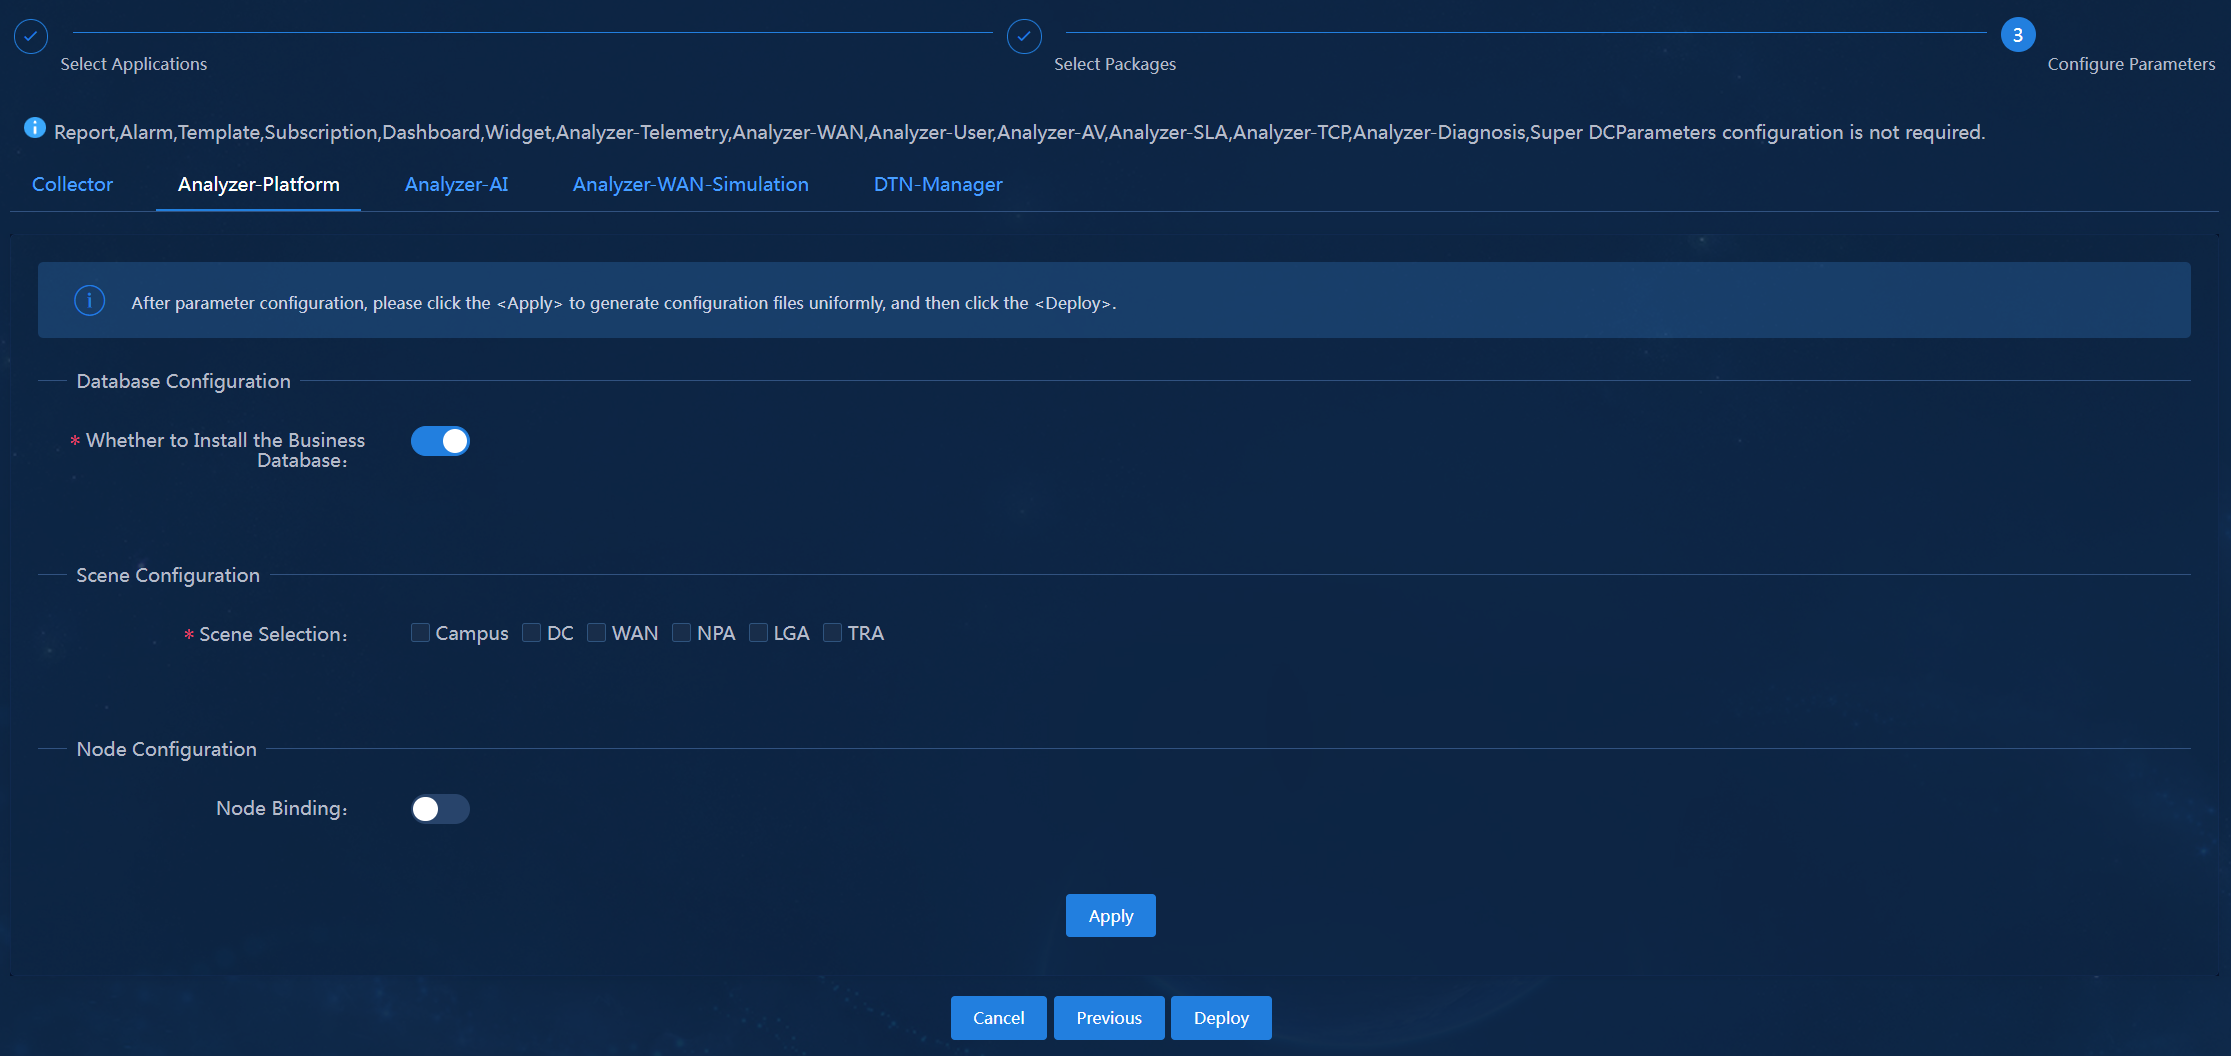
a. Configure the database settings:
Select whether to install a service database and specify the database type. By default, a service database is installed. Use the default database type. The default database type varies by the product type and environment condition.
b. Select a service scenario.
c. Configure node bindings as described in "Configuring node bindings."
d. Click Apply.
6. Configure parameters for the Analyzer-AI component.
Figure 29 Configuring parameters for the Analyzer-AI component

a. Configure the load settings:
Specify the number of load containers to run AI prediction tasks. By default, two times the number of service nodes is selected. For example, if you bind three nodes to the component in node binding settings, the system creates six load containers to run AI prediction tasks. You can also select Custom and enter a number. As a best practice, use the default setting.
b. Configure node bindings:
Specify nodes to deploy load containers of AI prediction tasks. By default, node binding is disabled. You can enable node binding in cluster mode. After you enable node binding, you can select nodes for load containers of AI prediction tasks. If node binding is disabled, nodes specified for the Analyzer-Platform component are used.
c. Click Apply.
Deploying components
Verify the parameters, and then click Deploy.
Viewing component details
After the deployment, you can view detailed information about the components on the component management page.
Accessing the Analyzer interface
After SeerAnalyzer deployment is completed, Unified Platform will offer the function menu of SeerAnalyzer. You can use SeerAnalyzer functions after logging in to Unified Platform.
Unified Platform provides a user-friendly GUI and you can log in to Unified Platform as follows:
1. Enter the URL of Unified Platform at the browser, and then press the Enter key.
The default Unified Platform URL is http://ip_address:30000/central/index.html. The ip_address argument represents the northbound service VIP of Unified Platform and 30000 is the port number of Unified Platform.
Figure 30 Page for Unified Platform login

2. Enter the username and password used for Unified Platform login. The default username and password are admin and Pwd@12345, respectively.
Registering software
Registering Unified Platform
For more information, see H3C Unified Platform Deployment Guide.
Registering Analyzer
Analyzer provides a 90-day free trial edition, which provides the same features as the official edition. To continue to use Analyzer after the trial period expires, obtain a license.
Installing a license on the license server
For more information, see H3C Software Licensing Guide.
Obtaining the license information
1. Log in to Unified Platform.
2. On the top navigation bar, click System.
3. From the left navigation pane, select License Management > License Information.
4. Configure the following parameters:
¡ IP Address—Specify the IP address configured on the license server used for the communication between Unified Platform and Analyzer cluster nodes.
¡ Port—Specify the service port number of the license server. The default value is 5555.
¡ Username—Specify the username configured on the license server.
¡ Password—Specify the user password configured on the license server.
5. Click Connect.
After connecting to the license server successfully, Unified Platform and Analyzer can automatically obtain the license information.
Uninstalling Analyzer
1. For Analyzer deployed as described in "Deploying Analyzer for Unified Platform of versions earlier than E0713," log in to Unified Platform at http://ip_address:30000/central. For Analyzer deployed as described in "Deploying Analyzer for Unified Platform of E0713 and later versions," log in to Matrix at https://ip_address:8443/matrix/ui. ip_address represents the northbound service VIP of Unified Platform. The default username and password are admin and Pwd@12345, respectively.
2. On Unified Platform, navigate to the System > Deployment page. On Matrix, navigate to the DEPLOY > Convergence Deployment page.
3. Select Analyzer, and then click Uninstall.
4. (Optional.) Log in to the server where SeerCollector is installed, access the /usr/local/itoaAgent directory, and then execute the bash uninstall.sh command to clear the data. If you log in to the platform as a non-root user, execute the sudo bash uninstall.sh command instead. Then, use the ps -aux | grep agent | grep -v grep command to verify that no command output is generated, which indicates that the component has been uninstalled completely.
Figure 31 Clearing data
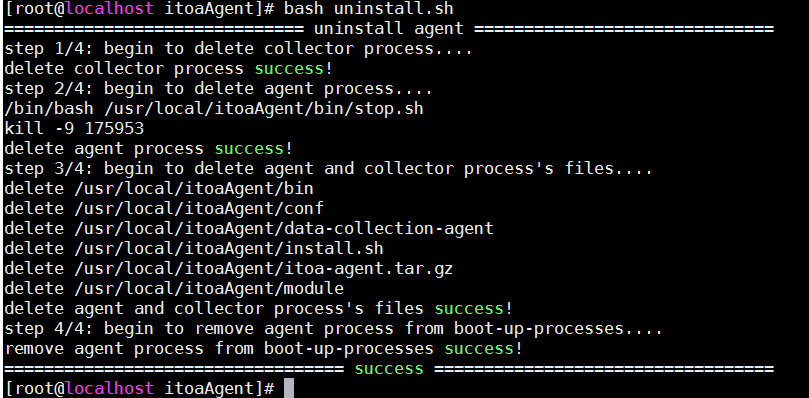
Upgrading Analyzer
|
|
CAUTION: You can upgrade a component with its configuration retained on Unified Platform. Upgrading components might cause interrupted or incomplete data analysis. Please proceed with caution. |
Restrictions and guidelines
· Before upgrading an Analyzer version that uses the Vertica database, execute the following command to verify that the database is in UP state.
su - dbadmin -c "admintools -t list_allnodes"
If the database is not in UP state, terminate the upgrade task and contact H3C Support for help.
Figure 32 View database state information
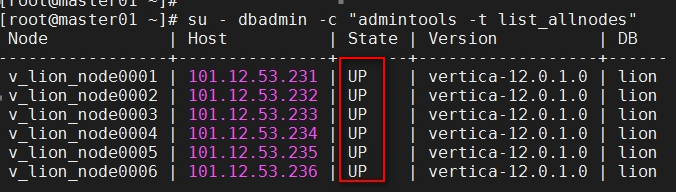
· To upgrade the analyzer version from E61xx (earlier than E6115) to E65xx, if you need to upgrade Unified Platform to the version compatible with analyzer version E65xx, perform the following operations in sequence:
a. Upgrade the analyzer version to E6115.
b. Upgrade the Unified Platform.
c. Upgrade the analyzer version from E6115 to E65xx.
If you have any specific requirements, please contact H3C engineers in advance for evaluation.
Upgrading Analyzer from E61xx to E65xx
1. Log in to Unified Platform.
2. Access the Analytics > Analysis Options > Resources > Protocol Template page, and export the protocol templates for SNMP and NETCONF.
As a best practice, record information about the current collection templates, because you need to reconfigure them after upgrading from E61xx to E65xx. For more information about collection template configuration, see "Configure collection templates."
Figure 33 Exporting protocol templates for SNMP and NETCONF

|
|
NOTE: · NETCONF does not support exporting passwords. Before exporting the template, please record the corresponding passwords and reconfigure them after the upgrade is completed. · Please pay attention to record which template is used by each device before upgrading. After upgrading, please reconfigure the protocol templates on the 'Assets List' page under 'Analytics > Analysis Options > Resources > Assets > Asset List'. · After upgrading from E61xx to E65xx, the collection template will be lost and the analysis function will be unavailable. Users need to reconfigure the collection template. |
3. Upgrade Unified Platform. For more information, see the deployment guide for Unified Platform.
4. Upgrade Analyzer.
On the top navigation bar, click System.
From the left navigation pane, select Deployment.
To view component information, click the ![]() icon
on the left of a Analyzer component.
icon
on the left of a Analyzer component.
Figure 34 Expanding component information

Click the ![]() icon in the Actions column
for an analyzer component.
icon in the Actions column
for an analyzer component.
Figure 35 Upgrading a component
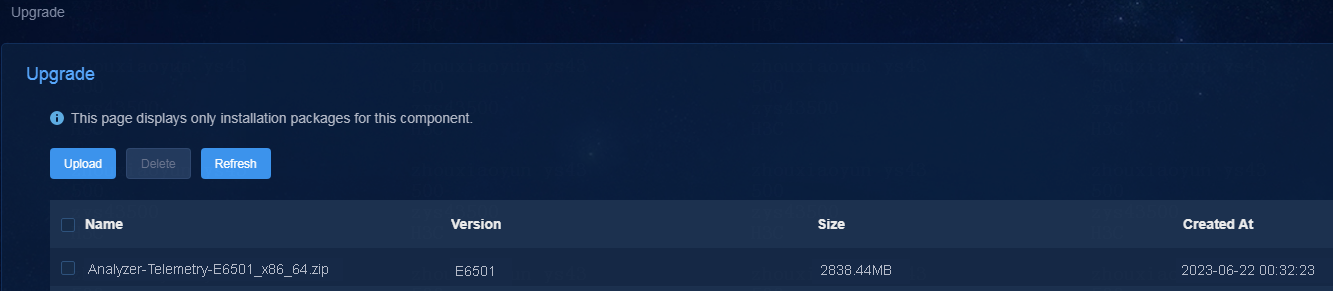
Click Upload, and then upload the target installation package.
After the installation package is uploaded successfully, select the installation package, and then click Upgrade.
|
|
NOTE: · In the current software version, Analyzer does not support rollback upon an upgrade failure If the upgrade fails, it is recommended to try again. If multiple retries are unsuccessful, please contact technical support.. · Performing a holistic upgrade of the Analyzer, which involves upgrading all components, can be upgraded across versions and the version numbers will be unified to become the upgraded version number. · You can upgrade the Analyzer components across versions. To upgrade all the components, first upgrade Analyzer-Platform, Analyzer-Telemetry (if any), and then the other components. · After upgrading the Analyzer-Telemetry component in a WAN scenario, you need to upgrade the Analyzer-WAN component. If you fail to do so, the Health Analysis > Network Analysis > Network Business Analysis item will be missing in the menu. |
5. Install Analyzer-Collector.
On the System > Deployment page, install Analyzer-Collector. Make sure the network scheme is the same as that of the old version.
Figure 36 Deployment page
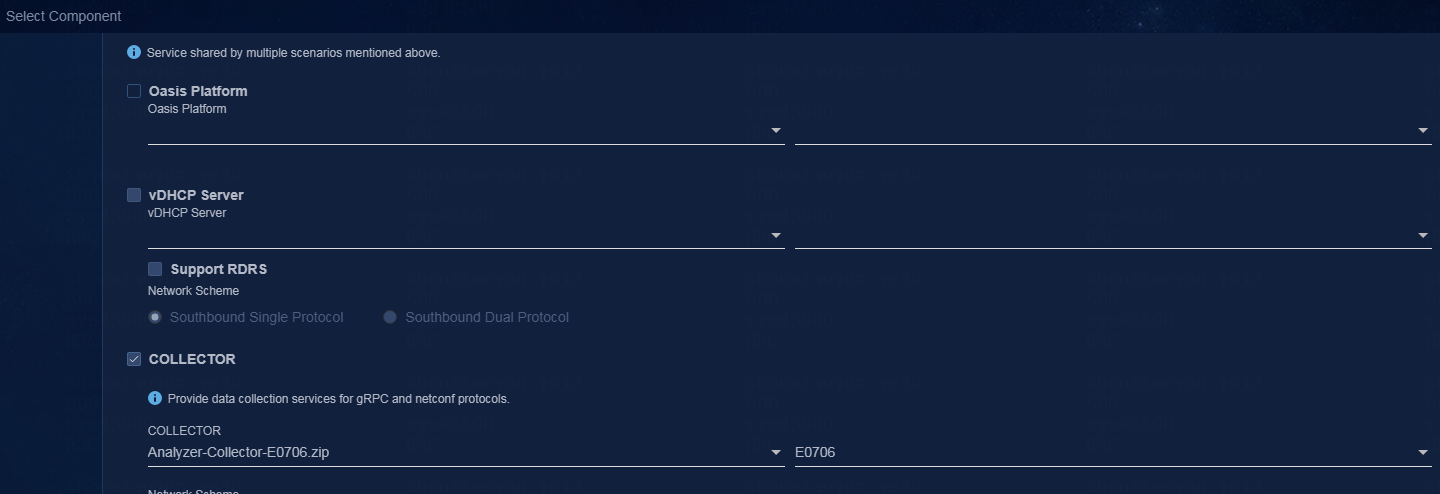
Click Next, and select the network settings configured before at the network binding phase.
Figure 37 Network binding

Click Next. Confirm the parameters and complete deployment.
Access the Analytics > Analysis Options > Resources > Protocol Template page, and import the protocol templates for SNMP and NETCONF.
Figure 38 Importing the protocol templates for SNMP and NETCONF
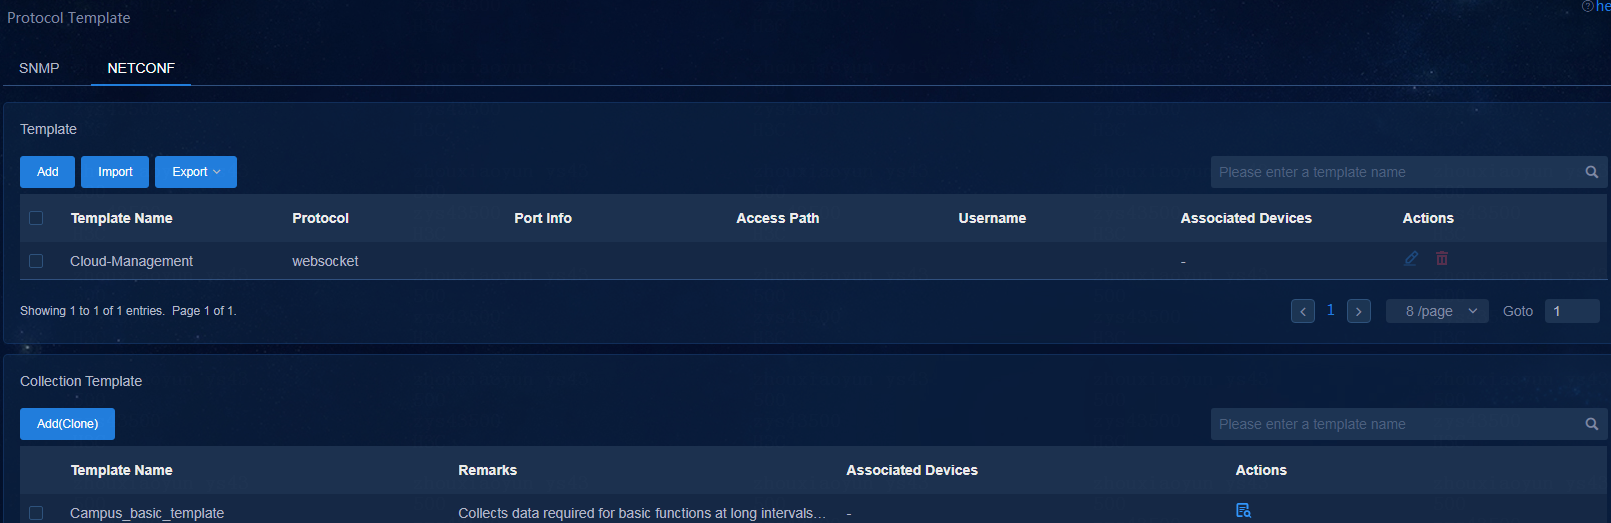
6. Configure collection templates.
After the upgrade is completed, the configured collection templates will be lost. The device will be bound to the default collection templates. To avoid this issue, you need to reconfigure the missing collection templates as follows:
Access the Analytics > Analysis Options > Collector > Common Collector page, click Add(clone) on the SNMP and NETCONF tabs separately.
Figure 39 Configuring a collection template
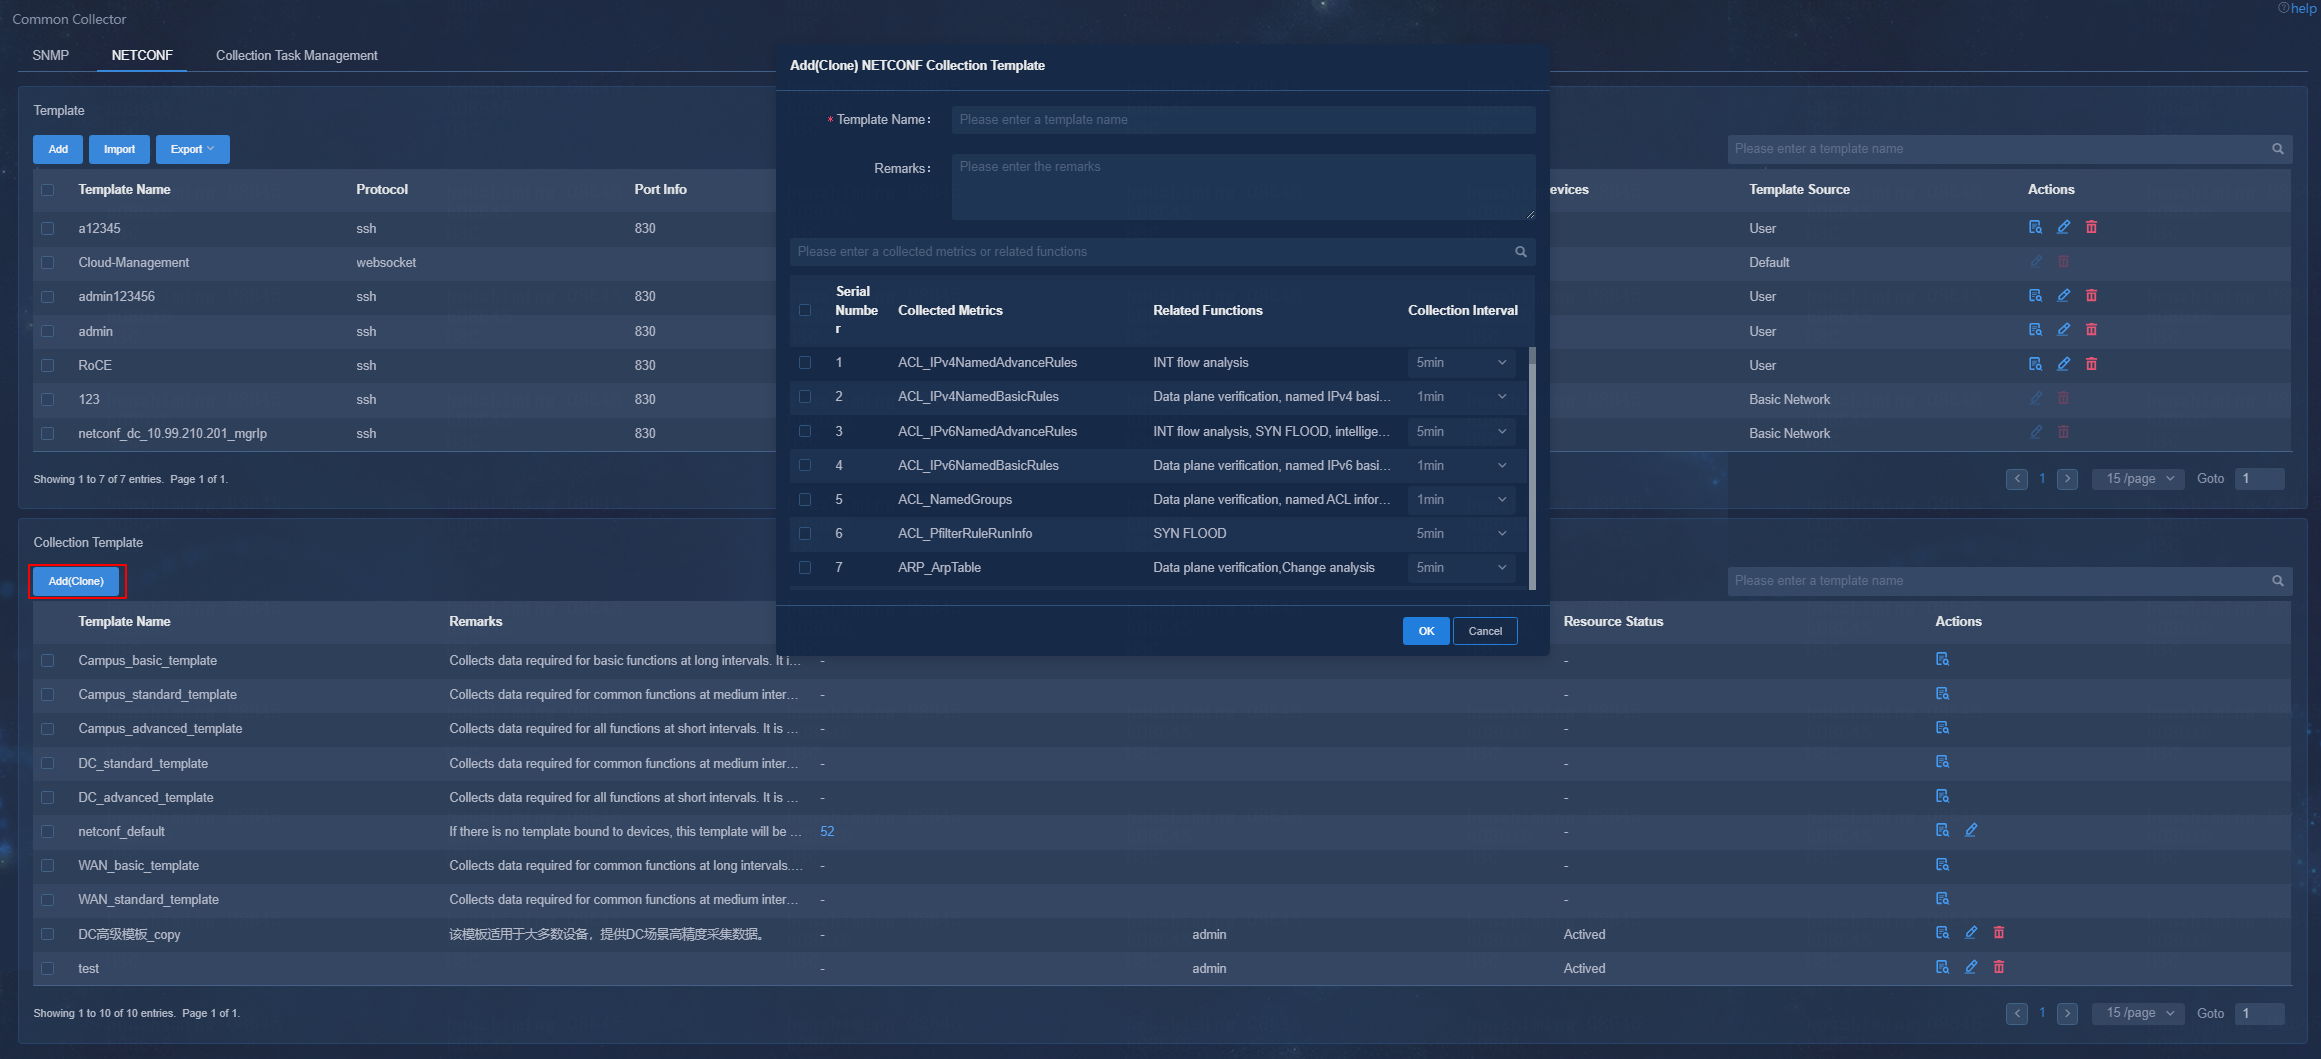
Access the Analytics > Analysis Options > Resources > Assets page, select the related assets.
Click Set Access Parameters, select SNMP Template Settings or NETCONF Template Settings, and select the desired collection template.
Figure 40 Selecting a template type
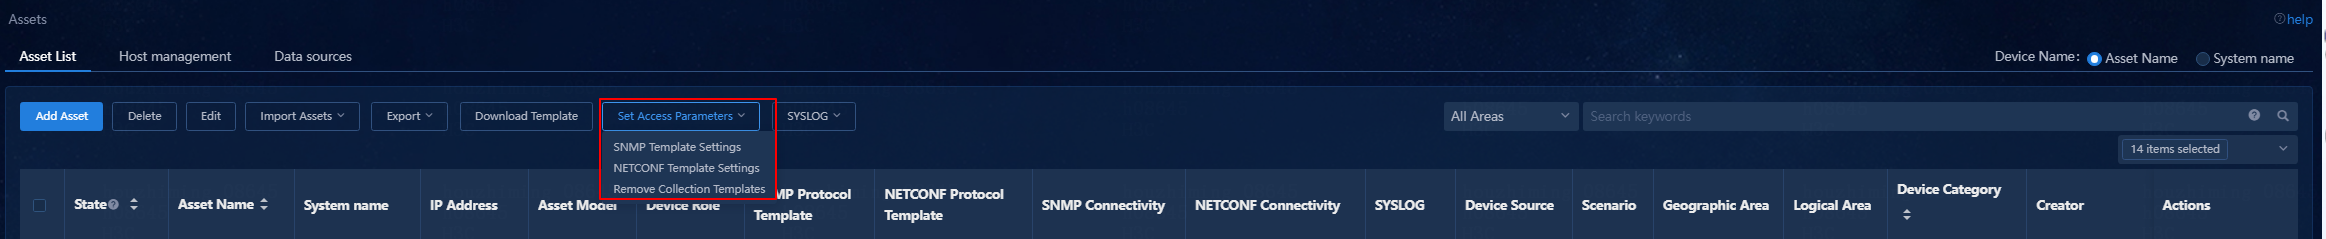
After template selection, click OK to finish collection template binding.
Figure 41 Binding to a collection template
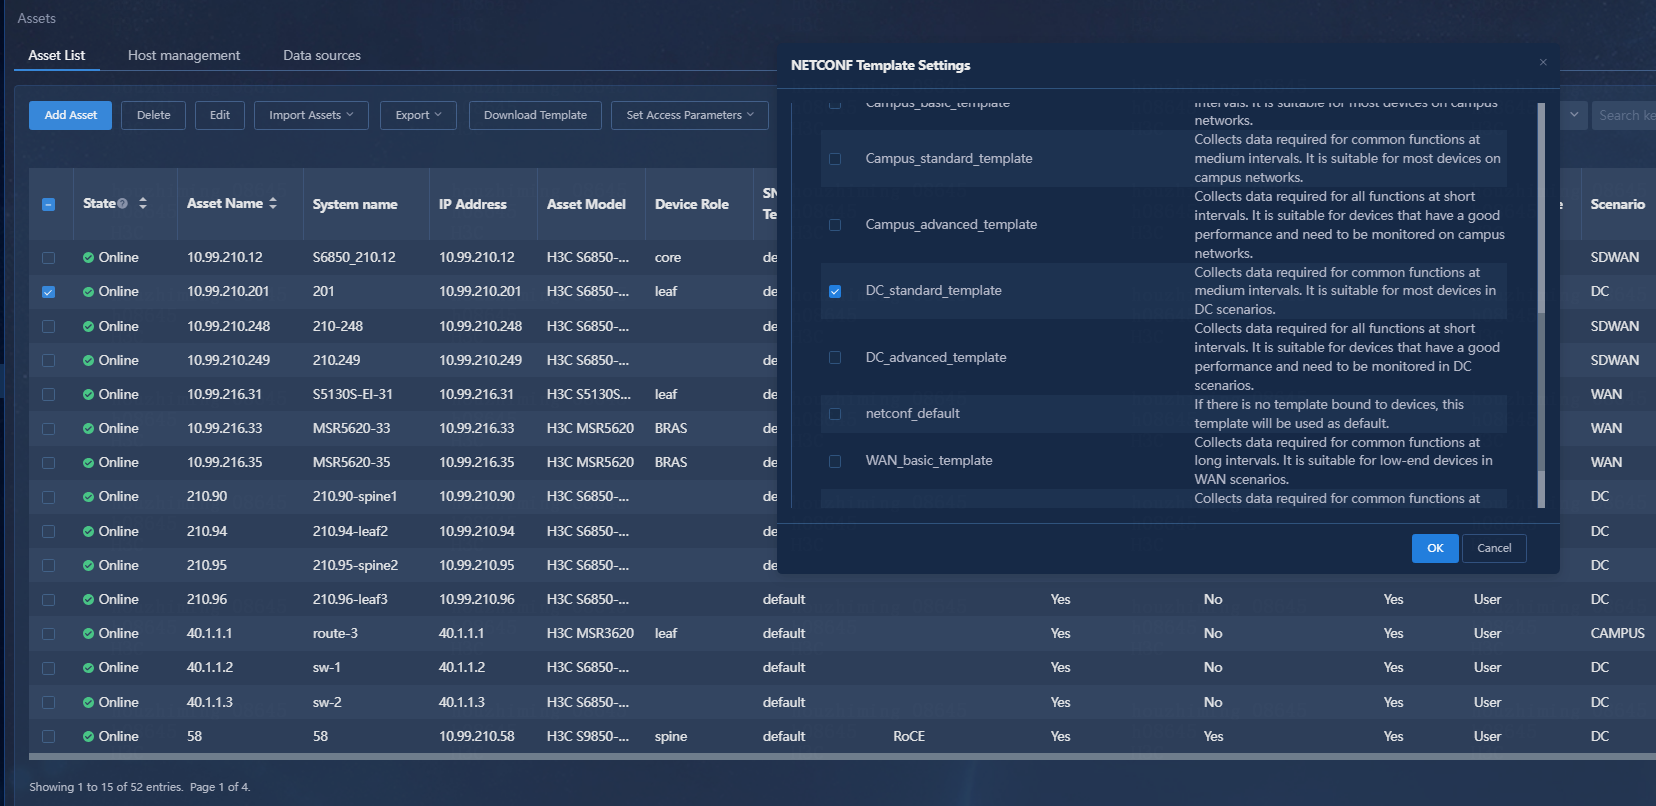
Upgrading Analyzer from E62xx or E63xx to E65xx or from E65xx to a later version
1. For Analyzer deployed as described in "Deploying Analyzer for Unified Platform of versions earlier than E0713," log in to Unified Platform and navigate to the System > Deployment page. For Analyzer deployed as described in "Deploying Analyzer for Unified Platform of E0713 and later versions," log in to Matrix and navigate to the DEPLOY > Convergence Deployment page.
2. To view component information, click the ![]() icon
on the left of a Analyzer component.
icon
on the left of a Analyzer component.
Figure 42 Expanding component information on the Deployment page

Figure 43 Expanding component information on the Convergence Deployment page
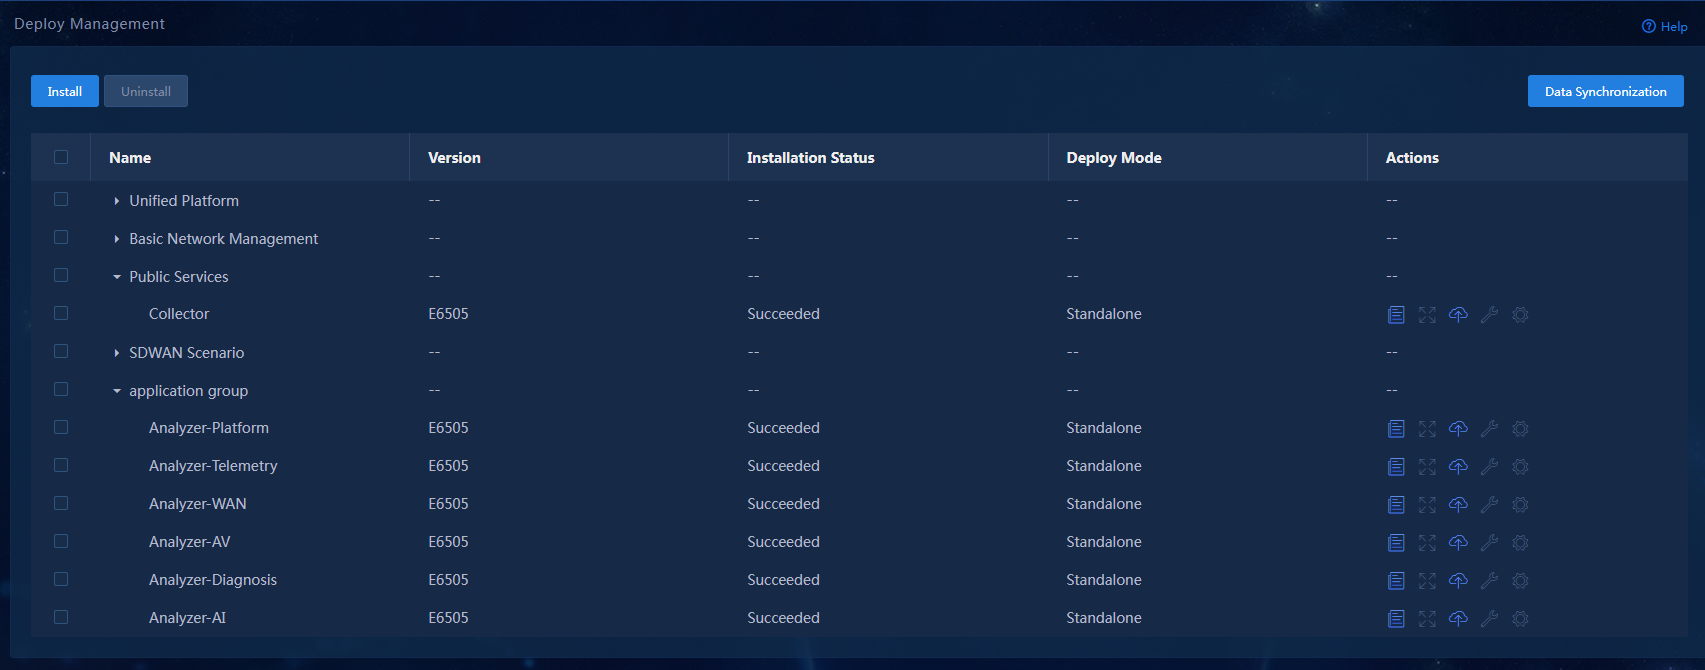
3. Click the ![]() or
or ![]() icon
in the Actions column for an analyzer component.
icon
in the Actions column for an analyzer component.
Figure 44 Upgrading a component on the Deployment page
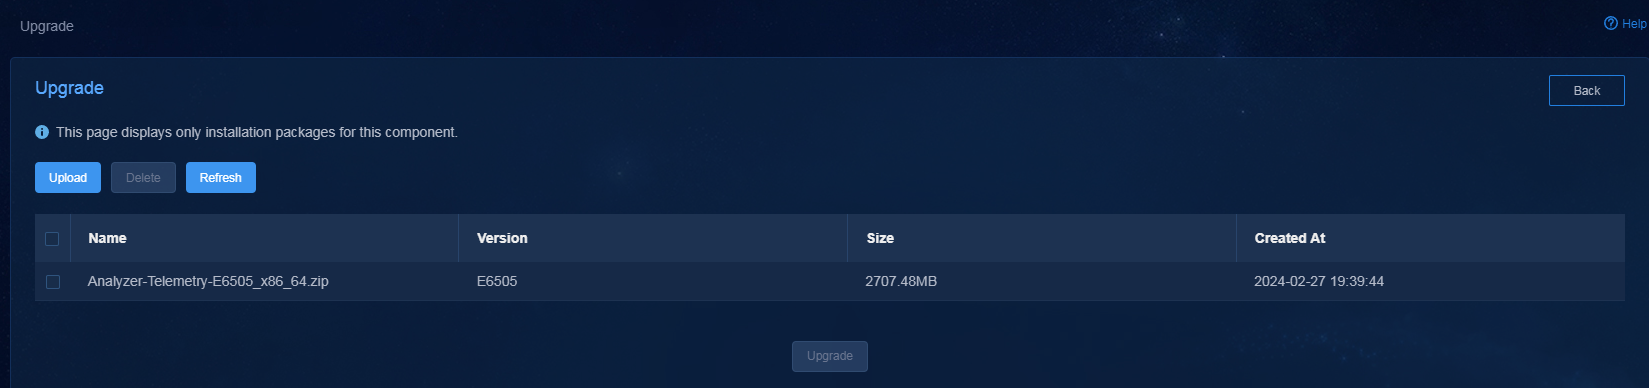
Figure 45 Upgrading a component on the Convergence Deployment page (1)
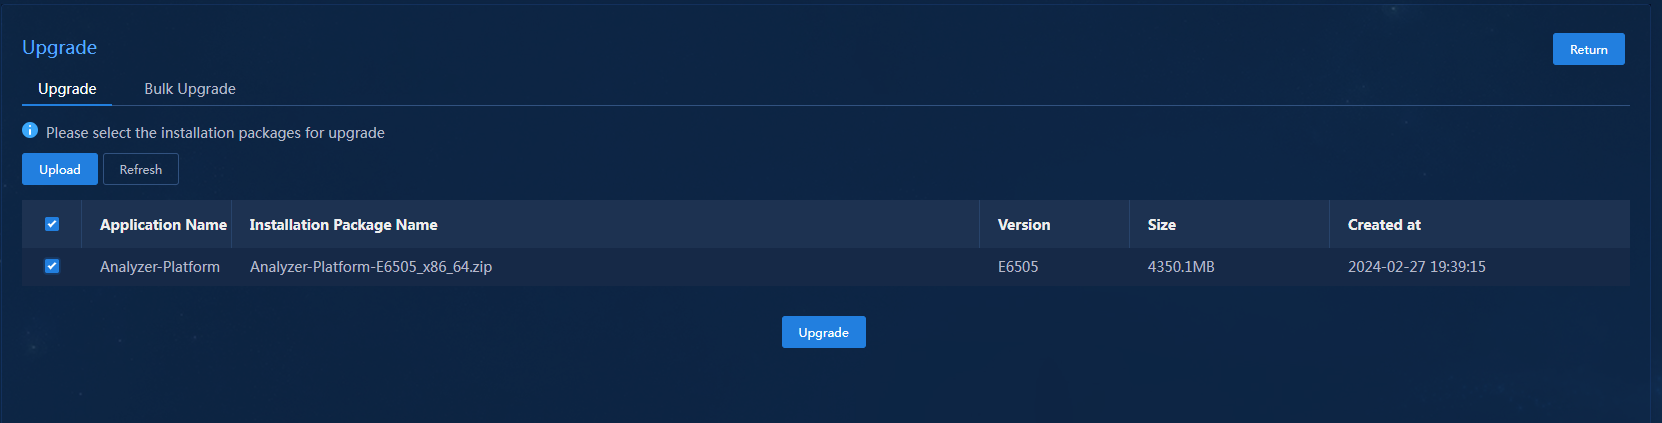
Figure 46 Upgrading a component on the Convergence Deployment page (2)

4. Click Upload, and then upload the target installation package.
5. After the installation package is uploaded successfully, select the installation package, and then click Upgrade. On the Convergence Deployment page, you can select multiple installation packages at a time.
|
|
NOTE: · In the current software version, Analyzer does not support rollback upon an upgrade failure · Performing a holistic upgrade of the Analyzer, which involves upgrading all components, can be upgraded across versions and the version numbers will be unified to become the upgraded version number.. · When upgrading the Analyzer as a whole, it is necessary to first upgrade the Analyzer-Collector component, then upgrade the Analyzer-Platform basic component, followed by the Analyzer-Telemetry component, and finally upgrade other components (with no specific order requirements). · After upgrading the Analyzer-Telemetry component in a WAN scenario, you need to upgrade the Analyzer-WAN component. If you fail to do so, the Health Analysis > Network Analysis > Network Business Analysis item will be missing in the menu. · In releases earlier than Unified Platform E0711H07, the application package of Analyzer-Collector was placed in Unified Platform release packages. As from SeerAnalyzer E6313, the application package of Analyzer-Collector was placed in SeerAnalyzer release packages. · When you deploy a release earlier than SeerAnalyzer E6313, use the application package of Analyzer-Collector inside Unified Platform release packages earlier than Unified Platform E0711 and E0711H07. In E0711H05, the application package of Analyzer-Collector is named as IA-collector-E0711H05_xx. To obtain the Analyzer-Collector application package, decompress package IA-collector-E0711H05_xx. · When you deploy SeerAnalyzer E6313, or later, use the application package of Analyzer-Collector inside the SeerAnalyzer release package. · After upgrading the Analyzer-Platform basic component, the task parameters (task manager process memory limit, task manager container memory limit, task manager container CPU limit, task manager slot number, task manager replica number, parallelism) for flink-type tasks under the task management module will be restored to their default values. · When upgrading patch packages, please follow the corresponding version manual for the upgrading process. · Under ARM architecture, the analyzer component does not support upgrading from version SeerAnalyzer-E6505 to version SeerAnalyzer-E6505P01. |
Scaling up the analyzer
|
|
CAUTION: · Before performing any scaling operation, please make sure to back up Matrix, Unified Platform, and other components in advance. In case of a failed scaling operation, the backup files can be used to restore configurations and data. · The scaling operation for components can only be performed on Unified Platform. · If ClickHouse is used for the analyzer, you cannot scale it up from standalone deployment mode to cluster deployment mode. If Vertica is used for the analyzer, you can scale it up from standalone deployment mode to cluster deployment mode. |
There are two scenarios for scale up Unified Platform:
· Scale it up from standalone deployment mode to cluster deployment mode, requiring two additional master nodes on Matrix to form a three-node cluster. Then, Unified Platform and its components can be scaled up accordingly.
· Scale it up in cluster mode, requiring additional worker nodes on Matrix to deploy the cluster first, and then scaling up the components.
Scalability of the Analyzer is divided into standalone and cluster mode, while the COLLECTOR public collection component currently only supports standalone mode.
Scaling configuration process
1. Preparation for scale-up
2. Scale up Matrix
3. Scale up Unified Platform(this step is not needed for cluster mode)
4. Adding an uplink port for hosts on the southbound attached network (not needed for Analyzer)
5. Setting up scaling parameters
6. Checking the status after scale-up
Preparation for scale-up
Requirements for scale-up
· Analyzer Runs without Any Faults.
· COLLECTOR Runs without Any Faults.
· The system and disk partitions of the scaling node need to be consistent with the already deployed nodes and network connectivity needs to be ensured.
Checking the running status of each server
1. Log in to any Master node of the Analyzer, whether it is a single machine or a cluster.
2. Check the running status of the Analyzer pod. A value of 0 indicates normal operation, while a non-zero value represents an abnormal state. If the service is abnormal, please contact an H3C technical support engineer for assistance.
[root@matrix01 ~]# kubectl get po -nsa |grep –v NAME |grep -v Completed | grep -iv Running | wc -l
3. Check the running status of the COLLECTOR pod. A value of 0 indicates normal operation, while a non-zero value represents an abnormal state. If the service is abnormal, please contact an H3C technical support engineer for assistance.
[root@matrix01 ~]# kubectl get po -ncommon |grep –v NAME | grep -iv Running | wc -l
4. Check the running status of the MPP database (Vertica version) to ensure that it is operating normally.
[root@matrix01 ~]# su - dbadmin
[dbadmin@matrix01 ~]$ admintools
Select option 1 and press Enter to confirm your selection.
Figure 47 After executing the admintools command, it will return an output.
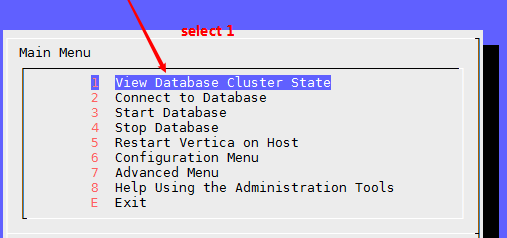
Observe the value at the arrow indicator to see if it is UP, which indicates normal operation. Any other value indicates an abnormal state.
Figure 48 MPP database status

After finishing the check, select E and press Enter to exit..
Figure 49 Exit

Execute the exit command to exit the MPP database check.
5. Log in to Unified Platform and navigate to the Analytics > Health Analysis> Network Analysis > Network Health page to check if the network health status is normal.
6. Log in to Unified Platform and navigate to the Analytics> Analysis Options > Task Management page to check if the tasks are running normally.
Scaling up a single node
|
|
IMPORTANT: · The following instructions are applicable for scaling operations on Unified Platform E0709 and above, Analyzer E6302 and above, and COLLECTOR Common Collection Component E0709 and above. · If the COLLECTOR Common Collection Component's southbound additional network uses a separate network card, the newly added node will also need two network cards and the southbound network card on the node must be enabled after expanding Unified Platform component and before expanding the collection component. |
Scaling up United Platform
Scale up Matrix
|
|
NOTE: · The reserved disk space for the nodes to be expanded in GlusterFS cannot be less than the capacity of GlusterFS on the Master node. · If you need to scale up Unified Platform, you need to scale up Matrix first. After Matrix is expanded, please do not carry out any other operations before expanding Unified Platform. |
1. When deploying Matrix on the two newly added servers, the software package of the same version as the original Matrix node should be used.
2. Log in to the single-machine deployment Matrix page, click the "Deployment" tab, select "Cluster" in the pop-up menu to enter the cluster deployment page.
3. Click the add icon ![]() in
the Master node area to add two Master nodes.
in
the Master node area to add two Master nodes.
4. Click the button to scale up the cluster. The expansion time is relatively long, please be patient.
Scale up Unified Platform
1. In the browser, enter http://ip_address:30000/central and press Enter to log in to Unified Platform. In the System> Deployment > Configure Network page, add the upstream port of the host to the additional network. If there is a South network configuration, it needs to be specified on the upstream side of the South network adapter.
|
|
NOTE: If you install the unified platform and analyzer through the convergence deployment page, you need to configure the network on the [DEPLOY>Clusters>Networks] page of Matrix. |
Figure 50 Add the upstream port
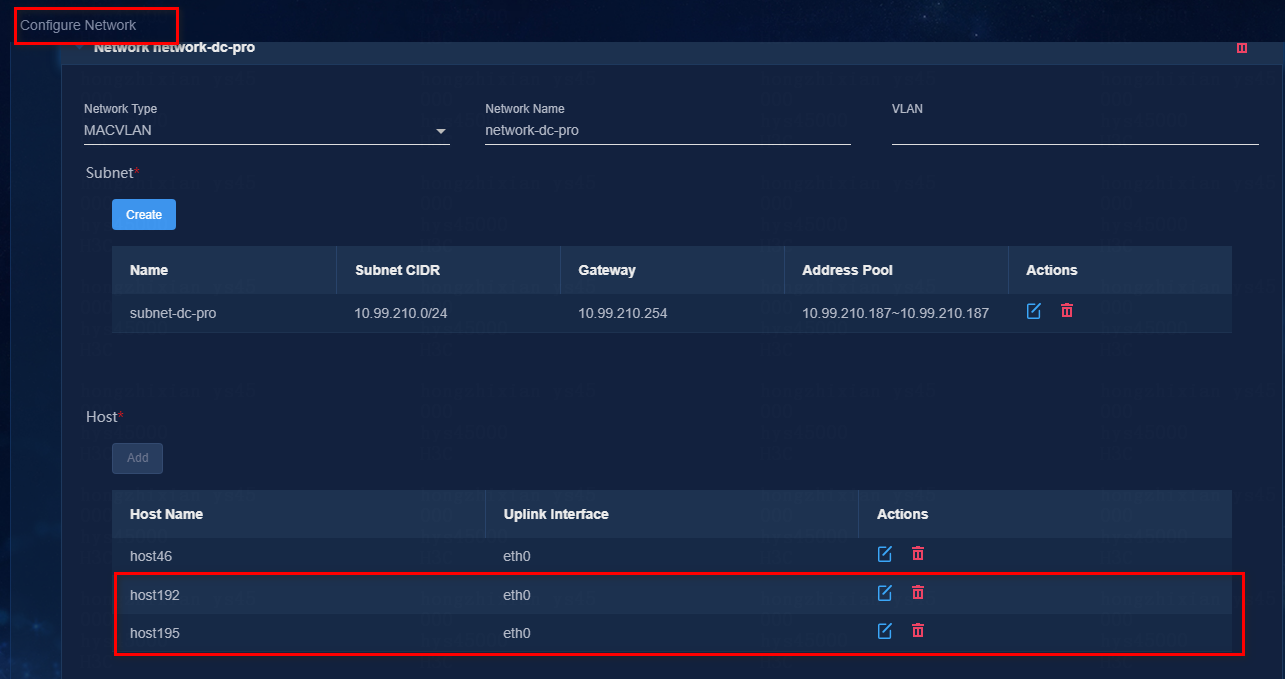
2. In the browser, enter https://ip_address:8443/matrix/ui and press Enter to log in to Matrix. On the DEPLOY> Applications page, click the button in the upper right corner to enter the configuration page for scaling applications. Select "gluster" and "SYSTEM," and then click the button.
|
|
NOTE: Please ensure that all component versions under SYSTEM support scaling based on the actual situation of each plan before performing the scaling operation. |
3. No action is required on the "Configure Shared Storage" and "Configure Database" pages. Simply click the button.
4. On the "Configure Parameters" page, you can modify the parameters of each configuration item. In the configuration parameters column for gluster, enter reserved hard disk information for the three nodes. In the configuration parameters column for system, configure the expansion-config scaling parameters, with the parameter contents shown below:
¡ The ExpansionType is the scaling type, and the value of "Standalone2Cluster" indicates standalone scaling, which does not need to be modified. The ExpansionCollectNodes are the names of the scaling nodes configured, and their values need to be separated by English commas. For example, if the original node is UC1 and you need to scale UC2 and UC3, enter "UC2, UC3".
Figure 51 Configure scaling parameters.

Start scale-up
After completing the above steps, click the button to start scale-up.
Figure 52 Start scale-up
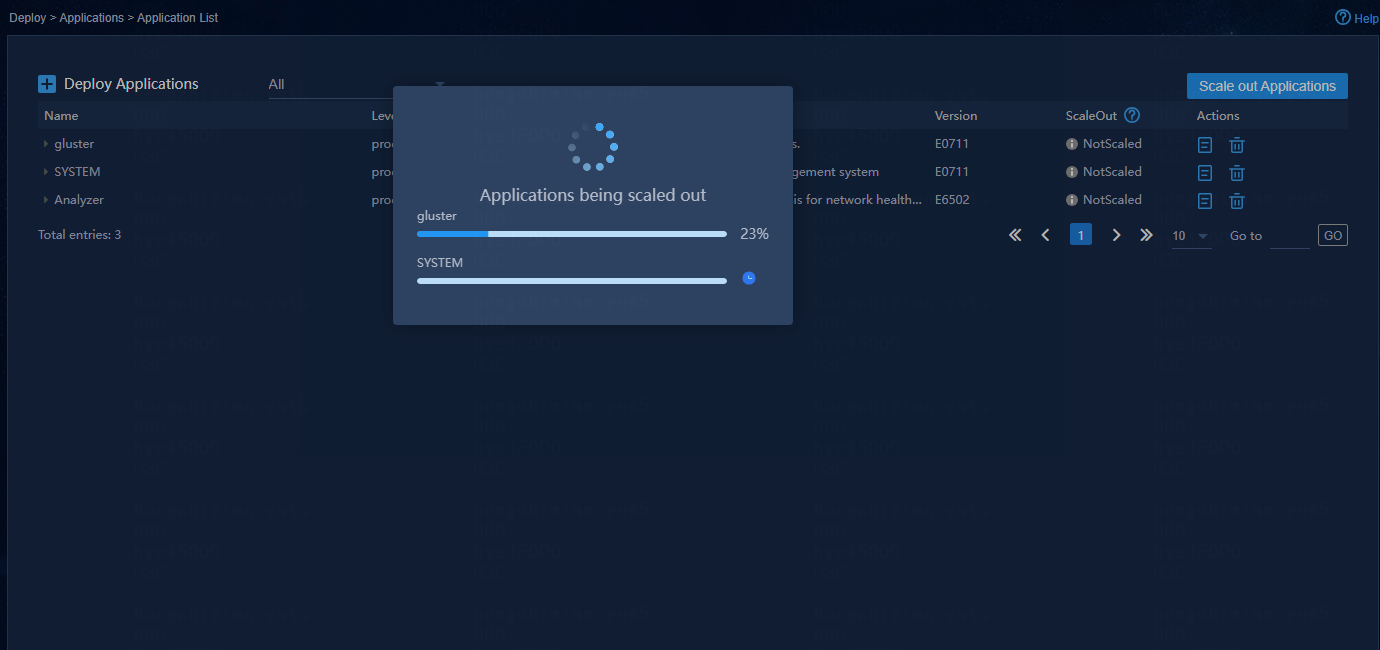
Scaling up Analyzer
Configure scale-up parameters
1. Log in to the Matrix page and go to the GUIDE>Expansion page to view the mount point of Gluster. Please note that the parameter configuration must be correct and the mounted partition must really exist, which is similar to the configuration during installation.
Figure 53 Gluster configuration parameters
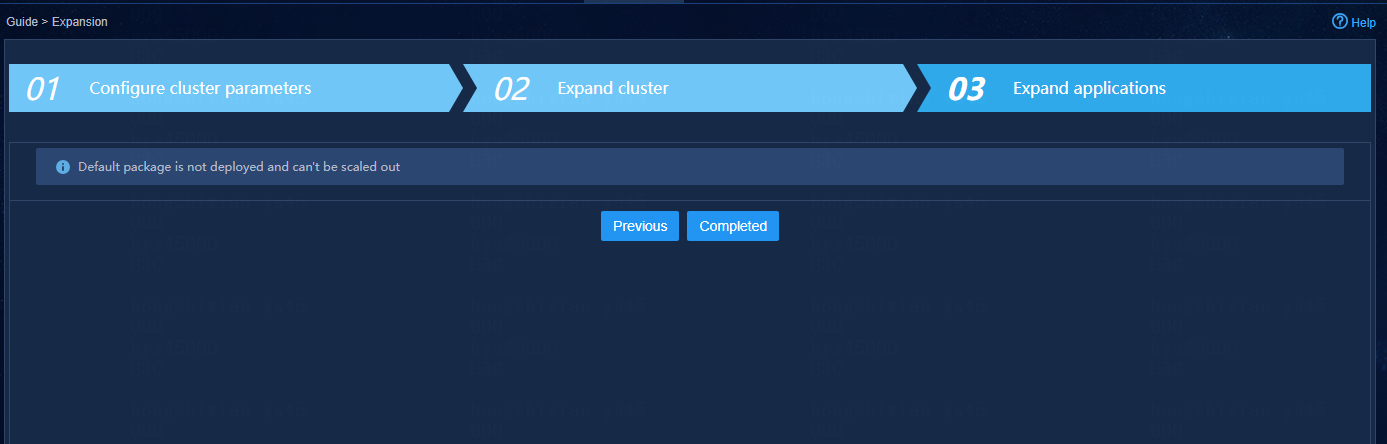
2. On the DEPLOY>Applications page, click the <Scale out Applications> button in the upper right corner to enter the configuration page for scaling out applications. Select the application that needs to be scaled.
Figure 54 Select the page for scale-up
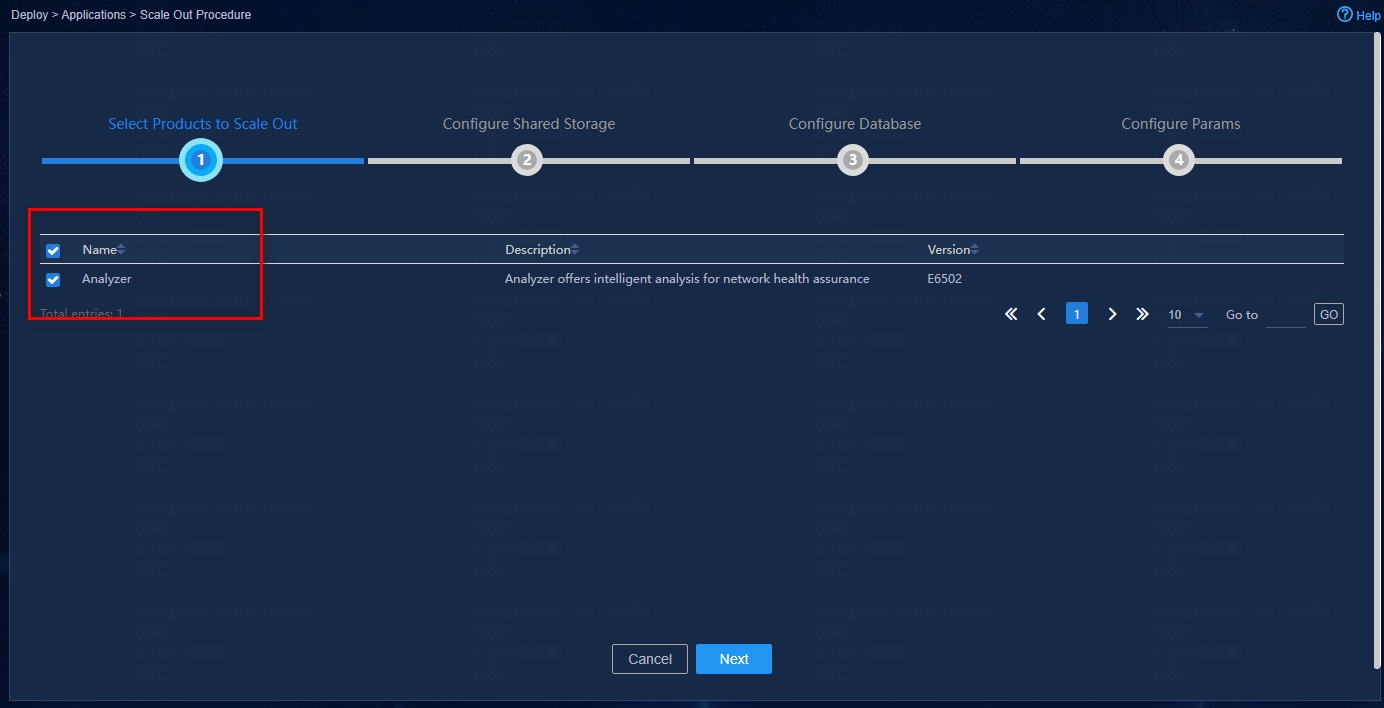
3. No operation is required on the 'Configure Shared Storage' and 'Configure Database' pages. Simply click the button.
4. On the 'Configure Parameters' page, configure scaling parameters.
The expansion-config represents the scaling parameter configuration with the following parameters:
¡ ExpansionType: The scaling type, which has a value of 'Standalone2Cluster' for stand-alone scaling and does not need to be modified.
¡ ExpansionBaseLabelNodes: The names of the scaling nodes configured, separated by commas. For example, if the original node is UC1 and needs to scale to UC2 and UC3, enter 'UC2, UC3'.
¡ ExpansionKafkaLabelNodes: The names of the scaling Kafka nodes configured, separated by commas. For example, if the original node is UC1 and needs to scale to UC2 and UC3, enter 'UC2, UC3'.
¡ ExpansionMPPLabelNodes: The names of the scaling MPP nodes configured, separated by commas. For example, if the original node is UC1 and needs to scale to UC2 and UC3, enter 'UC2, UC3'.
Figure 55 Configure scale-up parameters
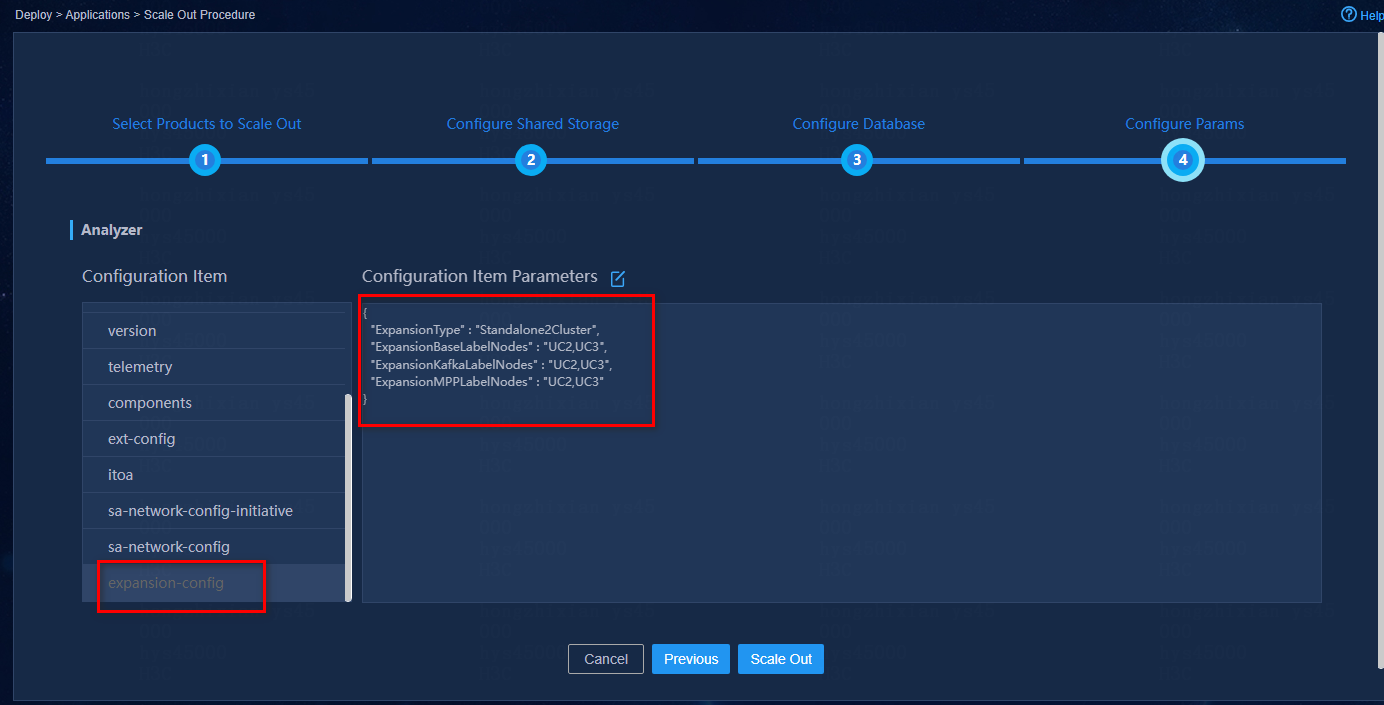
Start scale-up
After completing the above steps, click the button to start scale-up.
Figure 56 Start scale-up

Verify the scale-up result of the Analyzer component.
Check the Pod status on the Master node. If all Pods show 'Running', then the scaling has been successful.
[root@matrix01 ~]# kubectl get po -nsa |grep -v Completed
Scaling up a cluster
Scale up Matrix
|
|
NOTE: · When scale-up in cluster deployment mode, only Matrix needs to be scaled, and there is no need to scale up Unified Platform. |
1. When deploying Matrix on a new server, the software package of the same version as the original Matrix node should be used.
2. Access the Matrix page deployed in the cluster and click on the 'DEPLOY' tab. Select 'Cluster' from the pop-up menu to enter the cluster deployment page.
3. Click the add icon in the Worker node area to add one Worker node. If you need to add multiple Worker nodes, you can repeat the step or click the button to upload a template file to add them in bulk.
4. Click the button to scale up the cluster. The scaling process may take some time, please be patient.
Configure scale-up parameters.
1. Log into Matrix and go to the Deployment > Application page. Click on the icon in the 'Operation' section of the components of the big data component to access the details page of the component application.
Figure 57 Application list page
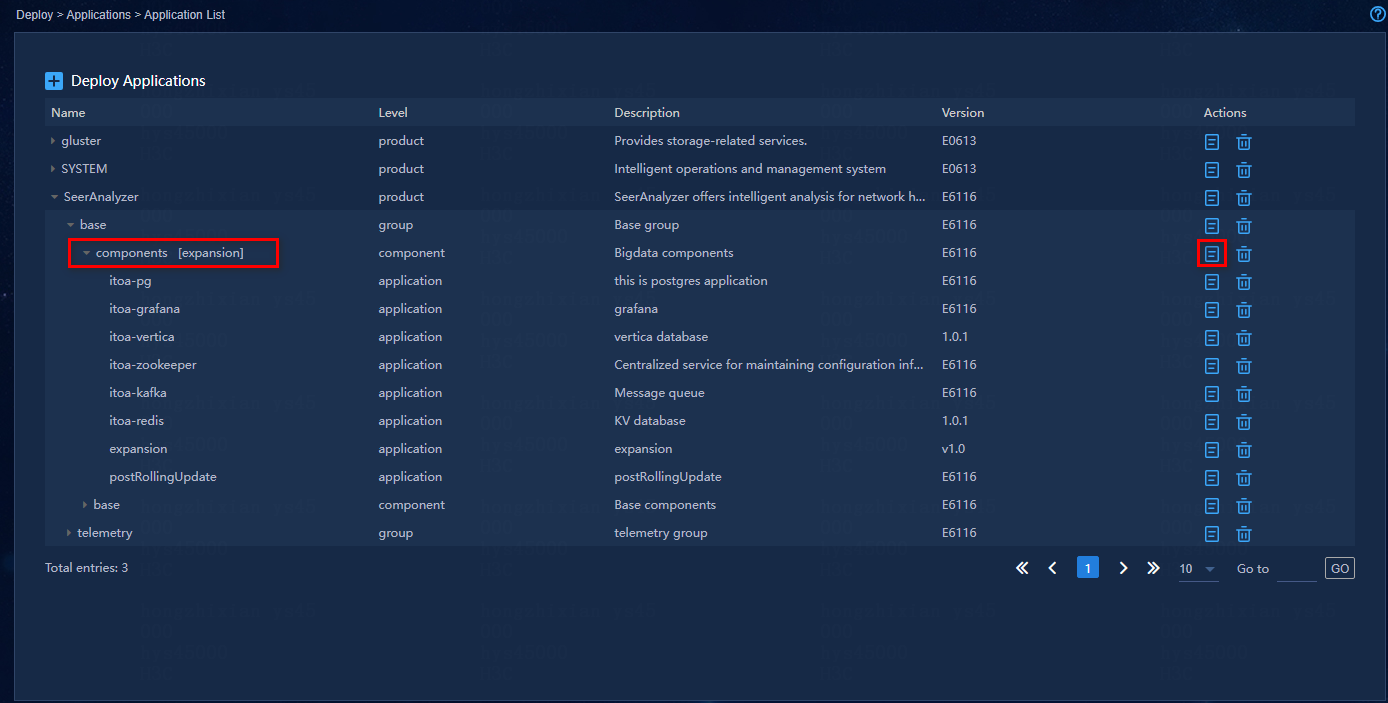
2. Click on the button to access the scaling parameter configuration page.
Figure 58 Scale-up button
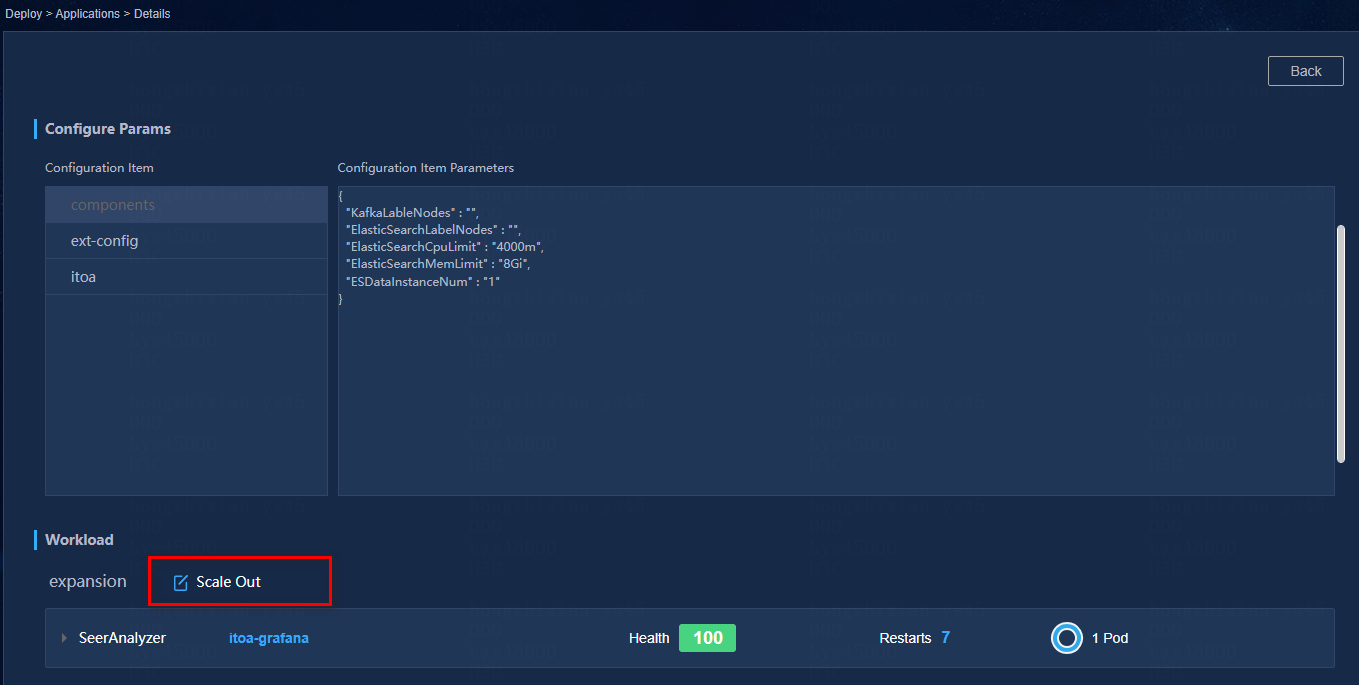
3. Configure scale-up parameters.
Figure 59 Scale-up page
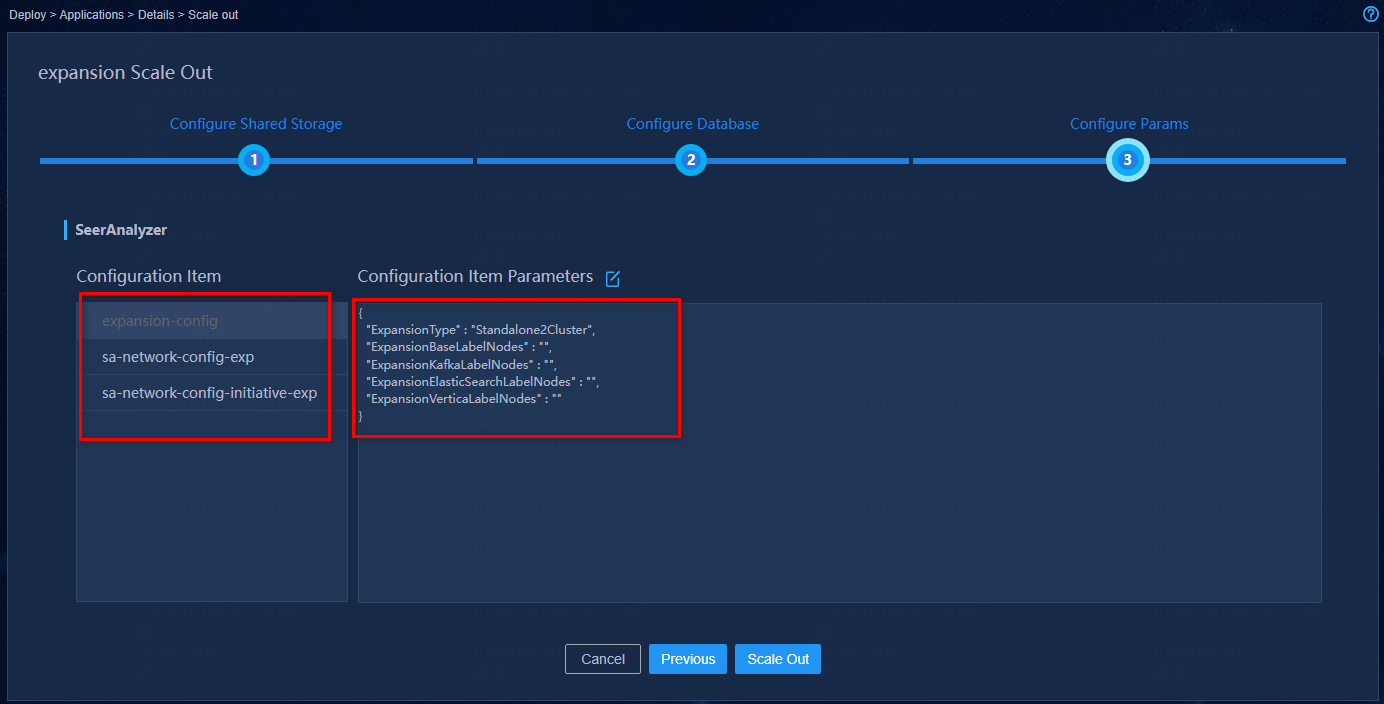
The 'expansion-config' represents the scaling parameter configuration. The parameters are as follows:
¡ ExpansionType: The scaling type, with the value 'Standalone2Cluster' representing standalone scaling. If it needs to be changed to cluster scaling, set it to an empty character '' instead. If it is cluster scaling, only one worker node can be scaled at a time.
¡ ExpansionBaseLabelNodes: Configures the names of the scaling nodes, and the values need to be separated by commas. For example, if the original nodes are UC1, UC2, and UC3, and you need to scale UC4 and UC5, you need to perform two scaling operations. For the first time, enter 'UC4' or 'UC5', and after completing the scaling operation, repeat the scaling steps above. For the second time, enter the other node to be scaled.
¡ ExpansionKafkaLabelNodes: Configures the names of the scaling nodes for Kafka, and the values need to be separated by commas. For example, if the original nodes are UC1, UC2, and UC3, and you need to scale UC4 and UC5, you need to perform two scaling operations. For the first time, enter 'UC4' or 'UC5', and after completing the scaling operation, repeat the scaling steps above. For the second time, enter the other node to be scaled.
¡ ExpansionMPPLabelNodes: Configures the names of the scaling nodes for MPP, and the values need to be separated by commas. For example, if the original nodes are UC1, UC2, and UC3, and you need to scale UC4 and UC5, you need to perform two scaling operations. For the first time, enter 'UC4' or 'UC5', and after completing the scaling operation, repeat the scaling steps above. For the second time, enter the other node to be scaled.
Strat scale-up
After completing the above steps, click the button to start scale-up.
Verify the scale-up result of the Analyzer component
Check the Pod status on the Master node. If all Pods show 'Running', then the scaling has been successful.
[root@matrix01 ~]# kubectl get po -nsa |grep -v Completed
FAQ
How can I configure security policies if multiple enabled NICs are configured with IP addresses?
1. Log in to Matrix, click DEPLOY on the top navigation bar, and select Security > Security Policies from the left navigation pane.
2. Click Add.
3. Configure the policy as follows:
a. Select the default action to permit.
b. Click Add in the Rules Info area and configure a rule for each node as follows:
- Specify the IP addresses of all the NICs on the node except for the NIC used by Matrix as the source addresses.
- Specify the protocol type as TCP.
- Enter 8101,44444,2379,2380,8088,6443,10251,10252,10250,10255,10256 as the destination ports.
- Set the action to ACCEPT.
c. Click Apply.
Figure 60 Configuring a security policy

4. Enable the disabled NICs. This example enables NIC eth33.
[root@node01 ~]# ifup eth33
How can I change the SSH port of a cluster node?
To change the node SSH port in a newly deployed scenario:
1. Change the SSH port of all nodes after OS installation on the nodes.
a. Edit the /etc/ssh/sshd_config configuration file, and change the Port 22 field as needed, for example, change the field to Port 2244.
b. Restart the sshd service.
systemctl restart sshd.service
c. Verify if the new port is a monitor port.
netstat –anp | grep –w 2244
2. Execute the vim /opt/matrix/config/navigator_config.json command to access the navigator_config file. Identify whether the sshPort field exists in the file. If the field exists, change its value. If the field does not exist, add this field and specify the value for it.
{
"productName": "uc",
"pageList": ["SYS_CONFIG", "DEPLOY", "APP_DEPLOY"],
"defaultPackages": ["common_PLAT_GlusterFS_2.0_E0707_x86.zip", "general_PLAT_portal_2.0_E0707_x86.zip", "general_PLAT_kernel_2.0_E0707_x86.zip"],
"url": "http://${vip}:30000/central/index.html#/ucenter-deploy",
"theme":"darkblue",
"matrixLeaderLeaseDuration": 30,
"matrixLeaderRetryPeriod": 2,
"sshPort": 12345
}
3. Restart the Matrix service.
[root@node-worker ~]# systemctl restart matrix
4. Verify that the port number has been changed. If the port number has been changed, a log message as follows is generated.
[root@node-worker ~]# cat /var/log/matrix-diag/Matrix/Matrix/matrix.log | grep "ssh port"
2022-03-24T03:46:22,695 | INFO | FelixStartLevel | CommonUtil.start:232 | ssh port = 12345.
5. Edit the /opt/matrix/k8s/run/matrix.info file on all nodes after Matrix installation, and then restart Matrix.
datasource=etcd //Matrix data source. This field cannot be edited.
ssh_port=22 //SSH port used by Matrix, which is 22 by default.
|
|
NOTE: · The SSH port is used for remote connection. Make sure all nodes, including master and worker nodes, use the same SSH port. · Make sure you restart Matrix for all nodes at the same time. Matrix will read the SSH port in the configuration file. |
6. Deploy Matrix. For more information, see the deployment guide for Matrix.
To change the node SSH port in an updated scenario, first upgrade Unified Platform and analyzers to the version (E6215 or later) that supports SSH port modification. Then, use steps 1, 2, and 3 applicable to a newly deployed scenario to change the SSH port.
What should I do if the analyzer fails to be deployed or upgraded?
The analyzer might fail to be deployed or upgraded because of a timeout during the process. If this occurs, deploy the analyzer again or upgrade the analyzer again. If the issue remains, contact Technical Support.
How do I adjust the maximum microservice quantity in a campus single-node converged deployment scenario?
Unified Platform uses the Kubernetes+Docker microservice technology architecture. By default, Unified Platform allows a maximum of 300 microservices. In campus single-server converged deployment scenario (a full set of control and managing components deployed on a single server: Unified Platform+vDHCP+SE+EIA+WSM+SA), the number of microservices might exceed this limit, and you are required to adjust the maximum microservice quantity.
To adjust the maximum microservice quantity, for example, from 300 to 400:
1. Make sure Matrix has been deployed on the server and the system is operating correctly.
2. Access the CLI and edit the Kubernetes configuration file.
vi /etc/systemd/system/kubelet.service.d/10-kubeadm.conf
Change the --max-pods parameter value from 300 to 400.
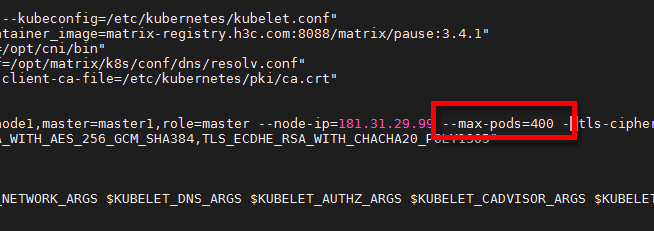
3. Save the configuration file and restart the kubelet service.
systemctl daemon-reload && systemctl restart kubelet
Why is Vertica unavailable after the node or cluster IP is changed?
When Matrix/Unified Digital Territory component and the Analyzer both need to execute hook scripts
To modify the node and cluster IP addresses, both Matrix/Unified Platform and the analyzer are required to execute hook scripts. The modification fails easily because of issues such as poor environment performance and timeout in script execution, and you must change back to the original node and cluster addresses instead of specifying a new set of IP addresses. Vertica will be unavailable if you specify a new set of IP addresses.
Why the Analyzer menu not visible after an operator logs in?
This is usually caused by the fact that the ordinary operator (not the administrator) account is not bound to a role group with permission to view the analysis component when it was created. If you need to obtain permission, you need to bind a role group with permission to view the analysis component when creating a new operator on the [System>Operator Management>Operators] page.
Figure 61 Add Operator
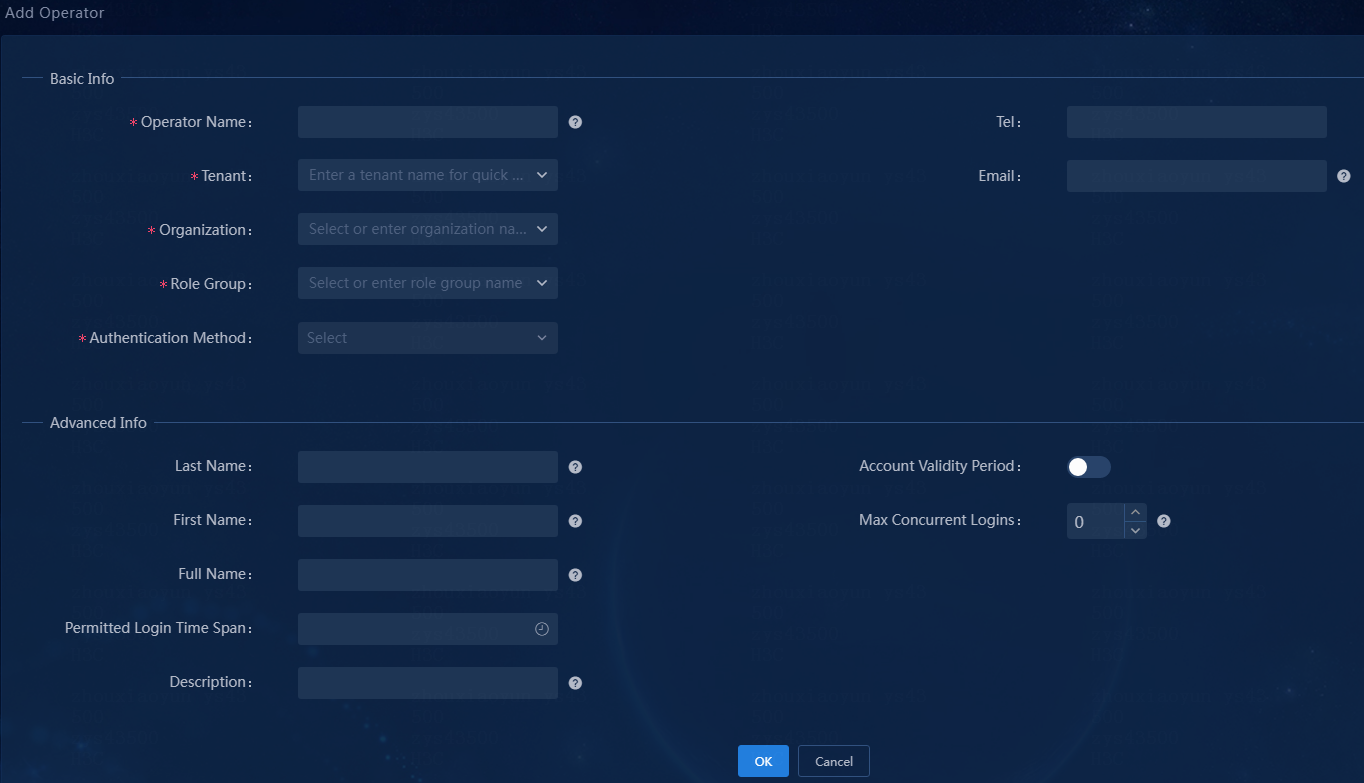
The role group permissions can be viewed on the "Permissions List" subpage under [System>Operator Role Management > Operator Role Group List].
How to check if NUMA nodes are allocated memory?
1. Query the PCIE address of the network card, for example, the PCIE of the data collection network card in a certain environment is: 43:00.1.
lspci | grep Eth
2. Find out the NUMA node ID of the network card.
/sys/bus/pci/devices/0000\:43\:00.1/numa_node
3. Execute the command: numactl -H, and check if the corresponding NUMA node has been allocated memory.
Taking NUMA node 4 as an example (4 is the NUMA node ID that has been queried, and the ID may vary depending on the actual deployment), the query result shows that NUMA node 4 has memory allocated.
node 4 cpus: 24 25 26 27 28 29 72 73 74 75 76 77
node 4 size: 32768 MB
node 4 free: 27161 MB
How to limit the timeout period when using kafka-console-consumer.sh to consume Kafka monitoring information?
When using kafka-console-consumer.sh to consume Kafka monitoring information, if the timeout period is not set, the script will not stop consuming actively. Even if users forget to turn off the consumption, it will not stop automatically, which will increase the system execution pressure. Therefore, it is necessary to add a default timeout configuration to the consumption script sa-console-consumer.sh, with the default time set to 60 seconds. When using this script for Kafka consumption monitoring, the following configuration needs to be performed in the corresponding Kafka Pod:
./sa-console-consumer.sh --timeout 5 --bootstrap-server itoa-kafka-service1:6667 --topic test001
The --timeout value parameter must be included behind the execution script sa-console-consumer.sh, or the parameter can be omitted. Then the parameters required by kafka-console-consumer.sh must follow.
The unit of value is seconds. "--timeout 5" means configuring the program to automatically exit after 5 seconds. If the "--timeout" parameter and its specific number of seconds are not configured, the program will exit automatically after 60 seconds by default.
How to check if hyper-threading is enabled?
Generally, the hyper-threading feature is enabled by default in the BIOS. You can find the Hyper-Thread option in the BIOS to check if hyper-threading is enabled.
Figure 62 check if hyper-threading is enabled
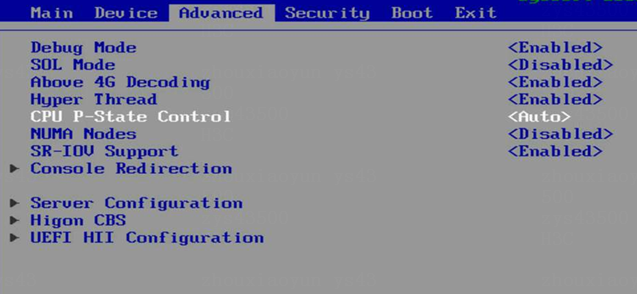
How to enable hardware virtualization function?
a. Enter the background of the SeerCollector and modify the /etc/default/grub file by adding the configuration content "amd_iommu=on iommu=pt".
[root@h3clinux1 ~]# vi /etc/default/grub
Copy the following content to overwrite the original file configuration:
GRUB_TIMEOUT=5
GRUB_DISTRIBUTOR="$(sed 's, release .*$,,g' /etc/system-release)"
GRUB_DEFAULT=saved
GRUB_DISABLE_SUBMENU=true
GRUB_TERMINAL_OUTPUT="console"
GRUB_CMDLINE_LINUX="crashkernel=auto rhgb quiet amd_iommu=on iommu=pt"
GRUB_DISABLE_RECOVERY="true"
b. Execute the following command:
- If the server is UEFI booted, execute the following command:
[root@h3clinux1 ~]# grub2-mkconfig -o /boot/efi/EFI/*/grub.cfg
- If the server is booted in legacy mode, execute the following command:
[root@h3clinux1 ~]# grub2-mkconfig -o /boot/grub2/grub.cfg
c. Restart the server.
[root@h3clinux1 ~]# reboot
How to resolve the issue of SNMP-Trap collection function not being available in the scenario of "South-North Network Convergence" (no network in the south) when analyzing components?
Symptom: The SNMP-Trap collection function of Analyzer is not available when a "South-North Network Convergence" (no network in the south) solution is used to deploy the common collection component and the network component is not installed.
Solution: Go to the [Monitor> Alarm > Traps > Trap Filter Rules] page, disable the "Undefined Trap Filtering" and "Filter Repeated Traps" rules.
What should I do if the SNMP-Trap collection function of Analyzer is unavailable in the South-North Network Convergence (no southbound network) scenario?
Symptom: The SNMP-Trap collection function of Analyzer is not available when the following conditions exist:
· The South-North Network Convergence (no southbound network) solution is used to deploy the common collection component.
· The network component is not installed.
Solution: Navigate to the Monitor> Alarm > Traps > Trap Filter Rules page, disable the Undefined Trap Filtering and Filter Repeated Traps rules.
Figure 63 Disabling trap filter rules
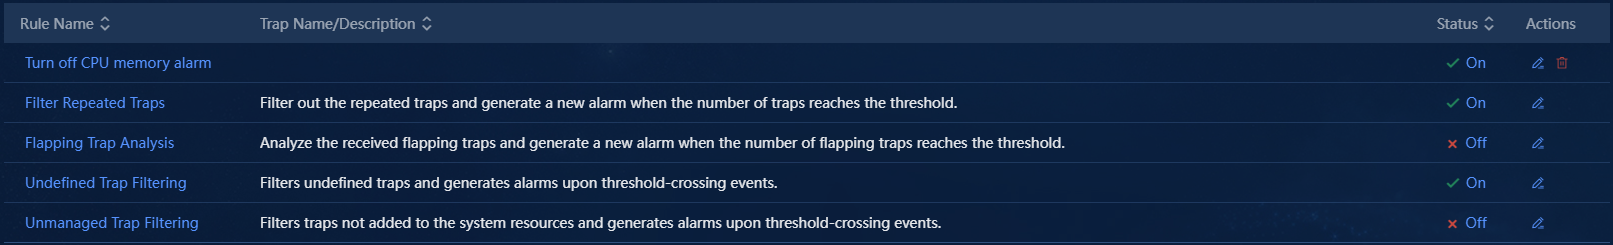
How to resolve the issue of the SeerCollector task state being stop after upgraded to E6501 or a later version?
Symptom: After being upgraded to E6501, the task state of SeerCollector becomes Stop.
Figure 64 SeerCollector page
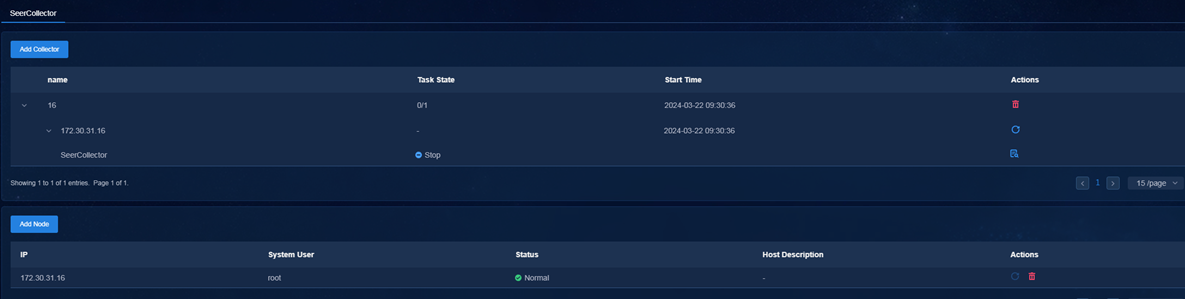
Solution: Access the Analysis>Analysis
Options>Collector>Collector Parameters>SeerCollector page. Click the ![]() icon in the Actions
column for SeerCollector in abnormal state. Verify that the task state becomes Running.
icon in the Actions
column for SeerCollector in abnormal state. Verify that the task state becomes Running.
How to change the file system type of a data disk partition to ext4?
Symptom: After you create data disk partitions under the guidance of "Data disk planning", you do not change the file system type of some data disk partitions to ext4. As a result, Analyzer deplolyment fails.
Solution: Perform the following tasks to clear the symptom:
1. Identify whether the file system type of the related disk partition is ext4.
[root@sa1 ~]# mount -l | grep sa_data
/dev/vdb1 on /sa_data type xfs (rw,relatime,seclabel,attr2,inode64,noquota)
/dev/vdb3 on /sa_data/kafka_data type xfs (rw,relatime,seclabel,attr2,inode64,noquota)
/dev/vdb2 on /sa_data/mpp_data type ext4 (rw,relatime,seclabel,data=ordered)
2. If the file system type of the related disk partitions is not ext4, perform the following operations:
|
|
IMPORTANT: First uninstall the Analyzer component and place the collected kafka data in directory /sa_data/kafka_data. |
a. Unmount the disk partitions. Make sure disk partition /sa_data is unmounted at last.
[root@sa1 ~]# umount /sa_data/kafka_data
[root@sa1 ~]# umount /sa_data/mpp_data
[root@sa1 ~]# umount /sa_data
b. Execute the mkfs.ext4 /dev/vdb1 command to format the disk partitions. This task is required for all non- ext4 disk partitions.
c. Execute the following command to obtain the new UUIDs assigned to the disk partitions. When you specify multiple disk partitions in the command, use the pipe symbol (|) to separate them.
[root@sa1 ~]# ll /dev/disk/by-uuid | grep -E 'vdb1|vdb2|vdb3'
lrwxrwxrwx. 1 root root 10 Jun 7 15:40 89b86ff9-e7ee-4426-ba01-61e78ca6f4b1 -> ../../vdb1
lrwxrwxrwx. 1 root root 10 Jun 7 15:40 c9da5aba-80b9-4202-ba16-b222462a0329 -> ../../vdb3
lrwxrwxrwx. 1 root root 10 Jun 7 15:40 cac87013-f014-40df-9aca-af76888b1823 -> ../../vdb2
d. Execute the vim /etc/fstab command to update UUIDs of the disk partitions and change their format to ext4.
e. Verify the modification.
[root@ sa1 ~]# cat /etc/fstab
#
# /etc/fstab
# Created by anaconda on Wed Dec 7 15:44:15 2022
#
# Accessible filesystems, by reference, are maintained under '/dev/disk‘
# See man pages fstab(5), findfs(8), mount(8) and/or blkid(8) for more info
#
UUID=519f9af7-12ce-4567-b62c-2315cad14f56 / xfs defaults 0 0
UUID=83628a24-94f5-4937-b016-64d0f72bd98d /boot xfs defaults 0 0
UUID=3B96-1B3A /boot/efi vfat defaults,uid=0,gid=0,umask=0077,shortname=winnt 0 0
UUID=89b86ff9-e7ee-4426-ba01-61e78ca6f4b1 /sa_data ext4 defaults 0 0
UUID=c9da5aba-80b9-4202-ba16-b222462a0329 /sa_data/kafka_data ext4 defaults 0 0
UUID=cac87013-f014-40df-9aca-af76888b1823 /sa_data/mpp_data ext4 defaults 0 0
UUID=51987141-f160-4886-ad51-bc788ec2176c /var/lib/docker xfs defaults 0 0
UUID=4e91a1b8-4890-4a41-be00-098ded6b8102 /var/lib/etcd xfs defaults 0 0
UUID=2554963b-03e7-4be4-b214-7350f2eb3df9 /var/lib/ssdata xfs defaults 0 0
#UUID=a22041b8-7c7c-4730-bc1f-634306145e36 swap swap defaults 0 0
f. Execute the mount -a command to mount the disk partitions.
The following error messages are a normal phenomenon.
mount: mount point /sa_data/kafka_data does not exist
mount: mount point /sa_data/mpp_data does not exist
To clear the above error messages, create those directories that do not exist.
[root@ sa1 ~]# mkdir -p /sa_data/kafka_data
[root@ sa1 ~]# mkdir -p /sa_data/mpp_data
g. Execute the mount -a command again to mount the disk partitions and change the file system type.
h. In cluster mode, repeat the previous steps on all nodes that require Analyzer deployment.
What should I do if the deployment of the Analyzer-Platfom component fails?
Symptom: When you deploy the Analyzer-Platfom component, the deployment fails and the system prompts that /sa_data is not mounted.
Solution: Verify that the data disk partitions required for Analyzer deployment are configured as described in this document and their file system types are all ext4. If not, reconfigure the required data disk partitions.
