- Table of Contents
-
- 03-System Management Configuration Guide
- 00-Preface
- 01-Basic device management configuration
- 02-Device hardening configuration
- 03-Hardware resource management configuration
- 04-EAA configuration
- 05-Process monitoring and maintenance configuration
- 06-Fast log output configuration
- 07-Flow log configuration
- 08-Information center configuration
- Related Documents
-
| Title | Size | Download |
|---|---|---|
| 03-Hardware resource management configuration | 90.59 KB |
Hardware resource management tasks at a glance
Configuring CPU usage tracking
Displaying CPU usage monitoring information
Setting memory alarm thresholds
Displaying memory usage monitoring information
Setting the port status detection timer
Verifying and diagnosing transceiver modules
Diagnosing transceiver modules
Enabling alarm upon detection of a third-party transceiver module
Displaying device hardware information
Managing hardware resources
This chapter describes routine device hardware resource management tasks, including monitoring CPU and memory usage, displaying power supply and fan operating status, and configuring basic device operating parameters.
Hardware resource management tasks at a glance
All hardware resource management tasks are optional. You can perform any of the tasks in any order.
· Monitoring CPU usage
¡ Configuring CPU usage alarm
¡ Configuring CPU usage tracking
¡ Displaying CPU usage monitoring information
· Monitoring memory usage
¡ Setting memory alarm thresholds
¡ Displaying memory usage monitoring information
· Setting the port status detection timer
· Verifying and diagnosing transceiver modules
¡ Verifying transceiver modules
¡ Diagnosing transceiver modules
· Displaying device hardware information
· Displaying device hardware electronic label information
Monitoring CPU usage
Configuring CPU usage alarm
About this task
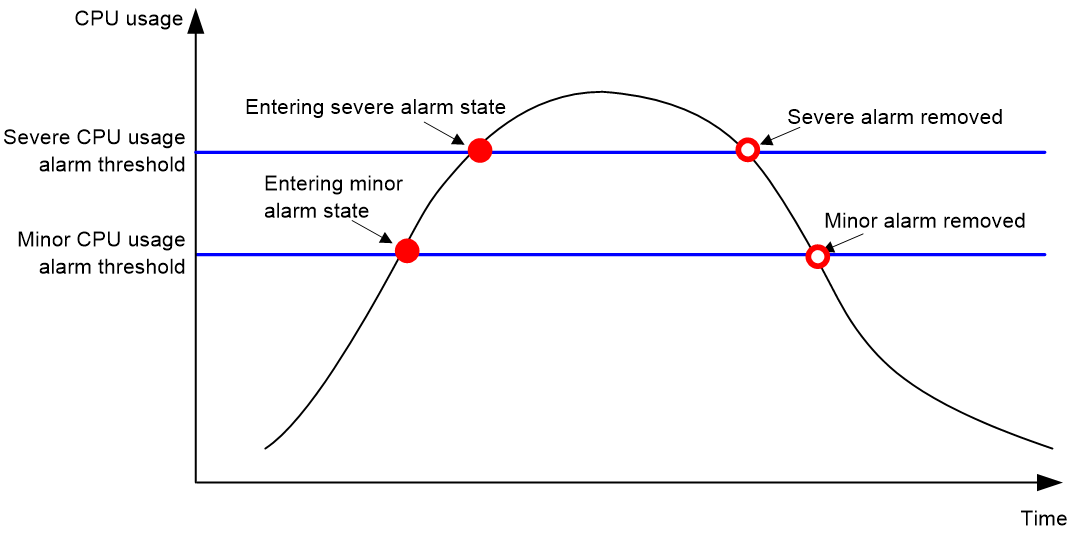
The device samples CPU usage at 1-minute intervals, and compares the samples with CPU usage thresholds to identify the CPU usage status and send alarms or notifications accordingly.
The device supports the following CPU usage thresholds:
· Minor threshold—If the CPU usage increases to or above the minor threshold but is less than the severe threshold, the CPU usage enters minor alarm state. The device sends minor alarms periodically until the CPU usage increases above the severe threshold or the minor alarm is removed.
· Severe threshold—If the CPU usage increases above the severe threshold, the CPU usage enters severe alarm state. The device sends severe alarms periodically until the severe alarm is removed.
· Recovery threshold—If the CPU usage decreases below the recovery threshold, the CPU usage enters recovered state. The device sends a recovery notification.
CPU usage alarms and notifications can be sent to NETCONF, SNMP, and the information center to be encapsulated as NETCONF events, SNMP traps and informs, and log messages. For more information about NETCONF and SNMP, see Network Management and Monitoring Configuration Guide. For more information about information center, see "Configuring the information center."
Figure 1 CPU alarms and alarm-removed notifications
Procedure
1. Enter system view.
system-view
2. Set the CPU usage alarm thresholds.
monitor cpu-usage threshold severe-threshold [ minor-threshold minor-threshold ] [ slot slot-number [ cpu cpu-number ] ]
By default, the CPU usage alarm threshold is 99%.
3. Set the CPU usage alarm resending intervals.
monitor resend cpu-usage { minor-interval minor-interval | severe-interval severe-interval } * [ slot slot-number [ cpu cpu-number ] ]
By default, the minor CPU usage alarm resending interval and severe CPU usage alarm resending interval are 300 seconds and 60 seconds, respectively.
Configuring CPU usage tracking
About this task
After you enable CPU usage tracking, the system samples CPU usage at intervals and saves the samples to a buffer. You can use the display cpu-usage history command to view the recent CPU usage.
Procedure
1. Enter system view.
system-view
2. Set the sampling interval for CPU usage tracking.
monitor cpu-usage interval interval [ slot slot-number [ cpu cpu-number ] ]
By default, the sampling interval for CPU usage tracking is 1 minute.
3. Enable CPU usage tracking.
monitor cpu-usage enable [ slot slot-number [ cpu cpu-number ] ]
By default, CPU usage tracking is enabled.
Displaying CPU usage monitoring information
Perform display tasks in any view.
· Display CPU usage monitoring settings.
display cpu-usage configuration [ slot slot-number [ cpu cpu-number ] ]
· Display the current CPU usage statistics.
display cpu-usage [ data-plane ] [ summary ] [ slot slot-number [ cpu cpu-number ] ]
Monitoring memory usage
Setting memory alarm thresholds
About this task
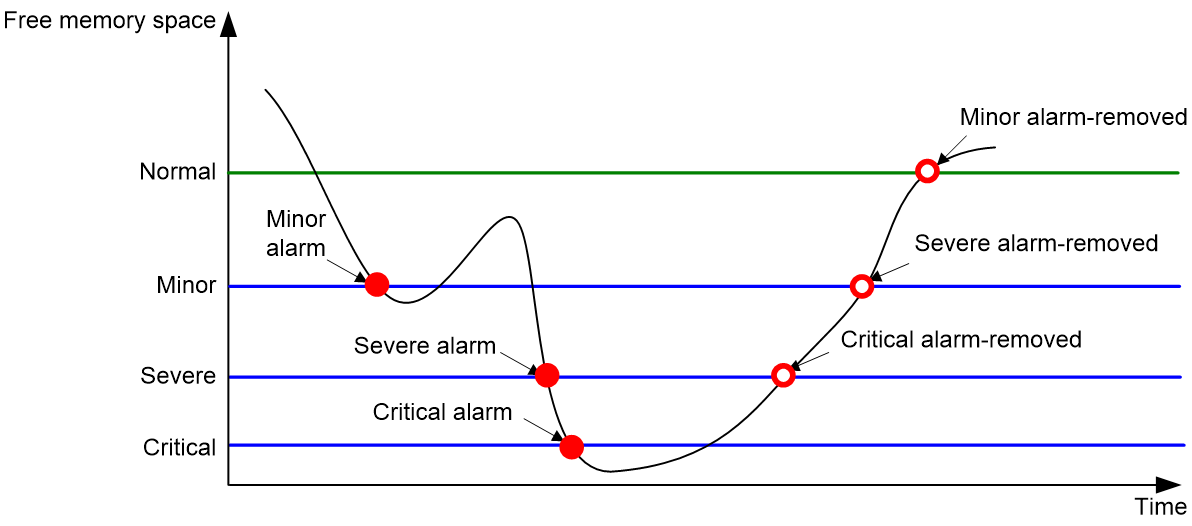
To ensure correct operation and improve memory efficiency, the system monitors the amount of free memory space in real time. If the amount of free memory space reaches the minor, severe, or critical alarm threshold, the system issues an alarm to affected service modules and processes.
As shown in Table 1 and Figure 2, the system supports the following free-memory thresholds:
· Normal state threshold.
· Minor alarm threshold.
· Severe alarm threshold.
· Critical alarm threshold.
Table 1 Memory alarm notifications and memory alarm-removed notifications
|
Notification |
Triggering condition |
Remarks |
|
Minor alarm notification |
The amount of free memory space decreases to or below the minor alarm threshold. |
After generating and sending a minor alarm notification, the system does not generate and send any additional minor alarm notifications until the minor alarm is removed. |
|
Severe alarm notification |
The amount of free memory space decreases to or below the severe alarm threshold. |
After generating and sending a severe alarm notification, the system does not generate and send any additional severe alarm notifications until the severe alarm is removed. |
|
Critical alarm notification |
The amount of free memory space decreases to or below the critical alarm threshold. |
After generating and sending a critical alarm notification, the system does not generate and send any additional critical alarm notifications until the critical alarm is removed. |
|
Critical alarm-removed notification |
The amount of free memory space increases above the severe alarm threshold. |
N/A |
|
Severe alarm-removed notification |
The amount of free memory space increases above the minor alarm threshold. |
N/A |
|
Minor alarm-removed notification |
The amount of free memory space increases above the normal state threshold. |
N/A |
Figure 2 Memory alarm notifications and alarm-removed notifications
Procedure
1. Enter system view.
system-view
2. Set the memory usage threshold.
memory-threshold [ slot slot-number [ cpu cpu-number ] ] usage memory-threshold
By default, the memory usage threshold is 100%.
3. Set the free-memory thresholds.
memory-threshold [ slot slot-number [ cpu cpu-number ] ] [ ratio ] minor minor-value severe severe-value critical critical-value normal normal-value
The following matrixes show the default settings on the devices:
|
Models |
Default |
|
MSR1008 |
· Minor alarm threshold—96 MB. · Severe alarm threshold—64 MB. · Critical alarm threshold—48 MB. · Normal state threshold—128 MB. |
|
MSR2630E-X1 |
· Minor alarm threshold—96 MB. · Severe alarm threshold—64 MB. · Critical alarm threshold—48 MB. · Normal state threshold—128 MB. |
|
MSR3610E-X1, MSR3610E-X1-DP |
· Minor alarm threshold—96 MB. · Severe alarm threshold—64 MB. · Critical alarm threshold—48 MB. · Normal state threshold—128 MB. |
|
Models |
Default |
|
MSR2660-XS |
· Minor alarm threshold—96 MB. · Severe alarm threshold—64 MB. · Critical alarm threshold—48 MB. · Normal state threshold—128 MB. |
|
MSR2680-XS |
· Minor alarm threshold—96 MB. · Severe alarm threshold—64 MB. · Critical alarm threshold—48 MB. · Normal state threshold—128 MB. |
|
Models |
Default |
|
MSR2600-12X-WiNet |
· Minor alarm threshold—96 MB. · Severe alarm threshold—64 MB. · Critical alarm threshold—48 MB. · Normal state threshold—128 MB. |
|
MSR2610-13X-WiNet |
· Minor alarm threshold—96 MB. · Severe alarm threshold—64 MB. · Critical alarm threshold—48 MB. · Normal state threshold—128 MB. |
Displaying memory usage monitoring information
Perform display tasks in any view.
· Display memory usage information.
display memory [ summary ] [ slot slot-number [ cpu cpu-number ] ]
· Display memory alarm thresholds and statistics.
display memory-threshold [ slot slot-number [ cpu cpu-number ] ]
Setting the port status detection timer
About this task
The device starts a port status detection timer when a port is shut down by a protocol. If the port has been in down state before the timer expires, the device will set the port status to the port's physical status.
Procedure
1. Enter system view.
system-view
2. Set the port status detection timer.
shutdown-interval time
The default setting is 30 seconds.
Verifying and diagnosing transceiver modules
Verifying transceiver modules
About this task
You can use one of the following methods to verify the genuineness of a transceiver module:
· Display the key parameters of a transceiver module, including its transceiver type, connector type, central wavelength of the transmit laser, transfer distance, and vendor name.
· Display its electronic label. The electronic label is a profile of the transceiver module and contains the permanent configuration, including the serial number, manufacturing date, and vendor name. The data was written to the transceiver module or the device's storage component during debugging or testing of the transceiver module or device.
The device regularly checks transceiver modules for their vendor names. If a transceiver module does not have a vendor name or the vendor name is not H3C, the device repeatedly outputs traps and log messages. For information about logging rules, see "Configuring the information center."
Procedure
To verify transceiver modules, execute the following commands in any view:
· Display the key parameters of transceiver modules.
display transceiver interface [ interface-type interface-number ]
· Display the electrical label information of transceiver modules.
display transceiver manuinfo interface [ interface-type interface-number ]
Diagnosing transceiver modules
About this task
The device provides the alarm and digital diagnosis functions for transceiver modules. When a transceiver module fails or is not operating correctly, you can perform the following tasks:
· Check the alarms that exist on the transceiver module to identify the fault source.
· Examine the key parameters monitored by the digital diagnosis function, including the temperature, voltage, laser bias current, TX power, and RX power.
Procedure
To diagnose transceiver modules, execute the following commands in any view:
· Display transceiver alarms.
display transceiver alarm interface [ interface-type interface-number ]
· Display the current values of the digital diagnosis parameters on transceiver modules.
display transceiver diagnosis interface [ interface-type interface-number ]
Enabling alarm upon detection of a third-party transceiver module
About this task
Upon installation of a transceiver module, the system reads vendor information from it to determine whether it is a third-party transceiver module. If it is a third-party module, the device sends a trap notification and a log message to notify the user of replacing it with an H3C transceiver module. You can use display transceiver manuinfo to obtain vendor information for a transceiver module.
Procedure
1. Enter system view.
system-view
2. Enable alarm upon detection of a third-party transceiver module.
transceiver third-party alarm enable
By default, alarm is enabled upon detection of a third-party transceiver module.
Displaying device hardware information
To display device hardware information, execute the following command in any view:
display device [ flash | usb ] [ slot slot-number [ subslot subslot-number ] | verbose ]
Displaying device hardware electronic label information
To display hardware electronic label information for the device, execute the following command in any view:
display device manuinfo [ slot slot-number [ subslot subslot-number ] ]
Displaying device hardware alarm information
To display device hardware alarm information, execute the following command in any view:
display alarm [ slot slot-number ]