- Table of Contents
- Related Documents
-
| Title | Size | Download |
|---|---|---|
| 02-Telemetry stream configuration | 71.88 KB |
Contents
Restrictions and guidelines: Telemetry stream configuration
Configuring basic telemetry stream functions
Display and maintenance commands for telemetry stream
Configuring telemetry stream
About telemetry stream
Telemetry stream is a network monitoring technology used to collect data from devices. It continuously streams data to a collector.
Telemetry stream supports collecting the input interface, timestamp, and output interface of traffic.
How telemetry stream works
The working mechanism of telemetry stream is as follows:
1. Telemetry stream samples a matching packet on the input interface and copies it to the telemetry stream processor in the device. The telemetry stream processor adds the input interface information to the packet.
2. The telemetry stream processor encapsulates the packet and routes it to the collector.
The collector can calculate the path and delay information according to the collected data from multiple nodes.
Telemetry stream timestamping
The device carries the timestamp in its packets sent to the collector. The collector can use the timestamp information collected from multiple nodes to calculate the delay introduced when packets are forwarded along the path.
Restrictions and guidelines: Telemetry stream configuration
Only SF interface modules support this feature.
For the timestamp to be normally used and accurate, configure PTP on the device. Only the default MDCs support PTP configuration, and non-default MDCs do not support PTP configuration. The device supports MDCs only when it is operating in standalone mode. For more information about MDCs, see MDC configuration in Virtual Technologies Configuration Guide. For more information about PTP, see PTP configuration in Network Management and Monitoring Guide.
Prerequisites
Configure routing to make sure the devices can reach each other.
Configuring basic telemetry stream functions
About this task
The device copies an original packet on the input interface and sends the copy to the telemetry stream processor in the device. The telemetry stream processor adds the input and output interface information to the packet, encapsulates it, and routes it to the collector.
Too many original packets will overwhelm the Telemetry processor and even cause it to drop packets. To address this problem, you can use an ACL or sampler on the input interface to reduce the packets sent to the collector. Only packets matching a permit ACL rule or sampled packets are sent to the collector.
If the data portion of original packets is large, you can enables the truncation function to save the link bandwidth consumed between the device and the collector and reduce the parsing load of the collector. The truncation function truncates the packets before sending them to the collector. The truncated packets retain complete input interface, output interface, and timestamp information.
Procedure
a. Enter system view.
system-view
b. Specify a device ID.
telemetry stream device-id address
By default, no device ID is specified.
2. Configure addressing parameters to encapsulate in the packets sent to the collector.
telemetry stream collector source source-address destination destination-address source-port source-port destination-port destination-port [ vpn-instance vpn-instance-name ] [ truncation ]
By default, no addressing parameters are configured.
3. Configure a telemetry stream action on the input interface.
a. Enter interface view.
interface interface-type interface-number
b. Configure a telemetry stream action on the interface.
telemetry stream action action-id [ acl [ ipv6 | mac | user-defined ] { acl-number | name acl-name } | sampler sampler-name ] *
By default, no telemetry stream action is configured.
c. Return to system view.
quit
For information about ACLs, see ACL and QoS Configuration Guide.
For information about samplers, see Network Management and Monitoring Configuration Guide.
4. Enable telemetry stream.
telemetry stream enable
By default, telemetry stream is enabled.
Display and maintenance commands for telemetry stream
Execute display commands in any view.
|
Task |
Command |
|
Display ACL configuration and match statistics. |
display acl [ ipv6 | mac | user-defined ] { acl-number | all | name acl-name } For more information about this command, see ACL and QoS Command Reference. |
|
Display the configuration of samplers. |
In standalone mode: display sampler [ sampler-name ] [ slot slot-number ] In IRF mode: display sampler [ sampler-name ] [ chassis chassis-number slot slot-number ] For more information about this command, see Network Management and Monitoring Command Reference. |
|
Display telemetry stream configuration. |
display telemetry stream |
Telemetry stream configuration examples
Example: Configuring telemetry stream
Network configuration
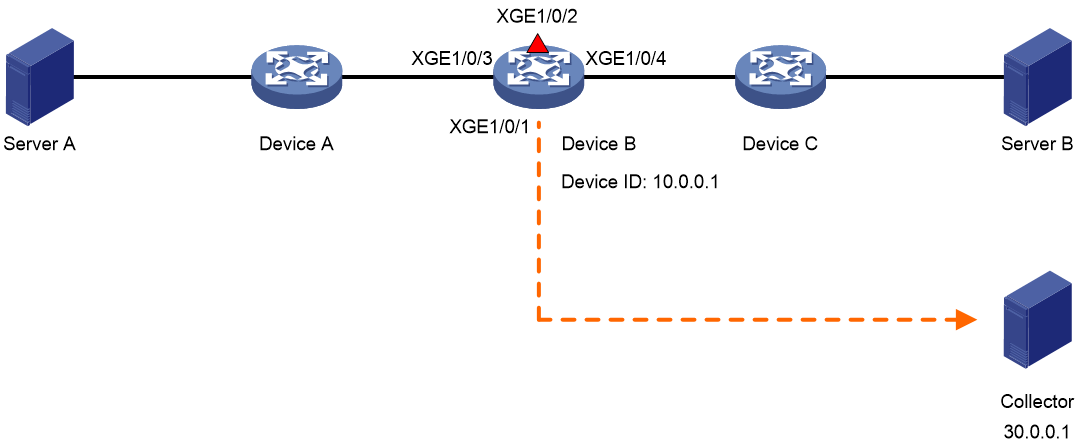
As shown in Figure 1, configure telemetry stream on Device B for the collector to calculate the delay when packets are forwarded by Device B.
Prerequisites
Assign IP addresses to interfaces and configure routing protocols. (Details not shown.)
Procedure
# Specify 1.1.1.1 as the device ID.
<DeviceB> system-view
[DeviceB] telemetry stream device-id 1.1.1.1
# Configure addressing parameters to encapsulate in telemetry stream packets sent to the collector.
[DeviceB] telemetry stream collector source 20.0.0.2 destination 30.0.0.1 source-port 12 destination-port 14
# Create sampler samp in random sampling mode, and set the sampling rate to 8. One packet from 256 (2 to the 8th power) packets is selected.
[DeviceB] sampler samp mode random packet-interval n-power 8
# Create IPv4 basic ACL 2000, and configure a rule to match packets with source IP address 192.168.1.2.
[DeviceB] acl basic 2000
[DeviceB-acl-ipv4-basic-2000] rule permit source 192.168.1.2 0
[DeviceB-acl-ipv4-basic-2000] quit
# Configure telemetry stream action 1 to use ACL 2000 and sampler samp on Ten-GigabitEthernet 3/0/3.
[DeviceB] interface ten-gigabitethernet 3/0/3
[DeviceB-Ten-GigabitEthernet3/0/3] telemetry stream action 1 acl 2000 sampler samp
[DeviceB-Ten-GigabitEthernet3/0/3] quit
# Enable telemetry stream.
[DeviceB] telemetry stream enable
Verifying the configuration
# Display the telemetry stream configuration on Device B.
[DeviceB] display telemetry stream
Telemetry stream status : Enabled
Telemetry stream timestamp status: Disabled
Telemetry stream device-id : 1.1.1.1
Telemetry stream action:
Ten-GigabitEthernet3/0/3:
Telemetry stream action 1:
ACL : 2000
Sampler: samp
Telemetry stream collector: (Configuration succeeded)
Source IP : 20.0.0.2
Destination IP : 30.0.0.1
Source port : 12
Destination port: 14
