- Table of Contents
-
- 20-Network Management and Monitoring Configuration Guide
- 00-Preface
- 01-Ping and tracert configuration
- 02-System debugging configuration
- 03-NQA configuration
- 04-iNQA configuration
- 05-NTP configuration
- 06-SNMP configuration
- 07-RMON configuration
- 08-Sampler configuration
- 09-Mirroring configuration
- 10-NetStream configuration
- 11-IPv6 NetStream configuration
- 12-Cloud connection configuration
- 13-iFIT configuration
- 14-Packet capture configuration
- Related Documents
-
| Title | Size | Download |
|---|---|---|
| 13-iFIT configuration | 286.42 KB |
Configuring a measurement mode
Configuring a measurement period
Configuring a transmit point and the egress point
Display and maintenance commands for iFIT
Example: Configuring iFIT in an EVPN L3VPN network
Example: Configuring iFIT in an IPv4 L3VPN over SRv6 network
Example: Configuring iFIT in an IPv6 EVPN L3VPN over SRv6 network
Configuring iFIT
About iFIT
In-situ Flow Information Telemetry (iFIT) determines network performance by measuring the packet loss and packet delay of service packets transmitted on an SRv6 or G-SRv6 network. iFIT is easy to deploy and provides an accurate assessment of network performance.
Application scenarios
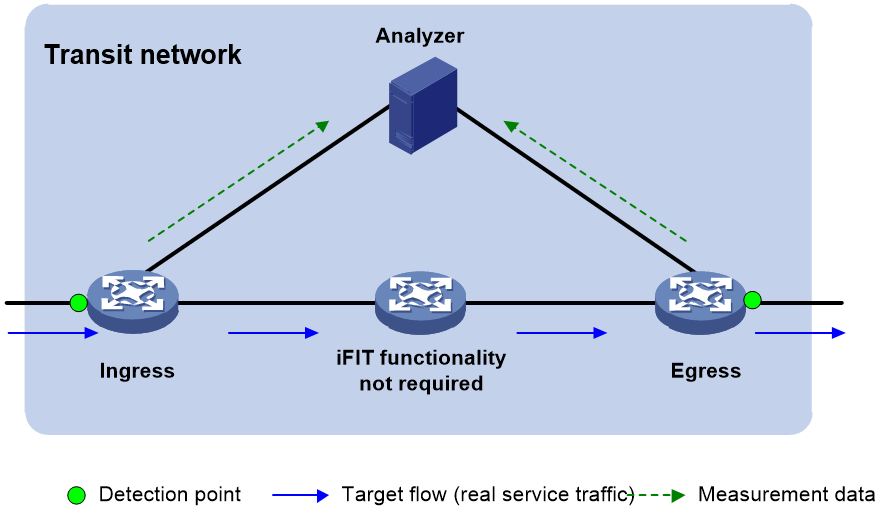
End-to-end measurement
To measure the packet loss and packet delay on the entire network, use end-to-end measurement. As shown in Figure 1, iFIT measures whether packet loss or packet delay occurs between the ingress point (where the target flow enters the IP network) and the egress point (where the flow leaves the network).
Figure 1 End-to-end measurement
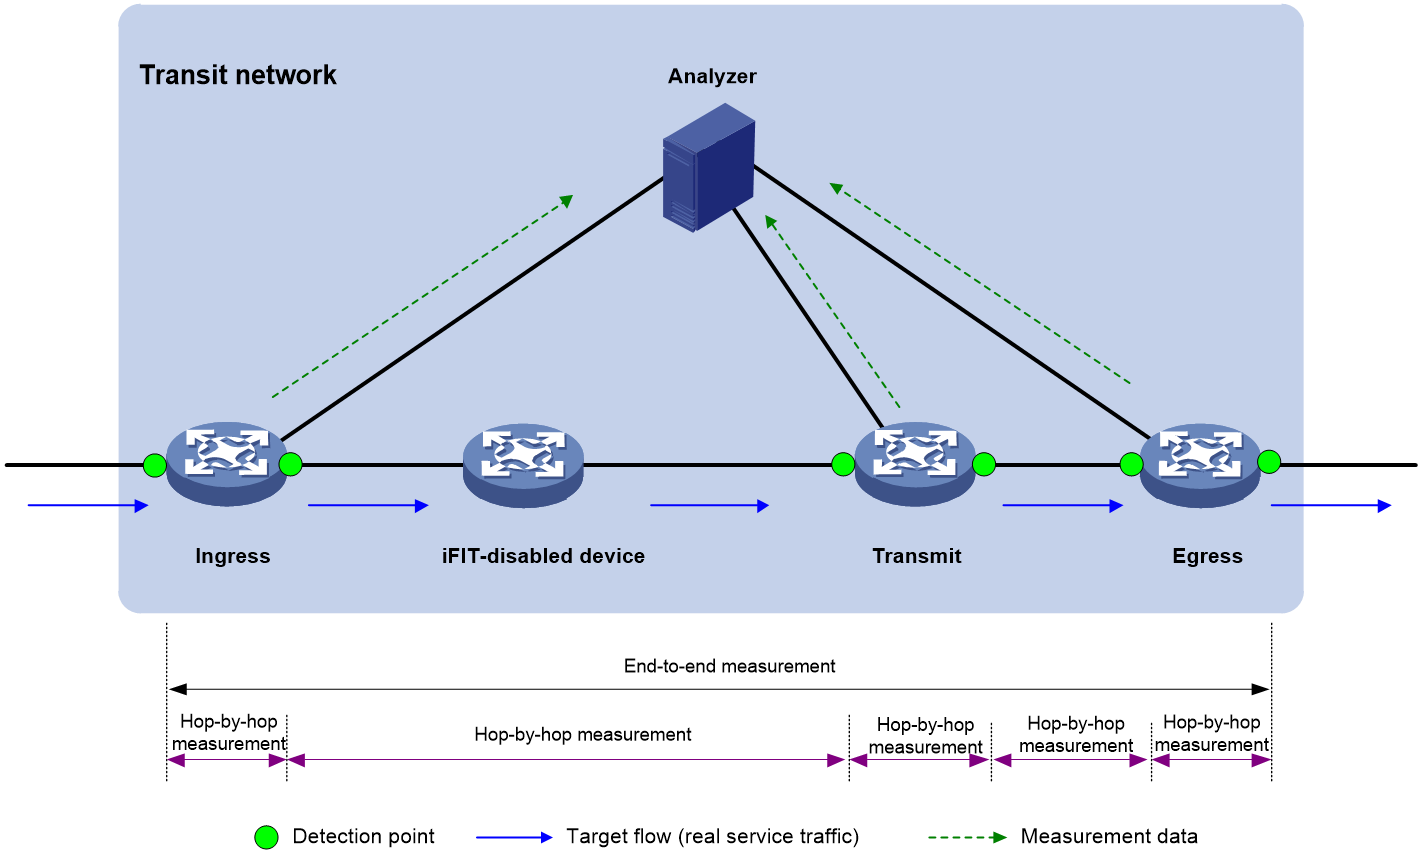
Hop-by-hop measurement
To accurately locate the packet loss and packet delay of each network node, use hop-by-hop measurement. To locate the faulty node, you can divide an end-to-end network into smaller measurement spans. As shown in Figure 2, iFIT measures whether the packet loss and packet delay occurs between the ingress point and egress point, ingress point and transmit point, transmit point and egress point.
Figure 2 Hop-by-hop measurement
iFIT architecture
Figure 1 and Figure 2 show the important iFIT concepts including target flow, transit network, and measurement system.
Target flow
iFIT provides statistics on a per-flow basis. The target flows can be divided into the following types:
· Static flow—A static flow is specified on the ingress point and encapsulated with iFIT header. You can specify a flow on the ingress point by using any combination of the following items: source IP address/segment, source port number, destination IP address/segment, destination port number, protocol type, DSCP value, and VPN instance.
An iFIT header contains fields to carry device ID, flow ID, measurement period, measurement mode, status of packet delay measurement, and status of packet loss measurement.
¡ A device ID uniquely identifies a device in an iFIT measurement network.
¡ A flow ID is automatically generated on the ingress point and passed to the transmit points and egress point. A flow ID and a device ID uniquely identify a flow together.
¡ Within a measurement period, the device starts iFIT measurement, collects and reports the measurement data.
¡ The available measurement mode includes end-to-end measurement and hop-by-hop measurement.
· Dynamic flow—A dynamic flow is learnt by the transit points and egress point after they parse the received packets.
The device uses the device ID and flow ID in the iFIT header to identify the flow. If the device does not receive the packets using the same device ID and the same flow ID for a period of time, the device will delete the dynamic flow entry.
Detection point
A detection point is an interface where iFIT measurement is performed. You can specify detection points as required.
Transit network
The transit network only bears target flows. The target flows are not generated or terminated on the transit network. The transit network can only be a Layer 3 network. Each node on the transit network must be reachable.
Measurement system
The measurement system includes the following device role:
· The ingress point refers to the point that the flow enters the transit network. It filters the target flow, adds iFIT headers to the packets of the flow, collects packet statistics and reports packet statistics to the analyzer.
· A transmit point identifies the target flow by the iFIT header and reports the measurement statistics to the analyzer according to the measurement mode in the iFIT header.
· The egress point identifies the target flow by the iFIT header, reports the measurement statistics to the analyzer, and removes the iFIT header from the packet.
· The analyzer collects the statistics reported by the ingress point, transmit points, and egress point for data summarization and calculation.
Operating mechanism
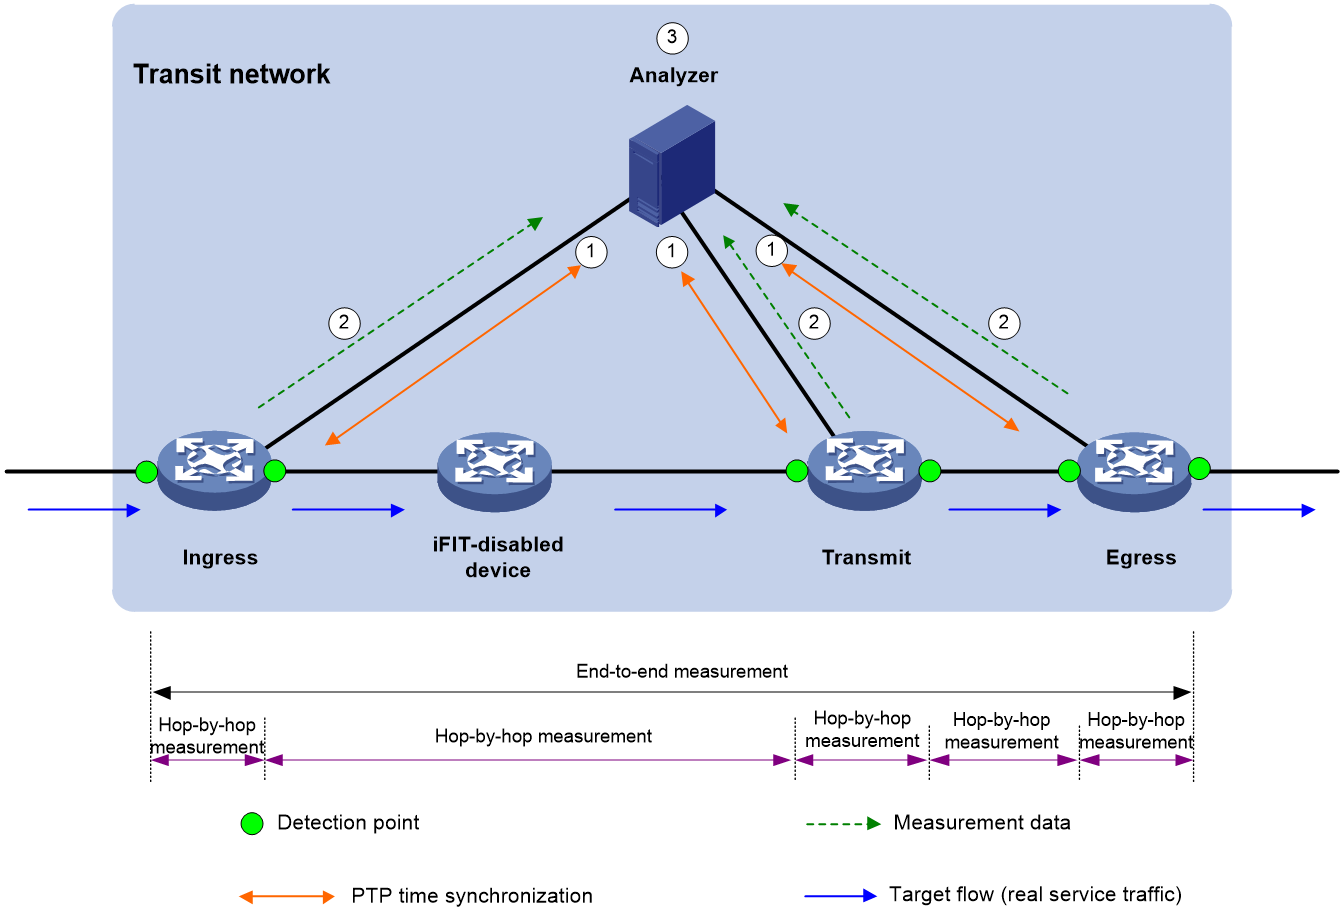
Time synchronization mechanism
Before starting the iFIT measurement, make sure all devices are time synchronized. Therefore, all iFIT-enabled devices can use the same measurement period to report the packet statistics to the analyzer. As a best practice, the analyzer and all iFIT-enabled devices are time synchronized to facilitate management and maintenance.
You can use NTP to synchronize time between devices. Time synchronized through NTP is accurate to milliseconds. Follow these guidelines if you use NTP:
· For iFIT measurement on only packet loss, you can use NTP.
· For iFIT measurement on the delay, because network delay is related to distance of physical links and network status, the transmission delay on links might be less than one millisecond. In this case, using NTP might affect the accuracy of iFIT measurement on the delay.
For more information about NTP, see "Configuring NTP".
Packet loss measurement mechanism
The number of incoming packets and that of outgoing packets in a network should be equal within a measurement period. If they are not equal, packet loss occurs in the transit network.
Packet delay measurement mechanism
When a packet pass through multiple detection points, each point will record the timestamp when the packet passes through the point and report the recorded timestamp to the analyzer. Then the analyzer can use the timestamp values reported by different detection points to calculate the packet delay.
Measurement data reporting mechanism
iFIT-enabled devices push the measurement data to the analyzer by using the gRPC protocol.
Currently, only gRPC dial-out mode is supported. In this mode, iFIT-enabled devices act as gRPC clients and the analyzer acts as a gRPC server (also called a gRPC collector in the gRPC protocol), The iFIT-enabled devices will initiates gRPC connections to the analyzer and push iFIT data to the analyzer.
Working mechanism
The following illustrates the working mechanism of hop-by-hop measurement. No transmit points exist in end-to-end measurement but end-to-end measurement works similarly as hop-by-hop measurement.
As shown in Figure 3, the flow passes through four devices. Three devices are enabled with iFIT. The iFIT measurement works as follows:
1. The analyzer synchronizes the time with all iFIT-enabled devices through the NTP protocol.
2. The iFIT-enabled devices takes the following actions:
a. The ingress point parses the packets to identify the target flow. It encapsulates iFIT headers to the packets, counts the number of packets, and reports the packet quantity and timestamp to the analyzer through gRPC periodically.
The ingress point is the interface bound to the target flow.
b. A transmit point counts the number of packets containing iFIT headers and reports the packet quantity and timestamp to the analyzer through gRPC periodically.
When the target flow passes through an iFIT-enabled device, the interfaces where the target flow enters the iFIT-enabled device and leaves the iFIT-enabled device are transmit points.
c. The egress point parses the packets to identify the target flow. It counts the number of packets containing iFIT headers, reports the packet quantity and timestamp to the analyzer through gRPC periodically, removes iFIT headers from the packets and forwards the packets.
When the target flow leaves the transit network, the interface where the target flow leaves the iFIT-enabled device is the egress point.
3. The analyzer calculate the packet delay for the target flow of the same period and same instance.
Restrictions and guidelines
An iFIT instance monitors only one flow. If you configure flows multiple times for an iFIT instance, the most recent configuration takes effect.
For the flows to be monitored by different instances, the flow attributes must not be identical and cannot conflict to avoid inaccurate measurement result.
As a best practice, configure iFIT first on the transmit points and the egress point and then the ingress point. Thus, the measurement results of the previous measurement periods will not affected if iFIT measurement starts on the ingress point but not on the transmit points and the egress point.
Modifying the iFIT instance or restarting the ingress point will cause flow ID change, which might cause inaccurate measurement data or no data in several measurement periods.
Prerequisites
Before configuring iFIT, make sure the analyzer and iFIT-enabled devices are time synchronized through NTP. For more information about NTP, see "Configuring NTP."
To enable the iFIT-enabled devices to report the measurement results to the analyzer, configure gRPC on the analyzer and iFIT-enabled devices. For more information about gRPC, see gRPC configuration in Telemetry Configuration Guide.
Configuring the ingress point
Tasks at a glance
To configure the ingress point, perform the following tasks:
· Configuring a detection point
· Configuring a measurement mode
· Configuring a measurement period
Configuring iFIT
1. Enter system view.
system-view
2. Enable the iFIT functionality globally and enter its view, or enter the existing iFIT view.
ifit enable
By default, the iFIT functionality is disabled.
3. Specify a device ID.
device-id device-id
By default, no device ID is specified.
A device ID is required and uniquely identifies a device in an iFIT measurement network.
Creating an iFIT instance
1. Enter system view.
system-view
2. Enter iFIT view.
ifit enable
3. Create an iFIT instance and enter its view.
instance instance-name
Configuring a flow
1. Enter system view.
system-view
2. Enter iFIT view.
ifit enable
3. Create an iFIT instance and enter its view.
instance instance-name
4. Specify a static flow to be monitored by the instance.
IPv4:
flow unidirection source-ip src-ip-address [ src-mask-length ] destination-ip dest-ip-address [ dest-mask-length ] [ protocol { { tcp | udp | sctp } [ source-port src-port-number ] [ destination-port dest-port-number ] | protocol-number } ] [ dscp dscp-value ] [ vpn-instance vpn-instance-name ]
IPv6:
flow unidirection source-ipv6 src-ipv6-address [ src-prefix-length ] destination-ipv6 dest-ipv6-address [ dest-prefix-length ] [ protocol { { tcp | udp | sctp } [ source-port src-port-number ] [ destination-port dest-port-number ] | protocol-number } ] [ dscp dscp-value ] [ vpn-instance vpn-instance-name ]
By default, no static flow is specified for an iFIT instance.
Configuring a detection point
About this task
Before enabling iFIT measurement on the ingress point of an instance, execute this command to bind an interface to the instance. After you bind an interface to an instance, iFIT parses the packets passing through the interface to identify the target packets and add an iFIT header to each target packets. Meanwhile, iFIT will count the number of target packets, and send the packet count and timestamp to the analyzer at intervals through gRPC.
Procedure
1. Enter system view.
system-view
2. Enter iFIT view.
ifit enable
3. Create an iFIT instance and enter its view.
instance instance-name
4. Bind an interface to the instance.
bind interface interface-type interface-number
By default, an instance is not bound to any interface.
Before enabling iFIT measurement on the ingress point of an instance, execute this command to bind an interface to the instance.
Configuring a measurement mode
1. Enter system view.
system-view
2. Enter iFIT view.
ifit enable
3. Create an iFIT instance and enter its view.
instance instance-name
4. Specify an iFIT measurement mode.
measure mode { e2e | trace }
By default, end-to-end measurement is used.
Configuring a measurement period
1. Enter system view.
system-view
2. Enter iFIT view.
ifit enable
3. Create an iFIT instance and enter its view.
instance instance-name
4. Specify the measurement period for the iFIT instance.
period period
By default, the measurement period for an iFIT instance is 30 seconds.
Enabling iFIT measurement
About this task
You can configure packet loss measurement and packet delay measurement as required.
Procedure
1. Enter system view.
system-view
2. Enter iFIT view.
ifit enable
3. Create an iFIT instance and enter its view.
instance instance-name
4. (Optional.) Disable packet delay measurement.
delay-measure disable
By default, packet delay measurement is enabled.
5. Enable iFIT measurement for the iFIT instance.
measure enable
By default, iFIT measurement for an iFIT instance is disabled.
Configuring a transmit point and the egress point
Tasks at a glance
Transmit points are required only for hop-by-hop measurement. For end-to-end measurement, do not configure transmit points.
To configure a transmit point or the ingress point, perform the following tasks:
· (Optional.) Managing a dynamic flow
Configuring iFIT
1. Enter system view.
system-view
2. Enable the iFIT functionality globally and enter its view.
ifit enable
By default, the iFIT functionality is disabled.
Managing a dynamic flow
1. Enter system view.
system-view
2. Enable the iFIT functionality globally and enter its view.
ifit enable
3. Specify the aging time for dynamic flows.
dynamic-flow aging-time multi-value
By default, the aging time for dynamic flows is 10 times the measurement period and it cannot be less than 5 minutes.
4. Delete iFIT dynamic flows.
delete dynamic-flow { device-id device-id flow-id flow-id | all }
Display and maintenance commands for iFIT
Execute display commands in any view.
|
Task |
Command |
|
Display dynamic flow information. |
display ifit flow dynamic [ device-id device-id flow-id flow-id ] |
|
Display static flow information. |
display ifit flow static [ flow-id flow-id ] |
|
Display global information about iFIT target flows. |
display ifit global-information |
|
Display iFIT instance information. |
display ifit instance [ instance-name ] |
|
Display statistics about an iFIT flow for the most recent 10 measurement periods. |
display ifit statistic device-id device-id flow-id flow-id [ verbose ] |
|
Clear iFIT statistics for the most recent 10 measurement periods. |
reset ifit statistic [ device-id device-id flow-id flow-id | instance instance-name] |
iFIT configuration examples
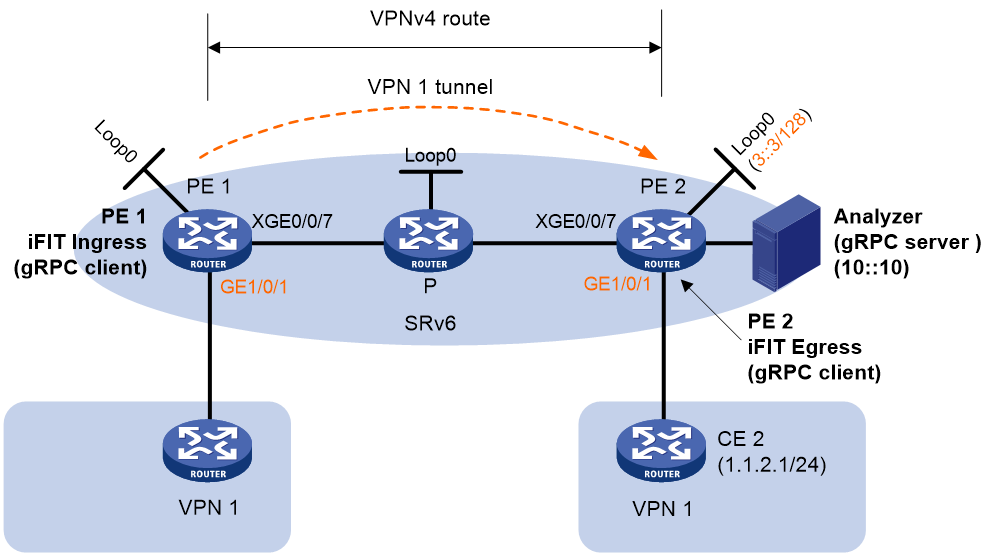
Example: Configuring iFIT in an EVPN L3VPN network
As shown in Figure 4:
· Configure IPv4 EVPN L3VPN for different sites of a VPN instance to communicate with each other.
· Configure the CE and the PE of each site to use EBGP to exchange VPN routes.
· Configure the PEs to communicate through OSPF and to exchange BGP EVPN routes through MP-IBGP.
· Configure iFIT to monitor the occurrence of packet loss and packet delay value when the flow passes through the VPN 1 tunnel.

Prerequisites
1. Configure EVPN L3VPN. (Details not shown.)
For information about configuring EVPN L3VPN, see EVPN L3VPN configuration in EVPN Configuration Guide.
2. Configure NTP on PE 1 and PE 2 for clock synchronization. (Details not shown.)
For information about configuring NTP, see "Configuring NTP."
Procedure
1. Configure gRPC:
# Enable the gRPC service.
<PE1> system-view
[PE1] grpc enable
# Create a sensor group named test, and add sensor path ifit/flowstatistics/flowstatistic.
[PE1] telemetry
[PE1-telemetry] sensor-group test
[PE1-telemetry-sensor-group-test] sensor path ifit/flowstatistics/flowstatistic depth 2
[PE1-telemetry-sensor-group-test] quit
# Create a destination group named collector1. Specify a collector that uses IPv4 address 10.10.10.10 and port number 50050.
[PE1-telemetry] destination-group collector1
[PE1-telemetry-destination-group-collector1] ipv4-address 10.10.10.10 port 50050
[PE1-telemetry-destination-group-collector1] quit
# Configure a subscription named A to bind sensor group test with destination group collector1. Set the sampling interval to 5 seconds.
[PE1-telemetry] subscription A
[PE1-telemetry-subscription-A] sensor-group test sample-interval 5
[PE1-telemetry-subscription-A] destination-group collector1
[PE1-telemetry-subscription-A] quit
[PE1-telemetry] quit
2. Configure iFIT:
# Enable the iFIT functionality.
[PE1] ifit enable
[PE1-ifit] device-id 1
# Configure instance a to monitor the unidirectional flow passing through the VPN 1 tunnel.
[PE1-ifit] instance a
[PE1-ifit-instance-a] flow unidirection source-ip 1.1.1.1 24 destination-ip 1.1.2.1 24 vpn-instance vpn1
# Bind interface Ten-GigabitEthernet0/0/6 to instance a.
[PE1-ifit-instance-a] bind interface ten-gigabitethernet 0/0/6
# Specify 10 seconds as the measurement period.
[PE1-ifit-instance-a] period 10
# Specify end-to-end measurement as the measurement mode.
[PE1-ifit-instance-a] measure mode e2e
# Enable iFIT measurement.
[PE1-ifit-instance-a] measure enable
[PE1-ifit-instance-a] quit
[PE1-ifit] quit
3. Configure PE 2:
# Configure gRPC.
Use the same procedure to configure gRPC on PE 2 as you configure gRPC on PE 1.
# Enable the iFIT functionality.
<PE2> system-view
[PE2] ifit enable
Verifying the configuration
1. View iFIT statistics on PE 1.
[PE1] display ifit statistic device-id 1 flow-id 3
Period ID Direction Interface PktCount Timestamp(sec, nsec)
163059918 Ingress XGE0/0/6 4124 1630599180, 1889782
163059919 Ingress XGE0/0/6 4124 1630599190, 1901494
163059920 Ingress XGE0/0/6 4124 1630599200, 1912118
2. View iFIT statistics on PE 2.
[PE2] display ifit statistic device-id 1 flow-id 3
Period ID Direction Interface PktCount Timestamp(sec, nsec)
163059918 Egress XGE0/0/6 4124 1630599180, 1948185
163059919 Egress XGE0/0/6 4124 1630599190, 1959405
163059920 Egress XGE0/0/6 4120 1630599200, 1968503
3. Packet loss occurs in period 163059920 by viewing iFIT statistics on the analyzer.
Example: Configuring iFIT in an IPv4 L3VPN over SRv6 network
Network configuration
As shown in Figure 5, the backbone network is an IPv6 network, and VPN 1 is an IPv4 network. Deploy MPLS L3VPN over SRv6 between PE 1 and PE 2 and use an SRv6 tunnel to transmit VPNv4 traffic between the PEs.
· Configure EBGP to exchange VPN routing information between the CEs and PEs.
· Configure IPv6 IS-IS on the PEs in the same AS to realize IPv6 network connectivity.
· Configure MP-IBGP to exchange VPNv4 routing information between the PEs.
· Configure iFIT to monitor the occurrence of packet loss and packet delay value when the flow passes through the VPN 1 tunnel.
Prerequisites
1. Configure IPv4 L3VPN over SRv6. (Details not shown.)
For information about configuring MPLS L3VPN over SRv6, see IP L3VPN over SRv6 configuration in Segment Routing Configuration Guide.
2. Configure NTP on PE 1 and PE 2 for clock synchronization. (Details not shown.)
For information about configuring NTP, see "Configuring NTP."
Procedure
1. Configure gRPC:
# Enable the gRPC service.
<PE1> system-view
[PE1] grpc enable
# Create a sensor group named test, and add sensor path ifit/flowstatistics/flowstatistic.
[PE1] telemetry
[PE1-telemetry] sensor-group test
[PE1-telemetry-sensor-group-test] sensor path ifit/flowstatistics/flowstatistic depth 2
[PE1-telemetry-sensor-group-test] quit
# Create a destination group named collector1. Specify a collector that uses IPv6 address 10::10 and port number 50050.
[PE1-telemetry] destination-group collector1
[PE1-telemetry-destination-group-collector1] ipv6-address 10::10 port 50050
[PE1-telemetry-destination-group-collector1] quit
# Configure a subscription named A to bind sensor group test with destination group collector1. Set the sampling interval to 5 seconds.
[PE1-telemetry] subscription A
[PE1-telemetry-subscription-A] sensor-group test sample-interval 5
[PE1-telemetry-subscription-A] destination-group collector1
[PE1-telemetry-subscription-A] quit
[PE1-telemetry] quit
2. Configure iFIT:
# Enable the iFIT functionality.
[PE1] ifit enable
[PE1-ifit] device-id 1
# Configure instance a to monitor the unidirectional flow passing through the VPN 1 tunnel.
[PE1-ifit] instance a
[PE1-ifit-instance-a] flow unidirection source-ip 1.1.1.1 24 destination-ip 1.1.2.1 24 vpn-instance vpn1
# Bind interface Ten-GigabitEthernet0/0/6 to instance a.
[PE1-ifit-instance-a] bind interface ten-gigabitethernet 0/0/6
# Specify 10 seconds as the measurement period.
[PE1-ifit-instance-a] period 10
# Enable iFIT measurement.
[PE1-ifit-instance-a] measure enable
[PE1-ifit-instance-a] quit
[PE1-ifit] quit
3. Configure PE 2:
# Configure gRPC.
Use the same procedure to configure gRPC on PE 2 as you configure gRPC on PE 1.
# Enable the iFIT functionality.
<PE2> system-view
[PE2] ifit enable
Verifying the configuration
1. View iFIT statistics on PE 1.
[PE1-ifit-instance-a] display ifit statistic device-id 1 flow-id 2
Period ID Direction Interface PktCount Timestamp(sec, nsec)
163059918 Ingress XGE0/0/6 4124 1630599180, 1889782
163059919 Ingress XGE0/0/6 4124 1630599190, 1901494
163059920 Ingress XGE0/0/6 4124 1630599200, 1912118
2. View iFIT statistics on PE 2.
[PE2] display ifit statistic device-id 1 flow-id 2
Period ID Direction Interface PktCount Timestamp(sec, nsec)
163059918 Egress XGE0/0/6 4124 1630599180, 1948185
163059919 Egress XGE0/0/6 4124 1630599190, 1959405
163059920 Egress XGE0/0/6 4120 1630599200, 1968503
3. Packet loss occurs in period 163059920 by viewing iFIT statistics on the analyzer.
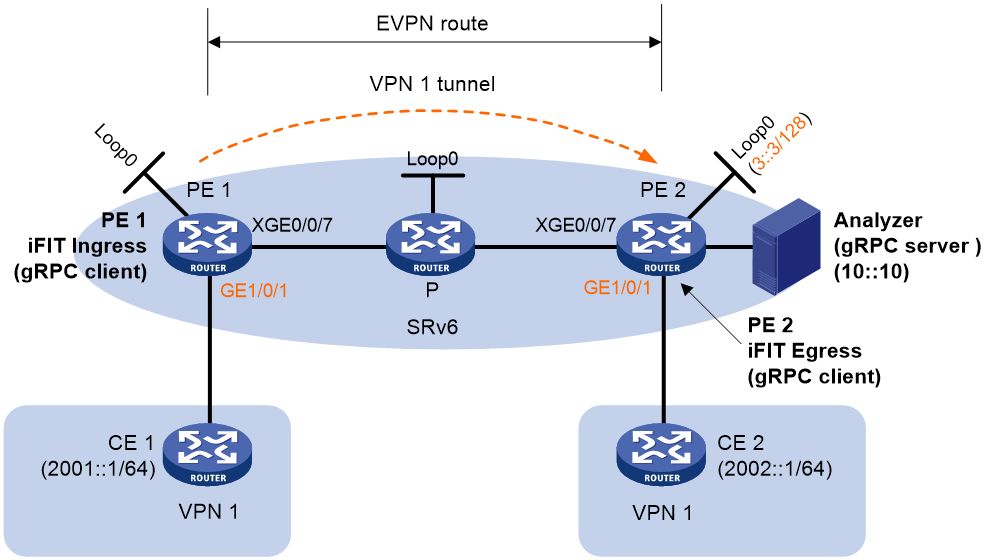
Example: Configuring iFIT in an IPv6 EVPN L3VPN over SRv6 network
Network configuration
As shown in Figure 6, the backbone network is an IPv6 network. Deploy EVPN L3VPN over SRv6 in SRv6-BE mode between PE 1 and PE 2 and use an SRv6 tunnel to transmit EVPN traffic between the PEs.
· Configure EBGP to exchange VPN routing information between the CEs and PEs.
· Configure IPv6 IS-IS on the PEs in the same AS to realize IPv6 network connectivity.
· Configure MP-IBGP to exchange EVPN routing information between the PEs.
· Configure iFIT to monitor the occurrence of packet loss and packet delay value when the flow passes through the VPN 1 tunnel.
Prerequisites
1. Configure IPv6 EVPN L3VPN over SRv6. (Details not shown.)
For information about configuring IPv6 EVPN L3VPN over SRv6, see EVPN L3VPN over SRv6 configuration in Segment Routing Configuration Guide.
2. Configure NTP on PE 1 and PE 2 for clock synchronization. (Details not shown.)
For information about configuring NTP, see "Configuring NTP."
Procedure
1. Configure gRPC:
# Enable the gRPC service.
<PE1> system-view
[PE1] grpc enable
# Create a sensor group named test, and add sensor path ifit/flowstatistics/flowstatistic.
[PE1] telemetry
[PE1-telemetry] sensor-group test
[PE1-telemetry-sensor-group-test] sensor path ifit/flowstatistics/flowstatistic depth 2
[PE1-telemetry-sensor-group-test] quit
# Create a destination group named collector1. Specify a collector that uses IPv6 address 10::10 and port number 50050.
[PE1-telemetry] destination-group collector1
[PE1-telemetry-destination-group-collector1] ipv6-address 10::10 port 50050
[PE1-telemetry-destination-group-collector1] quit
# Configure a subscription named A to bind sensor group test with destination group collector1. Set the sampling interval to 5 seconds.
[PE1-telemetry] subscription A
[PE1-telemetry-subscription-A] sensor-group test sample-interval 5
[PE1-telemetry-subscription-A] destination-group collector1
[PE1-telemetry-subscription-A] quit
[PE1-telemetry] quit
2. Configure iFIT:
# Enable the iFIT functionality.
[PE1] ifit enable
[PE1-ifit] device-id 1
# Configure instance a to monitor the unidirectional flow passing through the VPN 1 tunnel.
[PE1-ifit] instance a
[PE1-ifit-instance-a] flow unidirection source-ipv6 2001::1 64 destination-ipv6 2002::1 64 vpn-instance vpn1
# Bind interface Ten-GigabitEthernet0/0/6 to instance a.
[PE1-ifit-instance-a] bind interface ten-gigabitethernet 0/0/6
# Specify 10 seconds as the measurement period.
[PE1-ifit-instance-a] period 10
# Enable iFIT measurement.
[PE1-ifit-instance-a] measure enable
[PE1-ifit-instance-a] quit
[PE1-ifit] quit
3. Configure PE 2:
# Configure gRPC.
Use the same procedure to configure gRPC on PE 2 as you configure gRPC on PE 1.
# Enable the iFIT functionality.
<PE2> system-view
[PE2] ifit enable
Verifying the configuration
1. View iFIT statistics on PE 1.
[PE1-ifit-instance-a] display ifit statistic device-id 1 flow-id 2
Period ID Direction Interface PktCount Timestamp(sec, nsec)
163059918 Ingress XGE0/0/6 4124 1630599180, 1889782
163059919 Ingress XGE0/0/6 4124 1630599190, 1901494
163059920 Ingress XGE0/0/6 4124 1630599200, 1912118
2. View iFIT statistics on PE 2.
[PE2] display ifit statistic device-id 1 flow-id 2
Period ID Direction Interface PktCount Timestamp(sec, nsec)
163059918 Egress XGE0/0/6 4124 1630599180, 1948185
163059919 Egress XGE0/0/6 4124 1630599190, 1959405
163059920 Egress XGE0/0/6 4120 1630599200, 1968503
3. Packet loss occurs in period 163059920 by viewing iFIT statistics on the analyzer.