- Table of Contents
- Related Documents
-
| Title | Size | Download |
|---|---|---|
| 01-Text | 1.10 MB |
Contents
About the local Oasis platform
Sites, branches, and scenarios
View guest probing information
Configure basic network settings
Manage private software versions
View operation logs or login logs
Configure authentication settings
Configure settings on the device
Configure Facebook authentication
Configure one-key authentication
Configure fixed account authentication
Configure guest authentication
Configure Facebook authentication
Configure member authentication
Configure combined authentication
Configure dumb terminal authentication
Enable the captive-bypass feature
Enable self-service password change
Enable collaboration with an LDAP server for fixed account verification
Configure Internet access settings
Manage dumb terminal account groups
Configure portal automated authentication
Configure inter-site and inter-SSID re-authentication
Configure Internet access control
Configure the domain name whitelist and blacklist
View or export history of authentication template deployment
Configure the client blacklist
Configure 802.1X authentication
Perform smart operations and maintenance
View real-time connection information
View client health information
View client health information in common mode
View client health information in expert mode
View online client information
View authentication analysis results
View association and disassociation analysis results
View attack detection information
View SSID detection information
View spoofing detection information
Manage VIP clients and view VIP client statistics
View VIP client health information in common mode
View VIP client health information in expert mode
Perform progressive optimization
View password request approval records
Edit, clone, or delete a dashboard
About the local Oasis platform
The Oasis platform installed on a WBC multiservice access controller is a local edition for the H3C Oasis platform, allowing administrators to monitor the network and operate and maintain devices from the platform. It offers the following benefits:
· Manageability—You can monitor the entire network in real time for fast failure location and troubleshooting, deploy services as needed to monitor employee and user traffic, and tune your running services accordingly.
· Reliability—The Oasis platform provides only monitor and deployment services and does not process network services.
|
|
NOTE: The webpages displayed might vary depending on the model of the device where the Oasis platform is deployed. |
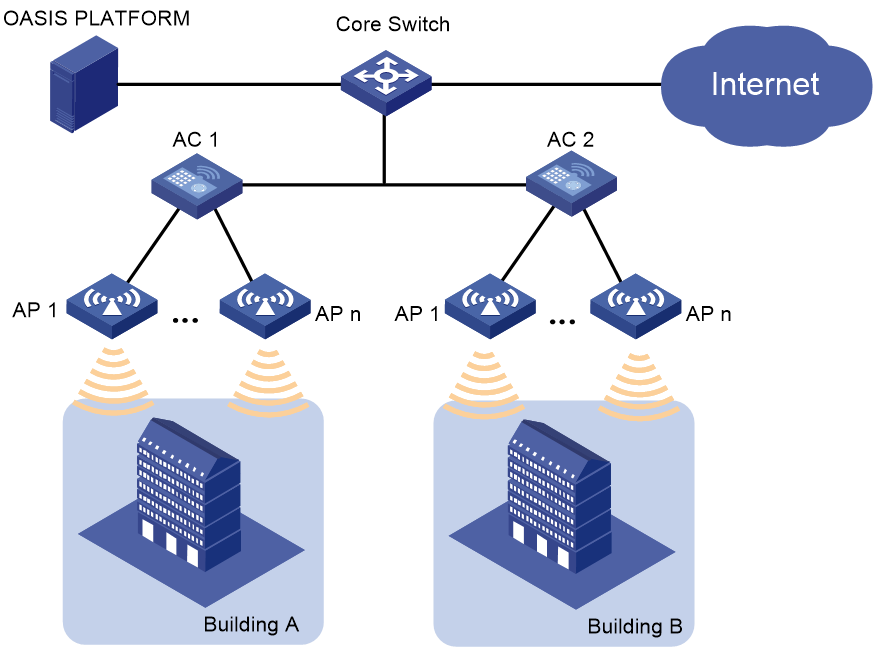
Typical networking
You can manage your devices from the Oasis platform as long as you register the devices on the platform
Figure 1 Network diagram
Sites, branches, and scenarios
A site is a virtual environment created for device management. You can add one or multiple devices to a site. A branch is a virtual container that stores sites. Typically, you categorize branches by location or brand, for example, headquarters-branch. The Oasis platform supports only the general scenario.
Tenants and sub accounts
The following accounts are available on the Oasis platform:
· Tenant—The predefined account oasis_root is the tenant, which has the highest privilege. The username and password are oasis_root and oasis_root123456, respectively.
· Sub account—All accounts created after login to the Oasis platform are sub accounts. A sub account can manange network devices and monitor the network. You can create chilld accounts for a sub account. The parent account has the privileges to create, edit, and delete child accounts and can view all sites and child accouts created by all its child accounts.
Log in to the Oasis platform
|
|
CAUTION: The Oasis platform can start only after it runs on the WBC multiservice access controller for a period of time. Please wait. |
Web browser requirements
As a best practice, use the following Web browsers:
· Internet Explorer 11 or higher.
· Mozilla Firefox 45.0.2 or higher
· Google Chrome 50.0.2661.87 or higher.
· Safari 5.1 or higher.
To access the Web interface, you must use the following browser settings:
· Accept the first-party cookies (cookies from the site you are accessing).
· To ensure correct display of webpage contents after software upgrade or downgrade, clear data cached by the browser before you log in.
· Enable active scripting or JavaScript, depending on the Web browser.
· If you are using a Microsoft Internet Explorer browser, you must enable the following security settings:
¡ Run ActiveX controls and plug-ins.
¡ Script ActiveX controls marked safe for scripting.
Procedure
You can access the Oasis platform directly by entering the URL of the Oasis platform in the address bar, and then entering the username and password or from the WBC monitoring platform. The default address of the Oasis platform is https://192.168.0.101:31443.
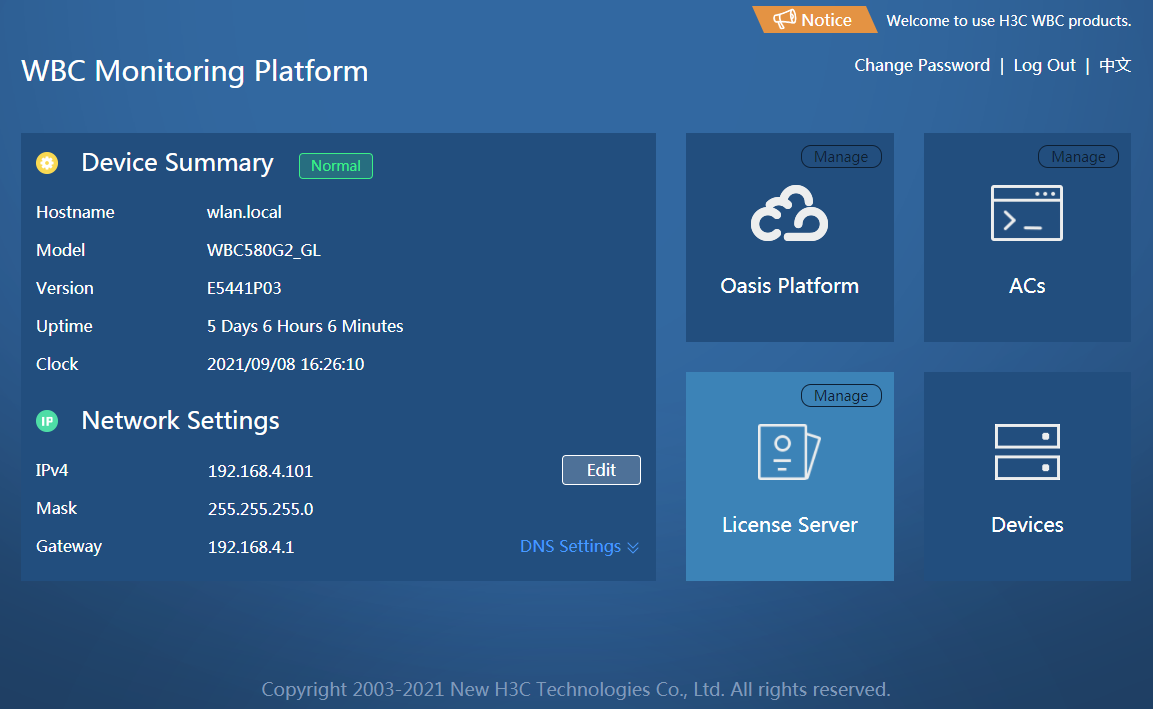
To log in to the Oasis platform from the WBC monitoring platform:
2. Click the Oasis Platform tab.
For other methods available for logging in to the WBC monitoring platform, see H3C WBC Multiservice Access Controllers Installation Guide.
Figure 2 WBC monitoring platform
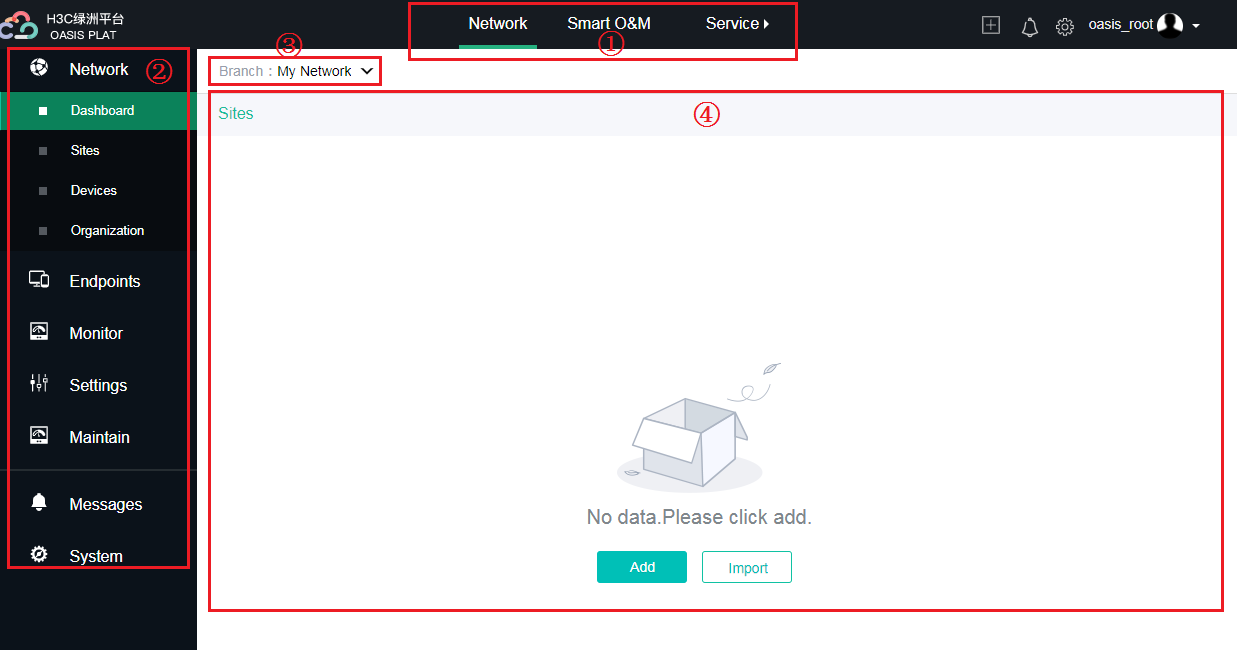
Webpage layout
The following is the webpage layout of the Oasis platform:
Figure 3 Webpage layout
|
Top navigation bar |
Left navigation pane |
|
Scenario menu |
Work pane |
· Top navigation bar—Contains functionality categories. If you click a category, the navigation pane displays all features and functionalities of that category. It also contains quick access functions, system notifications, and login account information.
· Left navigation pane—Contains menus of all features and functionalities. If you select one menu item, the right panel section displays the work pane for that item.
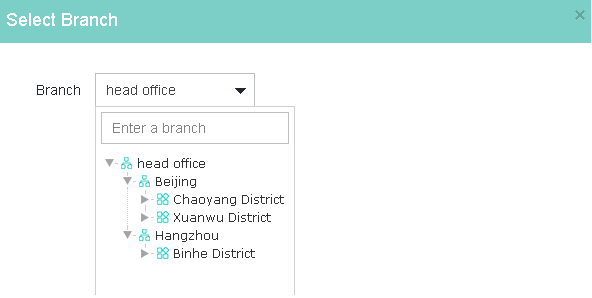
· Scenario menu—Allows you to select sites or branches as needed.
· Work pane—Provides an area for you to manage, configure, and monitor the system, features, and services depending on the menu item you select in the left navigation pane.
Manage your network
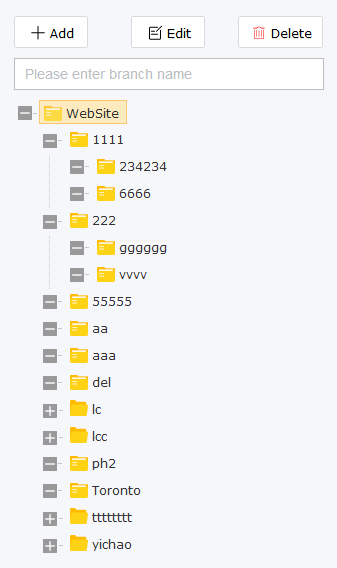
Manage branches
On the top navigation bar, click Network, and then select Network > Organization from the left navigation pane. Then add, edit, or delete a branch as needed. To add child branches under a branch, select that branch, and then click Add.
Before you delete a branch, you must delete the child branches and all sites.
Figure 4 Managing branches
Manage sites
Add a site
1. From the left navigation pane, select Network > Dashboard or Network > Organization.
2. If it is the first time you add a site, click Add. If a site already exists, click Add in the site list area to the right of the page. Click OK.
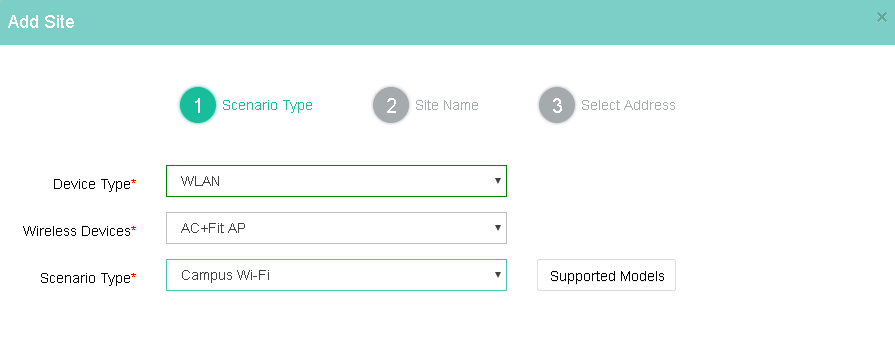
3. Select the General scenario.
Figure 5 Selecting the General scenario
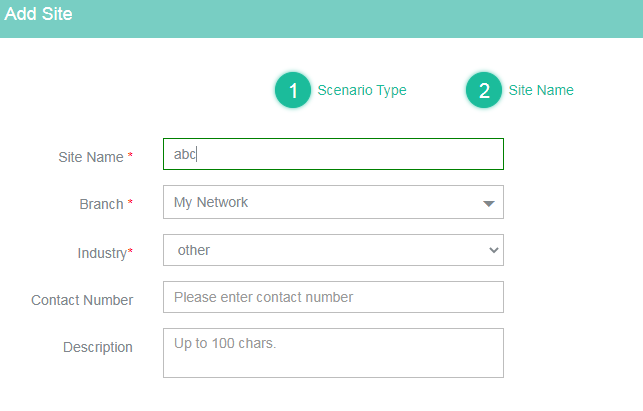
4. Specify the site name, branch, and industry.
Figure 6 Specifying site information
Delete a site
1. From the left navigation pane, select Network > Dashboard or Network > Organization.
2. Select a site, and then click Delete.
Export sites
To back up all sites of the current Oasis account, perform the following task to export the sites:
1. From the left navigation pane, select Network > Dashboard or Network > Organization.
2. On the Sites tab, click More Actions, and then select Export. The exported site list will be saved to the default downloading folder in the browser.
Import sites
1. From the left navigation pane, select Network > Dashboard or Network > Organization.
2. On the Sites tab, click More Actions and then select Import.
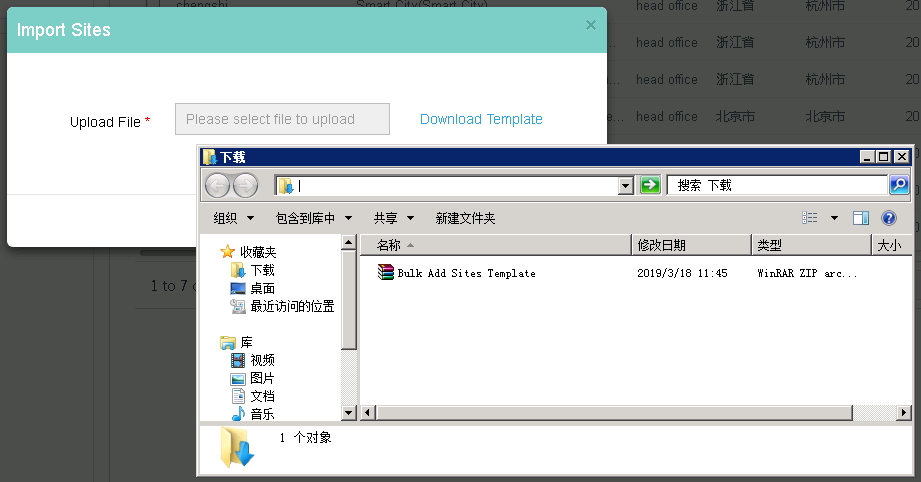
3. Click the Download Template link.
4. Fill in the template file as needed.
5. Click the Upload File field to select the template file, and then click OK.
Figure 7 Importing sites
Configure a site label
Perform this task to distinguish among different sites.
Restrictions and guidelines
Only tenants can configure a site label.
The number of site labels cannot exceed 10.
Procedure
1. From the left navigation pane, select Network > Dashboard or Network > Organization.
2. On the Sites tab, click More Actions and then select Manage Site Labels.
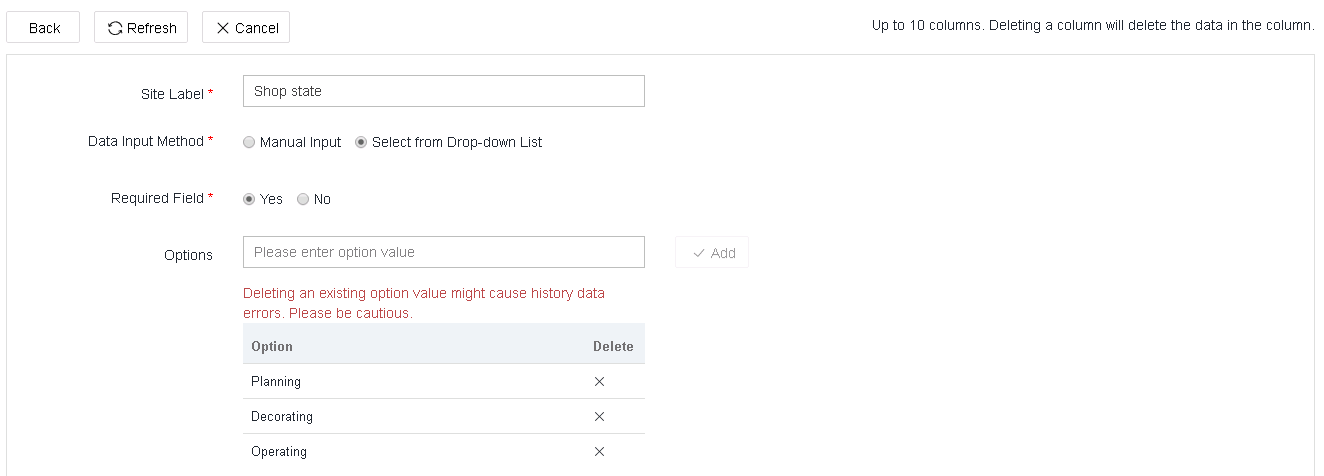
3. Click Add, enter the required information, and then click OK.
If you select Select from Drop-down List from the Data Input Method field, you must select option values from the Options field.
Figure 8 Adding a site label
4. To edit a site label, click the Edit button ![]() for that site
label.
for that site
label.
5. To delete a site label, click the Delete button ![]() for that site
label.
for that site
label.
Deleting a site label will delete the records saved for the site label in all sites of the account. Please be cautious.
6. To view site label information, click the Columns icon ![]() .
.
Figure 9 Viewing the site label
7. To add a site label for an existing site,
click the Edit button ![]() for
that site.
for
that site.
Manage devices
Add a device
Add a device from the CLI
# Specify the Oasis platform domain name as oasisauth.h3c.com.
<Sysname> system-view
[Sysname] cloud-management server domain oasisauth.h3c.com
# Create a host name to IPv4 address mapping in the static resolution table.
[Sysname] ip host oasisauth.h3c.com 192.168.0.101
# Display the Oasis platform connection state. If the connection is in Established state, the cloud connection is established successfully.
[Sysname] display cloud-management state
Cloud connection state : Established
Device state : Request_success
Cloud server address : 192.168.0.101
Cloud server domain name : oasisauth.h3c.com
Cloud connection mode : Https
Cloud server port : 19443
Connected at : Wed May 26 17:10:11 2021
Duration : 00d 00h 01m 54s
Process state : Message received
Failure reason : N/A
Last down reason : Device or process rebooted (Detail
s: N/A)
Last down at : Wed May 26 15:30:37 2021
Last report failure reason : N/A
Last report failure at : N/A
Dropped packets after reaching buffer limit : 0
Total dropped packets : 0
Last report incomplete reason : N/A
Last report incomplete at : N/A
Buffer full count : 0
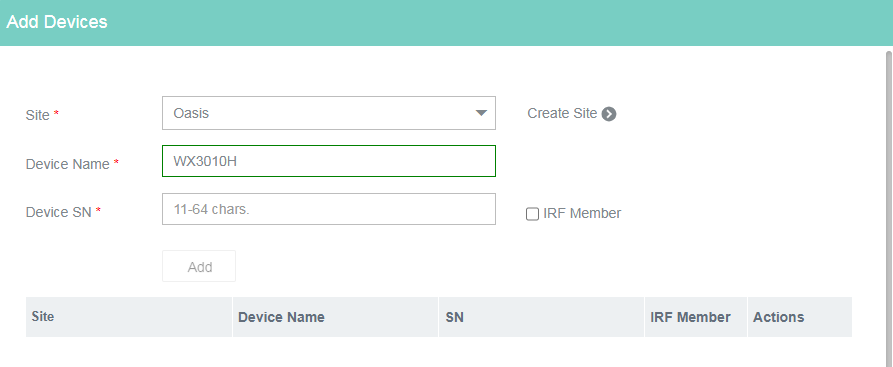
Add a device from the Oasis platform
1. From the left navigation pane, select Network > Devices.
2. Select a branch and a site.
3. Click Add.
To obtain the serial number of the device, see the label on the device, or access the device form the console port, and then execute the display device manuinfo command.
Figure 10 Adding a device
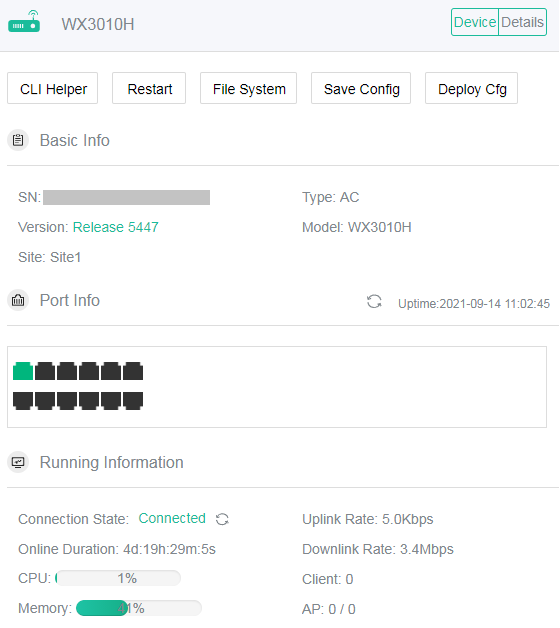
View device information
1. From the left navigation pane, select Network > Devices.
2. Select a branch and a site.
3. Click the name of a device to view its basic and running information.
On this page, you can restart a device, reset the cloud connection, deploy configuration to a device, save the running configuration, and manage the file system of a device.
Figure 11 Viewing device information
Edit the name of a device
1. From the left navigation pane, select Network > Devices.
2. Select a branch and a site.
3. Click ![]() for a device.
for a device.
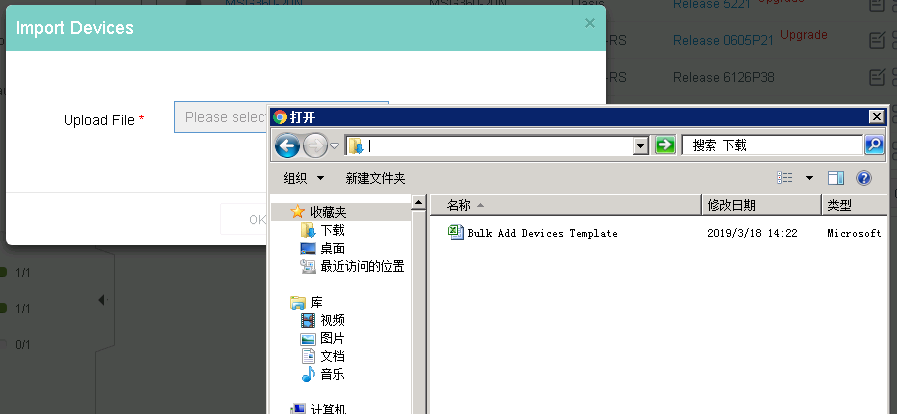
Import devices
1. On the top navigation bar, click Network.
2. From the left navigation pane, select Network > Devices.
3. On the Devices tab, click More Actions and then select Import.
4. Click the Download Template link.
5. Fill in the template file as required.
6. Click the Upload File field to select the template file, and then click OK.
Figure 12 Importing devices
Export devices
To back up device information, perform the following task to export the devices:
1. On the top navigation bar, click Network.
2. From the left navigation pane, select Network > Devices.
3. On the Devices tab, click More Actions, and then select Export. The exported device list will be saved to the default downloading folder in the browser.
Figure 13 Exporting devices
Delete devices in bulk
1. On the top navigation bar, click Network.
2. From the left navigation pane, select Network > Devices.
3. Select a branch and site.
4. Select the target devices, and then click Delete on top of the device list.
Move a device to another site
Restrictions and guidelines
You can move a device only to a site in the General scenario.
Moving a device might cause configuration loss. If configuration loss occurs, re-configure that device in the new site.
Procedure
1. On the top navigation bar, click Network.
2. From the left navigation pane, select Network > Devices.
3. Select a branch and site.
4. Select the target devices, and then click Migrate on top of the device list.
Manage areas
Restrictions and guidelines
If you move an AC to a new area, you must delete the APs managed by that AC from its original area, and then add the APs to the new area.
Procedure
1. On the top navigation bar, click Network.
2. From the left navigation pane, select Sites.
3. Click the Area Management tab.
4. Click Edit, and then click Add.
5. Specify an area name, and then click Submit.
6. To add more areas, click the ![]() button.
button.
7. To add APs to the areas, click OK in the dialog box that opens or return to the area management page and then click Click here to add APs.
8. On the Areas With Bound APs or Areas Without
Bound APs tab, click the ![]() icon in the Actions column for an area, add or remove one or
multiple APs, and then click Submit.
icon in the Actions column for an area, add or remove one or
multiple APs, and then click Submit.
9. To change the name of an area, click the ![]() icon
in the Actions column for that area.
icon
in the Actions column for that area.
10. To delete an area, click the ![]() icon in the
Actions column for that area. An area cannot be deleted if it contains APs.
icon in the
Actions column for that area. An area cannot be deleted if it contains APs.
11. To delete multiple areas in bulk, select target areas, and then click Bulk Delete on top of the area list.
12. To view the score, online clients, and AP
uplink and downlink rate information for an area, click the Tile button ![]() on the area
management page. To reboot one or multiple APs in that area, click Immediate Reboot.
on the area
management page. To reboot one or multiple APs in that area, click Immediate Reboot.
13. To view detailed information for an area,
including health score and AP quantity, click the List
button ![]() .
.
14. To view areas that contain APs with different health scores, click the All, Excellent, Good, Normal, or Offline button.
If no online APs exist in an area, the area is marked as offline.
Manage endpoints
View client statistics
Perform this task to view network access information such client and traffic statistics.
General restrictions and guidelines
· Associated clients include clients that have passed and have not passed authentication.
· If no authentication is configured, authenticated clients are counted as 0.
View client summary
Perform this task to view summary about currently online, first-access, multiple-access (associated), and total clients, and average online duration.
Restrictions and guidelines
· Data comparison
¡ You cannot compare statistics for the current day.
¡ You can compare client statistics for the same site or for different sites as needed. When you compare statistics for the same site:
- You can compare the client trend and average online duration in one day by clicking the date twice.
- If you compare the client trend and average online duration in two different time ranges, the number of days in the time ranges must be the same.
¡ When you compare statistics for different sites, you can compare only statistics on the same day or in the same time range.
¡ If you specify a time range that spans multiple days, statistics about the current day are not collected.
· Client distribution by week visit quantity/week visits trend
¡ If you select a single day, the system displays the client data for the week that includes the specified day. For example, if you select 2018-05-23, the system displays the client data from 2018-05-21 to 2018-05-27.
¡ If you select multiple days, the system displays the client data for the weeks that include the specified days. For example, if you select 2018-05-20 to 2018-05-21, the system displays the client data from 2018-05-14 to 2018-05-20 and 2018-05-21 to 2018-05-27.
Procedure
1. From the left navigation pane, select Endpoints > Client Statistics > Client Summary.
2. Select a branch and a site from the top of the work pane.
3. To compare client statistics in the specified time range, click Data Comparison in the Client Trend area.
4. To compare the average length of stay for clients in the specified time range, click Data Comparison in the Average Online Duration Trend area.
Parameters
· Client statistics
¡ Online Clients: Number of online clients in all sites.
¡ Average Online Duration: Daily average online duration per client for each site. If you select a time range that spans more than one day, statistics on all these days are counted as a sum.
· Client Rank
¡ Top 5: Top 5 dates when a site has the most clients or top 5 sites with the most clients.
¡ Bottom 5: Top 5 dates when a site has the least clients or top 5 sites with the least clients. If the current day is selected, this graph displays statistics for the past 7 days.
· Access User Proportion: Proportions of first-access clients and multiple-access clients during the specified time range.
· Client Trend: Client trend every 5 minutes for the selected day or daily client trend for the selected time range. A client is counted as one client even if the client has accessed the network multiple times in an hour or a day.
· By Client Vendor: Client statistics by vendor.
· By SSID: Client statistics by SSID.
· Online Duration Proportion: Distribution of clients by online duration. The statistics are cumulative. For example, if a client has accessed a site twice, the client is counted as two clients and the length of stay is the sum of the two accesses.
· Average Online Duration Trend: Average online duration of all clients by day. If you select Today, the statistics for the past seven days are displayed.
· Number of Week Visits/Week Visits Trend: Client statistics by number of week visits.
View client details
Perform this task to view online or offline client information and export the data for analysis.
Restrictions and guidelines
You can select only one site.
The tables display only default
information. To view more information, click the Columns icon ![]() and then select the target columns to
display.
and then select the target columns to
display.
Procedure
1. From the left navigation pane, select Endpoints > Client Statistics > Client Details.
2. Select a branch and a site from the top of the work pane.
3. To view detailed information about associated clients, click Associated Clients.
4. To view detailed information about authenticated clients, click Authenticated Clients.
Parameters
· Online Clients: Detailed information about all online clients in the current site.
· Client History: Detailed information about all offline clients within the past one to seven days.
View traffic summary
Perform this task to view summary about real-time client traffic or client traffic trend in the specified time range and compare traffic statistics in one site or between different sites.
Restrictions and guidelines
· If you specify a time range that spans multiple days, day-on-day statistics are not displayed.
· If you select Today, the statistics for the past seven days are displayed.
· You cannot compare statistics for the current day.
· You can compare traffic statistics for the same site or for different sites as needed. When you compare statistics for one site:
¡ You can compare the traffic statistics in one day by clicking the date twice.
¡ If you compare the traffic statistics in two different time ranges, the number of days in the time ranges must be the same.
· When you compare statistics for different sites, you can compare only statistics on the same day or in the same time range.
Procedure
1. From the left navigation pane, select Endpoints > Client Statistics > Traffic Summary.
2. Select a branch and a site from the top of the work pane.
3. To compare traffic statistics in the specified time range, click Data Comparison in the Total Traffic Trend area.
4. To compare traffic statistics per person in the specified time range, click Data Comparison in the Rank of Traffic per Person area.
Parameters
· Traffic statistics: Total upload and download traffic, upload and download traffic per person, and day-on-day traffic ratio and peak traffic within 30 days.
· Total Traffic Ranking: Top 5 and bottom 5 traffic by day or by site.
· Client Traffic Ranking: Top 10 traffic by client or by site.
· Total Traffic Trend: Total traffic trend during the specified time range.
· Rank of Traffic per Person: Top 5 and bottom 5 traffic per person by day or by site.
View traffic details
Perform this task to view online or offline client traffic information and export the data for analysis.
Restrictions and guidelines
You can select only one site.
Procedure
1. From the left navigation pane, select Endpoints > Client Statistics > Traffic Details.
2. Select a branch and a site from the top of the work pane.
3. To view detailed traffic information about associated clients, click Associated Clients.
4. To view detailed traffic information about authenticated clients, click Authenticated Clients.
Parameters
· Online Client Traffic: Detailed traffic information about all online clients in the current site.
· Client Traffic History: Detailed traffic information about all offline clients within the past one to seven days.
Manage critical endpoints
Perform this task to monitor and manage critical endpoints as assets. The system can generate critical endpoint online and offline messages.
Procedure
1. From the left navigation pane, select Endpoints > Endpoints > Critical Clients.
2. Select a branch and a site from the top of the work pane.
The page that opens displays the following information:
¡ Summary: Summary about critical clients in the site or branch, including total, online, and offline clients, disassociated clients and APs, and disassociated clients and APs today.
¡ Alarms: Alarms generated for frequent client disassociations, client disassociations, and client associations in the specified time range.
¡ Traffic Top 10: Top 10 clients or sites with the most traffic.
¡ Disassociations Top 10: Top 10 clients with the most disassociations.
¡ Client Trend: Trend for online and offline critical clients.
¡ Real-Time Client Statistics: Real-time critical client statistics in the current site or branch. To filter critical clients, click Filter, enter the filter criteria, and then click Search.
¡ Client Disassociation Log: Disassociation log information for critical clients.
3. To add a critical client, click Add Critical Clients. You will be redirected to the Endpoints page.
Manage cameras
The system can automatically identify and display camera information when a camera is connected to the system. Alternatively, you can manually add cameras to the system.
Restrictions and guidelines
· For camera identification to take effect, the device must have LLDP enabled and support EPA.
· For the device to support camera identification by MAC address mask, you must upgrade the device to Release 6320 or a higher version.
Procedure
1. From the left navigation pane, select Endpoints > Endpoints > Cameras.
2. Select a branch and a site from the top of the work pane.
The Camera Monitoring tab displays the following information:
¡ Statistics: Numbers of online, offline, and today's offline cameras, and total number of cameras.
¡ Alarms: Alarms generated for camera offline events and traffic anomalies in the specified time range.
¡ Traffic Ranking: Top 5 and bottom 5 cameras by traffic amount in the specified time range.
¡ Disassociations Top 10: Top 10 cameras with the most disassociations.
¡ Online/Offline Events Trend: Trend for online and offline events of cameras.
¡ Camera List: Statistics about cameras in the site, including state, MAC address, uplink device, and VLAN.
¡ Offline Event Logs: Offline event logs for cameras in the site. To export logs, click Export.
¡ Scheduled Task List: Information about scheduled tasks for cameras, including task name, action, schedule, run mode, and involved cameras.
3. To manage cameras, perform the following tasks:
¡ To discover cameras, click Discover. The system will obtain switch and router information and identify cameras and synchronize the information to the Oasis platform.
¡ To shield a camera, select that camera, and then click Shield on top of the camera list. The shielded cameras will be added to the denylist.
¡ To perform power management for a camera, select that camera, click PoE, and then select Enable, Disable, or Restart to enable, disable, or restart PoE power supply for that camera.
¡ To schedule PoE power supply for a camera, perform the following steps:
- Select that camera, and then click Scheduled Task.
- In the dialog box that opens, enter the task name, select an action, specify the time range, and then click OK. The created scheduled task will be displayed in the scheduled task list.
¡ To delete,
start, stop, or edit a scheduled task, or edit the camera list in a scheduled
task, click ![]() ,
, ![]() ,
, ![]() ,
, ![]() , or
, or ![]() in the Actions column for that task.
in the Actions column for that task.
¡ To view the camera list in a scheduled task, click the number link in the Cameras column for that task.
¡ To delete scheduled tasks in bulk, select one or multiple tasks, click Delete on top of the task list, and then click OK in the dialog box that opens.
4. To configure camera identification, click the Camera Idenfitication tab:
¡ To add a camera, click Add, enter the MAC address, mask, and device name, and then click Submit.
¡ To
edit a camera, click ![]() in the Actions for that camera.
in the Actions for that camera.
¡ To
delete a camera, click ![]() in the Actions column for that camera. To
bulk delete cameras, select the cameras, click Delete
on top of the list, and then click OK in the dialog
box that opens.
in the Actions column for that camera. To
bulk delete cameras, select the cameras, click Delete
on top of the list, and then click OK in the dialog
box that opens.
¡ To refresh the camera list, click Refresh.
¡ To
view shielded cameras, click Denylist. To remove a
camera from the denylist, click ![]() in the Actions column for that camera. To remove multiple
cameras in bulk from the denylist, select the cameras, and then click Delete on top of the denylist.
in the Actions column for that camera. To remove multiple
cameras in bulk from the denylist, select the cameras, and then click Delete on top of the denylist.
View guest probing information
Restrictions and guidelines
· The system displays guest probing statistics only when guest probing is enabled.
· After you enable guest probing, AP will take some time to collect information. Please wait.
· If you specify a time range that spans multiple days, statistics about the current day are not collected.
· Associated clients are clients that have been associated with any AP managed by the AC, and disassociated clients are clients that have not been associated with an AP.
· Active clients are clients that have sent wireless packets within a specific time period, and inactive clients are clients that have not sent any wireless packets.
Procedure
1. On the top navigation bar, click Network.
2. From the left navigation pane, select Endpoints > User Analysis > Guest Probing.
3. Select a branch and a site from the top of the work pane.
The page that opens displays the following information:
¡ User—Displays numbers of associated, disassociated, active, and inactive clients by day.
¡ User Statistics—Displays total number of clients detected in one or multiple days.
¡ Length of Stay—Displays users by length of stay in one or multiple days.
¡ Client Vendor—Displays numbers of clients by vendor.
¡ SSID Statistics—Displays clients by associated SSID.
Monitor the system
Monitor devices
Restrictions and guidelines
· To obtain more information about a device, connect that device to the Oasis platform.
· You can view operation logs within a maximum of one month.
· If you specify a time range that spans multiple days, CPU, memory and rate statistics about the current day are not collected.
· The system collects CPU and memory usage and uplink and downlink rates every 10 minutes. To view data in multiple days, shrink the horizontal scrollbar and then drag it left or right.
· To view the uplink and downlink rates at a specific time point, hover over that time point in the trend graph.
Procedure
1. From the left navigation pane, select Monitor > ACs > Summary.
2. Select a branch, a site, and a device from the top of the work pane.
3. To view the CPU and memory usage trend, click Expand from the Operating Info tile.
The logs record operations on Oasis account, IP address, and device configuration.
4. To view device association and disassociation records, click Expand from the Device State tile.
5. To view the rate trend, click Expand from the Realtime Rate tile. To set the rated bandwidths, click Set Rated Bandwidth.
6. To view AP ranking by disassociation quantity in the specified time range, click Expand from the AP Info tile. The Top10 APs with Most Disassociations graph opens.
7. To view the client association trend in the specified time range, click Expand from the Client Info tile. If the time range spans one day, the system displays client statistics by hour. If the time range spans multiple days, the system displays client statistics by day.
8. To view the most recent operation logs, click the Device Logs tab.
The list that opens displays operation logs in the past month, including user, IP, operation description, operation time, and result. You can filter the logs by time range as needed.
9. To view the alarm logs, click the Alarm Logs tab.
The list that opens displays information about alarms generated on the device in the specified time range, including notification method, severity, alarm state, alarm type, site, device, content, and generation time.
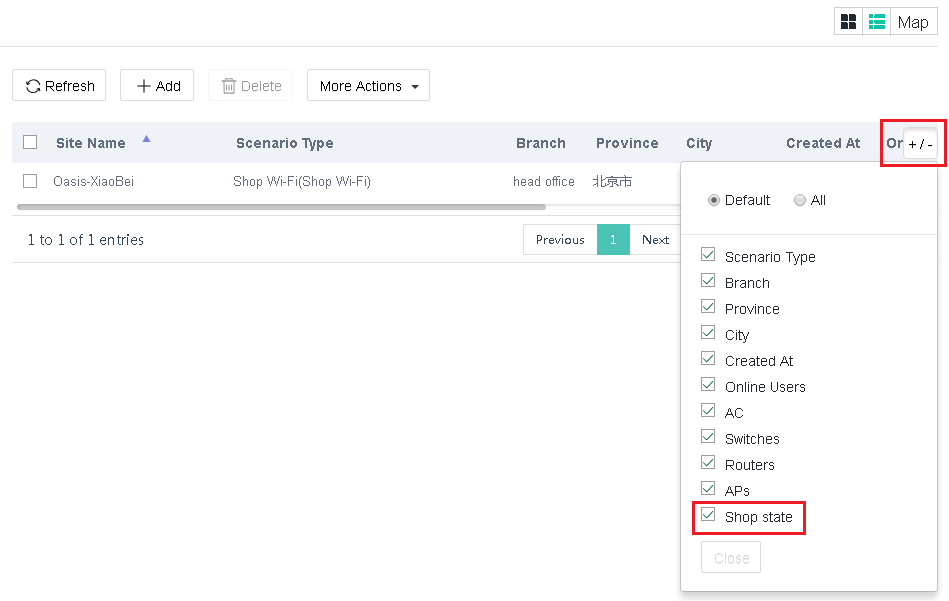
¡ To adjust the columns to display, click the Columns icon +/-.
¡ To filter alarms, click Filter, and then specify the filtering criteria as needed.
¡ To export the displayed alarms, click Export.
¡ To mark specific alarms as read, select the alarms and then click Mark as Read.
¡ To mark all alarms as read, click Mark All as Read.
10. To view the AP list, click the AP List tab.
The list that opens displays AP information, including AP name, SN, model, MAC, and version.
¡ To adjust the columns to display, click the Columns icon +/-.
¡ To filter APs, click Online, Offline, All, or Invalid.
¡ To change the name of an AP, click the AP name.
11. To view the client list, click the Client List tab.
The list that opens displays client information, including client MAC, IP, vendor, associated AP, SSID, online duration, RSSI, frequency, channel, association time, and client mode. To adjust the columns to display, click the Columns icon +/-.
Parameters
· Device Score
¡ Remaining Bandwidth: By ratio of the
egress bandwidth to the total available bandwidth. A lower ratio, a higher
score. To set the rated bandwidths, click ![]() next to this
field.
next to this
field.
¡ Online AP Ratio: By ratio of online APs to the total number of APs. More online APs, higher score.
¡ Client Rate: By rate of low-rate clients to the total number of APs. Fewer low-rate clients, higher score.
¡ Security Score: By number of rogue APs in the WLAN. Less rogue APs, higher score.
¡ Wireless Environment: By interference state. Less interference, higher score.
¡ System Health: By CPU and memory usages. Lower CPU and memory usages, higher score. The system takes the lower score between them.
· Set Rated Bandwidth: Uplink and downlink rates of a device in the specified time range. To set the rated bandwidths, click Set Rated Bandwidth. After you set the rated bandwidths, the rated bandwidth values in the graph will change accordingly. You must configure the rated bandwidths to be the same those you have purchased from your service provider.
View AP summary
Restrictions and guidelines
· You can select a single site or a branch that contains multiple sites.
· The system does not count APs that go offline unexpectedly as offline APs.
Procedure
1. From the left navigation pane, select Monitor > ACs > AP Summary.
2. Select a branch and a site from the top of the work pane.
3. To view real-time traffic ranking of all
APs, click the Info icon ![]() at the
upper right corner of the Realtime AP Traffic Top 5
area.
at the
upper right corner of the Realtime AP Traffic Top 5
area.
4. To view real-time user ranking of all APs,
click the Info icon ![]() at the upper
right corner of the Realtime AP User Top 5 area.
at the upper
right corner of the Realtime AP User Top 5 area.
Parameters
· AP statistics: Number of online, offline, total, and invalid APs.
· Realtime AP Traffic Top 5: Top 5 APs with the most downlink traffic.
· Realtime AP User Top 5: Top 5 APs with the most associated clients.
· AP Disassociations: Distribution of APs by the number of disassociations.
· AP Disassociation Reason: Distribution of APs by disassociation reason.
· AP Disassociations Top 10: Top 10 APs with the most disassociations. The system counts AP disassociations by day.
View AP details
Restrictions and guidelines
You can view only event and disassociation details within 30 days.
Procedure
1. From the left navigation pane, select Monitor > ACs > AP Details.
2. Select a branch and a site from the top of the work pane.
3. On the APs tab, view AP details and manage APs as follows:
¡ To edit the name of an AP, click the AP name link.
¡ To
edit the columns to display, click the ![]() icon.
icon.
4. To view radio details, click the Radios tab.
5. To view AP event details, click the Events tab.
6. To view AP disassociation details, click the Disassociations tab.
7. To refresh the page, click Refresh.
8. To export AP or radio information, click Export. To export event or disassociation information, select a time range, and then click Export.
Configure wireless settings
Perform this task to configure wireless services, basic AP settings, WLAN security, DRS, and authentication. For more information about user management and authentication settings, see "Configure authentication settings."
Manage autodeploy templates
You can apply an autodeploy template to a site to automatically configure specific devices at device association, which reduces configuration workloads.
To manage autodeploy templates:
1. From the left navigation pane, select Settings > Autodeploy.
2. To add an autodeploy template for ACs, click Add, configure the following parameters as needed, and then click OK:
¡ Template—Specify the template name.
¡ Device Model—Specify the model of devices to apply the template to.
¡ Description—Specify the template description.
¡ Copy Settings—Select whether to copy settings from an existing autodeploy template.
¡ VLANs, Probe, Authentication, Bandwidth, Self-Defined—Specify VLAN, probe, authentication, bandwidth, and other configurations.
3. To bind an autodeploy template to a site,
click the Bind icon ![]() for that template.
Click Bind, select the templates to bind, and then
click OK.
for that template.
Click Bind, select the templates to bind, and then
click OK.
4. To unbind autodeploy templates from a site, click
the Bind icon ![]() for that
template. Select the templates and then click Unbind.
for that
template. Select the templates and then click Unbind.
5. To view the bound sites, click the number link in the Bound Sites column.
6. To edit an autodeploy template, click the Edit icon ![]() for that
template.
for that
template.
7. To view the application record, click the View History icon ![]() for the template.
for the template.
¡ On the Binding Result tab, you can perform the following tasks:
- To refresh the binding result, click Refresh.
- To filter the result by time range, click One Day, and then select a time range. Options include One Day, One Week, One Month, and All.
- To rebind devices, select the devices and then click Rebind. The system will deploy the template settings to the devices.
- To export all the binding result, click Export.
¡ On the Unbind Devices tab, you can click Refresh to refresh the unbind device list.
8. To delete an autodeploy template, click the Delete icon ![]() for that
template, and then click OK in the dialog box that
opens.
for that
template, and then click OK in the dialog box that
opens.
Configure a wireless service
1. From the left navigation pane, select Settings > ACs > Wireless Services.
2. Select a branch, a site, and a device from the top of the work pane.
3. To add a wireless service, click Add, configure wireless service settings as needed, and then click Submit to finish adding or click Next to bind APs to this wireless service.
4. To bind APs to a wireless service, click the
Bind icon ![]() for that wireless
service, click the Unbound APs tab, select APs
(radios), and then click Bind.
for that wireless
service, click the Unbound APs tab, select APs
(radios), and then click Bind.
5. To unbind a wireless service, click the Bind icon ![]() for that wireless
service, select APs (radios) on the Bound APs tab, and
then click Unbound.
for that wireless
service, select APs (radios) on the Bound APs tab, and
then click Unbound.
6. To view information about bound APs, click the number in the Bound APs column.
7. To edit a wireless service, click the Edit icon ![]() for that wireless
service.
for that wireless
service.
8. To delete a wireless service, click the Delete icon ![]() for that wireless
service.
for that wireless
service.
9. To synchronize information about locally created wireless services to the Oasis platform, click Sync.
You can synchronize only wireless services that have an SSID configured.
Configure AP settings
This task is available only for ACs of version 5418 or later. The AP list displays only manual APs, including APs converted from auto APs.
To configure AP settings:
1. From the left navigation pane, select Settings > ACs > AP Settings.
2. Select a branch, a site, and an AC from the top of the work pane.
3. To configure an AP, click the Edit icon ![]() for that AP. You
can also click the AP name, state, channel, power, or bandwidth link of an AP
to edit the specific field.
for that AP. You
can also click the AP name, state, channel, power, or bandwidth link of an AP
to edit the specific field.
4. To synchronize locally configured AP settings to Oasis, click Sync.
5. To export displayed AP information, click Export.
Configure WLAN security
This task is available only for ACs of version 5442 or later.
To configure WLAN security settings:
1. From the left navigation pane, select Settings > ACs > WLAN Security.
2. Select a branch, a site, and an AC from the top of the work pane.
You are placed on the Attack Detection tab.
3. To configure attack detection, enable attack detection, and then specify the detection level, detection items, countermeasure items, and sensor APs. Click OK.
4. To configure SSID detection, click the SSID Detection tab. Enable SSID detection, configure detection rules, specify sensor APs, and then click OK.
5. To configure MAC spoofing detection, click the MAC Spoofing Detection tab. Enable the feature for wireless services.
Configure service settings
1. From the left navigation pane, select Settings > ACs > Service Settings.
2. Enable DPI report statistics (DRS) as needed.
With this feature enabled, you can access the Endpoints > User Analysis > Behavior Analysis page to view statistics about applications and websites visited by users.
3. To enable or disable WLAN probe, select the APs, and then click Enable/Disable WLAN Probe.
Configure basic network settings
Only the MSG series supports this task.
1. From the left navigation pane, select Settings > ACs > Basic Settings.
2. Select a branch, a site, and an AC from the top of the work pane.
On this page, you can configure external network, internal network, address mapping, DNS, DHCP, and NTP settings.
3. To synchronize locally configured basic network settings to Oasis, click Sync.
Configure ACs in bulk
1. From the left navigation pane, select Settings > ACs > Bulk Settings.
2. Click GUI or CLI.
|
|
CAUTION: Use the CLI function under the guidance of professionals. |
3. To add a configuration template, click Add, configure the template settings as needed, and then click Save. To apply the configuration template, click OK in the confirmation dialog box that opens, select target devices, and then click Apply.
4. To apply a configuration template that has
been created, click the Apply icon ![]() for
that template, select a branch from the upper right corner of the work pane, select
target devices, and then click Apply.
for
that template, select a branch from the upper right corner of the work pane, select
target devices, and then click Apply.
5. To view template deployment results, click History. To reapply a history template that has failed to be applied, click Reapply. To export the history, click Export.
6. To edit a configuration template, click the Edit icon ![]() for that template.
for that template.
7. To delete a configuration template, click
the Delete icon ![]() for that template.
for that template.
Maintain devices
Upgrade device software
Restrictions and guidelines
You can upgrade only online devices.
Offline download is available only for upgrade by device.
A recommended version is an optimal version recommended based on the upgrade risks and performance. A recommended version is selected by default.
Procedure
1. From the left navigation pane, select Maintain > Upgrade.
2. Select a branch and a site from the top of the work pane.
3. Click the Upgrade by Device or Upgrade by Model tab, select the version number, select the devices or models, and then click Upgrade.
4. In the dialog box that opens, select an upgrade method, and then click OK. Options include Upgrade and Reboot, Upgrade, Save, and Reboot, and Upgrade Only.
5. To download a software version, click Offline Download. You will be redirected to the official website of H3C, where you can download image files as needed.
6. To view upgrade details, click the Upgrade Details tab.
¡ The Devices Being Upgraded area displays current software version, upgrade progress, and upgrade start time for the devices being upgraded.
¡ The Upgraded Devices area displays current software version, upgrade state, and failure reason for the upgraded devices.
Upgrade an AC with ISSU
Perform this task to upgrade the master and backup ACs in a site that support ISSU upgrade.
The system uses the following procedure to perform an ISSU upgrade:
1. Upgrades the backup ACs.
2. Pre-loads software versions to the master ACs and APs.
3. Upgrades the APs.
4. Associates the upgraded APs with the upgraded backup ACs.
5. Upgrades the master ACs.
6. Associates the APs with the master ACs.
Restrictions and guidelines
Only some AC models support this task.
This task is not supported in an IRF network.
The ACs can operate in 1 +1 or N +1 redundancy mode. Do not configure two ACs that back up each other as the master and backup ACs. If the page does not display any ACs, make sure the software version is the same for the ACs to upgrade.
Prerequisites
Before performing this task, upgrade the image files for the devices to upgrade on the Upload Images tab on the Maintain > Private Versions page. Make sure the software version is the same for the ACs.
Procedure
1. From the left navigation pane, select Maintain > ISSU.
2. Select a branch and a site from the top of the work pane.
3. On the ISSU tab, select the devices to upgrade, and then click Upgrade. Then, identify the roles of the devices.
4. Select a private software version.
5. Select an upgrade policy:
¡ Upgrade Now—Upgrades APs immediately in turn.
¡ Scheduled Upgrade—Upgrades APs as scheduled.
¡ Intelligent Upgrade—Upgrades APs in idle time calculated based on client history and traffic history statistics and forcibly upgrades APs if the APs cannot be upgraded in idle time before the upgrade specified upgrade end time is reached.
6. Identify AC information, including software version, upgrade policy, and upgrade time.
7. Click the Upgrade Progress tab to view the upgrade progress and the details.
Manage private software versions
1. From the left navigation pane, select Maintain > Private Versions.
The page that opens displays the version name, applicable device model, category, and devices, and version description for the private software versions.
2. To manage private software versions, perform the following tasks:
¡ To
delete a version, click the Delete icon ![]() in
the Actions column for that version. To delete one
or multiple version in bulk, select the versions, and then click Delete on top of the version list.
in
the Actions column for that version. To delete one
or multiple version in bulk, select the versions, and then click Delete on top of the version list.
¡ To
edit a version, click the Edit icon ![]() in
the Actions column for that version. You can edit
all information excluding image file.
in
the Actions column for that version. You can edit
all information excluding image file.
¡ To
upgrade a version, click the Upgrade icon ![]() in
the Actions column for that version.
in
the Actions column for that version.
¡ To refresh the version list, click Refresh on top of the version list.
3. To upload a version, click the Version Upload tab, configure the following parameters, and then click OK:
¡ Version Name: Specify a name for the version.
¡ Version Description: Specify a description for the version.
¡ Device Model: Select a device category, and then select models, or enter a model keyword in the field to filter device models, and then select the models.
¡ Image File: Click Select File to select a file, and then click Open. You can upload a maximum of 10 versions.
Use the CLI helper
Restrictions and guidelines
In non-Telnet mode, follow these restrictions and guidelines:
· You can directly log in and configure the AC by using a username and password.
· Do not press Tab to complete a command or display logs as you can do in the CLI. Interactive operations such as saving the configuration and deleting files are not supported.
· If an error occurs in using the CLI helper (command input failure for example), click Troubleshoot in the lower right corner to resolve the issue.
To use Telnet mode, you must first enable Telnet on the AC.
Procedure
1. From the left navigation pane, select Maintain > CLI Helper.
2. Select a branch, a site, and an AC from the top of the work pane.
3. To view basic device information, network information, or monitoring information, click Basic Info, Network Info, or Monitoring Info in the Common Commands area to the right of the page.
4. To enable Telnet mode, click the toggle button, click Connect, and then enter the username and password to log in to the AC.
5. To export operation records or set the cache size in Telnet mode, select Export Records or Set Cache from the Operation Records list.
Access the file system
1. From the left navigation pane, select Maintain > File System.
2. Select a branch, a site, and an AC from the top of the work pane.
3. Click General or Advanced to switch the display mode.
4. In general mode, click Manage for a specific file type.
5. To upload a file, make sure the AC has sufficient space, click Upload, and then select the file to upload. File upload is available only in Advanced mode.
6. To download a file, select that file, and then click Download.
7. To rename a file, select that file, and then click Rename. You cannot rename a folder.
8. To delete a file, select that file, and then click Delete. Deleted files cannot be restored. Use this function with caution.
Restore the configuration
1. From the left navigation pane, select Maintain > Restore.
2. Select a branch, a site, and a device from the top of the work pane.
3. To add a restore point, click Create, enter the reason, specify whether to use this file as the next startup configuration file, and then click OK.
4. To restore the current configuration of the device to the specified restore point, select the target configuration file, and then click Restore.
5. To view detailed information about a restore
point, click the Details icon ![]() .
.
6. To delete a restore point, click the Delete
icon ![]() .
.
Compare configuration
Restrictions and guidelines
You can only import configuration files with a size smaller than 10 M.
Procedure
1. From the left navigation pane, select Maintain > Compare Cfg.
2. To compare local configurations, click Load Local Configuration File or click the Load Local Configuration File icon ![]() in
the upper right corner, and then select a local file.
in
the upper right corner, and then select a local file.
3. To compare configurations on devices, perform the following tasks:
a. Click Read Device Configuration
File or click the Read Device Configuration File
icon ![]() in the upper right corner.
in the upper right corner.
b. In the dialog box that opens, select a site, selct a device, select a configuration, Running, Local, Cloud-Backed Up, and then click OK. If the device is offline, you can select only Cloud-Backed Up.
Configuration differences will be highlighted, and number of different command lines will be displayed at the bottom of the page.
Maintain devices
Restrictions and guidelines
You can restart only online devices.
Procedure
1. From the left navigation pane, select Maintain > Device Operation.
2. Select a branch and a site from the top of the work pane.
3. Click a device tab.
4. On the page that opens, select a device.
5. To save the running configuration on the device and then restart the device, click Save Config and Restart. During the restart process, the device is unavailable. Use this option with caution.
6. To restart the device immediately, click Restart. This operation removes unsaved configuration on the device. During the restart process, the device is unavailable. Use this option with caution.
7. To configure scheduled restart, click Scheduled Restart, select a restart policy, and configure a schedule. This operation removes unsaved configuration on the device. During the restart process, the device is unavailable. Use this option with caution.
8. To remove scheduled restart settings, click Remove Scheduled Restart Settings.
9. To save the configuration, click Save Config.
10. To reconnect the device to the Oasis platform, click Reset Cloud Connection. Use this option when Oasis connection errors occur.
Use tools to manage devices
Restrictions and guidelines
Only the packet capture tool is available.
Packet capture stops automatically when the capture duration is reached or when the size of the captured packets reaches 65536 KB. You can view the capture progress with auto refresh enabled on the Capture tab.
After the capture is finished, the capture results will be saved in the default download path automatically. You can also download capture files on the Capture Records tab. The capture files can be saved on the Oasis platform only for 7 days. Please download the files in time.
Procedure
1. From the left navigation pane, select Maintain > Tools.
2. Select a branch and a site from the top of the work pane.
3. Click Add, and then configure the parameters as required, for example, configuration name, AP, radio, capture duration, and filter rules.
4. To edit a capture configuration, click the
Edit icon ![]() in the Actions column for that configuration, and edit the settings
as needed.
in the Actions column for that configuration, and edit the settings
as needed.
5. To delete a capture configuration, click the
Delete icon ![]() in the Actions column for that configuration.
in the Actions column for that configuration.
6. To copy a capture configuration, click the
Copy icon ![]() in the Actions column for that configuration, and then change the configuration
name.
in the Actions column for that configuration, and then change the configuration
name.
Replace devices
Perform this task to synchronize device configuration to the Oasis platform and replace a device when the device fails.
Restrictions and guidelines
You must make sure the replacement device is the same model as the failed device.
Procedure
1. From the left navigation pane, select Maintain > Replace Devices.
2. Select a branch and a site from the top of the work pane.
3. On the Replacement
tab, click the Sync Now icon ![]() in
the Actions column for a device, and then select Do Not Save or Save & Continue.
in
the Actions column for a device, and then select Do Not Save or Save & Continue.
4. For the system to automatically synchronize device configuration, enable Auto Sync, and then click Auto Sync Time to specify an auto sync time. Then the system will synchronize configuration changes to Oasis when the device comes online or at the specified time.
5. Click the Replacement
icon ![]() in the Actions column for a device, and then select Register New Device & Replace or Replace with Registered Device.
in the Actions column for a device, and then select Register New Device & Replace or Replace with Registered Device.
6. To replace an AP, click Replace AP, and then enter the old AP SN and new AP SN.
7. To view replacement records, click the Records tab. You can refresh the page to view the most recent records.
Messages
Manage alarms
Restrictions and guidelines
You can edit the default alarm policy but cannot delete it.
View or export alarms
Procedure
1. From the left navigation pane, select Messages > Alarms.
The Alarm List tab displays alarm statistics collected during the specified time range.
2. To filter alarms, click Filter, specify the filtering criteria, and then click Search.
3. To export alarms, click Export.
The alarms will be exported to an Excel file.
Parameters
· Alarm Trend: Displays the alarm trend by alarm quantity.
· Alarm Severity: Displays alarm distribution by alarm severity.
· Alarm Type Top 5: Displays the five alarm types with the most alarms.
· Alarm Info: Displays the alarm list.
Subscribe to alarms
Procedure
1. From the left navigation pane, select Messages > Alarms.
2. Click the Subscription tab.
3. To add an alarm policy, click Add and then configure policy settings as needed.
4. To edit an alarm policy, click the Edit icon for that policy. Then, configure policy settings as needed.
Parameters
· By Area: Enable or disable alarm generation by area. After you enable this function, the system generates alarms only for APs in the selected areas.
· Notification: Select the method through which alarms are notified. Options include:
¡ Display but Not Push.
¡ Email—Send alarm emails to the email addresses bound to the selected accounts.
¡ TT Alarm—Send alarm emails to TT accounts.
· Triggered: Select the time during which alarms can be notified.
· Maintenance: Select a time range during which alarm notification or generation is forbidden.
· Alarm Info: Select types and severity levels of alarms to be notified. Available severity levels include Tip, Info, Minor, Major, and Critical.
View operation logs or login logs
1. From the left navigation pane, select Messages > Operation Logs.
2. To view operation logs, click the Operation Logs tab. You can click User Operation Logs to view site or device import logs.
3. To view login logs, click the Login Logs tab.
Manage fault reports
The system allows users to scan a QR code and report faults during network operation. You can perform this task to view, export, and processor the reported faults and configure fault report subscription.
The system saves fault reports generated in the last 12 months.
Export the QR code for fault reporting
1. From the left navigation pane, select Messages > Fault Reports.
2. Click Export QR Code for Fault Reporting.
3. Select the site, and then click Export.
View detailed fault report information
1. From the left navigation pane, select Messages > Fault Reports.
The page that opens displays brief information about fault reports, including site name, location, fault type, source, report time, and time of the most recent process.
2. Click the Details
icon ![]() for a fault report.
for a fault report.
The page that opens displays detailed information about the report. You can specify the processing state and the processing record for the report.
Process a fault report
1. From the left navigation pane, select Messages > Fault Reports.
You can select a processing state for each report on the brief information page or specify the processing state and record for a report from the detailed information page.
2. Click the Details
icon ![]() for a fault report.
for a fault report.
3. Specify the processing state and the processing record.
4. Click Submit.
Process a fault report
1. From the left navigation pane, select Messages > Fault Reports.
2. Click the Alarms Subscription link in the notes area.
Configure system settings
Enable or disable services
Restrictions and guidelines
Only Customer 5412 and later versions support smart O&M.
Configuration synchronization is enabled for cloud-managed APs by default. As a best practice, keep it enabled, and disable it only when you want to use locally configured settings on the APs.
Procedure
1. From the left navigation pane, select System > Service Switch.
2. To enable auto backup for a device, click the Auto Backup tab, select ON in the Service State column for that device, specify the backup interface and max backup copies, and then click OK. To enable auto backup for multiple devices in bulk, select the devices, click On on top of the list, specify the backup interface and max backup copies, and then click OK.
3. To disable autobackup for a device, select OFF in the Service State column for that device, and then click OK in the dialog box that opens. To disable auto backup for multiple devices in bulk, select the devices, click Off on top of the list, and then click OK in the dialog box that opens.
4. To view backup information for a device,
click the View icon ![]() in the Actions column for that device.
in the Actions column for that device.
5. To view backup information for a device when
a lot of records exist in the list, click the ![]() icon in the upper
right corner of the list, specify the device name or device SN.
icon in the upper
right corner of the list, specify the device name or device SN.
6. To enable or disable configuration synchronization for a cloud-managed AP, click the Cloud-Managed AP Config Sync tab.
7. On the page that opens, select ON or OFF in the Service State column for that AP, and then click OK. To enable or disable configuration synchronization for multiple cloud-managed APs in bulk, select the APs, click On or Off on top of the list, and then click OK.
8. To view or edit settings for a cloud-managed
AP, click the View icon ![]() in
the Actions column for that AP.
in
the Actions column for that AP.
Configure labels
1. From the left navigation pane, select System > Labels.
2. Click Add. Enter
a label name, select a color, and then click OK. To
add more labels, click ![]() .
.
3. To synchronize a label from an AP group, click the Sync from Groups tab, select Obtain AP Groups for AC, Obtain AP Groups for Hotel, or Obtain AP Groups for Area, select a device, select an AP group, and then click OK.
4. To delete a label, click the Delete icon ![]() in the Actions column for that label, and then click OK in the dialog box that opens. To delete one or
multiple labels in bulk, select the labels, and then click Delete on top of the label list.
in the Actions column for that label, and then click OK in the dialog box that opens. To delete one or
multiple labels in bulk, select the labels, and then click Delete on top of the label list.
5. To edit a label, click the Edit icon ![]() in the Actions column for that label, edit the label name and
color as needed, and then click OK.
in the Actions column for that label, edit the label name and
color as needed, and then click OK.
6. To bind a label to from APs, perform the following tasks:
a. Click the Bind
icon ![]() in the Actions column or click the
number in the Bound APs column for that label.
in the Actions column or click the
number in the Bound APs column for that label.
b. Select a site, select APs to bind to the
label in the Unbound APs area, click ![]() , and
then click OK.
, and
then click OK.
c. To unbind a label from APs, select the APs
in the Bound APs area, click ![]() , and
then click OK.
, and
then click OK.
7. To filter labels, click ![]() in
the upper right corner of the list, and then enter filter criteria.
in
the upper right corner of the list, and then enter filter criteria.
8. To filter APs bound to a label, click Smart O&M on the top navigation bar, and then select Network > APs > AP Reboot from the left navigation pane.
Manage subaccounts
About this task
For a subaccount, the supported Oasis features are determined by its role and the manageable branches and sites are authorized by its parent account.
Procedure
1. From the left navigation pane, select System > Subaccounts.
2. To add a subaccount, click the Add icon ![]() for that account
and then configure subaccount settings as needed.
for that account
and then configure subaccount settings as needed.
3. To assign branch and site permissions to a
subaccount, click the Permission icon ![]() for that
account and then select branches and sites as needed.
for that
account and then select branches and sites as needed.
4. To edit a subaccount, click the Edit icon ![]() for that account
and then configure account settings as needed.
for that account
and then configure account settings as needed.
5. To delete a subaccount, click the Delete icon ![]() for that account.
for that account.
Configure open platforms
1. From the left navigation pane, select System > Open Platforms.
2. To activate open APIs for third-party platforms, click Activate. The page displays the authentication key if open APIs have been activated.
3. To download the API file, click Download File. The file provides information about H3C Oasis platform APIs and the methods to configure API-related settings.
4. To push authenticated user information, click Edit. This feature requires the user to be capable of development. For more information, see H3C Oasis Authentication User Guide.
Configure an email server
To use the alarm feature, you must first configure an SMTP email server. If the SMTP email server is located on the external network, make sure the WBC access controller has Internet connectivity.
Configure authentication settings
Configure basic settings
Prerequisites
Before configuring Oasis platform authentication, complete the following tasks:
· Connect the device to the Oasis platform.
For more information, see H3C Oasis Platform Deployment Guide.
· Complete the VLAN and DHCP settings.
· Configure wireless services and make sure the APs can come online.
Configure settings on the device
Restrictions and guidelines
Only software version 5405 or higher supports deploying authentication settings automatically. For other software versions, manually configure the following settings on the device.
Configure general settings
1. Configure a portal authentication domain.
# Add an ISP domain named cloud and enter its view.
<Sysname> system-view
[Sysname] domain cloud
# Specify the authentication, authorization, and accounting methods as none.
[Sysname-isp-cloud] authentication portal none
[Sysname-isp-cloud] authorization portal none
[Sysname-isp-cloud] accounting portal none
[Sysname-isp-cloud] quit
2. Configure cloud portal authentication.
# Add a portal Web server named cloud and specify its URL and type. (If the administrator configures wireless service on the Oasis platform, the configuration will be deployed to the device automatically.)
[Sysname] portal web-server 1
[Sysname-portal-websvr-1] url http://oasisauth.h3c.com/portal/protocol
[Sysname-portal-websvr-1] server-type oauth
# Configure a match rule to redirect HTTP requests that carry the user agent string CaptiveNetworkSupport to the URL http://oasisauth.h3c.com/generate_404.
[Sysname-portal-websvr-1] if-match user-agent CaptiveNetworkSupport redirect-url http://oasisauth.h3c.com/generate_404
# Configure a match rule to redirect HTTP requests that carry the user agent string Dalvik/2.1.0(Linux;U;Android7.0;HUAWEI to the URL http://oasisauth.h3c.com/generate_404.
[Sysname-portal-websvr-1] if-match user-agent Dalvik/2.1.0(Linux;U;Android7.0;HUAWEI redirect-url http://oasisauth.h3c.com/generate_404
# Configure a temporary pass rule to allow user packets that contain user agent information Mozilla to pass and then redirect the packets destined for the URL http://captive.apple.com to URL http://oasisauth.h3c.com/portal/protocol.
[Sysname-portal-websvr-1] if-match original-url http://captive.apple.com user-agent Mozilla temp-pass redirect-url http://oasisauth.h3c.com/portal/protocol
# Configure a temporary pass rule to allow user packets that contain user agent information Mozilla to pass and then redirect the packets destined for the URL http://www.apple.com to URL http://oasisauth.h3c.com/portal/protocol.
[Sysname-portal-websvr-1] if-match original-url http://www.apple.com user-agent Mozilla temp-pass redirect-url http://oasisauth.h3c.com/portal/protocol
[Sysname-portal-websvr-cloud] quit
# Configure a temporary pass rule to temporarily allow user packets that access URL http://10.168.168.168 to pass.
[Sysname] portal web-server cloud
[Sysname-portal-websvr-1] if-match original-url http://10.168.168.168 temp-pass
# Enable the optimized captive-bypass feature for iOS users.
[Sysname] portal web-server 1
[Sysname-portal-websvr-1] captive-bypass ios optimize enable
[Sysname-portal-websvr-1] quit
# Enable direct portal authentication on service template cloud.
[Sysname] wlan service-template 1
[Sysname-wlan-st-1] portal enable method direct
# Configure the authentication domain as cloud and specify portal Web server cloud as the cloud portal Web server for portal authentication.
[Sysname-wlan-st-1] portal domain cloud
[Sysname-wlan-st-1] portal apply web-server 1
[Sysname-wlan-st-1] quit
# Enable portal temporary pass and set the temporary pass period to 20 seconds.
[Sysname] wlan service-template 1
[Sysname-wlan-st-1] portal temp-pass period 20 enable
[Sysname-wlan-st-1] quit
# Add an HTTP-based local portal Web service and enter its view.
[Sysname] portal local-web-server http
[Sysname-portal-local-websvr-http] quit
# Add an HTTPS-based local portal Web service and enter its view.
[Sysname] portal local-web-server https
[Sysname-portal-local-websvr-https] quit
# Enable the HTTP and HTTPS services.
[Sysname] ip http enable
[Sysname] ip https enable
# Enable validity check on wireless portal clients.
[Sysname] portal host-check enable
# Enable logging for portal user logins and logouts.
[Sysname] portal user log enable
# Configure destination-based portal-free rule1 to allow portal users to access the DNS service without authentication. (This example uses the 114.114.114.114 255.255.255.255.)
[Sysname] portal free-rule 1 destination ip 114.114.114.114 255.255.255.255
# Configure destination-based portal-free rules 2 and 4 to allow portal users to access the DNS service without authentication.
[Sysname] portal free-rule 2 destination ip any udp 53
[Sysname] portal free-rule 3 destination ip any tcp 53
[Sysname] portal free-rule 4 destination ip any tcp 5223
# Configure destination-based portal-free rule 5 to allow portal users to access the Oasis authentication server without authentication.
[Sysname] portal free-rule 5 destination oasisauth.h3c.com
# Configure destination-based portal-free rules 10 to 22 to allow portal users to access the Oasis authentication server without authentication.
[Sysname] portal free-rule 10 destination short.weixin.qq.com
[Sysname] portal free-rule 11 destination mp.weixin.qq.com
[Sysname] portal free-rule 12 destination long.weixin.qq.com
[Sysname] portal free-rule 13 destination dns.weixin.qq.com
[Sysname] portal free-rule 14 destination minorshort.weixin.qq.com
[Sysname] portal free-rule 15 destination extshort.weixin.qq.com
[Sysname] portal free-rule 16 destination szshort.weixin.qq.com
[Sysname] portal free-rule 17 destination szlong.weixin.qq.com
[Sysname] portal free-rule 18 destination szextshort.weixin.qq.com
[Sysname] portal free-rule 19 destination isdspeed.qq.com
[Sysname] portal free-rule 20 destination wx.qlogo.cn
[Sysname] portal free-rule 21 destination wifi.weixin.qq.com
[Sysname] portal free-rule 22 destination open.weixin.qq.com
# Enable portal safe-redirect.
[Sysname] portal safe-redirect enable
# Specify HTTP request methods permitted by portal safe-redirect.
[Sysname] portal safe-redirect method get post
# Specify browser types permitted by portal safe-redirect.
[Sysname] portal safe-redirect user-agent Android
[Sysname] portal safe-redirect user-agent CFNetwork
[Sysname] portal safe-redirect user-agent CaptiveNetworkSupport
[Sysname] portal safe-redirect user-agent MicroMessenger
[Sysname] portal safe-redirect user-agent Mozilla
[Sysname] portal safe-redirect user-agent WeChat
[Sysname] portal safe-redirect user-agent iPhone
[Sysname] portal safe-redirect user-agent micromessenger
Configure Facebook authentication
|
|
IMPORTANT: · Execute commands in this section after you finish the settings in "Configure general settings." · Free-rule 38 might disable the app from displaying pictures. Please configure this rule as needed or contact Technical Support. |
# Configure destination-based portal-free rules to allow portal users who send an HTTP/HTTPS request that carries Facebook-related host names to access network resources without authentication.
<Sysname> system-view
[Sysname] portal free-rule 31 destination facebook.com
[Sysname] portal free-rule 32 destination m.facebook.com
[Sysname] portal free-rule 33 destination www.facebook.com
[Sysname] portal free-rule 34 destination graph.facebook.com
[Sysname] portal free-rule 35 destination connect.facebook.net
[Sysname] portal free-rule 36 destination static.xx.fbcdn.net
[Sysname] portal free-rule 37 destination staticxx.fbcdn.com
[Sysname] portal free-rule 38 destination scontent-hkg-3-1.xx.fbcdn.net
Configure one-key authentication
1. On the top navigation bar, click Network.
2. From the left navigation pane, select Settings > ACs > Authentication.
3. Select a branch, a site, and a device from the top of the page.
4. To add an authentication template, click Add on the Authentication Templates tab.
5. To edit an authentication template, click
the Edit icon ![]() for that
authentication template.
for that
authentication template.
6. To bind an authentication template to a
wireless service, click the Edit icon ![]() for
that authentication template, select Yes from the Bind to Wireless Service field, and then click Apply. If the template has been bound to wireless
service, skip this step.
for
that authentication template, select Yes from the Bind to Wireless Service field, and then click Apply. If the template has been bound to wireless
service, skip this step.
7. Click the Draw
icon ![]() for the target authentication template.
for the target authentication template.
8. Click the One-Key tile in the Auth Configuration area, enable one-key authentication, and then configure other settings as needed.
9. Click OK or click Release in the upper right corner of the page.
Configure fixed account authentication
Restrictions and guidelines
If you do not configure the validity period or configure it as 0, the account never expires.
If you select Bind MAC Address and do not enter any MAC addresses, clients that use the fixed account are not limited.
If you select Sent by Email, the system sends the account name and password to the specified email address. The number of email addresses cannot exceed 10 and must be separated by commas.
Procedure
1. On the top navigation bar, click Network.
2. From the left navigation pane, select Settings > ACs > Users.
3. Click the Fixed Accounts tab.
4. Click Add.
5. Configure fixed account information as required.
6. To add or edit an authentication template,
select Settings > ACs
> Authentication from the navigation pane, and
then select a branch, a site, and a device from the top of the page. To add a
template, click Add on the Authentication
Templates tab. To edit a template, click the Edit
icon ![]() for that authentication template.
for that authentication template.
7. To bind an authentication template to a
wireless service, click the Edit icon ![]() for
that authentication template, select Yes from the Bind to Wireless Service field, and then click Apply. If the template has been bound to wireless
service, skip this step.
for
that authentication template, select Yes from the Bind to Wireless Service field, and then click Apply. If the template has been bound to wireless
service, skip this step.
8. Click the Draw
icon ![]() for the target authentication template.
for the target authentication template.
9. Click the Account tile in the Auth Configuration area, enable fixed account authentication, and then configure other settings as needed.
10. Disable other authentication methods.
11. Click OK or click Release in the upper right corner of the page.
Configure guest authentication
Restrictions and guidelines
After configuration, a guest can access the network only after the approver scans the QR code on the client and authorizes the client. The QR code is valid for five minutes. When the QR code expires, the guest must refresh the QR code.
Procedure
1. On the top navigation bar, click Services > Authentication.
2. From the left navigation pane, select Portal Authentication.
3. Click the Accounts tab.
4. Click the Guest Accounts tab, click Add.
An approver is added after the approver scans the QR code, and then enters the verification code. If the approver is deleted, the Oasis platform automatically removes the permission from the approver.
5. Select Settings > ACs > Authentication from the navigation pane, and then select a branch, a site, and a device from the top of the page.
6. To add an authentication template, click Add on the Authentication Templates
tab. To edit an authentication template, click the Edit
icon ![]() for that authentication template.
for that authentication template.
7. To bind an authentication template to a
wireless service, click the Edit icon ![]() for
that authentication template, select Yes from the Bind to Wireless Service field, and then click Apply. If the template has been bound to wireless
service, skip this step.
for
that authentication template, select Yes from the Bind to Wireless Service field, and then click Apply. If the template has been bound to wireless
service, skip this step.
8. Click the Draw
icon ![]() for the target authentication template.
for the target authentication template.
9. Click the Guest tile in the Auth Configuration area, and then enable guest authentication.
10. Select approvers.
The Approvers field only displays the approvers authorized by this account and all its subaccounts. For tenants, the Approvers field displays the approvers authorized by all its subaccounts.
11. Disable other authentication methods.
12. Click OK or click Release in the upper right corner of the page.
Configure Facebook authentication
With Facebook authentication enabled, users will be redirected to the Facebook login page for authentication. They can access the network only after granting the Oasis platform to obtain his or her Facebook information (nickname, profile, and email information) from Facebook.
Prerequisites
Before configuring Facebook authentication, you must complete the following tasks on Facebook:
1. Create a Facebook app and obtain the app ID.
2. Enable client OAuth login and Web OAuth login, and enter https://oasisauth.h3c.com as an OAuth redirect URI.
Procedure
1. On the top navigation bar, click Network.
2. Select Settings > ACs > Authentication from the navigation pane.
3. Select a branch, a site, and a device from the top of the page.
4. To add an authentication template, click Add on the Authentication Templates tab.
5. To edit an authentication template, click
the Edit icon ![]() for that
authentication template.
for that
authentication template.
6. To bind an authentication template to a
wireless service, click the Edit icon ![]() for
that authentication template, select Yes from the Bind to Wireless Service field, and then click Apply. If the template has been bound to a wireless
service, skip this step.
for
that authentication template, select Yes from the Bind to Wireless Service field, and then click Apply. If the template has been bound to a wireless
service, skip this step.
7. Click the Draw
icon ![]() for the target authentication template.
for the target authentication template.
8. Click the Facebook tile in the Auth Configuration area, enable authentication via Facebook, enter the App ID, and disable all the other authentication methods.
9. Click OK or click Release in the upper right corner of the page.
Configure member authentication
With member authentication enabled, members can access the network by entering their phone number, email address, or member ID on the authentication page. Non-members must register on the authentication page first and then access the network as members.
Procedure
1. On the top navigation bar, click Network.
2. Select Settings > ACs > Authentication from the navigation pane.
3. Select a branch, a site, and a device from the top of the page.
4. To add an authentication template, click Add on the Authentication Templates tab.
5. To edit an authentication template, click
the Edit icon ![]() for that
authentication template.
for that
authentication template.
6. To bind an authentication template to a
wireless service, click the Edit icon ![]() for
that authentication template, select Yes from the Bind to Wireless Service field, and then click Apply. If the template has been bound to a wireless
service, skip this step.
for
that authentication template, select Yes from the Bind to Wireless Service field, and then click Apply. If the template has been bound to a wireless
service, skip this step.
7. Click the Draw
icon ![]() for the target authentication template.
for the target authentication template.
8. Click the Member Authentication tile in the Auth Configuration area, enable member authentication, configure other parameters as needed, and disable all the other authentication methods.
9. Click OK or click Release in the upper right corner of the page.
Configure combined authentication
Restrictions and guidelines
Only fixed account authentication, member authentication, and Facebook authentication can be used together:
A user can access the network as long as the user passes one authentication.
Procedure
1. Configure settings on the device as described in "Configure settings on the device" if the device software version is below 5405.
2. Configure a minimum of two authentication methods. (Details not shown.)
Configure dumb terminal authentication
Restrictions and guidelines
If an account group contains accounts that have been authenticated, changing the validity period of the account group will change the validity period of all the accounts in the group.
You can enter the first three bytes to add MAC addresses in bulk. The validity period configuration for a complete MAC address and that for a three-byte MAC address are not mutually exclusive. Assume that you add MAC addresses that start with AA-BB-CC and specify a 5-day validity period and then add MAC address AA-BB-CC-11-22-33 and specify a 10-day validity period. The validity periods of dumb terminals with a MAC address of AA-BB-CC-11-22-33 and a MAC address that starts with AA-BB-CC are 10 and 5 days, respectively.
Procedure
1. On the top navigation bar, select Services > Authentication.
2. From the left navigation pane, select Portal Authentication.
3. Click the Accounts tab.
4. On the Dumb Terminal Accounts tab, click Edit Account Group.
5. Click Add.
6. Enter the required information and then click OK.
7. Select an account group and then click Add.
8. Enter a MAC address in the required format.
9. Click the Authentication Templates tab.
10. To add an authentication template, click Add. To edit an authentication template, click the Edit icon ![]() for that
authentication template.
for that
authentication template.
11. Click the Draw
icon ![]() for the target authentication template. You are placed on the Login tab.
for the target authentication template. You are placed on the Login tab.
12. Click the Dumb Terminal tile in the Auth Configuration area, and then enable dumb terminal authentication.
13. Select an account group.
14. Click OK or click Release in the upper right corner of the page.
15. To deploy a template, perform the following steps:
a. Click the Deploy
Template icon ![]() for that authentication template.
for that authentication template.
b. Click the ACs tab.
c. Select a branch or site.
d. Select an AC and then click Apply.
If no devices are displayed, please check the device version.
e. Select a service template or an SSID, and then click OK.
16. Enable MAC-triggered authentication on the device. For more information, see "Configure MAC-trigger authentication."
Configure bulk authentication
Perform this task to deploy authentication settings in bulk.
Restrictions and guidelines
The configuration of a bulk authentication
template takes precedence over that of a non-bulk authentication template. For
the non-bulk authentication template to take effect, click the Edit icon ![]() for that
authentication template, and then click Apply.
for that
authentication template, and then click Apply.
Before deploying the configuration in bulk, make sure the following requirements are met:
· The devices where bulk authentication is deployed are online. If a device is offline, the deployment fails. The device will load the most recent deployed configurations at start up.
· The software version must be 5405 or higher.
· The wireless service name is the same as the portal Web server.
Procedure
1. On the top navigation bar, select Services > Authentication.
2. On the Authentication Templates tab, click Add.
3. Click the Draw
icon ![]() for the target authentication template. For the detailed
configuration procedures of different authentication methods, see "Configure basic settings."
for the target authentication template. For the detailed
configuration procedures of different authentication methods, see "Configure basic settings."
4. To deploy a template, perform the following steps:
a. Click the Deploy
Template icon ![]() for that authentication template.
for that authentication template.
b. Click the ACs tab.
c. Select a branch or site.
d. Select an AC and then click Apply. If no devices are displayed, please check the device version.
Configure advanced settings
Enable the captive-bypass feature
Typically, the device pushes the authentication page to a client automatically when the client attempts to access a portal authentication network. The captive-bypass feature enables the device to push the portal authentication page to the client only when the user launches a browser.
To enable the captive-bypass feature, you must perform the following steps on the device:
1. Enter system view.
system-view
2. Enter portal Web server view of Web server cloud.
portal web-server cloud
3. Enable the captive-pass feature.
captive-bypass enable
Manage fixed accounts
This feature is available only for fixed account authentication.
Perform this task to delete, import, or export fixed accounts in bulk.
To manage fixed accounts:
1. On the top navigation bar, select Network.
2. From the left navigation pane, select Settings > ACs > Users.
3. Click the Fixed Accounts tab.
4. To delete fixed accounts, select the target fixed accounts and then click Delete.
5. To import fixed accounts, click Import, download the template file and fill in the file as required, and then upload the template file.
6. To export fixed accounts, click Export.
Enable self-service password change
This feature is available only for fixed account authentication.
This feature enables users to change passwords at login. With this feature disabled, only the administrators can change the passwords of fixed accounts.
To enable self-service password change:
1. On the top navigation bar, select Network.
2. From the left navigation pane, select Settings > ACs > Authentication.
3. Select a branch, a site, and a device from the top of the page.
4. Click the Draw
icon ![]() for the target authentication template.
for the target authentication template.
5. Click the Account tile in the Auth Configuration area.
6. Enable Change Password.
Enable collaboration with an LDAP server for fixed account verification
This feature is available only for fixed account authentication.
Perform this task to enable the Cloudnet platform to report usernames and passwords to the LDAP server for verification when users attempt to access the WLAN by using fixed accounts. This frees network administrators from importing account information from the LDAP server to the Cloudnet platform.
Restrictions and guidelines
To use this feature, make sure the LDAP server has been configured.
Procedure
1. On the top navigation bar, select Network.
2. From the left navigation pane, select Settings > ACs > Authentication.
3. Select a branch, a site, and a device from the top of the page.
4. Click the Draw
icon ![]() for the target authentication template.
for the target authentication template.
5. Click the Account tile in the Auth Configuration area.
6. Enable LDAP and configure LDAP settings as needed.
7. Click Verify to verify the LDAP settings.
Configure Internet access settings
This feature is not available for dumb terminal authentication. Some Internet access settings are not available for Facebook authentication.
Procedure
1. On the top navigation bar, select Network.
2. From the left navigation pane, select Settings > ACs > Authentication.
3. Select a branch, a site, and a device from the top of the page.
4. Click the Draw
icon ![]() for the target authentication template.
for the target authentication template.
5. Click to expand the Advanced Settings menu in the Auth Configuration area.
6. Configure Internet access settings as needed.
Parameters
· Session Timeout: Maximum continuous online duration of a client upon one authentication. A client will be logged off when its continuous online duration exceeds the timeout. The session timeout cannot be larger than the daily online duration.
· Daily Online Duration: Maximum online duration of a client for a day. A client will be logged off when its online duration for a day exceeds the limit. The daily online duration cannot be smaller than the session timeout.
· Minimum Traffic and Idle Timer: Logs off a client if its traffic within an idle timer fails to reach the minimum traffic threshold.
· Client Rate Limit: Limited rate of uplink and downlink client traffic. This setting is supported in versions higher than 5417P01.
· HTTPS for Landing and Login: Use HTTPS sessions for the Landing and Login page. This setting is not available for app authentication.
· Permit PC: Permit PCs to access the WLAN.
Manage dumb terminal account groups
Perform this task to create, delete, or edit dumb terminal account groups and import or export dumb terminal accounts.
If you enable dumb terminal authentication and specify an account group, only dumb terminals in the group can access the WLAN.
To manage dumb terminal account groups:
1. On the top navigation bar, select Service > Authentication.
2. From the left navigation pane, select Portal Auth.
3. On the Dumb Terminal Accounts tab, configure dumb terminal account groups.
Configure portal automated authentication
This feature allows users that have been authenticated to access the network without re-authentication within the auth-free period. The following modes are available:
· Portal redirection—In this mode, users must run a browser to trigger automatic portal authentication. This mode supports pushing ads to clients.
· MAC-trigger—In this mode, users can access the WLAN without running a browser. This mode does not support pushing ads to clients.
Configure portal redirection authentication
1. On the top navigation bar, select Network.
2. From the left navigation pane, select Settings > ACs > Authentication.
3. Select a branch, a site, and a device from the top of the page.
4. Click the Draw
icon ![]() for the target authentication template.
for the target authentication template.
5. Click to expand the Advanced Settings menu in the Auth Configuration area.
6. Click the Auth-Free tab and enable the Free Auth feature.
7. (Optional.) Enable Push Page to push the login success page and home page to clients. If you do not enable this feature, the system pushes only the home page.
Configure MAC-trigger authentication
1. Configure portal redirection authentication. For more information, see "Configure portal redirection authentication."
2. Configure MAC-trigger authentication on the device:
a. Configure the MAC binding server.
# Create a MAC binding server and enter its view.
<Sysname> system-view
[Sysname] portal mac-trigger-server cloud
# Enable cloud MAC-trigger authentication. Set the maximum number of MAC binding query attempts to 2 and the query interval to 3 seconds.
[Sysname-portal-mac-trigger-server-cloud] cloud-binding enable
[Sysname-portal-mac-trigger-server-cloud] binding-retry 2 interval 3
[Sysname-portal-mac-trigger-server-cloud] quit
b. Apply MAC binding server 1 to service template cloud.
[Sysname] wlan service-template 1
[Sysname-wlan-st-1] portal apply mac-trigger-server cloud
Configure inter-site and inter-SSID re-authentication
This feature is available only for bulk authentication.
This feature allows clients that have been authenticated to roam between wireless services associated with different sites or different SSIDs for the same site without re-authentication. These wireless services must use the same authentication template or have the same SSID.
To configure inter-site and inter-SSID re-authentication:
1. On the top navigation bar, select Service > Authentication.
2. From the left navigation pane, select Portal Auth.
3. On the Authentication
Templates tab, click the Draw icon ![]() for
the target template.
for
the target template.
4. Click to expand the Advanced Settings menu in the Auth Configuration area.
5. Click the Auth-Free tab and enable Free Auth.
6. Configure inter-site and inter-SSID re-authentication.
Configure Internet access control
Perform this task to specify the time ranges during which users are allowed to access the WLAN.
To configure Internet access control:
1. On the top navigation bar, select Network.
2. From the left navigation pane, select Settings > ACs > Authentication.
3. Select a branch, a site, and a device from the top of the page.
4. Click the Draw
icon ![]() for the target authentication template.
for the target authentication template.
5. Click to expand the Advanced Settings menu in the Auth Configuration area.
6. Click the Internet Access Control tab and specify the time ranges.
Configure the developer mode
|
|
CAUTION: Editing the codes of existing functions might disable Cloudnet authentication. Please use this feature with caution. |
The developer mode allows users to modify the source codes of an authentication template for customization purposes.
To configure the developer mode:
1. On the top navigation bar, select Network.
2. From the left navigation pane, select Settings > ACs > Authentication.
3. Select a branch, a site, and a device from the top of the page.
4. Click the Draw
icon ![]() for the target authentication template.
for the target authentication template.
5. Click Developer Mode in the upper right corner.
Configure the domain name whitelist and blacklist
Restrictions and guidelines
This feature takes effect only when wireless authentication is configured.
Procedure
1. On the top navigation bar, select Network.
2. From the left navigation pane, select Settings > ACs > Authentication.
3. Click the Domain Name Whitelist or Domain Name Blacklist tab to configure the whitelist or blacklist.
If both the whitelist and blacklist are configured, the blacklist takes effect.
View or export history of authentication template deployment
Perform this task to view the history of all authentication template deployment or deployment in the current day, past 7 days, or past 30 days.
To view or export history of authentication template deployment:
1. On the top navigation bar, select Service > Authentication.
2. From the left navigation pane, select Portal Auth.
3. On the Authentication
Templates tab, click the Apply icon ![]() for
the target template.
for
the target template.
4. Click the corresponding network tab to view the deployment history.
Configure the client blacklist
Perform this task to forbid specific clients to access the WLAN.
Restrictions and guidelines
This feature takes effect only on offline clients. If you add an online client to the blacklist, the client will be rejected at the next access attempt.
Procedure
1. On the top navigation bar, select Network.
2. From the left navigation pane, select Settings > ACs > Users.
3. To add users to the blacklist, perform either of the following tasks:
¡ On
the Guests tab, click the Add
to Blacklist icon ![]() for the target user.
for the target user.
¡ On the Blacklist tab, click Add.
4. To remove users from the blacklist, select the users on the Blacklist tab, and then click Delete.
Log off online users
Perform this task to log off specific online users or all online users.
Restrictions and guidelines
This feature does not take effect on auth-free users.
Procedure
1. On the top navigation bar, select Network.
2. From the left navigation pane, select Network > Clients > Guest Details.
3. On the Online Clients tab, click Authenticated Clients.
4. To log off specific clients, select the clients and then click Log Off Selected Users. To log off all clients, click Log Off All Users.
Configure portal fail-permit
Portal fail-permit allows users to have network access without portal authentication when the access device detects that the portal authentication server or portal Web server is unreachable.
After portal authentication resumes, unauthenticated users must pass portal authentication to access the network. Users who have passed portal authentication before the fail-permit event can continue accessing the network.
Restrictions and guidelines
For this feature to take effect, make sure you have configured basic settings on the device. For more information, see "Add a device from the CLI."
Procedure
1. Enable portal fail-permit.
<Sysname> system-view
[Sysname] wlan service-template cloud
[Sysname-wlan-st-cloud] portal fail-permit web-server
[Sysname-wlan-st-cloud] quit
2. Configure portal Web server detection.
|
|
CAUTION: To avoid portal server flapping, follow the provided order to configure portal Web server detection. |
# Specify the URL and the type for portal Web server detection.
[Sysname] portal web-server cloud
[Sysname-portal-websvr-cloud] server-detect url http://oasisauth.h3c.com/portal/ping detect-type http
# Configure server detection:
¡ Set the detection interval to 10 seconds.
¡ Set the maximum number of consecutive detection failures to 2.
¡ Configure the device to send a log message and a trap massage after server reachability status changes.
[Sysname-portal-websvr-cloud] server-detect interval 10 retry 2 log trap
[Sysname-portal-websvr-cloud] quit
Configure 802.1X authentication
Configure 802.1X authentication for a single device
1. On the top navigation bar, select Network.
2. From the left navigation pane, select Settings > ACs > 802.1X Auth.
3. Select a branch, a site, and a device from the top of the page.
4. Click Sync from Devices to synchronize authentication policies and RADIUS schemes configured on the device to the cloud platform.
5. Configure the authentication policy:
a. Enable 802.1X authentication.
b. Specify the authentication protocol.
- If you select EAP, the system enables EAP relay and uses EAP to authenticate clients. Clients must also use EAP at association.
- If you select CHAP, the system enables EAP termination and uses CHAP to authenticate clients.
- If you select PAP, the system enables EAP termination and uses PAP to authenticate clients.
6. Configure RADIUS schemes:
¡ To add a scheme, click Add and then configure the following parameters:
- Scheme name.
- Primary authentication server IP, port, and share key for authentication.
- Primary accounting server IP, port, and share key for accounting.
- ISP domain for client access.
- Domain name deployment.
- NAS IP (source address used by the device to send RADIUS packets). Make sure the address is the same as the access device address configured on the RADIUS server.
¡ To
edit a scheme, click the Edit icon ![]() for
the scheme.
for
the scheme.
¡ To
delete a scheme, click the Delete icon ![]() for
the scheme.
for
the scheme.
7. Configure scheme application:
¡ To apply a scheme to the device, click Add, and then select the access method, RADIUS scheme, and authentication port or SSID.
¡ To
remove an applied scheme, click the Delete icon ![]() for
the scheme.
for
the scheme.
Configure 802.1X authentication for multiple devices in bulk
1. On the top navigation bar, select Service > Authentication.
2. From the left navigation pane, select 802.1X Auth.
3. On the RADIUS Scheme Template tab, configure RADIUS schemes:
¡ To add a scheme, click Add and then configure the following parameters:
- Scheme name.
- Primary authentication server IP, port, and share key for authentication.
- Primary accounting server IP, port, and share key for accounting.
- ISP domain for client access.
- Domain name deployment.
¡ To
edit a scheme, click the Edit icon ![]() for
the scheme.
for
the scheme.
¡ To
delete a scheme, click the Delete icon ![]() for
the scheme.
for
the scheme.
4. On the 802.1X Auth Template tab, configure 802.1X authentication policies:
a. To add a policy, click Add, and then specify the policy name, authentication protocol, and RADIUS scheme.
- If you select EAP as the protocol, the system enables EAP relay and uses EAP to authenticate clients. Clients must also use EAP at association.
- If you select CHAP as the protocol, the system enables EAP termination and uses CHAP to authenticate clients.
- If you select PAP as the protocol, the system enables EAP termination and uses PAP to authenticate clients.
b. To apply a policy, click the ![]() icon,
and then select the site, device category, device name, and interface. You can
add multiple entries and apply them together.
icon,
and then select the site, device category, device name, and interface. You can
add multiple entries and apply them together.
c. To view the policy application state,
including success records and unapplied devices, click the ![]() icon.
icon.
d. To edit a policy, click the ![]() icon
for the policy.
icon
for the policy.
e. To delete a policy, click the ![]() icon
for the policy.
icon
for the policy.
Perform smart operations and maintenance
By integrating cloud, network, and endpoint, Cloudnet platform smart operations and maintenance (O&M) provides network monitoring anywhere anytime and device O&M with ease. It offers excellent user experience through displaying network monitoring data in a clear and organized way. In addition, smart O&M provides abundant data, such as basic device information, health information, channel heatmaps, client event history and health information, greatly lowering the cost for network inspection.
Restrictions and guidelines
· For software versions lower than 5412, some functions are unavailable or the displayed data is incorrect. Please upgrade your software to the most recent version.
· If no device exists in a site, no data will be displayed.
Access the smart O&M menu
You can use either of the following methods to access the smart O&M menu:
· Click Smart O&M on the top navigation bar.
· Click the O&M link on a site tile on the Network > Network > Dashboard page.
Access the dashboard
View system summary
Restrictions and guidelines
System summary information displayed on the page are collected from the specified device during the selected time range, unless otherwise stated.
Procedure
1. Access the Smart O&M menu.
You are placed on the Summary page.
2. Select a site and a device from the top of the page, and specify a time range.
Parameters
· Network Health: Displays the score of the entire network. The network is graded based on the AC, AP, and client scores in the site.
· Health Status: Displays the proportion of each network health state in the site during the specified time range based on statistics collected at intervals of 5 minutes.
· Affected AP Statistics: Displays the proportion of APs affected by network issues and the proportion of APs not affected by network issues.
· Affected Client Statistics: Displays the proportion clients affected by network issues and the proportion of clients not affected by network issues.
· Alarms: Displays the number of alarms at each severity level, the total number of alarms, and the number of active alarms.
· Online Devices: Displays the online device quantity and total device quantity by device type. If you select only one AC, the system displays only information about APs associated with the AC.
· Health Scores: Displays the health score trend of ACs, APs, and clients during the selected time range in the site. The system collects health statistics at intervals of 5 minutes. The displayed time interval varies by the specified time span.
¡ AC Health: Displays AC scores in a trend graph. ACs are graded based on CPU usage and traffic.
¡ AP Health: Displays AP scores in a trend graph. APs are graded based on channel usage, client quantity, and client RSSI.
¡ Client Health: Displays client scores in a trend graph. Clients are graded based on channel usage, RSSI, and roaming frequency.
You can click the AC, AP, or client health link to access the detailed health information page.
· Issue Distribution: Displays statistics about issues occurred on all devices or the specified device during the selected time range in the site.
· Issue Trend: Displays issue trend during the selected time range. You can filter issues by issue type. The system collects issue statistics at intervals of 5 minutes.
· Client Association Trend: Displays the number of associated clients on all devices or the specified device during the selected time range in the site. The system collects client statistics at intervals of 5 minutes. The displayed time interval varies by the specified time span.
· Traffic Trend: Displays uplink and downlink traffic trend on all devices or the specified device during the selected time range in the site. The system collects traffic statistics at intervals of 5 minutes. The displayed time interval varies by the specified time span.
View real-time connection information
Procedure
1. Access the Smart O&M menu.
You are placed on the Summary page.
2. From the left navigation pane, select Dashboard > Connecting.
3. Click Refresh to view the most recent client, radio, and AP information.
Parameters
· Client
The bar chart displays the number of online clients by frequency band.
The Details area displays client health, RSSI, packet loss, retransmission, delay, speed, and traffic information. You can click a section in the area to display the online client list filtered by the parameter.
· Radio
The bar chart displays the number of radios by frequency band.
The Details area displays radio channel usage, RSSI, packet loss, retransmission, delay, speed, and associated client information. You can click a section in the area to display the radio list filtered by the parameter.
· AP
The area displays AP health, CPU usage, and memory usage information. You can click a section in the area to display the online AP list filtered by the parameter.
Manage issues
View issue information
Restrictions and guidelines
· Issue statistics displayed on the page are collected from the specified device during the selected time range, unless otherwise stated.
· Issues reported by an AP might occur on the AP or a client associated with the AP, or in the WLAN environment. Network administrators must analyze an issue step by step to find the root cause.
Procedure
1. Access the Smart O&M menu.
2. To access the Issue Analysis page, use the following methods:
¡ On the Dashboard page, click an issue type in the Issue Distribution area.
¡ From the left navigation pane, select Issues > Issue Analysis.
3. Select a site and a device from the top of the page.
4. Click the Dashboard
icon ![]() or an issue type.
or an issue type.
Parameters
For the dashboard:
· Issue Distribution: Displays all issues occurred on all devices or the specified device during the selected time range in the site.
· Issue Trend: Displays the trend of issues. You can filter issues by issue type. The system collects issue statistics at intervals of 5 minutes.
· Affected AP Statistics: Displays the proportion of affected APs and the proportion of unaffected APs.
· Affected Client Statistics: Displays the proportion of affected clients and the proportion of unaffected clients.
For a specific issue type:
· Statistics: Displays the numbers of issues, involved APs, involved clients, and online clients. The system collects statistics at intervals of 5 minutes.
You can use the scroll bar below the chart to adjust the time range displayed in the line chart.
To view detailed information for a specific moment, click the point of time on the X coordinate in the line chart.
· Statistics Analysis: Displays the issue distribution and issue trend. This tab is available only for some issue types.
· Involved APs: Displays information about APs affected by the issues, including AP name, AC, issue occurrences, and involved client quantity. This tab is available only for some issue types.
To view detailed information about an AP or AC, click the AP or AC name.
To view raw data about an AP and the issue type, click the issue occurrences.
· Involved Clients: Displays information about clients affected by the issues, including client MAC address, vendor, IP address, issue occurrences, and the most recent occurrence time. This tab is available only for some issue types.
To view raw data about a client and the issue type, click the issue occurrences.
· Raw Data: Displays detailed information about issues of the type, including the occurrence time and client, AP, AC, and radio information.
The items displayed vary by issue type.
To view detailed information about an AP or AC, click the AP or AC name.
· Impact: Displays issue influence by occurrence or client. Each rectangle represents a specific issue and has the numbers of occurrences for the top N involved items (device, client, or vendor) displayed on it. A larger rectangle represents a greater impact.
View alarm information
Restrictions and guidelines
Issue statistics displayed on the page are collected from the specified site during the selected time range, unless otherwise stated.
Procedure
1. Access the Smart O&M menu.
2. To access the Alarms page, use the following methods:
¡ On the Dashboard page, click Total or Active in the Issue Distribution area.
¡ From the left navigation pane, select Issues > Alarms.
You are placed on the Alarm List tab.
3. Select a site from the top of the page.
Parameters
· Alarm Trend: Displays the alarm quantity trend.
· Alarm Severity: Displays the numbers of generated alarms and cleared alarms by severity level. The severity levels include critical, major, minor, info, and tip.
· Alarm Type Top 5: Displays the top 5 alarm types that have the most alarms.
· Alarm Info: Allows you to filter and export alarms.
¡ To filter alarms, click Filter, specify the target alarm severity, state, type, site, and device, and then click Search.
¡ To clear the filtering criteria, click Reset.
¡ To export the displayed alarms, click Export. The alarms will be saved as an electronic form in compressed format.
¡ To mark alarms as read in bulk, select the alarms, and then click Mark As Read.
¡ To mark all alarms as read, click Mark All As Read.
¡ To view device details, click the name of an alarm device.
Subscribe to alarms
Perform this task to send alarms to network administrators.
Procedure
1. Access the Smart O&M menu.
2. To access the Alarms page, use the following methods:
¡ On the Dashboard page, click Total or Active in the Issue Distribution area.
¡ From the left navigation pane, select Issues > Alarms.
3. Select a site from the top of the page.
4. Click the Subscription tab.
5. To add an alarm policy, click Add, and then specify the parameters as needed.
Parameters
· Area: Allow only APs in the specified area to report alarms.
· Alarm Method: Select the alarm method. Options include:
¡ Email—Pushes alarms to the specified email addresses. You must also configure the SMTP server.
¡ Display Only—Displays alarms on the Cloudnet platform only, but does not push alarms to administrators.
¡ TT Alarm—Pushes alarms to the TT account for the Cloudnet account. This method is available only for specific Cloudnet accounts.
· Time: Select the time at which alarms will be sent.
· Maintenance: Allow the system to generate but not push alarms or disable the system from generating alarms during the specified time period.
· Alarm Info: Select alarms to notify and specify the alarm severity levels.
View client statistics
View client health information
Restrictions and guidelines
The system collects client statistics at intervals of 5 minutes.
The system scores client health based on client RSSI, uplink rate, downlink rate, packet loss rate, retransmission rate, delay, and issues.
Procedure
1. Access the Smart O&M menu.
2. From the left navigation pane, select Clients > Wireless > Health.
The Client Health page opens.
3. Select a site and a device from the top of the page.
4. To view detailed client information for a specific moment, click the bar for the moment in the Client Health graph.
You can adjust the scroll bar width and drag the scroll bar to zoom in or out information for a specific moment.
The Client Performance Details area displays detailed information about the clients. To display more columns, click the + / - icon, and then select the target columns.
5. To save the data about clients, click Export in the Client Performance Details area. The data will be saved as an electronic form in compressed format.
6. To view detailed information about a client, click the MAC address link of the client in the Client Performance Details area.
7. To change the VIP level of a client, click the value in the VIP level column for the client in the Client Performance Details area.
8. To view detailed information about the AP associated with a client, click the associated AP link in the Client Performance Details area.
9. To view detailed information about the AC associated with a client, click the associated AC link in the Client Performance Details area.
Parameters
· Excellent: The client has a score of 80 or higher.
· Good: The client has a score in the range of 65 (included) to 80.
· Average: The client has a score smaller than 65.
View client health information in common mode
Restrictions and guidelines
· The system collects client connection statistics at intervals of 5 minutes.
· For ACs, only ACs of version 5420 or higher supports deep analysis. Before using deep analysis on the Cloudnet platform, execute the wlan client inspect enable command in AP view or AP group view from the CLI of the device.
Procedure
1. Access the Smart O&M menu.
2. From the left navigation pane, select Clients > Wireless > Health.
The Client Health page opens.
3. Select a site and a device from the top of the page.
4. Click the MAC address link of a client in the Client Performance Details area. You are placed on the Client Info tab.
5. To view detailed information about the AP or AC associated with the client, click the AP or AC name in the Connection Info area.
Parameters
· Statistics: Displays client uplink rate, downlink rate, and average signal strength.
· Basic Client Info: Displays MAC, IP, IPv6, vendor, client mode, and username about the client.
· Connection Info: Displays the client online status, access service, associated AP, and associated AC. To view detailed information about an AP or AC, click the AP or AC name.
· Score Trend: Displays the client score for a specific moment when you hover over the trend graph and displays client health issues when you hover over a low score.
· Client Logs: Displays client online, offline, and roaming events and client operation exceptions.
¡ Rate Level: Displays packet transmission information between AP and client by rate level range when you click Rate Level, which is available for an offline event or online event of an online client.
¡ Deep Analysis: Displays the packet exchange process when you click Deep Analysis, which is available for an online event, online failure event, and DHCP lease extension event.
¡ Packet Failure Percentage: Number of packets that have failed to be sent at a certain rate level to the total number of packets sent at that rate level.
View client health information in expert mode
Procedure
1. Access the Smart O&M menu.
2. From the left navigation pane, select Clients > Wireless > Health.
The Client Health page opens.
3. Select a site and a device from the top of the page.
4. Click the MAC address link of a client in the Client Performance Details area, and then click the Expert Mode tab.
Parameters
· Basic Client Info: Displays MAC, IP, IPv6, vendor, client mode, and protocol type about the client.
· Health Report: Displays metrics and their current values and reference values.
¡ The current value is the average value of each metric in the previous statistics collection period.
¡ If
the current value exceeds the reference value, a red icon ![]() appears
after the reference value.
appears
after the reference value.
¡ If the client is offline, the current value displays the client information before it goes offline.
· Client Connection Info: Displays signal strength, uplink and downlink traffic, uplink and downlink rate, retransmission rates, packet loss rate, latency, and channel usage.
To view detailed information, click the trend graph for a specific metric.
To capture packets, click Capture to access the Network > Maintain > Tools page. The system automatically fills AC and AP information for the client in the input boxes. You can complete the other packet capture parameters and then start the packet capture task.
· Neighbor Client: Displays the number of clients (including the client itself) that come online on the same radio as a client during each time period. To view detailed information about the clients, click the bar for a specific moment in the graph.
· Client Logs: Displays client online, offline, and roaming events and client operation exceptions. To edit columns to display, click the + / - icon.
¡ Rate Level: Displays packet transmission information between AP and client by rate level range when you click Detail in the Rate Level column, which is available for an offline or online event of an online client.
¡ Deep Analysis: Displays the packet exchange process when you click Detail in the Deep Analysis column, which is available for an online event and online failure event.
¡ DHCP Lease Extend: Displays the packet exchange process when you click Detail in the DHCP Lease Extend column, which is available for a DHCP lease extension event.
¡ Packet Failure Percentage: Number of packets that have failed to be sent at a certain rate level to the total number of packets sent at that rate level.
View online client information
1. Access the Smart O&M menu.
2. From the left navigation pane, select Clients > Wireless > Online Clients.
The Online Client List opens.
3. To filter online clients, click Filter, specify the filtering criteria, and then click Search.
4. To view the most recent information, click Refresh.
View authentication analysis results
Procedure
1. Access the Smart O&M menu.
2. From the left navigation pane, select Clients > Wireless > Access Analysis.
You are placed on the Authentication tab.
3. Select a site and a device from the top of the page.
Parameters
· Access Success Rate Trend: Displays distribution of clients by access success rate in the specified time range. The system collects client statistics at intervals of 5 minutes.
· By Avg Durations: Displays distribution of clients by average association and authentication durations every hour, every day, or every week. If you click Week at the upper right of the graph, the graph displays statistics in the last week.
The association and authentication duration of clients that fail to access the network will not be counted.
· By Avg Authentication Durations: Displays distribution of clients by average 802.1X and MAC authentication durations every hour, every day, or every week. If you click Week at the upper right of the graph, the graph displays statistics in the last week.
The authentication duration of clients that fail the authentication will not be counted.
View association and disassociation analysis results
Restrictions and guidelines
The system collects the statistics every hour.
Procedure
1. Access the Smart O&M menu.
2. From the left navigation pane, select Clients > Wireless > Access Analysis.
3. Click the Association and Disassociation tab.
4. Select a site and a device from the top of the page.
5. To save the data, click Export in the target area. The data will be saved as an electronic form in compressed format.
Parameters
· By Abnormal Accesses: Displays the abnormal client access trend. The system collects statistics every hour. Only reasons about clients with the top 10 abnormalities are displayed.
· By Disassociations: Displays the client disassociation trend. The system collects statistics every hour. Only reasons about clients with the top 10 disassociations are displayed.
· Abnormal Clients Top 100: Displays statistics about clients with access exceptions at a specific time when you click the bar for that time in the By Abnormal Accesses graph. To view details about a client, click the client MAC address link. To view details about an AP, click the AP name link.
· APs with Most Abnormal Clients Top 100: Displays statistics about APs with which clients with access exceptions were associated at a specific time when you click the bar for that time in the By Abnormal Accesses graph. To view details about an AP, click the AP name link. To view AC details, click the AC name link.
· Disassociated Clients Top 100: Displays top 100 disassociated clients at a specific time when you click the bar for that time in the By Disassociations graph. To view details about a client, click the client MAC address link. To view details about an AP, click the AP name link.
· APs with Most Disassociated Clients Top 100: Displays top APs with the most disassociated clients at a specific time when you click the bar for that time in the By Disassociations graph. To view details about an AP, click the AP name link. To view AC details, click the AC name link.
View IP monitoring results
Restrictions and guidelines
· IPv4 address monitoring is enabled by default. You can execute the undo client ipv4-snooping dhcp-learning enable or undo client ipv4-snooping arp-learning enable command in wireless service template view to disable the client from obtaining IPv4 addresses through DHCP or ARP, respectively.
· IPv6 address monitoring is disabled by default. You can execute the client ipv6-snooping dhcpv6-learning enable or client ipv6-snooping nd-learning enable command in wireless service template view to enable the client to obtain IPv6 addresses through DHCPv6 or ND, respectively.
Procedure
1. Access the Smart O&M menu.
2. From the left navigation pane, select Clients > Wireless > Access Analysis.
3. Click the IP Monitoring tab.
4. Select a site and a device from the top of the page.
5. To view detailed information about a client, click the MAC address link in the IPv4 Monitor table.
6. To view detailed information about IPv4
monitoring, click the IPv4 Monitor Details icon ![]() for
the target client in the IPv4 Monitor table.
for
the target client in the IPv4 Monitor table.
7. To view detailed information about IPv4
monitoring, click the IPv6 Monitor Details icon ![]() for
the target client in the IPv6 Monitor table.
for
the target client in the IPv6 Monitor table.
8. To save the data, click Export. The data will be saved as an electronic form in compressed format.
Parameters
· IPv4 Monitor: Displays information about clients when they obtain an IPv4 address through DHCP for the first time.
· IPv4 Monitor Details: Displays detailed information about IPv4 monitor for the target client.
· IPv6 Monitor: Displays information about clients when they obtain an IPv6 address through DHCPv6 for the first time.
· IPv6 Monitor Details: Displays detailed information about IPv6 monitor for the target client.
· Online Duration—Time elapsed since a client came online and to the time when the client obtained an IPv4 or IPv6 address for the first time.
· Detection Via—The method used to obtain an IPv4 or IPv6 address for a client when it comes online or it's IP addresses change.
View client statistics
Restrictions and guidelines
The system collects statistics about client quantity and traffic at intervals of 5 minutes.
The displayed time interval varies by the specified time span.
Procedure
1. Access the Smart O&M menu.
2. From the left navigation pane, select Clients > Wireless > Summary.
3. Select a site and a device from the top of the page.
Parameters
· By WLAN Service: Displays distribution of clients by associated wireless services.
· By Vendor: Displays distribution of clients by vendor.
· By Authentication Method: Displays client statistics by authentication method.
· By AP Group: Displays client statistics by AP group.
· Client Type: Displays client distribution by client type.
· Client Association Trend (By AP Group): Displays the top 32 AP groups that have the most associated clients on all devices or the specified device during the selected time range. To save the data, click Export. The data will be saved as an electronic form in compressed format.
· Client Association Trend (By Wireless Service): Displays the top 16 wireless services that have the most associated clients on all devices or the specified device during the selected time range. To save the data, click Export. The data will be saved as an electronic form in compressed format.
· Client Association Trend (By Frequency Band): Displays distribution of 2.4 GHz and 5 GHz clients.
· Client Traffic Trend (By Frequency Band): Displays client statistics by total uplink and downlink traffic. If you click a point in the graph, the Top N Clients by Total Traffic list opens below the trend graph. To view details about a client, click the client MAC address in the list. To view details about an AP, click the AP name or radio ID. To view AC details, click the AC name.
View network information
View AC information
Procedure
1. Access the Smart O&M menu.
2. From the left navigation pane, select Network > ACs.
The AC information page opens.
3. Select a site from the top of the page.
4. To view detailed AC information, use the following methods:
¡ Click the name of an AC in the AC List area.
¡ From the left navigation pane, select Network > APs > Health, and then click an AC name in the AP Radio Details area.
¡ From the left navigation pane, select Network > APs > AP Statistics, click the AP Disassociations tab, and then click an associated AC name in the AP Disassociation Details list.
Parameters
AC information
· AC statistics: Displays the number of online ACs, total ACs, and AC distribution by model.
· AC List: Displays information about all ACs in the current site, including AC name, online state, operation duration, APs by AP state, online clients, and AC score for the current day. To display more columns, click the + / - icon, and then select the target columns. The system refreshes link rates at intervals of 30 seconds.
¡ Uplink Rate (LAN)—Rate of packets received from all LAN ports.
¡ Downlink Rate (LAN)—Rate of packets sent from all LAN ports.
¡ Uplink Rate (WAN)—Rate of packets received from all WAN ports.
¡ Downlink Rate (WAN)—Rate of packets sent from all WAN ports.
To edit the name of an AC, click the Edit icon ![]() for
the AC.
for
the AC.
· AC CPU Usage Top 5: Displays the top 5 ACs with the highest CPU usage at the time when the last statistics collection was performed. The system collects AC CPU usage statistics at intervals of 10 minutes.
· AC Memory Usage Top 5: Displays the top 5 ACs with the highest memory usage at the time when the last statistics collection was performed. The system collects AC memory usage statistics at intervals of 10 minutes.
AC Details
· Basic AC Info: Displays AC name, MAC, SN, model, software version, and last reboot reason.
For ACs in an IRF fabric, multiple values are displayed in MAC, SN, and Last Reboot Reason fields.
· AC Capabilities: Displays the maximum number of APs, maximum number of clients, and license information.
· AC Score: Displays the AC score. The system also displays the reasons if the AC score is low.
· CPU Usage: Displays the CPU usage trend of the AC. The system collects CPU usage information at intervals of 5 minutes.
· Memory Usage: Displays the memory usage trend of the AC. The system collects memory usage information at intervals of 5 minutes.
· Port Traffic: Displays inbound and outbound traffic and packet statistics on the specified port. The system collects port state information at intervals of 5 minutes.
The Port Traffic section displays traffic information for all ports if no port is specified.
View AP health information
Restrictions and guidelines
The system collects statistics about client traffic at intervals of 5 minutes.
Procedure
1. Access the Smart O&M menu.
2. From the left navigation pane, select Network > APs > Health.
The AP Health page opens.
3. Select a site and a device from the top of the page.
4. To view health information for all AP radios in the site, click the bar for a specific moment in the AP Health graph.
5. To save the data in the AP Radio Details area, click Export. The data will be saved as an electronic form in compressed format.
6. To view detailed AP information, use the following methods:
¡ Click the name of an AP in the AP Radio Details list.
¡ From the left navigation pane, select Network > APs > AP Statistics, and then click an AP name in an AP list.
7. To view detailed information about the AC associated with an AP, click the AC name in an AP list.
Parameters
AP Health
· AP Health: Displays AP health scores. Excellent: ≥ 80. Good: 65 (included) to 80. Average: ≤ 65.
· AP Radio Details: Displays detailed health information for all APs in the site, including AP name, associated AC, radio ID, AP score, health, client RSSI, channel in use, channel usage, delay, packet loss rate, and retransmission rate. To display more columns, click the + / - icon, and then select the target columns. The system scores an AP based on CPU usage, memory usage, channel usage, associated clients, and wireless environment.
AP Details
· Basic AP Info: Displays AP name, MAC, model, associated AC, associated radios, uptime, association, and last reboot reason.
· AP Score Trend: Displays the AP score for each statistics collection period in the specified time range.
· CPU Usage Trend/Memory Usage Trend: Displays the CPU usage and memory usage for each statistics collection period in the specified time range.
· Online Client Info: Displays the quantity of online clients in each statistics collection period in the specified time range. To view information about online clients for a moment, click the corresponding bar in the graph. The list that opens displays client MAC address, IPv4 address, IPv6 address, username, authentication method, score, health state, associated AP, associated radio, associated AC, and SSID.
¡ To customize the columns to display, click the + / - icon.
¡ To view detailed information about a client, click the client's MAC address.
¡ To view detailed information about an AC, click the AC name.
· Client Rate: Displays the client rate bar chart. If you click a bar in the graph, the Top N Clients by Total Traffic list opens below the graph, displaying client authentication method, frequency band, associated AP, associated AC, and uplink/downlink traffic information.
· Port Traffic: Displays the uplink and downlink traffic of clients for each statistics collection period in the specified time range.
· AP Logs: Displays AP events and causes, including AP online and offline events.
· Radio Info: Displays real-time and history radio usage in the specified time range, including working channel, channel usage, noise floor, online clients, retransmission rate, packet loss rate, delay, and RSSI.
View channel analysis
Restrictions and guidelines
The system collects statistics about 5 GHz and 2.4 GHz channels at intervals of 5 minutes.
Procedure
1. Access the Smart O&M menu.
2. From the left navigation pane, select Network > APs > Channel Analysis.
3. Select a site and a device from the top of the page.
4. To adjust the number of data entries in the 5 GHz Channels or 2.4 GHz Channels area, hover over the list and then rotate your mouse wheel.
5. To view the channel usage details, click the data for a specific channel at a specific moment in the 5 GHz Channels or 2.4 GHz Channels area. The Channel Usage Details area displays the channel usage details at that moment.
View AP statistics
Procedure
1. Access the Smart O&M menu.
2. From the left navigation pane, select Network > APs > AP Statistics.
You are placed on the APs tab.
3. Select a site and a device from the top of the page.
4. To view AP disassociation information, click the AP Disassociations tab.
5. To view AP association failure information, click the AP Association Failures tab.
Parameters
APs
· AP Info: Displays information about online, offline, or all APs.
¡ For online APs, this graph displays AP statistics by AP model and client quantity.
¡ For offline APs, this graph displays AP statistics by AP model and disassociation reason.
¡ For all APs, this graph displays AP statistics by AP model and client quantity. Invalid APs are not included. An AP is invalid if the system cannot obtain the AP's serial number.
· Online/Offline/All/Invalid AP List:
¡ The Online AP List displays the AP name, online client quantity, associated AC, radio quantity, and uptime information.
¡ The Offline AP List displays the AP name, associated AC, radio quantity, disassociation reason, and disassociation time information.
¡ The All AP List displays the AP name, current state, online client quantity, associated AC, radio quantity, and uptime information.
¡ The Invalid AP List displays the AP name, current state, online client quantity, associated AC, radio quantity, and uptime information.
To adjust the columns to display, click the + / - icon.
To save the data, click Export. The data will be saved as an electronic form in compressed format.
To configure labels for APs, select the APs and then click Bind Label or Unbind Label. This feature is not available for invalid APs.
To change the name of an AP, click the AP name in the list.
Radios
Displays pie charts about radio distribution by channel, channel usage, client count, and state, as well as a radio list that contains radio details, including state, type, bandwidth, channel, and channel usage.
AP Disassociations
· By Disassociation Reason: Displays AP statistics by disassociation reason in the last seven days.
· By Disassociation Quantity: Displays AP statistics by disassociation quantity in the last seven days.
· AP Disassociation Details: Displays detailed AP disassociation information when you click the bar for a day in the By Disassociation Reason or By Disassociation Quantity graph.
To view detailed information about an AP or AC, click the AP or AC name in the list.
To save the data, click Export. The data will be saved as an electronic form in compressed format.
AP Association Failures
· By Association Failure Reason: Displays AP statistics by association failure reason in the last seven days.
· By Association Failure Quantity: Displays AP statistics by association failure quantity in the last seven days.
· AP Association Failure Details: Displays detailed AP association failure information when you click the bar for a day in the By Association Failure Reason or By Association Failure Quantity graph.
To view detailed information about an AP or AC, click the AP or AC name in the list.
To save the data, click Export. The data will be saved as an electronic form in compressed format.
ARP Analysis
Displays the number of total ARP packets, uplink ARP packets, and downlink ARP packets sent by each AP.
Wired Port List
· Real-Time Statistics: Displays inbound and outbound packet receiving and transmission rate and traffic information on physical AP ports in the past statistics collection period.
· History Statistics: Displays inbound and outbound packet receiving and transmission rate and traffic information on physical AP ports during the specified time range.
Restart APs
Procedure
1. Access the Smart O&M menu.
2. From the left navigation pane, select Network > APs > AP Reboot.
3. Select a site and a device from the top of the page.
4. To filter APs by AP label, click Filter, select labels, and then click Search.
5. To reboot APs immediately, select the APs, and then click Immediate Reboot.
6. To create a scheduled reboot task, select the target APs, and then click Scheduled Reboot.
Parameters
· AP Statistics: Displays total APs and offline APs managed by the AC.
· AP Association and Disassociation Info: Displays the number of AP associations and disassociations.
· AP List: Display APs managed by the AC.
· Task List: Displays history AP reboot tasks.
· AP Reboot Tasks: Displays scheduled AP reboot tasks.
Manage network optimization
Perform one-key optimization
One-key optimization allows you to optimize commonly used AP parameters in bulk for APs to operate in optimal state.
Restrictions and guidelines
For ACs, only ACs of version 5436 or higher support one-key optimization.
Perform one-key optimization
1. Access the Smart O&M menu.
2. From the left navigation pane, select Optimization > One-Key Optimize.
You are placed on the Optimization Settings tab.
3. Select a site from the top of the page.
4. Add or edit a space.
¡ To add a space, click the plus sign + and configure the space parameters as needed.
¡ To
edit a space, click the Edit icon ![]() at the
upper right corner of the space tile.
at the
upper right corner of the space tile.
5. Click the Optimization Progress tab.
6. Click Optimize for the target space.
After the optimization finishes, the page displays information about the optimization, including optimized AP quantity, start time, duration, and comparison of the original parameters and new parameters. To view detailed information, click View Details.
If the optimization fails, the page displays reasons for the failure.
Delete a space
1. Access the Smart O&M menu.
2. From the left navigation pane, select Optimization > One-Key Optimize.
3. Select a site and a device from the top of the page.
4. Click the Optimization History tab.
5. Click the Delete
icon ![]() at the upper right corner of the space tile.
at the upper right corner of the space tile.
View optimization records
1. Access the Smart O&M menu.
2. From the left navigation pane, select Optimization > One-Key Optimize.
3. Select a site and a device from the top of the page.
4. Click the Optimization History tab.
The history list is empty if the system has not performed any optimization operations.
5. To view detailed information about an optimization, click View Details for the optimization record.
Parameters
· Scenario Type: Specify the scenario type. The system provides different optimization policies for different scenarios.
· Range: Specify the APs to optimize by room, AP group, or AP model.
· Items to Adjust: Select the items to adjust. Options include channel, bandwidth, and transmit power.
Perform one-key diagnosis
One-key diagnosis performs a thorough health check of all ACs in the site to discover potential issues. The system also provides suggestions against discovered issues.
Perform one-key diagnosis
1. Access the Smart O&M menu.
2. From the left navigation pane, select Optimization > One-Key Diagnosis.
3. Select a site and a device from the top of the page.
4. Click View Check Items and select items to check as needed and then click OK.
The required items cannot be cleared.
5. Click Diagnose.
After the diagnosis finishes, the page displays the numbers of passed items, failed items, optimizable items, undiagnosable items, and skipped items. To view detailed items of a type, click the item quantity. To view all items, click the total item quantity.
For a site with multiple ACs, an item is marked failed if one AC fails to pass the item check. For an AC associated with multiple APs, the device is marked failed for an item check if one AP fails to pass the item check.
6. Optimize the network as needed.
¡ For failed items and optimizable items, click Expand Repair Suggestions to view the optimization suggestions. To manually configure the devices, click CLI Helper in the list. To troubleshoot the potential issues, click the details to access the Alarms page.
¡ For undiagnosable items, verify that the corresponding devices are connected to the network correctly. An undiagnosable item indicates that the system failed to obtain the required data.
View optimization records
1. Access the Smart O&M menu.
2. From the left navigation pane, select Optimization > One-Key Diagnosis.
3. Select a site and a device from the top of the page.
4. Click History Diagnosis Info.
5. To view information about a diagnosis, click its diagnosis result.
The system can save a maximum of 16 diagnosis records and save a record for a maximum of 6 days. If the maximum record limit is reached, the system deletes the oldest record before adding a new record.
View security information
Perform this task to view attack, SSID, and MAC spoofing detection information for the specified AC. For more information about configuring the detection features, see "Configure WLAN security."
View attack detection information
Procedure
1. Access the Smart O&M menu.
2. From the left navigation pane, select Security > Attack Detection.
You are placed on the Attack Detection tab.
3. Select a site and a device from the top of the page.
4. To view detection logs, click the Logs tab.
Parameters
Attack Detection
· Total Attacks: Display the total number of attacks by attack type. You can click the bar for an attack type to view the attack trend for the type.
· Attack Detection Trend: Total: Display the attack trend during the specified time range.
· Attackers with Most Attacks Top N: Hotspot Attack: The data varies by the selected attack type.
¡ Source MAC: Displays the Top N clients that launched the most attacks. Larger the rectangle, more the launched attacks.
¡ Sensor AP: Displays the Top N sensor APs by detected attack count. Larger the rectangle, more the detected attacks.
¡ Radio: Displays the Top N radios by detected attack count. Larger the rectangle, more the detected attacks.
¡ Attacker Type: Displays the Top N attack types with the most attacks. Larger the rectangle, more the attacks.
· Top 5 by MAC: Displays the Top 5 clients for the selected attack type.
· Top 5 by Attack Type: Displays the Top 5 attack types. This graph is available when the selected attack type is All.
· Top 5 by Sensor AP: Displays the Top 5 sensor APs for the selected attack type.
· Top 5 by Attack Time: Displays the Top 5 time points with the most attacks of the selected type during the statistics collection period.
· Total Countermeasures: Displays the total number of countermeasures that have been taken during the specified time range.
· Countermeasure Trend: Displays the countermeasure trend.
· Countermeasures by MAC Address Top 5: Displays the Top 5 countermeasured clients.
· Countermeasures by AP Top 5: Displays the Top 5 APs with the most countermeasures.
Logs
· Attack Logs: Displays attack time, client MAC address, and attack type information. To view details about a sensor AP, click the AP name. To view details about an AC, click the AC name.
· Countermeasure Logs: Displays countermeasure time, MAC address of the countermeasured client, and countermeasured device type as well as device vendor information. To view details about a countermeasure AP, click the AP name. To view details about a countermeasure AC, click the AC name.
View SSID detection information
1. Access the Smart O&M menu.
2. From the left navigation pane, select Security > SSID Detection.
The list displays information about detected SSIDs, including the number of radios (BSSIDs) for each SSID.
If the SSID field is empty, it indicates that the detected signal is from a hidden SSID.
3. Select a site and a device from the top of the page.
4. To view information about radios that send signals for a SSID, click the number in the BSSIDs column for the SSID.
The BSSID information is expanded.
5. To view information about sensor APs that detected signals from a radio (BSSID), click the number in the Sensor APs column for the radio.
The sensor AP information is expanded.
View spoofing detection information
1. Access the Smart O&M menu.
2. From the left navigation pane, select Security > Spoofing Detection.
The list displays spoofing information, including detection time, conflict MAC address, conflict type (IP conflict or MAC conflict), client brand, client vendor, associated AP, and associated AC.
Information about both attackers and attacked clients are displayed.
View VIP device information
View VIP AP statistics
Perform this task to view VIP AP health or detailed information.
Prerequisites
Execute the ap-name ap-name command in monitor group view from the CLI of the device to add a VIP AP to the monitor group. The AP will report information about the associated clients and its running information to the AC, which will report the information to the Cloudnet platform.
Restrictions and guidelines
Only the software version of 5436 or higher supports this feature.
The system collects statistics at intervals of 2 minutes.
Procedure
1. Access the Smart O&M menu.
2. From the left navigation pane, select VIP > VIP APs.
3. Select a site and a device from the top of the page.
4. To view health information for all APs in the site, click the bar for a specific moment in the By AP Health graph.
5. To view detailed AP information, click the name of an AP in the Online VIP AP List area.
6. To view detailed information about the AC associated with a VIP AP, click the AC name in the Online VIP AP List area.
Parameters
AP summary
· By AP Health: Displays VIP AP health scores. Excellent: ≥ 80. Good: 65 (included) to 80. Average: < 65. The system scores VIP APs based on channel usage, associated clients, and client RSSI.
· By AP Distribution: Displays the number of VIP APs and the number of non-VIP APs.
· Online VIP AP List: Displays VIP AP operation information. To configure remarks, click the Remarks column.
AP details
· Basic AP Info: Displays AP name, MAC, model, associated AC, associated radios, uptime, association, and last reboot reason.
· AP Score Trend: Displays the AP score for each statistics collection period in the specified time range.
· Online Client Info: Displays the quantity of online clients in each statistics collection period in the specified time range. To view information about online clients for a moment, click the corresponding bar in the graph. The list that opens displays client MAC address, IPv4 address, IPv6 address, username, authentication method, score, health state, associated AP, associated radio, associated AC, and SSID.
¡ To customize the columns to display, click the + / - icon.
¡ To view detailed information about a client, click the client's MAC address.
¡ To view detailed information about an AC, click the AC name.
· Client Traffic: Displays the uplink and downlink traffic of clients for each statistics collection period in the specified time range.
· CPU/Memory Trend: Displays CPU usage and memory usage at each statistics collection moment. The usage information is from the AC of an AP.
· AP Logs: Displays AP events and causes, including AP online and offline events.
Manage VIP clients and view VIP client statistics
Perform this task to manage VIP clients and view VIP client health information, quantity, or details.
The system supports two VIP client levels. You can configure rate limit for level-2 VIP clients and non-VIP clients, and level-1 VIP client cannot be rate limited. If network resource is insufficient, APs will log off clients of a low priority to guarantee bandwidth for high-priority clients.
You can add VIP clients from the CLI or the Web interface.
Prerequisites
To add VIP clients from the CLI, execute the client-mac mac-address command to add a client to the VIP client group. The AP associated with the client will report information about the VIP client to the AC, which will report the information to the Cloudnet platform.
Restrictions and guidelines
Only the software version of 5436 or higher supports the VIP client monitor function.
The system collects statistics about VIP clients at intervals of 2 minutes.
Procedure
1. Access the Smart O&M menu.
2. From the left navigation pane, select VIP > VIP Clients.
You are placed on the Summary tab. The page displays the number of VIP clients of each VIP level.
3. Select a site and a device from the top of the page.
4. To view VIP client health trend, click Expand Historical Data.
The level-1 and level-2 VIP client health trend graphs open, displaying the number of VIP clients during each statistics collection period.
5. Click the Client List tab, and perform the following tasks as needed:
¡ To add VIP clients, click Add VIP Clients.
¡ To view detailed information about a VIP client, click the MAC address link of the client in the list.
¡ To view detailed information about the AP associated with a VIP client, click the associated AP link in the list.
¡ To view detailed information about the AC associated with a VIP client, click the associated AC link in the list.
¡ To customize the columns to display, click the + / - icon.
¡ To rate limit VIP clients, click Rate Limit, and then configure client rate limit settings, including the object, effective range, and uplink or downlink limited rate.
¡ To import VIP clients, click Bulk Import, download the template, fill in the file, and then upload the file. You must specify client MAC address, effective device serial number, and VIP level information.
¡ To remove VIP clients, select the target VIP clients and then click Remove VIP Clients.
¡ To remove VIP users, select the target VIP clients and then click Remove VIP Users.
¡ To view details about a client, click the MAC address of the client in the list.
Parameters
Client summary
· Client Distribution by Health State: Displays VIP AP health scores. Excellent: ≥ 80. Good: 65 (included) to 80. Average: < 65. The system scores VIP clients based on channel usage, RSSI, and uplink and downlink rates.
If you click an area in the client health pie chart, the system displays a VIP client list, containing VIP clients for the specified moment.
· Client Distribution by Issue Count: Displays the number of VIP clients by issue quantity.
· Client Type: Displays the number of VIP clients by frequency band.
· VIP Client List: Displays VIP client operation information. To configure remarks, click the Remarks column.
View VIP client health information in common mode
Restrictions and guidelines
Only the software version of 5436 or higher supports this feature.
Procedure
1. Access the Smart O&M menu.
2. From the left navigation pane, select VIP > VIP Clients.
3. Select a site and a device from the top of the page.
4. Click the MAC address link of a VIP client in the VIP Client List area. You are placed on the Client Info tab.
5. To view detailed information about the AP or AC associated with the client, click the AP or AC name in the Connection Info area.
Parameters
· Basic Client Info: Displays MAC, IP, IPv6, vendor, and client mode.
· Connection Info: Displays the client online status, access service, and score trend. You can hover over a low score in the trend graph to view the troubleshooting suggestions. To view detailed information about an AP or AC, click the AP or AC name.
· Client Logs: Displays client online, offline, and roaming events and client operation exceptions.
¡ Rate Level: Displays packet transmission information between AP and client by rate level range when you click Rate Level. The displayed information include sending failure proportion, dropped packets, retransmitted packets, successfully received packets, and successfully sent packets.
· Packet Failure Percentage: Number of packets that have failed to be sent at a certain rate level to the total number of packets sent at that rate level.
View VIP client health information in expert mode
Restrictions and guidelines
· The system collects statistics at intervals of 2 minutes.
· Only the software version of 5436 or higher supports this feature.
Procedure
1. Access the Smart O&M menu.
2. From the left navigation pane, select VIP > VIP Clients.
3. Select a site and a device from the top of the page.
4. Click the MAC address link of a VIP client in the VIP Client List area, and then click the Expert Mode tab.
Parameters
· Basic Client Info: Displays MAC, IP, IPv6, vendor, client mode, and protocol type about the client.
· Health Report: Displays metrics and their current values and reference values.
¡ The current value is the average value of each metric in the previous statistics collection period.
¡ If
the current value exceeds the reference value, a red icon ![]() appears
after the reference value.
appears
after the reference value.
¡ If the client is offline, the current value displays the client information before it goes offline.
· Client Connection Info: Displays signal strength, uplink and downlink traffic, uplink and downlink rate, retransmission rates, packet loss rate, latency, and channel usage.
To view detailed information, click the trend graph for a specific metric.
To capture packets, click Capture to access the Network > Maintain > Tools page. The system automatically fills AC and AP information for the client in the input boxes. You can complete the other packet capture parameters and then start the packet capture task.
· Neighbor Client: Displays the number of clients (including the client itself) that come online on the same radio as a client during each time period. To view detailed information about the clients, click the bar for a specific moment in the graph.
· Client Logs: Displays client online, offline, and roaming events and client operation exceptions. To edit columns to display, click the + / - icon.
¡ Rate Level: Displays packet transmission information between AP and client by rate level range when you click Detail in the Rate Level column, which is available for an offline or online event of an online client.
¡ Deep Analysis: Displays the packet exchange process when you click Detail in the Deep Analysis column, which is available for an online event and online failure event.
¡ DHCP Lease Extend: Displays the packet exchange process when you click Detail in the DHCP Lease Extend column, which is available for a DHCP lease extension event.
¡ Packet Failure Percentage: Number of packets that have failed to be sent at a certain rate level to the total number of packets sent at that rate level.
View AI tasks
Perform progressive optimization
This feature enables Cloudnet to collect environment data from wireless devices, and adjust the working channel, transmit power, or bandwidth based on data analysis result when the network is not busy. The operation is performed automatically and does not require any manual intervention. This helps optimize the network to improve user experience.
Restrictions and guidelines
· Only the software version of 5444 or higher supports this feature.
· The system collects data at intervals of 5 minutes.
Procedure
1. Access the Smart O&M menu.
2. From the left navigation pane, select AI-Driven Tasks > Progressive.
3. Select a site from the top of the page.
Parameters
Clients
· Client Health: Displays the score trend of the site and the entire network during the current day. The system scores a site based on the client uplink and downlink rates, average signal strength, delay, and packet loss rate.
· Clients with Poor Signals: Displays statistics about weak-signal clients in the site during the current day.
· Issues: Displays ping pong roaming issue statistics in the site during the current day.
· Client Rate: Displays client uplink and downlink rate statistics in the site during the current day. The rate unit is Mbps.
APs
· Interference Trend: Displays co-channel interferences detected by APs in the site during the current day. The larger the rectangle for low interference, the less the detected interferences. Severe: >70%, average: 50% (excluded) to 70% (included), low: ≤50%.
· Packet Loss Rate: Displays packet loss rate detected by APs in the site during the current day. The larger the rectangle for low rate, the smaller the packet loss rate. Severe: ≥3%, average: 1% (included) to 3% (excluded), low: <1%.
· Latency: Displays link latency detected by radios in the site during the current day. The larger the rectangle for low latency, the shorter the link latency. Severe: ≥3%, average: 1% (included) to 3% (excluded), low: <1%.
Manage service components
Configure PPSK authentication
Private pre-shared key (PPSK) authentication uses a unique password for each client and generates binding entries between client MAC addresses and PPSK passwords at client association. Compared with PSK authentication that applies one password to all clients, PPSK authentication provides enhanced security.
In PPSK authentication, the IT administrator manages all binding entries. You can configure WeChat official account settings for the administrator or approver to approve guests' password requests through a WeChat mini-program.
|
|
NOTE: PPSK authentication is available only on WBC series access controllers when the controllers have Internet connectivity. |
Configure PPSK authentication
Enable PPSK globally
1. On the top navigation bar, select Service > PPSK.
2. From the left navigation pane, select Settings.
3. Enable PPSK in the Global Settings section.
4. To view wireless services provided by a device, click View Wireless Services.
Enable SSID-based PPSK
For PPSK authentication to take effect, you must enable it both globally and for specific SSIDs.
To enable PPSK for specific SSIDs:
1. On the top navigation bar, select Service > PPSK.
2. From the left navigation pane, select Settings.
3. In the SSID-Based PPSK Authentication section, select the target SSIDs and then click On.
On the same device, you can enable PPSK for a maximum of 10 SSIDs.
Specify passwords for users
Restrictions and guidelines
You can specify passwords for users at user creation or from the Service > PPSK > Passwords page. This section specifies a password at user creation.
You can specify a maximum of 10 passwords for each user. If you specify a password for a nonexistent user from the Service > PPSK > Passwords page, the system creates the user.
Procedure
1. On the top navigation bar, select Service > PPSK.
2. From the left navigation pane, select Users.
3. Click Add User, Bulk Add, Add Superuser, or Import, and then configure parameters as needed.
This section adds a single user.
If multiple sites require the same user, create a superuser as a best practice to simplify configuration. You can perform upgrade or downgrade to change the user role (user or superuser).
4. Specify the username, email address, name, and phone number as needed.
5. Specify the password generation method.
¡ Generate—Allows the system to generate a password based on the specified password strength.
¡ Input—Allows you to specify a password manually.
6. Specify the MAC address binding method.
¡ Auto—In this mode, the system can bind 1 to 10 MAC addresses to a password. By default, the number is 3.
¡ Manual—In this mode, you can bind only one MAC address to a password.
7. Specify the limited uplink rate, limited downlink rate, and a user description as needed.
8. Click OK.
Approve password requests
1. On the top navigation bar, select Service > PPSK.
2. From the left navigation pane, select Password Requests.
The list that opens displays password requests that have not been processed.
3. Perform the following tasks to approve or reject password requests:
¡ To approve or reject a single request, click Approve or Reject for the request in the Actions column.
¡ To approve or reject multiple requests in bulk, select the target requests and then click Bulk Approve or Bulk Reject.
View password request approval records
1. On the top navigation bar, select Service > PPSK.
2. From the left navigation pane, select Approval Records.
The page that opens displays the password request approval records.
The password approval records cannot be deleted.
3. To filter the records by approval state, select a state from the State Filter list. Available options include the following:
¡ All.
¡ The request is approved. Please wait for the password to take effect.
¡ The request is rejected.
¡ The request timed out.
¡ Approval free. Please wait for the password to take effect.
¡ No available PWD for the current account.
¡ No available PWD in the site.
¡ System error.
¡ PWD request exists.
Manage hotels
Cloudnet provides unified WLAN management for scenarios such as hotels and dormitories. Administrators can view and optimize WLAN performance for each room to provide the optimal service.
To manage a hotel:
1. On the top navigation bar, select Service > Hotel Management.
2. Configure floors and room types:
a. From the left navigation pane, select Labels.
b. Select the room type and create underground and overground floors.
The system supports customized room types.
3. Manage rooms:
a. From the left navigation pane, select Rooms.
b. To create a room, click Add, and then specify the room name, room type, and floor.
c. To create multiple rooms in bulk, click Bulk Add, and then specify the start room number, end room number, and room number length.
Rooms created in a bulk operation have the same room type and floor number.
d. To edit a room, click the ![]() icon
for the room.
icon
for the room.
e. To delete a room, click the ![]() icon
for the room.
icon
for the room.
4. Deploy APs:
a. From the left navigation pane, select Rooms.
b. Click the Rooms Without
Bound APs tab, and click the ![]() icon for a room.
icon for a room.
5. Optimize room networks:
a. From the left navigation pane, select Net-Optimize.
The network optimization page opens, displaying rooms as tiles. Each tile displays the AP score, present clients, and average uplink and downlink rates in the most recent statistics collection period.
The system scores APs based on channel usage and issue count.
b. To restart APs in a room, click Immediate Reboot on the room tile.
APs that are being restarted cannot provide wireless access service.
Custom dashboard
Custom dashboard service enables you to add network statistical graphs to the monitoring screen to view the most recent network information such as network health, issue distribution, AP quantity, AP load statistics, client access trend, client/traffic trend, and alarm content.
Each account can create up to 10 dashboards, and the parent account can view the dashboards created by subaccounts.
Figure 14 Dashboard
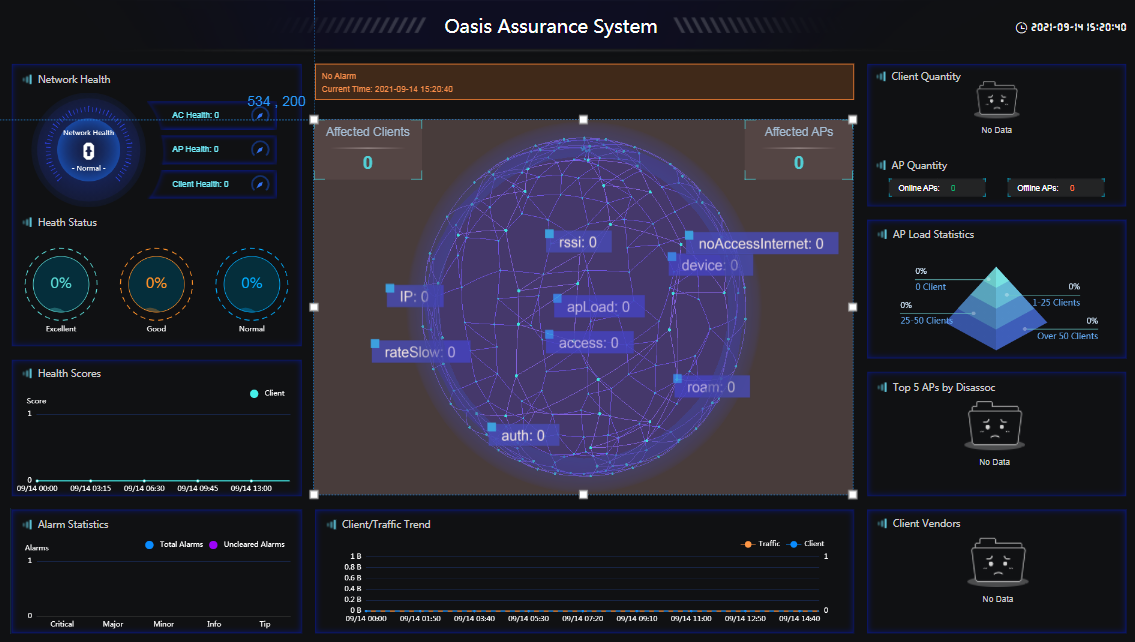
Create a dashboard
1. On the top navigation bar, select Service > Custom Dashboard.
You are placed on the My Dashboards page.
2. Click Create Dashboard.
3. Select the assurance template or the empty template, and then click Create Dashboard.
4. Specify a name for your dashboard and then click OK.
The dashboard customization page opens. The page contains the tile area, services area, dashboard area, and dashboard/tile settings area from left to right, and a tool bar at the top.
5. Add tiles to the dashboard. You can put custom contents on your dashboard by using tiles of different types, such as services, text, picture, time, and assistant.
6. Manage tiles in the Tile area.
¡ To adjust the display order of a tile, select the tile, and then select an action. The tile on top is displayed the first on your dashboard.
¡ To
hide or display a tile, click the ![]() icon to the left
of the tile.
icon to the left
of the tile.
¡ To view the data source of a tile, click the tile.
¡ To
remove a tile from your dashboard, select the tile, and then click the ![]() icon.
icon.
7. Manage the layout in the Dashboard area.
¡ To resize a tile, click on the tile, move your mouse pointer over one of the handles and then drag your mouse.
¡ To adjust the position of a tile, select the tile, and then press the arrow keys on your keyboard.
¡ To adjust the display order or remove a tile from your dashboard, right-click on the tile, and then select an action.
¡ To create a vertical or horizontal guide, click on a ruler.
¡ To move a guide to the desired position, drag the guide.
¡ To delete a guide, double-click the guide.
¡ To
show or hide a guide, click the ![]() icon at the
intersection of the rulers in the upper-left corner.
icon at the
intersection of the rulers in the upper-left corner.
8. To configure dashboard settings, click on a blank area on your dashboard. The Dashboard Settings area is displayed to the right of the page. The settings apply to all tiles on your dashboard.
¡ On the Style tab, you can configure the dashboard theme, title style, tile title, background picture, and dashboard cover. Only .jpg, .png, and .jpeg files are supported and the file size cannot exceed 2 MB.
¡ To configure data source settings such as time span and refresh interval, click the Data tab. To restore the default settings for all tiles on your dashboard, click Restore Default Settings.
9. To configure settings for a tile, click a tile in the Tile or Dashboard area. The Tile Settings area is displayed to the right of the page.
¡ On the Style tab, you can adjust the tile title name, title alignment, font size, tile position, and title display style, depending on the tile you select.
¡ On the Data tab, you can select devices, set a time span, and set a refresh interval, depending on the tile you select.
10. To preview your dashboard, click Save & Preview in the upper right corner after arranging the tiles on the dashboard.
To view the dashboard in full screen mode, press a shortcut key on your keyboard, for example, F11, depending on the operating system or browser you use.
Edit, clone, or delete a dashboard
1. On the top navigation bar, select Service > Custom Dashboard.
You are placed on the My Dashboards page.
2. Hover over the target dashboard to view, clone, or delete the dashboard, add remarks for the dashboard, or edit the dashboard name.
Manage assets
Perform this task to record assets (endpoints) in a site.
To manage assets in a site:
1. On the top navigation bar, select Service > Assets.
2. Select a site from the top of the page.
3. To add an asset, click Add, and then specify the endpoint name, MAC address, and site.
4. To delete assets, select the assets and then click Delete. Click OK in the dialog box that opens.
5. To export assets, click Export.
6. To import assets, click Import, download the template, fill in the template file, and then upload the file to the Cloudnet platform.
7. To add asset properties, Click Add Properties, and then specify the property name.
The default property value is optional.