- Table of Contents
- Related Documents
-
| Title | Size | Download |
|---|---|---|
| 01-Text | 4.12 MB |
Web browser requirements
As a best practice, use Google Chrome 57 or higher and set the resolution to 1600 × 900.
Log in to the Web interface for the first time
The platform provides default Web login settings. You can use these default settings to log in to the Web interface through HTTPS.
The following default settings are available for the first Web login.
|
Username |
Password |
User role |
User privileges |
|
sysAdmin |
sysAdmin |
System administrator |
Manage system settings, areas, and assets. |
|
buzAdmin |
buzAdmin |
Business administrator |
Manage all security services. |
|
admin |
admin@admin |
Super administrator |
Have all privileges. |
|
auditAdmin |
auditAdmin |
Audit administrator |
View logging records. |
To log in to the Web interface:
1. Open the browser, and then enter the IP address of the platform in the address bar.
2. On the login page, enter a default username and password. As a best practice, enter the username and password of the default network administrator.
3. Click Login.
To change the password of a default user or add a new administrator user, enter the System Settings > System Management > Roles & Privileges > User Management page.
Web interface layout
|
The navigation menus and webpages accessible to a user depend on the user's role. |
|
(1) Banner and admin section |
(2) Navigation pane |
(3) Work pane |
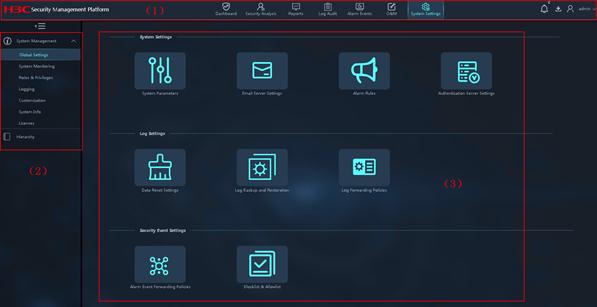
As shown in Figure 1, the Web interface contains the following areas:
· Banner and admin section—Contains the following items:
¡ Basic information, including the company logo, system name, and information about the current login user.
¡ Navigation bar used to access Web menus of different configuration categories.
¡ Icons used to display notification messages, log out of the Web interface, change the system style, and display the work pane in full screen.
· Navigation pane—Contains menus to access features. The menus are organized in a tree to facilitate users to access the features.
· Work pane—Displays feature information and operation results, and provides an area for you to configure features.
Log out of the Web interface
To ensure system security, log out of the
Web interface after you finish your operations. To log out of the Web
interface, click the ![]() icon next to the username in the upper-right
corner of the page and select Log
Out.
icon next to the username in the upper-right
corner of the page and select Log
Out.
This page displays asset resource usage and cyber security situation summary, including the CPU usage, memory usage, session trend chart, top 50 IPS blocked events, attack event trend chart, and device log receiving trend chart.
Figure 2 Dashboard
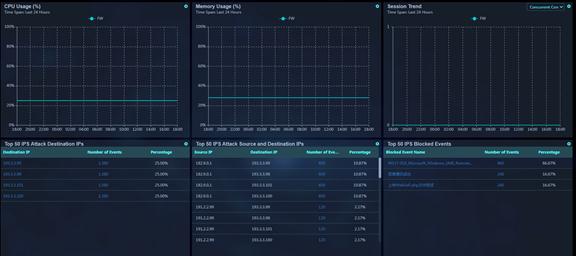
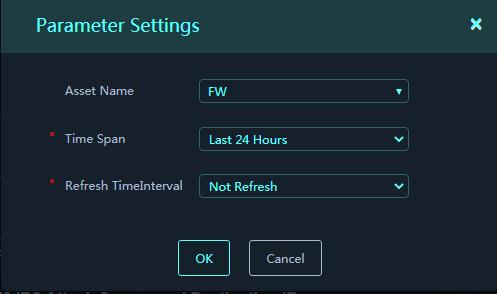
To filter statistics, click the ![]() icon
in each area to configure the filtering criteria. For example, you can specify the
asset name, time span, and refresh interval criteria.
icon
in each area to configure the filtering criteria. For example, you can specify the
asset name, time span, and refresh interval criteria.
Figure 3 Parameter Settings
This feature analyzes security events based on the vulnerability attack logs and virus attack logs reported from the devices managed by the platform and its subplatforms. You can display security event statistics by multiple criteria, including the attack trend, event severity, and event type.
Display security event statistics by attack trend
The attack trend analysis tab displays security event statistics by attack trend based on the logs reported to the platform and its subplatforms within the specified time span.
To display security event statistics by attack trend:
1. On the top navigation bar, click Security Analysis.
2.
On the Security Event Analysis page, click
the ![]() icon in the upper-right corner of the work
pane.
icon in the upper-right corner of the work
pane.
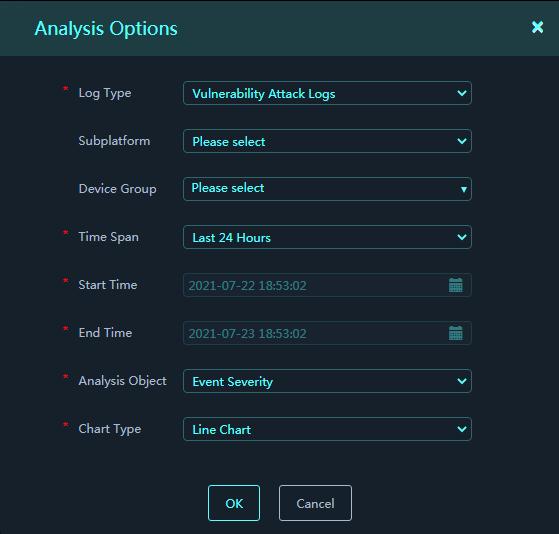
3. In the dialog box that opens, configure the analysis options and set the analysis object to Attack Trend.
Figure 4 Analysis Options
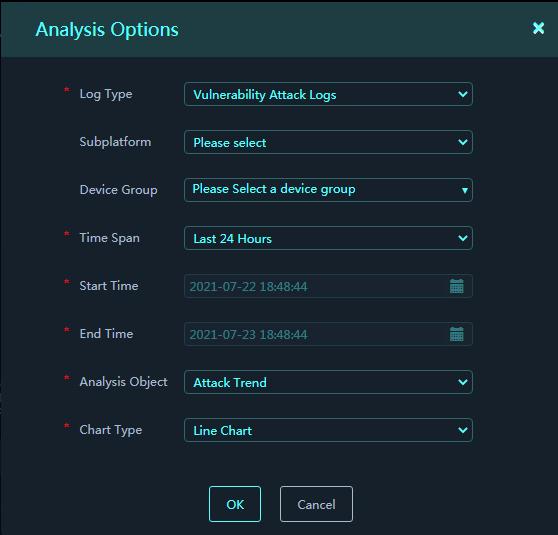
4. Click OK.
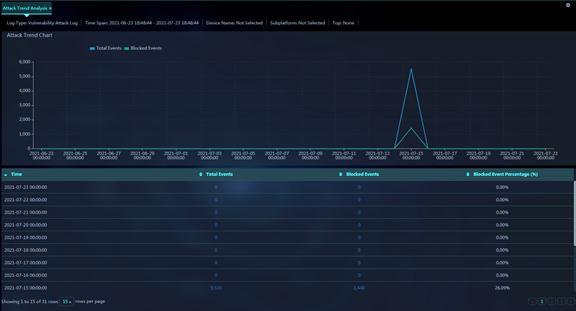
The security event statistics will be displayed by attack trend on the Attack Trend Analysis tab of the Security Event Analysis page.
5. Click a number in the Total Events or Blocked Events column to open a details page for events.
Figure 5 Attack Trend Analysis
Parameters:
· Time: End time of an analysis period. The security events occurred during the period are analyzed and counted to produce an analysis entry. For example, if the time span is last 24 hours, each analysis period is 15 minutes long.
· Total Events: Total number of attack events occurred during the current analysis period.
· Blocked Events: Number of events blocked during the current analysis period.
· Blocked Percentage (%): Percentage of blocked events to the total events during the current analysis period.
Display security event statistics by event severity
The event severity analysis tab displays security event statistics by event severity based on the logs reported to the platform and its subplatforms within the specified time span.
To display security event statistics by event severity:
1. On the top navigation bar, click Security Analysis.
2.
On the Security Event Analysis page, click
the ![]() icon in the upper-right corner of the work
pane.
icon in the upper-right corner of the work
pane.
3. In the dialog box that opens, configure the analysis options and set the analysis object to Event Severity.
Figure 6 Analysis Options
4. Click OK.
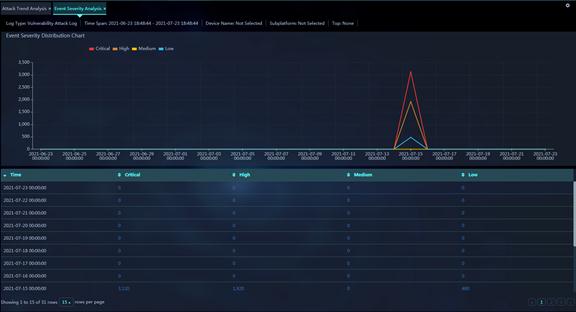
The security event statistics will be displayed by event severity on the Event Severity Analysis tab of the Security Event Analysis page.
5. Click a number in the Critical, High, Medium, or Low column to open a details page for events.
Figure 7 Event Severity Analysis
Parameters:
· Time: End time of an analysis period. The security events occurred during the period are analyzed and counted to produce an analysis entry. For example, if the time span is last 24 hours, each analysis period is 15 minutes long.
· Critical: Number of attack events with critical risks occurred during the current analysis period.
· High: Number of attack events with high risks occurred during the current analysis period.
· Medium: Number of attack events with medium risks occurred during the current analysis period.
· Low: Number of attack events with low risks occurred during the current analysis period.
Display security event statistics by destination port
The destination port analysis tab displays security event statistics by destination port based on the logs reported to the platform and its subplatforms within the specified time span.
To display security event statistics by destination port:
1. On the top navigation bar, click Security Analysis.
2.
On the Security Event Analysis page, click
the ![]() icon in the upper-right corner of the work
pane.
icon in the upper-right corner of the work
pane.
3. In the dialog box that opens, configure the analysis options and set the analysis object to Destination Port.
Figure 8 Analysis Options

4. Click OK.
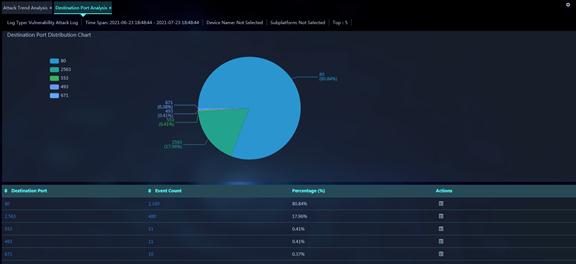
The security event statistics will be displayed by destination port on the Destination Port Analysis tab of the Security Event Analysis page.
5.
Click a number in the Destination Port
or Event Count column or click the ![]() icon in the Actions column for an entry to open a
details page for events.
icon in the Actions column for an entry to open a
details page for events.
Figure 9 Destination Port Analysis
Parameters:
· Destination Port: Destination port of attack events occurred within the specified time span.
· Event Count: Total number of attack events occurred on the destination port within the specified time span.
· Percentage (%): Percentage of the attack events on the destination port to the total number of attack events on all destination ports within the specified time span.
Display security event statistics by event type
The event type analysis tab displays security event statistics by event type based on the logs reported to the platform and its subplatforms within the specified time span.
To display security event statistics by event type:
1. On the top navigation bar, click Security Analysis.
2.
On the Security Event Analysis page, click
the ![]() icon in the upper-right corner of the work
pane.
icon in the upper-right corner of the work
pane.
3. In the dialog box that opens, configure the analysis options and set the analysis object to Event Type.
Figure 10 Analysis Options
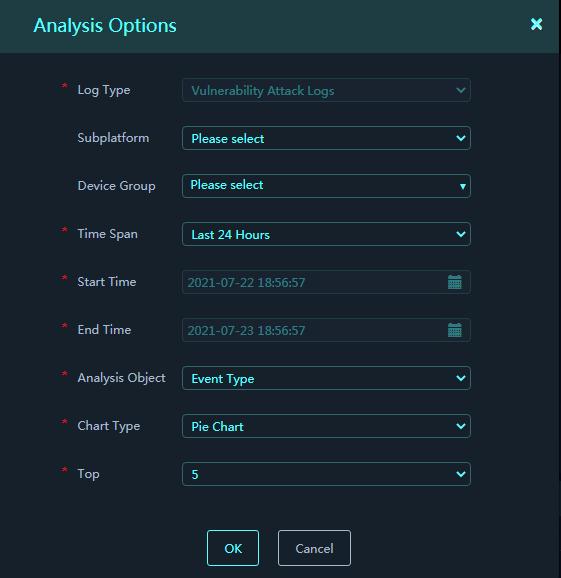
4. Click OK.
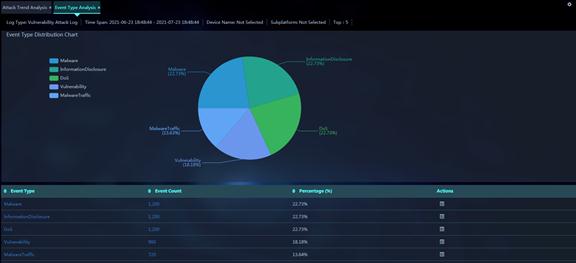
The security event statistics will be displayed by event type on the Event Type Analysis tab of the Security Event Analysis page.
5.
Click a type in the Event Type column,
click a number in the Event Count column, or click the ![]() icon in the Actions column for an entry. Any of
the operations opens a details page for events.
icon in the Actions column for an entry. Any of
the operations opens a details page for events.
Figure 11 Event Type Analysis
Parameters:
· Event Type: Type of attack events occurred within the specified time span.
· Event Count: Number of times that this type of events occurred within the specified time span.
· Percentage (%): Percentage of the number of occurrence times for this type of events to the total number of occurrence times for all events within the specified time span.
Display security event statistics by event protocol
The event protocol analysis tab displays security event statistics by event protocol based on the logs reported to the platform and its subplatforms within the specified time span.
To display security event statistics by event protocol:
1. On the top navigation bar, click Security Analysis.
2.
On the Security Event Analysis page, click
the ![]() icon in the upper-right corner of the work
pane.
icon in the upper-right corner of the work
pane.
3. In the dialog box that opens, configure the analysis options and set the analysis object to Event Protocol.
Figure 12 Analysis Options
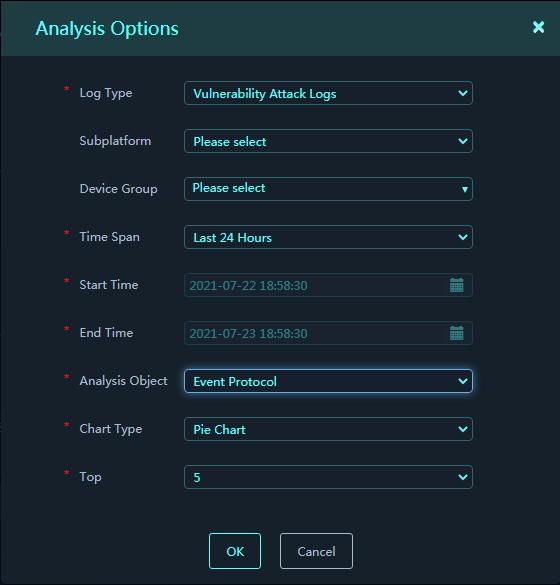
4. Click OK.
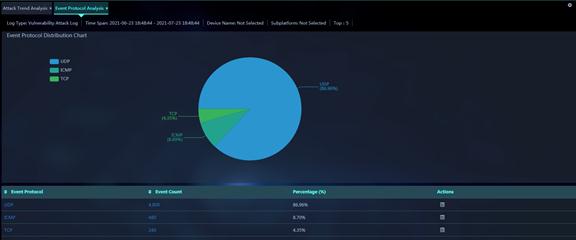
The security event statistics will be displayed by event protocol on the Event Protocol Analysis tab of the Security Event Analysis page.
5.
Click a protocol in the Event Protocol column,
click a number in the Event Count column, or click the ![]() icon in the Actions column for an entry. Any of
the operations opens a details page for events.
icon in the Actions column for an entry. Any of
the operations opens a details page for events.
Figure 13 Event Protocol Analysis
Parameters:
· Event Protocol: Protocol based on which attack events occurred within the specified time span.
· Event Count: Number of attack events based on the protocol within the specified time span.
· Percentage (%): Percentage of the attack events based on the protocol to the total number of attack events within the specified time span.
Display security event statistics by source IP
The source IP analysis tab displays security event statistics by source IP based on the logs reported to the platform and its subplatforms within the specified time span.
To display security event analysis by source IP:
1. On the top navigation bar, click Security Analysis.
2.
On the Security Event Analysis page, click
the ![]() icon in the upper-right corner of the work
pane.
icon in the upper-right corner of the work
pane.
3. In the dialog box that opens, configure the analysis options and set the analysis object to Source IP.
Figure 14 Analysis Options
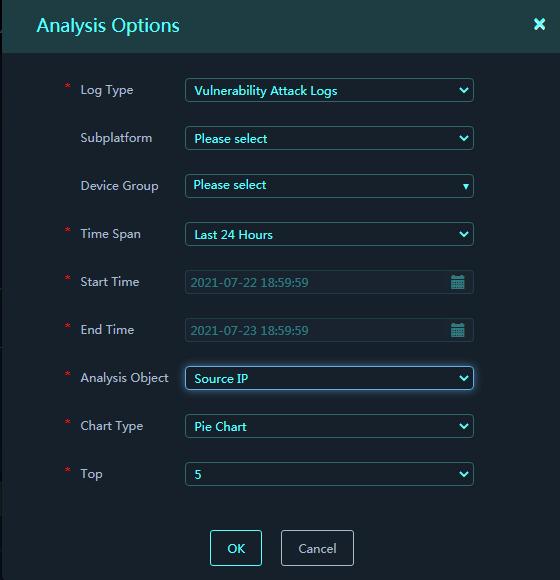
4. Click OK.
The security event statistics will be displayed by source IP on the Source IP Analysis tab of the Security Event Analysis page.
5.
Click an IP address in the Source IP column,
click a number in the Event Count column, or click the ![]() icon in the Actions column for an entry. Any of
the operations opens a details page for events.
icon in the Actions column for an entry. Any of
the operations opens a details page for events.
Figure 15 Source IP Analysis
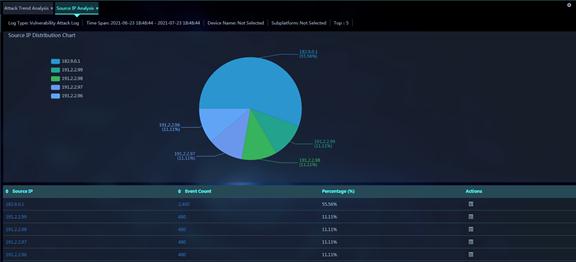
Parameters:
· Source IP: Source IP address of attack events occurred within the specified time span.
· Event Count: Number of attack events sourced from the IP address within the specified time span.
· Percentage (%): Percentage of the attack events sourced from the IP address to the total number of attack events within the specified time span.
Display security event statistics by destination IP
The destination IP analysis tab displays security event statistics by destination IP based on the logs reported to the platform and its subplatforms within the specified time span.
To display security event statistics by destination IP:
1. On the top navigation bar, click Security Analysis.
2.
On the Security Event Analysis page, click
the ![]() icon in the upper-right corner of the work
pane.
icon in the upper-right corner of the work
pane.
3. In the dialog box that opens, configure the analysis options and set the analysis object to Destination IP.
Figure 16 Analysis Options
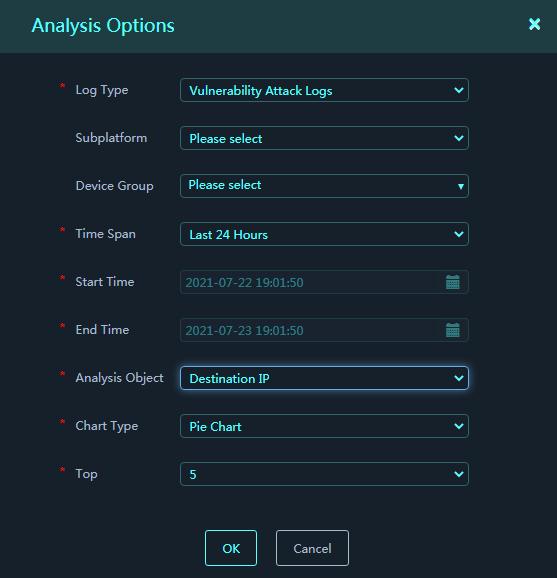
4. Click OK.
The security event statistics will be displayed by destination IP on the Destination IP Analysis tab of the Security Event Analysis page.
5.
Click an IP address in the Destination IP column,
click a number in the Event Count column, or click the ![]() icon in the Actions column for an entry. Any of
the operations opens a details page for events.
icon in the Actions column for an entry. Any of
the operations opens a details page for events.
Figure 17 Destination IP Analysis
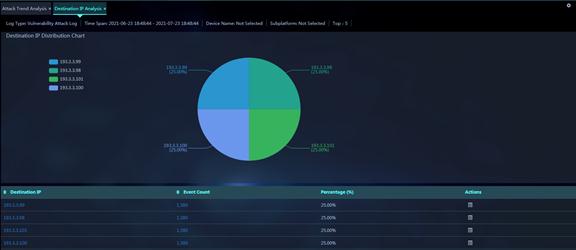
Parameters:
· Destination IP: Destination IP address of attack events occurred within the specified time span.
· Events: Number of attack events destined for the IP address within the specified time span.
· Percentage (%): Percentage of the attack events destined for the IP address to the total number of attack events within the specified time span.
Display security event statistics by signature hit count
The signature hit count analysis tab displays security event statistics by signature hit count based on the vulnerability attack logs reported to the platform within the specified time span.
To display security event statistics by signature hit count:
1. On the top navigation bar, click Security Analysis.
2.
On the Security Event Analysis page, click
the ![]() icon in the upper-right corner of the work
pane.
icon in the upper-right corner of the work
pane.
3. In the dialog box that opens, configure the analysis options and set the analysis object to Signature Hit Count.
Figure 18 Analysis Options
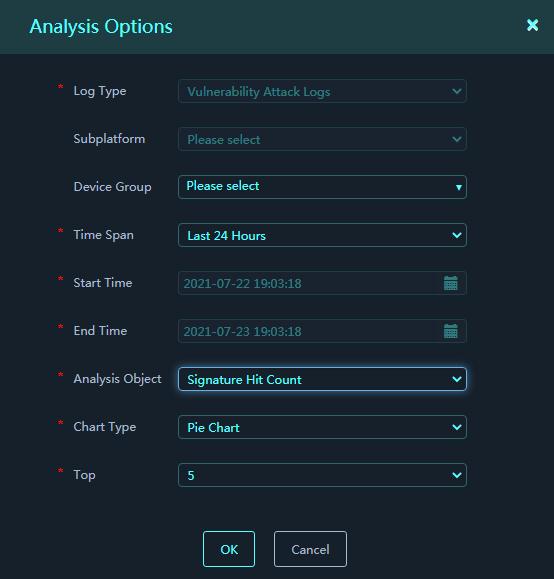
4. Click OK.
The security event statistics will be displayed by signature hit count on the Signature Hit Count tab of the Security Event Analysis page.
5.
Click a number in the Hit Count column
or click the ![]() icon in the Actions column for an entry to open a
details page for events.
icon in the Actions column for an entry to open a
details page for events.
Figure 19 Signature Hit Count Analysis
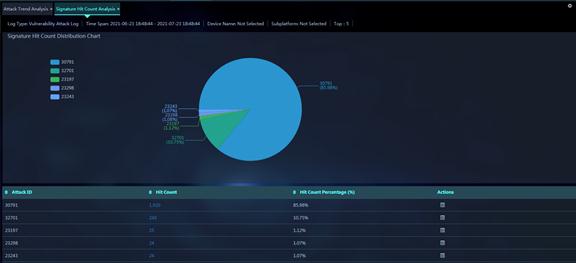
Parameters:
· Attack ID: Attack ID in the vulnerability attack logs reported to the platform within the specified time span.
· Hit Count: Number of times the attack ID was hit within the specified time span.
· Hit Count Percentage (%): Percentage of the number of times that the attack ID was hit to the total number of times that all attack IDs were hit within the specified time span.
Reports
Report templates
A report template defines the contents that contain in a report file. The platform can generate report files with different contents if you select different templates for the report tasks.
The platform provides the following predefined report templates:
· IPS Permitted Event—Contains statistics about all permitted events, including event name and event count information. The events are listed in descending order of event count.
· IPS Blocked Event—Contains statistics about all blocked events, including event name and event count information. The events are listed in descending order of event count.
· IPS Attack Event—Contains statistics about all attack events, including event name and attack count information. The events are listed in descending order of attack count.
· IPS Destination Port Attack Event—Contains destination port statistics about all attack events, including destination port number and attack count information. The events are listed in descending order of attack count.
· IPS Source IP Attack Event—Contains source IP statistics about all attack events, including source IP address and attack count information. The events are listed in descending order of attack count.
· IPS Destination IP Attack Event—Contains destination IP statistics about all attack events, including destination IP address and attack count information. The events are listed in descending order of attack count.
To view template information, enter the Reports > Reports > Report Templates
page. To preview a report template, click the ![]() icon in the Actions column
for the template.
icon in the Actions column
for the template.
Report tasks
Use this feature to add report tasks to generate report files periodically or immediately. Depending on the actual requirements, you can specify a task type, set the task execution time, and specify a report template for each task.
The platform provides the following types of report tasks:
· Periodic report tasks—Include daily, weekly, and monthly report tasks. The tasks periodically collect security events within the report time span and generate daily, weekly, and monthly report files accordingly. The report end time is 00:00:00 on the execution day and the report start time is the end time minus the report time span.
· Immediately executed report tasks—The tasks immediately collect security events within the report time span and generate report files. The report end time is the time you perform an immediately executed task and the report start time is the end time minus the report time span. You can also custom the start and end time.
Add a report task
Restrictions and guidelines
You can start or suspend only periodic report tasks.
Procedure
1. From the top navigation bar, select Reports.
2. From the left navigation pane, select Reports > Report Tasks.
3. Click Add.
4. On the Basic Info tab, configure basic parameters.
Figure 20 Basic Info
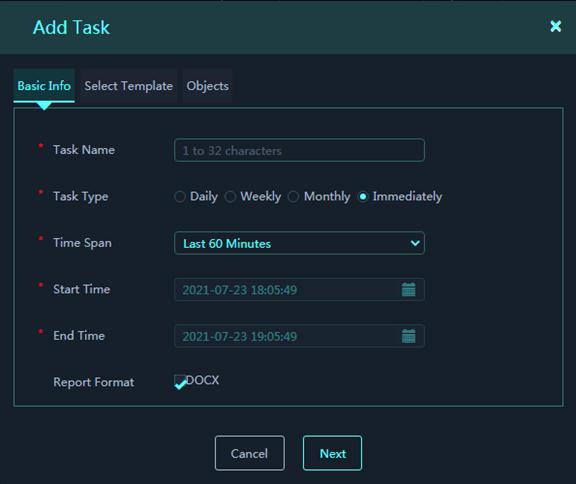
Basic info parameters:
¡ Task Name: Enter the name of the report task.
¡ Task Type: Select a task type, which can be daily, weekly, monthly, or immediately. The parameters vary by task type.
- If you select Daily, you need to specify the task execution time. For example, if the task execution time is 20:30:00, the platform will execute this task at 20:30:00 every day to collect security event statistics of last day. Then, the platform will generate a report file for the statistics.
- If you select Weekly, you need to specify the task execution time and the execution day. For example, if the task execution time is 20:30:00 and the task execution day is Monday, the platform will execute this task at 20:30:00 every Monday to collect statistics. The statistics include information about the security events occurred within last 7 days (not including the current day). The platform will generate a report file for the statistics.
- If you select Monthly, you need to specify the task execution time. For example, if the task execution time is 20:30:00, the platform will execute this task at 20:30:00 on the 1st day of each month to collect statistics. The statistics include information about the security events occurred within last month. The platform will generate a report file for the statistics.
- If you select Immediate, you need to specify the time span. For example, specify last 60 minutes or last 7 days. If you select Custom, you need to specify the start time and end time. The task will be executed immediately after you finish the task configuration. The platform will generate a statistics report file for the security events occurred within the specified time span.
¡ Report Format: Select a report file format. In the current software version, the platform supports only the DOCX format.
5. Click Next.
6. Select a report template. The platform will collect security event statistics and generate report files based on the selected report template.
Figure 21 Select Templates
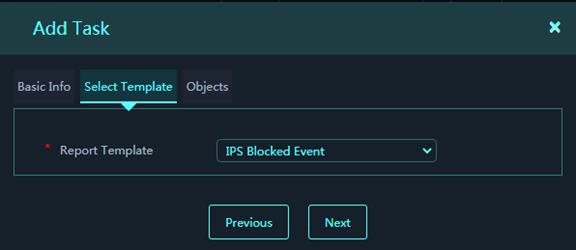
7. Click Next.
8. Select statistical objects.
Figure 22 Objects
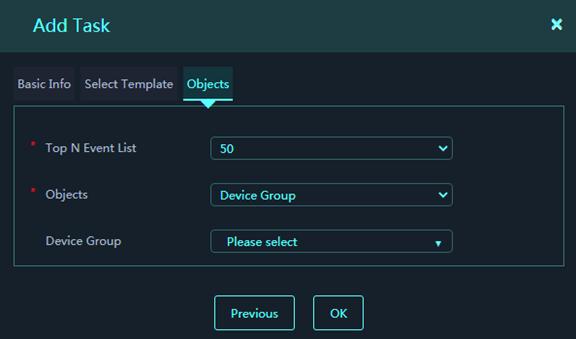
Parameters:
¡ Top N Event List: Specify the number of top events to be collected.
¡ Objects: Select objects from which to collect statistics. Only Device Group is supported.
¡ Device Group: Select device groups.
9. Click OK.
You can view the task state in the report task list.
Report files
This feature displays the report files generated through report tasks. You can view the file name, task name, and task type of each report file. In addition, you can download or delete these report files.
To delete report files in bulk, select
multiple report files and click Download in the upper-left corner of the work pane. To delete a single
report file, click the ![]() icon in the Actions column for that report file.
icon in the Actions column for that report file.
Figure 23 Reprot files

This feature displays analysis results for security logs, traffic logs, and application audit logs collected from devices.
By default, the page that you enter automatically refreshes at intervals of 30 seconds. To change the enabling status of auto refresh or change the refresh interval, click Settings in the upper-left corner of the work pane.
To filter logs, you can specify a time span
or click the More Filters icon ![]() to configure multiple filters. The page will
display log information according to the specified time span and filters. To
customize columns displayed in the log list, click the Columns icon to
select columns.
to configure multiple filters. The page will
display log information according to the specified time span and filters. To
customize columns displayed in the log list, click the Columns icon to
select columns.
To export logs:
1. Click Export in the upper-left corner of the work pane.
2.
Click the Download icon ![]() in the
upper-right corner of the page to view the export process. After the platform
finishes exporting the logs to a file, click the Download icon in the Actions column
for the log file. The downloaded logs will be stored in CSV files. Each CSV file can contain a maximum of 100000 logs. The CSV
files are compressed into a .TAR.GZ file.
in the
upper-right corner of the page to view the export process. After the platform
finishes exporting the logs to a file, click the Download icon in the Actions column
for the log file. The downloaded logs will be stored in CSV files. Each CSV file can contain a maximum of 100000 logs. The CSV
files are compressed into a .TAR.GZ file.
Restrictions and guidelines
Before you configure this feature, enable logging for services on the managed devices (for example, firewalls) and specify the log host. The IP address of the log host must be the IP address of this platform. You can configure the port number of the log host according to the log type.
· Set the port number to 9002 for NAT traffic logs.
· Set the port number to 514 or 30514 for other types of logs.
Security logs
Use this feature to display analysis results for vulnerability attack logs, virus attack logs, and security policy logs collected from the managed devices.
·
Vulnerability Attack
Log—To view
vulnerability attack log information, enter the Log Audit > Security Logs
> Vulnerability Attack Log page. If you consider that a log is falsely reported, click the ![]() icon
in the Actions column for that log. The Add IPS Allowlist Entry page is
opened. The system automatically adds the log information to the IPS allowlist entry.
You need to configure the entry name, verify the configuration, and click OK. For more
information about the IPS allowlist parameters, see "IPS allowlist."
icon
in the Actions column for that log. The Add IPS Allowlist Entry page is
opened. The system automatically adds the log information to the IPS allowlist entry.
You need to configure the entry name, verify the configuration, and click OK. For more
information about the IPS allowlist parameters, see "IPS allowlist."
Figure 24 Add IPS Allowlist
· Virus Attack Log—To view virus attack log information, enter the Log Audit > Security Logs > Virus Attack Log page.
· Security Policy Log—To view security policy log information, enter the Log Audit > Security Logs > Security Policy Log page.
Traffic logs
Use this feature to display the following logs collected from the managed devices:
· NAT Session Log—NAT session logs are used for security auditing. The logs record NAT session information, including IP and port translation information, user access information, and session start and end time information.
· NAT444 Port Block Log—NAT444 port block logs are used for user tracing. The NAT444 gateway generates a user log whenever it assigns or withdraws a port block. The log includes the private IP address, public IP address, and port block. You can use the public IP address and port numbers to locate the user's private IP address from the user logs.
· NAT444 Session Log—NAT444 session logs are used for security auditing. The logs record NAT444 session information, including IP and port translation information.
Application audit logs
Application audit logs record user online behaviors. For example, IM software logs record users' chat behaviors and search engine logs record users' history searching behaviors. You can adjust policies based on the logs to regulate user online behaviors.
Alarm events
Alarm events
This feature displays alarm events recorded by the platform. You can view information about the events, including the event generation time, event name, source and destination IP addresses, and real source IP.
Alarm rules
Use this feature to configure the matching criteria and time window to generate alarm events. Within each time window, the system aggregates events that match the same criteria and generates an alarm event for the aggregated events.
Parameters:
· Aggregation Criteria: Specify aggregation criteria to generate alarm events. The system aggregates events that match the same aggregation criteria and generates an alarm event for the aggregated events. The criteria include source IP, destination IP, real source IP, event name, and security actions.
· Time Window: Time window to generate an alarm event. The system aggregates only the events occurred within the same time window. Time window options include 10 seconds, 20 seconds, 30 seconds, 40 seconds, and 50 seconds.
Alarm notifications
Use this feature to send alarm event notifications by email to specific receivers.
Alarm notification policies
Perform this task to configure trigger conditions to send alarm notification emails and the email parameters.
Prerequisites
Before you configure this feature, complete the following tasks:
· Configure email server settings on the System Settings > System Management > Global Settings > Email Server Settings page.
Figure 25 Email Server Settings
· Configure email addresses for the receivers on the System Settings > System Management > Roles & Privileges > User Management page.
Figure 26 User Management
Add an alarm notification policy
1. From the top navigation bar, select Alarm Events.
2. From the left navigation pane, select Alarm Notifications > Alarm Notification Policies.
3. Click Add.
4. Configure basic information, trigger conditions, and email parameters.
Figure 27 Add Alarm Notification Policy
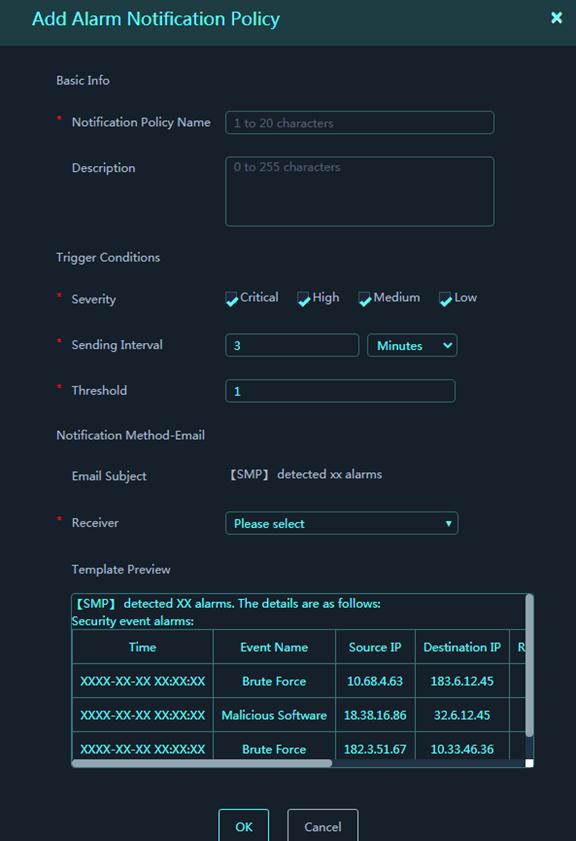
Parameters:
¡ Notification Policy Name: Enter the name of the alarm notification policy.
¡ Description: Enter a description for the alarm notification policy.
¡ Severity: Select severity levels to match alarm events. Options include critical, high, medium, and low.
¡ Sending Interval: Set the interval to send an email.
¡ Threshold: Set the maximum number of original events in an alarm event. The platform sends an alarm notification only when the number of original events in an alarm event is equal to or higher than the threshold.
¡ Email Subject: Configure the email subject of alarm notifications.
¡ Receivers: Specify receivers to receive alarm notifications through email. You can select only users that are configured with email addresses.
¡ Template Preview: Preview the email template content.
An alarm notification email contains only the top 50 alarm events. They are arranged in descending order of original event count.
Alarm notification records
The platform generates an alarm notification record each time it sends an alarm event notification by email.
To view alarm notification records:
1. On the top navigation bar, click Alarm Events.
2. From the left navigation pane, select Alarm Notifications > Alarm Notification Records.
The page that opens displays alarm event notification records, including the email sending time, alarm notification policy name, and receivers.
O&M
Areas
From the Areas menu, you can divide the network into different areas as needed, and configure subareas, assets, and collectors for the areas. The platform exchanges information with assets through area collectors.
Add an area
On the top navigation bar, click O&M. From the left navigation pane, select Areas. Click Add. Configure the parameters, and then click OK.
Figure 28 Add Area Management
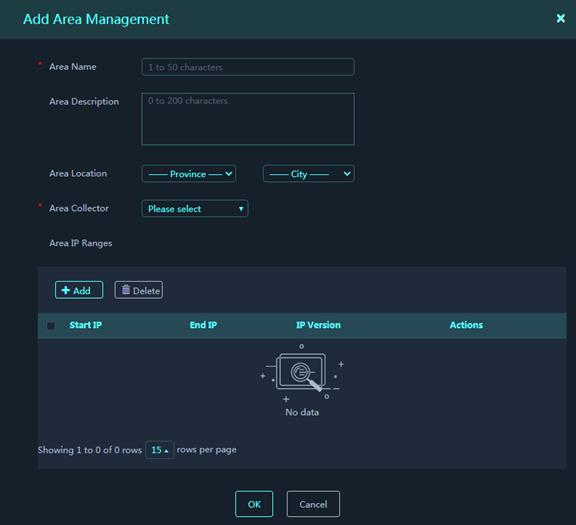
Figure 29 Add IP Range

Parameters:
· Area Name: Name of the area.
· Area Description: Description for the area.
· Area Location: Province and city information for the area.
· Area Collector: IP address of the collector deployed for the area. The platform exchanges information with assets through area collectors.
· Area IP Ranges: IP ranges contained in the area. Click Add to add an IP range.
¡ Start IP: Start IPv4 or IPv6 address of the IP range.
¡ End IP: End IPv4 or IPv6 address of the IP range. The end IP address must be higher than or equal to the start IP address.
¡ IP Version: IPv4 or IPv6.
Add subareas
On the areas management page, click the ![]() icon
in the Actions column for an area to add subareas for the area. The
subarea configuration is the same as the area configuration.
icon
in the Actions column for an area to add subareas for the area. The
subarea configuration is the same as the area configuration.
Figure 30 Add subareas

Device groups
From the Device Groups menu, you can divide assets into different groups so as to perform group-based security analysis, log auditing, and reporting for assets.
Restrictions and guidelines
A device group that contains devices cannot be deleted.
Add a device group
On the top navigation bar, click O&M. From the left navigation pane, select Device Groups. Click Add. Configure the parameters, and then click OK.
Figure 31 Add Device Group
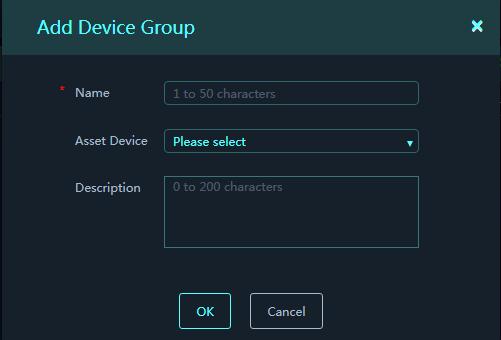
Parameters:
· Name: Name of the device group.
· Asset Device: Devices (assets) included in the device group.
· Description: Description for the device group. Set proper descriptions for device groups to facilitate usage of them.
Delete device groups
On the device group management page, you can delete device groups in the following ways:
· Select the device groups to be deleted and then click Delete.
· Click the Delete icon in the Actions column for a device group.
Monitored assets
From the Monitored Assets area, you can manage assets and monitor asset running in real time.
Manage templates
You can manage SNMP, SSH, and SOAP templates for asset management and monitoring.
· SNMP templates: Used to monitor device states, obtain device CPU and memory usage information.
· SSH templates: Used to log in to devices.
· SOAP templates: Used to configure devices, for example, upgrade and roll back signature versions.
The platform uses the templates to monitor device states, log in to devices remotely, and deploy configurations to devices.
Add an SNMP template
1. On the top navigation bar, click O&M.
2. From the left navigation pane, select Monitored Assets.
3. Click Manage Templates in the upper right corner of the page.
4. Click the SNMP Template tab. Click Add to add an SNMP template. Configure the template parameters, and then click OK.
Figure 32 Add SNMP Template
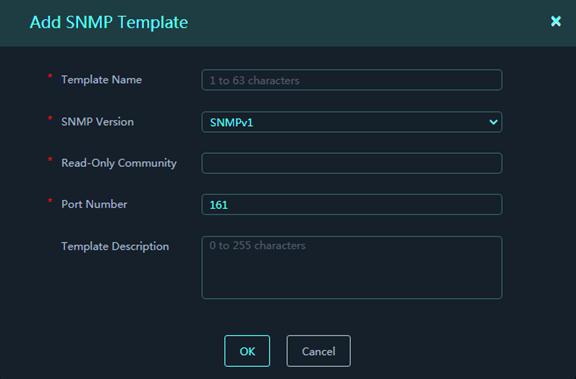
Parameters:
¡ Template Name: Name of the template.
¡ SNMP Version: Supported SNMP versions, including v1, v2, and v3. SNMPv3 supports multiple encryption and authentication methods.
¡ Read-Only Community: This value must be the same as that set on the device.
¡ Username: Username used for authentication.
¡ Authentication Password: Password used for authentication.
¡ Encryption Password: Encryption used for authentication.
¡ Port Number: Port number on which the platform listens for SNMP packets.
¡ Template Description: Description for the template.
Add an SSH template
1. On the top navigation bar, click O&M.
2. From the left navigation pane, select Monitored Assets.
3. Click Manage Templates in the upper right corner of the page.
4. Click the SSH Template tab. Click Add to add an SSH template. Configure the template parameters, and then click OK.
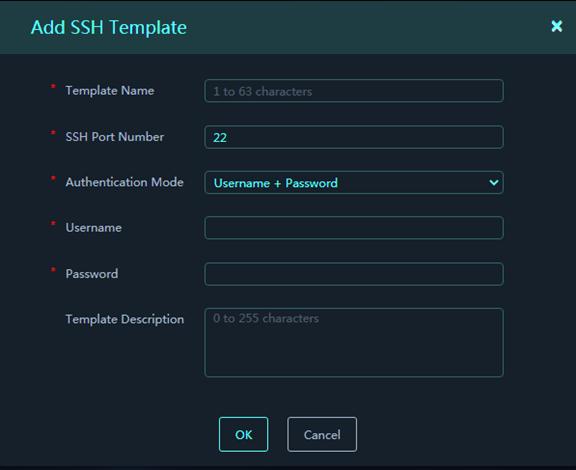
Figure 33 Add SSH Template
Parameters:
¡ Template Name: Name of the template.
¡ SSH Port Number: Port number used by the platform to log in to the device through SSH.
¡ Username: Username used by the platform to log in to the device through SSH.
¡ Password: Password used by the platform to log in to the device through SSH.
¡ Template Description: Description for the template.
Add an SOAP template
1. On the top navigation bar, click O&M.
2. From the left navigation pane, select Monitored Assets.
3. Click Manage Templates in the upper right corner of the page.
4. Click the SOAP Template tab. Click Add to add an SOAP template. Configure the template parameters, and then click OK.
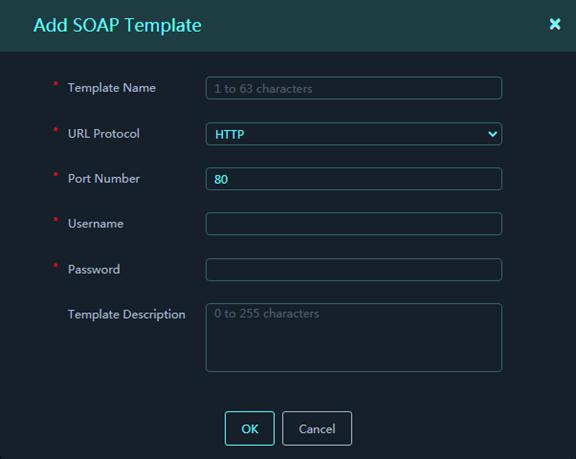
Figure 34 Add SOAP Template
Parameters:
¡ Template Name: Name of the template.
¡ URL Protocol: Select HTTP or HTTPS to enable the HTTP- or HTTPS-based NETCONF over SOAP feature.
¡ Port Number: Port number used by NETCONF over SOAP. For HTTP-based NETCONF over SOAP, the port number is 80 by default. For HTTPS-based NETCONF over SOAP, this port number is 832.
¡ Username: Username used by the platform to log in to the device.
¡ Password: Password used by the platform to log in to the device.
¡ Template Description: Description for the template.
Manage devices
On the Devices tab, you can manage and monitor devices, synchronize configurations from devices to the platform, and deploy configurations from the platform to devices. You can add devices one by one or import devices in bulk.
Restrictions and guidelines
Before adding devices, you must first configure template parameters. The SNMP or SOAP template settings configured on the platform must be consistent with the SNMP or NETCONF over SOAP settings on the device. Otherwise, the platform and the device cannot exchange information successfully.
View system information of assets
On the Devices tab, you can view basic information (including the asset name, area, IP address), CPU usage, and memory usage of devices.
Click the Details icon in the Actions column for an asset to view detailed information about the device, including system traffic statistics, session statistics, CPU/memory usage information, and interface details.
Click the ![]() icon in the Actions column for an
asset to open the Web login interface of the device.
icon in the Actions column for an
asset to open the Web login interface of the device.
Add an asset
Perform this task to add an asset:
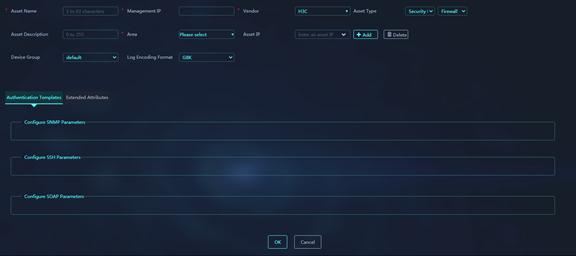
1. On the Devices tab, click Add to open the asset configuration page. Configure the asset parameters.
Figure 35 Add Asset
Parameters:
¡ Asset Name: Name of a device. As a best practice, enter the real device name.
¡ Management IP: Management IP address of the device.
¡ Vendor: Vendor of the device.
¡ Asset Type: Select Security Device - IPS Device for an IPS device, and Security Device - IPS Device for a firewall device.
¡ Asset Description: Description for the device.
¡ Area: Area where the device resides.
¡ Asset IP: Enter the IP address of the device, and then click Add next to the input box. You can open the asset IP list to view device IP information.
¡ Device Group: Device group to which the device belongs.
¡ Log Encoding Format: Encoding format used by the device to report logs, which can be GBK or UTF-8. The default is GBK.
2. Configure the authentication templates for device. You can manually edit the template parameters or select existing templates.
¡ To use an SNMP template: Click Configure SNMP Parameters, and then click Settings. You can manually edit the template parameters or use the settings in an existing template. For description of the parameters, see “Add an SNMP template.”
¡ To use an SSH template: Click Configure SSH Parameters, and then click Settings. You can manually edit the template parameters or use the settings in an existing template. For description of the parameters, see “Add an SSH template.”
¡ To use an SOAP template: Click Configure SOAP Parameters, and then click Settings. You can manually edit the template parameters or use the settings in an existing template. For description of the parameters, see “Add an SSH template.”
3. Configure extended attributes for the device, for example, the serial number and asset number of the device.
4. Click OK.
Bulk import assets
1. On the Devices tab, click Import and select Download Template.
Figure 36 Import asset
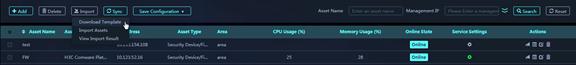
2. Enter device information as required in the template, and then click Import and select Import Assets. Select the template where you have edited device information and then upload it to import the devices in bulk.
Figure 37 Import Excel File
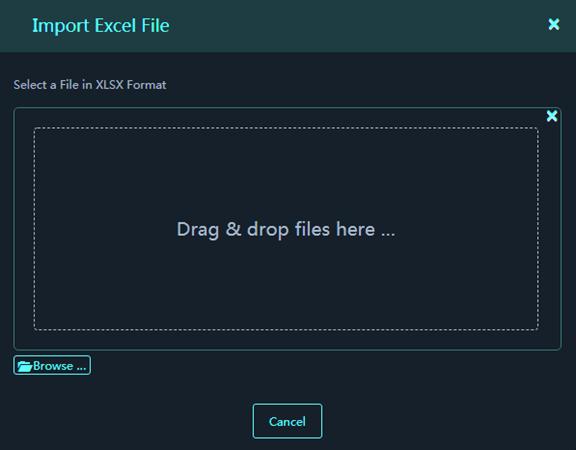
3. After the import is finished, you can click Import and select View Import Result to view the asset import result.
Synchronize the asset configuration
Perform this task to synchronize the service configurations from devices to the platform for centralized management.
Select one or more devices, and then click Sync. All service configurations that support synchronization can be synchronized from the selected devices to the platform. You can view the synchronization result in the Service Settings column.
Configure services of an asset
Perform this task to deploy service
configurations from the platform to a device. After device synchronization
succeeds, click the Service Settings icon ![]() for a device to open
the service configuration page.
for a device to open
the service configuration page.
Supported settings include security policies, IP address groups, service groups, applications, application groups, time ranges, security zones, IPS profiles, anti-virus profiles, IPS allowlist, dynamic NAT rules, NAT address groups, bandwidth policies, and traffic profiles. You can configure these services as needed on the platform.
The platform will immediately deploy your configuration (such as add, delete, edit, or move) for the services to the device.
Save the asset configuration
Perform this task to save the configuration of devices in bulk.
Select one or more devices. Click Save Configuration and select Save Configuration. The running configuration of each selected device will be saved to its startup configuration file. Click Save Configuration again and select Operation Result to view the save operation result.
Bulk import configuration from assets to the platform
Perform this task to import service configurations from a device to the platform. After the configurations of a device are imported to the platform, the configurations become global resources of the platform. You can deploy global resources to multiple devices. In this way, configurations can be copied from one device to another.
After device synchronization succeeds,
click the Service Settings icon ![]() for a device to open the service
configuration page. Click Import Configuration in the upper right corner
of the page. On the page that opens, you can view the device's configuration
resources and security policies that are importable to the platform.
for a device to open the service
configuration page. Click Import Configuration in the upper right corner
of the page. On the page that opens, you can view the device's configuration
resources and security policies that are importable to the platform.
You can select the importable resources and security policies as needed, and then click Import to import the configurations to the platform.
Restrictions and guidelines for configuration import:
· The system will compare the settings to be imported with the Global Resources under Security Services. The system cannot import settings conflicting with the global resources.
· The system imports the selected importable resources and their dependent resources to the global resources.
· The system imports the selected security policies and their dependent resources to the global resources.
Security services
From the Security Services menu, you can manage global resources (such as IP addresses, services, and time ranges) and security policies. Global resources can be used by security policies and deployed to one or more devices. You can bulk manage and deploy security policies on the platform.
Restrictions and guidelines
Before you deploy security policies to devices, you must first configure NETCONF over SOAP on the devices, add the devices to the platform as assets, and specify the areas where the devices reside and configure the SOAP parameters.
Global resources
IP address management
This feature allows you to search, add, delete, and edit host IP addresses, IP address ranges, subnet address, and IP address groups.
· Host IP Address: On this tab, you to search, add, delete, and edit all host IP addresses in the system. A host IP address name cannot be the same as an IP address range name or a subnet address name on the IP address list.
· IP Address Range: On this tab, you can search, add, delete, and edit all IP address ranges in the system. An IP address range can be IPv4 or IPv6. If an IP address range is added to an IP address group, the state of the IP address range is Used. If it is not added to an IP address group, the state is Not Used.
· Subnet Address: On this tab, you can search, add, delete, and edit all subnet addresses in the system. A subnet address can be IPv4 or IPv6. If a subnet address is added to an IP address group, the state of the subnet address is Used. If it is not added to an IP address group, the state is Not Used.
· IP Address Group: On this tab, you can search, add, delete, and edit all IP address groups in the system. An IP address group can be IPv4 or IPv6.
Service management
A service group is a group service objects used to match the protocol type and protocol properties (such as TCP or UDP source/destination port and ICMP message type/code) in a packet. Service groups include predefined service groups and user-defined service groups. You can search, add, edit, and delete user-defined service groups.
Time range management
A time range defines a period of time. You can create a time range and apply it to an inter-zone rule. Then, the rule takes effect in the period of time defined by the time range. The following types of time ranges are available:
· Periodic time range—Recurs on a day or days in a week. Example: 8:00 to 12:00 every Monday.
· Absolute time range—Represents a specific period of time and does not recur. Example: 2015-1-1 8:00 to 2015-1-3 18:00.
Security zone management
A security zone is a logical concept. You can add interfaces that have the same security requirements to a security zone to facilitate configuration and management of the interfaces.
On the security zone management page, click Add to open the security zone configuration page. Configure the name and description for the security zone. Click Add Interfaces. On the page that opens, select the device to which the security zone will be deployed, and then select the interfaces to be added to the security zone. Click OK. The system will deploy the security zone configuration to the device.
Restrictions and guidelines:
· To add a security zone, you need to select the target device and the device's interfaces to be added to the security zone. After the security zone is configured, the system deploys the configuration to the target device and the deployment takes time.
· Interfaces that are already in a security zone cannot be added to another security zone.
IPS
IPS is a security feature that can inspect and prevent application layer attacks. It enables devices to monitor network traffic for malicious activity and to proactively take prevention actions.
IPS is implemented based on IPS profiles. To add an IPS profile:
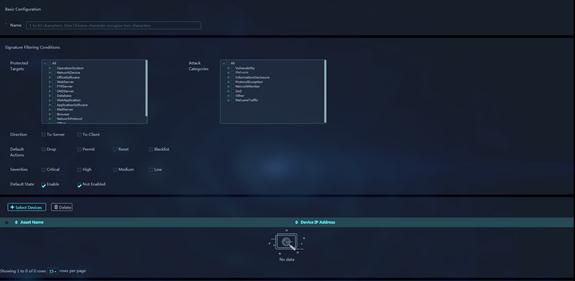
1. On the IPS Profiles page, click Add.
Figure 38 Add IPS Profile
![]()
![]()
2. In the Basic Configuration area, configure the IPS profile name.
3. In the Signature Filtering Conditions area, configure the criteria to filter the IPS signatures for the IPS profile.
Parameters:
¡ Protected Targets: Select the targets protected by the signatures.
¡ Attack Categories: Select the attack categories to which the signatures belong.
¡ Default Actions: Select the default actions of the signatures. Options are Drop, Permit, Reset, and Blacklist.
¡ Severities: Select the severity levels of the signatures. Options are Critical, High, Medium, and Low.
¡ Default State: Select the default state of the signatures. Options are Enabled and Disabled. Enabled means that the signature is widely applied in various scenarios and is recommended to use by default. Disabled means that the signature is applied only to a specific scenario and is not recommended using by default.
The IPS profile will filter all signatures that match the configured conditions. If a filtering condition configures multiple parameters, a signature must match a minimum of one of the parameters to match the condition.
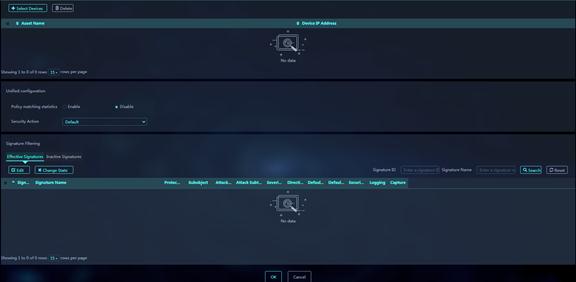
4. (Optional.) In the Unified Configuration area, configure the parameters as needed.
Parameters:
¡ Policy matching statistics: Enable this feature to count the number of times that packets hit the IPS profile.
¡ Security Action: Select the action that all signatures in the IPS profile will take on the matching packets. If you select the Default action, the signatures will take their respective default actions on the matching packets.
¡ Log: Logs the packets that match the signatures.
¡ Capture: Captures the packets that match the signatures.
5. (Optional.) In the Signature Filtering area, change the state or security action for an active or inactive IPS signature. Select a signature on the Active Signatures or Inactive Signatures tab. To change the signature's state, click Change State. To change the signature's action on matching packets, click Edit.
6. Click Select Devices to select the devices to which the IPS profile will be deployed. Click OK.
7. Click OK. The IPS profile configuration is finished and will be deployed to the selected devices.
8. Specify the IPS profile in a security policy. For more information about the security policy configuration, see “Security policies.”
IPS allowlist
If false alarms exist in threat logs, you can enable the allowlist feature, and add the detected threat IDs (the IPS signature IDs), URLs, and IP addresses to the allowlist. The device permits packets matching the allowlist to pass through, reducing false alarms.
To add an allowlist IPS entry:
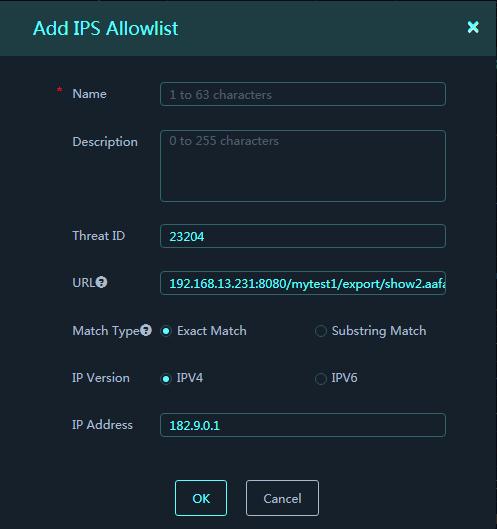
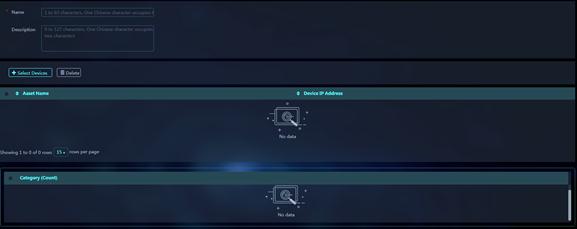
1. On the IPS Allowlist page, click Add. Configure the basic information for the IPS allowlist entry.
Figure 39 Add IPS Allowlist
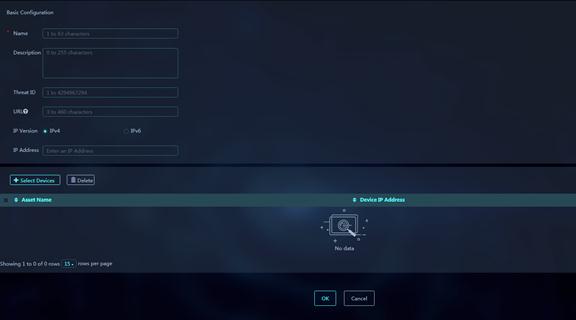
Parameters:
¡ Name: Enter a name for the IPS allowlist entry.
¡ Description: Enter a description for the IPS allowlist entry.
¡ Threat ID: Enter a threat ID. You can obtain the threat ID from threat logs.
¡ URL: Enter a URL. You can obtain the URL from threat logs. A URL contains packet header fields and packet first line, for example, 111.15.93.166/wnm/get.j.
¡ Match Type: Select a match type, exact match or substring match. Exact match deems a match if the detected URL in the packet is exactly the same as the configured URL. Substring match deems a match if the detected URL in the packet contains the configured URL.
¡ IP Version: Select the IP version of the addresses that can be obtained from threat logs. Options are IPv4 and IPv6.
¡ IP Address: Enter an IP address. You can obtain the IP address from threat logs.
2. Click Select Devices to select the devices to which the IPS allowlist entry will be deployed. Click OK.
3. Click OK. The IPS allowlist entry configuration is finished and will be deployed to the selected devices.
Anti-virus
Anti-virus identifies viruses in the application layer of packets based on an up-to-date virus signature library and takes actions to prevent a network from being infected. This feature is typically deployed on a gateway to insulate the internal network from viruses and protect the internal data. At present, anti-virus supports inspection on packets that are based on the following protocols:
· Hypertext Transfer Protocol (HTTP)
· File Transfer Protocol (FTP)
· Simple Mail Transfer Protocol (SMTP)
· Internet Mail Access Protocol (IMAP)
· Post Office Protocol - Version 3 (POP3)
Anti-virus is implemented based on anti-virus profiles. To add an anti-virus profile:
1. On the Anti-Virus page, click Add to open the anti-virus profile configuration page. Configure the anti-virus profile parameters.
Figure 40 Add Anti-virus Profile
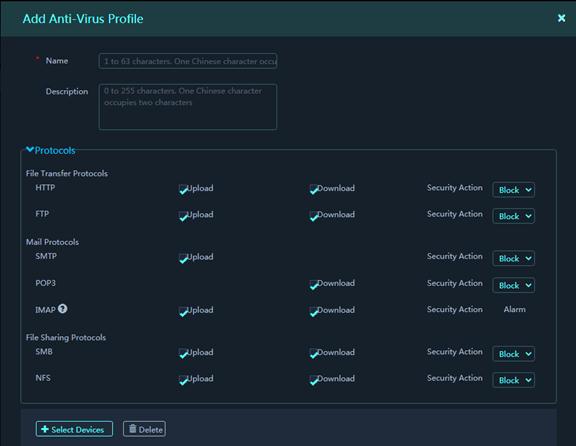
Parameters:
¡ Name: Enter a name for the anti-virus profile.
¡ Description: Enter a description for the context. Set proper descriptions for anti-virus profiles to facilitate maintenance.
¡ Upload: Select this item for a protocol to apply the anti-virus profile to the upload traffic of the protocol. This item is not available for the POP3 protocol.
¡ Download: Select this item for a protocol to apply the anti-virus profile to the download traffic of the protocol. This item is not available for the SMTP protocol.
¡ Security Action: Select an anti-virus action for matching packets. The device detects virus for packets using the specified protocols and in the specified directions. If an virus is detected in a packet, the device takes the specified action on the packet. Supported actions are Alarm, Block, and Redirect. The IMAP protocol supports only the Alarm action.
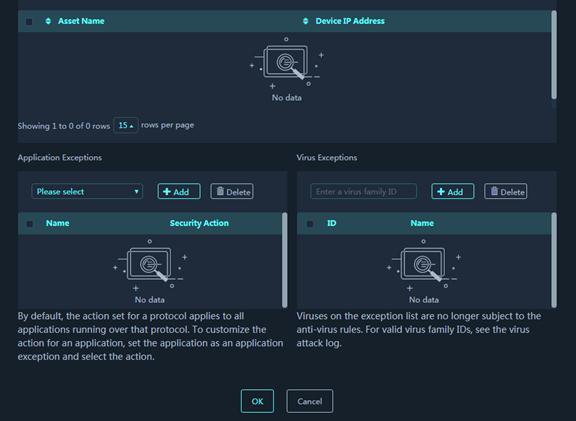
2. (Optional.) Typically, anti-virus action is protocol specific and applies to all applications carried by the protocol. To take a different action on an application, you can set the application as an exception and specify a different anti-virus action for the application. Application exceptions use application-specific actions and the other applications use protocol-specific actions. For example, the anti-virus action for HTTP is permit. To block games carried by HTTP, you can set the games as application exceptions and specify the block action for them.
3. (Optional.) Typically, anti-virus takes anti-virus actions on packets matching virus signatures. If a virus proves to be a false alarm, you can set the virus signature as a virus exception. Packets matching the virus exception are permitted to pass.
4. Click Select Devices to select the devices to which the anti-virus profile will be deployed. Click OK.
5. Click OK. The anti-virus profile configuration is finished and will be deployed to the selected devices.
6. Specify the anti-virus profile in a security policy. For more information about the security policy configuration, see “Security policies.”
Application management
The application recognition (APR) feature recognizes application protocols of packets for application-based services received on or sent out of ports and collects quantity and transmit rate statistics. APR uses the following methods to recognize an application protocol:
· Port-based application recognition (PBAR)—Maps a port to an application protocol and recognizes packets of the application protocol according to the port-protocol mapping.
· Network-based application recognition (NBAR)—Uses predefined or user-defined NBAR rules to match packet contents to recognize the application protocols of matching packets.
To add a user-defined application:
1. On the Application Management page, click the Application Service tab. Click Add. The Add User-Defined Application page opens.
Figure 41 Add User-defined Application
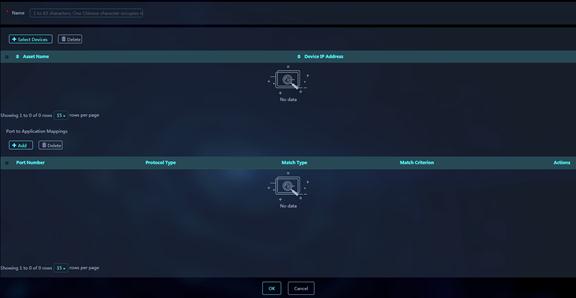
2. Enter a name for the application.
3. In the Port to Application Mappings area, click Add. Configure the port to application mapping parameters.
Figure 42 Add Port to Application
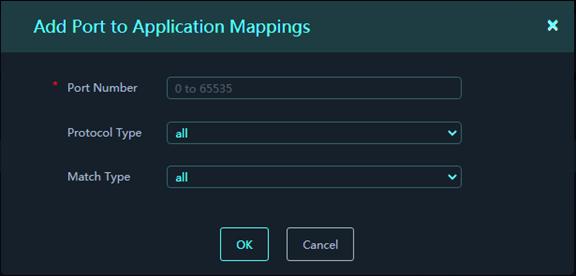
Parameters:
¡ Port Number: Enter the number of a port to which the application is mapped.
¡ Protocol Type: Select a transport layer protocol. Options include all, DCCP, SCTP, TCP, UDP, and UDP-Lite. All represents all transport protocols. If All is selected, packets that are encapsulated in any transport layer protocol and with the specified port are recognized as the specified application protocol's packets.
¡ Match Type: Select a match type. Options include all (general port mapping), IPv4 address-based host-port mapping, IPv4 subnet-based host-port mapping, IPv4 ACL-based host-port mapping, IPv6 address-based host-port mapping, IPv6 subnet-based host-port mapping, and IPv6 ACL-based host-port mapping. The platform supports using only existing ACLs on the device for IPv4 and IPv6 ACL-based mappings.
4. Click OK.
5. Click Select Devices to select the devices to which the application will be deployed. Click OK.
6. Click OK. The application configuration is finished and will be deployed to the selected devices.
You can add applications that have similar characteristics or limitations to an application group. The device supports a maximum of 1000 application groups. Each application group can contain a maximum of 1000 user-defined applications and a limitless number of predefined applications.
To add a user-defined application group:
7. On the Application Management page, click the User-Defined Application Group tab. Click Add. The Add User-Defined Application Group page opens.
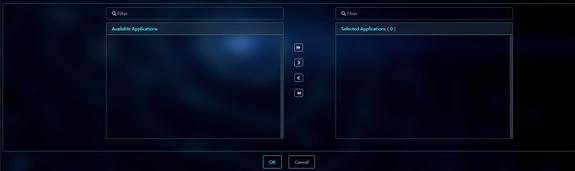
Figure 43 Add User-defined Application Group
8. Configure the name and description for the application group.
9. In the Category area, select categories to filter desired applications. The matching applications are listed in the Available Applications list.
10. Select the applications to be added to the application group, and
click ![]() to add the selected
applications to the Selected Applications list. Or, you can click
to add the selected
applications to the Selected Applications list. Or, you can click ![]() to add all
applications to the Selected Applications list.
to add all
applications to the Selected Applications list.
Figure 44 Selected Application list
11. Click Select Devices to select the devices to which the application group will be deployed. Click OK.
12. Click OK. The application group configuration is finished and will be deployed to the selected devices.
Security policies
A security policy defines a set of filtering criteria for identifying traffic. The filtering criteria include the following types: source security zone, destination security zone, source IP address and source MAC address, destination IP address, service, application, user, and time range. The device matches packets against the security policies and takes the action stated in the policy on the matching packets. Packets that match no security policies are discarded. A policy matches all packets if no criteria are specified for the policy.
Add a security policy
Perform this task to add a security policy:
1. On the Security Policies tab, click Add to open the security policy configuration page. Configure the security policy parameters.
Figure 45 Add security policy
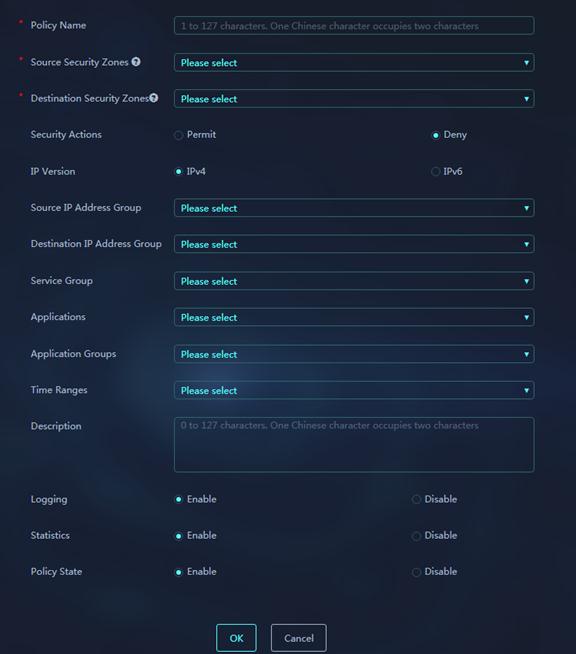
Parameters:
¡ Policy Name: Enter a name for the security policy. Security policies of the same type cannot have the same name.
¡ Source Security Zones: Select source security zones as filtering criteria of the security policy.
¡ Destination Security Zones: Select destination security zones as filtering criteria of the security policy.
¡ Security Action: Select the security policy action. Options include:
- Permit—Allows the packets that match the security policy to pass.
- Deny—Discards the packets that match the security policy.
¡ IP Version—IP version for the security policy, IPv4 or IPv6.
¡ Source IP Address Groups: Select source IP address groups as filtering criteria of the security policy.
¡ Destination IP Address Groups: Select destination IP address groups as filtering criteria of the security policy.
¡ Service Groups: Select service groups as filtering criteria of the security policy.
¡ Applications: Select applications as filtering criteria of the security policy.
¡ Application Groups: Select application groups as filtering criteria of the security policy.
¡ Time Range: Specify the time range during which the security policy rule is in effect.
¡ IPS Profile: Select the IPS profile to apply to the permitted packets.
¡ Anti-Virus Profile: Select the anti-virus profile to apply to the permitted packets.
¡ Description: Enter a description for the security policy. Set proper descriptions for security policies to facilitate maintenance.
¡ Logging: Select this item to enable logging for packets that match the security policy.
¡ Statistics: Select this item to collect statistics on the packets that match the security policy.
¡ Policy State: Select whether to enable the security policy.
2. Click OK.
You can delete, edit, and copy existing security policies.
Add a policy deployment task
Perform this task to bulk deploy security policies to multiple devices and display the deployment results.
To add a policy deployment task:
1. On the Policy Deployment Task tab, click Add. Configure the policy deployment task parameters.
Figure 46 Add Policy Deployment Task
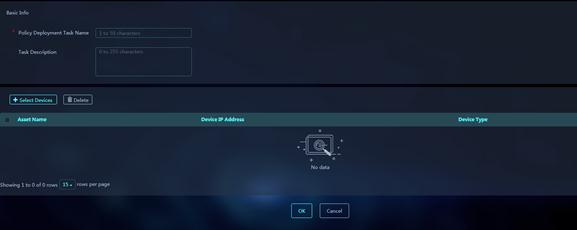
Parameters:
¡ Task Name: Enter a name for the task. The name must be unique among all policy deployment tasks.
¡ Task Description: Enter a description for the task. Set proper descriptions for policy deployment tasks to facilitate maintenance.
2. Click Select Devices to select the devices to which the security policies in task will be deployed. Click OK.
3. Click OK. The policy deployment task configuration is finished and the policy details page opens.
4. On the policy details page, add the security policies to be deployed to target devices. You can create new security policies or select existing security policies. You can also re-order, move, delete, and perform redundancy analysis for the security policies to be deployed.
Signature libraries
Restrictions and guidelines
Before you manage signature libraries, you must first configure NETCONF over SOAP on the devices, add the devices to the platform as assets, and specify the areas where the devices reside and configure the SOAP parameters.
Device signature libraries
On the Device Signature Databases tab, you can view signature libraries information about all devices, and upgrade and roll back signature library versions for devices.
Upgrade a signature library
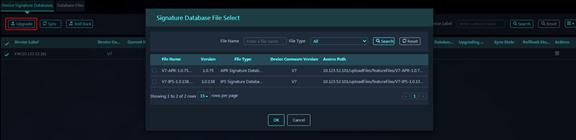
1. On the Device Signature Databases tab, select a device, and then click Upgrade. Select a signature file. Click OK. The device will use the file to upgrade the device's signature library.
Figure 47 Upgrade signature library
2. After the upgrade, select the device, and then click Sync. You can view the signature library upgrade result for the device.
Roll back a signature library
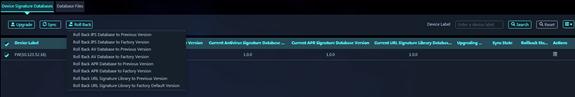
1. On the Device Signature Libraries tab, select a device, and then click Roll Back. Select an IPS, anti-virus, APR, or URL signature library to roll back. Select roll back to the previous version or roll back to the factory default.
Figure 48 Roll back a signature library
2. After the rollback, select the device, and then click Sync. You can view the signature library rollback result for the device.
Signature files
On the Database Files tab, you can upload signature files To the platform, delete signature files, and push signature files to a subplatform.
Upload a signature file
On the Database Files tab, click Upload File. Select a signature file and click Upload. The file will be uploaded to the platform.
Configure immediate push of a signature file
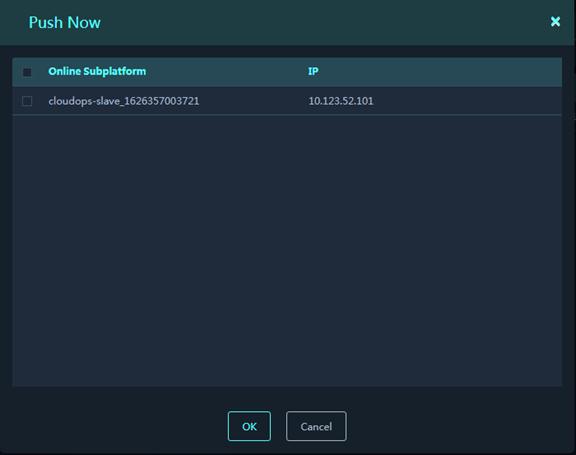
1. On the Database Files tab, select a signature file to be pushed, and then click Push File.
2. Select Push Now and select target subplatforms. Click OK. The system immediately pushes the selected signature file to the target subplatforms.
Figure 49 Push Now
3. To view the push result for the signature file, click the Details icon in the Actions column for the signature file.
Configure scheduled push of a signature file
1. On the Database Files tab, select a signature file to be pushed, and then click Push File.
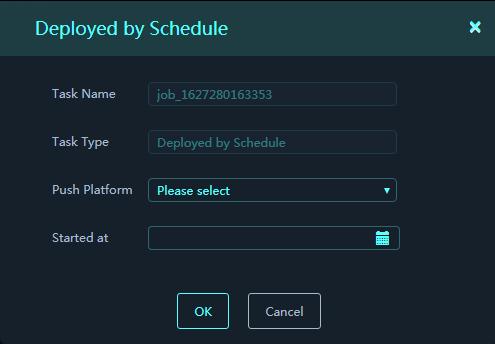
2. Select Scheduled Push.
3. Select target subplatforms and set the time when the file will be pushed to the subplatforms. Click OK. The system will push the selected signature file to the target subplatforms at the specified time.
Figure 50 Deplyed by Schedule
4. To view the push task execution result, navigate to the O&M > Signature Libraries > Push Tasks page. You can also start or suspend specific push tasks on this page.
Use this feature to manage system settings. For example, configure privileges for administrator users of the platform, record user operation logs, change the label name and logo image, and manage subplatforms.
System management
Global settings
System parameters
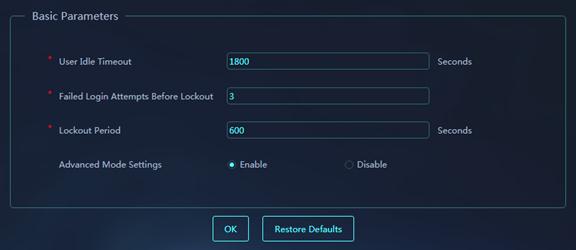
Use this feature to configure user login parameters or restore the parameters to the default values.
Figure 51 System parameters
Parameters:
· User Idle Timeout: Set the maximum user idle time. If a login user does not perform any operation on the webpages within the specified idle timeout time, the system forcibly logs that user out of the Web interface.
· Failed Login Attempts Before Lockout: Set the maximum number of times that a user consecutively fails to log in to the Web interface. The user is locked out of the Web interface after it fails the maximum login attempts.
· Lockout Period: Set the lockout period.
· Advanced Mode Settings: This parameter is limited to Agricultural Bank of China. In other scenarios, disable this parameter. With advanced mode enabled, the system makes IPS easy to use and enables the IPS allowlist service.
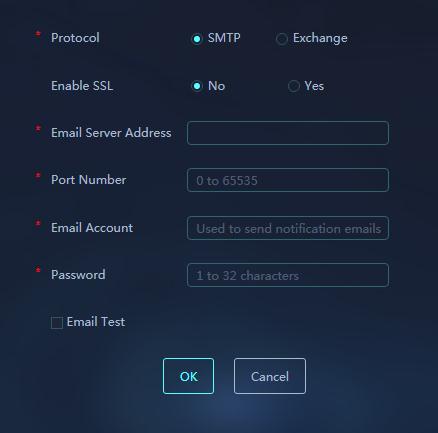
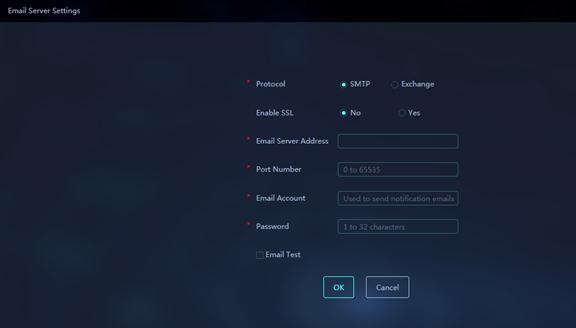
Email server settings
Use this feature to configure email server settings for the platform to send alarm notification emails.
Figure 52 Email server settings
Parameters:
· Protocol: Protocol used by the email server. Options are SMTP and Exchange.
· Enable SSL: Select whether to enable SSL. If SSL is enabled, the platform will encrypt emails by SSL.
· Email Server Address: IP address or host name of the email server.
· Port Number: Port number of the email server.
· Email Account: Email account used by the platform to send notifications.
· Password: Password of the email account.
· Email Test: Select this option to test whether the email server is available.
· Receiver Address: Specify a receiver email address for email test. Click Email Sending Test to use the configured parameters to start an email sending test.
Alarm rules
On the System Alarm Rules tab, you can set an alarm threshold for CPU usage, memory usage, or disk usage (data or system area). When the usage of one object reaches the specified threshold, the system generates an alarm.
To configure a system alarm rule:
1. On the top navigation bar, click System Settings.
2. From the left navigation pane, select System Management > Global Settings. In the work pane, click Alarm Rules.
3. On the System Alarm Rules tab, click Edit for a system alarm rule.
Figure 53 Edit Alarm Rule
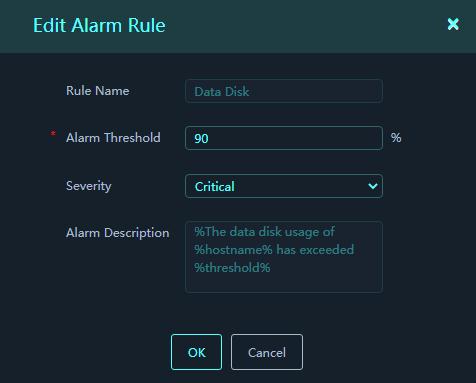
4. Edit the rule parameters.
Parameters:
¡ Rule Name: Name of the alarm rule. Supported names include CPU, memory, data disk, and system disk.
¡ Alarm Threshold: Set the upper threshold for CPU, memory, data disk, or system disk usage.
¡ Severity: Select the alarm severity. Values include Critical, Warning, and Notice.
¡ Alarm Description: Enter the format of alarm messages. The format is The XXX usage of %hostname% has exceeded %threshold%. The %hostname% variable represents the name of the host that triggers an alarm. The XXX variable represents the alarm rule type, which can be CPU, memory, data disk, or system disk. The %threshold% variable represents the alarm threshold.
5. Click OK.
On the Device Notification Rules tab, you can configure notification settings for device offline events and events that no logs are reported from devices. The settings include whether to enable pop up prompt, the prompt interval, and the interval at which the platform detects whether it has received logs from a device.
Authentication server settings
Use this feature to configure RADIUS server settings for user identity authentication. The platform delivers user identity information to the specified RADIUS server and determines whether a user has passed authentication depends on the result (accept or reject) returned by the server.
Figure 54 Authentication Server Settings
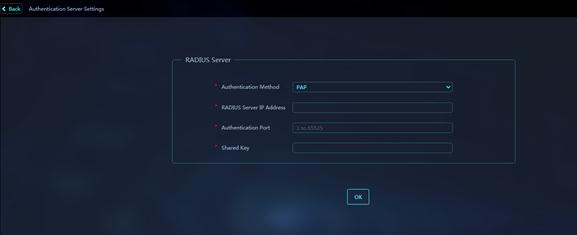
Parameters:
· Authentication Method: Select a user authentication method. Options are CHAP and PAP.
· RADIUS Server IP Address: Specify the IP address of a RADIUS server.
· Authentication Port: Enter the authentication port of the server.
· Shared Key: Set the shared key used by the platform to exchange information with the server.
Data reset settings
Use this feature to automatically clear original logs from the platform. The platform periodically detects the log storage size. When the size of original logs exceeds the log storage threshold or the log retention period exceeds a time threshold, the system triggers an original log deletion notification. At the same time, the system automatically begins to clear the earliest original logs until no thresholds are crossed.
Parameters:
· Log Storage Threshold: Set the log storage threshold. When the size of original logs to the total storage capacity exceeds this threshold, the system automatically begins to clear the earliest original logs until the threshold is not crossed.
· Time Thresholds: Set the maximum retention period for each type of logs. When the retention period for a log type exceeds the time threshold, the system automatically begins to clear the earliest original logs of that type until the threshold is not crossed. To change the time threshold for a type of logs, click Edit in the Actions column for that type of logs.
Log backup and restoration
Use this feature to back up or restore a large amount of log data on the platform. This feature helps you flexibly manage log data.
· Log Backup—Automatically backs up logs in the system. You must specify the correct FTP server connection parameters and start the log backup task. From the start time, the system starts to package the log data of last day and saves the log data to the specified FTP server. The platform can save a maximum of 50 GB of log data to the FTP server at a time. If the log data size exceeds 50 GB, backup will fail.
· Log Restoration—Restores log data within the specified time span from an FTP server.
To back up logs:
1. On the top navigation bar, click System Settings.
2. From the left navigation pane, select System Management > Global Settings. Then, click Log Backup and Restoration.
3. On the Log Backup tab, configure log backup parameters.
Figure 55 Log Backup
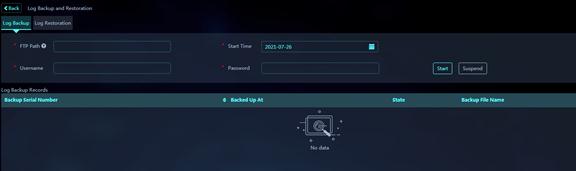
Parameters:
¡ FTP Path: Specify the directory where the FTP server stores backup log files.
¡ Username: Username used to access the FTP server.
¡ Password: Password used to access the FTP server.
¡ Start Time: Set the start time of the log backup task.
4. Click Start to start the log backup task.
Successful log backup operations will be displayed in the log backup record list.
To suspend the log backup task, click Suspend.
To restore logs:
1. On the top navigation bar, click System Settings.
2. From the left navigation pane, select System Management > Global Settings. Then, click Log Backup and Restoration.
3. Click the Log Restoration tab.
Figure 56 Log Restoration
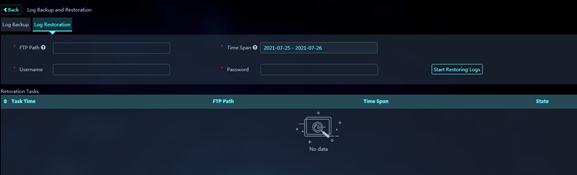
4. Configure log restoration parameters.
Parameters:
¡ FTP Path: Specify the directory where the FTP server stores backup log files.
¡ Username: Configure the username used to access the FTP server.
¡ Password: Configure the password used to access the FTP server.
¡ Time Span: Specify the time span. The logs backed up during this time span will be restored to the system. The maximum time span is 7 days (including the start time and end time).
5. Click Start Restoring Logs.
The system starts to restore logs according to the configured parameters. Successful log restoration operations will be displayed in the log restoration task list.
Log forwarding policies
Use this feature to forward the logs collected by this platform to other log analysis platforms or log receivers.
To add a log forwarding policy:
1. On the top navigation bar, click System Settings.
2. From the left navigation pane, select System Management > Global Settings. Then, click Log Forwarding Policies.
3. Click Add.
Figure 57 Add Log Forwarding Policy
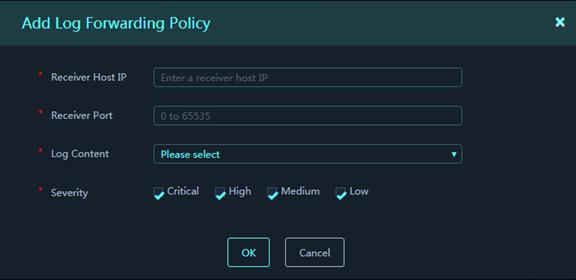
4. In the dialog box that opens, configure log forwarding policy parameters.
Parameters:
¡ Receiver Host IP: Specify the IPv4 or IPv6 address of the host that receives the logs forwarded from the platform.
¡ Receiver Port: Specify the destination port to receive the logs forwarded from the platform.
¡ Log Content: Select log fields to be forwarded.
¡ Severity: Select log severity levels.
5. Click OK.
Alarm event forwarding policies
Use this feature to forward the alarm events collected by this platform to other log analysis platforms or log receivers.
To add an alarm event forwarding policy:
1. On the top navigation bar, select System Settings.
2. From the left navigation pane, select System Management > Global Settings. Then, click Alarm Event Forwarding Policies.
3. Click Add.
Figure 58 Add Alarm Event Forwarding Policy
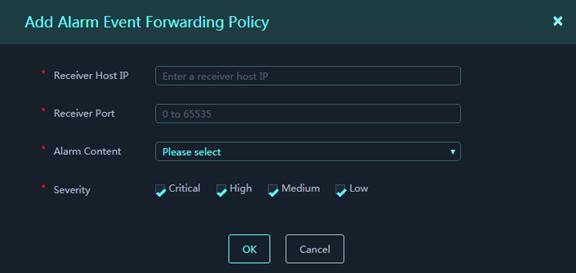
4. In the dialog box that opens, configure alarm event forwarding policy parameters.
Parameters:
¡ Receiver Host IP: Specify the IPv4 address of the host that receives the alarm events forwarded from the platform.
¡ Receiver Port: Specify the destination port to receive the alarm events forwarded from the platform.
¡ Alarm Content: Select alarm event fields to be forwarded.
¡ Severity: Select alarm event severity levels.
5. Click OK.
Blocklist and allowlist
Use this feature to add blocklist or allowlist entries based on the information extracted from vulnerability logs. Packets that match a blocklist entry are blocked and packets that match an allowlist entry are permitted.
To add a blocklist or allowlist entry:
1. On the top navigation bar, select System Settings.
2. From the left navigation pane, select System Management > Global Settings. Then, click Blocklist & Allowlist.
3. Click Add.
Figure 59 Add Allowlist/Blocklist Entry
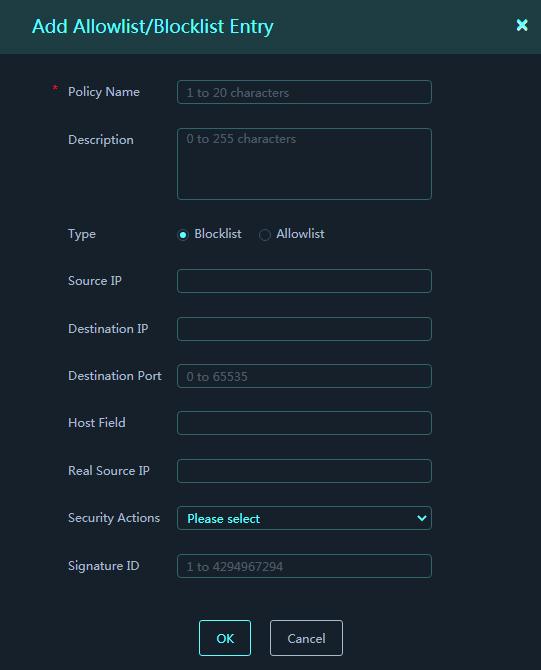
4. In the dialog box that opens, configure blocklist or allowlist parameters.
Parameters:
¡ Policy Name: Enter a name for the blocklist or allowlist entry.
¡ Description: Enter a description for the entry.
¡ Type: Select a type for the entry. Options are Blocklist and Allowlist.
¡ Source IP: Packet source IP address extracted from logs.
¡ Destination IP: Packet destination IP address extracted from logs.
¡ Destination Port: Packet destination port extracted from logs.
¡ Host Field: Packet Host field information extracted from logs.
¡ Real Source IP: Packet real source IP extracted from logs.
¡ Security Action: Security actions taken on packets. The information is extracted from logs.
¡ Signature ID: Matching signature ID of packets. The information is extracted from logs.
5. Click OK.
If a packet matches a blocklist or allowlist entry, the log for the packet will be the blocklist or allowlist type. To view the log, enter the Log Audit page.
System monitoring
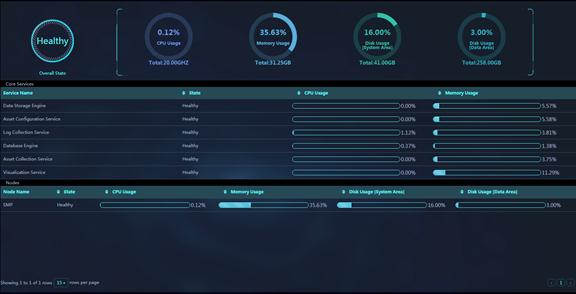
You can monitor the overall running state and resource consumption situation of the platform in real time on the System Monitoring page. This page includes CPU usage, memory usage, system disk usage, and data disk usage information as well as the running state information of each core service and node.
Figure 60 System Monitoring
Parameters:
· Overall running state of the platform:
¡ Overall State: The overall state of the platform is determined by node running status and core service status. The overall state can be healthy or faulty. The overall state is faulty if any node except cyber2 is offline or any core service is in faulty state.
¡ CPU Usage: Percentage of the currently used amount of CPU to the total amount of CPU in the cluster.
¡ Memory Usage: Percentage of the currently used amount of memory to the total amount of memory in the cluster.
¡ Disk Usage [System Area]: Percentage of the currently used amount of system disk space to the total amount of system disk space in the cluster.
¡ Disk Usage [Data Area]: Percentage of the currently used amount of data disk space to the total amount of data disk space in the cluster.
· Core Services:
¡ Service Name: Name of a core service.
¡ State: Running state of the service, which can be healthy or faulty.
- An online service is in faulty state if any of its processes exits unexpectedly.
- An offline service is in faulty state if it fails to start up within the scheduling period.
¡ CPU Usage: Percentage of the amount of CPU used by all processes of the core service to the total amount of CPU.
¡ Memory Usage: Percentage of the amount of memory used by all processes of the core service to the total amount of memory.
· Nodes:
¡ Node Name: Name of a node. A server deployed with SMP is a node.
¡ State: Running state of the node, which can be healthy or faulty. If a node goes offline, its state changes to faulty.
¡ CPU Usage: CPU usage of the node.
¡ Memory Usage: Memory usage of the node.
¡ Disk Usage [System Area]: System disk usage of the node.
¡ Disk Usage [Data Area]: Data disk usage of the node.
Roles and privileges
SMP provides the following predefined user roles: system administrator, business administrator, super administrator, and audit administrator. These roles cannot be edited or deleted.
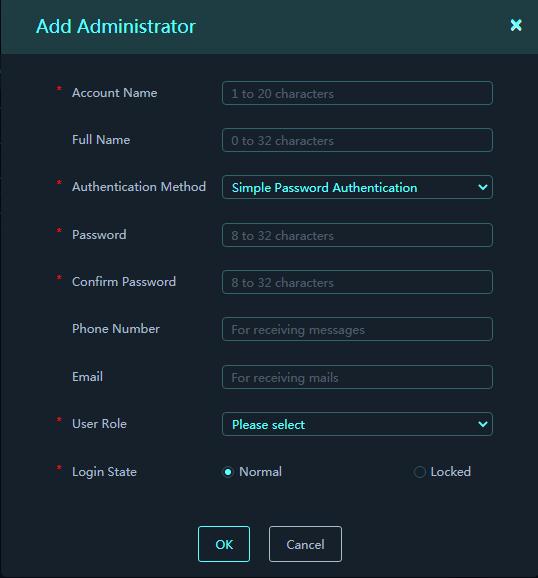
SMP provides predefined administrator users. Their usernames, user roles, and user role privileges are as shown in Table 1. These predefined administrator users cannot be deleted. However, you can edit the full name, phone number, email, password, and login authentication method of a predefined administrator user.
Administrator users with different roles have different privileges. You can control the privileges of administrator users by assigning them roles.
Table 1 User roles and privileges for predefined administrator users
|
Username |
User role |
User privileges |
|
sysAdmin |
System administrator |
Manage system settings, areas, and assets. |
|
buzAdmin |
Business administrator |
Manage all security services. |
|
admin |
Super administrator |
Have all privileges. |
|
auditAdmin |
Audit administrator |
View logging records. |
You can add new roles and assign privileges to the roles according to the service requirements. You can also add new administrator users and assign roles to the users. To manage administrator users and roles, enter the System Settings > System Management > Roles & Privileges page.
Administrators
To manage administrator users:
1. On the top navigation bar, click System Settings.
2. From the left navigation pane, select System Management > Roles & Privileges.
3. On the User Management tab, view, add, edit, or delete administrator user information.
4. To add an administrator user, click Add and configure parameters in the dialog box that opens.
Figure 61 Add Administrator
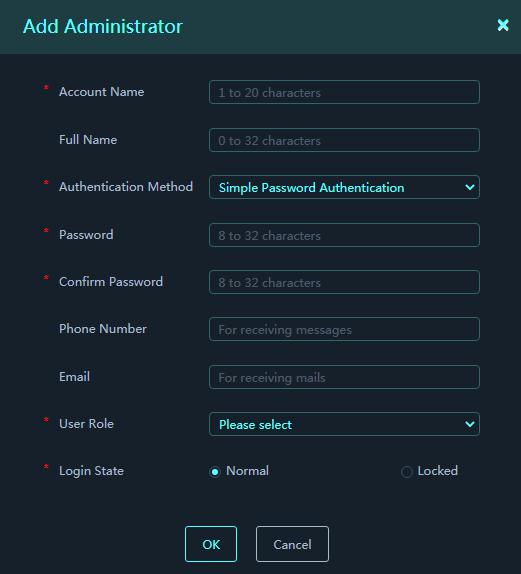
Parameters:
¡ Account: Enter the login username.
¡ User Full Name: Enter the user full name, which can be the same as the account.
¡ Login Authentication: Select an identity authentication method. Options are RADIUS authentication and simple password authentication.
¡ Password: Enter the login password.
¡ Confirm Password: Confirm the login password.
¡ Phone: Enter the 11-digit phone number of the user.
¡ Email: Enter the email address of the user. You can specify the user as a receiver in an alarm notification policy to receive alarm notification emails.
¡ User Role: Select a user role. Options include super administrator, business administrator, system administrator, audit administrator, and user-defined roles.
¡ Login State: Login state of the user. By default, the state is normal. If the state is locked, you cannot use the user account to log in to the platform.
5. Click OK.
Roles
1. On the top navigation bar, click System Settings.
2. From the left navigation pane, select System Management > Roles & Privileges.
3. On the Roles tab, view, add, edit, or delete user role information.
4. To add a role, click Add and configure parameters in the dialog box that opens.
Figure 62 Add Role
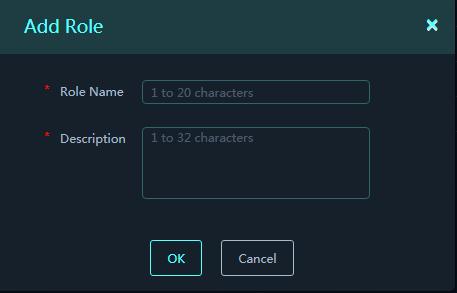
Parameters:
¡ Role Name: Enter a name for the role.
¡ Role Description: Enter a description for the role.
5. Click OK.
To configure privileges for a user-defined role, select that role in the role list and click Privileges. In the dialog box that opens, select menus accessible to the role and click OK.
Logging
Use this feature to display operation logs and system logs about users that log in to the platform.
· Operation Log—Used to display operation information about the operators that log in to the platform, including their usernames, login IP addresses, and operation contents. You can audit login user behaviors based on the information.
· System Log—Used to display system information for users. You can obtain information about the log reporting and online state of devices managed by the platform.
Customization
Perform this task to customize the label name and logo image.
Figure 63 Customization
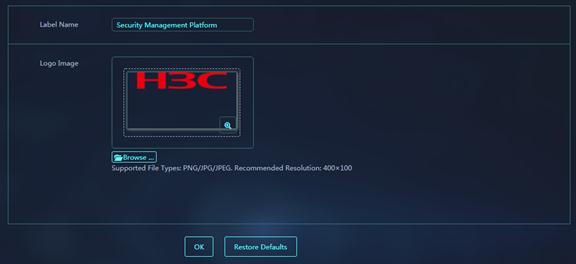
System info
Perform this task to display system information, including the product name, product model, and software version.
Licenses
Perform this task to manage system licenses. You can view licenses that have been installed, obtain license keys, or import license files.
Obtain a license key
Perform this task to obtain a host DID file. The file is generated based on encrypted device hardware information and user information on SMP. You can apply for a license file from the official website with a host DID file, license key, and SN serial number.
To obtain a license key:
1. On the top navigation bar, click System Settings.
2. From the left navigation pane, select System Management > Licenses.
3. Click Obtain License Key.
Figure 64 Obtain Activation Key
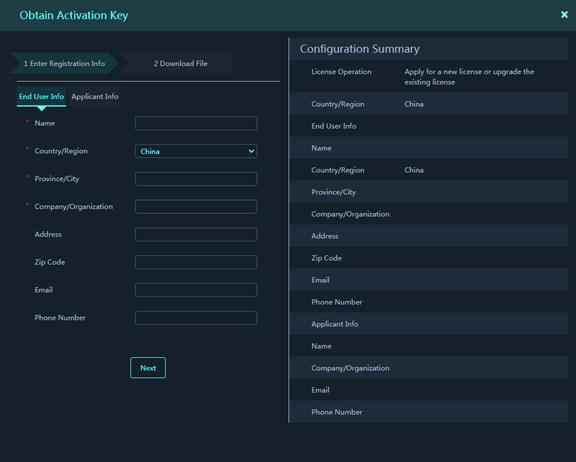
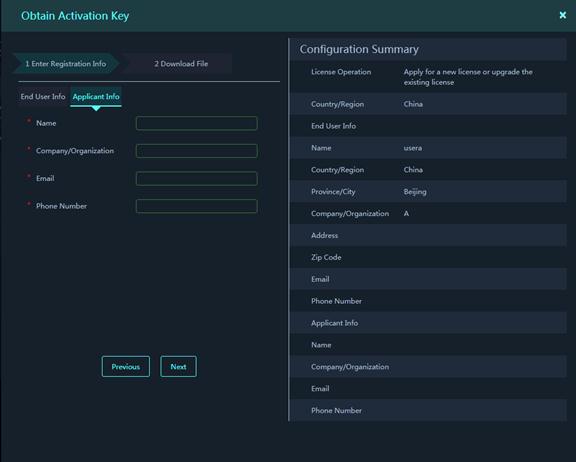
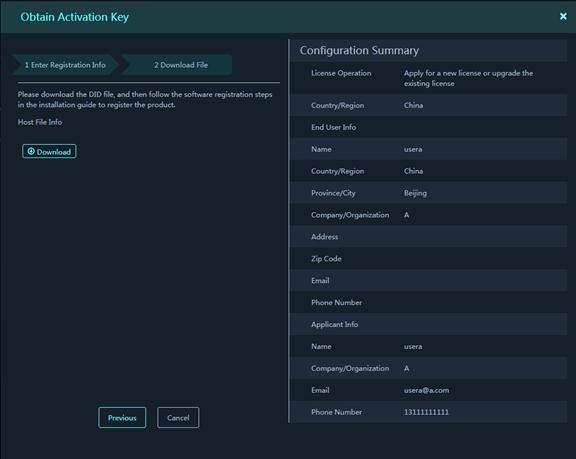
4. In the dialog box that opens, configure parameters to obtain the host DID file.
¡ Enter user information, including the username, country or region, province or city, company or organization name, address, zip code, email address, and phone number.
¡ Enter applicant information, including the applicant name, company or organization name, email address, and phone number.
¡ Click Next.
¡ Click Download to download the host DID file.
Import a license file
Perform this task to import a license file obtained from the official website.
To import a license file:
1. On the top navigation bar, click System Settings.
2. From the left navigation pane, select System Management > Licenses.
3. Click Import License File.
Figure 65 Import License File
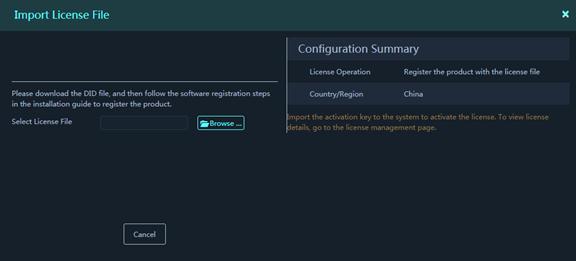
4. In the dialog box that opens, select an activated license file obtained from the official website and import the file to the platform.
After you import the file, the system will parse and install the license file.
Hierarchy
Use this feature to monitor the subplatforms and collectors managed by the platform. If the network is divided into multiple areas, you can deploy an SMP platform in each area. To centrally monitor all platforms, you can use one of the platforms as the parent platform and register the other platforms as subplatforms with the parent platform. The subplatforms report their resource usage information (including the CPU, memory, and disk usage information) to the parent platform every 1 minute.
You can register multiple subplatforms with a parent platform. No subplatform can be attached to a subplatform. Only the parent platform displays subplatform information on the Hierarchy page.
Figure 66 Hierachy

For information about registering subplatforms with a parent platform, see the SMP installation guide. On the Web interface, you cannot add or delete a parent platform for a platform or add or delete subplatforms for the platform.
Parameters:
· Node Name: Name of a subplatform.
· Type: Security management subplatform.
· IP: IP address of the subplatform.
· Description: Description of the subplatform or collector.
· Registration State: Whether the subplatform has been registered with the platform.
· Online State: State of the subplatform, which can be online or offline.
· Last Reported: Last time when the subplatform reported resource usage information.
·
Access the Subplatform: Click the ![]() icon to open the login page of the
subplatform.
icon to open the login page of the
subplatform.
·
State Monitor: Click the ![]() icon to view resource usage of the
subplatform.
icon to view resource usage of the
subplatform.
Figure 67 Subpaltform State Monitoring
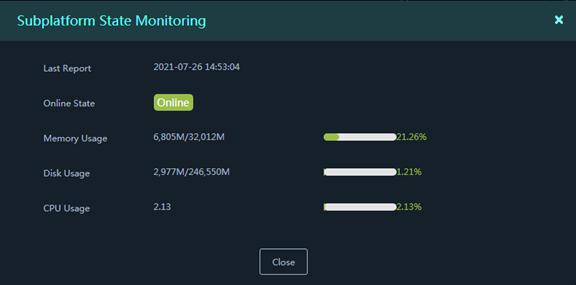
Parameters:
¡ Last Reported: Last time when the subplatform reported information.
¡ Online State: Display whether the subplatform is online.
¡ Memory Usage: Display memory usage of the subplatform.
¡ Disk Usage: Display disk usage of the subplatform.
¡ CPU Usage: Display CPU usage of the subplatform.