| Title | Size | Downloads |
|---|---|---|
| H3C S12500 Switch Series Troubleshooting Guide-R7328-6W100-book.pdf | 653.06 KB |
- Table of Contents
H3C S12500 Switch Series (R7328) Troubleshooting Guide
|
Copyright © 2014 Hangzhou H3C Technologies Co., Ltd. All rights reserved. No part of this manual may be reproduced or transmitted in any form or by any means without prior written consent of Hangzhou H3C Technologies Co., Ltd. The information in this document is subject to change without notice. |
|
Contents
General troubleshooting procedures
Problem locations and possible results
Common service recovering and troubleshooting methods
Dealing with console login password loss
Telnetting to the device to change the console login password
Using BootWare menus to change the console login password
Dealing with Telnet password loss
Troubleshooting configuration loss
Startup configuration file failure
No display on the configuration terminal
Garbled display on the configuration terminal
Troubleshooting links and ports
A port frequently goes up and down
Troubleshooting hardware forwarding
Online hardware diagnostic and failure protection
Troubleshooting packet forwarding failure
IRF fabric establishment failure
Troubleshooting system management
General troubleshooting procedures
Obtaining information
H3C recommends that you enable the information center by using the info-center enable command for fast troubleshooting. By default, the information center is enabled.
Obtaining log information
Log information includes logs in log files that record operation information and diagnostic information in diag files that record state information. The system stores these files in the CF card or Flash.
You can export the log and diag files through FTP, TFTP, or USB. To identify the files exported from different MPUs, save them in a specific order, for example, in different folders named chassisXslotY.
Table 1 Log information classification
|
Category |
File name |
Content |
|
log file |
logfileX.log |
Command executions and operational logs. |
|
diaglog file |
diagfileX.log |
Diagnostic log information about device operation, such as the following items: · Parameter settings used when an error occurs. · Information about a card startup error. · Handshaking information between the MPU and interface card when a communication error occurs. |
|
diag file |
XXX.gz |
Current device operation statistics, including: · Device status. · CPU status. · Memory status. · Configuration status. · Software entries. · Hardware entries. |
Restrictions and guidelines
Follow these restrictions and guidelines to obtain log information:
· Record the displayed information during operations for future analysis.
· Understand the impact of each operation and make sure the configuration can be restored upon operation failures.
· Make sure the current configuration is consistent with the saved configuration. Do not save the configuration during IRF split, card faults, and card reboot.
· After you perform an operation, wait for a while before you verify the results.
· Before you replace an MPU with a new MPU, make sure the new MPU has the same software version as the old MPU.
Obtaining log files
To obtain log files:
1. Save logs from the log buffer to log files.
By default, the log files are saved in the logfile folder of the CF card on each MPU. If MDCs are configured, log files are also saved for MDCs.
The contents in the log file buffer have been saved to the file cfa0:/logfile/logfile4.log
2. Display log files on the active MPU.
<Sysname> dir cfa0:/logfile/
Directory of cfa0:/logfile
0 -rw- 233116 Apr 27 2013 09:20:44 logfile1.log.gz
1 -rw- 142919 May 03 2013 14:15:42 logfile2.log.gz
2 -rw- 193287 May 09 2013 12:28:08 logfile3.log.gz
3 -rw- 1193287 Jun 09 2013 12:28:08 logfile4.log
1021808 KB total (259072 KB free)
3. Display log files on the standby MPU.
<Sysname> dir slot1#cfa0:/logfile/
Directory of slot1#cfa0:/logfile
0 -rw- 242287 May 13 2013 16:47:46 logfile4.log.gz
1 -rw- 143837 May 24 2013 22:56:46 logfile5.log.gz
2 -rw- 149806 Jun 01 2013 13:43:26 logfile6.log.gz
1020068 KB total (643264 KB free)
4. Display log files on each MPU of every IRF subordinate device. The following example shows the log files on the MPU in slot 0 of chassis 2.
<Sysname> dir chassis2#slot0#cfa0:/logfile/
Directory of chassis2#slot0#cfa0:/logfile
0 -rw- 215316 Jun 03 2013 05:49:20 logfile7.log.gz
1 -rw- 235163 Jun 21 2013 07:31:54 logfile8.log.gz
2 -rw- 3256492 Jun 26 2013 09:01:08 logfile9.log
1021808 KB total (773424 KB free)
5. Display log files on each MDC. The following shows the log file on MDC 3.
<Sysname>dir cfa0:/mdc/
Directory of cfa0:/mdc
0 drw- - Jul 10 2013 14:56:50 mdc2
1 drw- - Jul 10 2013 16:48:04 mdc3
2 drw- - Jul 10 2013 16:43:20 mdc4
<Sysname>dir cfa0:/mdc/mdc3/logfile/
Directory of cfa0:/mdc/mdc3/logfile
0 -rw- 8417 Jul 10 2013 18:17:46 logfile1.log
1020068 KB total (701636 KB free)
Obtaining diaglog files
To obtain diaglog files:
1. Save the diagnostic logs in the diagnostic log file buffer to diagnostic log files.
By default, the log files are saved in the diagfile folder of the CF card on each MPU. If MDCs are configured, log files are also saved for MDCs.
<Sysname> diagnostic-logfile save
The contents in the diagnostic log file buffer have been saved to the file cfa0:/diagfile/diagfile4.log
2. Display diaglog files on the active MPU.
<Sysname> dir cfa0:/diagfile/
Directory of cfa0:/diagfile
0 -rw- 332331 Aug 27 2013 23:08:18 diagfile1.log.gz
1 -rw- 237264 Aug 28 2013 09:30:18 diagfile2.log.gz
2 -rw- 235521 Aug 28 2013 19:48:18 diagfile3.log.gz
3 -rw- 1026731 Oct 08 2013 15:07:59 diagfile4.log
1021808 KB total (790640 KB free)
3. Display diaglog files on the standby MPU.
<Sysname> dir slot1#cfa0:/diagfile/
Directory of slot1#cfa0:/diagfile
0 -rw- 311953 May 10 2013 20:44:20 diagfile1.log.gz
1 -rw- 303482 May 10 2013 22:29:14 diagfile2.log.gz
2 -rw- 5240223 May 11 2013 00:14:20 diagfile3.log
1021808 KB total (773424 KB free)
4. Display diaglog files on each MPU of every IRF subordinate device. The following shows the log files on the MPU in slot 0 of chassis 2.
<Sysname> dir chassis2#slot0#cfa0:/diagfile/
Directory of chassis2#slot0#cfa0:/diagfile
0 -rw- 348518 May 11 2013 03:40:18 diagfile8.log.gz
1 -rw- 352960 May 11 2013 05:23:22 diagfile9.log.gz
2 -rw- 558495 May 15 2013 17:11:48 diagfile10.log
1021808 KB total (773424 KB free)
5. Display diaglog files on each MDC. The following shows the log files on MDC 3.
<Sysname> dir cfa0:/mdc/
Directory of cfa0:/mdc
0 drw- - Jul 10 2013 14:56:50 mdc2
1 drw- - Jul 10 2013 16:48:04 mdc3
2 drw- - Jul 10 2013 16:43:20 mdc4
<Sysname> dir cfa0:/mdc/mdc3/diagfile/
Directory of cfa0:/mdc/mdc3/diagfile
0 -rw- 9417 Jul 10 2013 18:17:46 diagfile1.log
1020068 KB total (700636 KB free)
Obtaining diag files
To obtain diag files, use either of the following methods:
· Execute the display diagnostic-information command. Enter y and specify the path and file name cfa0:/diag.tar.gz as prompted to save the information to the file.
The more cards the device has, the more time the saving operation takes. During the saving operation, do not execute any command.
<Sysname> display diagnostic-information
Save or display diagnostic information (Y=save, N=display)? [Y/N]:y
Please input the file name(*.tar.gz)[flash:/diag.tar.gz]:cfa0:/diag.tar.gz
Diagnostic information is outputting to cfa0:/diag.tar.gz.
Please wait...
Save successfully.
<H3C> dir cfa0:/
Directory of cfa0:
……
6 -rw- 898180 Jun 26 2013 09:23:51 diag.tar.gz
1021808 KB total (259072 KB free)
· Display the information on the screen.
H3C recommends not using this method. When the information is long, it is easy to miss some of the information.
# Configure the screen-length disable command to avoid information output interruption.
<Sysname> screen-length disable
# Execute the display diagnostic-information command. Enter n at the prompt.
<Sysname> display diagnostic-information
Save or display diagnostic information (Y=save, N=display)? [Y/N]:n
===========================================================
===============display alarm===============
No alarm information.
=========================================================
===============display boot-loader===============
Software images on slot 0:
Current software images:
cfa0:/S12500-CMW710-BOOT-R7328_mrpnc.bin
cfa0:/S12500-CMW710-SYSTEM-R7328_mrpnc.bin
Main startup software images:
cfa0:/S12500-CMW710-BOOT-R7328_mrpnc.bin
cfa0:/S12500-CMW710-SYSTEM-R7328_mrpnc.bin
Backup startup software images:
None
=========================================================
===============display counters inbound interface===============
Interface Total (pkts) Broadcast (pkts) Multicast (pkts) Err (pkts)
BAGG1 0 0 0 0
GE4/0/1 0 0 0 0
GE4/0/2 2 2 0 0
GE4/0/3 0 0 0 0
GE4/0/4 0 0 0 0
GE4/0/5 0 0 0 0
GE4/0/6 0 0 0 0
GE4/0/7 0 0 0 0
GE4/0/8 0 0 0 0
GE4/0/9 0 0 0 0
GE4/0/10 0 0 0 0
......
Obtaining other information
You also need to obtain other operational information. The following lists some relevant information:
· Problem symptom, time, topology, configuration information, measures, and results.
· Operation logs, captured packet information, debug information, and information output from the console port during continual MPU and switching fabric card reboots.
· Alarms of cards, power supply, and fans.
Troubleshooting procedure
When the switch has a problem, do the following:
1. Obtain operation information.
2. Use the troubleshooting flowchart provided in "Troubleshooting flowchart" to determine the problem type.
3. Use the solution for the problem type to troubleshoot the switch.
If you cannot determine the problem, contact H3C Support.
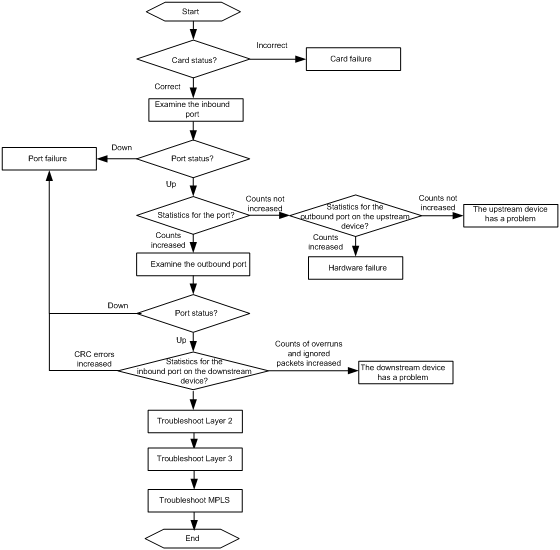
Troubleshooting flowchart
Use the troubleshooting flowchart shown in Figure 1 to determine the problem type.
Figure 1 Troubleshooting flowchart
The following are commonly used troubleshooting methods:
· Collecting packet statistics on ports.
· Mirroring packets.
· Capturing packets.
· Configuring QoS policies to collect statistics.
· Enabling debugging functions.
· Replacing the suspicious hardware or install the suspicious hardware to another slot.
For example, if a transceiver might have a problem, do one of the following:
¡ Replace the transceiver with a transceiver that can operate correctly.
¡ Install the transceiver in another slot.
If the card in a slot might have a problem, do one of the following:
¡ Replace the card with a card that can operate correctly.
¡ Install the card into another slot.
Problem types
In IRF mode, some commands require the global slot numbers of cards. The global slot number of a card is calculated by using the following equation:
Global slot number = (chassis number – 1) * maximum number of slots + local slot number
For an S12500, the maximum number of slots is 29. For example, for an IRF fabric formed by two S12518 switches, the global slot number for the card in slot 5 of chassis 2 is calculated as follows:
(2 – 1) * 29 + 5 = 34
Card failure
A card failure might result in the following symptoms:
· A card cannot start up.
· A card reboots unexpectedly.
· A card reboots again and again.
· A card is not in the correct state.
· To troubleshoot a card failure, see "Troubleshooting hardware ."
Power failure
A power failure might result in the following symptoms:
· Power LEDs are not in the correct states.
· Power alarm messages are displayed continuously.
To troubleshoot a power failure, see "PMU or power module failure."
Fan failure
A fan failure might result in the following symptoms:
· Fans do not operate.
· Fan LEDs are not in the correct states
· Fan alarm messages are displayed continuously.
To troubleshoot a fan failure, see "Fan tray failure."
Temperature problem
If temperature alarm messages are displayed, the device might have a temperature problem. To troubleshoot a temperature problem, see "Temperature alarm."
Port failure
A port failure might result in the following symptoms:
· A port cannot come up.
· A port goes down and comes up frequently.
· The counts of packet errors on the port are not zero.
To troubleshoot a port failure, see "Troubleshooting links and ports."
Hardware forwarding failure
If the log messages such as "Forwarding fault" or "Board fault: chassis X slot Y, please check it" are displayed, the device might have a hardware forwarding failure.
To troubleshoot a hardware forwarding failure, see "Troubleshooting hardware forwarding."
Packet forwarding failure
A packet forwarding failure might result in the following symptoms:
· Some ping packets are lost, or the ping operation fails.
· Some tracert packets are lost, or the tracert operation fails.
· Layer 2 frames are lost, or the Layer 2 link is down.
· Layer 3 frames are lost, or the Layer 3 connection is down.
· The MPLS service is not running correctly.
To troubleshoot a packet forwarding failure, see "Troubleshooting links and ports."
IRF failure
An IRF failure might result in the following symptoms:
· The IRF fabric cannot be formed.
· An IRF split occurs.
To troubleshoot an IRF failure, see "Troubleshooting IRF."
Overuse of CPU
If the switch uses too much CPU, see "High CPU usage."
Overuse of memory
If the switch uses too much memory, see "High memory usage."
Insufficient resources
If the "No enough resource" message is displayed, see "Insufficient resources."
Problem locations and possible results
Figure 2 shows a typical network model and the possible problem locations. For higher availability and quick switchover and restoration in response to failures, the network uses two upstream links and two core switches. Table 2 shows the possible symptoms and results of different problem locations.
Figure 2 Typical network model and the possible problem locations

Table 2 Problem locations and possible symptoms and results
|
Problem location |
Possible symptoms |
Possible results |
|
1 (including transceivers) |
A port is down. |
A service switchover occurs. |
|
Counts of packet errors are increased. |
All services on the link are affected. |
|
|
2 |
A card fails. |
A service switchover occurs. |
|
A chip on a card fails while the card is operating correctly. |
Services on the chip are affected. If a switching fabric module failure occurs, the whole device is affected. |
|
|
A software error occurs. |
The device reboots and a service switchover occurs. If a protocol module has a problem, the service is usually affected. |
|
|
3 |
Same as problem location 1. |
Services on the access switch are affected. The scope of affected services is smaller than a problem at problem location 1. |
|
4 |
The device is down. |
Services on the device are affected. |
|
A chip on a card fails. |
Some ports or all services on the device are affected. |
|
|
A software error occurs. |
The device reboots and all services on the device are affected. If a protocol module has a problem, the service is usually affected. |
|
|
5 |
Same as problem location 1. |
Server services on the link are affected. |
|
6 |
The network is operating correctly but a service is not. |
The service on the server is affected. |
Common service recovering and troubleshooting methods
Table 3 Common service recovering and troubleshooting methods
|
Failure category |
Service recovering methods |
Troubleshooting methods |
|
Hardware |
· Isolate the failed card. · Isolate the failed device by adjusting service traffic forwarding paths. For example, adjust the preferences for routes so traffic is switched to other paths. |
Complete required tests on the backup hardware, and replace the failed hardware. |
|
Software |
· Reboot the protocols on the failed device. · Isolate the failed device by adjusting service traffic forwarding paths. |
· Upgrade the software or install patches. · Adjust the network topology, or modify the configuration to remove the failures. |
|
Link |
Isolate the failed link by adjusting service traffic forwarding paths. |
Remove link errors. |
|
Others |
· Correct configuration errors. · Connect the ports of the devices correctly. · Isolate the failed link by adjusting service traffic forwarding paths. |
· Correct configuration errors. · Connect the ports of the devices correctly. · Repair the power and air conditioner systems for the devices. |
Technical support
Email: [email protected]
Hotline: 400-810-0504
|
|
TIP: Before contacting H3C Support, record the symptom and collect the device operation information. |
Dealing with password loss
Dealing with console login password loss
Use either of the following methods:
· (Preferred.) Telnetting to the device to change the console login password
· Using BootWare menus to change the console login password
Telnetting to the device to change the console login password
Make sure the following requirements are met:
· You can log in to the device by using Telnet.
· After login, you are assigned the user role network-admin or level-15.
To Telnet to the device to change the console login password:
1. Telnet to the device. (Details not shown.)
2. Determine the user line you are using.
<Sysname> display users
Idx Line Idle Time Pid Type
1 CON 1/1 00:00:36 Oct 08 16:35:09 543
+ 16 VTY 0 00:00:00 Oct 08 17:02:03 566 TEL
Following are more details.
VTY 0 :
Location: 192.168.29.1
+ : Current operation user.
F : Current operation user works in async mode.
The output shows that two users are online. You are using VTY line 0. Your IP address is 192.168.29.1. The other user is using Console line 1/1.
3. Display the user roles assigned to the user line you are using.
[Sysname] line vty 0
[Sysname-line-vty0] display this
#
line aux 1/1
user-role network-operator
#
line con 1/1
user-role network-admin
#
line vty 0
authentication-mode none
user-role level-15
user-role network-admin
user-role network-operator
#
return
The output shows that VTY 0 has the user role level-15. You have the right to change the console login password.
4. Configure password authentication for console login and configure the password. You can also configure a different login authentication mode.
<Sysname> system-view
[Sysname] line console 0
[Sysname-line-console0] authentication-mode password
[Sysname-line-console0] set authentication password simple 12345678
[Sysname-line-console0] return
5. Save the running configuration to use the configuration at the next reboot.
<Sysname> save
The current configuration will be written to the device. Are you sure? [Y/N]:y
Please input the file name(*.cfg)[flash:/default.cfg]
(To leave the existing filename unchanged, press the enter key):default.cfg
Validating file. Please wait....
Saved the current configuration to mainboard device successfully.
Using BootWare menus to change the console login password
|
|
CAUTION: · Use this method only when you do not have an option. A reboot is required to access BootWare menus. · Do not power off the device when you use this method. |
The procedure for using BootWare menus to change the console login password depends on whether password recovery capability is enabled:
· If password recovery capability is enabled, you can use the Skip Authentication for Console Login option to skip console login authentication and configure a new password.
· If password recovery capability is disabled, you can use the Restore to Factory Default Configuration option to restore the factory-default configuration and configure a new password.
To determine whether password recovery capability is enabled, use either of the following methods:
· Telnet to the device and display the running configuration. If the password-recovery enable command is configured, password recovery capability is enabled.
<Sysname> display current-configuration
#
version 7.1.045, Release 7328
#
mdc Admin id 1
#
sysname Sysname
#
command-alias enable
command-alias mapping undo no
command-alias mapping quit exit
command-alias mapping return end
#
system-working-mode bridgee
password-recovery enable
#
· View the bootstrap information displayed when you use the BootWare menu. If the message "Password recovery capability is enabled." is displayed, password recovery capability is enabled.
Changing the console login password when password recovery capability is enabled
To change the console login password when password recovery capability is enabled:
1. Connect a configuration terminal to the console port of the device.
2. Power on the device.
RAM test successful.
System is starting...
Press Ctrl+D to access BASIC-BOOTWARE MENU...
Booting Normal Extended BootWare
The Extended BootWare is self-decompressing...........................Done.
****************************************************************************
* *
* H3C S12500 BootWare, Version 2.18 *
* *
****************************************************************************
Compiled Date : Mar 27 2013
CPU Type : P5040
CPU L1 Cache : 32KB
CPU L2 Cache : 1024KB
CPU Clock Speed : 1800MHz
Memory Type : DDR3 SDRAM
Memory Size : 8192MB
Memory Speed : 1066MHz
BootWare Size : 8MB
Flash Size : 512MB
cfa0 Size : 4002MB
NVRAM Size : 1024KB
BASIC CPLD Version : 001C
EXTENDED CPLD Version : 001C
PCB Version : Ver.A
Board self testing...........................
Board steady testing... [ PASS ]
Board SlotNo... [ 0 ]
DX246 testing... [ PASS ]
PHY88E1111 testing... [ PASS ]
CPLD1 testing... [ PASS ]
CPLD2 testing... [ PASS ]
NS16550 register testing... [ PASS ]
The switch's Mac address... [00:0F:E2:0E:08:03]
CF Card testing... [ PASS ]
BootWare Validating...
Press Ctrl+B to access EXTENDED-BOOTWARE MENU...
3. Press Ctrl + B within three seconds after the " Press Ctrl+B to access EXTENDED-BOOTWARE MENU..." prompt message appears.
The extended BootWare menu is displayed:
Password recovery capability is enabled.
Note: The current operating device is cfa0
Enter < Storage Device Operation > to select device.
==========================<EXTENDED-BOOTWARE MENU>==========================
|<1> Boot System |
|<2> Enter Serial SubMenu |
|<3> Enter Ethernet SubMenu |
|<4> File Control |
|<5> Restore to Factory Default Configuration |
|<6> BootWare Operation Menu |
|<7> Skip Authentication for Console Login |
|<8> Storage Device Operation |
|<0> Reboot |
============================================================================
Ctrl+Z: Access EXTENDED ASSISTANT MENU
Ctrl+F: Format File System
Enter your choice(0-8):
4. Enter 7 to skip console login authentication.
Enter your choice(0-8): 7
Clear Image Password Success!
The extended BootWare menu is displayed again:
==========================<EXTENDED-BOOTWARE MENU>==========================
|<1> Boot System |
|<2> Enter Serial SubMenu |
|<3> Enter Ethernet SubMenu |
|<4> File Control |
|<5> Restore to Factory Default Configuration |
|<6> BootWare Operation Menu |
|<7> Skip Authentication for Console Login |
|<8> Storage Device Operation |
|<0> Reboot |
============================================================================
Ctrl+Z: Access EXTENDED ASSISTANT MENU
Ctrl+F: Format File System
Enter your choice(0-8): 0
5. Enter 0 to reboot the device. The device will reboot and load the next-startup configuration file with the console login password ignored.
Enter your choice(0-8): 0
DDR2 SDRAM test successful.
System is starting...
Booting Normal Extend BootWare
The Extend BootWare is self-decompressing.................................
Done.
6. After the switch starts up, configure a new console login password. You can also configure a different login authentication mode.
<Sysname> system-view
[Sysname] line console 0
[Sysname-line-console0] authentication-mode password
[Sysname-line-console0] set authentication password simple 12345678
[Sysname-line-console0] return
7. Save the running configuration to use the configuration at the next reboot.
<Sysname> save
The current configuration will be written to the device. Are you sure? [Y/N]:y
Please input the file name(*.cfg)[flash:/default.cfg]
(To leave the existing filename unchanged, press the enter key):default.cfg
Validating file. Please wait....
Saved the current configuration to mainboard device successfully.
Changing the console login password when password recovery capability is disabled
|
|
IMPORTANT: Restoring the factory-default configuration deletes the next-startup configuration files. |
To change the console login password when password recovery capability is disabled:
1. Connect a configuration terminal to the console port of the device.
2. Power on the device.
RAM test successful.
System is starting...
Press Ctrl+D to access BASIC-BOOTWARE MENU...
Booting Normal Extended BootWare
The Extended BootWare is self-decompressing...........................Done.
****************************************************************************
* *
* H3C S12500 BootWare, Version 2.18 *
* *
****************************************************************************
Compiled Date : Mar 27 2013
CPU Type : P5040
CPU L1 Cache : 32KB
CPU L2 Cache : 1024KB
CPU Clock Speed : 1800MHz
Memory Type : DDR3 SDRAM
Memory Size : 8192MB
Memory Speed : 1066MHz
BootWare Size : 8MB
Flash Size : 512MB
cfa0 Size : 4002MB
NVRAM Size : 1024KB
BASIC CPLD Version : 001C
EXTENDED CPLD Version : 001C
PCB Version : Ver.A
Board self testing...........................
Board steady testing... [ PASS ]
Board SlotNo... [ 0 ]
DX246 testing... [ PASS ]
PHY88E1111 testing... [ PASS ]
CPLD1 testing... [ PASS ]
CPLD2 testing... [ PASS ]
NS16550 register testing... [ PASS ]
The switch's Mac address... [00:0F:E2:0E:08:03]
CF Card testing... [ PASS ]
BootWare Validating...
Press Ctrl+B to access EXTENDED-BOOTWARE MENU...
3. Press Ctrl + B within three seconds after the " Press Ctrl+B to access EXTENDED-BOOTWARE MENU..." prompt message appears.
The extended BootWare menu is displayed:
Password recovery capability is disabled.
Note: The current operating device is cfa0
Enter < Storage Device Operation > to select device.
==========================<EXTENDED-BOOTWARE MENU>==========================
|<1> Boot System |
|<2> Enter Serial SubMenu |
|<3> Enter Ethernet SubMenu |
|<4> File Control |
|<5> Restore to Factory Default Configuration |
|<6> BootWare Operation Menu |
|<7> Skip Authentication for Console Login |
|<8> Storage Device Operation |
|<0> Reboot |
============================================================================
Ctrl+Z: Access EXTENDED ASSISTANT MENU
Ctrl+F: Format File System
Enter your choice(0-9):
4. Enter 5 and press Y to delete the next-startup configuration files.
Enter your choice(0-9): 5
Because the password recovery capability is disabled, this operation can
cause the configuration files to be deleted, and the system will start up
with factory defaults. Are you sure to continue?[Y/N]Y
Setting...Done.
The extended BootWare menu is displayed again:
==========================<EXTENDED-BOOTWARE MENU>==========================
|<1> Boot System |
|<2> Enter Serial SubMenu |
|<3> Enter Ethernet SubMenu |
|<4> File Control |
|<5> Restore to Factory Default Configuration |
|<6> BootWare Operation Menu |
|<7> Skip Authentication for Console Login |
|<8> Storage Device Operation |
|<0> Reboot |
============================================================================
Ctrl+Z: Access EXTENDED ASSISTANT MENU
Ctrl+F: Format File System
Enter your choice(0-8): 0
5. Enter 0 to reboot the device. The device will reboot with the factory defaults.
Enter your choice(0-8): 0
DDR2 SDRAM test successful.
System is starting...
Booting Normal Extend BootWare
The Extend BootWare is self-decompressing.................................
Done.
6. After the switch starts up, configure a new console login password. You can also configure a different login authentication mode.
<Sysname> system-view
[Sysname] line console 0
[Sysname-line-console0] authentication-mode password
[Sysname-line-console0] set authentication password simple 12345678
[Sysname-line-console0] return
7. Save the running configuration to use the configuration at the next reboot.
<Sysname> save
The current configuration will be written to the device. Are you sure? [Y/N]:y
Please input the file name(*.cfg)[flash:/default.cfg]
(To leave the existing filename unchanged, press the enter key):default.cfg
Validating file. Please wait....
Saved the current configuration to mainboard device successfully.
Dealing with Telnet password loss
To deal with Telnet password loss:
1. Log in to the device through the console port.
2. Configure password authentication for console login and configure the password. You can also configure a different login authentication mode.
<Sysname> system-view
[Sysname] line vty 0 63
[Sysname-line-vty0-63] authentication-mode password
[Sysname-line-vty0-63] set authentication password simple 12345678
[Sysname-line-vty0-63] return
3. Save the running configuration to enable the configuration to survive a reboot.
<Sysname> save
The current configuration will be written to the device. Are you sure? [Y/N]:y
Please input the file name(*.cfg)[flash:/default.cfg]
(To leave the existing filename unchanged, press the enter key):default.cfg
Validating file. Please wait....
Saved the current configuration to mainboard device successfully
Troubleshooting configuration loss
Startup configuration file failure
Symptom
The device starts up with factory defaults because both the main and backup startup configuration files are not available or do not exist.
Solution
|
|
CAUTION: Do not execute the save command before you complete the tasks in this section. The save operation overwrites the restored startup configuration file with the running configuration. |
To resolve the problem:
1. Transfer a backup copy of the startup configuration files to the root directory of a storage medium on each MPU:
|
|
IMPORTANT: Save the transferred configuration file to the storage medium from which the device loads startup configuration files. Make sure both MPUs use the same type of storage media. In this section, the CF card is used on each MPU. |
a. Download configuration file config.cfg from the FTP server to the root directory of the CF card on the active MPU.
<Sysname> ftp 192.168.29.1
Press CTRL+C to abort.
Connected to 192.168.29.1 (192.168.29.1).
220 WFTPD 2.0 service (by Texas Imperial Software) ready for new user
User (192.168.29.1:(none)): 1
331 Give me your password, please
Password:
230 Logged in successfully
Remote system type is MSDOS.
ftp> binary
200 Type is Image (Binary)
ftp> get config.cfg
227 Entering Passive Mode (192,168,29,1,209,24)
150 "F:\config.cfg" file ready to send (18494 bytes) in IMAGE / Binary mode
226 Transfer finished successfully.
18494 bytes received in 0.0383 seconds (471.1 kbyte/s)
ftp> quit
221 Windows FTP Server (WFTPD, by Texas Imperial Software) says goodbye
b. Copy the configuration file to the root directory of the CF card on the standby MPU.
<Sysname> copy config.cfg slot1#cfa0:/config.cfg
Copy cfa0:/config.cfg to slot1#cfa0:/config.cfg?[Y/N]:y
.
%Copy file cfa0:/config.cfg to slot1#cfa0:/config.cfg...Done.
2. Specify the configuration file as the main startup configuration file. Skip this step if the configuration file uses the same name as the corrupt main startup configuration file.
<Sysname> startup saved-configuration config.cfg
3. Reboot the device.
4. If the problem persists, contact H3C Support.
Related commands
This section lists the commands that you might use for troubleshooting configuration loss.
|
Command |
Description |
|
binary |
Sets the file transfer mode to binary. |
|
copy |
Copies a file and saves the file to the destination directory. |
|
ftp |
Logs in to an FTP server and enters FTP client view. |
|
get |
Downloads a file from the FTP server and saves the file. |
|
startup saved-configuration |
Specifies a file as a startup configuration file for each MPU. |
Troubleshooting hardware
This section provides troubleshooting information for common problems with the switch hardware.
|
|
NOTE: · For information about LEDs, see H3C S12500 Routing Switch Series Installation Guide. · If the switch outputs log messages, such as "Forwarding fault," "Board fault: chassis X slot Y," or "please check it," see "Troubleshooting hardware forwarding." |
No display on the configuration terminal
Symptom
The configuration terminal has no display when the switch is powered on.
Solution
To resolve the problem:
1. Verify that the power system is operating correctly.
2. Verify that the MPU is operating correctly.
3. Verify that the console cable has been correctly connected.
4. Verify that the following settings are configured for the terminal:
¡ Baud rate—9600
¡ Data bits—8
¡ Parity—none
¡ Stop bits—1
¡ Flow control—none
¡ Emulation—VT100
5. Verify that the console cable is not faulty.
6. If the problem persists, contact H3C Support.
Garbled display on the configuration terminal
Symptom
The configuration terminal displays garbled text.
Solution
To resolve the problem:
1. Verify that the following settings are configured for the terminal:
¡ Baud rate—9600
¡ Data bits—8
¡ Parity—none
¡ Stop bits—1
¡ Flow control—none
¡ Emulation—VT100
2. If the problem persists, contact H3C Support.
Card state abnormality
Symptom
· The LEDs for a card indicate a failure.
¡ MPU—The RUN LED on the MPU is off, steady on, or flashing red.
¡ LPU—The LC LED on the MPU is flashing red, or the RUN LED on the LPU is off, steady on, or flashing red.
¡ Switching fabric module—The SFC LED on the MPU is flashing red, or the RUN LED on the switching fabric module is off, steady on, or flashing red.
· Execute the display device command. The command output shows that the card is in Absent, Fault, Off, Offline, or Illegal state.
The following shows a sample output of the display device command.
<Sysname> display device
Slot No. Brd Typ e Brd Status Software Version
1/0 LST1MRPNE1 Master S12500-CMW710-R7328
1/1 LST1MRPNE1 Standby S12500-CMW710-R7328
1/2 NONE Absent NONE
1/3 NONE Absent NONE
1/4 LST0XP40RFD1 Normal S12500-CMW710-R7328
1/5 NONE Absent NONE
1/6 NONE Absent NONE
1/7 NONE Absent NONE
1/8 NONE Absent NONE
1/9 LST1GT48LEC1 Normal S12500-CMW710-R7328
1/10 NONE Absent NONE
1/11 NONE Absent NONE
1/12 LST1SF08E1 Normal S12500-CMW710-R7328
1/13 NONE Absent NONE
1/14 NONE Absent NONE
1/15 LST1SF08E1 Normal S12500-CMW710-R7328
1/16 NONE Absent NONE
1/17 NONE Absent NONE
1/18 NONE Absent NONE
Solution
In Absent state
To resolve the problem:
1. Verify that the card is installed securely. Remove and reinstall the card to make sure the card is installed securely.
2. Verify that the card is not faulty by following these steps:
a. Install this card into another slot.
b. Install another card that is operating correctly on the chassis into this slot.
3. Verify that the LEDs on the card panel and inside the card do not indicate any fault.
4. Verify that the output power of the power modules meets the requirements.
5. Verify that the system software supports the card.
a. Execute the display device command to display the system software version.
b. See the card manual to verify that the system software supports the card.
c. If the system software does not support the card, upgrade the card to the compatible version.
6. Perform one of the following operations:
¡ If the card is an MPU, press the Reset button on the MPU to reset the MPU and verify that the RUN LED flashes green. Then connect the MPU to a terminal through the console cable to verify that it boots correctly.
¡ If the card is a switching fabric module, connect the switching fabric module to a terminal through the console cable to verify that it boots correctly.
¡ If the card is an LPU, verify that the MPU is operating correctly.
7. If the card is faulty, replace the card and contact H3C Support. If the problem persists, contact H3C Support.
In Off state
To resolve the problem:
1. Determine whether a user powered off the card by using the power-supply off command.
¡ If the user did, power on the card by using the power-supply on command.
¡ If the user did not, the power module of the card is faulty. Replace the card and contact H3C Support.
2. If the problem persists, contact H3C Support.
In Fault state
To resolve the problem:
1. Wait a period of time and determine whether the card remains in Fault state or reboots after becoming Normal. If the card reboots after becoming Normal, contact H3C Support.
2. Verify that the card boots correctly.
¡ For an MPU or switching fabric module, connect the card to a terminal through the console cable to verify that the card boots correctly. If a DRAM test fails, causing repeated reboots (as shown in the following), verify that the DRAM is installed securely.
readed value is 55555555 , expected value is aaaaaaaa
DRAM test fails at: 080ffff8
DRAM test fails at: 080ffff8
Fatal error! Please reboot the board.
¡ For an LPU, verify that the system working mode supports the card type.
Use the display system-working-mode command to display the system operating mode:
<Sysname> display system-working-mode
The current system working mode is routee.
The next system working mode is routee
If the current system operating mode does not support the card, the switch generates related information as shown in the following example:
%Jun 26 10:13:04:006 2013 H3C SYSM/1/DRV_SYSM_PROMPT: -MDC=1;
This is not hardware fault, please change mode by command 'system-working-mode' in system view.
%Jun 26 10:13:04:006 2013 H3C SYSM/1/DRV_SYSM_PROMPT: -MDC=1;
chassis 2 slot 2 is an EB type board, and it supports Standard working mode only.
%Jun 26 10:13:04:006 2013 H3C SYSM/1/DRV_SYSM_PROMPT: -MDC=1;
ERROR!!! chassis 2 slot 2 doesn't support the current system working mode, board rebooting!
The output shows that the EB card is not supported in Routee mode.
If you determine that the current system operating mode does not support the card, use the system-working-mode command to modify the system operating mode. Then save the configuration. The new operating mode takes effect after the switch reboots.
[Sysname]system-working-mode standard
Do you want to change the system working mode? [Y/N]:y
The system working mode is changed, please save the configuration and reboot the system to make it effective.
[Sysname]save
The current configuration will be written to the device. Are you sure? [Y/N]:y
Please input the file name(*.cfg)[cfa0:/ali0207-V7.cfg]
(To leave the existing filename unchanged, press the enter key):
cfa0:/ali0207-V7.cfg exists, overwrite? [Y/N]:y
Validating file. Please wait...
Saved the current configuration to mainboard device successfully.
3. Install the card into another slot to determine whether the card is faulty.
4. If the card is faulty, replace the card and contact H3C Support. If the problem persists, contact H3C Support.
In Offline state
To resolve the problem:
1. Determine whether a user took the card offline by using the board-offline command. For example, when a new card is installed, the user needs to take the card offline by using the board-offline command for diagnostic testing. If the user does so, use the undo board-offline command to take the card online.
2. Perform one of the following operations:
¡ When an LPU is taken offline, a fault might have been detected on the LPU by the online diagnostic module. Execute the display hardware-failure-detection command, and check for the records at the time when the card was taken offline. If the LPU is faulty, replace the LPU and contact H3C Support.
<Sysname>display hardware-failure-detection
Current level:
chip : isolate
board : isolate
forwarding : isolate
---------------------Chassis 2, Slot 0 executed records:-------------------
Chassis 2, Slot 6:
1. 2013-06-26, 09:49:15 some auto-down ports on this slot are down by forwarding detection.
---------------------Chassis 2, Slot 0 trapped records:--------------------
Chassis 1, Slot 3:
1. 2013-06-20, 15:17:44 warned by forwarding detection.
Chassis 2, Slot 6:
1. 2013-06-26, 09:52:22 warned by forwarding detection.
¡ When one or more switching fabric modules are taken offline, a forwarding-plane failure might have been detected, and the system generates log messages such as "Forwarding fault," "Board fault: chassis X slot Y," and "please check it." You can execute the display hardware-failure-detection command to display offline information about switching fabric modules.
- If one switching fabric module is taken offline, and the forwarding-plane failure is removed after the switching fabric module is taken offline, the switching fabric module is faulty. Replace the switching fabric module and contact H3C Support. If the forwarding-plane failure persists after the switching fabric module is taken offline, the switching fabric module is not faulty, because the switching fabric module does not participate in traffic forwarding after being taken offline. (The online diagnostic module is not intelligent enough, and misjudgment might occur at multiple points of failures.) You can use the undo board-offline command to get the switching fabric module online. See "Troubleshooting hardware forwarding" to resolve the problem, and contact H3C Support.
- If multiple switching fabric modules are taken offline, the LPUs might be faulty. See "Troubleshooting hardware forwarding" to resolve the problem, and contact H3C Support.
In Illegal state
To resolve the problem:
1. Verify that the switch supports the card.
2. Verify that the switch software version supports the card. New cards cannot boot on an earlier software version. Upgrade the software version to support the new cards.
3. Insert the card into another slot to verify that the card is not faulty.
4. If the problem persists, replace the card and contact H3C Support.
Card reboot
Symptom
· A card rebooted unexpectedly or repeatedly.
· The log message shows that a card has rebooted.
· Execute the display version or display kernel reboot command. The command output shows that the card has rebooted (the uptime less than other cards).
Solution
To resolve the problem:
1. View the log messages, or execute the display version command to determine the period during which the card rebooted.
2. Determine whether a user rebooted the card by using the reboot command or by powering off and then powering on the card during the period. The reason for the last reboot is displayed in the display version command output. You can check the Last reboot reason field for the event that caused the last reboot. As shown in the preceding sample command output, Power on indicates that the reason for the last reboot is that a user repowered it.
3. If all cards rebooted simultaneously, verify the following:
¡ The power modules operate correctly.
¡ The switch has not been disconnected from the power source.
¡ The power cables are connected securely.
4. Verify that log messages such as "Slot X need to be rebooted automatically!" are not generated during the card reboot. If a message like that is displayed, replace the card and contact H3C Support.
5. Verify that the message "Hardware error" is not displayed. If the message is displayed, view the error code:
¡ If the error code is 0 through 31 or no smaller than 100, the power module of the card is faulty. Replace the card and contact H3C Support.
¡ For other error codes, contact H3C Support.
%Jul 7 18:10:50:890 2012 H3C DIAG/1/ALERT: -MDC=1; Hardware error! slot=6, code=0
%Jul 7 18:10:50:890 2012 H3C DIAG/1/ALERT: -MDC=1; Hardware error! slot=6, code=1
%Jul 7 18:10:50:890 2012 H3C DIAG/1/ALERT: -MDC=1; Hardware error! slot=6, code=2
6. Execute the display hardware-failure-detection command. Verify that there is no card reboot record in the determined reboot period in the command output. If there is a card reboot record in the determined period, contact H3C Support.
7. If the problem persists, contact H3C Support.
PMU or power module failure
Symptom
· LEDs of the power monitoring module (PMU) or power module indicate a failure.
¡ When the RUN LED on the PMU is off, the PMU is faulty.
¡ When the Major LED on the PMU of the S12504 switch is steady on, or the ALM LED on the PMU of the S12508/S12518 switch is flashing or steady on, the power modules might be faulty.
¡ When the fault LED on a power module is steady on, the power module is faulty.
· An alarm is generated, indicating that the PMU or a power module is faulty, as shown in the following examples:
%Jun 26 10:13:46:233 2013 H3C DEV/2/POWER_MONITOR_FAILED: -MDC=1; Power monitor unit 1 failed.
%Jun 27 18:10:50:890 2013 H3C DEVD/4/DRV_DEV_PSU_CHANGED: -MDC=1; Chassis 1: PSU ID may be changed, please check it!
Solution
To resolve the problem:
1. Verify that the power module or PMU is securely installed. Remove and reinstall the power module or PMU to make sure the module is installed securely.
2. Verify that the power module or PMU is not faulty by exchanging it with another one that operates correctly.
3. Verify that the power cord is connected correctly. You can remove and reinstall the power cord, or replace the power cord.
4. Verify that the power source is supplying power as required.
5. Verify that problems, such as short-circuit output, over-current output, over-voltage output, under-voltage input, and overtemperature, do not occur on the power module.
6. Execute the display power-supply command to display the power module information.
If the power module and PMU are installed securely but the power module state field is empty or Absent, a failure occurs. The fault cause is displayed following the state field:
¡ If the cause is Under-vol, the power module might not connect to the power cord, or the power module has a bad contact with the power source.
¡ For other causes, remove and reinstall the power module to make sure the power module is installed securely. You can also determine whether the power module is faulty by exchanging it with another one that runs correctly.
The following shows a sample output of the display power-supply command:
<Sysname>display power-supply
Power info on chassis 2:
PSU 1/1 state: Normal
PSU 1/2 state: Normal
PSU 1/3 state: Normal
PSU 1/4 state: Normal
PSU 1/5 state: Normal
PSU 1/6 state: Normal
PSU 1/7 state: Normal
PSU 1/8 state: Normal
PSU 1/9 state: Normal
PSU 1/10 state: Normal
PSU 1/11 state: Normal
PSU 1/12 state: Normal
PSU 1/13 state: Normal
PSU 1/14 state: Normal
PSU 1/15 state: Normal
PSU 1/16 state: Normal
7. Execute the display power-supply verbose command.
a. Verify that the PMU information (System power monitoring unit in the command output) is displayed correctly. If the PMU information fails to be displayed, remove and reinstall the PMU, and determine whether the PMU is faulty by exchanging it with another one that runs correctly.
b. Verify whether the Line-card power status field for each securely-installed card is On. If not, perform one of the following:
- In Absent state—See "In Absent state" to remove the failure.
- In Wait state—The system power is insufficient, and the card is waiting to be powered on. Verify that the power source and the power modules operate correctly.
- In Off state—The card powers off automatically due to user operation, over-temperature protection, or power module failure, and it will not power on automatically. See "In Offline state" to resolve the problem.
The following shows a sample output of the display power-supply verbose command.
<Sysname> display power-supply verbose
Power info on chassis 0:
System power-supply policy: enable
System power-module redundant(configured): 1
System power usable: 4725 Watts
System power redundant(actual): 0 Watts
System power allocated: 2685 Watts
System power available: 2040 Watts
System power used(current): 1338.12 Watts
System power monitoring unit 1:
Software version: 200
Type In/Out Rated-Vol(V) Existing Usable Redundant(actual)
---------- ------ ------------ -------- ------ -----------------
PSE9000-A AC/DC 220(default) 2 2 0
DC output voltage information:
Tray Value(V) Upper-Threshold(V) Lower-Threshold(V) Status
---- -------- ------------------ ------------------ -------
1 49.93 52.00 48.00 Normal
DC output current information:
Total current(A): 26.80
Branch Value(A)
------ --------
1/1 N/A
1/2 N/A
1/3 N/A
1/4 N/A
1/5 N/A
1/6 N/A
1/7 16.40
1/8 10.40
PSU Status:
ID Status Input-Err Output-Err High-Temperature Fan-Err Closed Current-Limit
--- ------- ----------- ---------- ---------------- ------- ------ -------------
1/1 Absent
1/2 Absent
1/3 Absent
1/4 Absent
1/5 Absent
1/6 Absent
1/7 Normal
1/8 Normal
Line-card power status:
Slot Board-Type Watts Status
---- --------------- ----- ------
2 None -- Absent
3 None -- Absent
4 None -- Absent
5 None -- Absent
6 None -- Absent
7 None -- Absent
8 None -- Absent
9 Unknown 190 On
PMU 1: normal
Protocol: 21
Type: LST1PMUB
Vendor: H3C
Current Ver: 200
Boot Ver: 205
Low-Area Ver: 200
High-Area Ver: 290
Current-Area: Low
PCB Ver: Ver.A
Backplane PCB Ver: Ver.A
Backplane Type: LST19KA2PSB
PMU Temperature: 25 ℃
PSU Count: 2
PSU Actual Output: 50V
ID Temperature Fan 0 Speed Fan 1 Speed Actual Current
---- ----------- ----------- ----------- --------------
Run7 64 37 0 16
Run8 41 134 133 10
ID Inp-Vol RatedPower Type Hardware SN
----- ------- ---------- ---------------- ---------------- --------------
Info7 220 2725 CP2725AC54TE 1:3C 12KZ33020750
Info8 220 2000 CP2000AC54PE 1:14 11CS18000957
8. If the power module or PMU is faulty, replace the module. If the problem persists, contact H3C Support.
Fan tray failure
Symptom
· The RUN LED of a fan tray is off. The ALM LED is flashing or steady on.
· A fan tray error message is displayed on the switch, as shown in the following example:
%Jun 26 10:12:24:805 2013 H3C DEV/3/FAN_ABSENT: -MDC=1; Chassis 2 Fan 2 is absent.
%Jun 26 10:12:32:805 2013 H3C DEVD/2/DRV_DEV_FAN_CHANGE: -MDC=1; Chassis 2: Fan communication state changed: Fan 1 changed to fault.
%Jun 26 10:12:42:405 2013 H3C DEV/2/FAN_FAILED: -MDC=1; Chassis 2 Fan 1 failed.
Solution
To resolve the problem:
1. Verify that the power module system is operating correctly if all LEDs are off.
2. Put your hand at the air outlet to verify that there is air being exhausted from the air outlet. If no air is being exhausted from the outlet, the fan trays are faulty.
3. Verify that the airflow is not blocked at the air inlet and outlet.
4. Verify that the fan tray is securely installed. You can remove and reinstall the fan tray to make sure that the fan tray is securely installed.
5. Verify that the status of each fan is normal and that the speed difference between the fans does not exceed 50%. Execute the display fan verbose command to display detailed information about the fans. If there is an abnormality, verify that the fan tray is not faulty by exchanging it with another one that runs correctly.
6. If the problem persists, replace the fan tray. If there is no new fan tray, power off the switch to avoid damage caused by high temperatures. The switch can be used temporarily if there are cooling measures to maintain the switch operating temperature below 50°C (122°F).
7. If the problem persists, contact H3C Support.
The following shows a sample output of the display fan verbose command.
<Sysname>display fan verbose
Fan-tray verbose state on chassis 0:
Fan-tray 1:
Software version: 204
Hardware version: Ver.A
Fan number: 8
Temperature: 33 ℃
High temperature alarm threshold: 60 ℃
Low speed alarm threshold: 30 %
Fan Status Speed(%)
--- ---------- ----------
1 normal 50 %
2 normal 50 %
3 normal 50 %
4 normal 50 %
5 normal 50 %
6 normal 50 %
7 normal 45 %
8 normal 45 %
Type: FCU
Current Ver: 204
Boot Ver: 100
Low-Area Ver: 204
Temperature alarm
Symptom
A temperature over-low or over-high alarm is generated on the switch, as shown in the following example:
%Jun 26 10:13:46:233 2013 H3C DEV/4/TEMPERATURE_WARNING: -MDC=1; Temperature is greater than warning upper limit on Chassis 1 slot 2 sensor inflow 1.
Solution
To resolve the problem:
1. Verify that the ambient temperature is in the acceptable range. If the temperature is too high, find the cause. The possible cause might be that the equipment room has bad ventilation or the air conditioning is faulty.
2. Verify that the current temperature of the switch does not exceed the upper and lower warning and alarm thresholds. The card might be damaged when operating continuously at a high temperature. You can feel the card by hand, or execute the display environment command to display temperature information.
¡ If the temperature is too high, see "Fan tray failure" to determine whether fan tray failure causes the problem.
¡ If the Temperature field displays error or a value out of the ordinary, the switch might fail to access the card temperature sensor through the I2C bus. The switch accesses the transceiver modules through the same I2C bus. You can view whether the transceiver module information is displayed correctly. If the switch can access the transceiver modules, use the temperature-limit command to reconfigure the temperature thresholds. Then use the display environment command to view whether the setting takes effect.
[Sysname]temperature-limit chassis 2 slot 0 hotspot 1 -20 85 90
<Sysname>display environment
System temperature information (degree centigrade):
-------------------------------------------------------------------------------
Slot Sensor Temperature LowerLimit WarningLimit AlarmLimit ShutdownLimit
2/0 inflow 1 35 -25 70 85 N/A
2/0 outflow 1 40 -20 80 85 N/A
2/0 hotspot 1 43 -20 85 90 N/A
2/2 inflow 1 39 -20 70 85 N/A
2/2 outflow 1 40 -10 80 90 N/A
2/2 hotspot 1 41 -10 80 90 N/A
2/3 inflow 1 41 -20 70 85 N/A
2/3 outflow 1 57 15 80 85 N/A
2/3 hotspot 1 41 -20 75 80 N/A
2/3 hotspot 2 50 0 75 80 N/A
2/4 inflow 1 43 -20 70 85 N/A
2/4 outflow 1 60 15 80 85 N/A
2/4 hotspot 1 43 -20 75 80 N/A
2/4 hotspot 2 54 0 75 80 N/A
3. If the problem persists, contact H3C Support.
Related commands
This section lists the commands that you might use for troubleshooting hardware.
|
Command |
Description |
|
display device |
Displays device information, including the card states. |
|
display environment |
Displays the temperature statistics on the device, including the current temperature and temperature thresholds. |
|
display fan |
Displays the operating states of fans. |
|
display hardware-failure-detection |
Displays hardware failure detection and rectification information, including the rectification actions for each failure and historic information about the last ten fault rectifications on each card. |
|
display power-supply |
Displays power module information: · Enabled/disabled status of the power module management function. · Power module type, rated input voltage, and rated output power. · Number of redundant power supplies and the available, redundant, used, and remaining power of each power module. · Status of the installed power supplies. · Power module status of the LPUs. |
|
display system-working-mode |
Displays the current system operating mode. |
|
display version |
Displays system version information, card running time, and cause of the last reboot. |
|
save |
Saves the running configuration to a specific configuration file. |
|
system-working-mode |
Sets the system operating mode to modify the hardware resources allocation. The command takes effect after the configuration is saved and the device reboots. |
|
temperature-limit |
Sets the temperature alarm thresholds for the device. |
Troubleshooting links and ports
This section provides troubleshooting information for common problems with links and ports.
Error packets on a port
Symptom
Use the display interface command to display the traffic statistics about incoming packets and outgoing packets of a port. The error packet count is not 0.
<Sysname> display interface GigabitEthernet1/8/0/1
GigabitEthernet1/8/0/1 current state: UP
Line protocol current state: UP
IP Packet Frame Type: PKTFMT_ETHNT_2, Hardware Address: b8af-67bc-24fa
Description: GigabitEthernet1/8/0/1 Interface
Loopback is not set
Media type is twisted pair, Port hardware type is 1000_BASE_T
1000Mbps-speed mode, full-duplex mode
Link speed type is autonegotiation, link duplex type is autonegotiation
Flow-control is not enabled
The Maximum Frame Length is 9216
Allow jumbo frame to pass
Broadcast MAX-ratio: 100%
Multicast MAX-ratio: 100%
Unicast MAX-ratio: 100%
PVID: 999
Mdi type: automdix
Port link-type: access
Tagged Vlan: none
UnTagged Vlan: 999
Port priority: 2
Last clearing of counters: Never
Peak value of input: 70 bytes/sec, at 2013-03-19 13:04:15
Peak value of output: 210 bytes/sec, at 2013-03-19 13:04:15
Last 300 seconds input: 0 packets/sec 70 bytes/sec 0%
Last 300 seconds output: 0 packets/sec 210 bytes/sec 0%
Input (total): 693897 packets, 72834962 bytes
22196 unicasts, 584504 broadcasts, 87197 multicasts, - pauses
Input (normal): 693897 packets, 72834962 bytes
22196 unicasts, 584504 broadcasts, 87197 multicasts, 152536 pauses
Input: 0 input errors, 0 runts, 0 giants, 0 throttles
0 CRC, 0 frame, 0 overruns, - aborts
- ignored, - parity errors
Output (total): 7515164 packets, 14001669469 bytes
20811 unicasts, 6228300 broadcasts, 1266053 multicasts, - pauses
Output (normal): 7515164 packets, 14001669469 bytes
20811 unicasts, 6228300 broadcasts, 1266053 multicasts, 0 pauses
Output: 0 output errors, - underruns, - buffer failures
0 aborts, 0 deferred, 0 collisions, 0 late collisions
- lost carrier, - no carrier
Table 4 Error packet fields for incoming packets
|
Field |
Description |
|
input errors |
Number of incoming error packets. |
|
Runts |
Number of incoming frames shorter than 64 bytes, in correct format, and containing valid CRCs. |
|
Giants |
Number of incoming frames larger than the maximum frame length configured on the interface. |
|
CRC |
Number of incoming frames that contained CRC errors. |
|
frame |
Number of incoming frames that contained CRC errors and a non-integer number of bytes. |
|
throttles |
Number of incoming packets that contained a non-integer number of bytes. |
Table 5 Error packets fields for outgoing packets
|
Field |
Description |
|
output errors |
Number of outgoing error packets. |
|
aborts |
Number of packets that failed to be transmitted. |
|
deferred |
Number of frames that the interface failed to transmit when the delay exceeded two times the maximum packet transmission time because the medium was busy. |
|
collisions |
Number of frames that the interface stopped transmitting because Ethernet collisions were detected during transmission. |
|
late collisions |
Number of frames that the interface deferred to transmit after transmitting their first 512 bits because of detected collisions. |
Solution
The number of incoming error packets of the CRC, frame, and throttle types keeps increasing on a port
To resolve the problem:
1. Use a tester to test the link, and verify that the link quality or fiber signal attenuation of the link is normal. If a link failure exists, replace the network cable or fiber.
A weak link quality or serious fiber signal attenuation will cause packet transmission errors.
2. Verify that the transceiver module is operating correctly if a transceiver module is used.
For more information, see "Transceiver module failures."
3. Use the network cable or fiber and transceiver module of the port to connect to another port that is operating correctly.
¡ If error packets do not appear on the new port and error packets appear after the network cable or fiber and transceiver module is connected to the current port again, you can determine that the port fails. Use another port that is operating correctly, and contact H3C Support.
¡ If error packets still appear on the new port, the peer device and intermediate transmission links might fail. Examine the peer device and intermediate transmission links.
4. Verify that the peer device and intermediate devices are operating correctly.
5. If the problem persists, contact H3C Support.
The number of incoming error packets of the overrun type keeps increasing on a port
The number of overrun packets keeps increasing on a port because the input rate exceeds the processing capability of the port, which causes congestion.
To resolve the problem:
1. Execute the display interface command multiple times when both of the following are true:
¡ Only one port cannot correctly send and receive packets, or the device attached to only one port cannot transmit traffic.
¡ The other ports on the same interface card are operating correctly.
2. Perform one of the following tasks, depending on the error packet count trend:
¡ If the number of input errors increases, but the number of overruns does not increase, examine the fiber, transceiver module, and the peer device.
¡ If the number of input errors increases and the increment is the same as the increment of overruns, the interface card might be internally congested or blocked. To resolve the problem, contact H3C Support.
3. If the problem persists, contact H3C Support.
The incoming error packets of the jumbo type keeps increasing on a port
To resolve the problem:
1. Verify that the jumbo frame configurations are the same on both ends, including:
¡ Whether jumbo frame support is enabled.
¡ The default maximum jumbo frame size allowed.
¡ The configured maximum jumbo frame size allowed.
2. If the problem persists, contact H3C Support.
The number of outgoing error packets keeps increasing on a port
To resolve the problem:
1. Examine the duplex mode of the port. Configure the port to operate in full duplex mode if the port is operating in half duplex mode.
2. If the problem persists, contact H3C Support.
A port fails to go up
Symptom
Solution
To resolve the problem:
1. Verify that the network cable or fiber link between ports is correct.
2. Verify that the Rx end and the Tx end are correctly connected.
3. Verify that the intermediate transmission link is correct by performing one of the following tasks:
¡ Replace the network cable or fiber between ports.
¡ Connect other ports that are operating correctly by using the network cable or fiber.
4. Use the display interface command to identify whether the port is up. If the port is not up, use the undo shutdown command to bring up the port.
5. Verify that the configurations of the local port and the peer port are correct, including whether the port is shutdown, and its speed, duplex mode, negotiation mode, and MDI.
[Sysname]display current-configuration interface ten-gigabitethernet 1/6/0/1
#
interface Ten-GigabitEthernet1/6/0/1
port link-mode bridge
port link-type trunk
port trunk permit vlan 1 3102
port link-aggregation group 1
#
Return
Table 6 Support for duplex modes
|
Speed (right) |
100 Gbps |
40 Gbps |
10 Gbps |
1000 Mbps |
100 Mbps |
10 Mbps |
|
Duplex mode (below) |
||||||
|
Full |
Supported |
Supported |
Supported |
Supported |
Supported |
Supported |
|
Half |
Not supported |
Not supported |
Not supported |
Not supported |
Not supported |
Not supported |
6. If the port has a transceiver module installed, verify that the transceiver modules at both ends of the link are consistent in the rate, wavelength, and single-mode or multi-mode status.
[Sysname]display transceiver interface ten-gigabitethernet 2/9/0/1
Ten-GigabitEthernet2/9/0/1 transceiver information:
Transceiver Type : 10G_BASE_LR_XFP
Connector Type : LC
Wavelength(nm) : 1310
Transfer Distance(km) : 10(SMF)
Digital Diagnostic Monitoring : YES
Vendor Name : H3C
7. Replace the transceiver module with a transceiver module that is operating correctly, and determine whether the transceiver modules fail.
For more information, see "Transceiver module failures."
8. If the transceiver module fails, replace the transceiver module, and contact H3C Support.
A port in up state goes down
Symptom
Solution
To resolve the problem:
1. Examine the logs of the local device and the peer device, and verify that a shutdown operation has not been performed.
2. Examine the status of ports at both ends. Determine whether the port is shut down because of the protocol failures or because of the failures detected by the online diagnosis module.
3. Contact H3C Support if Protect DOWN appears in the output for a port, for example, GigabitEthernet 2/6/0/1.
Protect DOWN means that the port goes down because the isolate keyword is specified for the hardware-failure-detection command. When the online diagnosis module detects port failures, the port will be shut down and isolated, so that the traffic can be switched to the backup link.
[Sysname]display interface gigabitethernet2/6/0/1
GigabitEthernet2/6/0/1 current state: Protect DOWN
Line protocol current state: DOWN
IP Packet Frame Type: PKTFMT_ETHNT_2, Hardware Address: 0000-e80d-c000
Description: GigabitEthernet2/6/0/1 Interface
Loopback is not set
Media type is optical fiber, Port hardware type is 1000_BASE_SX_SFP
Unknown-speed mode, unknown-duplex mode
Link speed type is autonegotiation, link duplex type is autonegotiation
Flow-control is not enabled
The Maximum Frame Length is 9216
……
4. Verify that the configurations of ports at both ends, network cables, transceiver modules, and fiber links are correct.
For more information, see "A port fails to go up."
5. If the problem persists, contact H3C Support.
A port frequently goes up and down
Symptom
A port frequently goes up and down.
Solution
1. For a fiber port, verify that the transceiver module is operating correctly:
a. Verify that the transceiver modules at both ends and the fiber in between are operating correctly by viewing the alarm information of transceiver modules.
b. For a transceiver module that supports the digital diagnosis function, identify whether the optical power of the transceiver module reaches the upper or lower threshold by viewing the diagnostic information:
- If the Tx optical power reaches a threshold, replace the optical fiber and transceiver module to identify whether they are operating correctly.
- If the Rx optical power reaches a threshold, verify that the peer transceiver module and the fiber link in between are operating correctly.
For more information, see "Transceiver module failures."
2. For a copper port, the port status might be unstable when the speed and duplex mode are autonegotiated. Manually configure the speed and duplex mode for the port.
3. Verify that the link, peer device, and intermediate devices are operating correctly.
4. If the problem persists, contact H3C Support.
Transceiver module failures
Symptom
The interface with a transceiver module installed cannot operate correctly.
Solution
To resolve the problem:
1. Check the alarms on the transceiver module:
¡ If TX faults exist in the alarms, the peer port, fiber, or intermediate transmission devices might fail.
¡ If the RX faults or electrical current and voltage faults exist in the alarms, examine the local port.
<Sysname>display transceiver alarm interface GigabitEthernet 2/0/1
GigabitEthernet2/0/1 transceiver current alarm information:
TX fault
RX power high
Table 7 Alarms on transceiver modules
|
Field |
Description |
|
Alarms on SFP/SFP+/CFP/QSFP+ transceiver modules: |
|
|
RX loss of signal |
Received signals are lost. |
|
RX power high |
The received optical power is high. |
|
RX power low |
The received optical power is low. |
|
TX fault |
Transmission error. |
|
TX bias high |
The transmitted bias current is high. |
|
TX bias low |
The transmitted bias current is low. |
|
TX power high |
The transmitted optical power is high. |
|
TX power low |
The transmitted optical power is low. |
|
Temp high |
The temperature is high. |
|
Temp low |
The temperature is low. |
|
Voltage high |
The voltage is high. |
|
Voltage low |
The voltage is low. |
|
Transceiver info I/O error |
Transceiver information read/write error. |
|
Transceiver info checksum error |
Transceiver information checksum error. |
|
Transceiver type and port configuration mismatch |
The type of the transceiver module does not match the port configuration. |
|
Transceiver type not supported by port hardware |
The port does not support this type of transceiver modules. |
|
Alarms on XFP transceiver modules: |
|
|
RX loss of signal |
Received signals are lost. |
|
RX not ready |
The receiving status is not ready |
|
RX CDR loss of lock |
Receiving CDR loss of lock. |
|
RX power high |
The received optical power is high. |
|
RX power low |
The received optical power is low. |
|
TX not ready |
The transmission status is ready. |
|
TX fault |
Transmission error. |
|
TX CDR loss of lock |
Transmission CDR loss of lock. |
|
TX bias high |
The transmitted bias current is high. |
|
TX bias low |
The transmitted bias current is low. |
|
TX power high |
The transmitted optical power is high. |
|
TX power low |
The transmitted optical power is low. |
|
Module not ready |
The module is not ready. |
|
APD supply fault |
Avalanche photo diode error. |
|
TEC fault |
Thermoelectric cooler error. |
|
Wavelength unlocked |
Wavelength loss of lock. |
|
Temp high |
The temperature is high. |
|
Temp low |
The temperature is low. |
|
Voltage high |
The voltage is high. |
|
Voltage low |
The voltage is low. |
|
Transceiver info I/O error |
Transceiver information read/write error. |
|
Transceiver info checksum error |
Transceiver information checksum error. |
|
Transceiver type and port configuration mismatch |
The type of the transceiver module does not match the port configuration. |
|
Transceiver type not supported by port hardware |
The port does not support this type of transceiver modules. |
2. Identify whether the Rx optical power and Tx optical power of the transceiver module is within the upper threshold and the lower threshold.
For an H3C transceiver module that supports the diagnosis function, you can use the following commands to identify whether the Rx optical power and Tx optical power exceed the thresholds. The following commands might fail to query the optical power information for other transceiver modules.
a. View the electronic label information of the transceiver module.
<Sysname>display transceiver manuinfo interface ten-gigabitethernet 1/2/0/15
Ten-GigabitEthernet1/2/0/15 transceiver manufacture information:
Manu. Serial Number : 213410A0000054000251
Manufacturing Date : 2012-10-26
Vendor Name : H3C
When the Vendor Name field is H3C, the transceiver module is customized by H3C. H3C recommends that you use H3C transceiver modules.
b. Identify whether the transceiver module supports digital diagnosis.
<Sysname>display transceiver interface
Ten-GigabitEthernet1/2/0/15 transceiver information:
Transceiver Type : 10G_BASE_LR_XFP
Connector Type : LC
Wavelength(nm) : 1310
Transfer Distance(km) : 10(SMF)
Digital Diagnostic Monitoring : YES
Vendor Name : FINISAR CORP.
When the Digital Diagnostic Monitoring field is Yes, the transceiver module supports digital diagnosis.
c. View the realtime Rx optical power and Tx optical power of the transceiver module.
<Sysname>display transceiver diagnosis interface
Ten-GigabitEthernet1/2/0/15 transceiver diagnostic information:
Current diagnostic parameters:
Temp.(°C) Voltage(V) Bias(mA) RX power(dBM) TX power(dBM)
41 3.26 42.43 -40.00 -2.20
d. Use the display transceiver interface or display transceiver diagnosis interface command to view the upper/lower thresholds for the Rx optical power and Tx optical power.
The two commands might both output the upper/lower thresholds. When the output upper/lower thresholds from the two commands are different, use the upper/lower threshold covering a smaller range.
Additionally, the display transceiver diagnosis interface command outputs the realtime Rx/Tx optical power, temperature and its upper/lower thresholds, voltage and its upper/lower thresholds, and bias current and its upper/lower threshold. In the output:
- The Current diagnostic parameters area displays the realtime temperature, voltage, bias current, Rx optical power, and Tx optical power.
- The Alarm thresholds area displays the upper and lower thresholds for the temperature, voltage, bias current, Rx optical power, and Tx optical power.
<Sysname>display transceiver interface Ten-GigabitEthernet 1/2/0/15
Ten-GigabitEthernet1/2/0/15 transceiver information:
Transceiver Type : 10G_BASE_LRM_SFP
Connector Type : LC
Wavelength(nm) : 1310
Transfer Distance(m) : 220(OM2),220(OM1),220(OM3)
Digital Diagnostic Monitoring : YES
Vendor Name : FINISAR CORP.
Max. TX Power(dBm) : UNKNOWN
Min. TX Power(dBm) : UNKNOWN
Min. RX Power(dBm) : UNKNOWN
Max. RX Power(dBm) : UNKNOWN
Original Manufacturer : FINISAR CORP.
Part Number : FTLX1371D3BCL-HC
Rev Number : A
Serial Number : UG903SL
Product Date : 09-09-14
<Sysname>display transceiver diagnosis interface Ten-GigabitEthernet 1/2/0/15
Ten-GigabitEthernet1/2/0/15 transceiver diagnostic information:
Current diagnostic parameters:
Temp.(°C) Voltage(V) Bias(mA) RX power(dBM) TX power(dBM
43 3.35 46.33 -3.60 -2.38
Alarm thresholds:
Temp.(°C) Voltage(V) Bias(mA) RX power(dBM) TX power(dBM
High 73 3.80 92.40 2.50 3.50
Low -3 2.81 1.00 -16.40 -11.20
Parameters when first used on N/A:
Temp.(°C) Voltage(V) Bias(mA) RX power(dBm) TX power(dBm)
N/A N/A N/A N/A N/A
Total account of alarms: 0
Latest occurrence of different alarms:
Type Date Description
Temp. N/A N/A
Voltage N/A N/A
Bias N/A N/A
RX power N/A N/A
TX power N/A N/A
TX N/A N/A
RX N/A N/A
Others N/A N/A
Latest three alarms:
Date Description
N/A N/A
N/A N/A
N/A N/A
3. Cross-verify the transceiver module that might fail:
a. Install the transceiver module in another fiber port.
b. Replace the current transceiver module with a transceiver module that is operating correctly.
4. Determine whether the transceiver module fails or the neighboring devices and intermediate transmission links fail.
5. If the problem persists, save the failure information and contact H3C support.
Related commands
This section lists the commands that you might use for troubleshooting ports and links.
|
Command |
Description |
|
display current-configuration |
Displays the running configuration. With an interface specified, this command displays the running configuration of the interface. |
|
display interface |
Displays the incoming traffic statistics, outgoing traffic statistics, and status of a port. In the output from this command, you can view whether error packets exist and view the error packet statistics. |
|
display transceiver alarm |
Displays alarms present on transceiver modules. |
|
display transceiver diagnosis |
Displays the current values of the digital diagnosis parameters on transceiver modules. |
|
display transceiver interface |
Displays key parameters of the transceiver module in a specified interface to verify whether the transceiver modules at both ends are consistent in the rate, wavelength, and single-mode or multi-mode status. |
|
display transceiver manuinfo |
Displays the electronic label information of a transceiver module to query the vendor of the transceiver module. |
Troubleshooting hardware forwarding
Forwarding path problem
Symptom
When data forwarding path failure detection is enabled (it is enabled by default), the switch periodically sends test packets between LPUs to examine whether the forwarding chips on the LPUs are operating correctly.
[Sysname] forward-path-detection enable
If a forwarding problem occurs, the switch displays "Forwarding fault" or "Board fault" messages. For example:
%Jun 26 09:51:53:207 2013 H3C DIAG/1/ALERT: -MDC=1-Chassis=2-Slot=4; Forwarding fault: chassis 2 slot 6 to chassis 2 slot 4
%Jun 26 09:51:57:621 2013 H3C DIAG/1/ALERT: -MDC=1; Board fault: chassis 2 slot 6,please check it
%Jun 26 09:51:59:251 2013 H3C DIAG/1/ALERT: -MDC=1-Chassis=2-Slot=6; Forwarding fault: chassis 2 slot 6 to chassis 2 slot 6
%Jun 26 09:52:05:621 2013 H3C DIAG/1/ALERT: -MDC=1; Board fault: chassis 2 slot 6,please check it
%Jun 26 09:52:12:621 2013 H3C DIAG/1/ALERT: -MDC=1; Board fault: chassis 2 slot 6,please check it
%Jun 26 09:52:22:621 2013 H3C DIAG/1/ALERT: -MDC=1; Board fault: chassis 2 slot 6,please check it
Solution
The switch has MPUs, LPUs, and switching fabric modules. LPUs and switching fabric modules perform service traffic forwarding. Traffic is load balanced among the switching fabric modules. MPUs perform control and management. MPUs do not participate in service traffic forwarding.
To resolve the forwarding path problem:
· If "Forwarding fault" messages show forwarding problems between multiple LPUs, it is likely that a switching fabric module has a problem. To locate the problem source, isolate switching fabric modules one by one. (An isolated switching fabric module does not participate in traffic forwarding. To avoid packet loss, make sure the switch has a minimum of two switching fabric modules.)
For example, do the following on an H3C S12508 switch in which slots 10 through 18 hold switching fabric modules:
a. Isolate the switching fabric module in slot 10.
[Sysname] board-offline slot 10
Caution: This command is only for diagnostic purpose which will cause board normal service unusable. Continue? [Y/N]:y
Config successfully
b. Observe for a while to see whether the problem disappears.
c. If the problem disappears, the switching fabric module is likely to be the problem source. H3C recommends that you replace the module card or install the module into another switch that is operating correctly to determine whether the module is really the problem source.
d. If the problem persists, cancel the isolation.
[Sysname]undo board-offline slot 10
This command will reboot the specified board. Continue? [Y/N]:y
Config successfully
e. After the switching fabric module in slot 10 starts up and operates correctly (in Normal state), isolate the switching fabric module in the next slot. Repeat the previous steps until you locate the failed switching fabric module and verify that other switching fabric modules are operating correctly.
· If "Forwarding fault" messages show forwarding problems from the same LPU to multiple other LPUs, the LPU is likely to have a problem. If you are not sure whether the LPU has a problem, H3C recommends that you do the following to locate the problem source:
a. Isolate switching fabric modules one by one, and observe whether the problem disappears.
b. If the problem persists during the whole isolation process, the LPU might be the source of the problem. H3C recommends that you switch the services on the LPU to other LPUs and replace or isolate the LPU. If the problem is solved, the LPU is the source of the problem.
Online hardware diagnostic and failure protection
When the hardware failure detection function is enabled, the switch automatically detects hardware failures on the following elements:
· chip—Components, such as chips, capacitors, and resistors.
· board—Cards, including the control channels. The switch supports fast card status detection.
· forwarding—Forwarding plane, including forwarding of service traffic and other types of traffic.
You can configure the switch to take the following actions in response to hardware failures:
· off—Takes no action.
· warning—Sends traps to notify you of the failures.
· reset—Restarts the relevant components or cards to recover from failures.
· isolate—Shuts down the relevant ports, prohibits loading software for the relevant cards, isolates the relevant cards, or powers off the relevant cards to reduce impact from the failures.
If there are backup links, H3C recommends that you configure the switch to take the isolate action. This action isolates the failed element and helps recover services quickly. The following shows the configuration commands:
[Sysname] hardware-failure-detection chip isolate
Config successfully
[Sysname] hardware-failure-detection board isolate
Config successfully
[Sysname] hardware-failure-detection forwarding isolate
Config successfully
To display hardware failure detection and fix information, use the following command:
<Sysname> display hardware-failure-detection
Current level:
chip : isolate
board : isolate
forwarding : warning
--------------------------Slot 0 executed records:-----------------------------
There is no record.
--------------------------Slot 0 trapped records:-----------------------------
There is no record.
Related commands
This section lists the commands that you might use for troubleshooting hardware forwarding.
|
Command |
Description |
|
board-offline |
Isolate a card from the system. |
|
display hardware-failure-detection |
Display hardware failure detection and fix information, including the following times: · Protection actions configured for hardware failures. · Most recent 10 fix records of each card. |
|
forward-path-detection enable |
Enable data forwarding path failure detection to examine whether data forwarding paths are operating correctly. |
|
hardware-failure-detection |
Configure hardware failure detection, and specify the actions to be taken in response to hardware failures. The purpose is to enable the device to automatically detect hardware failures and recover services. |
Troubleshooting packet forwarding failure
Ping failure or packet loss
Symptom
Packet loss and ping failure occurred.
<Sysname>ping 10.0.0.5
PING 10.0.0.5 (10.0.0.5): 56 data bytes, press CTRL_C to break
Request time out
Request time out
Request time out
Request time out
Request time out
--- 10.0.0.5 ping statistics ---
5 packet(s) transmitted, 0 packet(s) received, 100.0% packet loss
Solution
Packet statistics collection
To resolve the problem, collect packet statistics by using packet capture tools or by configuring ACL rules. The following uses ACL rule as an example.
1. Create an IPv4 advanced ACL rule to permit IP packets destined for 1.1.1.1.
[Sysname]acl number 3000
[Sysname-acl-adv-3000] rule 1 permit ip destination 1.1.1.1 0
2. Define a traffic class and a traffic behavior.
[Sysname]traffic classifier statistic_1
[Sysname-classifier-static] if-match acl 3000
[Sysname] traffic behavior statistic_1
[Sysname-classifier-static] accounting packet
3. Create a QoS policy, and associate traffic class statistic_1 with traffic behavior statistic_1 in the QoS policy.
[Sysname] qos policy statistic_1
[Sysname-classifier-static] classifier statistic_1 behavior statistic_1
4. Apply the QoS policy to the incoming traffic of GigabitEthernet 8/0/1.
[Sysname] interface gigabitethernet 8/0/1
[Sysname-GigabitEthernet8/0/1] qos apply policy statistic_1 inbound
5. Display information about the QoS policies applied to GigabitEthernet 8/0/1.
[Sysname] display qos policy interface gigabitethernet8/0/1
Interface: GigabitEthernet8/0/1
Direction: Inbound
Policy: statistic_1
Classifier: statistic_1
Operator: AND
Rule(s) : If-match acl 3000
Behavior: statistic_1
Accounting Enable:
1000 (Packets)
Packet count
If the device does not receive any ping packets, check the neighboring device on the uplink. If the number of ping packets sent by the device is correct, check the neighboring device on the downlink. If the number of ping packets sent is incorrect, see "Layer 2 forwarding failure, "Layer 3 forwarding failure," and "MPLS forwarding failure."
Layer 2 forwarding failure
Symptom
Layer 2 packet loss or ping failure occurs between a switch and a device on the same network segment and in the same VLAN.
A switch can perform Layer 2 forwarding only when the destination MAC address of a packet is different from any MAC address of the switch. A switch might have multiple MAC addresses in an address range. The following output shows the MAC addresses of a VLAN interface on a switch:
[Sysname] display interface vlan-interface 10
Vlan-interface10 current state: UP
Line protocol current state: UP
Description: Vlan-interface10 Interface
The Maximum Transmit Unit is 1500
Internet Address is 1.1.1.1/24 Primary
IP Packet Frame Type: PKTFMT_ETHNT_2, Hardware Address: 00e0-fc00-6503
IPv6 Packet Frame Type: PKTFMT_ETHNT_2, Hardware Address: 00e0-fc00-6503
Last clearing of counters: Never
Solution
To resolve the problem:
1. Verify that the following Layer 2 configurations are correct:
¡ VLAN and PVID.
¡ Packet filtering.
¡ Traffic redirection.
¡ Traffic policing.
¡ Generic traffic shaping (GTS).
¡ Unknown unicast suppression/multicast suppression/broadcast suppression.
2. Verify that the learned MAC addresses are correct. If they are not, determine whether loops occur. To quickly restore forwarding, you can configure static MAC address entries.
<Sysname> display mac-address
MAC Address VLAN ID State Port/NickName Aging
0010-9400-0002 10 Learned GE2/6/0/1 Y
000f-e259-79c0 25 Learned GE2/15/0/1 Y
00e0-fc12-3456 25 Learned GE2/15/0/1 Y
0023-8956-7b00 3102 Learned XGE2/4/0/1 Y
0023-8956-7b00 3202 Learned XGE2/4/0/8 Y
3. Verify traffic statistics:
¡ Execute the qos traffic-counter inbound command to collect statistics about the inbound traffic.
[Sysname] qos traffic-counter inbound counter0 slot 3 interface gigabitethernet 3/0/1
¡ Execute the display qos traffic-counter inbound multiple times to observe the discarded packet count in the inbound direction. If the count continuously increases, verify the port configurations according to Table 8. If the reasons for packet loss still cannot be determined, contact H3C Support.
<Sysname> display qos traffic-counter inbound counter0 slot 3
Slot 3 inbound counter0 mode:
Interface: GigabitEthernet3/0/1
VLAN: all
Traffic-counter summary:
Summary inbound: 578199 packets
Dropped of local filtering: 0 packets
Dropped of VLAN filtering: 0 packets
Dropped of security filtering: 0 packets
|
Field |
Description |
|
Slot 3 inbound counter0 mode |
Monitored objects of the counter in the inbound direction of a card. |
|
Interface |
Interface monitored by the counter. |
|
VLAN |
VLANs monitored by the counter. |
|
Traffic-counter summary |
Traffic statistics collected by the counter. |
|
Summary inbound |
Number of packets received by the bridge. |
|
Dropped of local filtering |
Number of packets dropped by the bridge, excluding the packets dropped by security filtering and inbound direction VLAN filtering. |
|
Dropped of VLAN filtering |
Number of packets dropped by inbound direction VLAN filtering. |
|
Dropped of security filtering |
Number of packets dropped by security filtering. |
¡ Execute the qos traffic-counter outbound command to collect statistics about the outbound traffic.
[Sysname] qos traffic-counter outbound counter0 slot 4 interface gigabitethernet 4/0/1
¡ Execute the display qos traffic-counter outbound multiple times to observe the discarded packet count in the outbound direction. If the count continuously increases, verify the port configurations according to Table 9. If the reasons for packet loss still cannot be determined, contact H3C Support.
[Sysname] display qos traffic-counter outbound counter0 slot 4
Slot 4 outbound counter0 mode:
Interface: GigabitEthernet4/0/1
VLAN: all
Local precedence: all
Drop priority: all
Traffic-counter summary:
Unicast: 0 packets
Multicast: 0 packets
Broadcast: 0 packets
Control packets: 18 packets
Bridge egress filtered packets: 0 packets
Tail drop packets: 0 packets
Tail drop multicast packets: 993827 packets
Forwarding restrictions packets: 0 packets
|
Field |
Description |
|
Slot 4 outbound counter0 mode |
Monitored objects of the counter in the outbound direction of a card. |
|
Interface |
Interface monitored by the counter. |
|
VLAN |
VLANs monitored by the counter. |
|
Local precedence |
Local precedence values monitored by the counter. |
|
Drop priority |
Drop priority values monitored by the counter. |
|
Traffic-counter summary |
Traffic statistics collected by the counter. |
|
Unicast |
Number of unicast packets. |
|
Multicast |
Number of multicast packets. |
|
Broadcast |
Number of broadcast packets. |
|
Control packets |
Number of control packets. |
|
Bridge egress filtered packets |
Number of packets filtered in the egress direction of the bridge. |
|
Tail drop packets |
Number of packets dropped by tail drop. |
|
Tail drop multicast packets |
Number of multicast packets dropped by tail drop. |
|
Forwarding restrictions packets |
Number of packets that are prevented from being forwarded. The switch does not support this field. It is reserved for future support. |
Layer 3 forwarding failure
Symptom
IP service failures, ping or tracert operation failures, or ping or tracert packet loss occurs.
A switch performs Layer 3 forwarding by using the driver IP forwarding table instead of the routing table. The route management module selects optimal routes through various protocols, and puts them into the FIB table. The FIB table synchronizes the routes to the driver IP forwarding table, which guides packet forwarding.
Figure 3 Relationship between the routing table and forwarding table
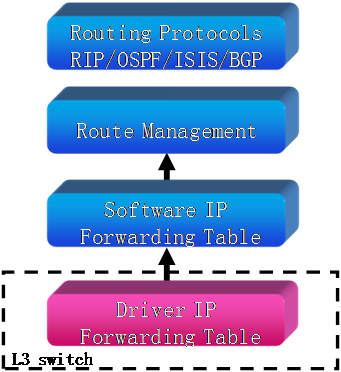
Solution
To resolve the problem:
1. Use the mirroring function or capture packets to verify that the destination MAC address of packets is the MAC address of the switch.
A switch can perform Layer 3 forwarding only when the destination MAC address of a packet is the MAC address of the switch. The switch might have multiple MAC addresses in an address range. The following output shows the MAC addresses of VLAN interfaces on a switch:
[Sysname] display interface vlan-interface 10
Vlan-interface10 current state: UP
Line protocol current state: UP
Description: Vlan-interface10 Interface
The Maximum Transmit Unit is 1500
Internet Address is 1.1.1.1/24 Primary
IP Packet Frame Type: PKTFMT_ETHNT_2, Hardware Address: 00e0-fc00-6503
IPv6 Packet Frame Type: PKTFMT_ETHNT_2, Hardware Address: 00e0-fc00-6503
Last clearing of counters: Never
2. Verify that the route to the specific destination exists in the routing table. If it does not exist, examine the routing protocol configurations and protocol states.
[Sysname] display ip routing-table 1.1.1.0
Summary Count : 1
Destination/Mask Proto Pre Cost NextHop Interface
1.1.1.0/24 Static 60 0 20.0.0.2 Vlan20
3. Verify that the route to the specific destination exists in the FIB table. If a route exists but cannot be used to guide the packet forwarding, contact H3C Support.
[Sysname] display fib 1.1.1.0
Destination count: 1 FIB entry count: 1
Flag:
U:Useable G:Gateway H:Host B:Blackhole D:Dynamic S:Static
R:Relay F:FRR
Destination/Mask Nexthop Flag OutInterface/Token Label
1.1.1.0/24 20.0.0.2 USG Vlan20 Null
4. Verify that the interfaces in the learned ARP entries are correct. If they are not, execute the reset arp command to clear ARP entries so that the device can learn the correct ARP entries. You can also configure static ARP entries. If the problem persists, contact H3C Support.
[Sysname] display arp 20.0.0.2
Type: S-Static D-Dynamic M-Multiport I-Invalid
IP address MAC address VLAN Interface Aging Type
20.0.0.2 0000-0000-0001 20 GE2/0/1 N/A S
5. Verify that no packets are dropped by the routing engine. If dropped packets exist, troubleshoot the corresponding software modules.
Execute the set hardware internal ipuc dropcnt command to specify an operating mode of the drop counter. The drop counter collects statistics of packets dropped due to different reasons when it operates in different modes.
Execute the display hardware internal ipuc cnt command. Check the RouterDropCnt field for the dropped packet statistics.
<Sysname> system-view
[Sysname] probe
[Sysname-probe] set hardware internal ipuc dropcnt 2 slot 2
Dropcnt set ok
[Sysname-probe] display hardware internal ipuc cnt 0 slot 2
Pp0 cnt info:
…
RouterDropCnt: 0
…
[Sysname-probe] set hardware internal ipuc dropcnt 5 slot 2
Dropcnt set ok
[Sysname-probe] display hardware internal ipuc cnt 0 slot 2
Pp0 cnt info:
…
RouterDropCnt: 3
…
6. If the problem persists, contact H3C Support.
MPLS forwarding failure
Symptom
You might experience the following problems with MPLS forwarding:
· Unreachable destination.
· No routes.
· Error message printed.
· Unstable tunnels.
· Packet sending or receiving failure.
Solution
VLL and L3VPN are implemented based on LSPs.
To resolve the common problems with MPLS, verify the LSP and route configurations on the LSRs.
Figure 4 MPLS network diagram
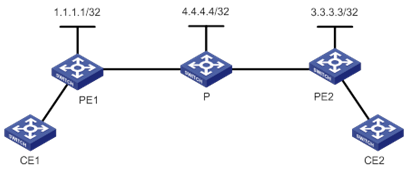
Troubleshooting MPLS LSPs
Perform the following configurations on the ingress node (PE 1 in Figure 4):
1. Execute the display mpls lsp command to display LSP information.
[PE1]display mpls lsp
FEC Proto In/Out Label Interface/Out NHLFE
100.100.100.100/32 LDP 3/- -
4.4.4.4/32 LDP NULL/3 Vlan103
90.0.0.0/24 LDP NULL/3 Vlan103
1.1.1.1/32 LDP 3/NULL InLoop0
50.0.0.0/24 LDP NULL/3 Vlan103
70.0.0.0/24 LDP NULL/3 Vlan103
3.3.3.3/32 LDP NULL/1025 Vlan103
If the configured LSP does not exist, verify the MPLS LSP configuration on each LSR.
2. Execute the display mpls ldp peer command and verify the MPLS LDP session.
[PE1]display mpls ldp peer
Total number of peers: 1
Peer LDP ID State Role GR MD5 KA Sent/Rcvd
4.4.4.4:0 Operational Passive Off Off 39/39
If the session status is not Operational, an error might occur. Go to steps 3 and 4 to further determine the problem. If the session status is Operational, go to step 5.
3. Execute the display current-configuration configuration ldp command, and verify that the local LSR and the peer LSR have the same MD5 password.
<PE1>display current-configuration configuration ldp
#
mpls ldp
md5-authentication 4.4.4.4 cipher $c$3$uNK0ggilqlClQ6Q/CcNQPPqux6mAqU2p
#
return
4. Execute the display mpls ldp interface command to display LDP interface information.
[PE1]display mpls ldp interface
Interface MPLS LDP Auto-config
Vlan10 Enabled Configured -
GE3/0/2 Enabled Configured -
XGE2/0/6 Enabled Configured -
If the configured information is incorrect, verify the MPLS LDP configuration on each LSR.
5. Execute the mpls lsr-id command, and verify that the LSR ID is the IP address of a loopback interface. H3C recommends that you configure the IP address of a loopback interface as the LSR ID.
<PE1>display current-configuration | include lsr-id
mpls lsr-id 2.2.2.2
<PE1>display ip interface brief
*down: administratively down
(s): spoofing
Interface Physical Protocol IP Address Description
Loop0 up up(s) 100.100.100.100 LoopBack0..
Loop2 up up(s) 100.100.100.102 LoopBack2..
M-E0/0/0 up up 192.168.147.7 M-Etherne..
<PE1>system-view
[PE1]mpls lsr-id 100.100.100.100
6. Verify that the VLAN interface is enabled with MPLS and MPLS LDP.
[PE1]interface vlan-interface 103
[PE1-Vlan-interface103]display this
#
interface Vlan-interface103
ip address 1.1.1.2 255.255.255.0
mpls enable
mpls ldp enable
#
return
Troubleshooting routes
Perform the following configurations on the ingress node (PE 1 in Figure 4):
1. Execute the display ip routing-table command to display routing table information.
[PE1]display ip routing-table
Destinations : 10 Routes : 10
Destination/Mask Proto Pre Cost NextHop Interface
1.1.1.1/32 Direct 0 0 127.0.0.1 InLoop0
3.3.3.3/32 OSPF 10 2 103.0.0.4 Vlan103
4.4.4.4/32 OSPF 10 1 103.0.0.4 Vlan103
50.0.0.0/24 OSPF 10 2 103.0.0.4 Vlan103
70.0.0.0/24 OSPF 10 2 103.0.0.4 Vlan103
90.0.0.0/24 OSPF 10 2 103.0.0.4 Vlan103
103.0.0.0/24 Direct 0 0 103.0.0.1 Vlan103
103.0.0.1/32 Direct 0 0 127.0.0.1 InLoop0
127.0.0.0/8 Direct 0 0 127.0.0.1 InLoop0
127.0.0.1/32 Direct 0 0 127.0.0.1 InLoop0
Verify that the route entries include IP addresses of the loopback interfaces on PE 1, P, and PE 2, and the IP address of the remote device's VLAN interface. Otherwise, verify the routing protocol configuration on each LSR.
2. Verify that the routing protocol (this example uses OSPF) operates correctly. If it does not, verify the routing protocol configuration on each LSR.
[PE1]display ospf peer
OSPF Process 1 with Router ID 1.1.1.1
Neighbor Brief Information
Area: 0.0.0.0
Router ID Address Pri Dead-Time Interface State
4.4.4.4 103.0.0.4 1 37 Vlan103 Full/BDR
3. Verify that the loopback interface and the VLAN interface are advertised in the routing protocol. Verify that the LDP interface is enabled with a routing protocol.
[PE1-ospf-1]display this
#
ospf 1
area 0.0.0.0
network 103.0.0.0 0.0.0.255
network 1.1.1.1 0.0.0.0
#
return
4. Execute the debugging command to verify that routing protocol packets are sent and received correctly. If they are not, verify the routing protocol configurations on the local LSR and remote LSR.
<PE1>debugging ospf packet
*Mar 5 04:33:09:446 2014 PE1 OSPF/7/DEBUG: -MDC=1; OSPF 1: Sending packe
ts.
*Mar 5 04:33:09:453 2014 PE1 OSPF/7/DEBUG: -MDC=1; Source address: 1.1.1.1
*Mar 5 04:33:09:545 2014 PE1 OSPF/7/DEBUG: -MDC=1; Destination address: 224.0.0.5
*Mar 5 04:33:09:618 2022 PE1 OSPF/7/DEBUG: -MDC=1; Version 2, Type: 1, Length: 44.
*Mar 5 04:33:09:699 2014 PE1 OSPF/7/DEBUG: -MDC=1; Router: 192.168.147.7, Area: 0.0.0.0, Checksum: 42732.
*Mar 5 04:33:09:750 2014 PE1 OSPF/7/DEBUG: -MDC=1; Authentication type: 00, Key(ASCII): 0 0 0 0 0 0 0 0.
*Mar 5 04:33:09:820 2014 PE1 OSPF/7/DEBUG: -MDC=1; Network mask: 255.255.255.0, Hello interval: 10, Option: _E_.
*Mar 5 04:33:09:931 2014 PE1 OSPF/7/DEBUG: -MDC=1; Router priority: 1, Dead Interval: 40, DR: 1.1.1.1, BDR: 0.0.0.0.
5. If the problem persists, contact H3C Support.
QACL service failure
QACL services in this section refer to services that filter packets matching predefined match criteria. These services include OpenFlow, packet filtering, policy-based routing (PBR), QoS policies, IP source guard, and portal authentication.
Symptom
A QACL service failed to achieve desired results.
Solution
To resolve the problem:
1. Verify that the packets are not matched by a higher-priority QACL service.
The switch supports applying different types of QACL services to an object. The following QACL service types are in descending order of priority:
¡ OpenFlow.
¡ Packet filtering configured globally.
¡ Globally applied QoS policy.
¡ IP source guard configured globally.
¡ Packet filtering configured at the interface level.
¡ PBR configured at the interface level.
¡ QoS policy applied at the interface level.
¡ IP source guard configured at the interface level.
¡ Portal authentication configured at the interface level.
¡ Packet filtering configured at the VLAN level.
¡ PBR configured at the VLAN level.
¡ QoS policy applied at the VLAN level.
¡ IP source guard configured at the VLAN level.
¡ Portal authentication configured at the VLAN level.
When packets match different types of QACL services, the highest-priority QACL service takes effect.
If the packets match another higher-priority QACL service, modify that QACL service.
2. Verify that the ACL hardware mode is correctly configured when IPv6 ACLs are used to match packets.
An incorrect ACL hardware mode causes cards not to support IPv6 ACLs. As a result, the QACL service that references the IPv6 ACLs will fail.
For an EB, EC2, or FD card to support IPv6 ACLs, the ACL hardware mode must be advanced.
For an EC1, EF, or FG card to support IPv6 ACLs, IPv6 must be enabled for the ACL hardware mode.
a. Use the display device command to determine the type of the card where the QACL service failed to function correctly. This example uses the card in slot 6.
[Sysname] display device
Slot No. Brd Type Brd Status Software Version
0 NONE Absent NONE
1 LST1MRPNC1 Master S12500-CMW710-B737002
2 NONE Absent NONE
3 NONE Absent NONE
4 NONE Absent NONE
5 NONE Absent NONE
6 LST1GT48LEF1 Normal S12500-CMW710-B737002
7 NONE Absent NONE
…
b. Use the display acl hardware-mode command to view the current ACL hardware mode.
[Sysname] display acl hardware-mode
Current ACL hardware mode:
Mode: Basic
IPv6 status: Disabled
Next startup ACL hardware mode:
Mode: Advanced
IPv6 status: Disabled
c. Configure the ACL hardware mode:
- For an EB, EC2, or FD card, if the Mode field is displayed as Basic, configure the acl hardware-mode advanced command, save the configuration, and reboot the switch.
- For an EC1, EF, or FG card, if the IPv6 status field is displayed as Disabled, configure the acl hardware-mode ipv6 enable command, save the configuration, and reboot the switch.
3. (For QoS policies only) Verify that the QoS policy is correctly applied.
Configure the terminal debugging or terminal monitor command, remove the applied QoS policy, and reapply the QoS policy.
If the QoS policy has unsupported or conflicted settings, the switch displays error messages indicating that the QoS policy is not correctly applied.
These error messages include the following types:
¡ Match criteria for a class with the AND operator conflict.
[Sysname] %Mar 19 15:44:53:648 2014 Sysname QOS/4/QOS_POLICY_APPLYGLOBAL_CBFAIL:-MDC=1-Slot=6; Failed to apply classifier-behavior c1 in policy p1 to the inbound direction globally. In a classifier with AND operator, you cannot configure multiple ACL match rules.
You can also use the display qos policy global command to display the applied QoS policy.
[Sysname] display qos policy global slot 3 inbound
Direction: Inbound
Policy: p1
Classifier: c1 (Failed)
Operator: AND
Rule(s) :
If-match acl 3000
If-match acl 3001
Behavior: b1
Filter enable: Deny
To resolve the conflict, redefine the class and specify the OR operator.
¡ A class does not support a match criterion.
<Sysname> terminal debugging
<Sysname> terminal monitor
[Sysname] system-view
[Sysname] undo qos apply policy p1 global inbound
[Sysname] qos apply policy p1 global inbound
[Sysname] %Aug 3 18:53:41:817 2024 Sysname QOS/4/QOS_POLICY_APPLYGLOBAL_CBFAIL: -MDC=1-Slot=3; Failed to apply classifier-behavior c1 in policy p1 to the inbound direction globally. Customer-VLAN match rule is not supported.
You can also use the display qos policy global command to display the applied QoS policy.
[Sysname] display qos policy global slot 3
Direction: Inbound
Policy: p1
Classifier: c1 (Failed)
Operator: AND
Rule(s) :
If-match customer-vlan-id 100
If-match acl 3000
Behavior: b1
Marking:
Remark service-vlan-id 201
To resolve the problem, delete the unsupported match criterion from the class.
¡ A behavior has conflicted actions.
<Sysname> terminal debugging
<Sysname> terminal monitor
[Sysname] system-view
[Sysname] interface gigabitethernet6/0/12
[Sysname-GigabitEthernet6/0/12] undo qos apply policy p1 inbound
[Sysname-GigabitEthernet6/0/12] qos apply policy p1 inbound
[Sysname-GigabitEthernet6/0/12] %Mar 19 16:58:41:624 2014 Sysname QOS/4/QOS_POLICY_APPLYIF_CBFAIL: -MDC=1-Slot=6; Failed to apply classifier-behavior c1 in policy p1 to the inbound direction of interface GigabitEthernet6/0/12. Redirect to CPU conflicts with filter permit.
You can also use the display qos policy interface command to display the applied QoS policy.
[Sysname] display qos policy interface inbound
Interface: GigabitEthernet6/0/12
Direction: Inbound
Policy: p1
Classifier: c1 (Failed)
Operator: AND
Rule(s) :
If-match acl 3000
Behavior: b1
Filter enable: Permit
Redirecting:
Redirect to the CPU
To resolve the conflict, delete one of the conflicted actions.
4. Verify that the time range, if configured, is correct.
[Sysname] display time-range t1
Current time is 09:59:37 8/14/2013 Wednesday
Time-range: t1 (Inactive)
09:25 to 09:30 working-day
If the time range is incorrect, modify the time range by using the time-range command.
5. View ACL and QoS resources usage.
[Sysname] display qos-acl resource slot 5
Interfaces: GE5/0/1 to GE5/0/24
---------------------------------------------------------------------
Type Total Reserved Configured Remaining Usage
---------------------------------------------------------------------
ACL rule 8192 96 7 8089 1%
Inbound ACL 8192 96 6 8089 1%
Outbound ACL 8192 0 1 8089 0%
IN-MQC-CAR 8192 0 0 8192 0%
IN-COMM-CAR 7168 0 0 7168 0%
IN-COUNT 8192 0 33 8159 0%
OUT-MQC-CAR 8192 0 33 8159 0%
OUT-COUNT 8192 0 33 8159 0%
Interfaces: GE5/0/25 to GE5/0/48
---------------------------------------------------------------------
Type Total Reserved Configured Remaining Usage
---------------------------------------------------------------------
ACL rule 8192 96 7 8089 1%
Inbound ACL 8192 96 6 8089 1%
Outbound ACL 8192 0 1 8089 0%
IN-MQC-CAR 8192 0 0 8192 0%
IN-COMM-CAR 7168 0 0 7168 0%
IN-COUNT 8192 0 33 8159 0%
OUT-MQC-CAR 8192 0 33 8159 0%
OUT-COUNT 8192 0 33 8159 0%
When the Remaining field is 0 or the Usage field is 100%, the resources are insufficient.
If the resources are insufficient, contact H3C Support.
6. If the problem persists, save the fault information and contact H3C Support.
SPB forwarding failure
Symptom
Forwarding failure occurs on an SPB VSI extended between two customer network sites, as shown in Figure 5.
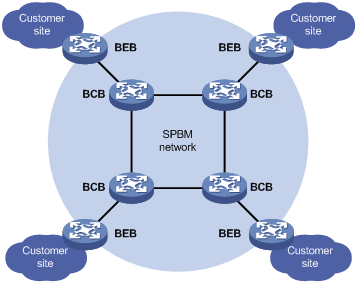
Solution
To resolve the problem:
1. Verify that the source and destination BEBs and all BCBs have established adjacencies with their neighbors:
a. Execute the display spbm peer command.
<Sysname> display spbm peer
Peer information for SPBM
-------------------------
System ID Port Circuit ID State Holdtime
000f.e212.3f80 GE1/3/0/11 2 Up 25s
000f.e212.3f40 GE1/3/0/5 2 Up 28s
b. Check the Port and State fields in the command output.
- If no port is displayed in an entry, check the interface connected to the neighbor for connectivity issues.
- If a neighbor is not in Up state, go to the next step.
|
|
NOTE: The source and destination BEBs and all BCBs are collectively called "SPBM nodes" in the subsequent steps. |
2. Verify that the SPBM nodes have the same MST region configuration:
a. Execute the display stp region-configuration command. Verify that the SPBM nodes have the same region name, revision level, and VLAN-to-MSTI mapping table.
<Sysname> display stp region-configuration
Oper Configuration
Format selector : 0
Region name : spbm
Revision level : 0
Configuration digest : 0xb0eefe27946a874f0a8d015b0d44dab0
Instance VLANs Mapped
0 1 to 6, 13 to 4094
4092 7 to 12
b. If configuration inconsistency exists, modify the configuration by using the region-name, revision-level, or instance command. Make sure all B-VLANs are mapped to MSTI 4092.
3. Verify that the VSI's settings (I-SID and B-VLAN) are the same on the source and destination BEBs, and the multicast replication mode is the same across the SPBM nodes. For example:
[Sysname] vsi web
[Sysname-vsi-web] display this
#
vsi web
spb i-sid 1000
b-vlan 9
multicast replicate-mode tandem
4. Verify that the BEBs have connectivity to their customer network sites and have established a MAC-in-MAC tunnel to each other:
a. Execute the display l2vpn vsi command.
<Sysname> display l2vpn vsi name web verbose
VSI Name: web
VSI Index : 287
VSI State : Up
MTU : 1500
Bandwidth : 102400 kbps
Broadcast Restrain : 5%
Multicast Restrain : -
Unknown Unicast Restrain: -
MAC Learning : Enabled
MAC Table Limit : Unlimited
Drop Unknown : -
SPB I-SID : 1000
SPB Connections:
BMAC BVLAN Link ID Type
000f-e212-3f80 9 64 Unicast
000f-e212-3fc0 9 65 Unicast
73ca-c900-03e8 9 - Multicast
ACs:
AC Link ID State
GE1/3/0/1 srv2 0 Up
b. Check the B-MAC field and AC information in the command output:
- If the B-MAC of the remote BEB does not exist, contact H3C Support.
- If none of the ACs is up, check the customer network ports for connectivity issues.
c. Execute the display l2vpn minm forwarding command.
<Sysname> display l2vpn minm forwarding vsi web
Total number of MinM connections: 3
Types: MC - multicast, UC - unicast
Status Flag: * - inactive
VSI name: web
Link ID I-SID BMAC BVLAN Owner Type Interface
64 1000 000f-e212-3f80 9 SPB UC GE1/3/0/11
65 1000 000f-e212-3fc0 9 SPB UC GE1/3/0/5
- 1000 73ca-c900-03e8 9 SPB MC GE1/3/0/5
GE1/3/0/11
d. Check the B-MAC field in the command output.
e. If the B-MAC of the remote BEB does not exist, contact H3C Support.
5. If the problem persists, contact H3C Support.
Related commands
This section lists the commands that you might use for troubleshooting IP forwarding.
|
Command |
Description |
|
accounting packet |
Configures a traffic accounting action in the traffic behavior database to count traffic in packets. |
|
acl |
Creates an ACL, and enters its view. |
|
acl hardware-mode ipv6 |
Enables or disables IPv6 for the ACL hardware mode. |
|
classifier behavior |
Associates a traffic behavior with a traffic class in a QoS policy. |
|
debugging ospf packet |
Enables OSPF packet debugging to examine whether OSPF packets can be correctly sent and received. |
|
display acl |
Displays configuration and match statistics for ACLs. |
|
display acl hardware-mode |
Displays information about the ACL hardware mode and the IPv6 status for the mode. |
|
display arp |
Displays ARP entries to check whether output interfaces can be correctly learned through ARP. |
|
display current-configuration | include lsr-id |
Displays the current MPLS LSR ID. |
|
display current-configuration configuration ldp |
Displays information about MPLS LDP to verify the consistency of MD5 passwords. |
|
display fib |
Displays FIB entries to examine whether an entry matching a specific destination network exists in the FIB table. |
|
display l2vpn minm forwarding |
Displays MAC-in-MAC forwarding entries. |
|
display l2vpn vsi |
Displays VSI information. |
|
display hardware internal ipuc cnt |
Displays routing engine counters. |
|
display hardware internal pcl pce-entry slot |
Displays the contents and action of a specific entry for a chip on a card. |
|
display interface |
Displays information about the specified interface. |
|
display ip interface brief |
Displays brief IP configuration information for the specified Layer 3 interface or all Layer 3 interfaces. |
|
display ip routing-table |
Displays brief information about active routes in the routing table to examine whether a route to the specified network exists in the routing table. |
|
display ip source binding |
Displays IPv4 source guard binding entries. |
|
display ipv6 source binding |
Displays IPv6 source guard binding entries. |
|
display ipv6 policy-based-route interface |
Displays IPv6 interface PBR configuration and statistics. |
|
display mac-address |
Displays MAC address entries to examine whether interfaces can be correctly learned. |
|
display mirroring-group |
Displays mirroring group information. |
|
display mpls ldp interface |
Displays LDP interface information to examine whether the corresponding label advertisement mode exists. |
|
display mpls ldp peer |
Displays LDP peer information to examine whether the configured LSPs are up. |
|
display mpls ldp session |
Displays LDP session information. |
|
display mpls lsp |
Displays information about LSPs. |
|
display ospf peer |
Displays information about OSPF neighbors. |
|
display packet-filter |
Displays ACL application information for packet filtering. |
|
display packet-filter statistics |
Displays match statistics and default action statistics of ACLs for packet filtering. |
|
display qos-acl resource |
Displays QoS and ACL resource usage. |
|
display qos policy control-plane |
Displays information about the QoS policies applied to the specified control plane. |
|
display qos policy global |
Displays information about global QoS policies. |
|
display qos policy interface |
Displays information about the QoS policy or policies applied to an interface. |
|
display qos traffic-counter |
Displays the traffic statistics collected by the specified counter, and displays the configuration of the counter. |
|
display spbm peer |
Displays ISIS-SPB neighbor information. |
|
display stp region-configuration |
Displays effective MST region configuration information. |
|
display this |
Displays the running configuration in the current view. |
|
display time-range |
Displays time range configuration and status. |
|
if-match |
Defines a match criterion. |
|
interface |
Enters interface view. |
|
ipv6 verify source ip-address |
Enables the IPv6 source guard function. |
|
mpls lsr-id |
Configures an LSR ID for the local LSR. |
|
ping |
Verifies whether the destination IP address is reachable, and displays related statistics. |
|
qos apply policy |
Applies a QoS policy to a port. |
|
qos policy |
Creates a QoS policy and enters QoS policy view. |
|
qos traffic-counter |
Enables the traffic accounting function and specifies the type of traffic. |
|
reboot |
Reboots a card or the entire system. |
|
rule |
Creates an ACL rule. |
|
save |
Saves the running configuration to a configuration file. |
|
set hardware internal ipuc dropcnt |
Sets the operating mode of a drop counter. |
|
traffic behavior |
Creates a traffic behavior and enters traffic behavior view. |
|
traffic classifier |
Creates a class and enters class view. |
Troubleshooting IRF
This section provides troubleshooting information for common problems with IRF.
IRF fabric establishment failure
Symptom
An H3C S12500 IRF fabric cannot be established.
Solution
To resolve the problem:
1. Verify that all member chassis run the same software version and use the same type of MPUs:
a. Execute the display device command. Check the Brd Type and Software Version fields for the MPU type and software version.
<Sysname> display device
Slot No. Brd Type Brd Status Software Version
3/0 NONE Absent NONE
3/1 LST2MRPNC1 Master S12500-CMW710-R7328
3/2 NONE Absent NONE
3/3 LST1XP32REB1 Normal S12500-CMW710-R7328
3/4 NONE Absent NONE
3/5 NONE Absent NONE
3/6 NONE Absent NONE
3/7 NONE Absent NONE
3/8 NONE Absent NONE
3/9 NONE Absent NONE
3/10 NONE Absent NONE
3/11 NONE Absent NONE
3/12 NONE Absent NONE
3/13 NONE Absent NONE
3/14 NONE Absent NONE
3/15 NONE Absent NONE
3/16 NONE Absent NONE
3/17 LST1SF08E1 Normal S12500-CMW710-R7328
3/18 NONE Absent NONE
b. If the member chassis run different software versions, upgrade the software to the same version. If they use different types of MPUs, replace MPUs.
2. Verify that at least one IRF physical port is up for an IRF port:
|
|
NOTE: An IRF port goes down only if all its physical ports are down. |
a. Execute the display interface command. Check the Current state field for the status of an IRF physical port. For example:
<Sysname> display interface gigabitethernet 2/6/0/1
GigabitEthernet2/6/0/1
Current state: UP
Line protocol state: UP
IP Packet Frame Type: PKTFMT_ETHNT_2, Hardware Address: 0000-e80d-c000
Description: GigabitEthernet2/6/0/1 Interface
Bandwidth: 1000000kbps
Loopback is not set
Media type is optical fiber, Port hardware type is 1000_BASE_SX_SFP
……
b. If any physical port bound to an IRF port is down, bring it up.
3. Verify that all IRF physical ports are connected correctly:
|
|
IMPORTANT: When you connect two neighboring IRF members, you must connect the physical ports of IRF-port 1 on one member to the physical ports of IRF-port 2 on the other. |
a. Execute the display irf configuration command. Check the IRF-Port1 and IRF-Port2 fields for IRF port bindings.
<Sysname> display irf configuration
MemberID NewID IRF-Port1 IRF-Port2
1 1 Ten-GigabitEthernet1/8/0/1 disable
Ten-GigabitEthernet1/8/0/2
2 2 disable Ten-GigabitEthernet2/12/0/1
Ten-GigabitEthernet2/12/0/2
b. Verify that the physical IRF connections are consistent with the IRF port bindings. In this example, Ten-GigabitEthernet 1/8/0/1 and Ten-GigabitEthernet 1/8/0/2 on member chassis 1 must be connected to Ten-GigabitEthernet 2/12/0/1 and Ten-GigabitEthernet 2/12/0/2 on member chassis 2.
c. If connection errors exist, reconnect the IRF physical ports.
4. Verify that all member chassis use the same system operating mode:
a. Execute the display system-working-mode command on each member chassis. Check the command output for mode inconsistency.
[Sysname] display system-working-mode
The current system working mode is standard.
The next system working mode is standard..
b. If mode inconsistency exists, execute the system-working-mode command to change the system operating mode. The system-working-mode command setting takes effect after a system reboot.
5. Verify that all MDC settings and settings for the acl hardware-mode ipv6 and irf mode enhanced commands are the same across all chassis:
a. Execute the display current-configuration command. Check the configuration on each member chassis for configuration inconsistency.
[Sysname] display current-configuration
……
acl hardware-mode ipv6 enable
……
irf mode enhanced
……
b. If configuration inconsistency exists, modify the configuration.
6. If the problem persists, contact H3C Support.
IRF split
Symptom
An IRF fabric splits.
Solution
To resolve the problem:
1. Use the system log to identify the IRF split time.
You can use this information to search the system log for events that might cause the split.
%Jun 26 10:13:46:233 2013 H3C STM/2/STM_LINK_STATUS_TIMEOUT: IRF port 1 is down because heartbeat timed out.
%Jun 26 10:13:46:436 2013 H3C STM/3/STM_LINK_STATUS_DOWN: -MDC=1; IRF port 2 is down.
2. Verify that all interface cards that have IRF physical ports are in Normal state:
a. Execute the display device command. Check the Brd Status field for the card state.
<Sysname> display device
Slot No. Brd Type Brd Status Software Version
3/0 NONE Absent NONE
3/1 LST2MRPNC1 Master S12500-CMW710-R7328
3/2 NONE Absent NONE
3/3 LST1XP32REB1 Normal S12500-CMW710-R7328
3/4 NONE Absent NONE
3/5 NONE Absent NONE
3/6 NONE Absent NONE
3/7 NONE Absent NONE
3/8 NONE Absent NONE
3/9 NONE Absent NONE
3/10 NONE Absent NONE
3/11 NONE Absent NONE
3/12 NONE Absent NONE
3/13 NONE Absent NONE
3/14 NONE Absent NONE
3/15 NONE Absent NONE
3/16 NONE Absent NONE
3/17 LST1SF08E1 Normal S12500-CMW710-R7328
3/18 NONE Absent NONE
b. If an interface card is not in Normal state, use the methods described in "Card state abnormality" to resolve the problem.
3. Verify that each IRF port has at least one physical port in up state:
a. Execute the display interface command. Check the Current state field for the state of an IRF physical port. For example:
<Sysname> display interface gigabitethernet 2/6/0/1
GigabitEthernet2/6/0/1
Current state: UP
Line protocol state: UP
IP Packet Frame Type: PKTFMT_ETHNT_2, Hardware Address: 0000-e80d-c000
Description: GigabitEthernet2/6/0/1 Interface
Bandwidth: 1000000kbps
Loopback is not set
Media type is optical fiber, Port hardware type is 1000_BASE_SX_SFP
……
b. If any physical port bound to an IRF port is down, use the methods described in "Troubleshooting links and ports" to recover the link state and bring up the physical port.
4. Remove hardware problems that might cause recurring IRF split events:
a. Execute the display version command. Check the uptime of the member chassis, MPUs, and interface cards that have IRF links.
<Sysname> display version
H3C Comware Software, Version 7.1.045, Release 7328
Copyright (c) 2004-2013 Hangzhou H3C Tech. Co., Ltd. All rights reserved.
H3C S12504 uptime is 0 weeks, 0 days, 5 hours, 54 minutes
Last reboot reason : Power on
Boot image: cfa0:/S12500-CMW710-BOOT-R7328_mrpnc.bin
Boot image version: 7.1.045P12, Release 7328
Compiled Jan 07 2014 17:01:20
System image: cfa0:/S12500-CMW710-SYSTEM-R7328_mrpnc.bin
System image version: 7.1.045, Release 7328
Compiled Jan 07 2014 17:02:33
LST2MRPNC1 1: uptime is 0 weeks, 0 days, 5 hours, 54 minutes
Last reboot reason : Power on
3456 Mbytes SDRAM
1024 Kbytes NVRAM Memory
Type : LST2MRPNC1
BootRom : 2.20
Software : S12500-CMW710-R7328
PCB : Ver.B
Board Cpu:
Number of Cpld: 2
Cpld 0:
SoftWare : 003
Cpld 1:
SoftWare : 003
PowChipA : 004
CpuCard
Type : LSR1CPA
PCB : Ver.C
Number of Cpld: 1
Cpld 0:
SoftWare : 001
BootRom : 2.12
Mbus card
Type : LSR1MBCB
Software : 115
PCB : Ver.B
LST1GT48LEC1 3: uptime is 0 weeks, 0 days, 5 hours, 53 minutes
Last reboot reason : Power on
1024 Mbytes SDRAM
0 Kbytes NVRAM Memory
Type : LST1GT48LEC1
Software : S12500-CMW710-R7328
PCB : Ver.A
Board Cpu:
Number of Cpld: 1
Cpld 0:
SoftWare : 003
PowChipA : 004
PowChipB : 004
CpuCard
Type : LSR1CPAE
PCB : Ver.C
Number of Cpld: 1
Cpld 0:
SoftWare : 001
BootRom : 2.12
Mbus card
Type : LSR1MBCB
Software : 115
PCB : Ver.B
LST2SF08C1 8: uptime is 0 weeks, 0 days, 5 hours, 53 minutes
Last reboot reason : Power on
128 Mbytes SDRAM
0 Kbytes NVRAM Memory
Type : LST2SF08C1
BootRom : 2.12
Software : S12500-CMW710-R7328
PCB : Ver.B
Board Cpu:
Number of Cpld: 1
Cpld 0:
SoftWare : 001
PowChipA : 001
LST2SF08C1 9: uptime is 0 weeks, 0 days, 5 hours, 53 minutes
Last reboot reason : Power on
128 Mbytes SDRAM
0 Kbytes NVRAM Memory
Type : LST2SF08C1
BootRom : 2.12
Software : S12500-CMW710-R7328
PCB : Ver.B
Board Cpu:
Number of Cpld: 1
Cpld 0:
SoftWare : 001
PowChipA : 001
b. Compare the uptime of chassis, MPUs, and interface cards to determine whether a member chassis, MPU, or interface card rebooted before the IRF split.
c. If the IRF split is caused by a chassis or card reboot, identify the reboot cause:
- If the reboot occurred because of a hardware problem, replace the faulty component.
- If the reboot occurred because of power failure, use the methods described in "PMU or power module failure" to remove the power supply problems.
5. If the problem persists, contact H3C Support.
Related commands
This section lists the commands that you might use for troubleshooting IRF.
|
Command |
Description |
|
display device |
Displays device configuration. Use this command to verify that all member chassis run the same software version and use the same type of MPUs. |
|
display interface |
Displays interface information. Use this command to verify that each IRF port has at least one physical port in up state. |
|
display irf configuration |
Displays IRF configuration on each member chassis. Use this command to identify physical ports bound to IRF-port 1 and IRF-port 2 on each member chassis before you check IRF physical connections. |
|
display system-working-mode |
Displays system operating mode. Use this command to verify that all member chassis are operating in the same mode. |
|
display current-configuration |
Displays the running configuration. In system view, verify that the MDC settings and the settings for the acl hardware-mode ipv6 and irf mode enhanced commands are the same across all chassis. |
|
display version |
Displays the system version and uptime as well as the uptime of each card. Use this command to identify the runtime of each member chassis, MPU, and interface card that has IRF physical ports. Compare their uptime to determine whether a member chassis, MPU, or interface card rebooted before an IRF split. |
Troubleshooting system management
This section provides troubleshooting information for common problems with system management.
High CPU usage
Symptom
A CPU usage higher than 60% persists on a card.
<Sysname>display cpu-usage
Slot 0 CPU usage:
0% in last 5 seconds
61% in last 1 minute
0% in last 5 minutes
Slot 0 CPU 1 CPU usage:
0% in last 5 seconds
0% in last 1 minute
0% in last 5 minutes
Execute the display cpu-usage history command to display the CPU usage statistics within the last 60 minutes.
<Sysname>display cpu-usage history slot 0
100%|
95%|
90%|
85%|
80%|
75%|
70%|
65%|
60%|
55%|
50%|
45%|
40%|
35%| #
30%| # #
25%| # #
20%| # # # #
15%| ## # # ##
10%| ## # # ##
5%|############################################################
------------------------------------------------------------
10 20 30 40 50 60 (minutes)
cpu-usage (CPU 0) last 60 minutes (SYSTEM)
Solution
High CPU usage might occur because of the following issues:
· Route flapping.
· Too many routing policies.
· Packet attack.
· Link loop.
To resolve the problem:
1. Execute the display route-policy command to display the configured routing policies to verify that the configured routing policies are reasonable.
<Sysname> display route-policy
Route-policy: policy1
permit : 1
if-match cost 10
continue: next node 11
apply comm-list a delete
2. Execute the display hardware internal nst packet-statistic command to display statistics about packets with different CPU codes.
If you provide the clear keyword, the system clears the statistics after the command is executed, and queries the statistics at a specific interval.
<Sysname>system-view
[Sysname]probe
[Sysname-probe]display hardware internal nst packet-statistic chassis 3 slot 3 clear
Code Packets Code Packets Code Packets Code Packets
0 0 1 0 2 0 3 0
4 0 5 214 6 0 7 0
8 0 9 0 10 0 11 0
12 0 13 0 14 0 15 0
16 0 17 0 18 0 19 0
20 0 21 0 22 0 23 0
24 0 25 0 26 0 27 0
28 0 29 0 30 0 31 0
32 0 33 0 34 0 35 0
36 0 37 0 38 0 39 0
40 0 41 0 42 0 43 0
44 0 45 0 46 0 47 0
48 0 49 0 50 0 51 0
52 0 53 0 54 0 55 0
……
252 0 253 0 254 0 255 0
The output shows that among the packets sent to the CPUs, the number of packets with the CPU code 5 is the greatest.
Table 10 CPU code description
|
CPU code |
Description |
Speed (pps) |
Queue |
|
5 |
ARP broadcasts |
600 |
2 |
|
16 |
RIPv2/RIPng/OSPFv2/v3 protocol packets |
700 |
5 |
|
17 |
RIP1 protocol packets |
300 |
5 |
|
29 |
LDP/RS protocol packets |
600 |
4 |
|
30 |
PIM/PIMv6 protocol packets |
400 |
4 |
|
31 |
NA/RA protocol packets |
400 |
2 |
|
32 |
DHCP protocol packets |
400 |
2 |
|
33 |
NTP protocol packets |
100 |
4 |
|
65 |
ARP Detection packets redirected to the destination port through ICPL |
600 |
1 |
|
160 |
Host routes |
150 |
0 |
|
161 |
Subnet routes |
500 |
0 |
3. Capture packets and use Wireshark to identify the attack source and configure attack detection as needed.
4. Execute the display interface command, and check for loop links.
<Sysname>display interface gigabitethernet2/6/0/1
GigabitEthernet2/6/0/1
Current state: UP
Line protocol current state: UP
IP Packet Frame Type: PKTFMT_ETHNT_2, Hardware Address: 0000-e80d-c000
Description: GigabitEthernet2/6/0/1 Interface
Loopback is not set
Media type is optical fiber, Port hardware type is 1000_BASE_SX_SFP
1000Mbps-speed mode, full-duplex mode
……
Last clearing of counters: Never
Peak value of input: 123241940 bytes/sec, at 2014-02-27 14:33:15
Peak value of output: 80 bytes/sec, at 2014-02-27 14:13:00
Last 300 seconds input: 26560 packets/sec 123241940 bytes/sec 99%
Last 300 seconds output: 0 packets/sec 80 bytes/sec 0%
……
If any loop occurs, verify the following:
¡ The link connections and port configuration are correct.
¡ STP is enabled, and the configuration is correct.
¡ The STP status of the neighboring device is normal.
¡ If all the previous configurations are correct, the reason might be:
- STP calculation error.
- STP calculation is correct, but the driver does not block a port.
You can do all of the following:
¡ Shut down the uplink port on the ring.
¡ Remove and insert the transceiver module into the port to restart STP calculation.
¡ Contact H3C Support.
5. If the problem persists, save the diagnostic information, and contact H3C Support by following these steps:
a. Execute the display process cpu command to identify the process with high CPU usage.
<Sysname>display process cpu chassis 2 slot 2
CPU utilization in 5 secs: 5.2%; 1 min: 13.9%; 5 mins: 17.1%
JID 5Sec 1Min 5Min Name
1 0.0% 0.0% 0.0% scmd
……
17 0.0% 0.0% 0.0% [DIBC]
18 0.0% 0.0% 0.0% [PCHK]
19 0.0% 0.0% 0.0% [lipc_topology]
27 0.0% 1.5% 1.2% [DFBR]
28 4.3% 11.5% 15.0% [DFRS]
29 0.0% 0.0% 0.0% [DIAG]
30 0.0% 0.0% 0.0% [mdcos_wdg]
……
The output shows that the DFRS process with the JID 28 on the card in slot 2 of member device 2 has high CPU usage.
b. Execute the follow process command five times to identify the kernel stack information for the DFRS process with the JID 28.
<Sysname>system-view
[Sysname]probe
[Sysname-probe]follow process 28 chassis 3 slot 3
Attaching to process 28 ([EVH0])
Iteration 1 of 5
------------------------------
Kernel stack:
[<c0019d74>] __switch_to+0x74/0xf0
[<c006d5d4>] down_interruptible+0x104/0x110
[<f7be0544>] osSemWait+0x44/0xf0 [cpa]
[<f7958ce0>] cpssEventSelect+0x120/0x2e0 [cpa]
[<f7971380>] appDemoEvHndlr+0x50/0x310 [cpa]
[<c006727c>] kthread+0x12c/0x130
[<c0002ac4>] ppc_kernel_thread+0x44/0x60
Iteration 2 of 5
------------------------------
Kernel stack:
[<c0019d74>] __switch_to+0x74/0xf0
[<c006d5d4>] down_interruptible+0x104/0x110
[<f7be0544>] osSemWait+0x44/0xf0 [cpa]
[<f7958ce0>] cpssEventSelect+0x120/0x2e0 [cpa]
[<f7971380>] appDemoEvHndlr+0x50/0x310 [cpa]
[<c006727c>] kthread+0x12c/0x130
[<c0002ac4>] ppc_kernel_thread+0x44/0x60
……
6. If the problem persists, contact H3C Support.
High memory usage
Symptom
A memory usage higher than 70% persists on a card.
Use the display memory command to display the memory usage of a card.
<Sysname>display memory chassis 2 slot 2
The statistics about memory is measured in KB:
Chassis 2 Slot 2:
Total Used Free Shared Buffers Cached FreeRatio
Mem: 774280 591932 182348 0 0 6548 23.6%
-/+ Buffers/Cache: 175800 598480
Swap: 0 0 0
Solution
To resolve the problem:
1. Execute the display process memory command multiple times to do the following:
¡ Display the memory usage for all user processes on a card.
¡ Identify the process for which memory usage is continuously increasing.
If the memory usage of a process is continuously increasing, the memory might be leaked.
Dynamic memory is heap memory dynamically assigned to the device. Its value becomes large when memory is leaked.
<Sysname>display process memory chassis 2 slot 2
JID Text Data Stack Dynamic Name
1 168 604 24 64 scmd
2 0 0 0 0 [kthreadd]
3 0 0 0 0 [ksoftirqd/0]
……
78 112 9368 12 320 diagd
79 76 1040 8 8 mdcagentd
80 116 8860 8 16 fsd
81 140 992 16 212 dbmd
83 72 496 8 20 syslogd
84 168 41980 16 44 drvdiagd
85 172 17112 16 12 devd
94 112 8864 12 12 edev
……
The output shows that the process with the ID 78 uses the most memory.
2. Execute the display process memory heap command multiple times to do the following:
¡ Display heap memory usage for user process 78.
¡ Identify the memory block for which memory usage is continuously increasing.
If the memory usage of a memory block is continuously increasing, the memory might be leaked.
<Sysname>display process memory heap job 78 verbose
Heap usage:
Size Free Used Total Free Ratio
16 0 385 385 0.0%
24 2 49 51 3.9%
32 0 13 13 0.0%
40 0 7 7 0.0%
64 0 411 411 0.0%
72 0 4 4 0.0%
80 1 0 1 100.0%
96 1 0 1 100.0%
104 0 8 8 0.0%
136 0 8 8 0.0%
152 0 9 9 0.0%
184 0 1 1 0.0%
368 0 8 8 0.0%
3080 0 1 1 0.0%
8200 1 0 1 100.0%
29376 1 0 1 100.0%
Large Memory Usage:
Used Blocks : 24
Used Memory(in bytes): 2031616
Free Blocks : 0
Free Memory(in bytes): 0
Summary:
Total virtual memory heap space(in bytes) : 2113536
Total physical memory heap space(in bytes) : 454656
Total allocated memory(in bytes) : 2075736
3. Contact H3C Support.
Insufficient resources
Symptom
The system displays the following log and trap information when resources are insufficient:
%Mar 16 20:43:11:218 2014 H3C DRV_L3/4/NO_RESOURCE: -MDC=1-Slot=3; Insufficient system resources!
%Mar 16 20:44:51:259 2014 H3C DRV_L3/4/NO_RESOURCE: -MDC=1-Slot=6; No enough resource!
%Mar 16 20:47:18:712 2014 H3C DRV_L3/4/NO_RESOURCE: -MDC=1-Slot=3; Not enough are available to complete the operation.
Solution
ACL resources
The following features use ACL resources:
· QoS.
· Packet filter.
· Priority mapping and trust.
· Mirror.
· Protocol packet to CPU.
· Selective QinQ and VLAN mapping.
· Port binding, PORTAL, and EAD.
· Broadcast suppression.
· MAC-BASED-VLAN, VOICE VLAN, RSPAN, and UDP-Helper.
To resolve the problem:
1. Use the display qos-acl resource command to display the ACL usage on a card.
<Sysname> display qos-acl resource chassis 3 slot 3
Interfaces: XGE3/3/0/1, XGE3/3/0/3
XGE3/3/0/5, XGE3/3/0/7
XGE3/3/0/9, XGE3/3/0/11
XGE3/3/0/13, XGE3/3/0/15
---------------------------------------------------------------------
Type Total Reserved Configured Remaining Usage
---------------------------------------------------------------------
ACL rule 2048 0 55 1993 2%
Inbound ACL 2048 0 6 1993 0%
Outbound ACL 2048 0 49 1993 2%
IN-MQC-CAR 8192 0 0 8192 0%
IN-COMM-CAR 7168 0 0 7168 0%
IN-COUNT 8192 0 82 8110 1%
OUT-MQC-CAR 8192 0 82 8110 1%
OUT-COUNT 8192 0 82 8110 1%
……
2. If most ACL resources are allocated, optimize ACL configuration. For example, delete or combine ACL rules. If the configuration cannot be optimized, contact H3C Support.
FIB resources
To resolve the problem:
1. Use the display hardware internal ipuc fib number command to display FIB usage.
[Sysname-probe] display hardware internal ipuc fib number slot 31
Ipv4 route prefix : 17
Ipv6 route prefix : 2
Allocated route entry : 13
Ipv4Uc allocated nexthop: 4 0 0 0 0 0 0 0 0
0 0
Ipv6Uc allocated nexthop: 0 0 0 0 0 1 0 0 0
0 0
Ipv4Mc allocated nexthop: 3
Ipv6Mc allocated nexthop: 0
Tunnel allocated nexthop: 0
Ipv4Vn allocated nexthop: 0 0 0 0 0 0 0 0 0
0 0
Max support vrf : 512
Max support ipv4 prefix : 262144
Max support ipv6 prefix : 65536
Max support nexthop : 13312
2. If most FIB resources are allocated, contact H3C Support.
MAC resources
MAC resource insufficiency problems easily occur in large Layer 2 networks. There is a large amount of MAC addresses in these networks. New MAC addresses cannot be learned because old MAC addresses have not aged.
To resolve the problem:
1. Display MAC addresses that have been learned.
<Sysname>display mac-address count
49 mac address(es) found
The output shows that the number of MAC addresses that have been learned is small.
2. H3C recommends that you do the following:
¡ Set a smaller MAC address aging time.
¡ Create VLANs by service or by department, and connect VLANs at Layer 3.
MPLS LSP resources
To resolve the problem:
1. Display MPLS LSP statistics.
<Sysname>display mpls lsp statistics
LSP Type Ingress/Transit/Egress Active
Static LSP 0/0/0 0/0/0
Static CRLSP 0/0/0 0/0/0
LDP LSP 0/0/1 0/0/1
RSVP CRLSP 0/0/0 0/0/0
BGP LSP 0/0/0 0/0/0
Local LSP 0/0/0 0/0/0
-----------------------------------------------------
Total 0/0/1 0/0/1
2. If MPLS LSP resources are insufficient, contact H3C Support.
Other system resources
Contact H3C Support.
Related commands
This section lists the commands that you might use for troubleshooting system management.
|
Command |
Remarks |
|
display cpu-usage |
Displays CPU usage statistics and tasks with high CPU usage. |
|
display cpu-usage history |
Displays the historical CPU usage statistics in charts. |
|
display hardware internal ipuc fib number |
Displays unicast entry statistics for a VRF. |
|
Displays statistics about packets sent to the CPUs with different CPU codes. |
|
|
display interface |
Displays information about a specific interface. |
|
display mac-address |
Displays MAC address entries. |
|
display memory |
Displays memory usage for a card. |
|
display mpls lsp statistics |
Displays MPLS LSP statistics. |
|
display process cpu |
Displays CPU usage for all processes. |
|
display process memory |
Displays memory usage for all user processes on a card. |
|
display process memory heap |
Displays heap memory usage for a user process. |
|
display qos-acl resource |
Displays QoS and ACL resource usage. |
|
display route-policy |
Displays routing policy information. |
|
follow process |
Displays stack information for a process. |
