- Released At: 13-09-2023
- Page Views:
- Downloads:
- Table of Contents
- Related Documents
-
AD-Campus 6.2
SeerAnalyzer Configuration Guide
Document version: 5W100-20230221
Copyright © 2023 New H3C Technologies Co., Ltd. All rights reserved.
No part of this manual may be reproduced or transmitted in any form or by any means without prior written consent of New H3C Technologies Co., Ltd.
Except for the trademarks of New H3C Technologies Co., Ltd., any trademarks that may be mentioned in this document are the property of their respective owners.
The information in this document is subject to change without notice.
Contents
Unified southbound and northbound network
Single-stack southbound network
Configuring analysis services for wired network devices
Importing wired network device assets
Configuring a protocol template
Configuring an asset protocol template
Configuring the physical topology
Configuring analysis services for wireless devices
Configuring authentication data collection
Configuring diagnosis optimization
Setting the mobile APP detection
Configuring AI-driven optimization
Configuring wired user services
Configuring wired authentication devices
Configuring an authentication-free allowlist for wired users
Configuring audio and video quality analysis
Configuring wired audio and video quality analysis
Configuring wireless audio and video quality analysis
Starting the audio and video quality analysis and parsing task
Configuring campus application analysis
Configuring wireless application analysis
Starting a TCP stream analysis task
Creating a network-wide health report task
Deploying SeerAnalyzer in hierarchy mode
Configuring sub-analyzer data sources
Configuring O&M and monitoring
Configuring gRPC for network analysis
Deploying the gRPC configuration through Unified Platform
Overview
Introduction
H3C SeerAnalyzer (SeerAnalyzer for short) focuses on the value mining of machine data. Based on big data technologies, SeerAnalyzer finds out valuable information from massive data to help enterprises in networking, service O&M, and business decision making. SeerAnalyzer collects device performance, user access, and service traffic data in real time and visualizes network operations through big data analysis and artificial intelligence (AI) algorithms. SeerAnalyzer can predict potential network risks and generate notifications.
SeerAnalyzer can analyze network device operation data, network service application traffic data, and network access and usage log data. SeerAnalyzer supports data analysis in scenarios including Campus, WAN, DC, NPA, TRA, and LGA.
This document describes how to configure SeerAnalyzer in the Campus scenario with a focus mainly on ensuring user experience. Based on user access and network usage data collected by Telemetry, SeerAnalyzer uses big data and AI technologies to analyze the user experience health and related issues. Also, SeerAnalyzer discovers the root causes for degraded experience and provides optimization suggestions according to the network device health statistics.
Terms
|
Term |
Description |
|
SNMP |
Simple Network Management Protocol (SNMP) is used to remotely manage and operate network devices. |
|
NETCONF |
Network Configuration Protocol (NETCONF) is used to configure and manage network devices and supports programming. |
|
ERSPAN |
Layer 3 remote mirroring technology that encapsulates mirrored packets in GRE packets with a protocol number of 0x88BE and routes the packets to the remote monitoring device for data monitoring. |
|
SYSLOG |
Syslog protocol, which is used to record system logs. |
|
Telemetry |
Telemetry Steam is a network monitoring technology that collects data from devices and sends the data to collectors. |
|
gRPC |
Google Remote Procedure Call (gRPC) provides network device configuration and management methods that support multiple programming languages. |
|
eMDI |
Enhanced Media Delivery Index. |
|
SIP |
Session Initiation Protocol (SIP) is a multimedia communication protocol defined by the Internet Engineering Task Force (IETF). |
|
iNQA |
Intelligent Network Quality Analyzer (iNQA) is an inspection mechanism that measures network performance quickly in large-scaled IP networks. |
|
iNQA Collector |
Manages and controls the MPs, periodically collects the data from the MPs, and reports the data to the analyzer. |
|
iNQA Analyzer |
Collects, aggregates, and calculates the data from the collector instances. |
Network introduction
|
|
CAUTION: In this document, the network solution uses the southbound single stack, and the IPv4 protocol is used for the data collection network. |
· Northbound network—Northbound service VIP configured on Unified Platform. The cluster uses the IP address to provide external services.
· Southbound network—Indicates the network through which the data collection component of SeerAnalyzer or an independent collector receives the data collected from devices. Make sure the southbound network and a device from which data is collected can reach each other. Based on your network configuration, choose one of the following southbound network solutions:
¡ No independent southbound network—The southbound and northbound networks are unified. SeerAnalyzer uses the network of Unified Platform for data collection without an independent network.
¡ Southbound single-stack network—In this network solution, an independent network is required and the IPv4 or IPv6 protocol is used for data collection.
¡ Southbound dual-stack network—In this network solution, an independent network is required and both IPv4 and IPv6 addresses are configured for data collection.
Network diagram
Unified southbound and northbound network
Figure 1 Unified southbound and northbound network
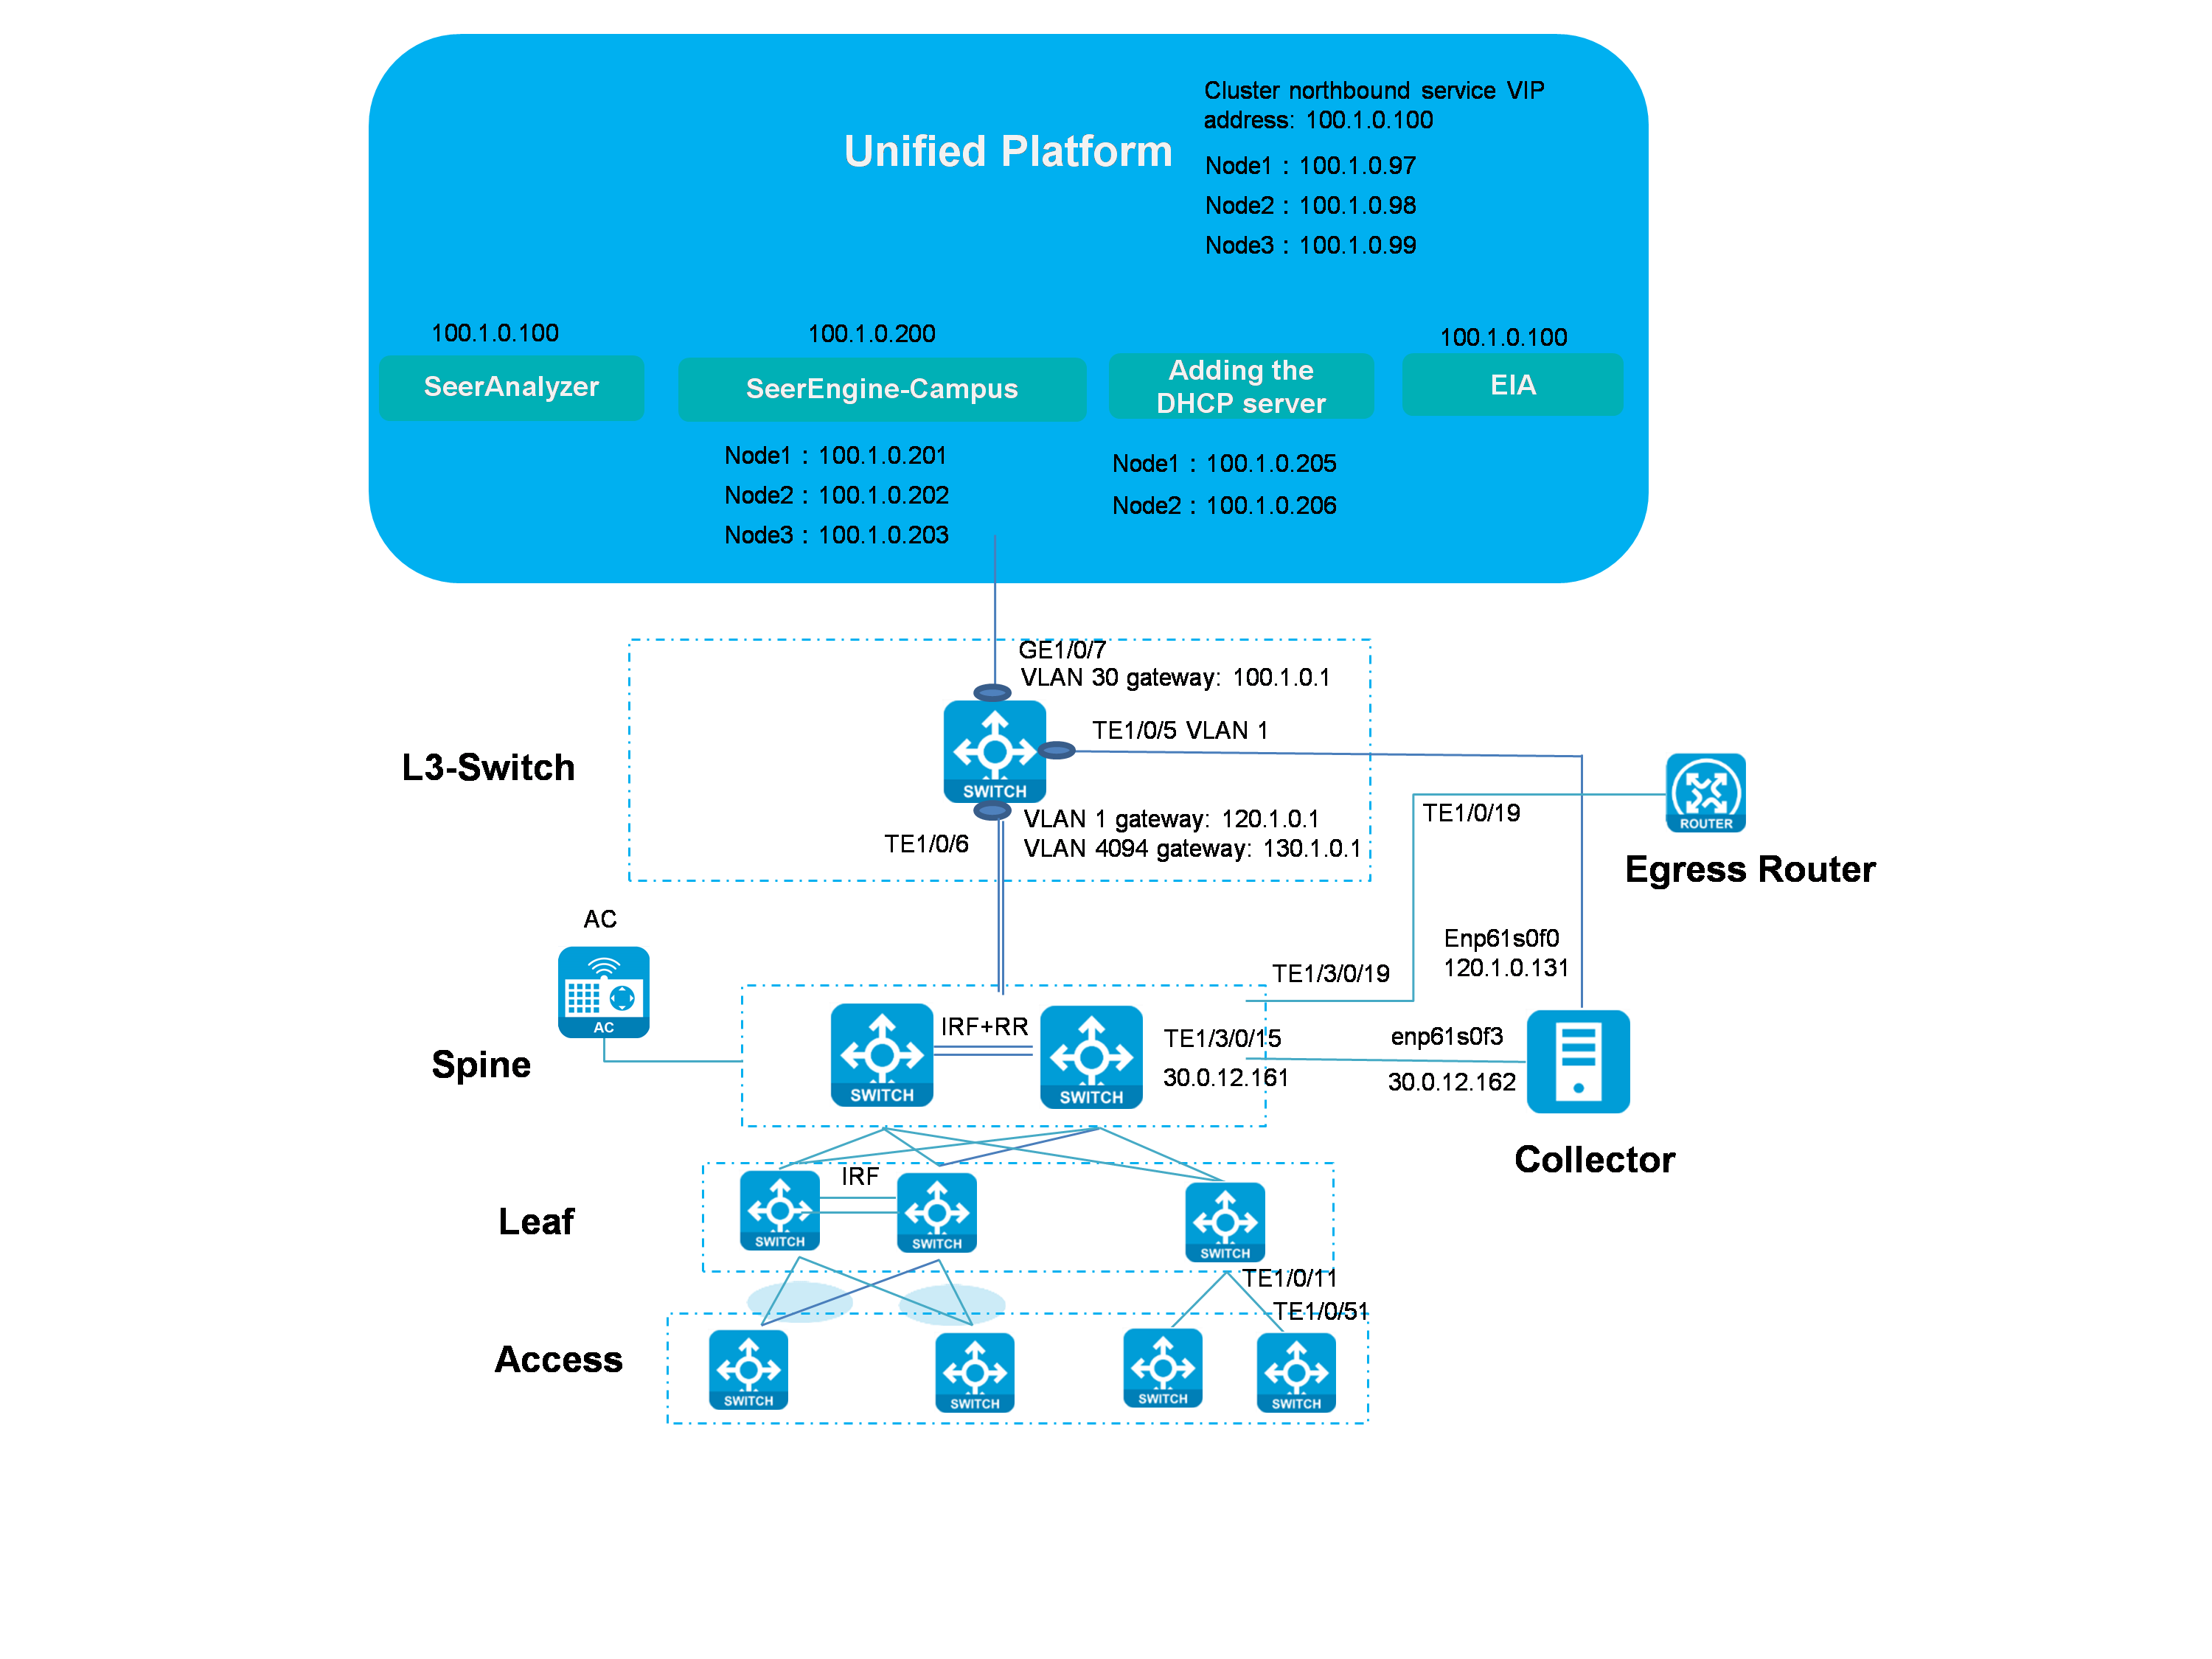
Network description:
· If the deployed server has only one NIC, choose the unified southbound and northbound network solution in which SeerAnalyzer and Unified Platform share one NIC. In this case, SeerAnalyzer, SeerEngine-Campus, vDHCP, and EIA use the IP addresses in the same subnet.
· The collector in the network is used to collect TCP data, which is required for the analysis of application statistics. The collector is not required if TCP data collection is not involved.
Table 1 Network planning and IP address list
|
Item |
Example |
Description |
|
Unified Platform cluster node IP addresses |
Node1: 100.1.0.96 Node2: 100.1.0.97 Node3: 100.1.0.98 |
IP addresses of the hosts where Unified Platform is deployed |
|
Unified Platform cluster internal VIP address |
100.1.0.99 |
IP address for communication among the nodes in the Unified Platform cluster |
|
Unified Platform cluster northbound service VIP address |
100.1.0.100 |
IP address used by the Unified Platform cluster to provide external services |
|
SeerAnalyzer data collection IP address |
100.1.0.100 |
IP address used by SeerAnalyzer for data collection |
|
EIA |
100.1.0.100 |
IP address of the EIA server |
|
SeerEngine-Campus cluster IP address |
100.1.0.200 |
SeerEngine-Campus cluster IP address |
|
SeerEngine-Campus node IP addresses |
Node1: 100.1.0.201 Node2: 100.1.0.202 Node3: 100.1.0.203 |
IP addresses of three nodes in the SeerEngine-Campus cluster |
|
vDHCP cluster IP address |
100.1.0.204 |
vDHCP cluster IP address |
|
vDHCP |
Node1: 100.1.0.205 Node2: 100.1.0.206 |
IP addresses of the two nodes in the vDHCP cluster |
|
Management switch VLAN 30 gateway |
100.1.0.1 |
VLAN 30 gateway for communication between Unified Platform and external devices |
|
Management switch VLAN 1 gateway |
120.1.0.1 |
VLAN 1 gateway for automated deployment |
|
Management switch VLAN 4094 gateway |
130.1.0.1 |
VLAN 4094 gateway for communication between the controller and other devices |
|
Network device management subnet |
130.1.0.0/24 |
Network device management subnet |
|
Spine management IP address |
130.1.0.51 |
Spine management IP address |
|
Leaf management IP address |
130.1.0.52 |
Leaf management IP address |
|
Interface connecting the spine device and collector |
30.0.12.161 |
Interface connecting the spine device and collector |
|
Collector management IP address |
120.1.0.131 |
Management IP address of the collector |
|
Collector service IP address |
30.0.12.162 |
Service IP address of the collector |
|
Collector floating IP address |
30.0.12.163 |
VIP address of the collector |
Single-stack southbound network
Figure 2 Single-stack southbound network (two NICs)
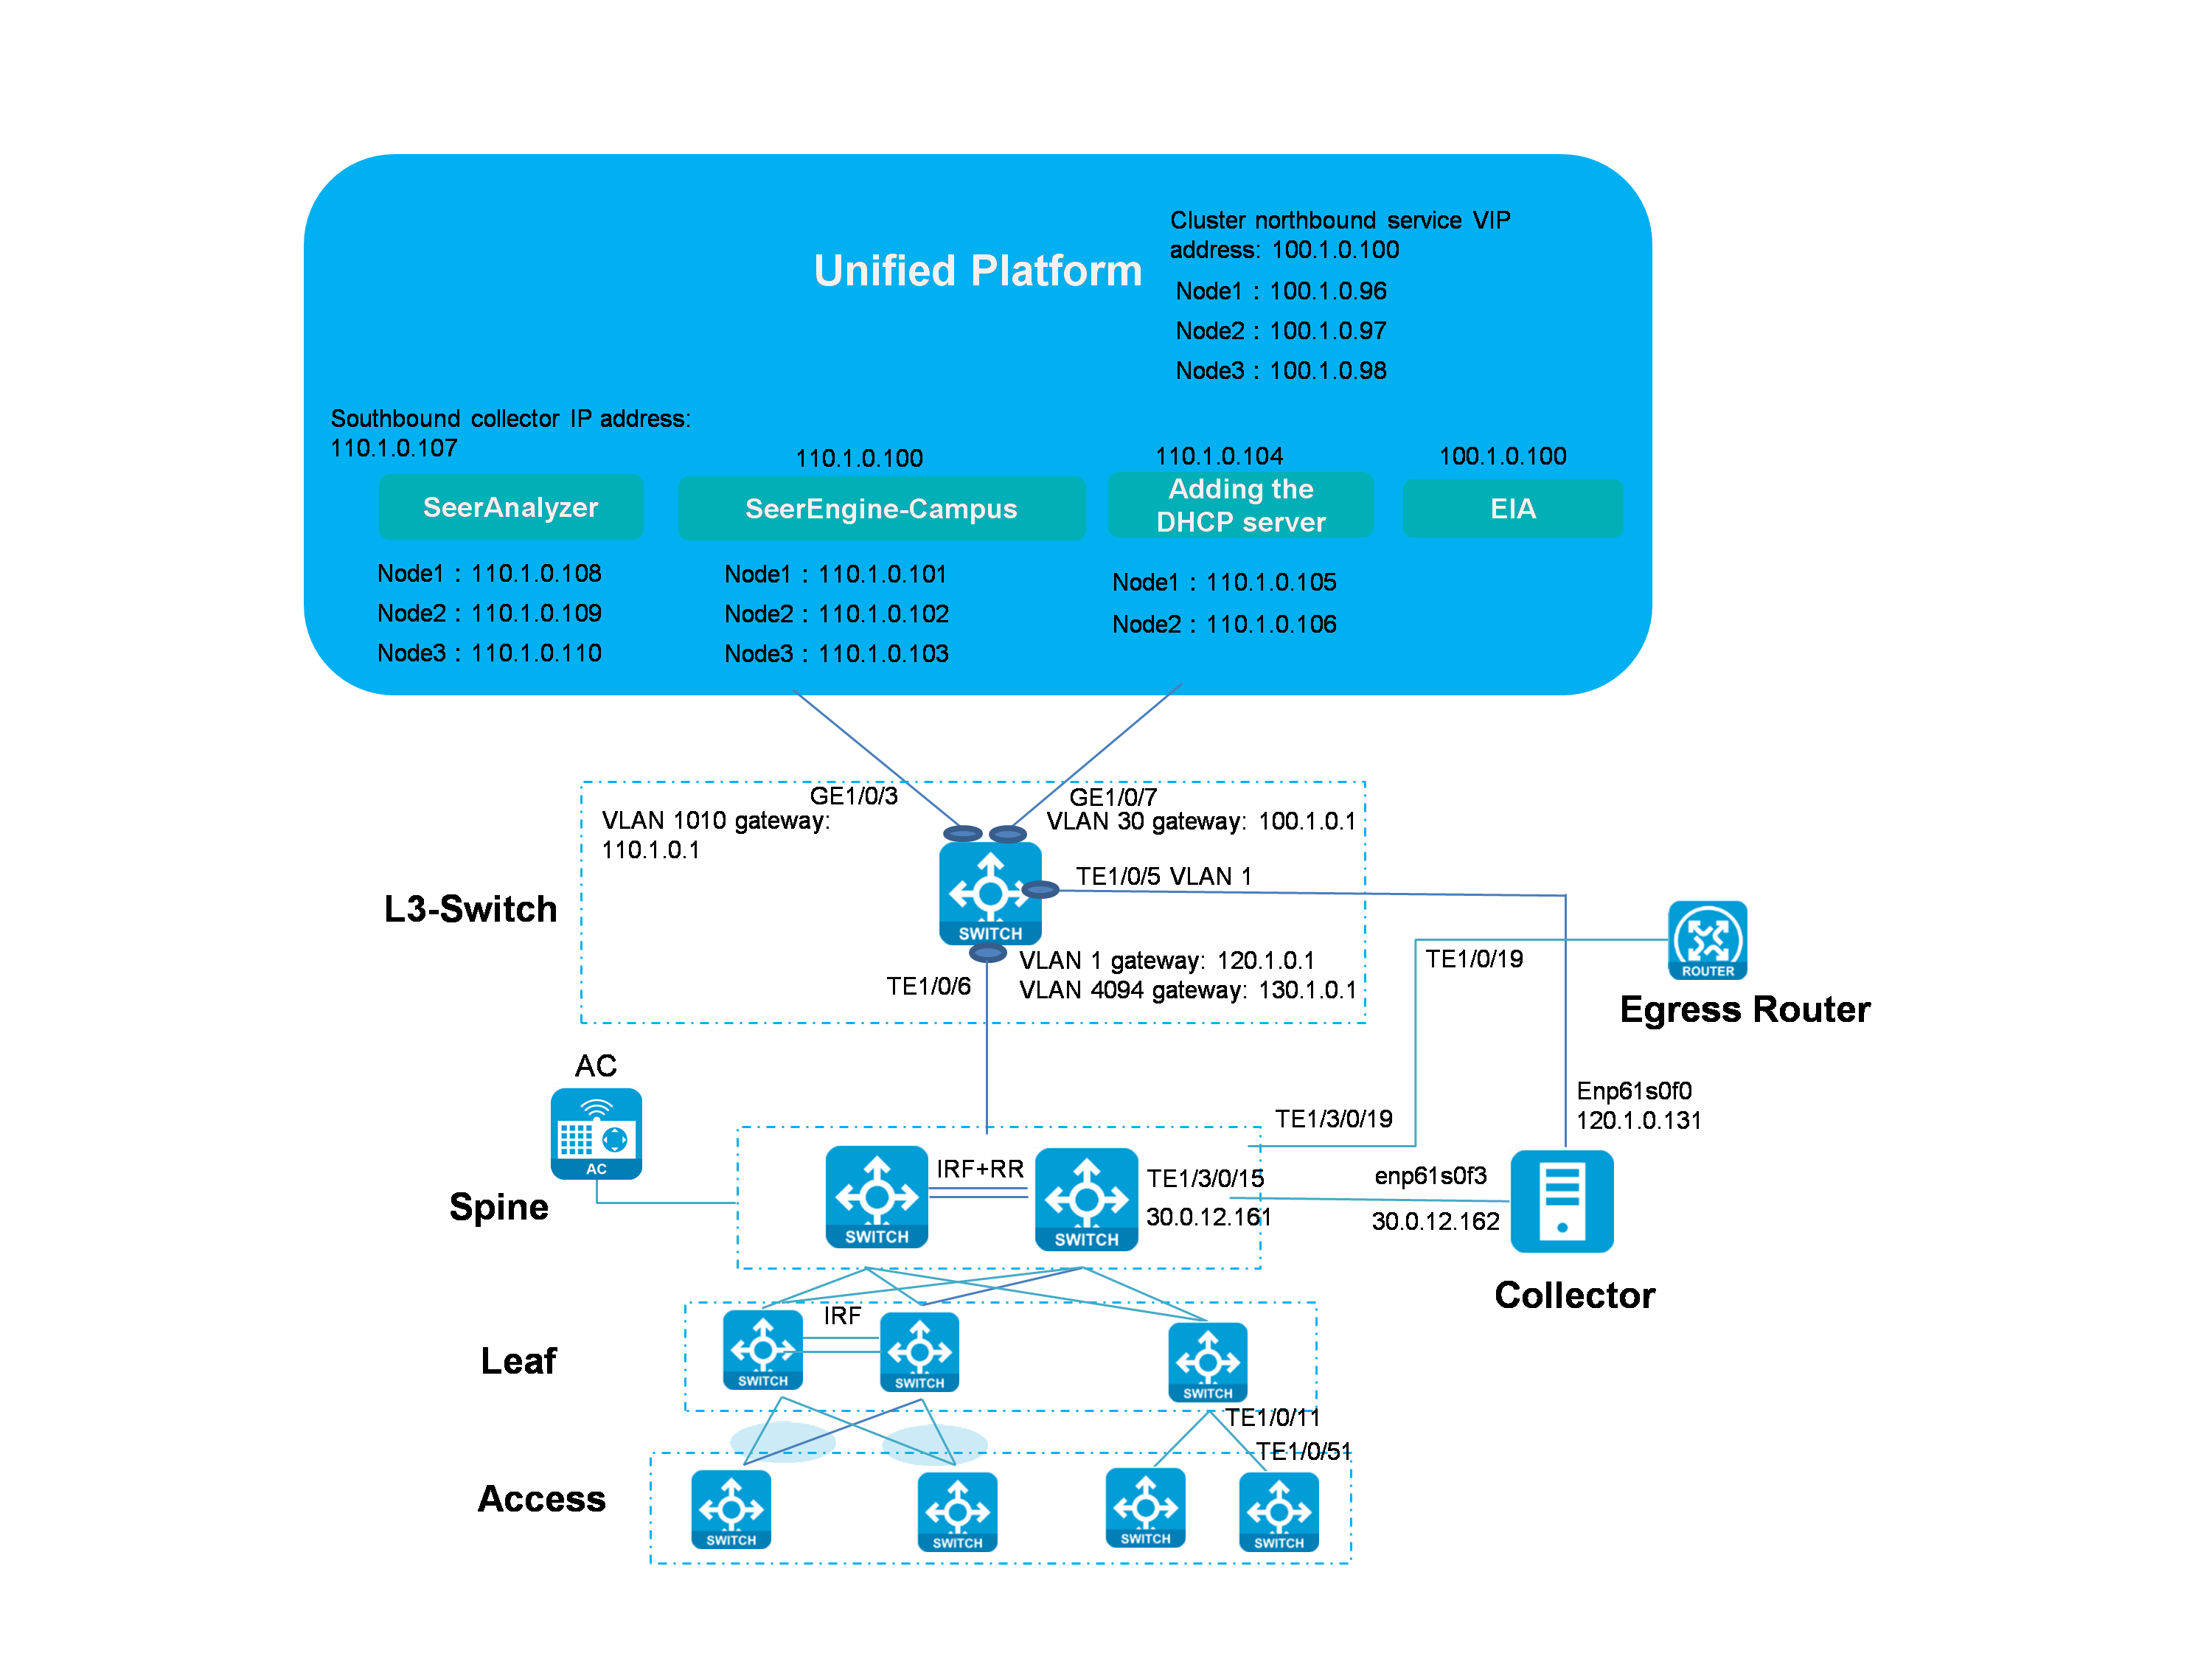
Network description:
· SeerAnalyzer and Unified Platform use different NICs. SeerAnalyzer and SeerEngine-Campus share the same NIC.
¡ SeerAnalyzer and SeerEngine-Campus can use the IP addresses in the same subnet. When you deploy SeerAnalyzer, use the network of SeerEngine-Campus instead of creating a network.
¡ SeerAnalyzer and SeerEngine-Campus can also use the IP addresses of different subnets. In this case, create a network for deploying SeerAnalyzer.
· The collector in the network is used to collect TCP data, which is required for the analysis of application statistics. The collector is not required if TCP data collection is not involved.
· In this document, SeerAnalyzer and SeerEngine-Campus use the IP addresses in the same subnet, which is used as an example for IP address planning.
Table 2 Network planning and IP address list
|
Item |
Example |
Description |
|
Unified Platform cluster node IP addresses |
Node1: 100.1.0.96 Node2: 100.1.0.97 Node3: 100.1.0.98 |
IP addresses of the hosts where Unified Platform is deployed |
|
Unified Platform cluster internal VIP address |
100.1.0.99 |
IP address for communication among the nodes in the Unified Platform cluster |
|
Unified Platform northbound service VIP address |
100.1.0.100 |
IP address used by the Unified Platform cluster to provide external services |
|
SeerAnalyzer southbound passive collector IP address |
110.1.0.107 |
VIP address of the SeerAnalyzer southbound passive collector cluster |
|
SeerAnalyzer southbound passive collector node container IP addresses |
Node1: 110.1.0.108 Node2: 110.1.0.109 Node3: 110.1.0.110 |
Container IP addresses of the SeerAnalyzer southbound passive collector nodes |
|
SeerAnalyzer southbound active collector IP address |
110.1.0.111 |
VIP address of the SeerAnalyzer southbound active collector cluster |
|
SeerAnalyzer southbound active collector node container IP addresses |
Node1: 110.1.0.112 Node2: 110.1.0.113 Node3: 110.1.0.114 |
Container IP addresses of the SeerAnalyzer southbound active collector nodes |
|
EIA |
100.1.0.100 |
IP address of the EIA server |
|
SeerEngine-Campus cluster IP address |
110.1.0.100 |
SeerEngine-Campus cluster IP address |
|
SeerEngine-Campus node IP addresses |
Node1: 110.1.0.101 Node2: 110.1.0.102 Node3: 110.1.0.103 |
SeerEngine-Campus node IP addresses |
|
vDHCP cluster IP address |
110.1.0.104 |
vDHCP cluster IP address |
|
vDHCP |
Node1: 110.1.0.105 Node2: 110.1.0.106 |
IP addresses of the two nodes in the vDHCP cluster |
|
Management switch VLAN 30 gateway |
100.1.0.1 |
VLAN 30 gateway for communication between Unified Platform and external devices |
|
Management switch VLAN 1010 gateway |
110.1.0.1 |
VLAN 1010 gateway for communication between the southbound network and other networks (configured when the southbound network uses an independent NIC) |
|
Management switch VLAN 1 gateway |
120.1.0.1 |
VLAN 1 gateway for automated deployment |
|
Management switch VLAN 4094 gateway |
130.1.0.1 |
VLAN 4094 gateway for communication between the controller and other devices |
|
Network device management subnet |
130.1.0.0/24 |
Network device management subnet |
|
Interface connecting the spine device and collector |
30.0.12.161 |
Interface connecting the spine device and collector |
|
Collector management IP address |
120.1.0.131 |
Management IP address of the collector |
|
Collector service IP address |
30.0.12.162 |
Service IP address of the collector |
|
Collector floating IP address |
30.0.12.163 |
VIP address of the collector |
Configuring analysis services for wired network devices
The analysis services for wired network devices provide the following functions:
· Network Health—Provides the Overview, Device, Boards, Chips, Interface, Queue, Transceiver Modules, Links, and PoE tabs regarding wired network devices. The overall health trend of network devices, current network device status, list of network devices in the current system, and device details are displayed.
· Changes Analysis—Displays the statistics and details about the historical snapshot data comparisons of network devices.
· Area Overview—Displays the health status of network devices by area in a list.
· Topology Overview—Displays the logical connections among all network devices (including switches, routers, and APs) in the current system using topology diagrams.
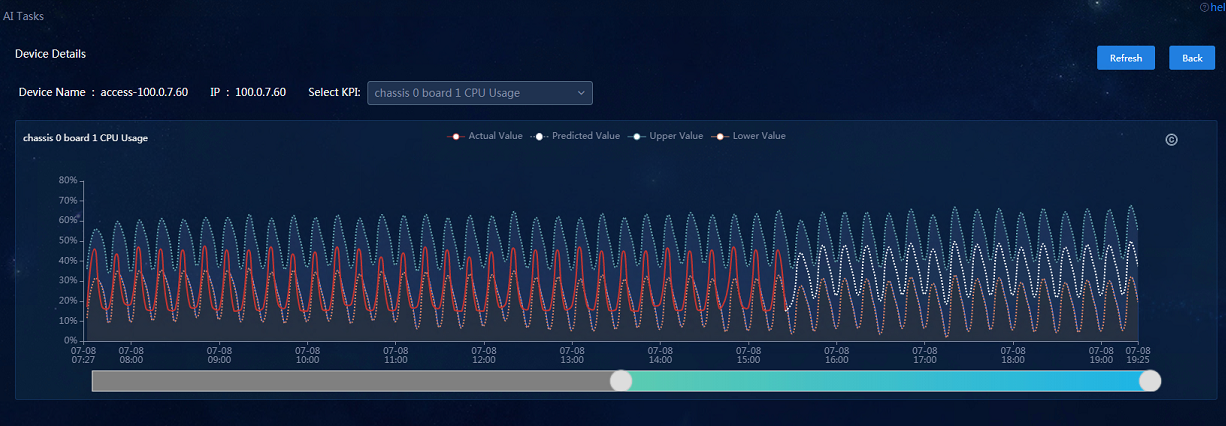
· Intelligent Prediction—Uses statistical learning and machine learning methods to analyze the regularity in time series data (KPI) of wired network devices, fits and predicts the future trend of the data, and generates the baselines, prediction results, and anomaly locations.
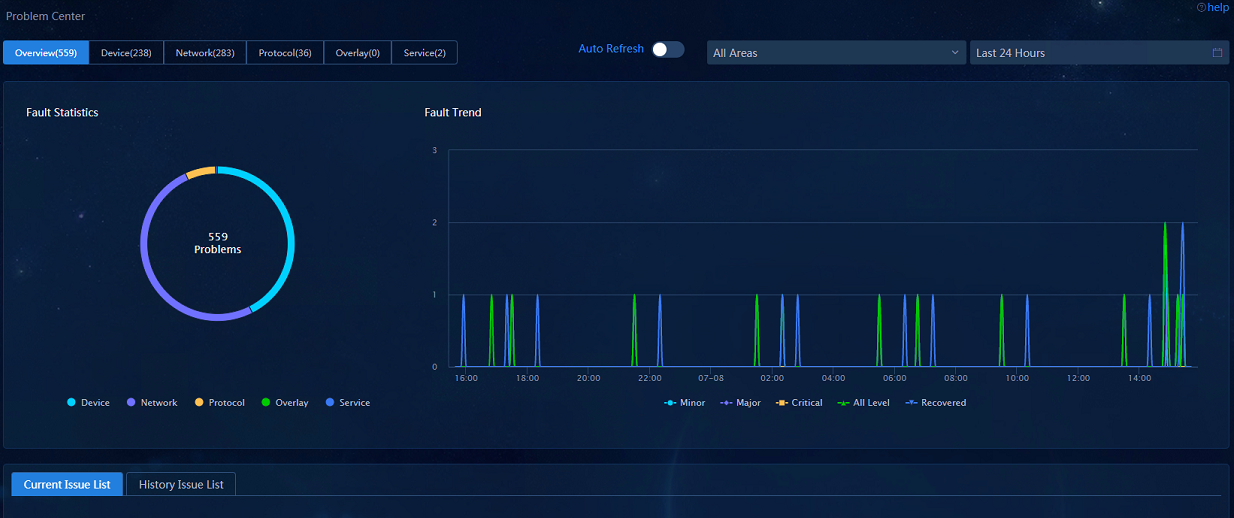
· Problem Center—Displays statistics on network-wide faults that occurred in the specified time span and allows you to view fault information classified by device, network, protocol, overlay, and service by switching between tabs.
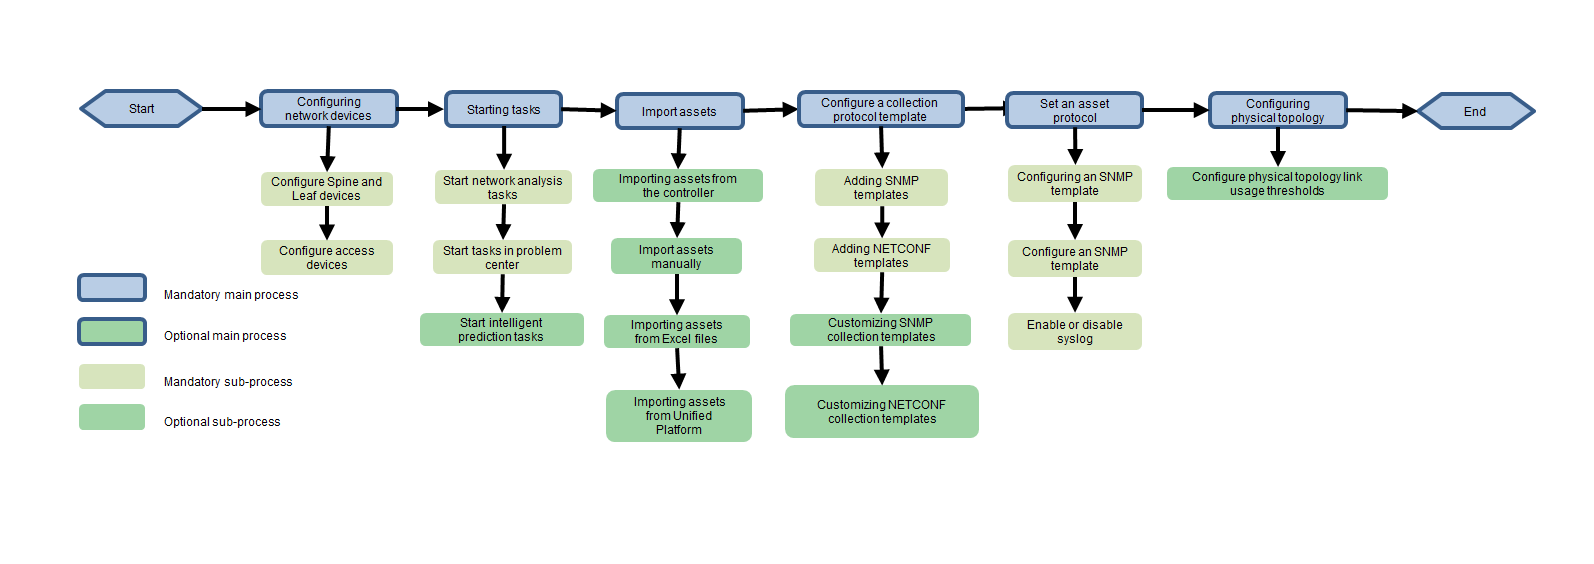
Configuration process
Figure 3 Flowchart of configuring analysis services for wired network devices
Network planning
For more information, see "Single-stack southbound network."
Configuration procedure
Configuring network devices
|
|
CAUTION: The time zone and time of the network devices must be consistent with those of Unified Platform. |
Configuring spine and leaf devices
|
|
NOTE: Spine and leaf devices are configured in the same way. |
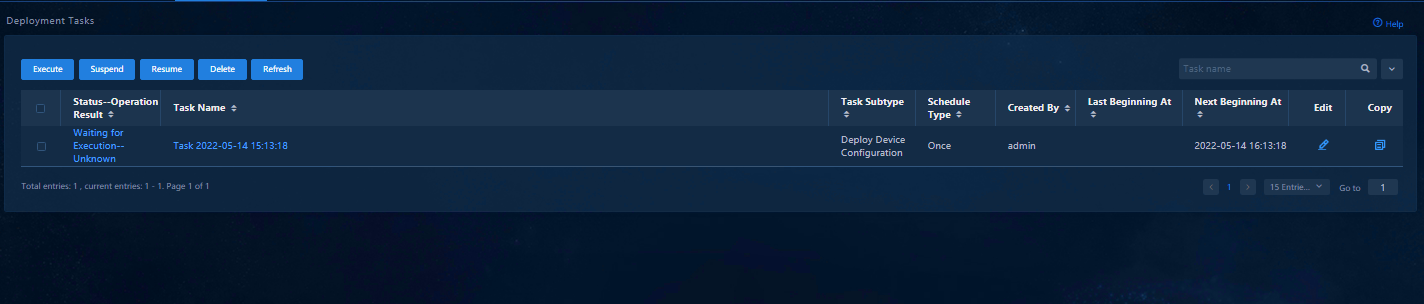
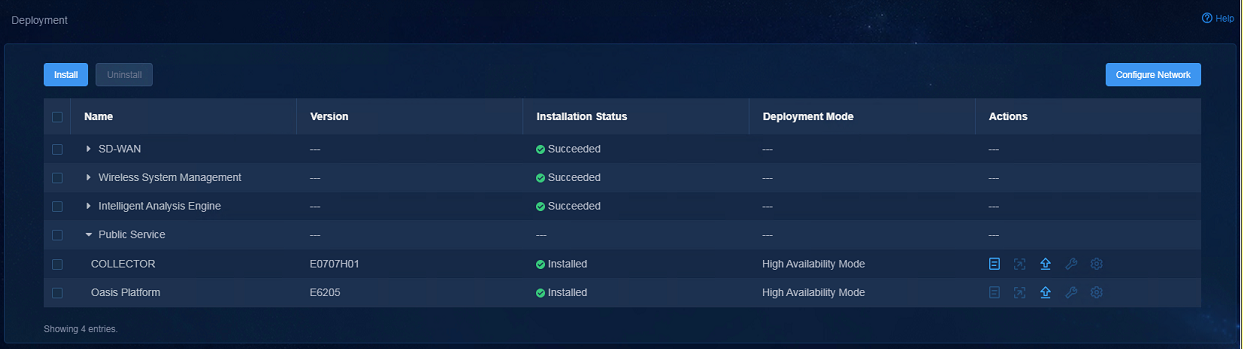
1. View the IP address for the southbound passive collector.
a. Navigate to the System > Deployment page.
b. In the public services, click the Details icon for COLLECTOR.
The cluster IP address of the component whose name does not contain init is the IP address for the southbound passive collector.
Figure 4 Deployment page
2. Configure static routes from network devices to SeerAnalyzer.
Configure two routes. The destination subnets are the northbound service VIP subnet and the IP subnet for southbound passive collector. If the unified southbound and northbound network solution is used, configure only the route to the northbound service VIP subnet.
ip route-static vpn-instance vpn-default 100.1.0.0 24 130.1.0.1
ip route-static vpn-instance vpn-default 110.1.0.0 24 130.1.0.1
#
3. Configure gRPC to collect table entry data.
|
|
CAUTION: Due to the common performance of H3C S5560X/S6520X Switch Series, as a best practice, do not configure gRPC to collect table entry data when the S5560X/S6520X Switch Series are used as leaf devices in the network. |
gRPC is used to collect data for MAC, L2VPN MAC, ARP, route, and ND entries. Then, the data is used for analysis of table entry changes. Incremental reporting of these entries is only supported by gRPC-based collection in the current software version.
grpc enable
telemetry
sensor-group s4 //Configure a sensor group for incremental reporting of table entry changes analysis.
sensor path mac/underlaymacevent
sensor path mac/overlaymacevent
sensor path arp/arptableevent
sensor path nd/ndtableevent
sensor path route_stream/ipv4routeevent
sensor path route_stream/ipv6routeevent
destination-group d1 //Configure the destination group with a custom name.
ipv4-address 110.1.0.107 port 50051 vpn-instance vpn-default //Configure the IP address of the collector and related parameters. The IP address is configured as the IP address for the southbound passive collector.
subscription d //Create the subscription and associate it with the sensor groups and the destination group for incremental reporting of table entry changes analysis.
sensor-group s4 sample-interval 3600
destination-group d1
source-address 130.1.0.52 //Configure the IP address as the management IP address of the device.
#
4. Configure Syslog.
info-center enable
info-center loghost source Vsi-interface4094
info-center loghost vpn-instance vpn-default 110.1.0.107 facility local5 //Configure the IP address as the IP address for the southbound passive collector.
5. Configure SNMP, NETCONF, and SSH.
|
|
NOTE: The IP address in the snmp-agent target-host configuration can be the northbound service VIP address or the IP address for the southbound passive collector. The differences are as follows: · If the IP address is configured as the northbound service VIP address, the SNMP trap is first sent to Unified Platform, which then forwards a copy to SeerAnalyzer. · If the IP address is configured as the southbound passive collector IP address, the SNMP trap is directly sent to SeerAnalyzer. As a best practice, use the IP address for the southbound passive collector. If the unified southbound and northbound network solution is used, configure the IP address as the northbound service VIP address. |
snmp-agent
snmp-agent community write private
snmp-agent community read public
snmp-agent sys-info version all
snmp-agent target-host trap address udp-domain 110.1.0.107 vpn-instance vpn-default params securityname public v2c //Configure the IP address as the IP address for the southbound passive collector.
snmp-agent packet max-size 4096
snmp-agent configuration-examine interval 10 //Configure the intervals at which the SNMP module examines the system configuration for changes.
#
netconf soap http enable
netconf soap https enable
netconf ssh server enable
#
ssh server enable
#
6. Configure a local user.
Set the username and password to admin and H3C1234567, respectively.
local-user admin class manage
local-user admin class manage
password simple H3C1234567 // Make
sure the password meets the complexity requirements. The password must be 10 to
63 characters in length and contain at least two types of the following
characters: digits, uppercase letters, lowercase letters, and special
characters. The string does not support Chinese characters, question marks (?),
or spaces, and cannot be the username or reversed username.
service-type telnet http https ssh
authorization-attribute user-role network-admin
authorization-attribute user-role network-operator
line vty 0 63
authentication-mode scheme
user-role network-admin
user-role network-operator
#
7. Configure NTP.
clock timezone beijing add 08:00:00 //Configure the time zone.
clock protocol ntp
ntp-service enable
ntp-service unicast-server 100.1.0.100 vpn-instance vpn-default //The built-in NTP server of Unified Platform is used here, which can be configured as needed.
#
Configuring an access device
1. Configure static routes from network devices to SeerAnalyzer.
Configure two routes. The destination subnets are the northbound service VIP subnet and the IP subnet for southbound passive collector. If the unified southbound and northbound network solution is used, configure only the route to the northbound service VIP subnet.
ip route-static 100.1.0.0 24 130.1.0.1
ip route-static 110.1.0.0 24 130.1.0.1
#
2. Configure Syslog.
info-center enable
info-center loghost source Vlan-interface4094
info-center loghost 110.1.0.107 facility local5
#
3. Configure gRPC.
As a best practice, do not configure gRPC on an access device because of its low performance. For how to configure gRPC on an access device, see "Appendix: Configuring gRPC."
4. Configure SNMP, NETCONF, and SSH.
|
|
NOTE: The IP address in the snmp-agent target-host configuration can be the northbound service VIP address or the IP address for the southbound passive collector. The differences are as follows: · If the IP address is configured as the northbound service VIP address, the SNMP trap is first sent to Unified Platform, which then forwards a copy to SeerAnalyzer. · If the IP address is configured as the southbound passive collector IP address, the SNMP trap is directly sent to SeerAnalyzer. As a best practice, use the IP address for the southbound passive collector. If the unified southbound and northbound network solution is used, configure the IP address as the northbound service VIP address. |
snmp-agent
snmp-agent community write private
snmp-agent community read public
snmp-agent sys-info version all
snmp-agent target-host trap address udp-domain 110.1.0.107 params securityname public v2c //Configure the IP address as the IP address for the southbound passive collector.
snmp-agent packet max-size 4096
snmp-agent configuration-examine interval 10 //Configure the intervals at which the SNMP module examines the system configuration for changes.
#
netconf soap http enable
netconf soap https enable
netconf ssh server enable
#
ssh server enable
#
5. Configure a local user.
Set the username and password to admin and H3C1234567, respectively.
local-user admin class manage
local-user admin class manage
password simple H3C1234567 // Make
sure the password meets the complexity requirements. The password must be 10 to
63 characters in length and contain at least two types of the following
characters: digits, uppercase letters, lowercase letters, and special
characters. The string does not support Chinese characters, question marks (?),
or spaces, and cannot be the username or reversed username.
service-type telnet http https ssh
authorization-attribute user-role network-admin
authorization-attribute user-role network-operator
line vty 0 63
authentication-mode scheme
user-role network-admin
user-role network-operator
#
6. Configure NTP.
clock timezone beijing add 08:00:00 //Configure the time zone.
clock protocol ntp
ntp-service enable
ntp-service unicast-server 100.1.0.100 //The built-in NTP server of Unified Platform is used here, which can be configured as needed.
#
Starting tasks
Starting network service analysis tasks
Navigate to the Analysis > Analysis Options > Task Management page, select the following tasks, and click Enable to start these tasks.
· HealthAnalysis
· snmpAnalysis
· SNMPTrapParase
· DeviceResource
· grpcAnalysis
· FlinkNetConf
· BufferMonitorAnalysis
· NodeKpiAnalysis
· IfKpiAnalysis
· DeviceControlPlaneConnectivityFlowProcessing
· DevEffectAnalysis
· BaselineAbnormalDetection
· ProblemCenterAnalysisJava
· ProblemCenterMonitor
· CampusProblemCenter
· ProblemCenterAnalysisGRPC
· ProblemCenter
Starting AI prediction tasks
Navigate to the Analysis > Predict Analysis > AI Task Management page, select the following tasks in the task list, and click Batch Enable to start these tasks.
· Asset/Board-CPU-Usage
· Asset/Board-Memory-Usage
· Table Resource Usage
· AiPredict-CPU Usage-5min
· AiPredict-Memory Usage-5min
· AiPredict-Device Resource-5min
· AiPredict-Device Resource-1hour
· AiPredict-Packet Loss Rate-5min
· AiPredict-Packet Error Rate-5min
Importing wired network device assets
Importing assets from the controller
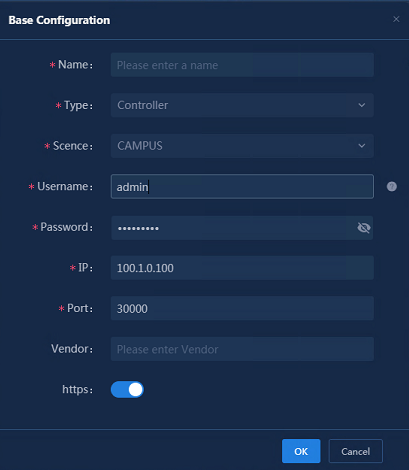
1. Add controller connection information: Navigate to the Analysis > Analysis Options > Resources > Assets > Data Sources page, and click Add. In the Base Configuration dialog box that opens, specify the following parameters:
¡ Name: Enter the controller name (up to 36 characters with special characters supported).
¡ Type: Select Controller.
¡ Scene: Select CAMPUS.
¡ Username: Enter the username for logging in to the controller (SeerEngine-Campus) system.
¡ Password: Enter the password for logging in to the controller (SeerEngine-Campus) system.
¡ IP: Enter the northbound service VIP address.
¡ Port: Enter the port number in the URL of the controller (SeerEngine-Campus) system.
¡ https: Enable https only when you use HTTPS to log in to the controller (SeerEngine-Campus).
Figure 5 Base configuration page
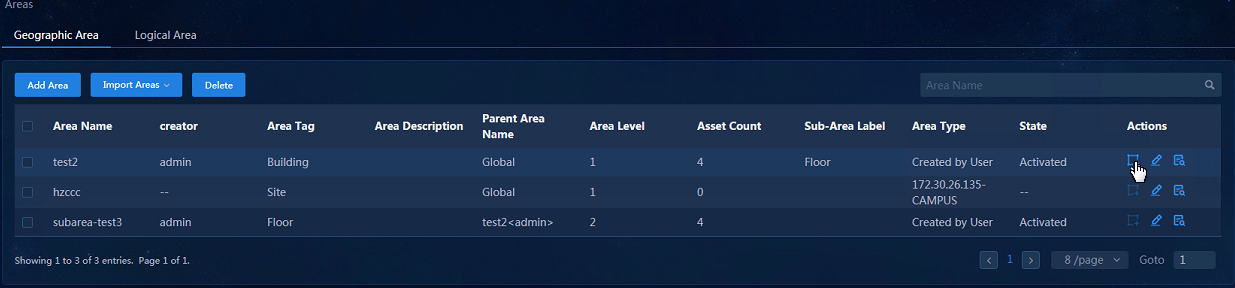
2. Import areas: You can import areas from the controller, including geographic areas and logical areas.
a. Navigate to the Analysis > Analysis Options > Resources > Areas > Geographic Area page. Click Import Areas and select Import from Controller. Once you select a controller, you can import geographic areas from the controller.
Figure 6 Importing geographic areas from the controller

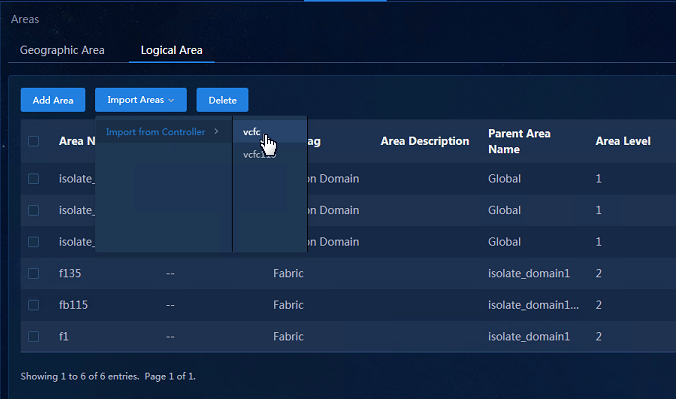
a. Navigate to the Analysis > Analysis Options > Resources > Areas > Logical Area page, Click Import Areas and select Import from Controller. Once you select a controller, you can import logical areas from the controller.
Figure 7 Importing logical areas from the controller
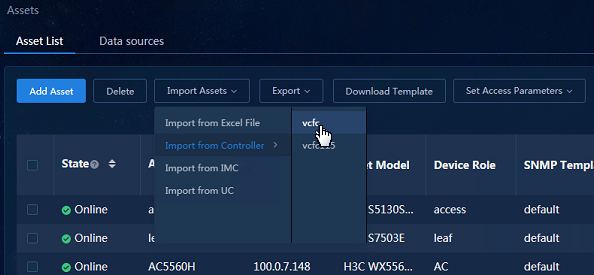
a. Navigate to the Analysis > Analysis Options > Resources > Assets > Asset List page. Click Import Assets and select Import from Controller. Once you select a controller, you can import assets from the controller.
Figure 8 Importing assets from the controller
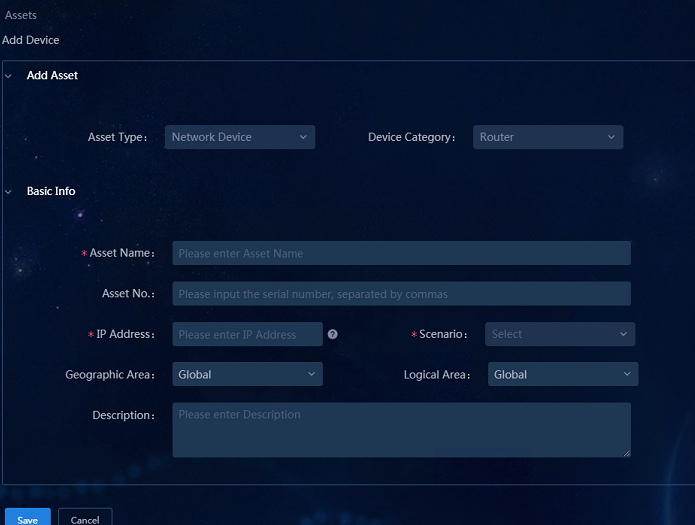
Adding assets manually
Navigate to the Analysis > Analysis Options > Resources > Assets > Asset List page, and click Add Asset to add assets manually.
· Asset Type: Select Network Device.
· Device Category: Select Switch in most cases. You can also select Router if required.
· Asset Name: Enter the asset name.
· IP Address: Enter the IP address.
· Scenario: Select CAMPUS.
· IRF Fabric: Select Yes or No as needed. If you select Yes, you must enter the IP address of the subordinate device.
|
|
NOTE: · SNMP Settings and NETCONF Settings on the Add Asset page are optional. You can configure the settings in Asset List after assets are added. · Asset Type, Device Category, Asset Name, IP Address, and Scenario are required while others are optional. The system automatically obtains other information about the device after the asset is added. · The IP address of the subordinate device refers to the IP address of the standby device of the stacked devices. For example, there are two devices with separate IP addresses. After devices are stacked, they share the IP address of one of the devices. So the other IP address is the IP address of the subordinate device, which is used to determine the stack split fault in the problem center. If there is only one IP address for the management port, the IP address of the subordinate device is not necessary. You can disable stacking and enter multiple serial numbers of the assets. This stacking button is only used to determine the stack split failure. |
Figure 9 Adding assets manually
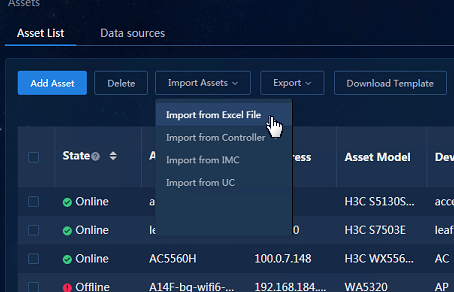
Importing assets from an Excel file
Navigate to the Analysis > Analysis Options > Resources > Assets > Asset List page, download the Excel template, specify the parameters, and select Import from Excel File.
Figure 10 Importing assets from an Excel file
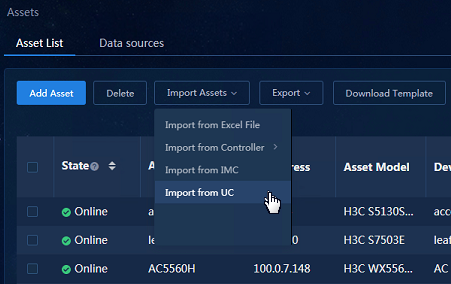
Importing assets from Unified Platform
Navigate to the Analysis > Analysis Options > Resources > Assets > Asset List page. Click Import Assets and select Import from UC to import assets.
Figure 11 Importing assets from Unified Platform
Importing assets from IMC
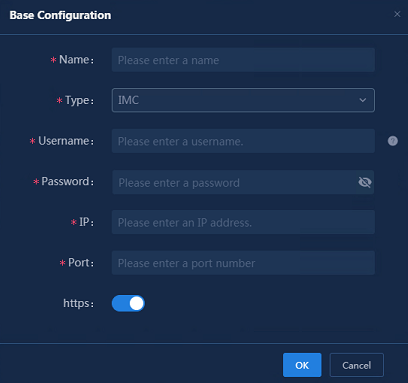
1. To import assets from IMC, you must configure the IMC data source. Navigate to the Analysis > Analysis Options > Resources > Assets > Data Sources page, and click Add. In the Base Configuration dialog box that opens, specify the following parameters:
¡ Name: Enter the name.
¡ Type: Select IMC.
¡ Username: Enter the username for logging in to the system where IMC authentication is performed. The name can be 2 to 32 characters in length and can contain only letters, digits, underscores (_), hyphens (-), periods (.), and backslashes (\).
¡ Password: Enter the password for logging in to the system where IMC authentication is performed.
¡ IP: Enter the IP address for logging in to the system where IMC authentication is performed.
¡ Port: Enter the port number in the URL of the system where IMC authentication is performed.
¡ https: Enable https only when you use HTTPS to log in to the system where IMC authentication is performed.
Figure 12 Configuring IMC data sources
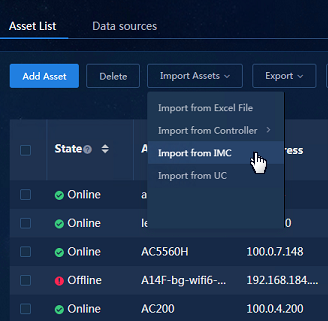
2. After the IMC data source is configured, navigate to the Analysis > Analysis Options > Resources > Assets > Asset List page, Click Import Assets and select Import from IMC to import assets.
Figure 13 Importing assets from IMC
Configuring a protocol template
To enable SNMP collection for devices, configure the corresponding SNMP template. After the template configuration is completed, you can deploy the template to the devices on the Assets page.
Adding SNMP templates
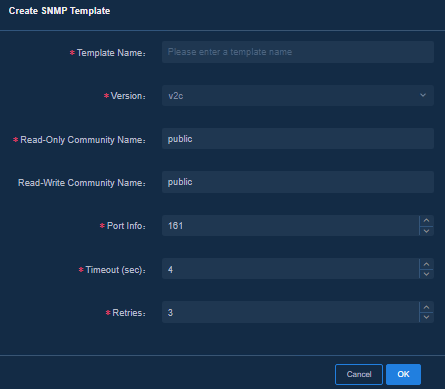
Navigate to the Analysis > Analysis Options > Collection Parameters > Template Management > SNMP page, click Create SNMP Template, and specify the following parameters:
· Template Name: Enter the name of the template, which can be up to 32 characters in length and can contain only letters, digits, hyphens (-), and underscores (_).
· Version: SNMP version. The default value is v2c. You can select v2c or v3 from the list.
· Read-Only Community Name: Enter the read-only community name of SNMP, which must be consistent with that in the device configuration.
· Read-Write Community Name: Enter the read-write community name of SNMP, which must be consistent with that in the device configuration.
· Port Info: Enter the port of SNMP. The default value is 161.
· Timeout (sec): Timeout period of an SNMP data request. The default value is 4 seconds. You can enter an integer in the range of 1 to 60.
· Retries: Retry times of an SNMP data request. The default value is 3. You can enter an integer in the range of 1 to 20.
Figure 14 Creating an SNMP template
Customizing SNMP collection templates
The system is pre-configured with one collection template, which can meet the basic network analysis requirements for most devices. You can customize the SNMP collection template for special requirements.
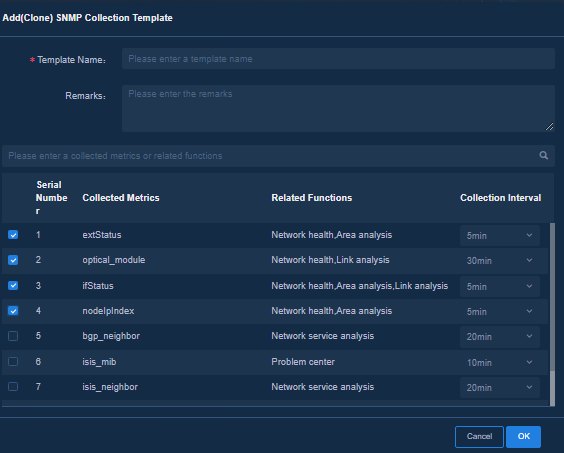
1. Navigate to the Analysis > Analysis Options > Collection Parameters > Template Management > SNMP page, and select an existing collection template. Click Add (Clone) and specify the following parameters. Then you can customize the template based on the collection items cloned from the existing template.
¡ Template Name: Enter the name of the template.
¡ Remarks: Optional. This field is used to describe the usage and characteristics of the template.
¡ Collected Metrics: Select the collected metrics. You can modify the collection intervals as needed.
Figure 15 Adding (Cloning) an SNMP template
Adding NETCONF templates
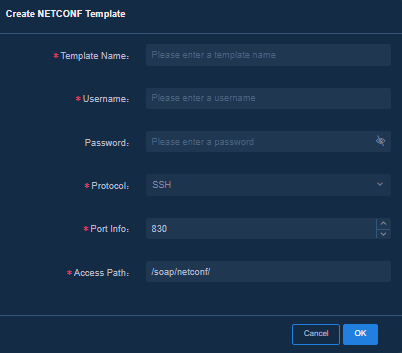
Navigate to the Analysis > Analysis Options > Collection Parameters > Template Management > NETCONF page, click Create NETCONF Template, and specify the following parameters:
· Template Name: Enter the name of the template, which can be up to 32 characters in length and can contain only letters, digits, hyphens (-), and underscores (_).
· Username: Enter the username of the NETCONF service. The username must be consistent with that in the device configuration.
· Password: Enter the password of the NETCONF service. The password must be consistent with that in the device configuration.
· Protocol: Select the connection protocol of the NETCONF service. The default value is SSH. You can retain the default value.
· Port Info: Select the port number of the NETCONF service. The default value is 830.
· Access Path: Enter the URL path of the NETCONF request. You can retain the default value.
Figure 16 Creating a NETCONF collection template
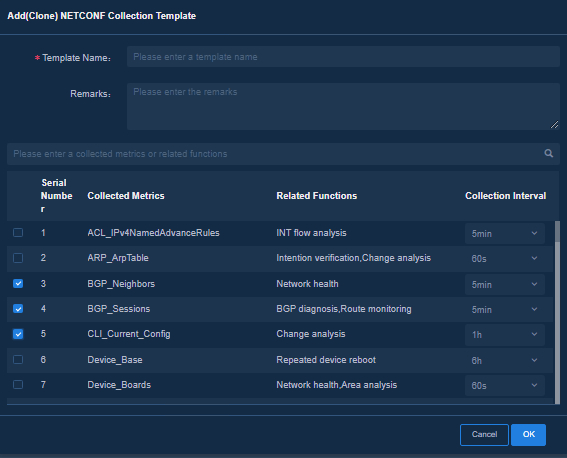
Customizing NETCONF collection templates
The system is pre-configured with the following three collection templates:
· Campus Basic Template—This template is suitable for devices with relatively low performance.
· Campus Standard Template—This template is suitable for most devices and supports data collection with medium precision in the Campus scenario.
· Campus Advanced Template—This template is suitable for most devices and supports data collection with high precision in the Campus scenario.
You can customize a NETCONF collection template for special requirements.
1. Navigate to the Analysis > Analysis Options > Collection Parameters > Template Management > NETCONF page, and select an existing collection template. Click Add (Clone) and specify the following parameters. Then you can customize the template based on the collection items cloned from the existing template.
¡ Template Name: Enter the name of the template.
¡ Remarks: Optional. This field is used to describe the usage and characteristics of the template.
¡ Collected Metrics: Select the collected metrics. You can modify the collection intervals as needed.
Figure 17 Adding (Cloning) a NETCONF collection template
Configuring an asset protocol template
Configuring an SNMP template
1. Navigate to the Analysis > Analysis Options > Resources > Assets > Asset List page. Select the required assets, and click Set Access Parameters and select SNMP Template Settings to configure the SNMP template.
Figure 18 Setting the SNMP template in the asset list
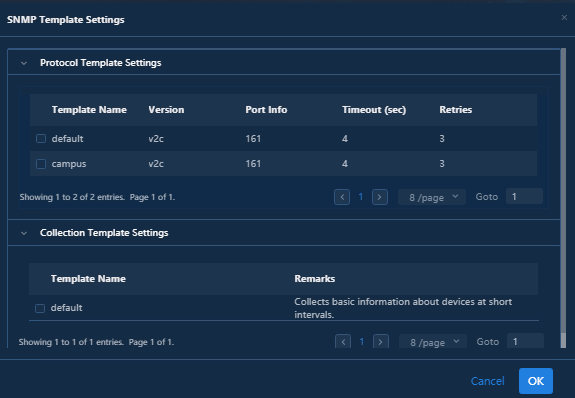
2. In the SNMP Template Settings dialog box that opens, select a protocol template in Protocol Template Settings and a collection template in Collection Template Settings.
Figure 19 SNMP template settings
Configuring a NETCONF protocol template
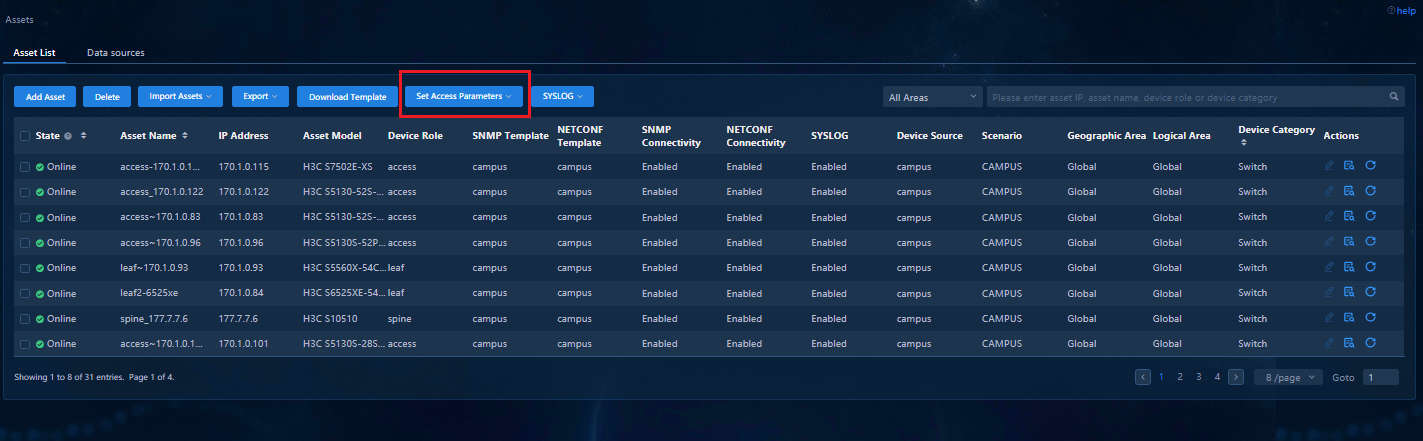
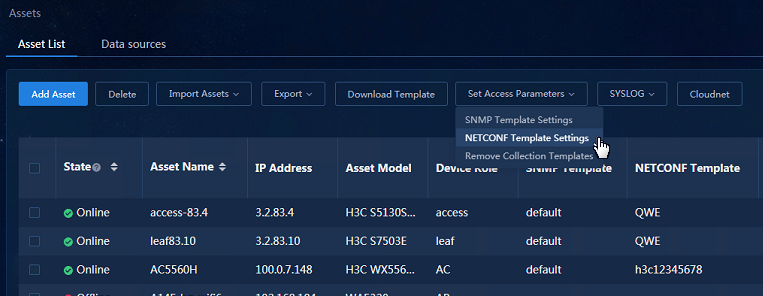
1. Navigate to the Analysis > Analysis Options > Resources > Assets > Asset List page. Select the required assets, and click Set Access Parameters and select NETCONF Template Settings to configure the NETCONF template.
Figure 20 Configuring the NETCONF template in the asset list
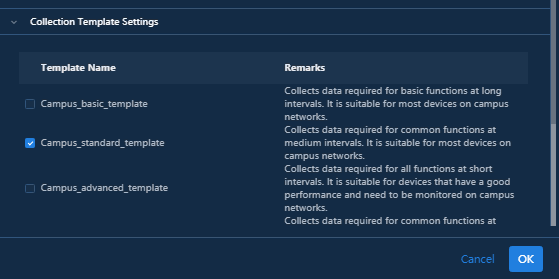
2. In the NETCONF Template Settings dialog box that opens, select a NETCONF protocol template in Protocol Template Settings and a collection template in Collection Template Settings.
Figure 21 NETCONF template settings
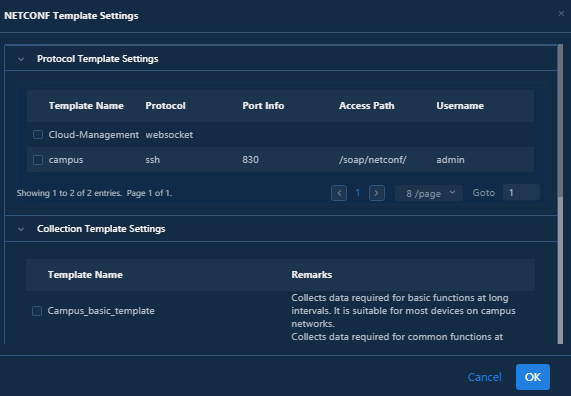
Figure 22 Collection template settings
Configuring Syslog
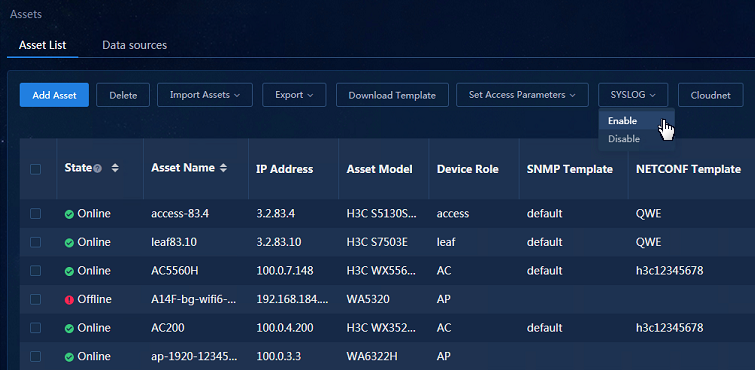
Navigate to the Analysis > Analysis Options > Resources > Assets > Asset List page. Select the required assets, and then click SYSLOG and select Enable to enable Syslog collection.
Figure 23 Enabling Syslog collection
Managing areas
Importing areas from the controller
For more information, see "Importing assets from the controller."
Adding geographic areas manually
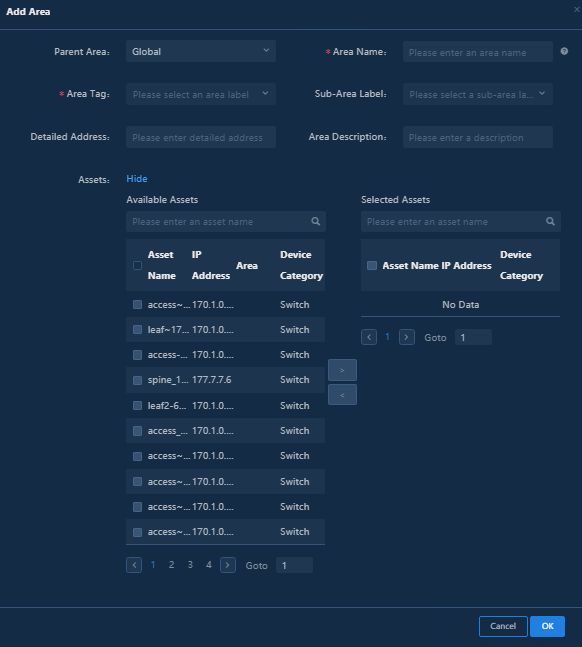
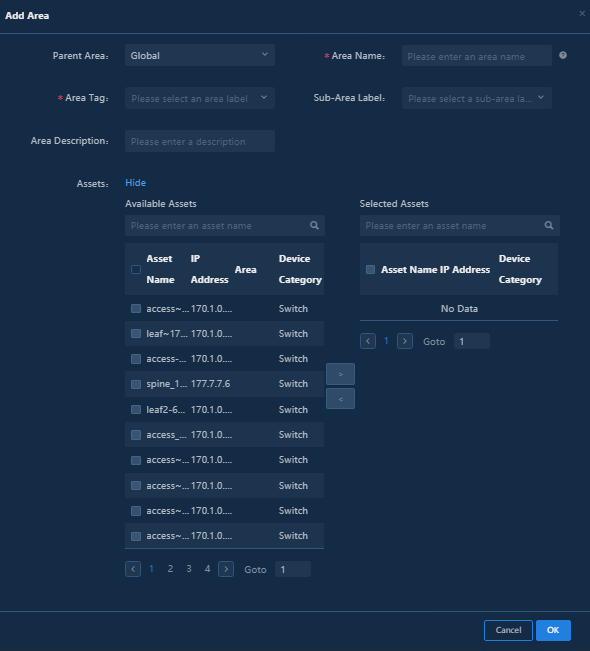
Navigate to the Analysis > Analysis Options > Resources > Areas > Geographic Area page, and click Add Area.
· Area Name: Required. The name can be up to 20 characters in length and can contain only letters, Chinese characters, digits, hyphens (-), and underscores (_).
· Area Tag: Select Site or Building from the list or customize a tag.
· Latitude and Longitude: Enter the latitude and longitude of the area.
· Assets: Select the required assets in Available Assets and move them to Selected Assets.
Figure 24 Adding an area
Adding a logical area manually
Navigate to the Analysis > Analysis Options > Resources > Areas > Logical Area page, and click Add Area.
· Area Name: Required. The name can be up to 20 characters in length and can contain only letters, Chinese characters, digits, hyphens (-), and underscores (_).
· Area Tag: Select Site or Building from the list or customize a tag.
· Latitude and Longitude: Enter the latitude and longitude of the area.
· Assets: Select the required assets in Available Assets and move them to Selected Assets.
Figure 25 Adding a logical area
Configuring the physical topology
Enabling the traffic heatmap
Navigate to the Analysis > Health Analysis > Health Overview > Topo > Physical Topo page, and click the Traffic Heatmap button to display the traffic heatmap.
Figure 26 Enabling the traffic heatmap
Configuring topology link bandwidth usage thresholds
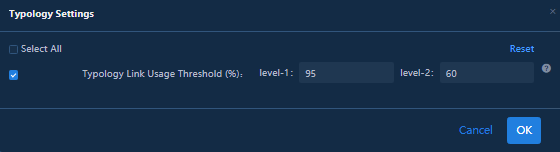
1. Navigate to the Analysis > Health Analysis > Health Overview > Topo > Physical Topo page, and click the Settings icon.
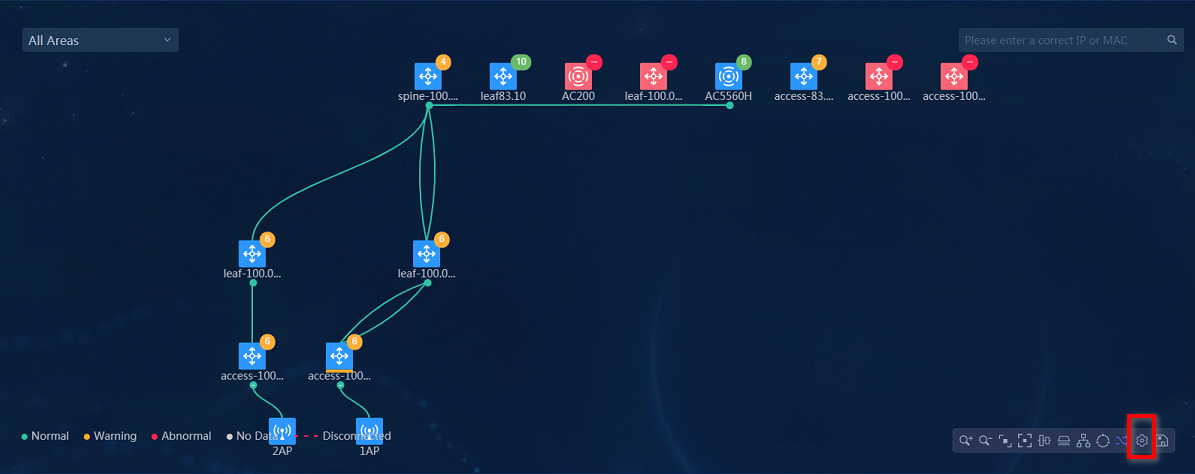
2. In the dialog box that opens, specify the following parameters:
¡ level-1: Topology link bandwidth usage threshold for level-1 alarm reporting. After the threshold is reached, the traffic heatmap turns red.
¡ level-2: Topology link bandwidth usage threshold for level-2 alarm reporting. After the threshold is reached, the traffic heatmap turns yellow.
3. Click OK to save the configuration.
|
|
NOTE: To restore the topology link bandwidth usage thresholds to the default values, click Reset. |
Figure 27 Configuring topology link bandwidth usage thresholds
Displaying analysis results
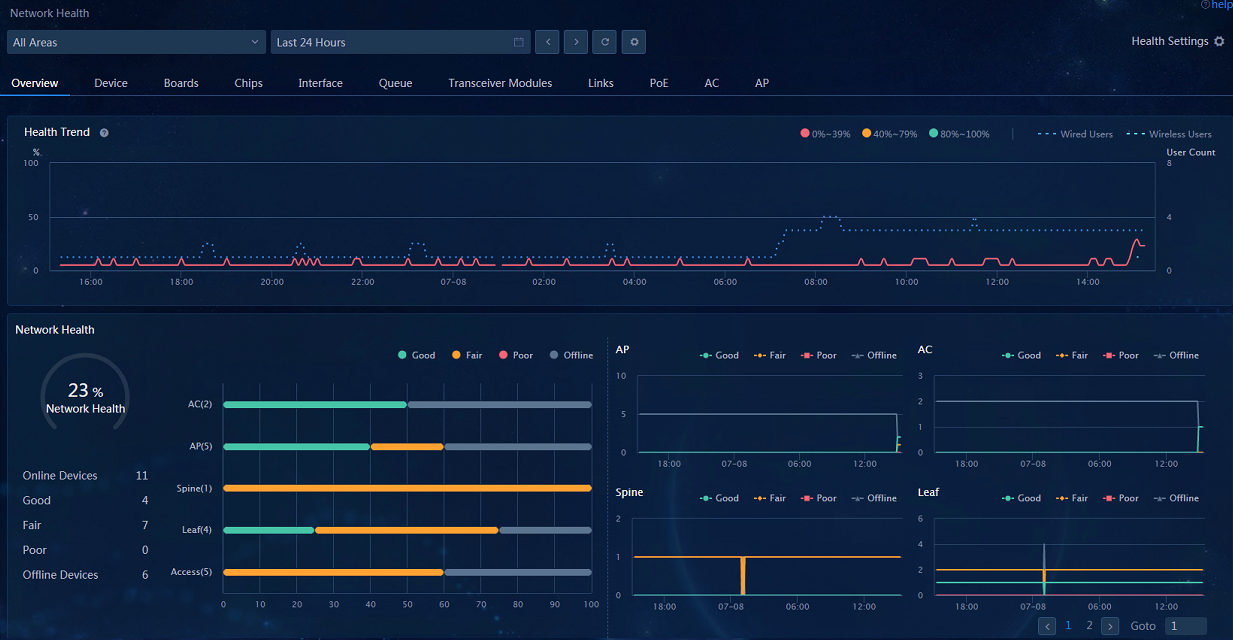
· Network Health: Navigate to the Analysis > Health Analysis > Network Analysis > Network Health page. On the Overview tab, view the widgets of Health Tread, Network Health, and network devices. You can view the data in the widgets or click a device name and view the details in the dialog box that opens. You can also click the Device, Boards, Chips, Interface, Transceiver Modules, Links, or PoE tab to view data.
Figure 28 Network health results
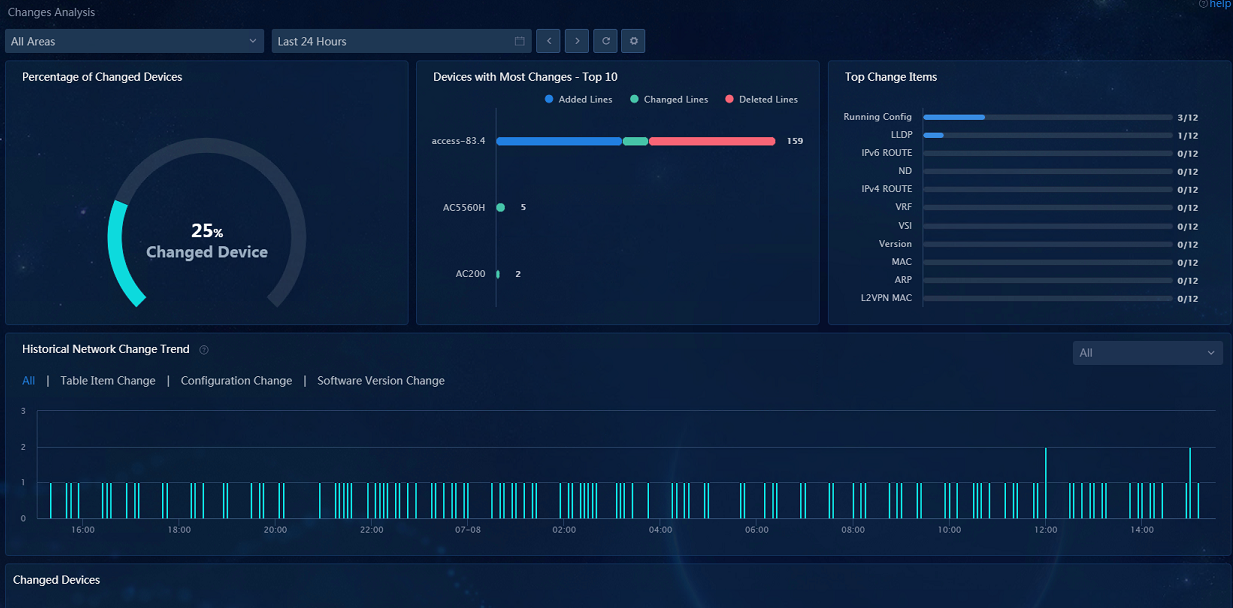
· Changes Analysis: Navigate to the Analysis > Health Analysis > Network Analysis > Changes Analysis page to view the data in widgets including Percentage of Changed Devices, Devices with Most Changes - Top 10, Top Change Items, Historical Network Change Trend, and Changed Devices.
Figure 29 Changes analysis results
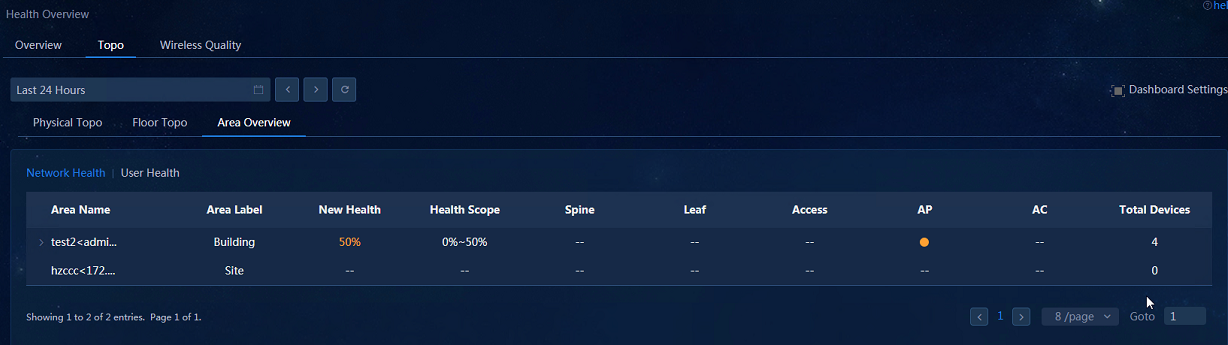
· Area Overview: After configuring an area, navigate to the Analysis > Health Analysis > Health Overview > Topo > Area Overview page to view the network health status and data.
Figure 30 Area overview results
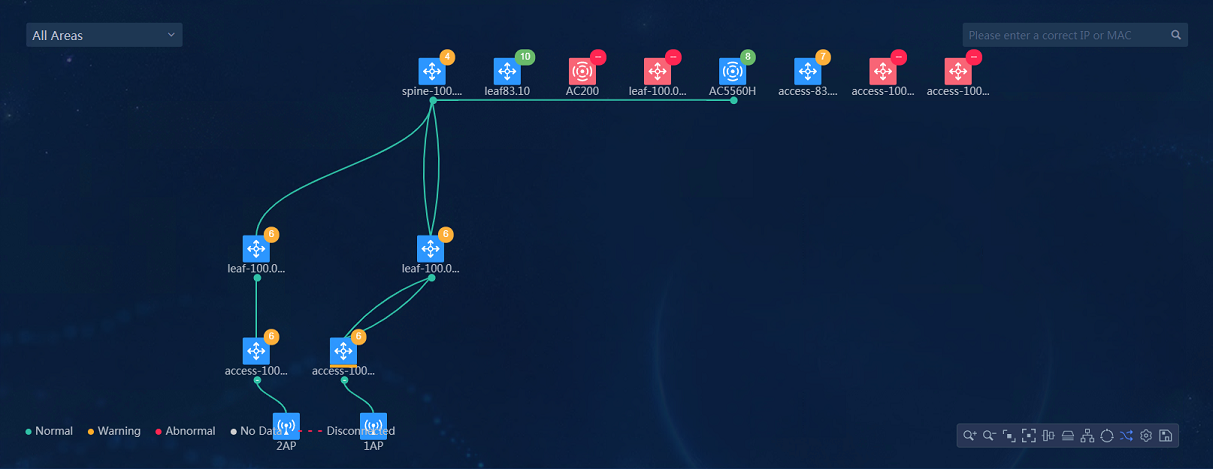
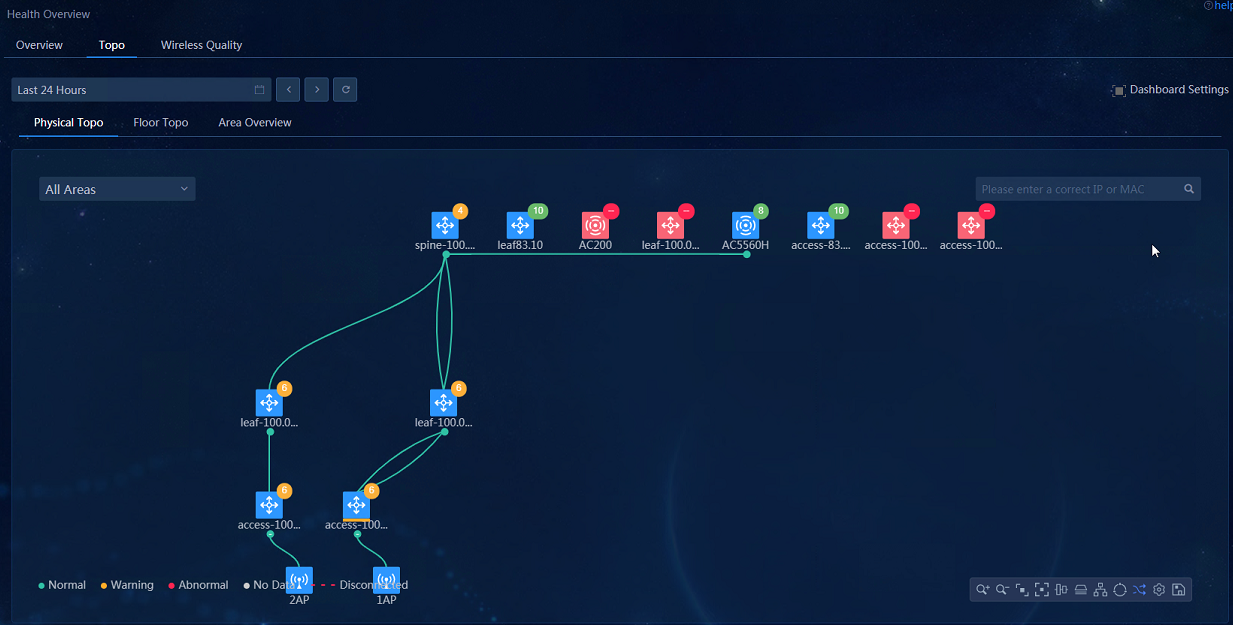
· Physical Topo: Navigate to the Analysis > Health Analysis > Health Overview > Topo > Physical Topo page to view the topology. The physical topology of wired network devices is displayed.
Figure 31 Physical topology results
· Intelligent Prediction: Navigate to the Analysis > Predict Analysis > Intelligent Prediction page to view the device list. The data about switches is displayed. You can click Device Details to view the historical and predicted values of a specific KPI.
Figure 32 Intelligent prediction results
· Problem Center: Navigate to the Analysis > Diagnosis Analysis > Problem Center page. On the Overview tab, view the data in widgets Fault Statistics, Fault Trend, and Current Issue List. The data in widget History Issue List will be displayed after the problem is solved. On the Protocol, Overlay, Device, and Network tabs, data will be displayed after the actual failure or constructed failure occurs.
Figure 33 Problem center results
Restrictions and guidelines
· The time zone and time of the network devices must be consistent with those of Unified Platform.
Configuring analysis services for wireless devices
The analysis services for wireless devices provide the following functions:
· User Health—Displays information including the overall user health trend, current overall endpoint state, endpoint operation, user list, and user details.
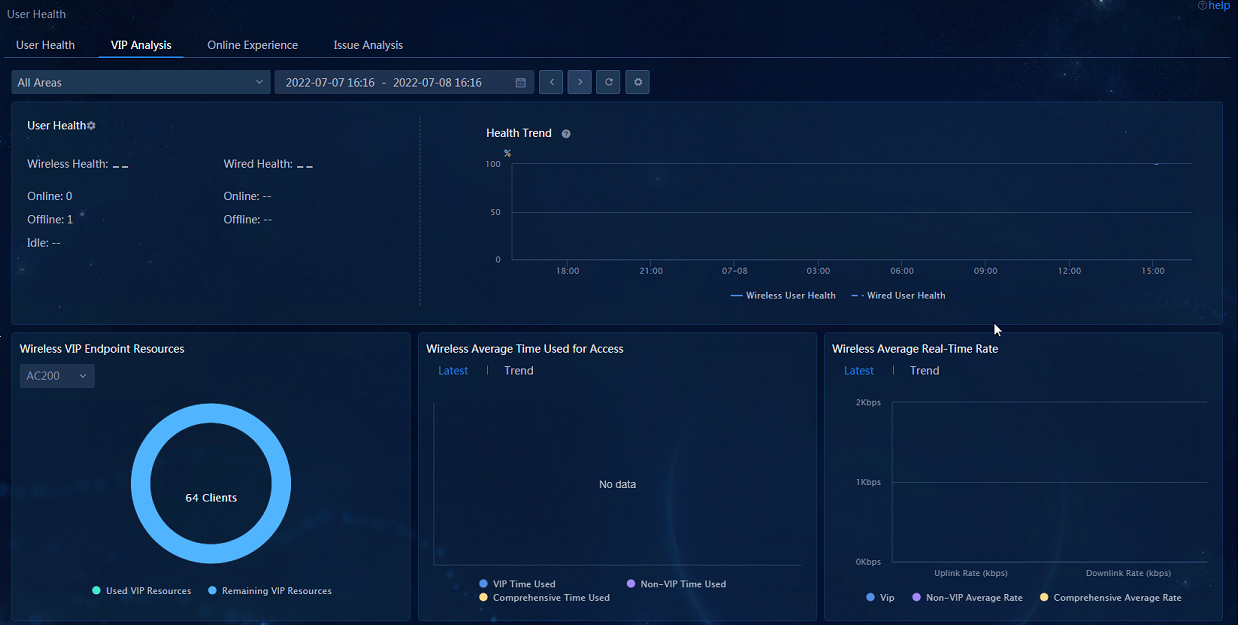
· VIP Analysis—Displays information including VIP users' overall health state trend, the overall state of current VIP endpoints, the operation of VIP endpoints, and the comparison with the operation of non-VIP endpoints, and the list of users.
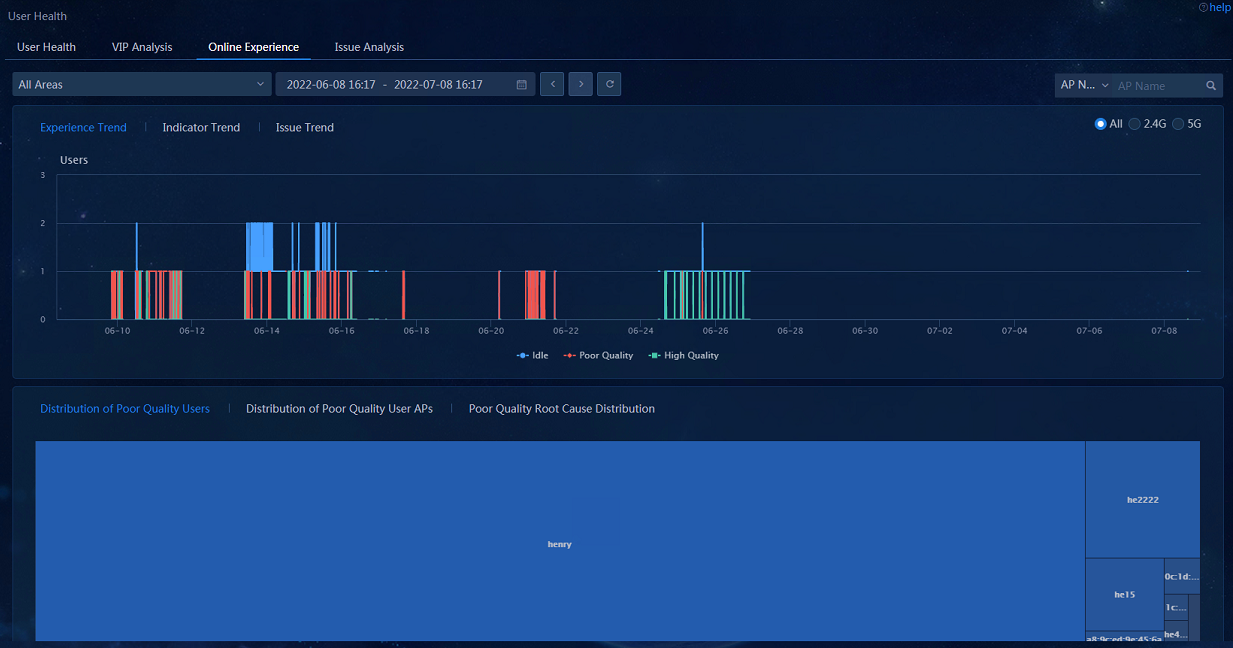
· Online Experience—Obtains the overall Internet access experience trend in the specified time span based on the collected statistics on wireless user health and network indexes, displays the health of the customer network in different time spans based on the quality of the user experience, and shows the top 50 users and APs with the poorest network quality based on statistics on the poor quality duration from the perspectives of users and APs, respectively.
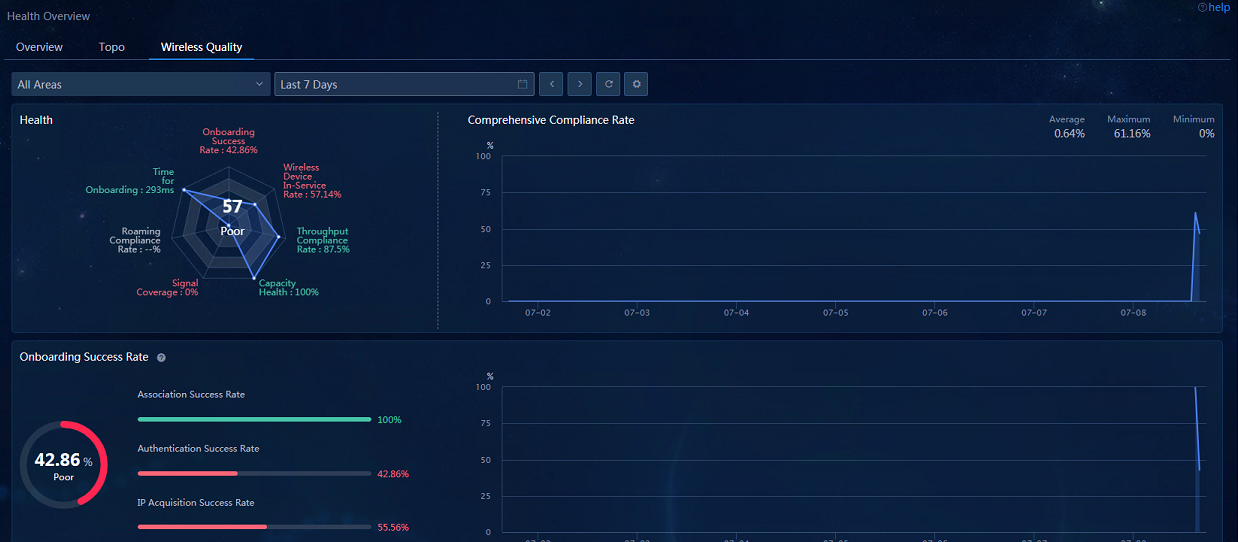
· Wireless Quality—Displays the overall evaluation results of user network experience quality, supports the drilling of various sub-indexes into the lower-level page for problem discovery and analysis based on the 7 categories of index monitoring systems, including the onboarding success rate, time for onboarding, coverage, roaming compliance rate, capacity health, throughput compliance rate, and wireless device in-service rate, and allows you to know the network quality.
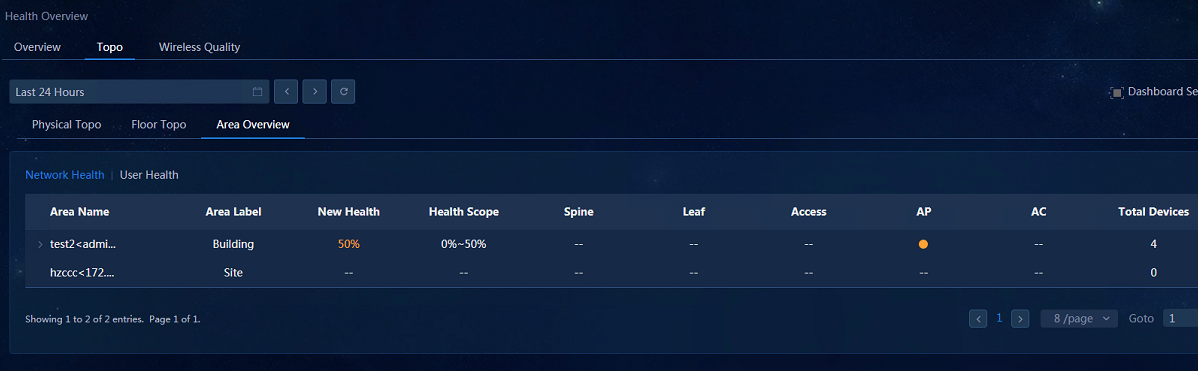
· Topology—Displays the physical topology, geographical topology, floor topology, and area overview of wireless devices. You can upload floor pictures in the floor area and distribute AP assets in the floor pictures. Area Overview displays the user health information by area in the list.
· User Issue—Displays eight major categories of problems. The statistical values on each problem category are the total number of all problems found in that category. Each major category contains one or more subcategories of problems, and administrators can view the total number of each subcategory of problems found, the number of endpoints involved, and the number of APs involved.
· Problem Center—Displays the problems of wireless users. Individual roaming and connection-wireless VIP user problems are displayed in the Service category, while wireless group connection problems are displayed in the Network category.
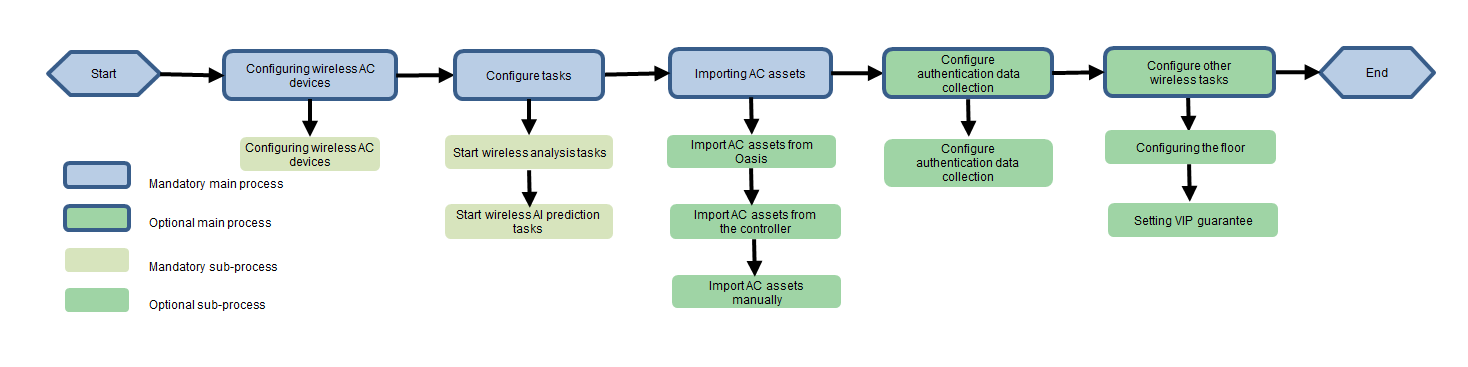
Configuration process
Figure 34 Flowchart of configuring analysis services for wireless devices
Network planning
For more information, see "Single-stack southbound network."
Configuration procedure
Configuring wireless ACs
The wireless AC must be connected to the Oasis component of SeerAnalyzer, so the wireless AC must be configured with a route to the northbound service VIP subnet.
|
|
CAUTION: The time zone and time of the wireless AC must be consistent with those of Unified Platform. |
Configuring the route from the wireless AC to SeerAnalyzer
ip route-static 100.1.0.0 24 130.1.0.1 //130.1.0.1 is the IP address of VLAN-interface 4094 on the Layer 3 management switch and acts as the gateway.
#
Configuring the connection between the wireless AC and SeerAnalyzer
Method 1:
cloud-management server domain 100.1.0.100 //Specify the IP address as the northbound service VIP address.
cloud-management server port 17443 //Specify the port number as 17443.
#
Method 2:
|
|
NOTE: If you choose method 2, enable the DNS process by executing the dns domain xxx and undo dns domain xxx command. If the wireless AC is rebooted, enable the DNS process again. |
dns domain sa //sa is a custom name.
undo dns domain sa
ip host h3c-SeerAnalyzer.com 100.1.0.100 //The IP address is the northbound service VIP address of Unified Platform, and h3c-SeerAnalyzer.com can be customized.
cloud-management server domain h3c-SeerAnalyzer.com
cloud-management server port 17443 //Specify the port number as 17443.
#
Verify that the connection between the wireless AC and SeerAnalyzer is successful:
After importing AC assets in the step "Configuring the floor," execute the display cloud-management state command on the ACs. If the status is Established, it means the connection is successful.
Configuring and enabling client inspection on clients
Configure the function in AP view or AP group view (in system view for wireless fat APs).
//AP view
wlan ap ap-8850 model WA4330-ACN
wlan client inspect enable
#
//AP group view
wlan ap-group default-group
wlan client inspect enable
#
Configuring time zone synchronization to APs
wlan timezone-sync enable
#
Configuring SNMP
snmp-agent
snmp-agent community write private
snmp-agent community read public
snmp-agent sys-info version all
snmp-agent packet max-size 4096
#
Configuring a local user
Set the username and password to admin and H3C1234567, respectively.
local-user admin class manage
local-user admin class manage
password simple H3C1234567 // Make
sure the password meets the complexity requirements. The password must be 10 to
63 characters in length and contain at least two types of the following
characters: digits, uppercase letters, lowercase letters, and special
characters. The string does not support Chinese characters, question marks (?),
or spaces, and cannot be the username or reversed username.
service-type telnet http https ssh
authorization-attribute user-role network-admin
authorization-attribute user-role network-operator
line vty 0 63
authentication-mode scheme
user-role network-admin
user-role network-operator
#
Configuring NTP
clock timezone beijing add 08:00:00 //Configure the time zone.
clock protocol ntp
ntp-service enable
ntp-service unicast-server 100.1.0.100 //The built-in NTP server of Unified Platform is used here, which can be configured as needed.
#
Starting tasks
Starting wireless analysis tasks
Navigate to the Analysis > Analysis Options > Task Management page, select the following tasks, and click Enable to start these tasks.
· OasisKafka
· onofflineAndAlarm
· SaUserStatisticsApplication
· WirelessUserProcess
· HealthAnalysis
· DevEffectAnalysis
· BaselineAbnormalDetection
· ProblemCenterMonitor
· CampusProblemCenter
· ProblemCenter
Starting AI prediction tasks
Navigate to the Analysis > Predict Analysis > AI Task Management page, select the following tasks in the task list, and click Batch Enable to start these tasks.
· AC CPU usage
· AP CPU usage
· AP Memory Usage
· AC Memory Usage
· Wireless1hDHCPFailNum
· Wireless1hAuthFailNum
· Wireless1HourAccessFailures
· Wireless1HourAccess
· Wireless5minsDHCPFailNum
· Wireless5minsAuthFailNum
· Wireless5MinutesAccessFailure
· Wireless5MinutesAccessTimes
· WeakSignalRatePediction
· WeakSignalTotalNumberPrediction
· AuthenticationFailureRatePrediction
· AuthenticationFailureUserRatePrediction
· AuthenticationSlowRatePrediction
· AuthenticationSlowUserRatePrediction
· AuthenticationTimeoutPrediction
· CertificationTimeoutPrediction
· TotalNumberofAuthenticationsPrediction
· AssociationFailureRatePrediction
· AssociationFailureUserRatePrediction
· AssociationSlowRatePrediction
· PredictPercentageofSlowConnections
· TotalNumberofConnectionsPrediction
· IPCollectionFailureRatePrediction
· IPCollectionFailureRateForecast
· IPCollectionSlowRateForecast
· IPCollectionSlowCountPrediction
· DHCPTotalUserStatistics
· not5GRatioStatistics
· not5GTotalUserStatistics
· AiPredict-AP-5min
Importing AC assets
You can choose one or more methods to import assets based on the actual environment and requirements.
Importing AC assets from the controller
For more information, see "Importing assets from the controller."
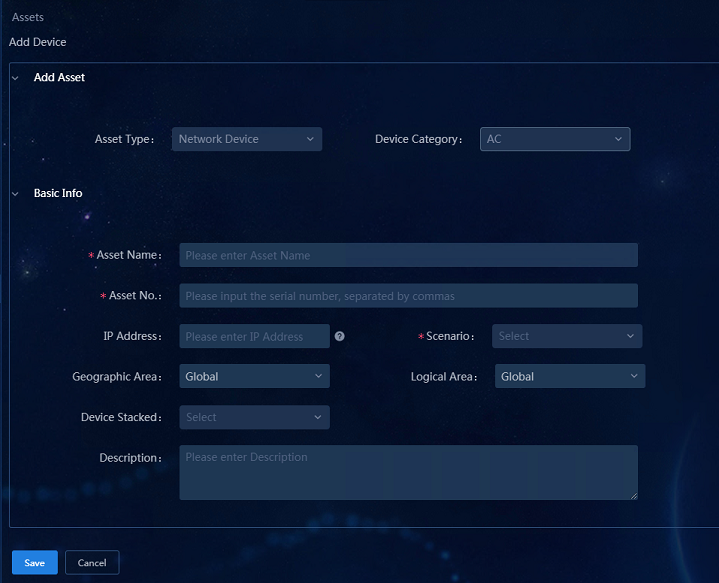
Adding AC assets manually
Navigate to the Analysis > Analysis Options > Resources > Assets > Asset List page, and click Add Asset to add assets manually.
· Asset Type: Select Network Device.
· Device Category: Select AC.
· Asset Name: Enter the asset name.
· Asset No.: Enter the asset serial number.
· IP Address: Enter the AC management IP address.
· Scenario: Select CAMPUS.
· AC in AC Hierarchy: Select Yes or No as needed. If you select Yes, select Central AC or Local AC.
· Device Stacked: Select Yes or No as needed. Select Yes for the stacked devices and enter multiple serial numbers of the asset, separated by commas.
Figure 35 Adding AC assets manually
Importing AC assets from an Excel file
For more information, see "Importing assets from an Excel file."
Configuring authentication data collection
Configure authentication data collection based on the actual type of the authentication system deployed in the system.
Configuring IMC authentication data collection
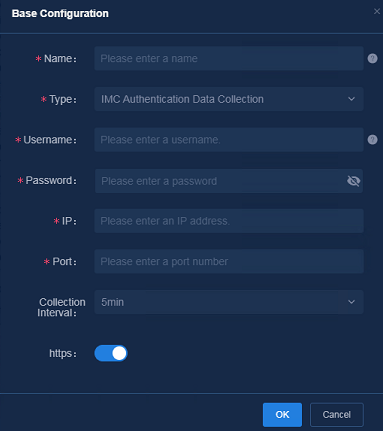
Navigate to the Analysis > Analysis Options > Task Management > Collection Task page, and click Add. In the Base Configuration dialog box that opens, specify the following parameters:
· Name: Enter the name.
· Type: Select IMC Authentication Data Collection.
· Username: Enter the username for logging in to the system where IMC authentication is performed. The name can be 2 to 32 characters in length and can contain only letters, digits, underscores (_), hyphens (-), periods (.), and backslashes (\).
· Password: Enter the password for logging in to the system where IMC authentication is performed.
· IP: Enter the IP address for logging in to the system where IMC authentication is performed.
· Port: Enter the port number in the URL of the system where IMC authentication is performed.
· Collection Interval: Set the collection interval to 5 minutes.
· https: Enable https only when you use HTTPS to log in to the system where IMC authentication is performed.
Figure 36 Configuring IMC authentication data collection
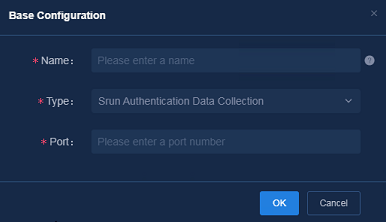
Configuring Srun authentication data collection
Navigate to the Analysis > Analysis Options > Task Management > Collection Task page, and click Add. In the Base Configuration dialog box that opens, specify the following parameters:
· Name: Enter the name of the collection task.
· Type: Select Srun Authentication Data Collection.
· Port: Enter 1813.
Figure 37 Configuring Srun authentication data collection
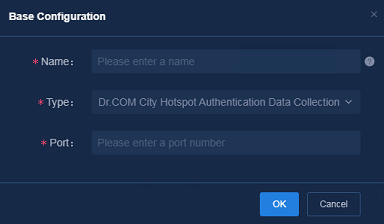
Dr. COM city hotspot
Navigate to the Analysis > Analysis Options > Task Management > Collection Task page, and click Add. In the Base Configuration dialog box that opens, specify the following parameters:
· Name: Enter the name of the collection task.
· Type: Select Dr. COM City Hotspot Authentication Data Collection.
· Port: Enter 61440.
Figure 38 Configuring Dr. COM city hotspot authentication data collection
Configuring the floor
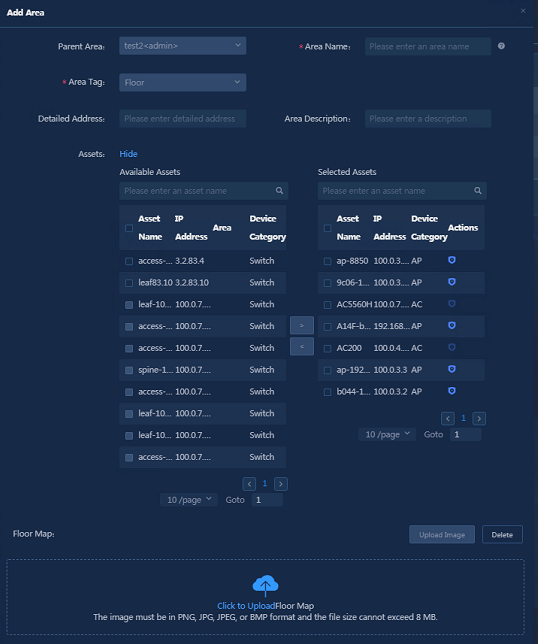
1. Navigate to the Analysis > Analysis Options > Resources > Areas > Geographic Area page, and click the Add Floor icon. For more information, see "Adding geographic areas manually."
2. In the Areas
list, select the area and click the ![]() icon to add floors,
as shown in Figure 39. In
the dialog box that opens, specify the following parameters, as shown in Figure 40.
icon to add floors,
as shown in Figure 39. In
the dialog box that opens, specify the following parameters, as shown in Figure 40.
¡ Area Name: Required. The name can be up to 20 characters in length and can contain only letters, Chinese characters, digits, hyphens (-), and underscores (_).
¡ Area Tag: Fixed. The default tag is Floor.
¡ Latitude and Longitude: Enter the latitude and longitude of the area.
¡ Assets: Select the required assets in Available Assets and move them to Selected Assets.
¡ Floor Map: Click Upload Image to upload the floor map. Click the ![]() icon
in the Selected Assets to distribute the APs in the
floor map. In the floor map, drag and drop the AP icons with the mouse to make
the APs correctly distributed in the floor map, as shown in Figure 41. After
the floor map is uploaded, you can manually adjust the APs on the floor to the
corresponding positions.
icon
in the Selected Assets to distribute the APs in the
floor map. In the floor map, drag and drop the AP icons with the mouse to make
the APs correctly distributed in the floor map, as shown in Figure 41. After
the floor map is uploaded, you can manually adjust the APs on the floor to the
corresponding positions.
Setting VIP assurance
The SeerEngine-Campus controller must be deployed for VIP assurance. For how to configure SeerEngine-Campus, see AD-Campus IP Policy Basics Configuration Guide.
If the SeerEngine-Campus controller is not deployed, no data about VIP endpoint resources is displayed for the VIP assurance function.
Configuring VIP users
|
|
CAUTION: You can specify MAC, Account, or both of them. · Account and MAC must be both matched if both are configured. In this way, the VIP user can be confirmed. · If only Account is configured, make sure the user account is successfully authenticated and the online user information can be obtained from the authentication system. In this way, the VIP user can be confirmed. · If only MAC is configured, the user account does not need to be authenticated, and the online user information does not need to be obtained from the authentication system. |
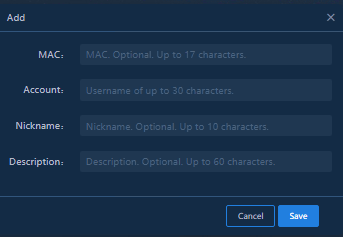
Navigate to the Analysis > Analysis Options > Global Configure > VIP User Configuration page, and click Add. In the Add dialog box that opens, specify the following parameters:
· MAC: Enter the MAC address of the VIP user.
· Account: Enter the account of the VIP user.
· Nickname and Description: Both are optional. You can configure them as needed.
Figure 42 Configuring a VIP user
Setting the non-VIP rate limit parameters
1. Navigate to the Analysis > Analysis Options > Global Configure > Non-VIP Rate Limit Parameter Settings page, and click Settings. In the dialog box that opens, specify the following parameters:
¡ Direction: Select Inbound or Outbound.
¡ Mode: Select Dynamic or Static.
- If you select Dynamic, you must specify Minimum CIR, Maximum CIR, and CIR.
- If you select Static, you must specify CIR.
¡ Minimum CIR: Enter the minimum value of the rate limit for each client.
¡ Maximum CIR: Enter the maximum value of the rate limit for each client.
¡ CIR: In Static mode, the specified value is the rate limit for each client. In Dynamic mode, the specified value is the sum of the rate limits for all clients.
2. After all the parameters are specified, click Save.
Figure 43 Setting the non-VIP rate limit parameters

Displaying analysis results
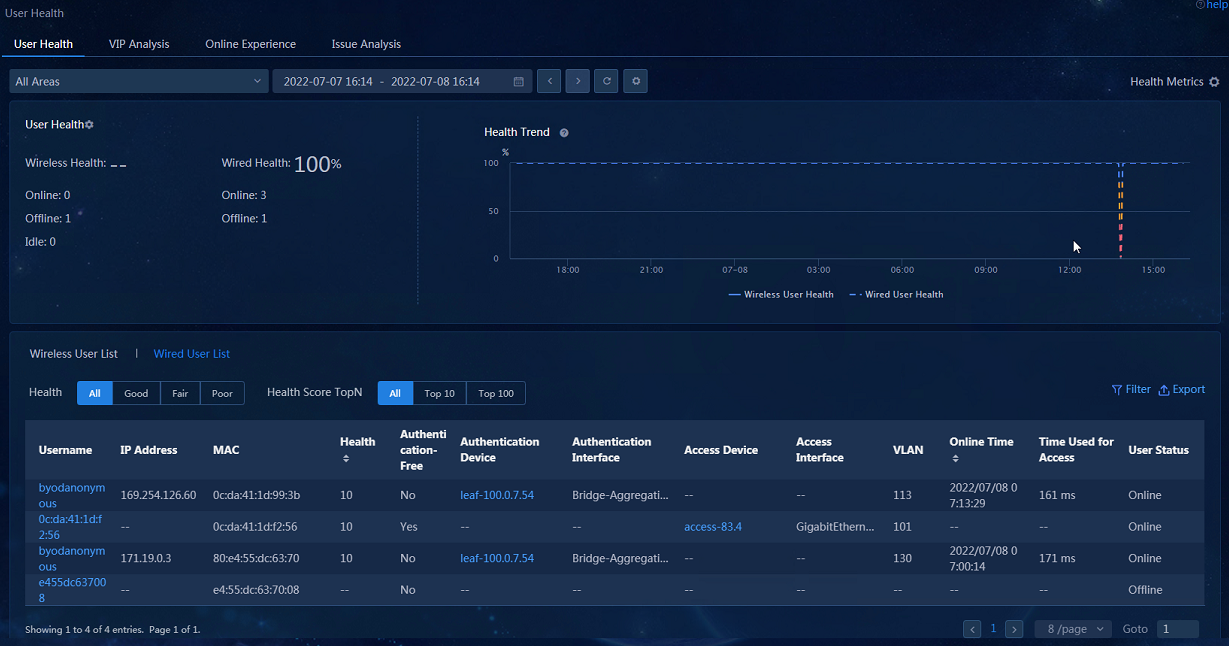
· User Health: Navigate to the Analysis > Health Analysis > User Analysis > User Health page to view the user health widgets related to wireless users. You can click the Username field for a wireless user to display the details of the wireless user in the dialog box that opens.
Figure 44 User health page
· VIP Analysis: Navigate to the Analysis > Health Analysis > User Analysis > User Health > VIP Analysis page to view the widgets related to wireless users. You can click the Username field for a wireless user to view the details of the wireless user in the dialog box that opens.
Figure 45 VIP analysis page
· Online Experience: Navigate to the Analysis > Health Analysis > User Analysis > User Health > Online Experience page to view data in the widgets related to online experience.
Figure 46 Online experience page
· Wireless Quality: Navigate to the Analysis > Health Analysis > Health Overview > Wireless Quality page to view data in the wireless quality widgets.
Figure 47 Wireless quality page
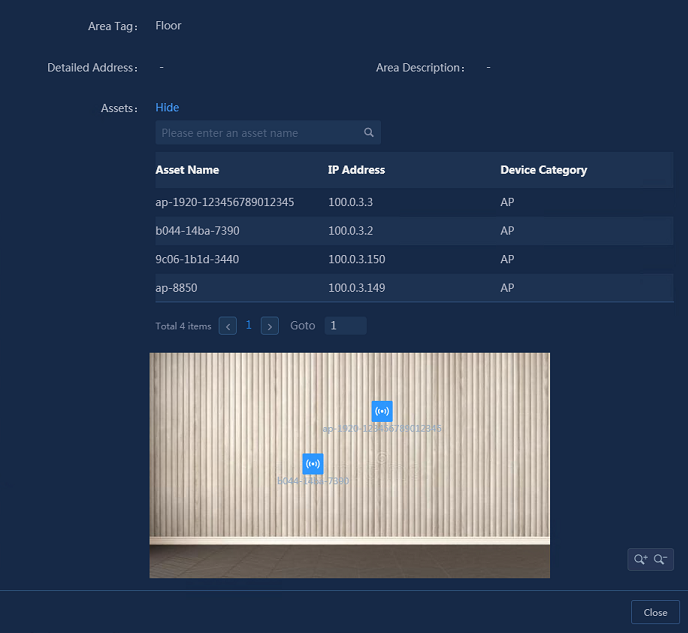
· Topology Overview: Navigate to the Analysis > Health Analysis > Health Overview > Topo > Floor Topo page. You can view the topology of wireless devices such as APs and view the data in the topology graph. After the external network is connected, you can view the GIS map with data displayed.
Figure 48 Floor map

· Area Overview: After an area is configured, navigate to the Analysis > Health Analysis > Health Overview > Topo > Area Overview page to view the user health data.
Figure 49 Viewing the user health data on the Area Overview page
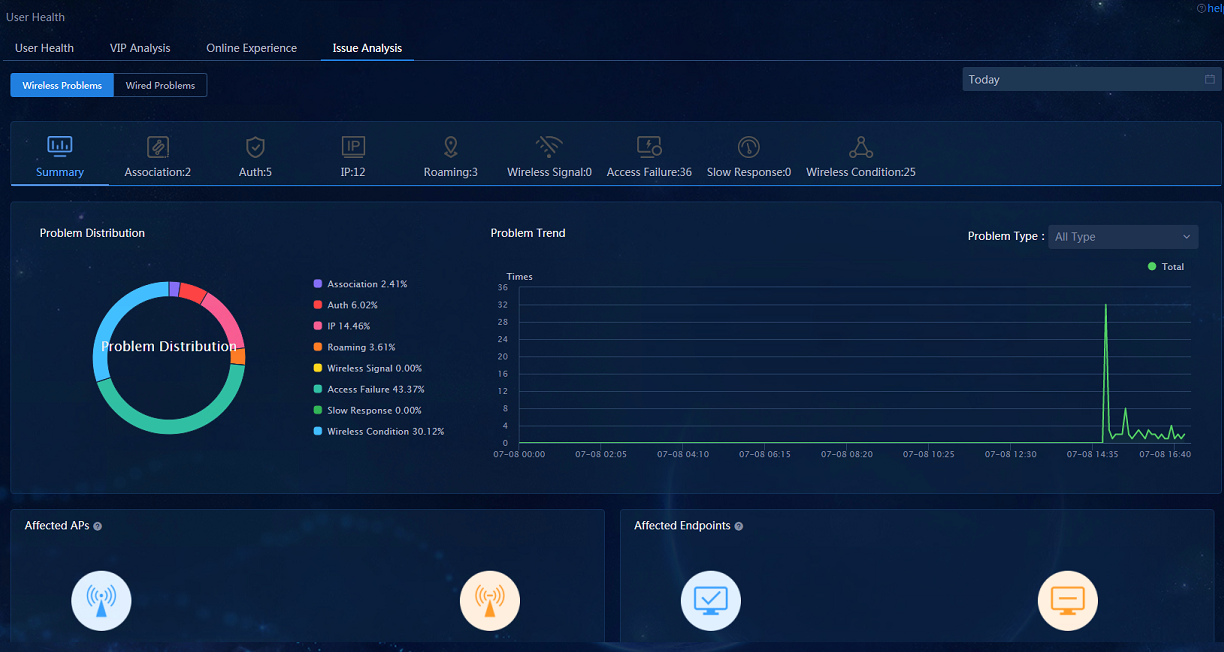
· Issue Analysis: Navigate to the Analysis > Health Analysis > User Analysis > User Health > Issue Analysis page to view the wireless problems. The data in Summary and other categories will be displayed after the actual failure or constructed failure occurs.
Figure 50 Viewing user issues on the Wireless Problems page
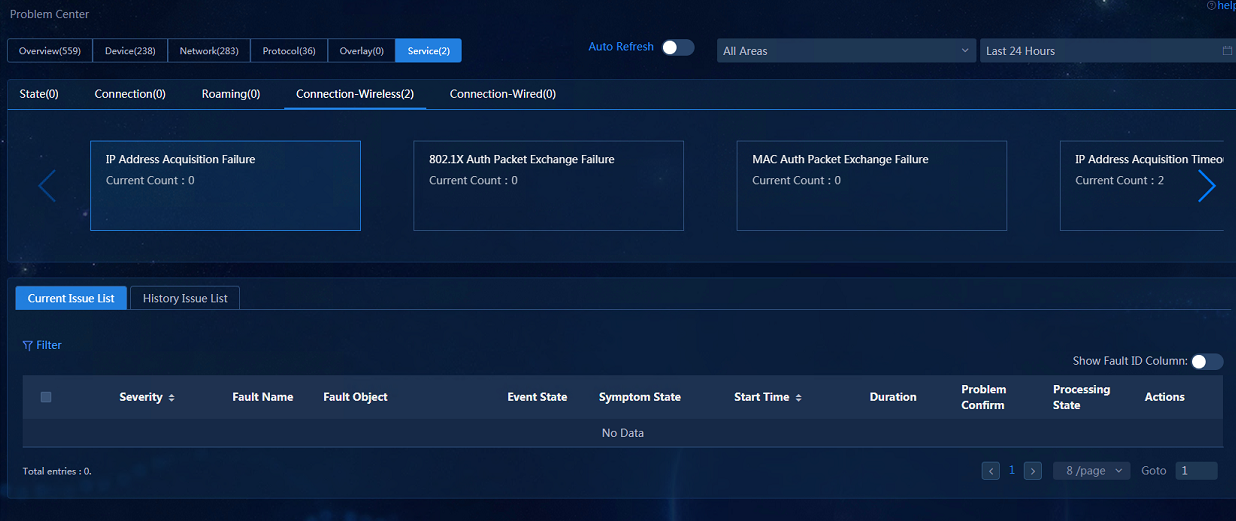
· Problem Center: Navigate to the Analysis > Diagnosis Analysis > Problem Center page. On the Service tab, you can view individual problems of wireless VIPs, including Roaming and Connection-Wireless categories. On the Network tab, you can view the wireless group problems including the Connection category. The data is displayed after the actual failure or construction failure occurs.
Figure 51 Problem center page
Restrictions and guidelines
· If both a user account and a MAC address are configured in VIP account settings, the VIP user identity is verified based on both values. If only one of them is configured, the VIP user identity is verified based on the configured one. If you configure a VIP user based on the account, make sure the user is successfully authenticated for the first time. If you cannot do that, as a best practice, configure the VIP user based on the MAC address.
· The time zone and time of the wireless AC must be consistent with those of Unified Platform.
· For the registration site information on the mobile app settings, make sure the latitude and longitude you entered are accurate to 5 to 6 decimal places.
Configuring diagnosis optimization
Wireless diagnosis includes one-key diagnosis, Doctor AP, mobile app detection, and WLAN security detection. Wireless optimization includes one-key optimization, AI-driven optimization, AI analytics, and closed loop fault management.
· One-key diagnosis—Involves 19 major diagnosis items including device configuration, network status, and device operation status. This function allows you to select the items for diagnosis as needed. You can simply click the Diagnose button to start checking. Detailed solutions are provided for the abnormal items (or items that can be optimized), and the network can be quickly restored based on the guidance.
· Doctor AP—You can use online APs to simulate the real service process of the client and diagnose the health of the WLAN network from the perspective of the client. During the connection process, Doctor AP records the time of packet interaction. After the AP is connected, Doctor AP performs the network detection and saves and uploads the results for you to solve the network issues.
· Mobile app detection—Cloudnet app is a mobile diagnostic app. It can solve the network issues of the campus users and realize the interaction between client and back-end SeerAnalyzer. You can use the network availability assessment and root cause analysis of SeerAnalyzer to perform diagnosis online with one click.
· WLAN security detection—This Layer 2 protocol detection with the protection function is developed for the 802.11 protocol. The WLAN security function can detect wireless behaviors or devices that threaten network security, interfere with network services, and affect network performance by monitoring and analyzing channels, and defend against intruding wireless devices.
· One-key optimization—Based on the wireless O&M history data, performs automatic optimization of the channel, power, and bandwidth of the AP and visually compares the changes after the optimization to improve user experience and simplify maintenance.
· AI-driven optimization—Based on the previous data of endpoints, APs, and other aspects, applies big data analysis and AI algorithms to predict the operating trend of the network environment (including endpoint tidal trajectory and regular high load of APs). It also plans and adjusts the RF parameters in advance for the network to adapt to the service, thus improving the network experience.
· AI analytics—Automatically identifies issues of the wireless network and solves them in a timely manner without human intervention, realizing the automatic running of the wireless network.
· Closed loop fault management—When the source of the fault object in the problem center is SeerEngine-Campus, the Actions column of the problem list in the problem center can pop up on the closed loop fault management page for closing the loop. The operations include solution, suggestion, and issue categories. The solution category can issue isolation solutions and recovery solutions.
Configuration process
Figure 52 Flowchart of configuring wireless diagnosis and optimization

Network planning
For more information, see "Single-stack southbound network."
Configuration procedure
One-key diagnosis
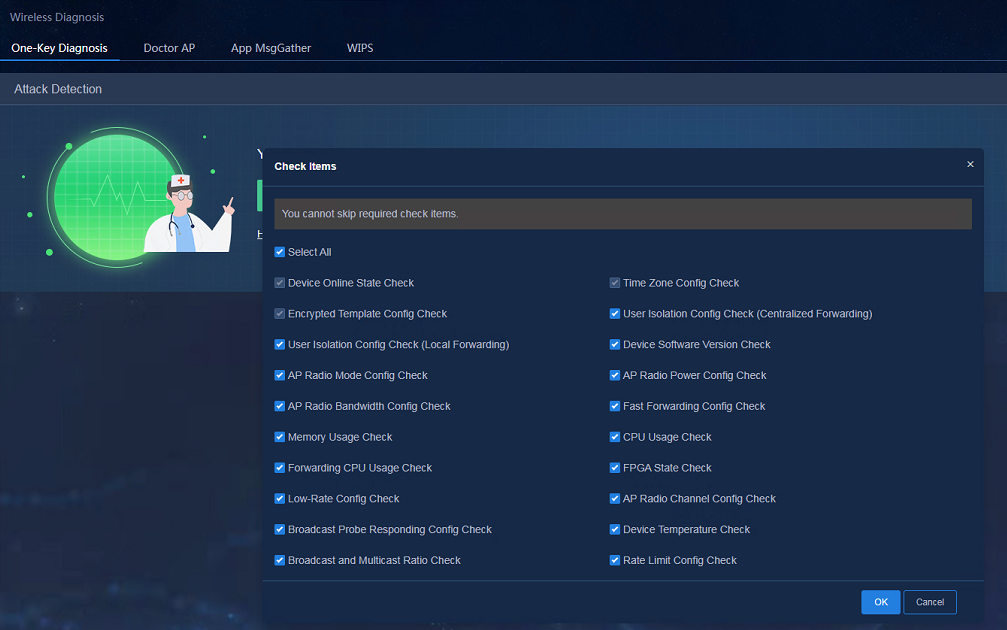
1. Navigate to the Analysis > Diagnosis Analysis > Wireless Diagnosis > One-Key Diagnosis page, click Check Items, and select the check items in the window that opens.
Figure 53 Checking the items
2. After selecting the items for check, click Diagnose and click Start Diagnosis in the dialog box that opens to perform the diagnosis.
Figure 54 One-key diagnosis

Doctor AP
Doctor AP supports manual detection and automatic detection.
Manual detection
1. Navigate to the Analysis > Diagnosis Analysis > Wireless Diagnosis > Doctor AP > Manual page and click the Sync button to synchronize the site data.
2. Click the Add Manual Test Item button and enter the parameters on the page that opens.
¡ Doctor AP mode: Select Intelligent or Manual. The intelligent mode supports selecting Doctor AP automatically and the manual mode requires you to select Doctor AP manually.
¡ Set CRITICAL AP: Click View Critical APs and select the AP in the AP list on the page that opens. Click Configure As Critical AP after the AP is selected as Doctor AP. Because the endpoint connected to this AP will be disconnected from the network, the AP configured as the critical AP will be excluded during the inspection.
¡ AC: Select the associated AC of the tested AP.
¡ AP Name: Select the tested AP.
¡ Radio: Select the radio of the tested AP.
¡ SSID: Select the SSID to be tested.
¡ Password: Enter the SSID password if the password is required to connect to the SSID.
¡ Doctor AP Selection Policy (for intelligent mode): The APs, except the critical APs, follow two policies to be set as Doctor APs during the inspection.
- Default policy: Automatically configure the AP with zero endpoint connection as the Doctor AP in the current site. If the AP cannot be found, look for the APs with total upstream and downstream traffic not exceeding 10 MB within one hour. If the AP still cannot be found, skip the detection of the AP.
- Custom policy: Customize the maximum number of endpoint connections and the maximum total upstream and downstream traffic within one hour. Only when these two indexes on the AP are lower than the custom threshold at the same time, the AP can be selected as a Doctor AP.
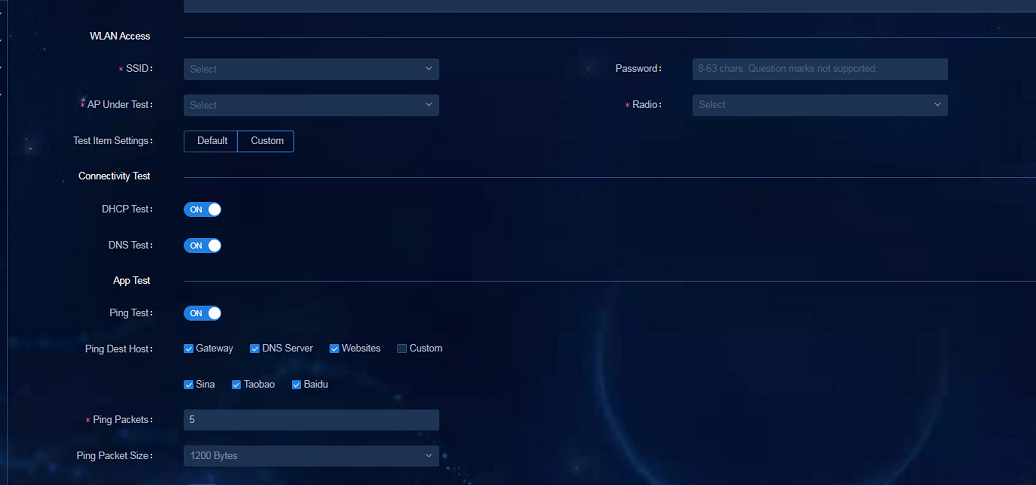
¡ Test Item Settings: You can select Default or Custom.
¡ DHCP Test: Select whether to perform DHCP diagnosis.
¡ DNS Test: Select whether to perform DNS diagnosis.
¡ Ping Test: Select whether to enable the ping test as needed.
¡ Ping Dest Host: Select or customize the destination host for the ping test as needed.
¡ Ping Packets: Enter the number of ping packets. The default value is 5.
¡ Ping Packet Size: Select the large packet (1200 bytes) or small packet (64 bytes) for the ping package length.
¡ HTTP: Select whether to enable the HTTP test as needed.
¡ HTTP Destination Host: Select Known Websites or Custom Websites as needed.
3. After the parameters are configured, click Run Now.
|
|
CAUTION: For wireless access, SSIDs with 802.1X authentication are not supported. |
Figure 55 Doctor AP manual detection in intelligent mode
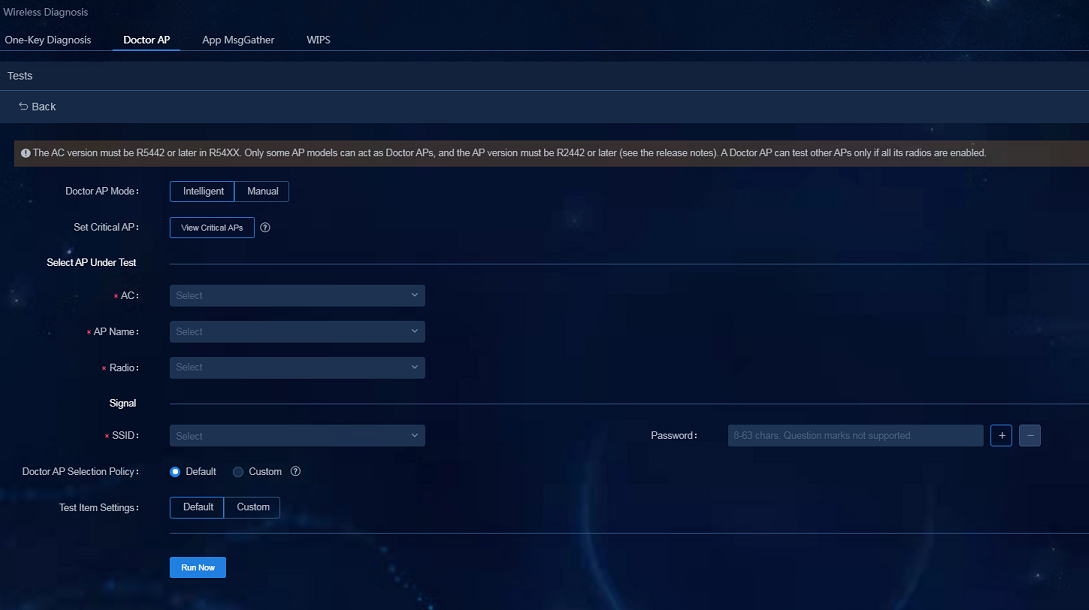
Figure 56 Doctor AP manual detection in manual mode
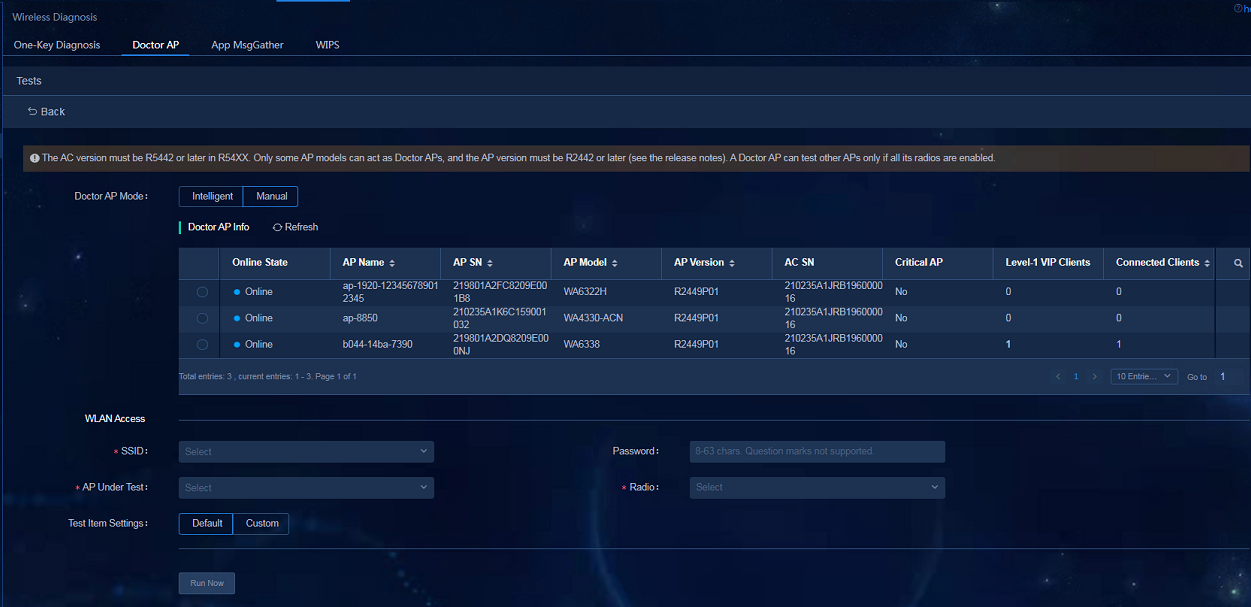
Figure 57 Doctor AP manual detection with custom policies
Automatic detection
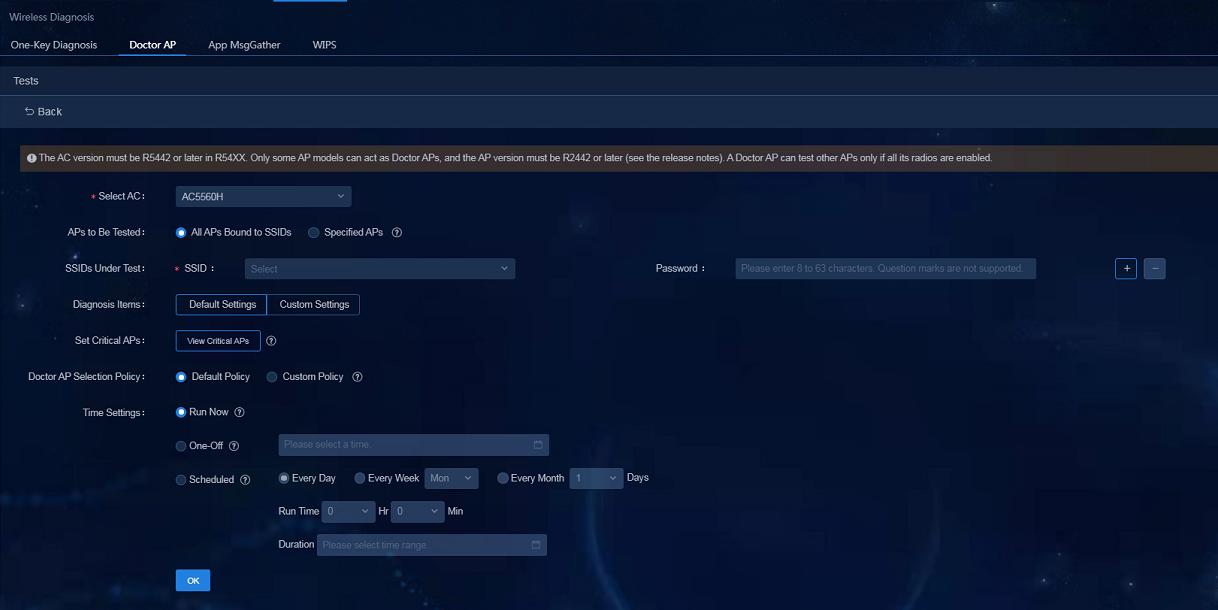
1. Navigate to the Analysis > Diagnosis Analysis > Wireless Diagnosis > Doctor AP > Intelligent page and click the Sync button to synchronize the site data.
2. Click the Add Manual Test Item button and enter the parameters on the page that opens.
¡ Select AC: Select the AC.
¡ APs to Be Tested: Select All APs Bound to SSIDs or Specified APs.
¡ All APs Bound to SSIDs: Automatically select the APs bound to the measured signal and automatically select up to 128 online APs.
¡ Specified APs: You can specify the APs to be tested.
¡ SSID: Select the SSID to be tested.
¡ Password: Enter the SSID password if the password is required to connect to the SSID.
¡ Set Critical APs: Click View Critical APs and select the APs in the AP list on the page that opens. Click Configure As Critical AP after the AP is selected as Doctor AP. Because the endpoint connected to this AP will be disconnected from the network, the AP configured as the critical AP will be excluded during the inspection.
¡ Doctor AP Selection Policy (for intelligent mode): The APs, except the critical APs, follow two policies to be configured as Doctor APs during the inspection.
- Default policy: Automatically configure the AP with zero endpoint connection as the Doctor AP in the current site. If the AP cannot be found, look for the APs with total upstream and downstream traffic not exceeding 10 MB within one hour. If the AP still cannot be found, skip the detection of the AP.
- Custom policy: Customize the maximum number of endpoint connections and the maximum total upstream and downstream traffic within one hour. Only when these two indexes on the AP are lower than the custom threshold at the same time, the AP can be selected as a Doctor AP.
¡ Time Settings: You can select Run Now, One-Off, or Scheduled as needed.
¡ Test Item Settings: You can select Default or Custom.
¡ DHCP Test: Select whether to perform DHCP diagnosis.
¡ DNS Test: Select whether to perform DNS diagnosis.
¡ Ping Test: Select whether to enable the ping test as needed.
¡ Ping Dest Host: Select or customize the destination host for the ping test as needed.
¡ Ping Packets: Enter the number of ping packets. The default value is 5.
¡ Ping Packet Size: Select the large packet (1200 bytes) or small packet (64 bytes) for the ping package length.
¡ HTTP: Select whether to enable the HTTP test as needed.
¡ HTTP Destination Host: Select Known Websites or Custom Websites as needed.
3. After the parameters are configured, click OK.
Figure 58 Configuring the automatic detection of Doctor AP
|
|
CAUTION: To use the Doctor AP detection function, the AP must support the Doctor AP function. Make sure the AP supports the Doctor AP function before configuration. This function might vary on different APs. |
Setting the mobile APP detection
Configuring the internal edge IP address
The internal edge IP address is the internal IP address of the device connected to the external network.
Navigate to the Analysis > Diagnosis Analysis > Wireless Diagnosis > Mobile APP page and click Probe Settings. In the Internal Edge IP List area, click Add. In the Add Internal Edge dialog box that opens, enter the IP address and click OK.
Figure 59 Configuring the internal edge IP address
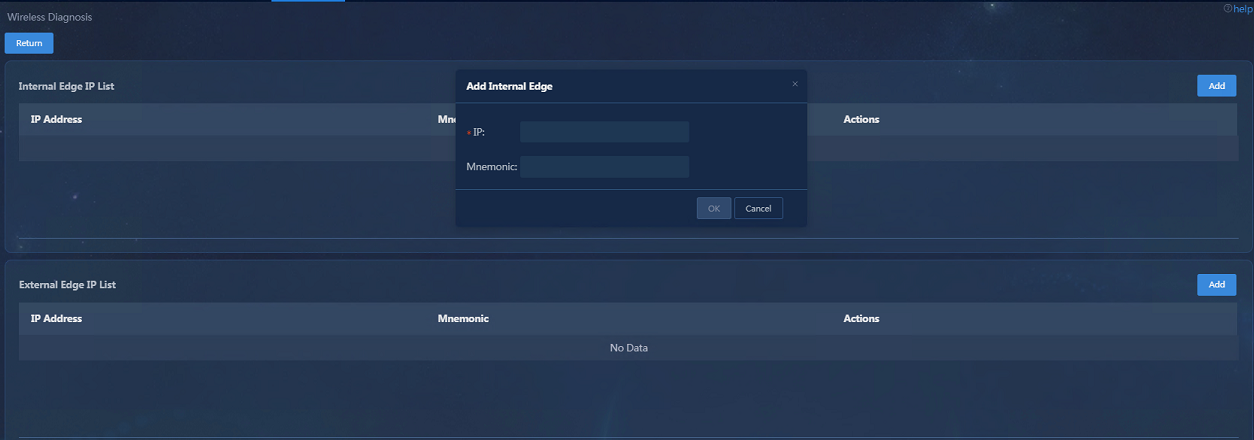
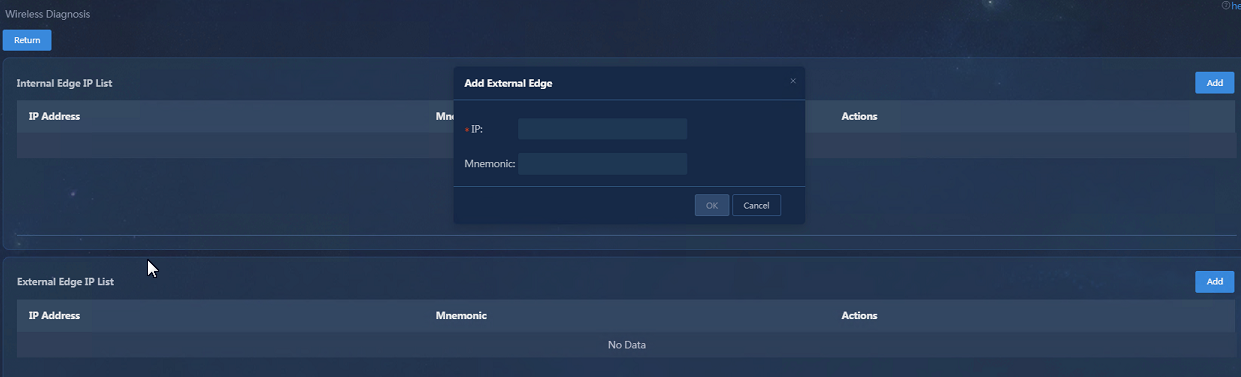
Configuring the external edge IP address
The external edge IP address is the external IP address of the device connected to the external network.
Navigate to the Analysis > Diagnosis Analysis > Wireless Diagnosis > Mobile APP page and click Probe Settings. In the External Edge IP List area, click Add. In the Add External Edge dialog box that opens, enter the IP address and click OK.
Figure 60 Configuring the external edge IP address
Configuring site registration information
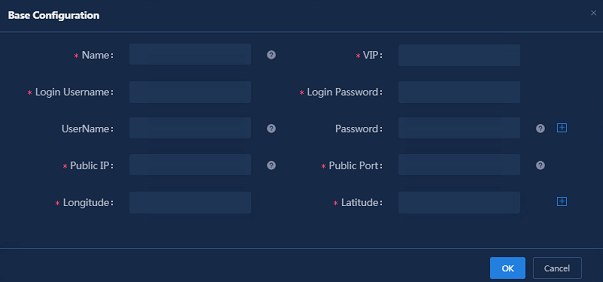
Navigate to the Analysis > Diagnosis Analysis > Wireless Diagnosis > Mobile APP page and click Probe Settings. On the Registration Info page, click Add. In the Base Configuration dialog box that opens, specify the following parameters:
· Name: Enter the name of the site.
· VIP: Enter the northbound service VIP address.
· Login Username: Enter the username for logging in to the system.
· Login Password: Enter the password for logging in to the system.
· Username: Enter the username for logging in to the Unified Platform cluster node.
· Password: Enter the password for logging in to the Unified Platform cluster node. If all nodes have the same username and password, enter one of them. If they have different usernames and passwords, add the nodes by clicking the + icon.
· Public IP: Enter the northbound service VIP address mapped to the public network.
· Public Port: Enter the port number of the northbound service VIP address mapped to the public network.
· Longitude: Enter the longitude of the site location with 5 to 6 decimal places.
· Latitude: Enter the latitude of the site location with 5 to 6 decimal places.
Figure 61 Configuring registration information
WLAN security detection
The WLAN security detection includes Attack Detection, SSID Detection, and MAC Spoofing Detection.
Attack detection
1. If SeerEngine-Campus is deployed, navigate to the Automation > Campus Network > Network Devices > Wireless Device page, and select WLAN Security from the Related Links list. On the Attack Detection tab, enable Attack Detection. Select the Detection Level and confirm the countermeasure items.
2. If SeerEngine-Campus is not deployed, navigate to the Automation > Campus Network > Wireless Device > AC page, and select WLAN Security from the Related Links list. On the Attack Detection tab, enable Attack Detection. Select the Detection Level and confirm the countermeasure items.
Figure 62 Selecting WLAN security

Figure 63 Enabling attack detection

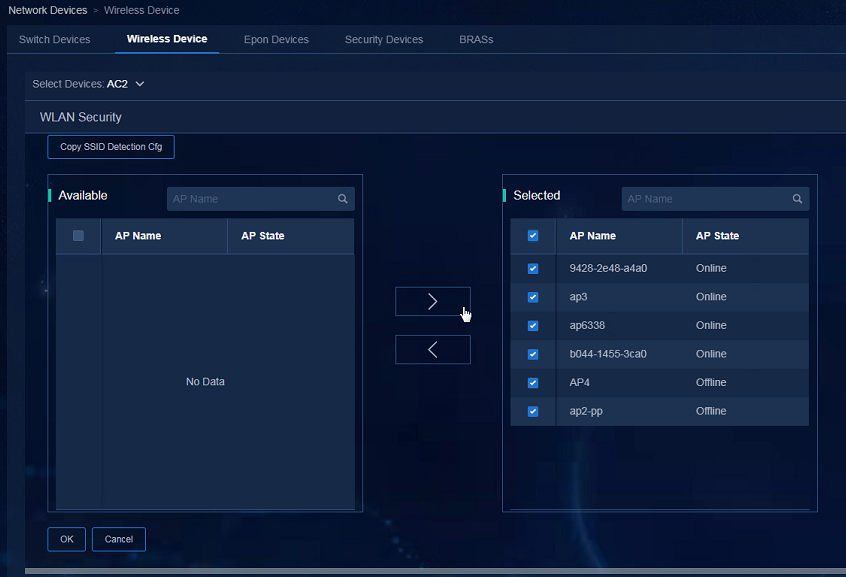
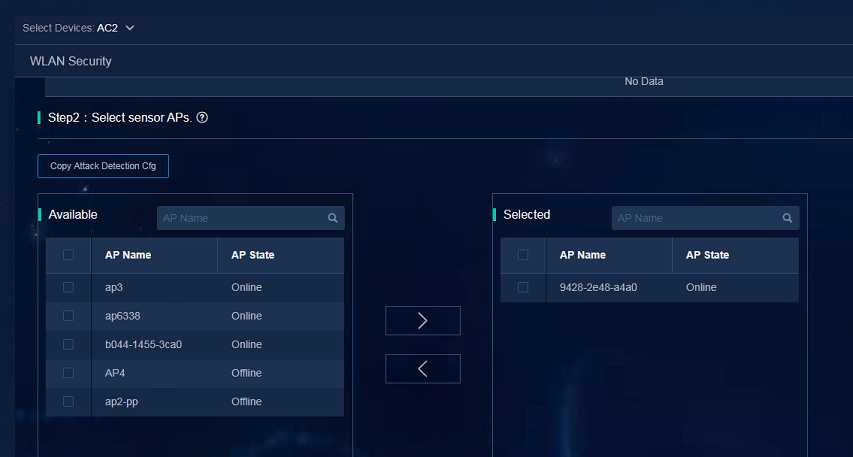
3. Select the tested APs and click OK to complete the configuration.
Figure 64 Selecting the tested APs
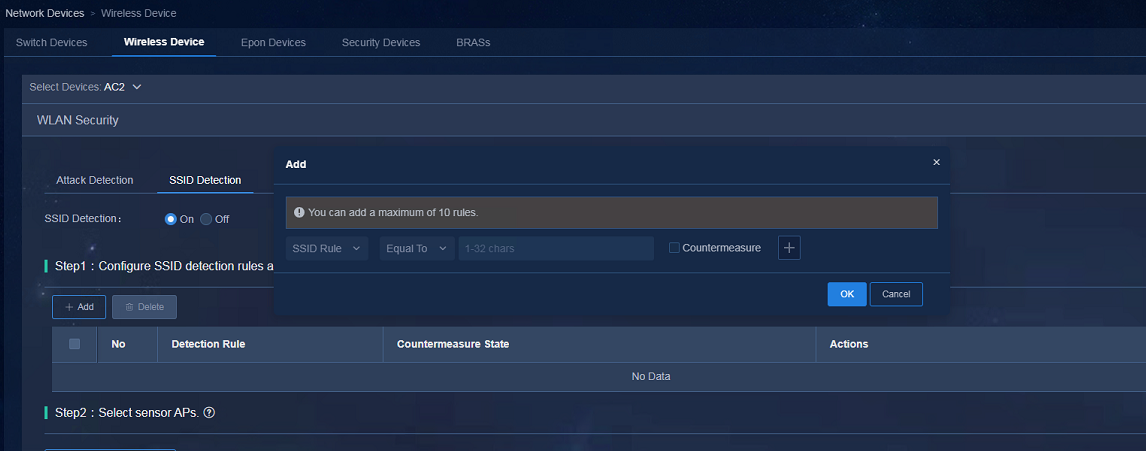
SSID detection
1. If SeerEngine-Campus is deployed, navigate to the Automation > Campus Network > Network Devices > Wireless Device page, and select WLAN Security from the Related Links list. On the SSID Detection tab, enable SSID Detection. Configure the SSID detection rules and confirm the countermeasure items.
2. If SeerEngine-Campus is not deployed, navigate to the Automation > Campus Network > Wireless Device > AC page, and select WLAN Security from the Related Links list. On the SSID Detection tab, enable SSID Detection. Configure the SSID detection rules and confirm the countermeasure items.
Figure 65 SSID detection
3. Select the tested APs and click OK to complete the configuration.
Figure 66 Selecting the tested APs
MAC spoofing detection
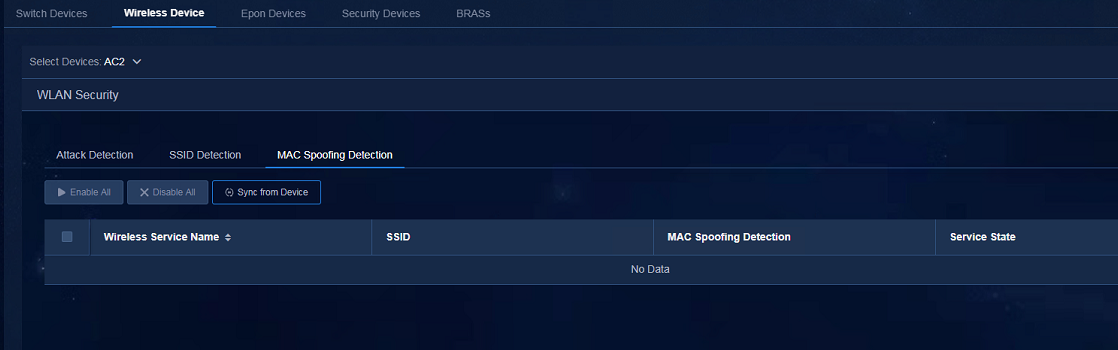
1. If SeerEngine-Campus is deployed, navigate to the Automation > Campus Network > Network Devices > Wireless Device page, and select WLAN Security from the Related Links list. On the MAC Spoofing Detection tab, enable MAC Spoofing Detection.
2. If SeerEngine-Campus is not deployed, navigate to the Automation > Campus Network > Wireless Device > AC page, and select WLAN Security from the Related Links list. On the MAC Spoofing Detection tab, enable MAC Spoofing Detection.
Figure 67 MAC spoofing detection
One-key optimization
One-key optimization supports one-click scan and optimization on the selected APs and shows the comparison of parameters before and after optimization.
Adding spaces
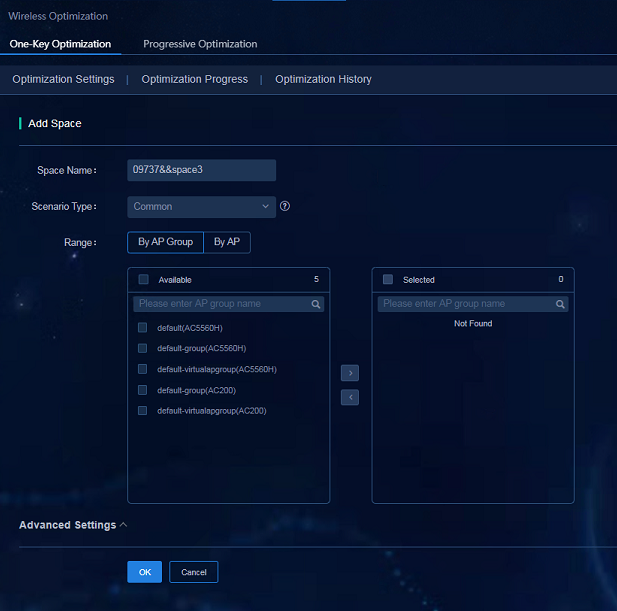
1. Navigate to the Analysis > Disposition Assurance > Wireless Optimization > One-Key Optimization > Optimization Settings page. On the Wireless Optimization tab, click the + icon to add a space.
¡ Space Name: The space name is automatically generated, which can be modified as needed.
¡ Scenario Type: Select the scenario type as needed.
¡ Range: Select By AP Group or By AP.
2. Click OK.
Figure 68 Adding spaces
Performing one-key optimization
Navigate to the Analysis
> Disposition Assurance > Wireless Optimization > One-Key
Optimization > Optimization Settings page,
find the space, and click the ![]() icon to perform
one-key optimization.
icon to perform
one-key optimization.
Figure 69 Performing one-key optimization

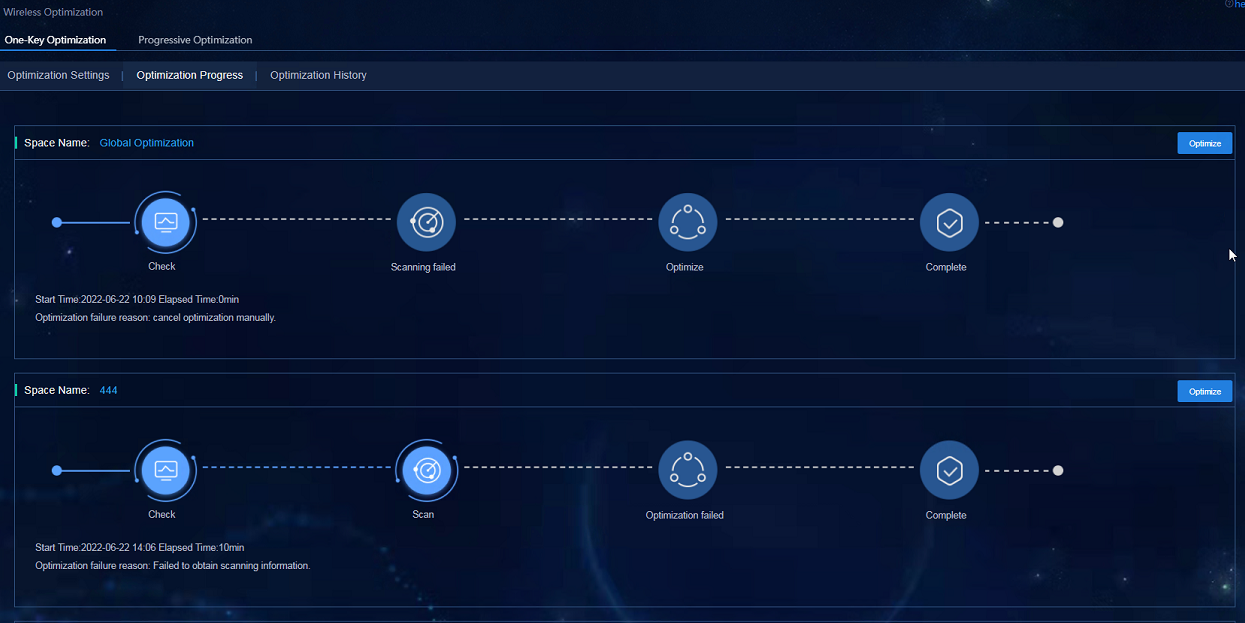
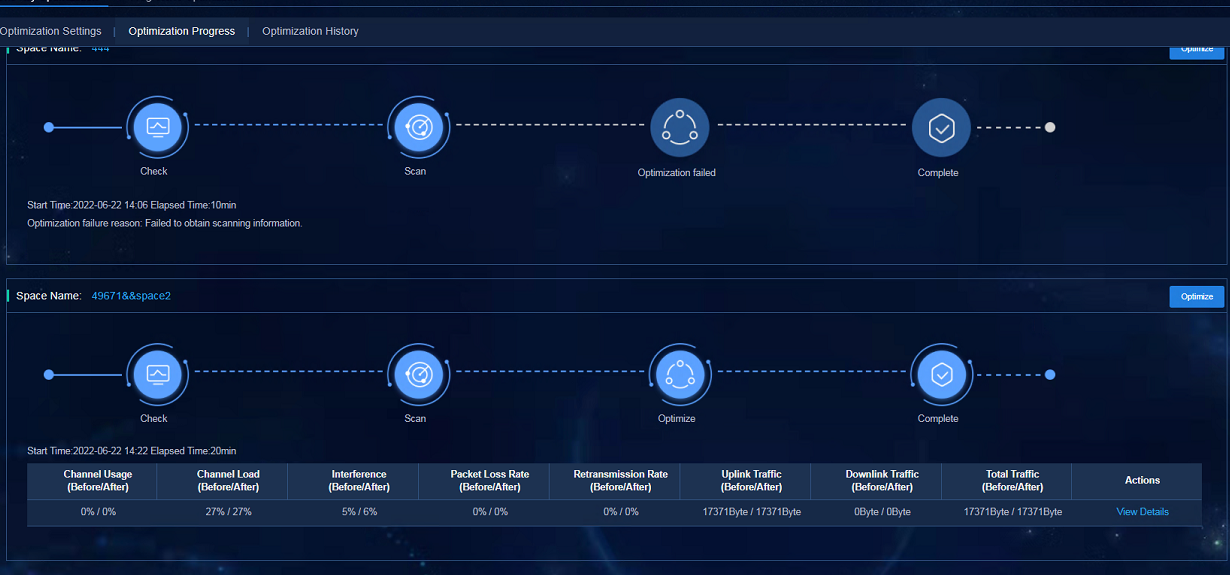
Alternatively, navigate to the Analysis > Disposition Assurance > Wireless Optimization > One-Key Optimization > Optimization Progress page, find the space, and click Optimize.
Figure 70 Optimization progress
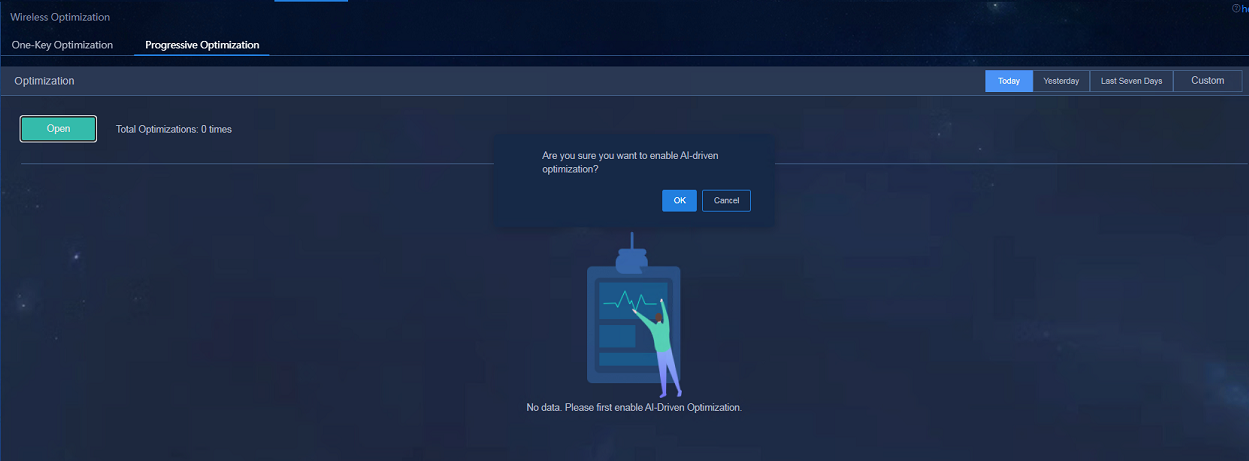
Configuring AI-driven optimization
Navigate to the Analysis > Disposition Assurance > Wireless Optimization > AI-Driven Optimization page, click Open, and then click OK to complete the configuration.
Figure 71 Configuring AI-driven optimization
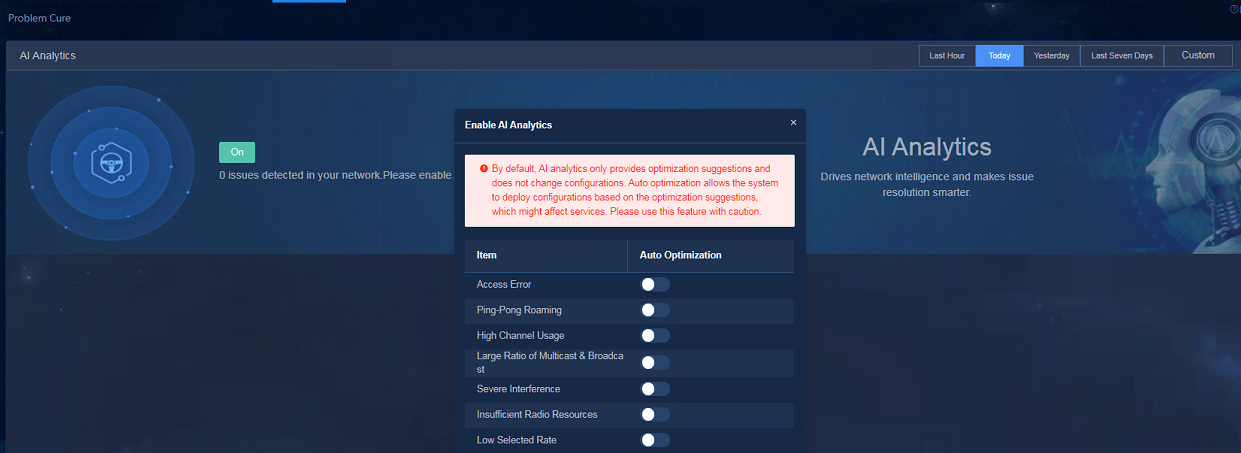
Configuring AI analytics
Navigate to the Analysis > Disposition Assurance > Problem Cure page, click On, and enable the Auto Optimization items in the window that opens.
· Item: Indicates the types of problems that can be optimized.
· Auto Optimization: If Auto Optimization is not enabled, only optimization suggestions are provided. If Auto Optimization is enabled, the configuration will be issued based on the processing strategy for the item, which might affect services. Enable Auto Optimization with caution.
Figure 72 Configuring AI analytics
Displaying analysis results
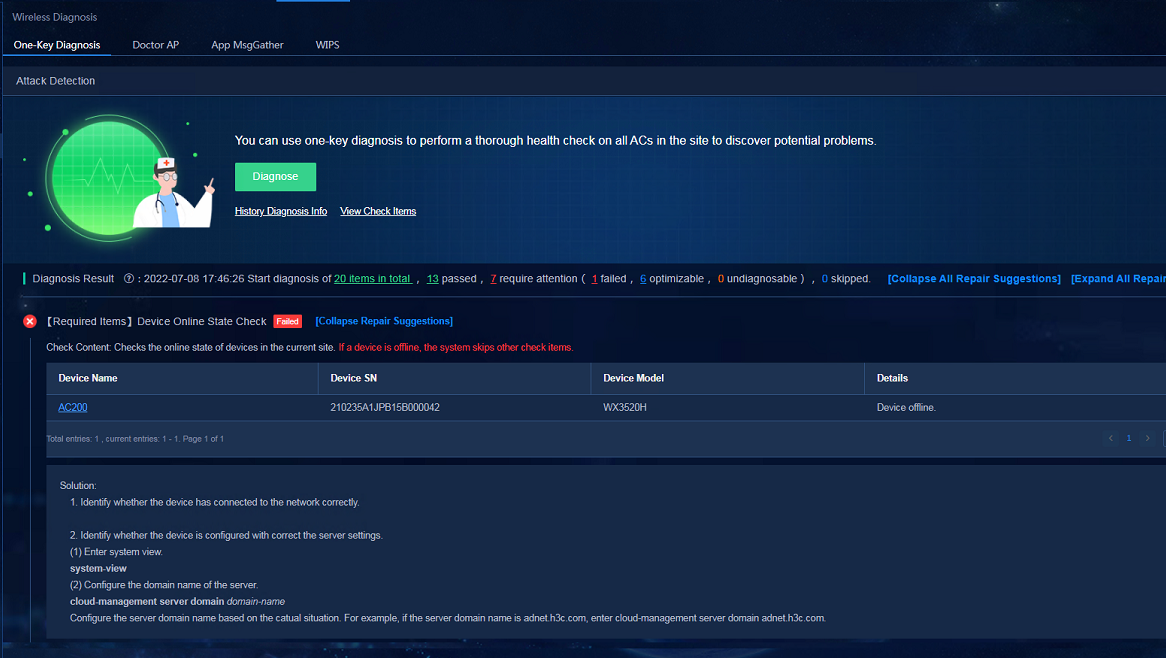
· One-Key Diagnosis: Navigate to the Analysis > Diagnosis Analysis > Wireless Diagnosis > One-Key Diagnosis page. Once the one-key diagnosis is completed, you can view the data about diagnosis results, check items, and repair suggestions.
Figure 73 One-key diagnosis
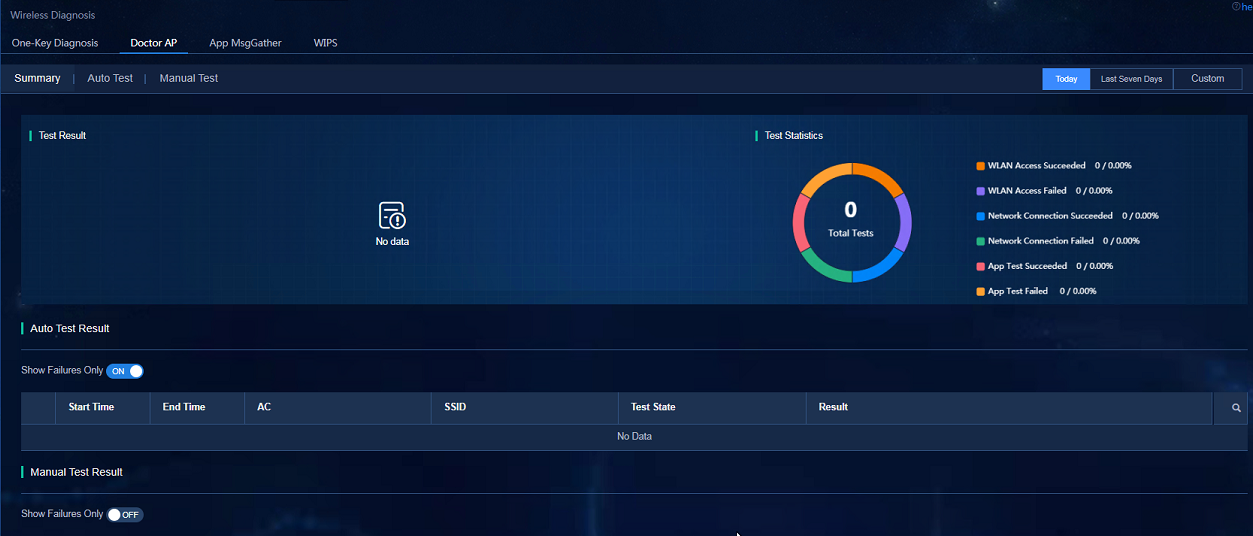
· Doctor AP: Navigate to the Analysis > Diagnosis Analysis > Wireless Diagnosis > Doctor AP page, and click the Summary tab. After Doctor AP diagnosis is completed, view the data in test results, test statistics, test lists, and other widgets.
Figure 74 Doctor AP page
· One-Key Optimization: Navigate to the Analysis > Disposition Assurance > Wireless Optimization > One-Key Optimization > Optimization Progress page to view the optimization progress. After the optimization is completed, there are parameters comparisons before and after the optimization. You can click View Details to view the detailed data.
Figure 75 One-key optimization page
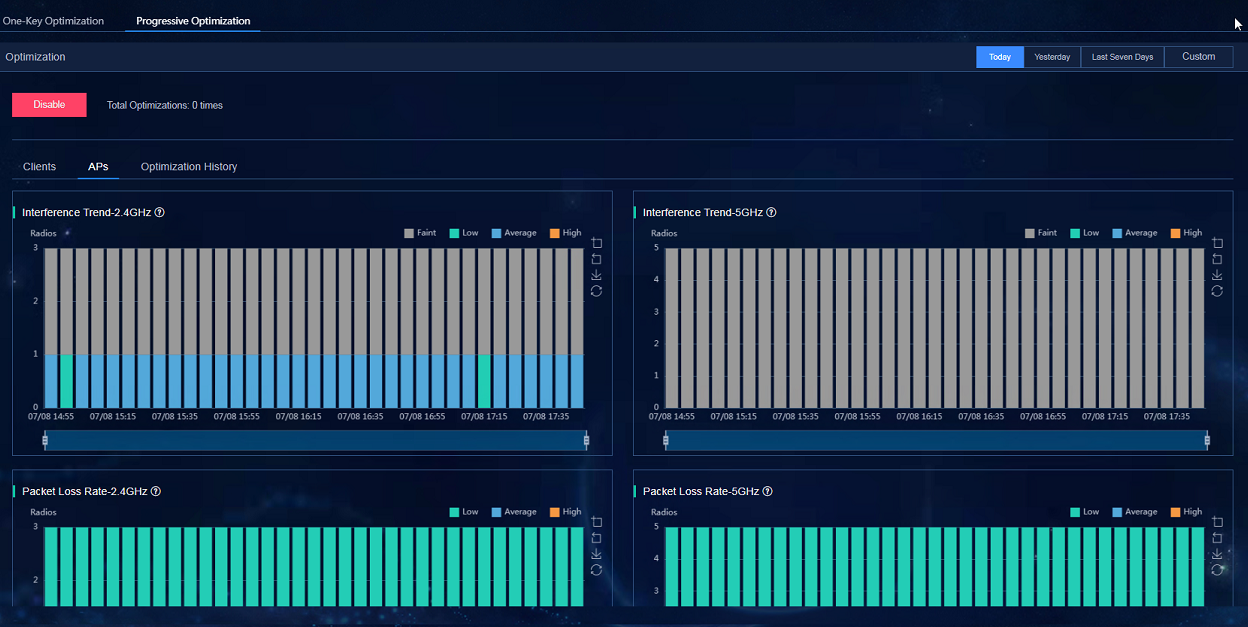
· AI-Driven Optimization: Navigate to the Analysis > Disposition Assurance > AI-Driven Optimization page to view the total number of optimizations and optimization history.
Figure 76 AI-driven optimization
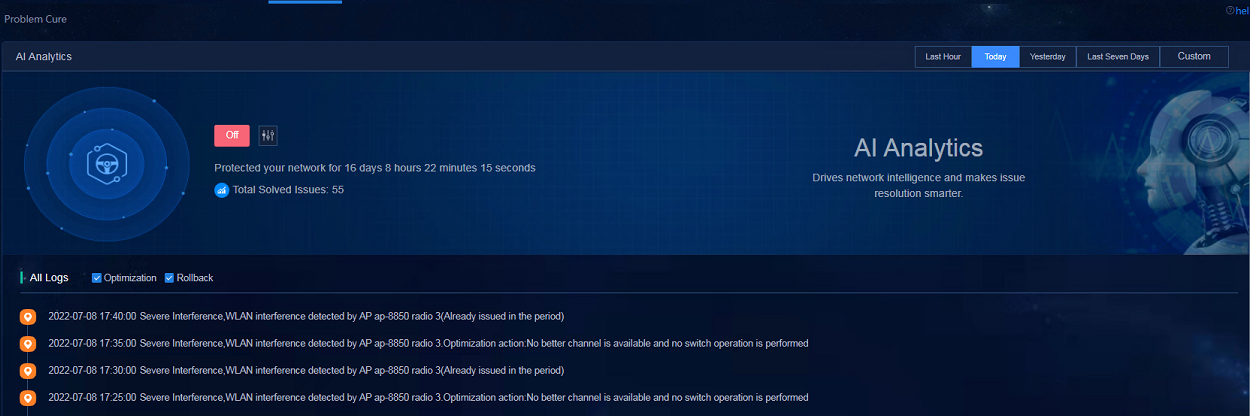
· AI Analytics: Navigate to the Analysis > Disposition Assurance > AI Analytics page to view data about the total solved issues and logs.
Figure 77 AI analytics
· WLAN security detection:
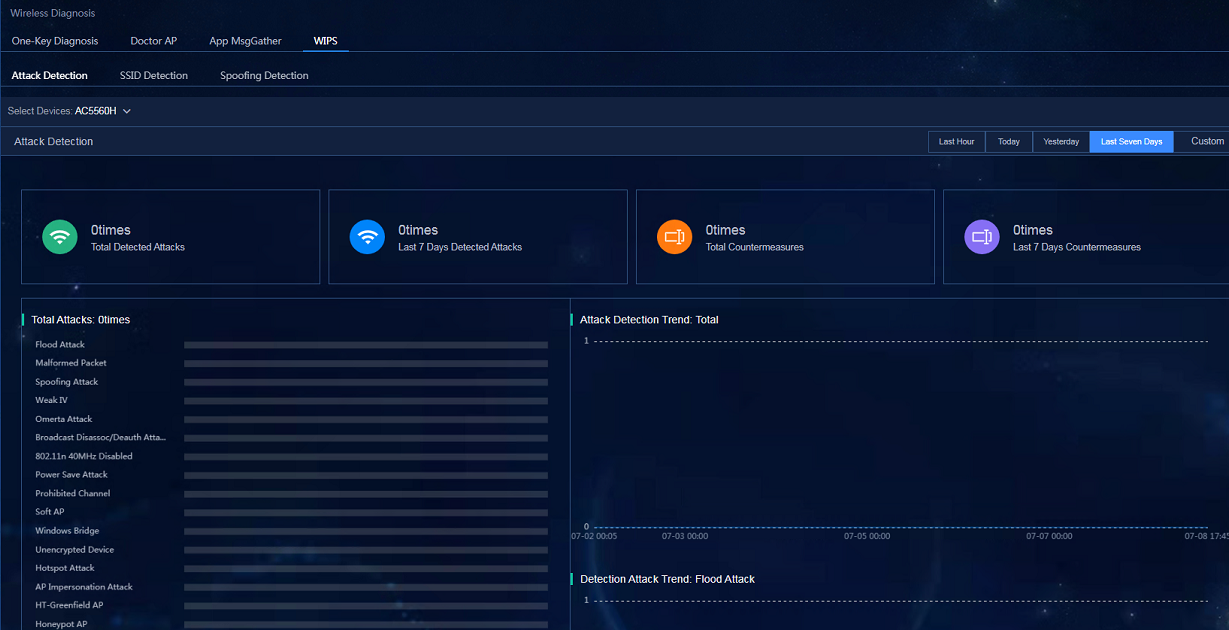
¡ Attack Detection: Navigate to the Analysis > Diagnosis Analysis > Wireless Diagnosis > WIPS > Attack Detection page to view the data in the widgets including overview information and attack detection trend.
Figure 78 Attack detection
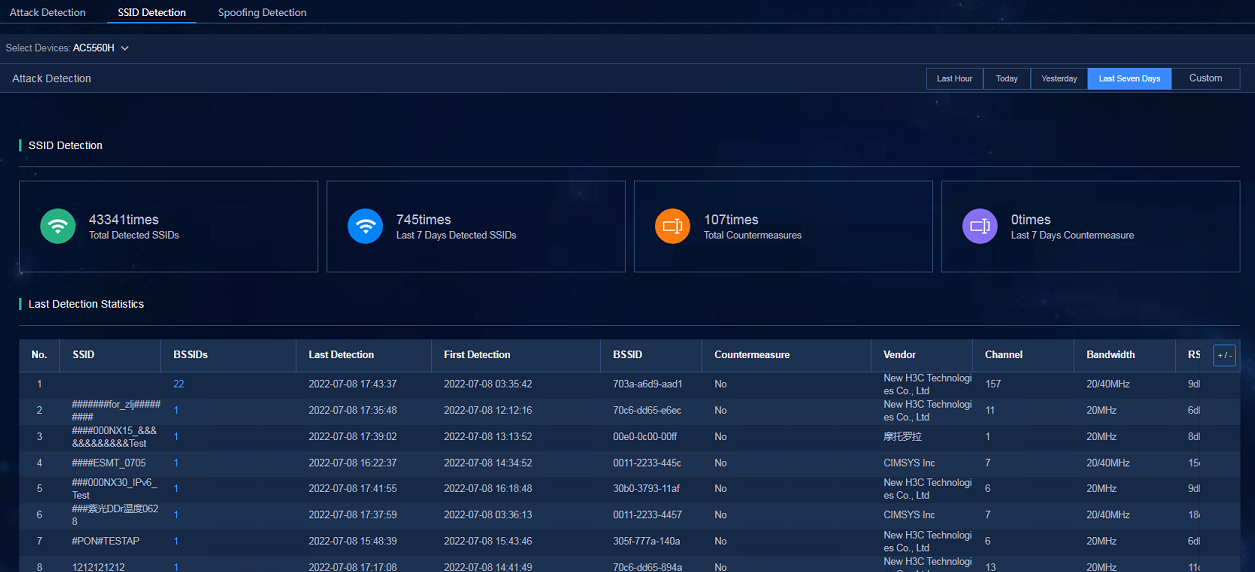
¡ SSID Detection: Navigate to the Analysis > Diagnosis Analysis > Wireless Diagnosis > WIPS > SSID Detection page to view the data in the widgets including the overview information and last detection statistics.
Figure 79 SSID detection
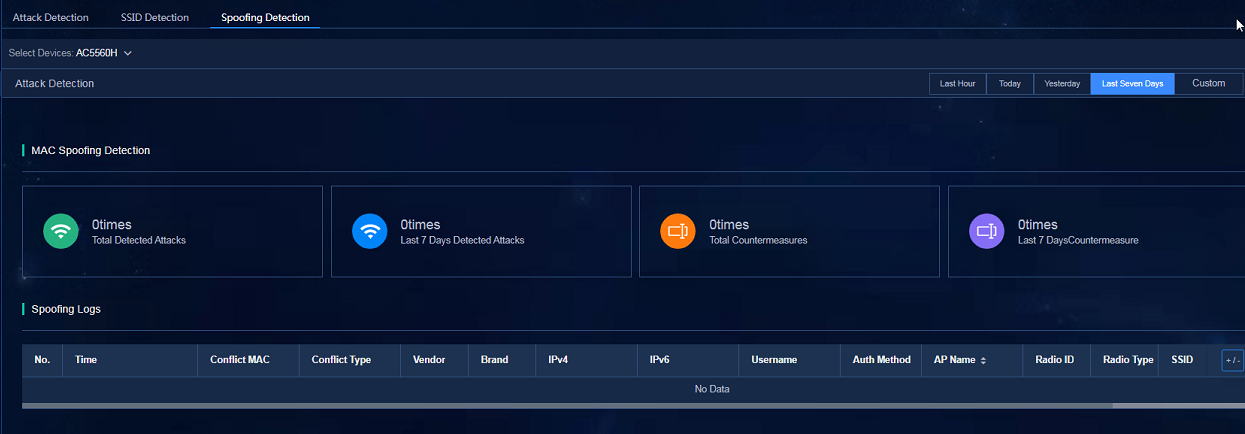
¡ Spoofing Detection: Navigate to the Analysis > Diagnosis Analysis > Wireless Diagnosis > WIPS > Spoofing Detection page to view the data in the widgets including the overview information and spoofing logs.
Figure 80 MAC spoofing detection
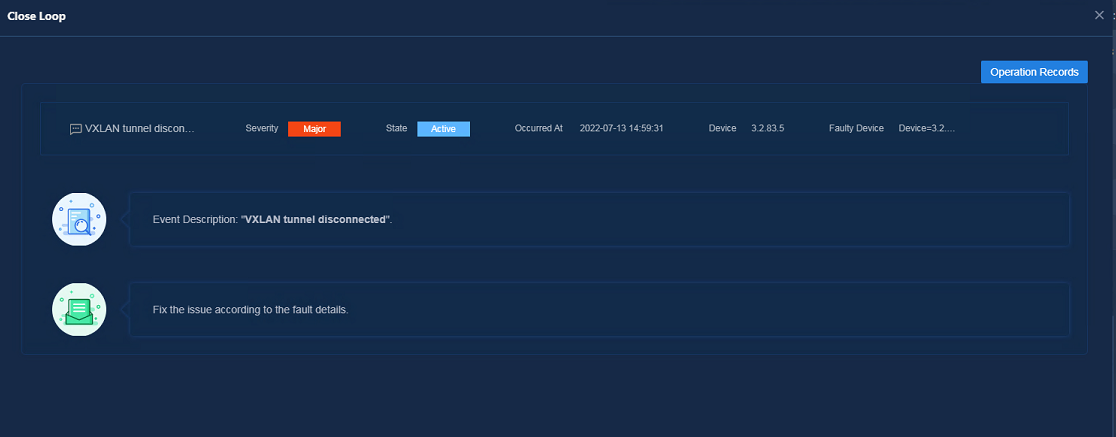
· Close Loop: Navigate to the Analysis > Diagnosis Analysis > Problem Center page. In the issue list, click the Close Loop button.
Figure 81 Closed loop fault management
Restrictions and guidelines
· For the Doctor AP, SSIDs with 802.1X authentication are not supported.
· To use the Doctor AP detection function, make sure the AP supports the Doctor AP function. Make sure the AP supports the Doctor AP function before configuration. This function might vary on different APs.
· If AI Analytics is enabled, only optimization suggestions are provided by default and no actual device configuration changes are made. If Auto Optimization is enabled, the configuration will be issued based on the processing policy for the item, which might affect services. Enable Auto Optimization with caution.
Configuring wired user services
The wired user services include the user health for wired users, VIP assurance for wired users, and the connection problems of wired users in the problem center.
· User Health—Displays the overall health trend of wired users, wired user list, and wired user details.
· VIP Analysis—Displays the overall health trend of wired VIP users, wired VIP user issues, wired VIP user list, and wired VIP user details.
· Problem Center—Displays the connection problems of wired VIP users.
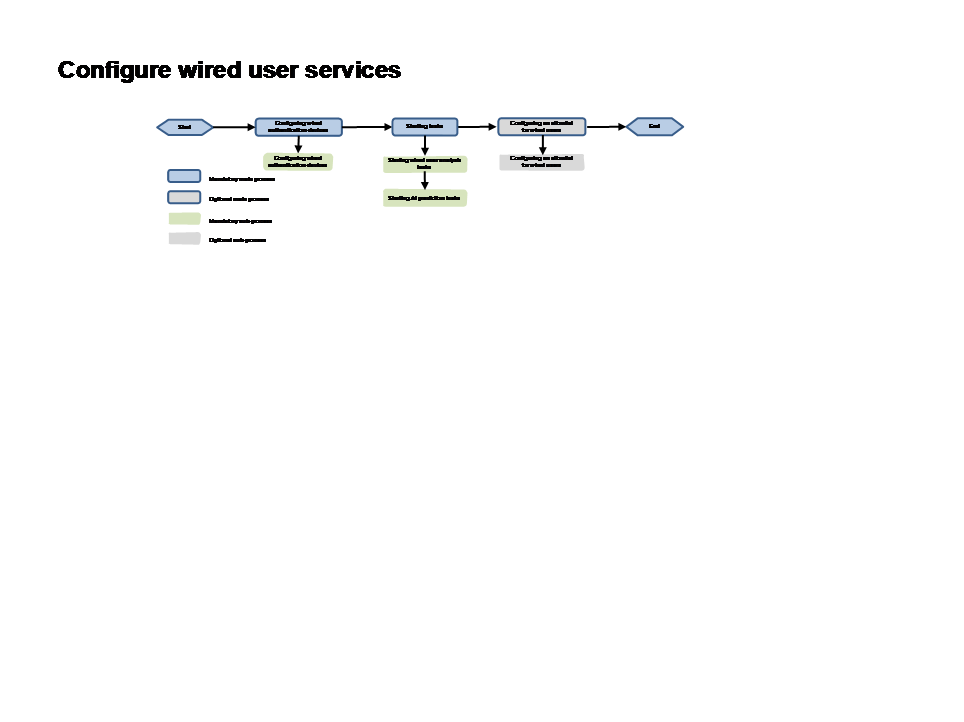
Configuration process
Figure 82 Flowchart of configuring wired user services
Network planning
For more information, see "Single-stack southbound network."
Configuration procedure
Configuring wired authentication devices
Configuring a leaf device (authentication device)
Configure a leaf device for wired user authentication and DHCP data collection.
|
|
CAUTION: Due to the relatively poor performance of H3C S5560X/S6520X Switch Series, as a best practice, do not configure gRPC when the S5560X/S6520X Switch Series devices are used as leaf devices in the network. |
grpc enable
telemetry
sensor-group s117 //Configure the sensor group and event types.
sensor path dhcpsp/dhcpuserevent
sensor path dot1x/dot1xauthtrace
sensor path maca/macauthtrace
destination-group d1 //Configure the destination group with a custom name.
ipv4-address 110.1.0.107 port 50051 vpn-instance vpn-default //Configure the IP address of the collector and related parameters. The IP address is configured as the southbound passive collector IP address. If the unified southbound and northbound network solution is used, the IP address is configured as the northbound service VIP address.
subscription b //Create the subscription, and associate it with the sensor group and the destination group. Sampling intervals are not required for event-triggered data collection.
sensor-group s117
destination-group d1
source-address 130.1.0.52 //Configure the IP address as the management IP address of the device.
#
Configuring an access device
Configure MAC Information
|
|
NOTE: The MAC Information function can be used by wired users to obtain access devices and access interfaces. It can also be used to identify authentication-free wired users. This function is configured when there are wired users and authentication-free wired users. |
1. Enable the global MAC Information function.
#
mac-address information enable
#
2. Enable the MAC Information function on the interface.
Configure the function on the access interface of the access device to obtain the access interface of wired users. This function is required for all interfaces with attached endpoints.
#
interface GigabitEthernet1/0/2
port access vlan 102
stp edged-port
mac-address information enable added //Enable reporting of online users.
mac-address information enable deleted //Enable reporting of offline users.
#
Starting tasks
Starting wired user analysis tasks
Navigate to the Analysis > Analysis Options > Task Management page, select the following tasks, and click Enable to start these tasks.
· SaUserStatisticsApplication
· Analysis on the health of new wired users
Starting AI prediction tasks
Navigate to the Analysis > Predict Analysis > AI Task Management page, select the following tasks in the task list, and click Batch Enable to start these tasks.
· Wired1hDHCPFailNum
· Wired1hAuthFailNum
· Wired1hDHCPSucessNum
· Wired1hAuthSuccessNum
· Wired5minsDHCPFailNum
· Wired5minsAuthFailNum
· Wired5minsDHCPSucessNum
· Wired5minsAuthSucessNum
Configuring an authentication-free allowlist for wired users
The wired user allowlist allows you to set the MAC address range of the authentication-free wired users. SeerAnalyzer confirms whether the MAC is used by the authentication-free user by getting the MAC address entry of the device and comparing it with the configured MAC address range. Even the authentication-free users configured before the SeerAnalyzer deployment can be detected and analyzed by SeerAnalyzer.
Adding an allowlist for wired users
Navigate to the Analysis > Analysis Options > Global Configuration page, select the Wired User Allowlists tab, and click Add.
· Start MAC Address: Enter the start address of the MAC addresses of the wired VIP users.
· End MAC Address: Enter the end address of the MAC addresses of the wired VIP users.
· Access Device Type: Select leaf or access as the device type. When it is set to leaf, you must enter names of the device and device interface that the user accesses.
· Device Name: In the dropdown list, you can select an incorporated leaf device. You can enter a device name to filter devices, or enter a non-incorporated device and select it.
· Device Interface: In the dropdown list, you can select an interface of an incorporated leaf device. You can enter an interface name to filter interfaces, or enter an interface of a non-incorporated device and select it.
Figure 83 Adding an allowlist for wired users
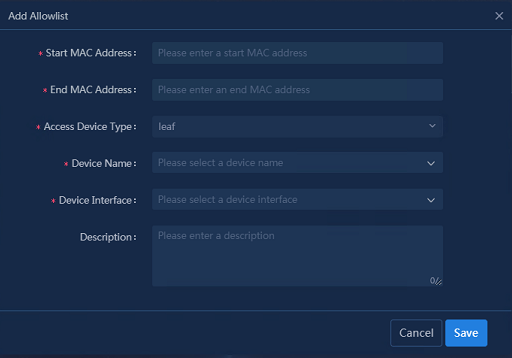
Adding an allowlist for wired users in batches
1. Download an Excel template, navigate to the Analysis > Analysis Options > Global Configuration page, select the Wired User Allowlists tab, and click the Download Template button.
2. Enter data in the Excel template: Include Start MAC Address, End MAC Address, Access Device Type (the Device Name and Device Interface of the leaf devices cannot be empty), Device Name (optional), Device Interface (optional), and Description (optional).
3. Click the Import button and select the Excel file to import the wired user allowlist.
Configuring NETCONF to collect MAC address entry data
SeerAnalyzer must collect the MAC/L2VPN MAC address entries to detect the authentication-free users before SeerAnalyzer deployment. For leaf devices, as a best practice, configure gRPC to incrementally upload entries. For the configuration, see "Configuring a spine device." For access devices, as a best practice, configure NETCONF to collect MAC address entries.
Navigate to the Analysis > Analysis Options > Collection Parameters > Template Management > NETCONF page, and select the Campus standard collection template. Click Add (Clone) and specify the following parameters. Then you can customize the template based on the collection items cloned from the existing template.
· Template Name: Enter the name of the template.
· Remarks: Optional. This field is used to describe the usage and characteristics of the template.
· Collected Metrics: Select MAC_MacUnicastTable in addition to the existing metrics.
Figure 84 Adding (Cloning) a NETCONF collection template
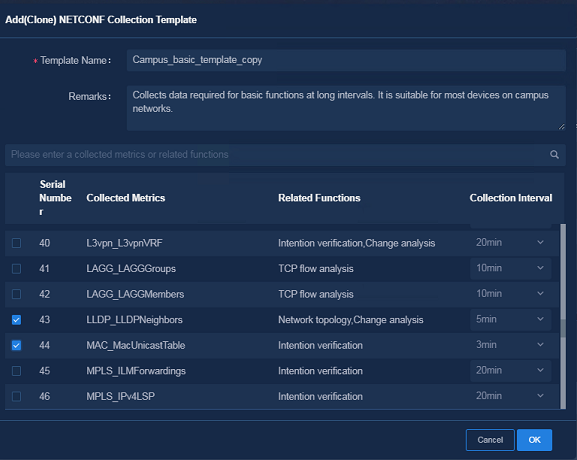
Displaying analysis results
· User health: Navigate to the Analysis > Health Analysis > User Analysis > User Health page to view the widgets related to user health. The data about wired users is displayed. You can click the username for a wired user to view the details of the wired user in the dialog box that opens.
Figure 85 Viewing the wired user health
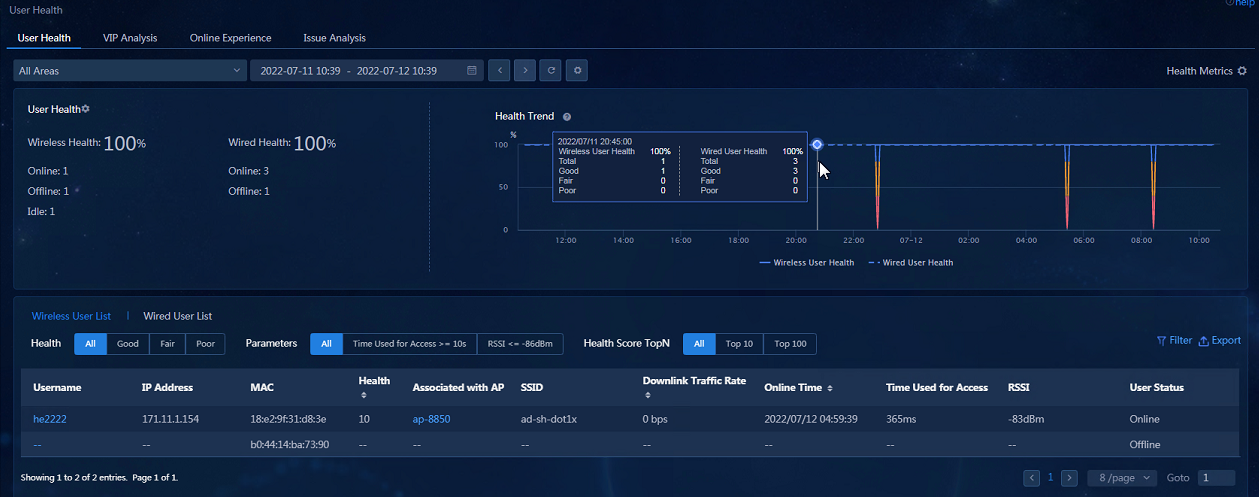
· VIP Analysis: Navigate to the Analysis > Health Analysis > User Analysis > User Health > VIP Analysis page to view the widgets related to wired users. The data about wired users is displayed. You can click the username for a wired user to view the details of the wired user in the dialog box that opens.
Figure 86 Viewing the wired user VIP analysis
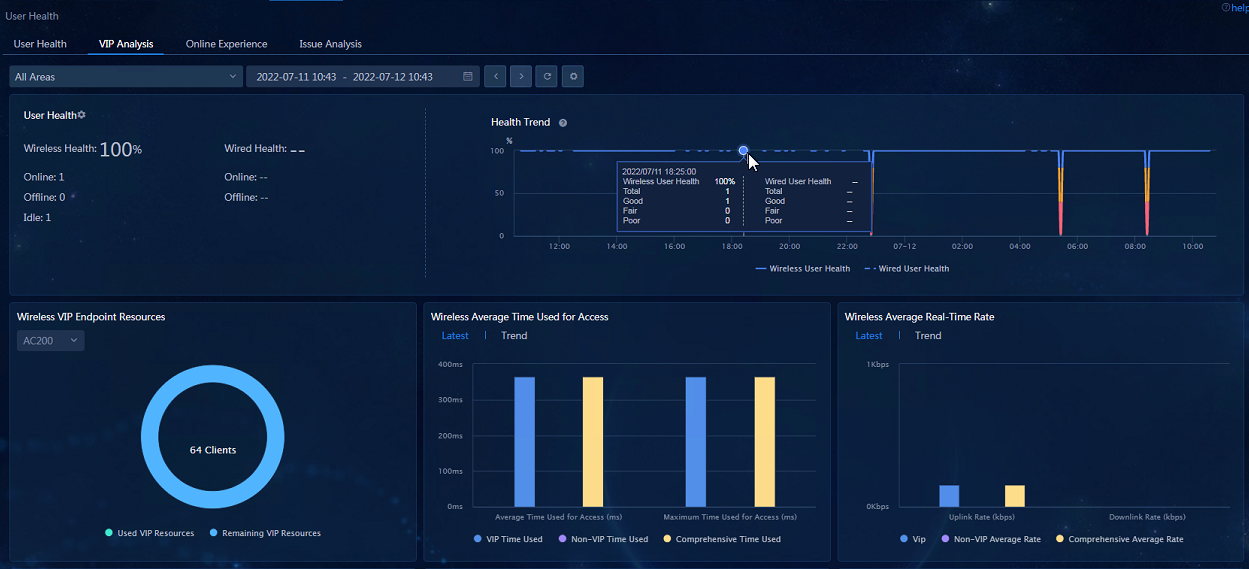
· Problem Center: Navigate to the Analysis > Diagnosis Analysis > Problem Center page to view the Connection problems on the Network tab. The wired user group problems are displayed.
Figure 87 Viewing the wired user problems in Problem Center
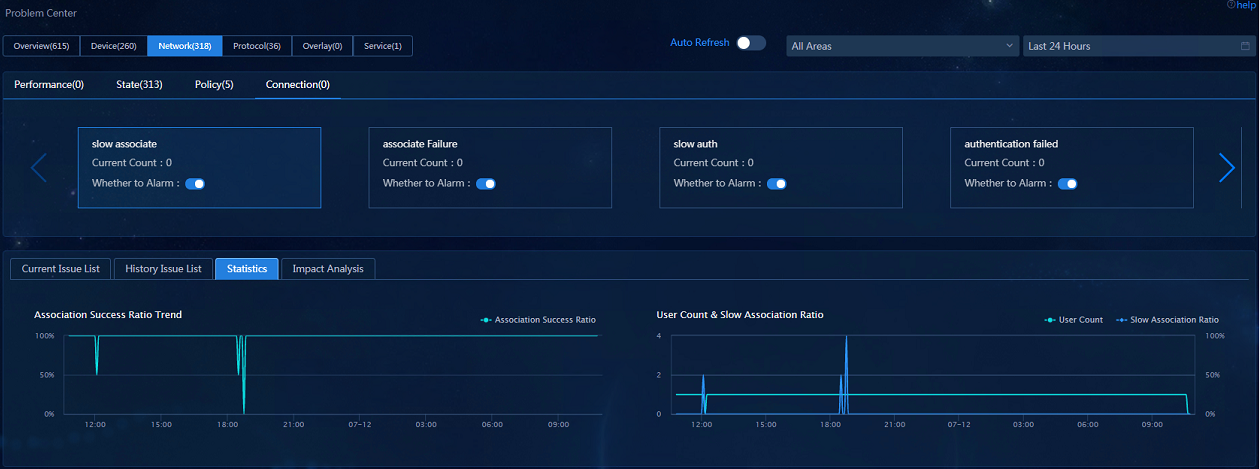
Restrictions and guidelines
· Due to the relatively poor performance of H3C S5560X/S6520X Switch Series, as a best practice, do not configure gRPC when H3C S5560X/S6520X Switch Series are used as leaf devices in the network.
Configuring audio and video quality analysis
The audio and video quality analysis function monitors the quality of audio and video traffic on network devices accessed by clients, servers, and media gateways, identifies network issues such as frequent packet loss and excessive jitters based on the device health and other KPIs, and ensures the quality of audio and video traffic by network expansion, contacting audio and video solution providers, and other measures.
Configuration process
Figure 88 Flowchart of configuring audio and video quality analysis
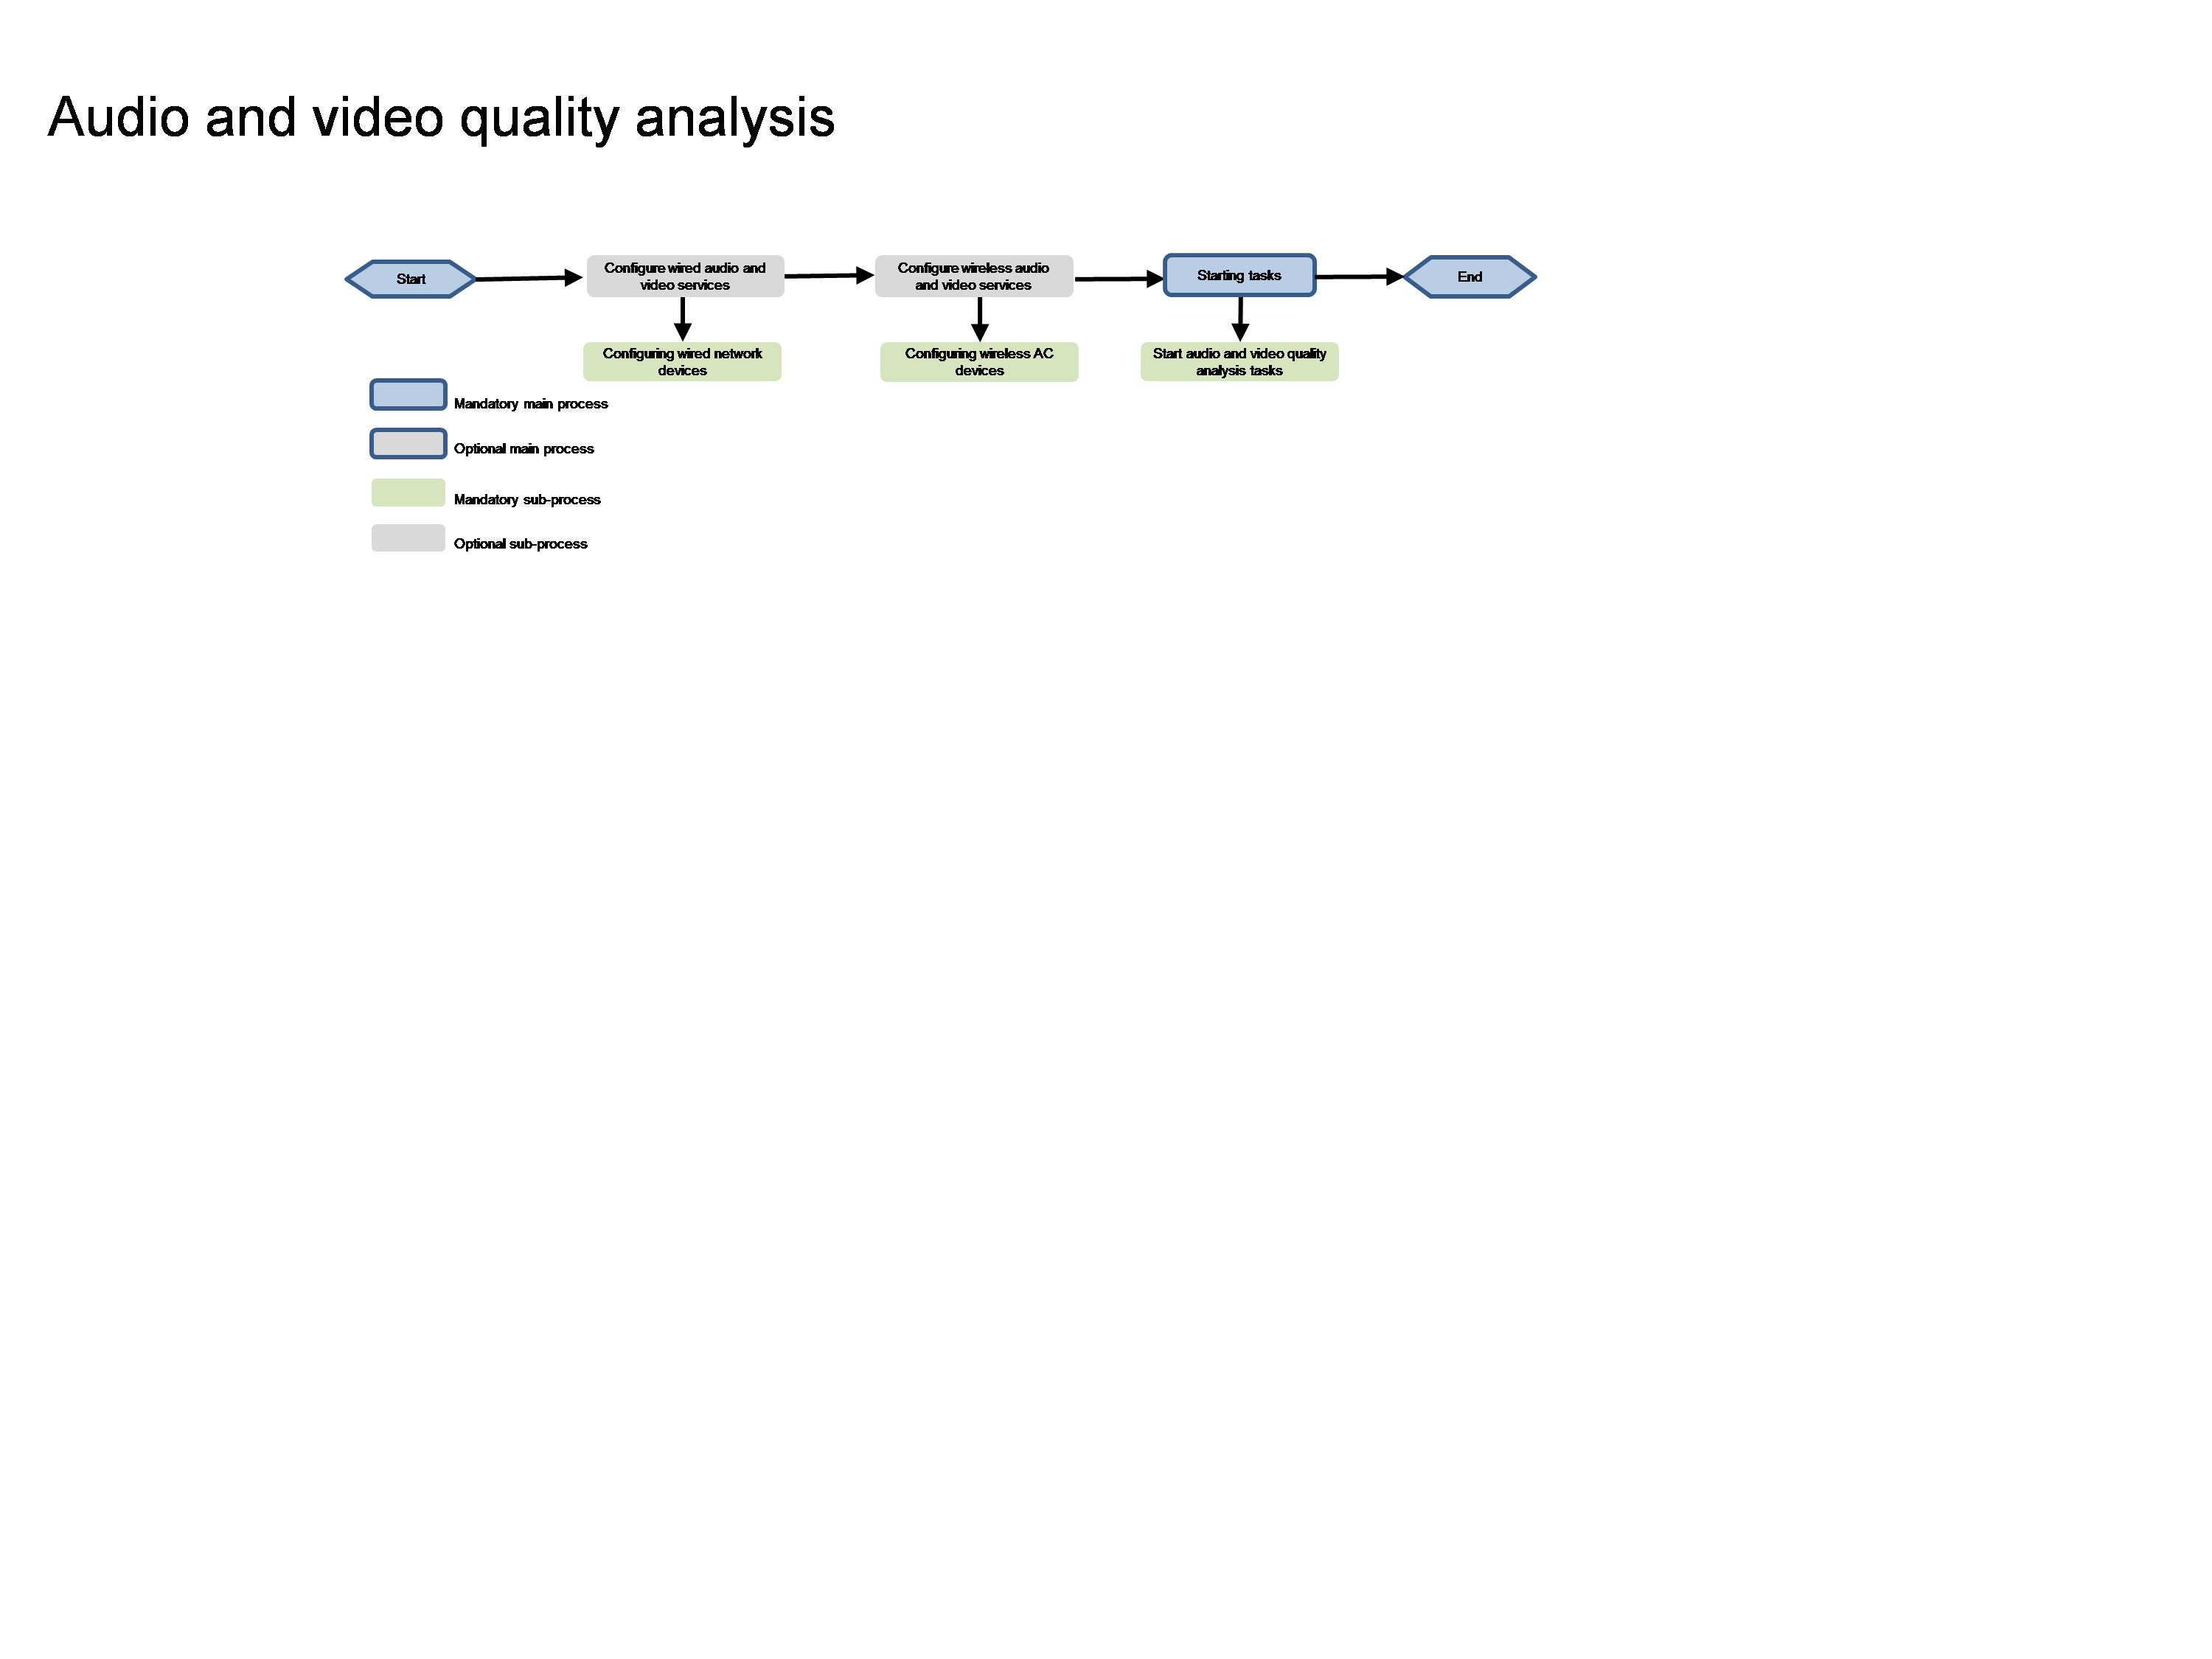
Network planning
For more information, see "Single-stack southbound network."
Configuration procedure
Configuring wired audio and video quality analysis
Configuring wired network devices
1. Configure SQA and eMDI, typically on spine and leaf devices.
sqa //Enter SQA view.
sqa-sip enable //Enable SIP-based SQA.
sqa-h323 enable //Enable H.323-based SQA.
#
emdi
#
2. Configure gRPC.
|
|
WARNING! Due to the relatively poor performance of H3C S5560X/S6520X Switch Series, do not configure gRPC to collect the audio and video data when the S5560X/S6520X Switch Series are used as leaf devices in the network. |
grpc enable
telemetry
sensor-group s118 //Configure the sensor group and event types.
sensor path sqa/bidirectionalcallevent
sensor path sqa/callevent
sensor path sqa/calltrafficevent
destination-group d1 //Configure the destination group with a custom name.
ipv4-address 110.1.0.107 port 50051 vpn-instance vpn-default //Configure the IP address of the collector and related parameters. The IP address is configured as the IP address for the southbound passive collector.
subscription b //Create the subscription, and associate it with the sensor group and the destination group. Sampling intervals are not required for event-triggered data collection.
sensor-group s118
destination-group d1
source-address 130.1.0.48 //Configure the IP address as the management IP address of the device.
#
Configuring wireless audio and video quality analysis
Configuring an AC
|
|
NOTE: An AC needs to be configured to meet wireless audio and video analysis service requirements. The AC and AP models must support SQA and eMDI. |
1. Enable SIP. (Wireless audio and video currently only support SIP sessions.)
sqa profile 1
sip enable
#
emdi
#
2. Configure gRPC.
grpc enable
telemetry
sensor-group s118
sensor path sqa/bidirectionalcallevent
sensor path sqa/callevent
sensor path sqa/calltrafficevent
destination-group d1
ipv4-address 110.1.0.107 port 50051 //Configure the IP address of the collector and related parameters. The IP address is configured as the southbound passive collector IP address. If the unified southbound and northbound network solution is used, the IP address is configured as the northbound service VIP address.
subscription e
sensor-group s118
destination-group d1
source-address 130.1.0.48 //Configure the IP address as the management IP address of the device.
#
Starting the audio and video quality analysis and parsing task
Navigate to the Analysis > Analysis Options > Task Management page, select the following tasks, and click Enable to start these tasks.
· AudioQualityAnalysis and VideoQualityAnalysis
Displaying analysis results
Navigate to the Analysis > Health Analysis > Application Analysis > Application Health page and click SIP and H323 to view the data in widgets, including MOS Distribution, Session Statistics, Traffic Trend Chart, and session lists.
Figure 89 Viewing the audio and video quality analysis
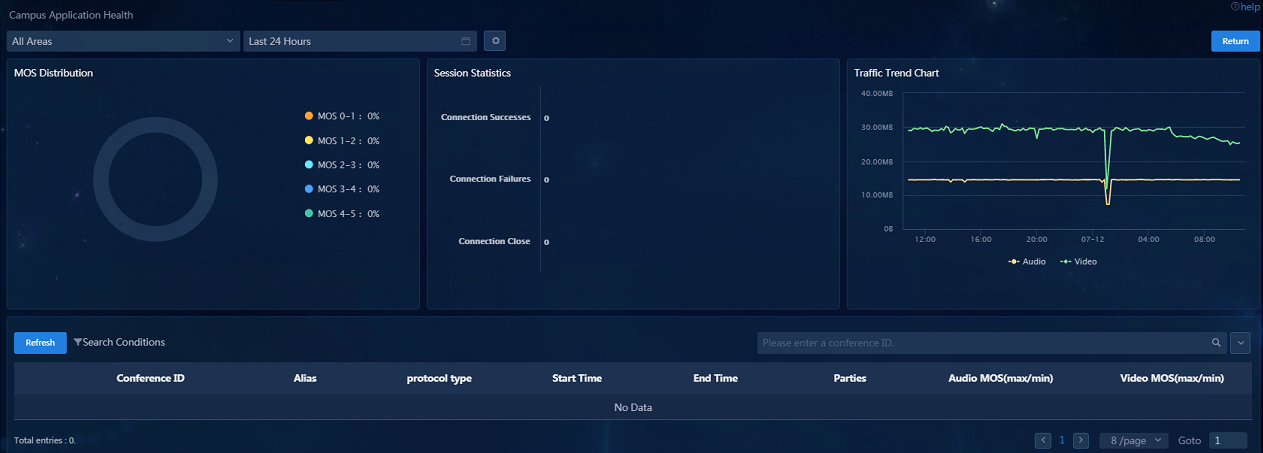
Restrictions and guidelines
· For wireless audio and video quality analysis, AC and AP models must support SQA and eMDI.
· Due to the relatively poor performance of H3C S5560X/S6520X Switch Series, as a best practice, do not configure gRPC when H3C S5560X/S6520X Switch Series are used as leaf devices in the network.
Configuring campus application analysis
The campus application analysis function monitors the application traffic and quality of the network devices accessed by wired devices and wireless devices, and the access of each end user within the application. For devices with frequent packet loss and excessive jitters, it helps ensure the quality of application traffic by network expansion or contacting application solution providers based on the device health and other KPIs.
For the campus application analysis function, the wired application data source is wired device iNQA and the wireless application data source is wireless device DPI.
Configuration process
Figure 90 Flowchart of configuring the campus application analysis
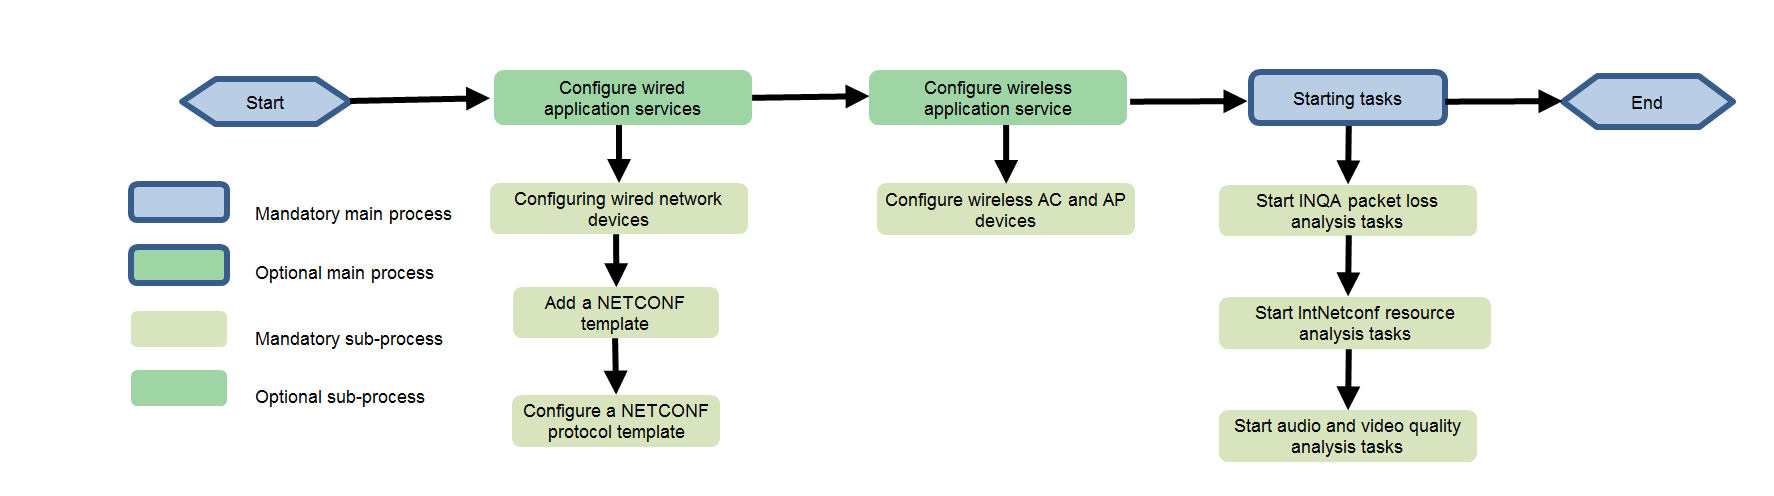
Network planning
For more information, see "Single-stack southbound network."
Configuration procedure
Wired application analysis
Configuring wired network devices
|
|
NOTE: Configure the spine device as iNQA Analyzer. In the current software version, iNQA does not support VXLAN encapsulated messages. Therefore, the MP must be located before the device for VXLAN encapsulation. If the destination flow is south-north, as a best practice, configure the collectors as the spine device and leaf device, the MP of the spine device as the egress of the external network, and the MP of the leaf device as the downstream port. If the destination flow is east-west, as a best practice, configure the collectors as leaf devices (the two leaf devices where the destination flow passes) and the MP of the leaf device as the downstream port. The following is an example of south-north traffic. |
1. Configure iNQA collector for leaf devices.
#
inqa collector //Enable the collector function and enter the collector view.
collector id 130.1.0.52 //Configure the ID of the collector.
analyzer 130.1.0.51 vpn-instance vpn-default //Bind the analyzer.
flag loss-measure tos-bit 6 //Use the sixth bit in the ToS field as the iNQA color bit.
instance 1 //Create an instance for the collector and enter the instance view.
flow bidirection source-ip 172.16.55.0 24 destination-ip 172.16.56.0 24 protocol tcp source-port 0 to 65535 destination-port 0 to 65535
//Configure collector instance 1 to monitor the bidirectional TCP flows between 172.16.55.0/24 and 172.16.56.0/24 with the source port number 0-65535 and destination port number 0-65535.
mp 100 in-point port-direction inbound //Configure ingress MP 100 for collector instance 1 to collect traffic data for the flows entering the MP.
#
interface Ten-GigabitEthernet 1/0/11 (downstream port of the leaf device)
inqa mp 100 //Configure MP 100 on the physical port.
#
loss-measure enable continual //Enable continual packet loss measurement for the collector instance.
#
2. Configure an iNQA collector for spine devices.
inqa collector //Enable the collector function and enter the collector view.
collector id 130.1.0.51 //Configure the ID of the collector.
analyzer 130.1.0.51 vpn-instance vpn-default //Bind the analyzer.
flag loss-measure tos-bit 6 //Use the sixth bit in the ToS field as the iNQA color bit.
instance 1 //Create an instance for the collector and enter the instance view.
flow bidirection source-ip 172.16.55.0 24 destination-ip 172.16.56.0 24 protocol tcp source-port 0 to 65535 destination-port 0 to 65535
//Configure collector instance 1 to monitor the bidirectional TCP flows between 172.16.55.0/24 and 172.16.56.0/24 with the source port number 0-65535 and destination port number 0-65535.
mp 200 out-point port-direction outbound //Configure egress MP 200 for collector instance 1 to collect traffic data for the flows leaving the MP.
#
interface Twenty-FiveGigE1/0/5 (the port where the spine device is connected to the tester)
inqa mp 200 //Configure MP 200 on the physical port.
#
loss-measure enable continual //Enable continual packet loss measurement for collector instances.
#
3. Configure iNQA analyzer for spine devices.
|
|
CAUTION: iNQA Analyzer is only supported by TD3 chips, such as H3C S6550XE switches. |
#
inqa analyzer //Enable the analyzer function and enter the analyzer view.
analyzer id 130.1.51 //Configure the ID of the analyzer.
instance 1 //Create an instance for the analyzer and enter the instance view.
collector 130.1.51 //Associate instance 1 with collector 130.1.51 on the analyzer.
collector 130.1.52 //Associate instance 1 with collector 130.1.52 on the analyzer.
loss-measure alarm upper-limit 6.000000 lower-limit 4.000000 //Configure the packet loss upper limit as 6% and the packet loss lower limit as 4% for analyzer instance 1.
measure enable //Enable the measurement function for analyzer instance 1.
ams 1 //Create AMS and enter the AMS view.
flow forward //Configure the direction of the destination flow as forward.
in-group collector 130.1.51 mp 100 //Configure the ingress MP group of the AMS and bind the ingress MP to the AMS. The ingress MP is MP 100 on the collector with IPv4 address 130.1.51.
out-group collector 130.1.51 mp 200 //Configure the egress MP group of the AMS and bind the egress MP to the AMS. The egress MP is the MP 200 on the collector with IPv4 address 130.1.51.
#
4. Configure gRPC (only required on analyzer).
grpc enable
telemetry
sensor-group s119 //Configure the sensor group and event types.
sensor path inqa/statisticses/statistics/amses/ams/losses/loss
sensor path inqa/statisticses/statistics/losses/loss
destination-group d1 //Configure the destination group with a custom name.
ipv4-address 110.1.0.107 port 50051 vpn-instance vpn-default //Configure the IP address of the collector and related parameters. The IP address is configured as the IP address for the southbound passive collector.
subscription b //Create the subscription, and associate it with the sensor group and the destination group. Sampling intervals are not required for event-triggered data collection.
sensor-group s119
destination-group d1
#
5. Add a NETCONF protocol template.
a. Navigate to the Analysis > Analysis Options >Collection Parameters > Template Management > NETCONF page, and select the Campus template in the collection template list. Click the Add (Clone) button to add collected metrics INQA_Analyzer and INQA_Collector.
Figure 91 Adding protocol templates
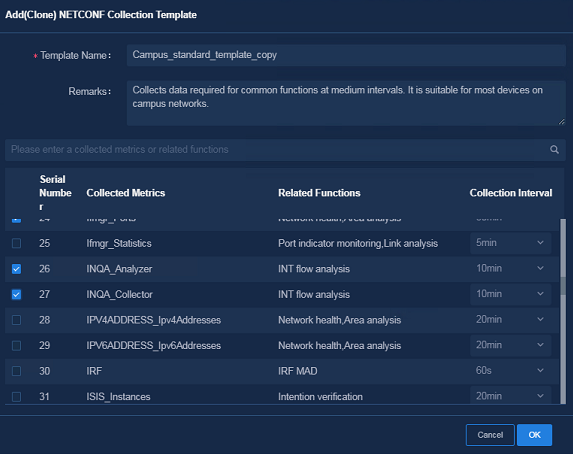
a. For how to configure a NETCONF protocol template, see "Configuring an asset protocol template."
Configuring wireless application analysis
Configuring an AC
|
|
NOTE: An AC needs to be configured to meet wireless application analysis service requirements. In the current software version, the AC model is not restricted but the AP model must support DPI. The forwarding type of the AP must be configured as local forwarding. |
1. Configure SQA, eMDI, and UCC.
#
sqa profile 1 //Create SQA profile 1 and enter its view.
sip enable //Enable SIP-based SQA.
application statistics enable //Enable statistics collection for endpoint application traffic.
application tencentmeeting enable //Enable SQA for the Tencent Meeting application traffic.
application wechatvoip enable
application wechat enable
application qqvoip enable
application qq enable
application skype enable
#
emdi
#
ucc profile 1 //Create UCC profile 1 and enter its view.
sip enable //Enable SIP-based UCC.
application tencentmeeting enable //Enable the UCC function for Tencent Meeting traffic, and enable the application as needed.
application wechatvoip enable
application wechat enable
application qqvoip enable
application qq enable
application skype enable
#
#
wlan service-template q1
client forwarding-location ap
ucc-profile 1
sqa-profile 1
service-template enable
#
2. For how to configure gRPC, see "Configuring wireless audio and video quality analysis."
Starting analysis tasks
Navigate to the Analysis > Analysis Options > Task Management page, select the following tasks, and click Enable to start these tasks.
· AudioQualityAnalysis and VideoQualityAnalysis
· InqaParse
· intNetconf
Displaying analysis results
Navigate to the Analysis > Health Analysis > Application Analysis > Campus Application Health page to view the data in widgets, including Overview Statistics and Application List.
Figure 92 Campus application health page
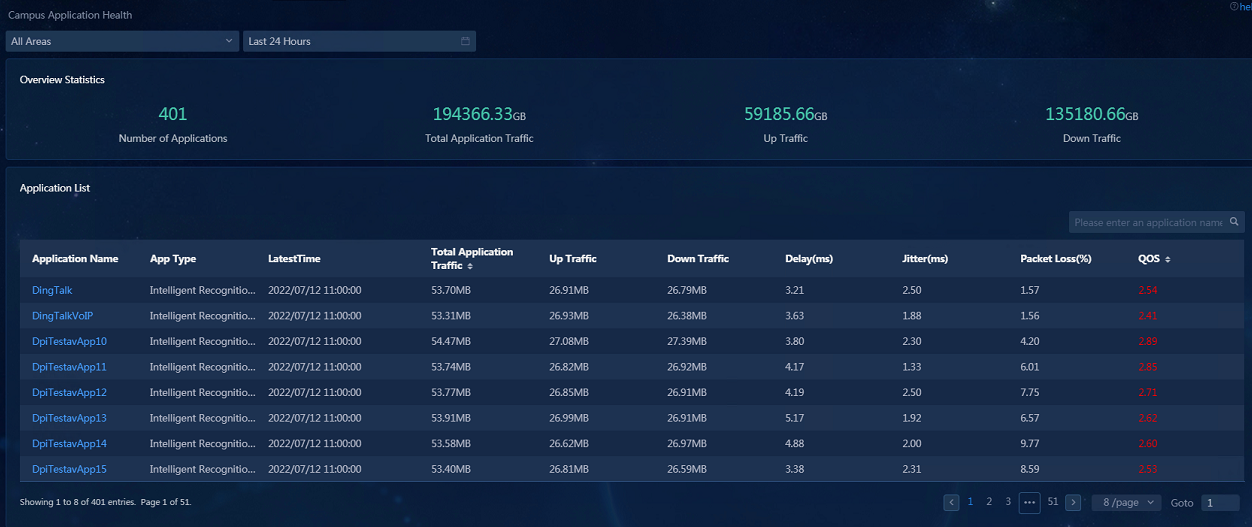
Restrictions and guidelines
· iNQA Analyzer is only supported by switches with TD3 chips, such as H3C S6550XE switches.
· An AC needs to be configured to meet wireless application analysis service requirements. In the current software version, the AC model is not restricted but the AP model must support DPI. The forwarding type of the AP must be configured as local forwarding.
TCP/DNS statistics analysis
|
|
CAUTION: An independent collector must be deployed for TCP/DNS statistics analysis. |
The TCP/DNS statistics analysis function matches the data from the TCP flow analysis by user IP address. SeerAnalyzer collects all TCP session control packets forwarded by network devices for TCP flow analysis, while TCP/DNS packets are collected from switches via ERSPAN. Therefore, an independent collector is required in the network.
Navigate to the Analysis > Health Analysis > User Analysis > User Health page and click a username for a user in the user list. A page opens to display the user details. The Application Statistics Analysis and the DNS Traffic Latency Trend (a hidden widget, which must be selected in the widget settings) widgets on the page display the top 10 applications by latency, top 10 applications by traffic, and top 10 applications by session count, and DNS latency trend for endpoints in the selected time span.
Configuration process
Figure 93 Flowchart of configuring application statistics analysis
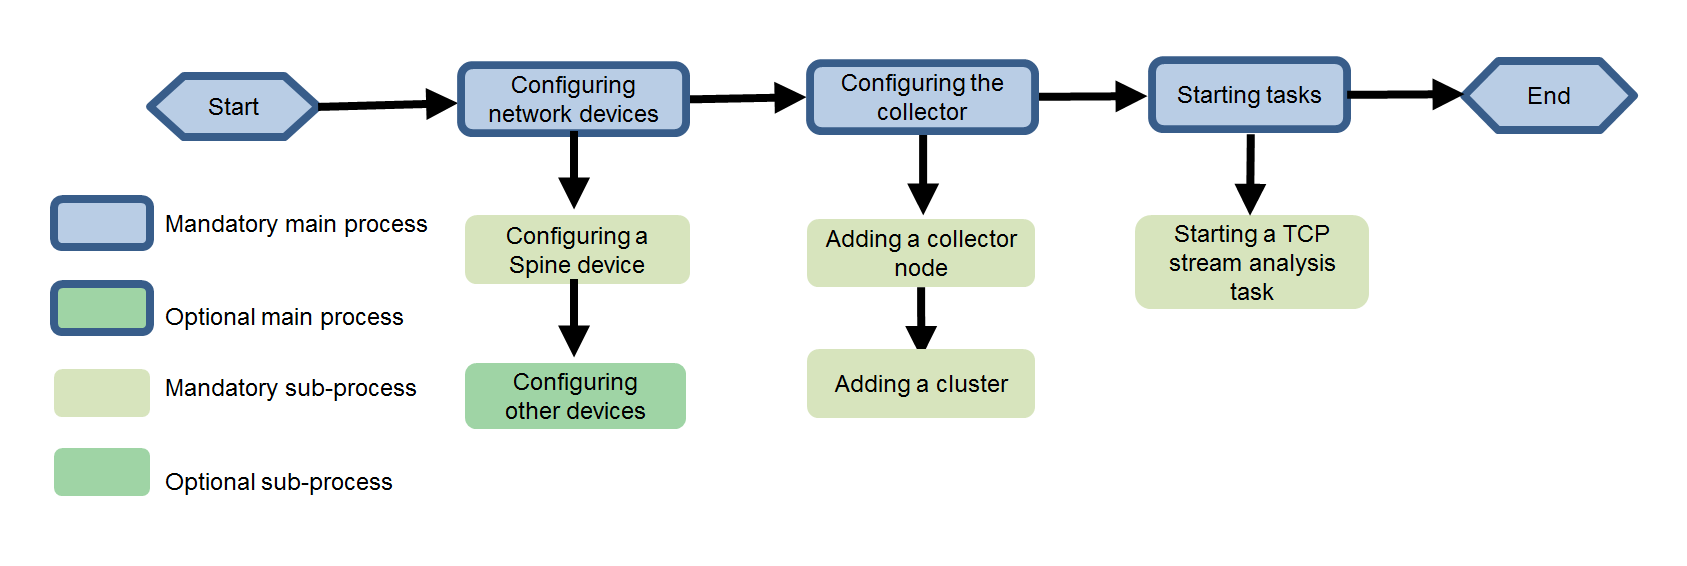
Network planning
For more information, see "Single-stack southbound network."
Configuration procedure
Configuring network devices
Configuring a spine device
To directly connect a spine device to the collector, you must configure an interface on the spine device for connecting to the collector and advertise the route to the collector to other devices.
1. Configure an interface on the spine device for connecting to the collector.
interface Ten-GigabitEthernet1/3/0/15
port link-mode route
ip address 30.0.12.161 255.255.255.0
ospf 1 area 0.0.0.0 // Advertise the route to the collector to other devices.
#
2. Configure ERSPAN.
acl advanced name ta1 //Configure an ACL.
rule 0 permit tcp syn 1
rule 5 permit tcp fin 1
rule 10 permit tcp rst 1
rule 15 permit udp source-port eq dns
rule 20 permit udp destination-port eq dns
#
traffic classifier tt1 operator and // Create a traffic class named tt1.
if-match acl name ta1
#
traffic behavior tb1 // Create a traffic behavior named tb1.
accounting packet // Configure packet accounting.
mirror-to interface destination-ip 30.0.12.163 source-ip 30.0.2.156 // Configure an action of mirroring traffic to interfaces in the traffic behavior, with the destination IP address encapsulated in the mirrored packets as the floating IP address of the collector and the source IP address as the management IP address of the device.
#
qos policy tq1 // Define the QoS policy.
classifier tt1 behavior tb1
#
qos apply policy tq1 global inbound // Apply the QoS policy to the inbound direction globally.
#
Configuring other devices
For a leaf device, only ERSPAN configuration is required. For more information, see "Configuring a spine device."
Do not configure the TCP packet collection for access devices.
Configuring the collector
Adding a collector node
Navigate to the Analysis > Analysis Options > Collection Parameters > Collector Parameters > SeerCollector page, click Add Node, and specify the parameters in the dialog box that opens.
· Host IP: Enter the management IP address of the collector.
· Username: Enter the username of the collector.
· Password: Enter the password of the collector.
· Host Description: Optional.
Figure 94 Adding a collector node
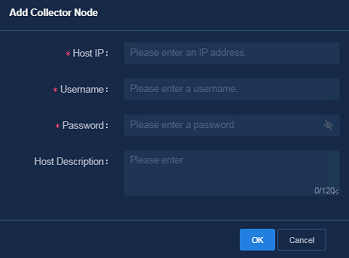
Adding a cluster
Navigate to the Analysis > Analysis Options > Collection Parameters > Collector Parameters > SeerCollector page, click Add Cluster, and specify the parameters in the dialog box that opens.
· Cluster Name: Enter the cluster name.
· Collector Node: Select the collector node in Available Nodes and move it to Selected Nodes. In Selected Nodes, select the node and click Configure to specify the parameters in the dialog box that opens, as shown in Figure 95.
¡ Data reporting network port physical IP address: Enter the management IP address of the collector.
¡ Physical IP address of the device management network port: Enter the management IP address of the collector.
¡ PTP clock synchronization network port physical IP address: Enter the management IP address of the collector.
¡ Physical IP address of data collection network port: Enter the service IP address of the collector.
· Collector Floating IP Address: Enter the floating IP address of the collector. The floating IP address resides in the same subnet as the service IP address of the collector.
|
|
CAUTION: Only the collector node in Normal state is displayed in Available Nodes. |
Figure 95 Configuring a cluster
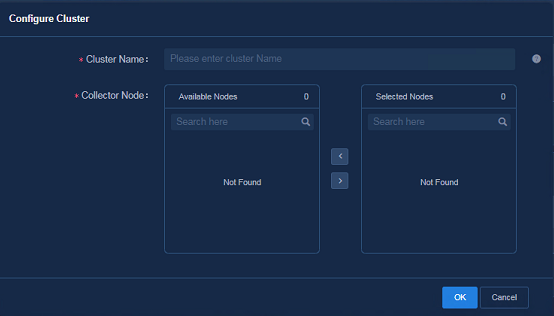
Figure 96 Configuring a node
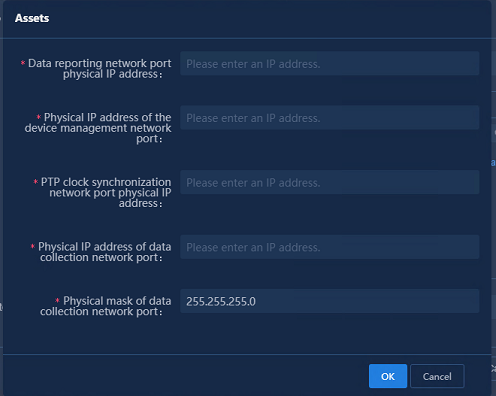
Starting a TCP stream analysis task
Navigate to the Analysis > Analysis Options > Task Management page, select the following tasks, and click Enable to start these tasks.
· TCP stream processing
Displaying analysis results
User Health: Navigate to the Analysis > Health Analysis > User Analysis > User Health page, click the Username field for a user on the user list, and view the application statistics analysis on the Device Details page.
Figure 97 Application statistics analysis page

Restrictions and guidelines
· Only the collector node in Normal state is displayed in Available Nodes.
Configuring the dashboard
Dashboard settings include dashboard title, gateway egress interface, and map settings.
Configuration process
Figure 98 Flowchart of configuring process
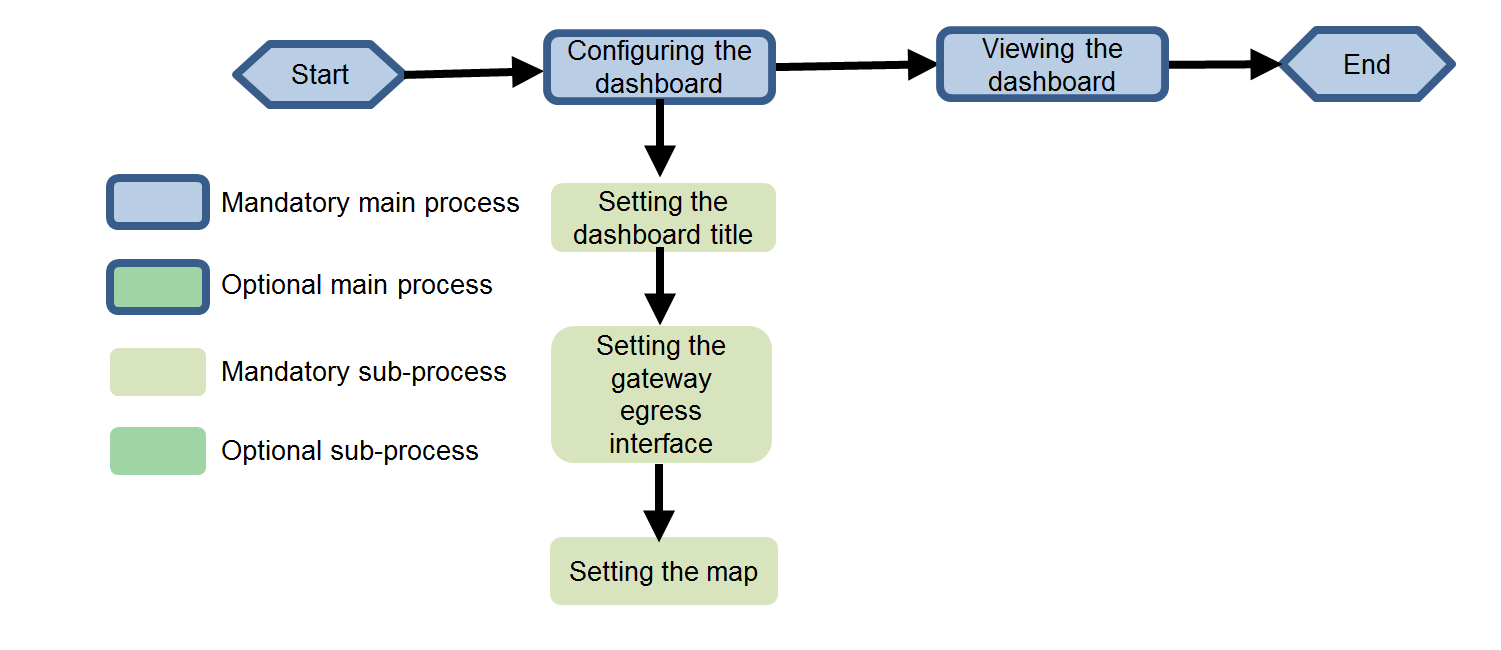
Network planning
For more information, see "Single-stack southbound network."
Configuration procedure
Configuring the dashboard
1. Navigate to the Analysis > Health Analysis > Health Overview > Topo page, and click Dashboard Settings.
Figure 99 Topology overview

2. In the Dashboard Settings dialog box that opens, Dashboard Settings include the following three parts: Dashboard Title, Gateway Egress Interface Settings, and Map Settings.
Setting the dashboard title
· Dashboard Title: Enter the dashboard title as needed and click Save.
Setting the gateway egress interface
· Device Name: Select the gateway egress interface device.
· Gateway Egress Interface: Select the gateway egress interface and click Save.
Figure 100 Configuring the dashboard
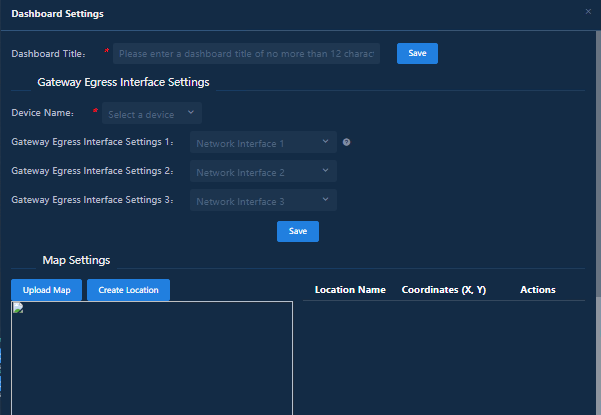
Setting the map
· Upload Map: Click Upload Map to upload the map for dashboard display.
· Create Location: Hover over the location in the map to display the coordinates of
the location. Then click Create Location, enter the
Location Name and Coordinates,
and click the ![]() icon to add the location during operation.
icon to add the location during operation.
· Click to Bind: Select an AP, and click Click to Bind to bind the AP to a location. You can select multiple APs to bind them to the same location at a time.
Figure 101 Setting the map in dashboard settings
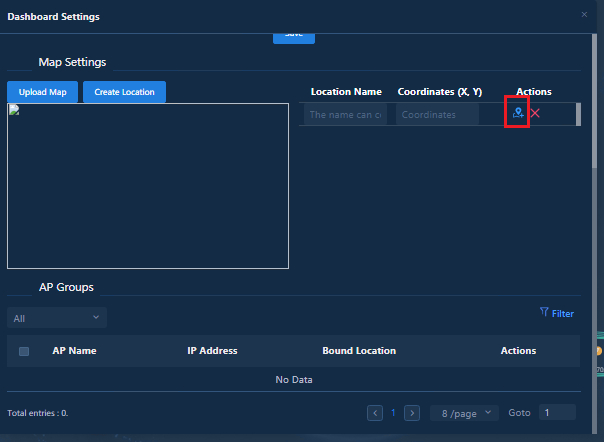
Viewing the dashboard
Navigate to the Analysis
> Health Analysis > Health
Overview > Topo page, and click the ![]() icon to display the dashboard.
icon to display the dashboard.
Figure 102 Topology overview
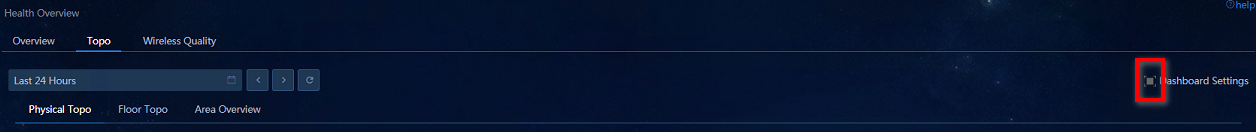
Figure 103 Dashboard
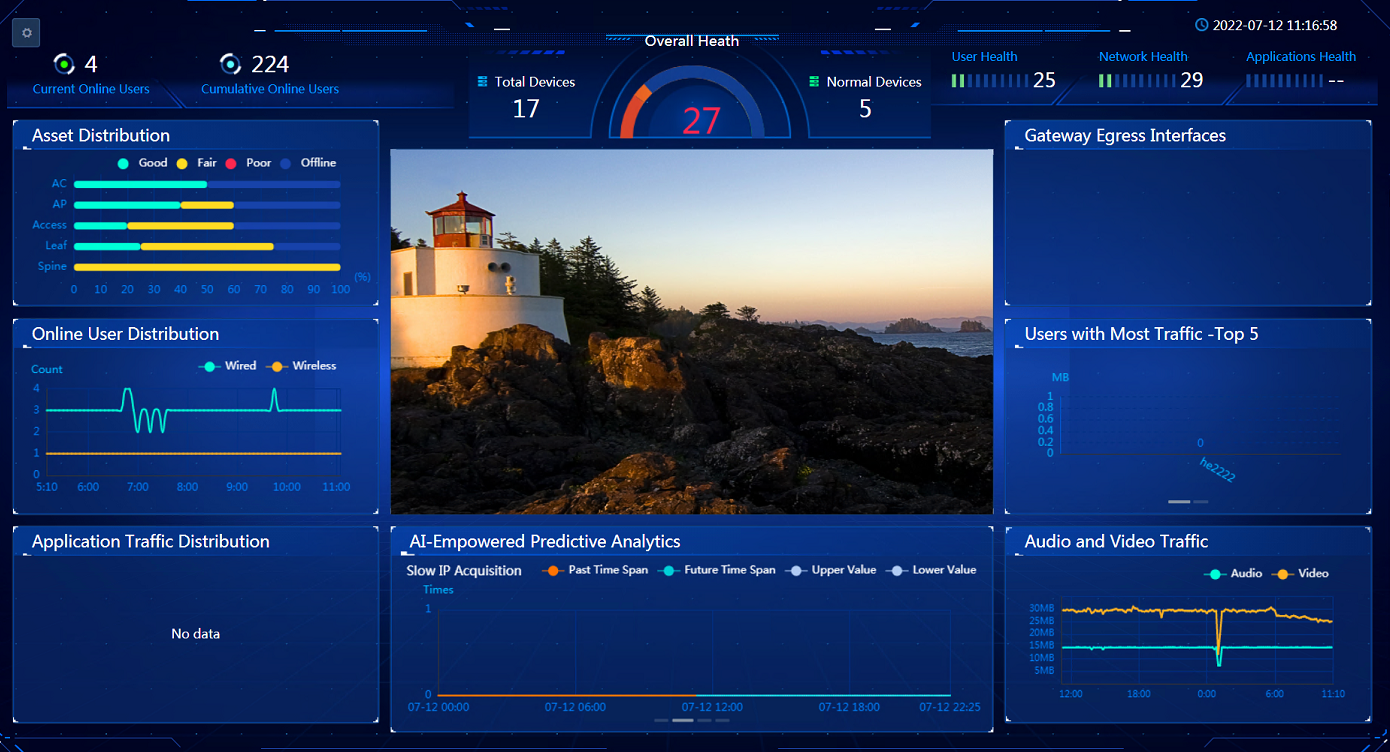
Configuring health reports
Health reports display the list of network-wide health report tasks created by the current user. The list contains the task name, status, recipient email, task creation time, next task execution time, and period type.
Configuration process
Figure 104 Flowchart of configuring health report
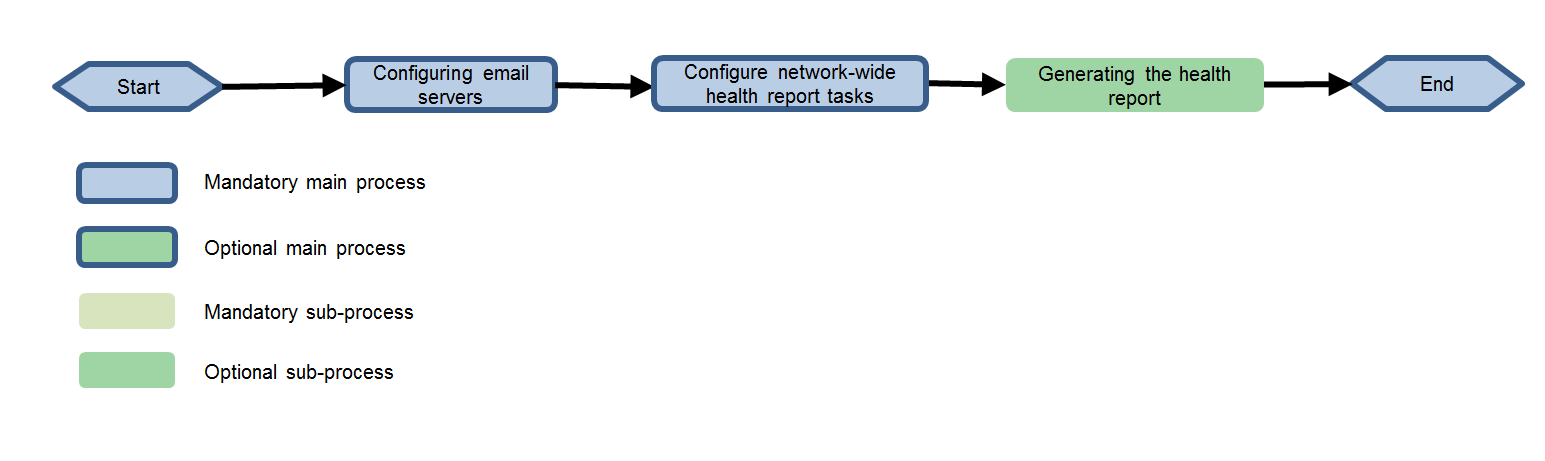
Network planning
For more information, see "Single-stack southbound network."
Configuration procedure
Configuring email servers
1. Navigate to the System > System Settings > Mail Server Settings page, and specify the following parameters.
¡ Server Address: Enter the domain name and IP address of the mail server.
¡ Server Port: Enter the port number of the mail server.
¡ Secure Connection (SSL/TLS): Select the secure connection method.
¡ Client Authentication: If you select Client Authentication, you must enter the username and password.
¡ Sender's Mail Address: Enter a mail address that can send emails.
2. Click Send Test Mail.
If a success message is prompted, the configuration is successful.
3. Click OK to save the configuration.
Figure 105 Configuring a mail server
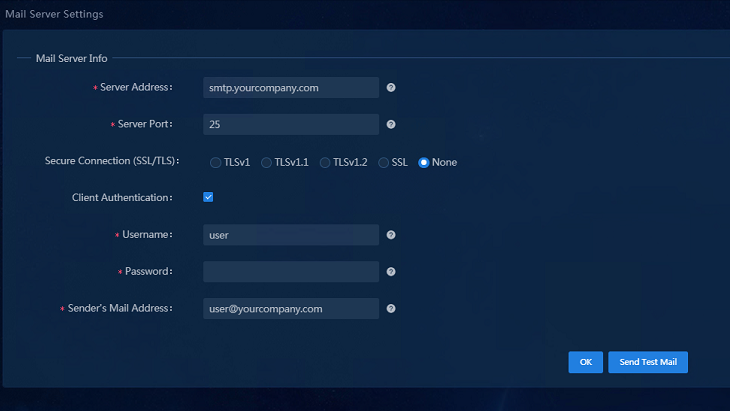
Creating a network-wide health report task
1. Navigate to the Analysis > Health Analysis > Health Overview > Overview page, click Health Report, and click the Create Task button on the page that opens.
¡ Report Type: Select day, week, or month as needed.
¡ Start Time: Set the start time of the task.
¡ Task Name: Enter the task name.
¡ Dead Time: Select the dead time. The health report will never expire if the dead time is not configured.
¡ Email: Enter the email address to receive the report and click Add.
2. After the configuration is completed, click OK.
Figure 106 Creating a health report task
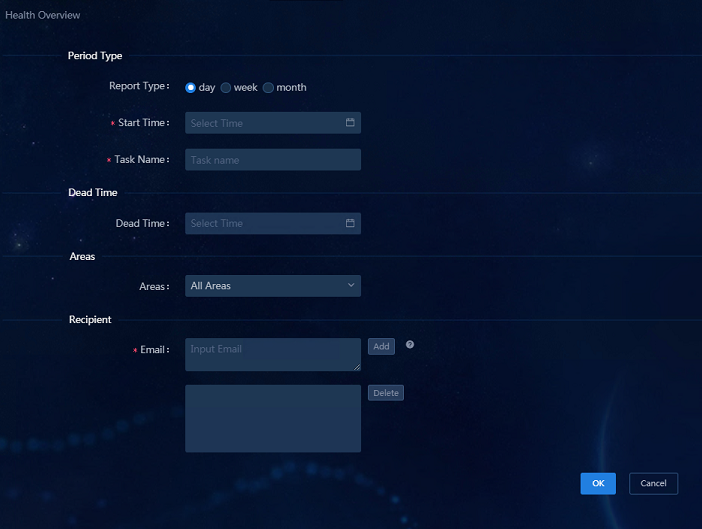
Generating the health report
On the Health Report page, click Generate Now.
· Report Type: Select day, week, or month as needed.
· Start Time: Select the start time for the data in the report.
· End Time: Select the end time for the data in the report.
· Select the generation method:
¡ DownloadFile: Select DownloadFile and click OK. The health report file is downloaded from the browser.
¡ Email: Select Email, enter the email address, click Add, and then click OK. The health report is sent to the mailbox immediately.
Figure 107 Generating the health report
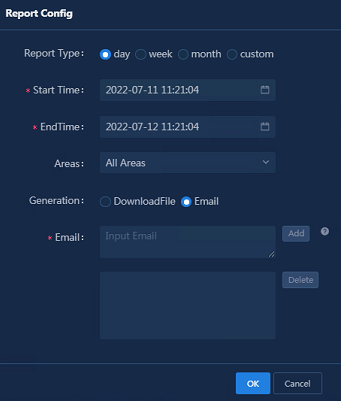
Displaying analysis results
· The generated health report can be directly downloaded and viewed via a browser or a specified email address.
Restrictions and guidelines
· If the mail server address uses the domain name mode, you must configure the DNS server during Unified Platform deployment, or log in to the Installer platform after deployment and navigate to the Deployment > Cluster > Cluster Parameters page to change the DNS server.
Deploying SeerAnalyzer in hierarchy mode
Deploying SeerAnalyzer in multiple campuses and areas allows you to reduce the traffic of WAN network data transmission. The deployment of multiple analyzers allows the main analyzer to view data statistics of all campuses, view the detailed data information of sub-analyzers, and regularly get the quality analysis summary data of the sub-analyzers.
Configuration process
Figure 108 Flowchart of configuring SeerAnalyzer in hierarchy mode
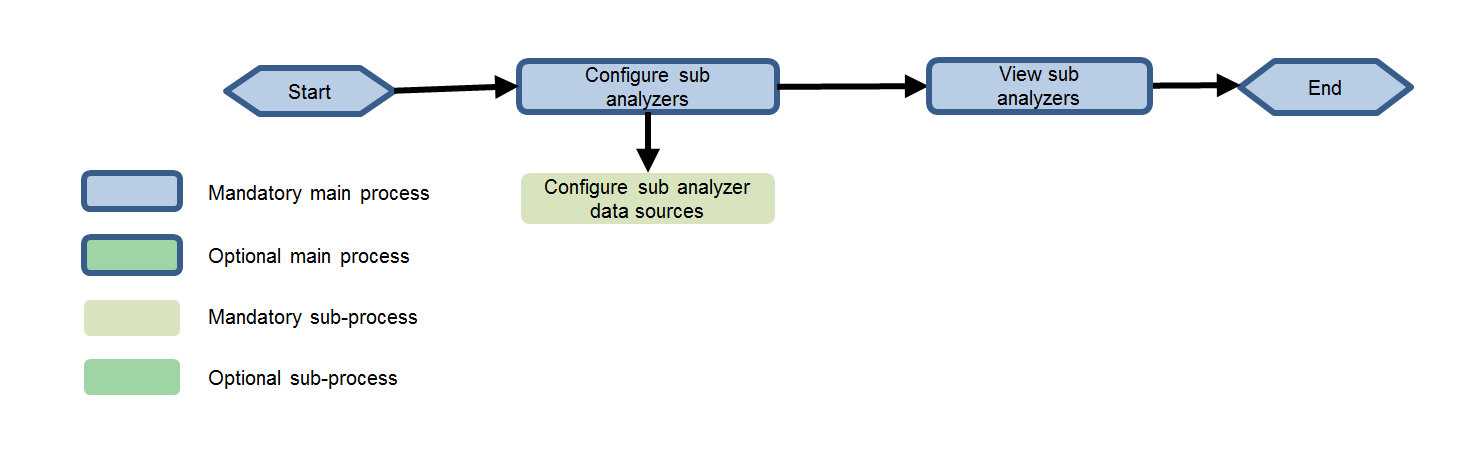
Network planning
Figure 109 Network diagram of deploying SeerAnalyzer in hierarchy mode
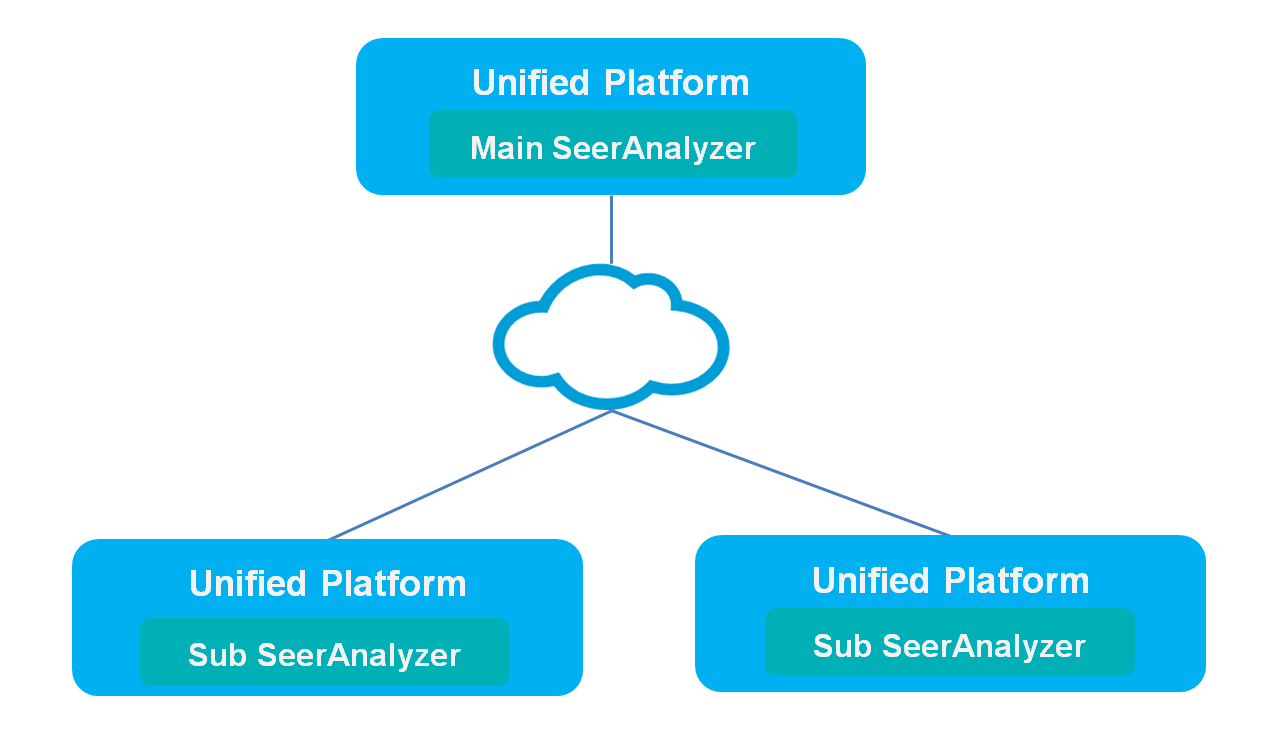
Configuration procedure
Configuring sub-analyzer data sources
Navigate to the Analysis > Analysis Options > Resources > Assets > Data Sources page, and click Add. In the Base Configuration dialog box that opens, specify the following parameters:
· Name: Enter the name.
· Type: Select Analyzer.
· Username: Enter the username for logging in to the sub-analyzer. The username can be 2 to 32 characters in length and can contain only letters, digits, underscores (_), hyphens (-), periods (.), and backslashes (\).
· Password: Enter the password for logging in to the system where the sub-analyzer is deployed.
· IP: Enter the IP address for logging in to the system where the sub-analyzer is deployed.
· Port: Enter the port number of the URL for logging in to the sub-analyzer.
· https: Enable https only when you use HTTPS to log in to the sub-analyzer.
Figure 110 Configuring sub-analyzer data sources
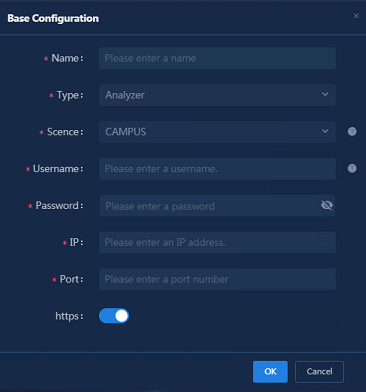
Displaying analysis results
View the sub-analyzer: Navigate to the Analysis > Health Analysis > Health Overview > Topo > Area Overview page, and click the All Areas tab to view the multi-level analyzer network health status. You can click the area name to redirect to the sub-analyzer login page.
Figure 111 All areas
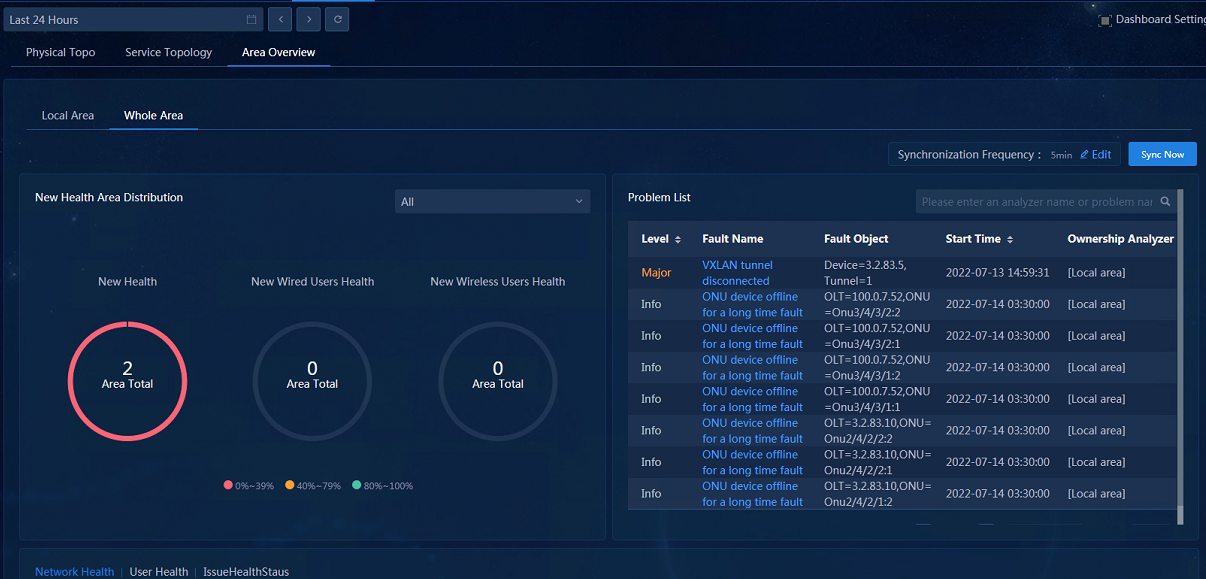
Configuring O&M and monitoring
For more information about O&M and monitoring of each function in this configuration guide, see O&M and Monitoring Configuration Guide for the Campus Scenario-Specific Solution.
Appendix: Configuring gRPC
Configuring gRPC for network analysis
For SNMP- and NETCONF-based data collection, you can configure gRPC for data collection if it is required. The following provides the detailed configuration procedure.
Configuring gRPC for a spine/leaf device
grpc enable
telemetry
sensor-group s111 //Configure a sensor group to collect the basic information of the device.
sensor path device/boards
sensor path device/extphysicalentities
sensor path device/physicalentities
sensor path device/transceivers
sensor path ifmgr/interfaces
sensor path ifmgr/statistics
sensor path ifmgr/ethportstatistics
sensor-group s112 //Configure a sensor group for topology calculation and changes analysis.
sensor path lldp/lldpneighbors
sensor-group s113 //Configure a sensor group for capacity management.
sensor path resourcemonitor/monitors
sensor path resourcemonitor/resources
sensor-group s114 //Configure a sensor group for cache monitoring.
sensor path buffermonitor/boardegressdrops
sensor path buffermonitor/commbufferusages
sensor path buffermonitor/commheadroomusages
sensor path buffermonitor/ecnandwredstatistics
sensor path buffermonitor/egressdrops
sensor path buffermonitor/ingressdrops
sensor path buffermonitor/pfcspeeds
sensor path buffermonitor/pfcstatistics
sensor-group s115 //Configure a sensor group for full reporting of changes analysis.
sensor path mac/macunicasttable
sensor path arp/arptable
sensor path route/ipv4routes
sensor path route/ipv6routes
sensor path nd/ndtable
sensor path lldp/lldpneighbors
sensor-group s116 //Configure a sensor group for incremental reporting of changes analysis. The sensor path can be used for both full reporting and incremental reporting of changes analysis. Incremental reporting takes priority. If incremental reporting is configured, you do not need to configure full reporting.
sensor path mac/underlaymacevent
sensor path mac/overlaymacevent
sensor path arp/arptableevent
sensor path nd/ndtableevent
sensor path route_stream/ipv4routeevent
sensor path route_stream/ipv6routeevent
destination-group d1 //Configure the destination group with a custom name.
ipv4-address 110.1.0.107 port 50051 vpn-instance vpn-default //Configure the IP address of the collector and related parameters. The IP address is configured as the IP address for the southbound passive collector.
subscription a //Create the subscription, and associate it with the sensor groups and destination group. The sample-interval parameter indicates the data sampling and push period, which can be modified as needed.
sensor-group s111 sample-interval 60
sensor-group s112 sample-interval 300
sensor-group s113 sample-interval 300
sensor-group s114 sample-interval 300
sensor-group s115 sample-interval 1200 //Configure full reporting of changes analysis.
sensor-group s116 sample-interval 3600 //Configure incremental reporting of changes analysis. Incremental reporting takes priority. If incremental reporting is configured, you do not need to configure full reporting.
destination-group d1
source-address 130.1.0.52 //Configure the IP address as the management IP address of the device.
#
Configuring gRPC for an access device
grpc enable
telemetry
sensor-group s111 //Configure a sensor group to collect the basic information about the device.
sensor path device/boards
sensor path device/extphysicalentities
sensor path device/physicalentities
sensor path device/transceivers
sensor path ifmgr/ethportstatistics
sensor path ifmgr/interfaces
sensor path ifmgr/statistics
sensor-group s112 //Configure a sensor group for topology calculation and changes analysis.
sensor path lldp/lldpneighbors
sensor-group s113 //Configure a sensor group for changes analysis.
sensor path mac/macunicasttable
destination-group d1 //Configure the destination group with a custom name.
ipv4-address 110.1.0.107 port 50051 //Configure the IP address as the southbound passive collector IP address.
subscription a //Create the subscription, and associate it with the sensor groups and destination group. The sample-interval parameter indicates the data sampling and push period, which can be modified as needed.
sensor-group s111 sample-interval 60
sensor-group s112 sample-interval 300
sensor-group s113 sample-interval 300
destination-group d1
source-address 130.1.0.61 //Configure the IP address as the management IP address of the device.
#
Deploying the gRPC configuration through Unified Platform
Adding a configuration template
1. Navigate to the Automation > Configuration Options > Configuration Templates page. Click Add and select Manually Add to add a configuration template.
Figure 112 Configuration templates
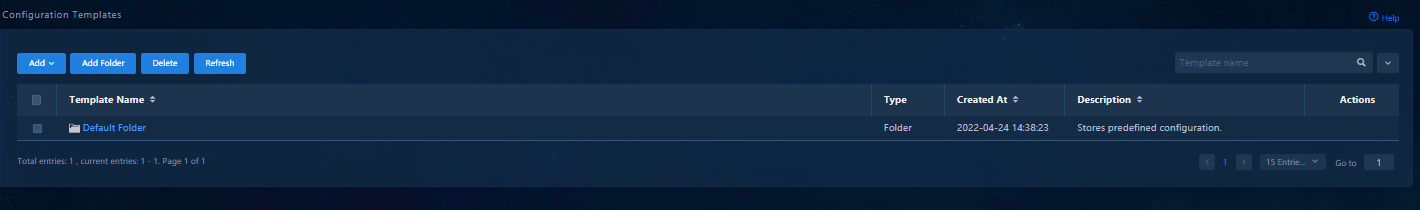
2. Specify the following parameters in the dialog box that opens:
¡ Template Name: Enter the name of the template.
¡ Template Type: Select the default configuration segment.
¡ Applicable Devices: Optional.
¡ Content: Enter the configuration segment that needs to be deployed.
3. Click Confirm.
|
|
NOTE: The basic information of wired devices is used as an example for the configuration content. Configure gRPC for wired user authentication as needed. |
Figure 113 Adding a configuration template 1
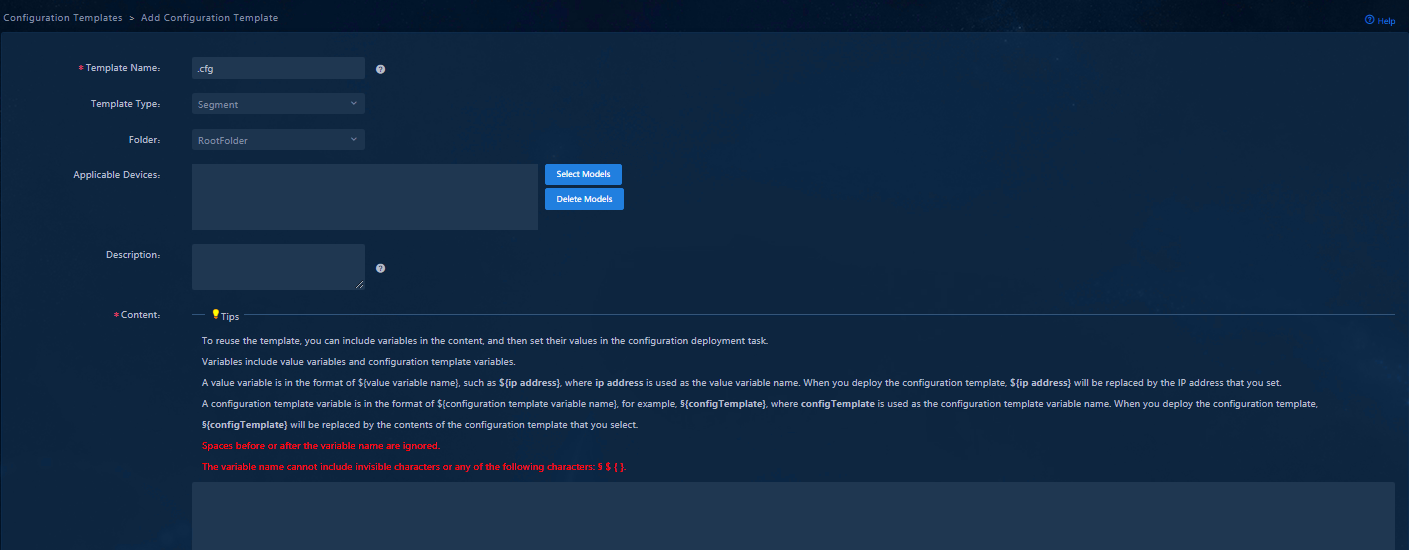
Configuring a VPN instance
|
|
NOTE: In typical networking of AD-Campus, the management network resides in VPN instance vpn-default. Therefore, you must deploy the configuration through Unified Platform and configure the VPN instance in the deployment settings. |
1. Navigate to the Automation > Configuration Options > Options page. On the VPN Instances tab, click Select Devices. In the dialog box that opens, select devices such as spine and leaf devices whose management networks reside in VPN instance vpn-default. Then, click Add Devices.
Figure 114 Adding devices

2. On the VPN Instances tab, enter the VPN (vpn-default) of the management network in the VPN Instance Name column, or select the devices. Click Bulk Set, and enter the VPN (vpn-default) of the management network in the VPN Instance Name field in the dialog box that opens.
Figure 115 Configuring a VPN instance 1
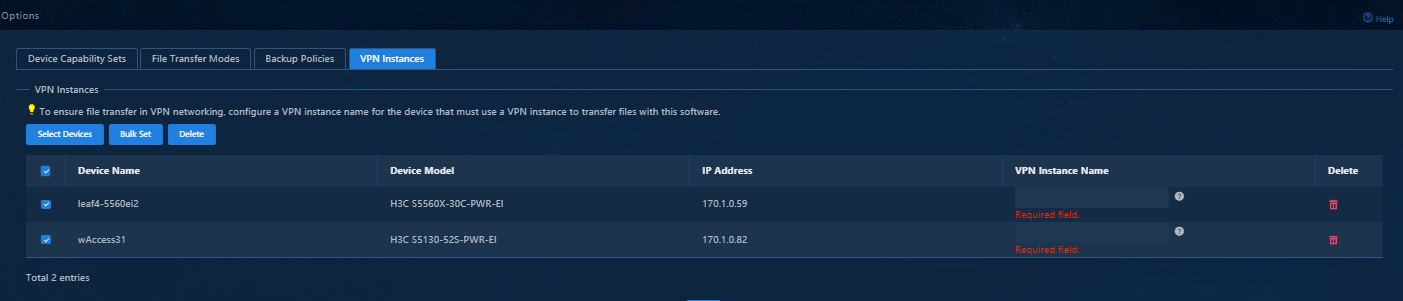
Figure 116 Configuring a VPN instance 2
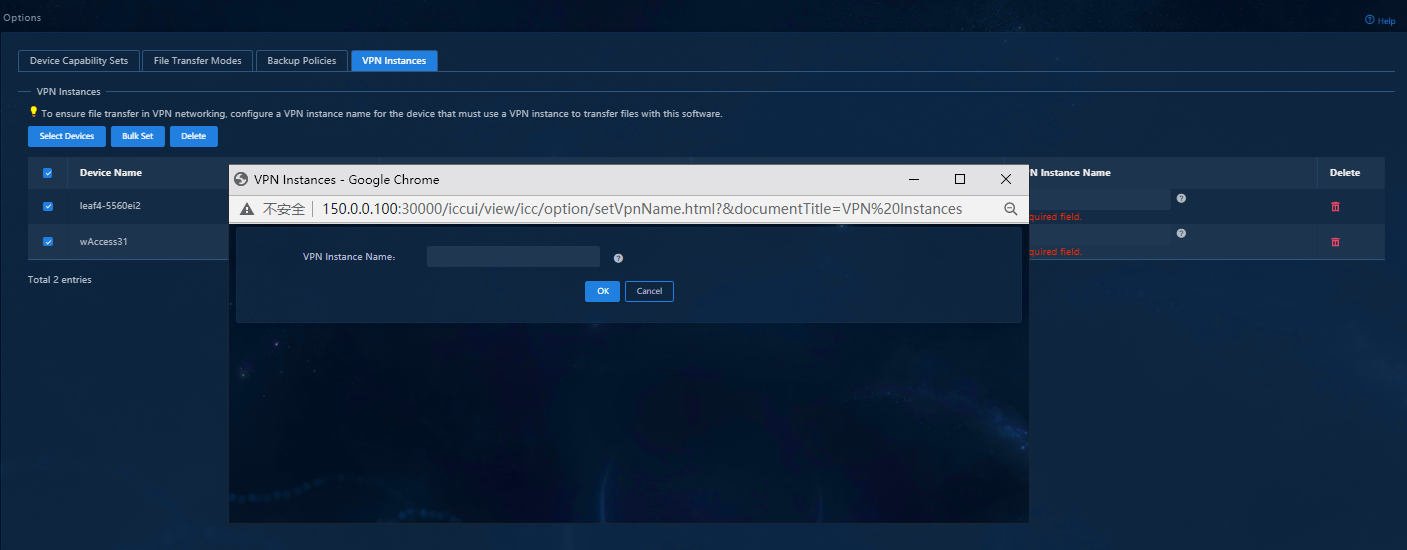
Deploying the configuration segment
1. Navigate to the Automation > Configuration Options > Configuration Templates page. In the Actions column for a configuration template, click the Deploy icon.
Figure 117 Configuration templates
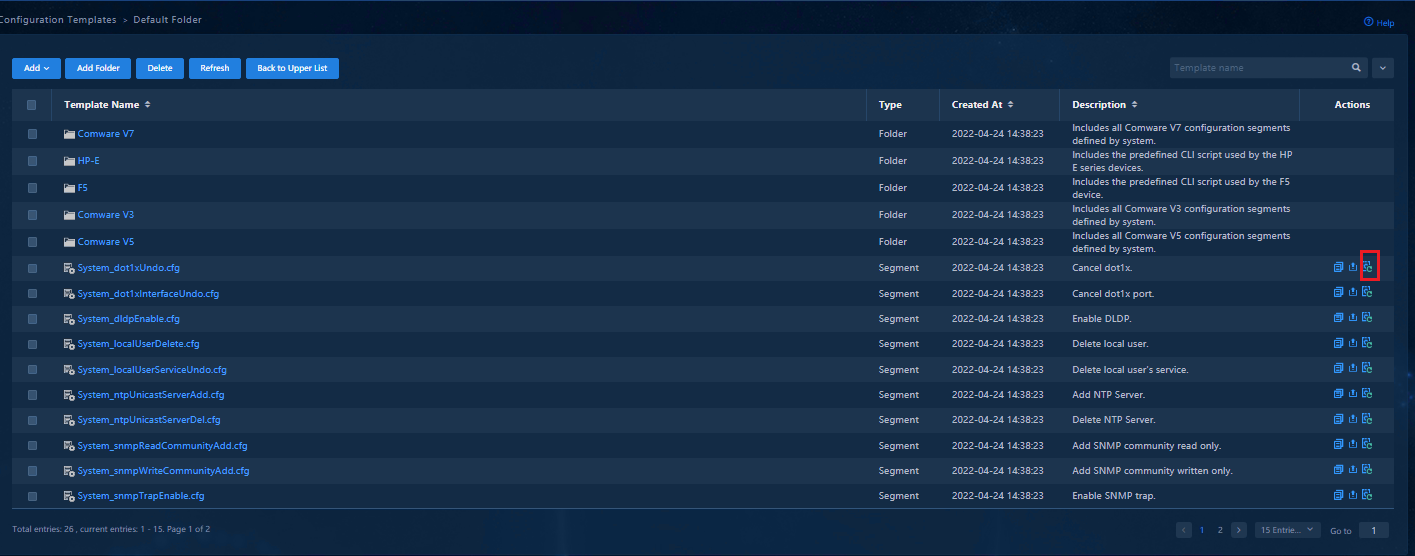
2. On the Deploy Device Configuration page, click Select Devices.
Figure 118 Deploying a configuration template
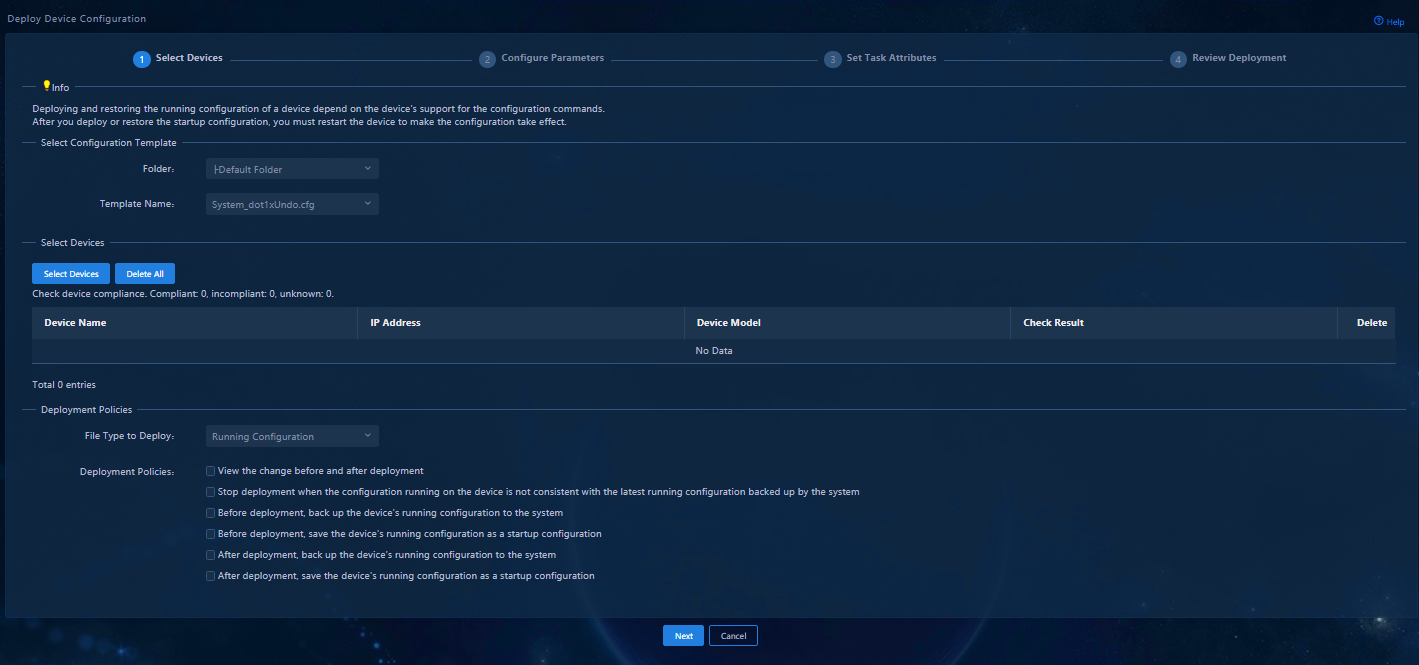
3. In the dialog box that opens, select the device to which you want to deploy the configuration segment, and click Select Devices.
Figure 119 Adding devices
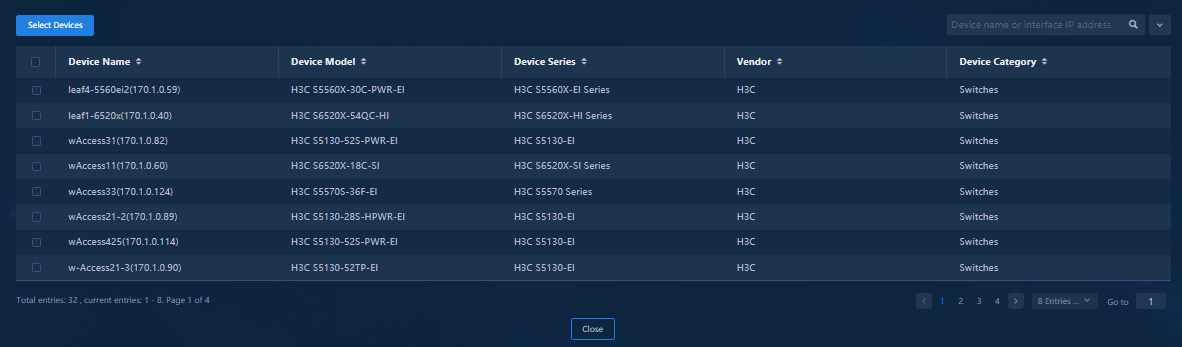
4. On the Deploy Device Configuration page, select deployment policies, and then click Next.
Figure 120 Selecting deployment policies
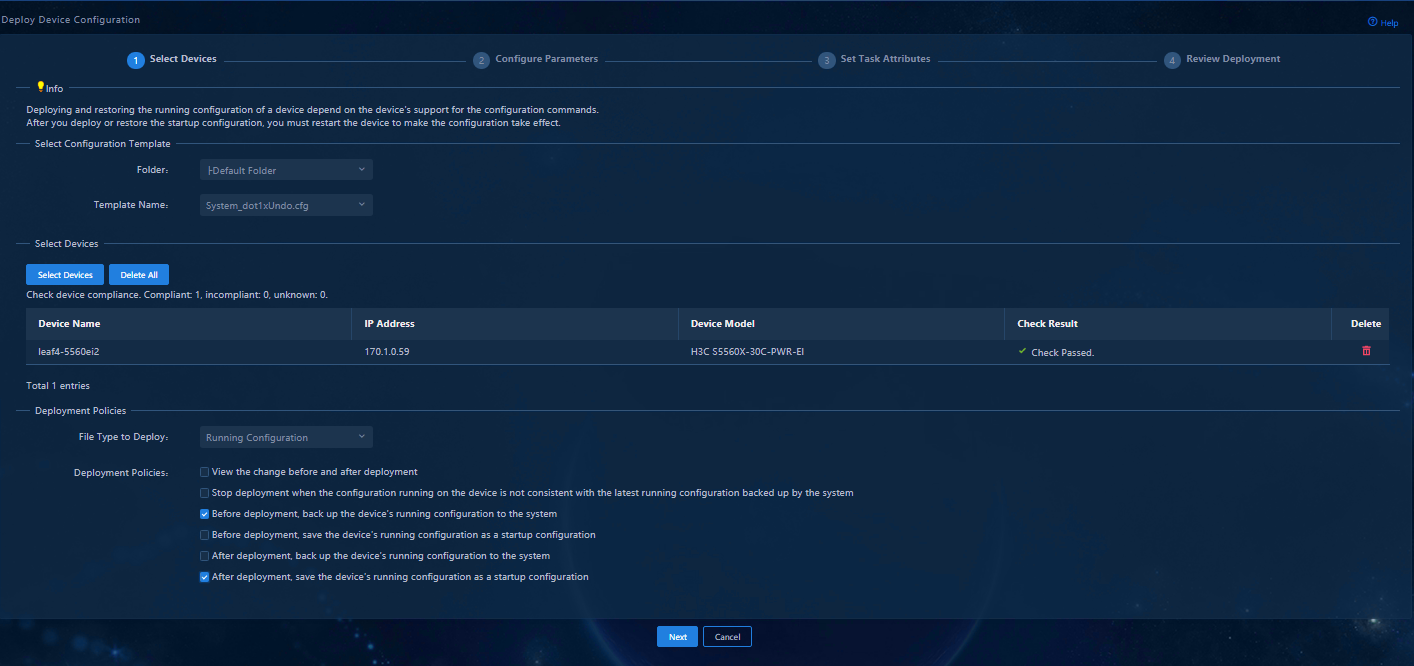
5. Specify the parameters in the dialog box that opens:
¡ Task Name: Enter the template name.
¡ Schedule Time: Select Immediately.
6. Keep clicking Next until you click Finish.
Figure 121 Deploying device configuration
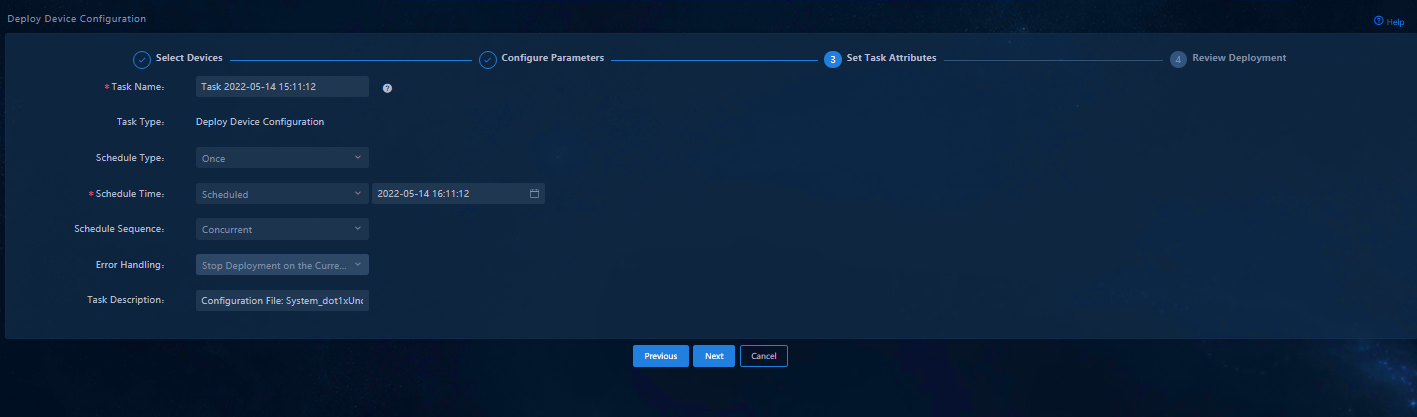
Viewing the deployment result
Navigate to the Automation > Configuration Options > Deployment Tasks page to view the deployment result. To view any failure reason, click the result in the Status--Operation Result column.
Figure 122 Viewing the deployment results