- Released At: 30-05-2023
- Page Views:
- Downloads:
- Table of Contents
- Related Documents
-
|
|
|
Intelligent Management Center |
|
WSM Network Planning Configuration Examples |
|
|
Document version: 5W100-20230529
Software version: IMC WSM 7.3 (E0505)
|
Copyright © 2023 New H3C Technologies Co., Ltd. All rights reserved. No part of this manual may be reproduced or transmitted in any form or by any means without prior written consent of New H3C Technologies Co., Ltd. The information in this document is subject to change without notice. |
|
Contents
Configuration restrictions and guidelines
Example: Using WSM network planning
Setting a location view topology
Adding a location view topology
Setting network planning parameters
Drawing a network planning area
Generating a network planning report
Introduction
This document provides examples for using WSM network planning to plan WLAN deployment.
WSM network planning can plan the locations, models, and number of APs on your network before you deploy a WLAN. Then, WSM generates a network planning report. This feature improves WLAN deployment efficiency.
Prerequisites
Before you configure network planning, complete the following configurations:
· Obtain building plans of the area where WLANs are to be deployed.
· Obtain necessary information about the deployment scenario to correctly draw obstacles.
Configuration restrictions and guidelines
When you configure network planning, follow these restrictions and guidelines:
· Network planning is applicable only to HP and H3C APs.
· WSM must support the models of the APs to be deployed.
Example: Using WSM network planning
Network configuration
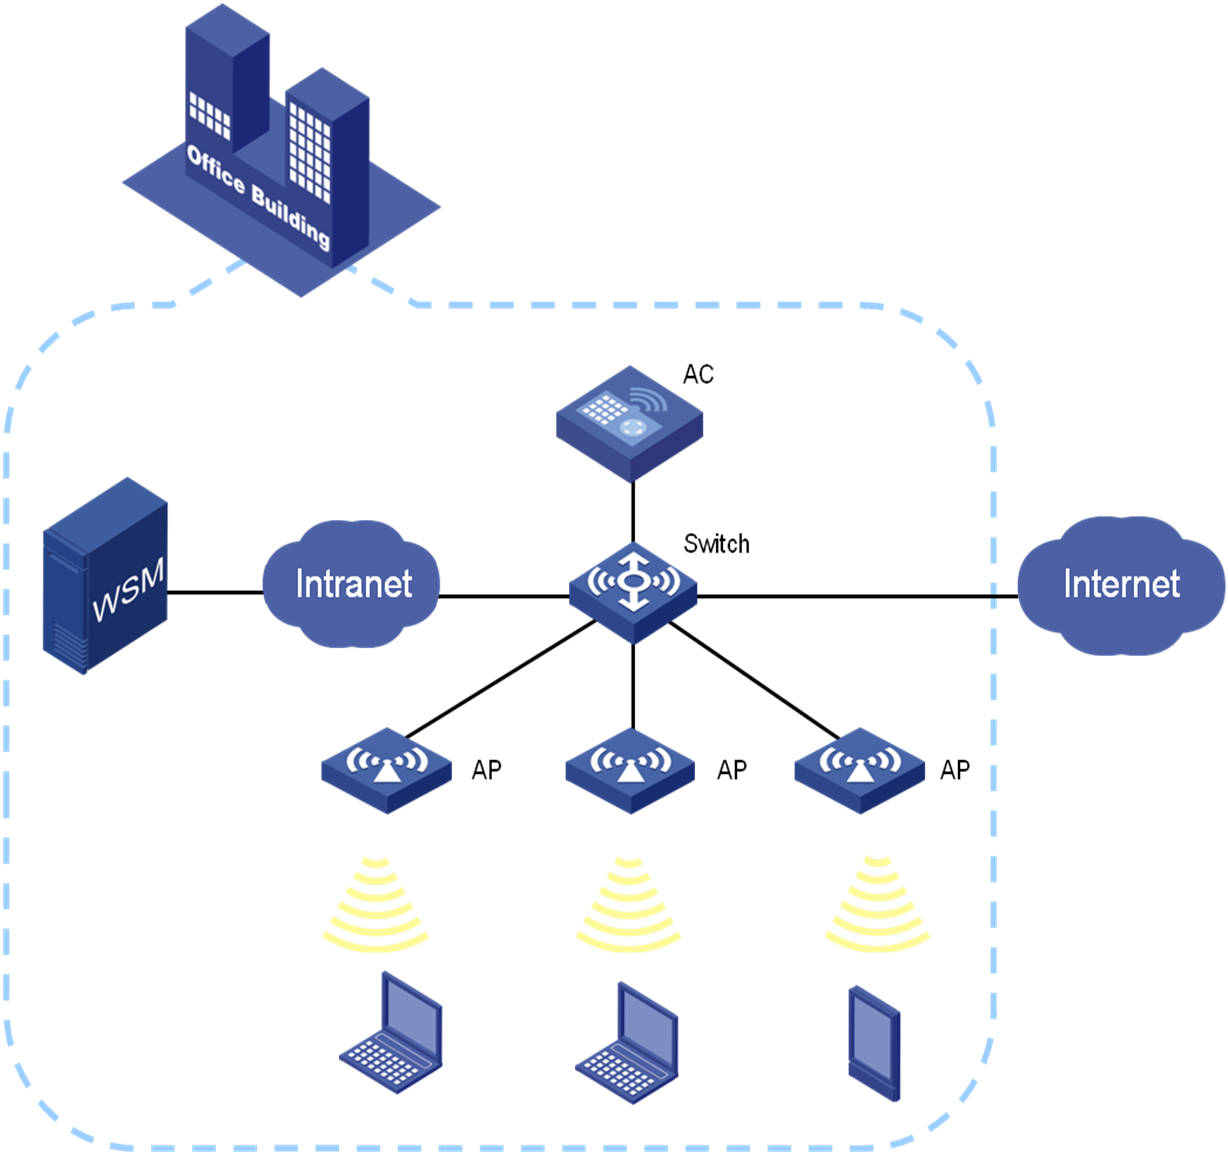
As shown in Figure 1, use the WSM network planning feature to plan WLAN deployment on the first floor of an office building.
Analysis
To use WSM network planning, complete the following tasks:
1. Set a location view topology to build a WLAN deployment environment.
2. Enable network planning to calculate the signal coverage.
3. Generate a network planning report for WLAN deployment.
Software version used
This configuration example was created and verified on the following:
· IMC PLAT 7.3 (E0504).
· IMC WSM 7.3 (E0505).
Setting a location view topology
Adding a location view topology
1. Log in to IMC.
2. Click the Service tab.
3. From the navigation tree, select WLAN Manager > Wireless Topology.
The wireless device topology appears.
4. From the navigation tree, select Topology > Wireless Topology > Location View.
The location view topology displays all location views, as shown in Figure 2.
Figure 2 Location view topology

5. Right-click on a blank area, and then select Add Location from the shortcut menu.
6. In the Add Location dialog box, configure the following parameters as needed, as shown in Figure 3:
¡ Enter buildingA1 in the Location Name field.
¡ Select Floor from the Location Type list.

7. Click OK.
The location view named buildingA1 is added.
8. Double-click the location view to open the location view topology.
Adding a background image
1. On the toolbar at the top of the topology page,
click the Add Background icon![]() .
.
The Set Topology Background Image page appears.
2. Select Upload Image or Upload CAD File, and then click Choose File, as shown in Figure 4.

3. Select the building plan of the first floor in building A, and then click Open.
4. On the Set Topology Background Image page, perform one of the following tasks:
¡ Click Set if you selected Upload Image.
¡ Click Merge into Picture if you selected Upload CAD File.
5. Click Close.
The selected image appears in the location view topology, as shown in Figure 5.
Figure 5 Location view topology

Setting a scale
1. Set a scale by using one of the following methods:
¡ On
the toolbar at the top of the topology page, click the Set
Scale icon ![]() .
.
¡ Right-click on a blank area, and select Set Scale from the shortcut menu.
2. Draw a line on the background image, as shown in Figure 6.

3. In the Specify the actual distance window, enter 8.12 in the Actual Distance field and select Meter as a unit of measurement, as shown in Figure 7.
Figure 7 Setting a scale

4. Click OK.
The scale appears at the left corner of the topology, as shown in Figure 8.
Figure 8 Scale displayed on the topology

Drawing obstacles
1. On the toolbar at the top of the topology page,
click the Add Obstacle icon ![]() .
.
2. In the Add Obstacle dialog box, configure the following parameters to add elevators, as shown in Figure 9:
¡ Select Rectangle from the Shape list.
¡ Select Elevator Shaft (150dB/m) from the Type list.
¡ Use the default value 0.2 for the Thickness(m) field.
The value of the Absorption(dB) field is automatically calculated based on the obstacle type and thickness.
Figure 9 Configuring elevator parameters

3. Click OK to enter draw mode.
4. Drag the cursor to draw a rectangle as an elevator, as shown in Figure 10.

5. Double-click to finish drawing the elevator.
In draw mode, you can add multiple elevator obstacles.
6. Click the Exit Edit
Mode icon ![]() to exit draw mode.
to exit draw mode.
7. Click the Add Obstacle icon
![]() .
.
8. In the Add Obstacle dialog box, configure the following parameters to draw bearing pillars, as shown in Figure 11:
¡ Select Rectangle Area from the Shape list.
¡ Select Concrete (24dB/m) from the Type list.
Figure 11 Configuring bearing pillar parameters

9. Click OK to enter draw mode.
10. Drag the cursor to draw a rectangle area as a bearing pillar, as shown in Figure 12.

11. Double-click to finish drawing the bearing pillar.
In draw mode, you can add multiple bearing pillars.
12. Click the Exit Edit
Mode icon ![]() to exit draw mode.
to exit draw mode.
13. Click the Add Obstacle icon ![]() .
.
14. In the Add Obstacle dialog box, configure the following parameters, as shown in Figure 13:
¡ Select Polyline from the Shape list.
¡ Select Brick Wall (24dB/m) from the Type list.
¡ Enter 0.3 in the Thickness (m) field.
The value of the Absorption(dB) field is automatically calculated based on the obstacle type and thickness.
Figure 13 Configuring brick wall parameters

15. Click OK to enter draw mode.
16. Drag the cursor to draw a brick wall, as shown in Figure 14.

17. Double-click to finish drawing the brick wall.
In draw mode, you can add multiple brick walls.
18. Click the Exit Edit
Mode icon ![]() to exit draw mode.
to exit draw mode.
Drawing obstacles is complete, as shown in Figure 15.

Configuring network planning
Setting network planning parameters
1. Right-click on a blank area, and then select Plan Network > Draw Covered Area from the shortcut menu.
2. On the Auto Plan Parameters page, configure the following parameters, as shown in Figure 16.
¡ Select the 2.4G option, and then select 802.11gn from the list.
¡ Select H3C from the AP Vendor list.
¡ Select WA2620i-AGN from the AP Model list.
¡ Use the default value –70 for the Minimum Signal Strength(dBm) field.
¡ Use the default value 100 for the Concurrent Online User Count field.
¡ Enter 10 in the Per-User Bandwidth (Mbps) field.
¡ Enter 80 in the Power Usage (%)-2.4GHz field.
Figure 16 Setting network planning parameters

3. Click OK to enter network planning area draw mode.
Drawing a network planning area
1. Drag the cursor on the background image, and then click at the desired positions to draw a network planning area.
In draw mode, you can add multiple areas.
A network planning area can contain a maximum of 25 points. If a network planning area is complicated, you can divide the area into multiple areas.
2. Double-click to finish drawing the network planning area.
The network planning area is highlighted on the background image, as shown in Figure 17.
Figure 17 Network planning area

3. Click the Exit Edit Mode icon ![]() to exit draw mode.
to exit draw mode.
Auto AP deployment
Right-click on a blank area, and then select Plan Network > Auto Lay APs from the shortcut menu.
WSM automatically deploys the virtual APs in the network planning area. The blue AP icons indicate the locations where the APs are deployed, as shown in Figure 18.
Figure 18 Virtual AP deployment

Displaying signal strengths
1. Right-click on a blank area, and select Show Signal Coverage > By Signal from the shortcut menu.
2. In the window that appears, select 2.4G.
3. Click OK.
The topology displays the signal coverage area for each AP, as shown in Figure 19.
You can view the signal coverage area by rate, channel, or SSID as needed. Based on the signal coverage result, you can add or delete virtual APs or adjust AP locations.
Figure 19 Displaying signal strengths

Adding a virtual AP
You need to add virtual APs if the signal strength is not strong. In this example, an AP named WA2620i-AGN_5 is added.
To add a virtual AP:
1. Right-click on a blank area, and then select Add Virtual APs from the shortcut menu.
2. In the Select AP Model window, select an AP model, and then click OK to return to the location view and enter adding virtual AP mode, as shown in Figure 20.
Figure 20 Selecting an AP model

3. Click the spot where the virtual AP is to be added.
The added virtual AP appears on the spot.
4. Click the Exit Current Mode icon ![]() to exit adding virtual AP mode.
to exit adding virtual AP mode.
Modifying a virtual AP
You can modify virtual APs to obtain optimal signals. This example uses a virtual AP named WA2620i-AGN_1.
To modify a virtual AP:
1. Right-click the virtual AP WA2620i-AGN_1, and then select Modify Virtual AP from the shortcut menu.
2. On the Modify Virtual AP page, click the Radio2 tab and configure the following parameters, as shown in Figure 21:
¡ Select ANT-2009Y from the Antenna list.
¡ Enter 200 in the Angle field. Click Refresh to view the signal coverage area of the virtual AP.
¡ Use the default settings for other fields.
Figure 21 Modifying a virtual AP

3. Click OK.
The new signal coverage area appears, as shown in Figure 22.
Figure 22 New signal coverage area

Generating a network planning report
1. Right-click on a blank area, and then select Generate Network Planning Report from the shortcut menu.
2. Click Result after report generation is complete, as shown in Figure 23.
Figure 23 Exporting the network planning report

The network planning report is exported, including AP and antenna information, number of APs and antennas to be deployed, locations of APs, and signal coverage areas.
Figure 24 Network planning report

