- Released At: 25-02-2022
- Page Views:
- Downloads:
- Table of Contents
- Related Documents
-
|
|
|
H3C SecPath Firewall Products |
|
Comware 7 Troubleshooting Guide |
|
|
|
|
Document version: 6W402-20220223
Copyright © 2022 New H3C Technologies Co., Ltd. All rights reserved.
No part of this manual may be reproduced or transmitted in any form or by any means without prior written consent of New H3C Technologies Co., Ltd.
Except for the trademarks of New H3C Technologies Co., Ltd., any trademarks that may be mentioned in this document are the property of their respective owners.
The information in this document is subject to change without notice.
Contents
Applicable device models and software versions
Collecting log and operating information
Collecting common log messages
Collecting diagnostic log messages
Collecting operating statistics
Common service recovery and fault removal methods
Troubleshooting packet forwarding failures
Device ping failure from a directly connected PC
Connectivity failure between two PCs connected through the device
Connectivity failure between PCs connected through the device in the same security zone
Ping or tracert operation failure
Ping operation failure across NAT
IRF fabric establishment failure
A Reth interface is not pingable if not assigned to redundancy group
Failure to access the external network from internal users
Source address translation failure
Destination address translation failure
IPsec configuration failure (NAT in unification with IPsec)
Failure to access the gateway device configured with policy-based NAT from internal users
Failure to access the gateway device configured with source address translation from external users
Failure to access the external network from internal users
Source address translation failure
Destination address translation failure
IPsec configuration failure (NAT in unification with IPsec)
Failure to access the gateway device configured with source address translation from external users
NAT fails but the outbound interface can be pinged successfully from the external network
IPsec SAs established successfully but IPsec-protected traffic cannot be forwarded
IKE SAs established successfully but IPsec SAs cannot be established
IPsec smart link does not detect link quality
IPsec tunnel interface-based IPsec tunnel cannot be established
Troubleshooting load balancing
High CPU usage and memory usage
Troubleshooting system management
Failure to log in to the SSL VPN Web interface
Failure to log in to the SSL VPN gateway from a browser
Failure to access internal resources from a browser
Failure to obtain SSL VPN gateway information from an iNode client
Failure to log in to the SSL VPN gateway from an iNode client
Failure to access internal resources from an iNode client
Failure to terminate idle SSL VPN sessions of iNode client users
User filtering, monitoring, and IP binding settings not take effect
Failure to relog in to the SSL VPN gateway
Failure to configure WeChat Work (or WeCom) authentication
IPS or anti-virus mistakenly intercepts legal traffic
IPS or WAF fails to intercept attack traffic or generate attack logs
Application rate limit does not take effect
File filtering or data filtering does not take effect
SSL decryption does not take effect
Application audit and management does not take effect
URL filtering does not take effect
Server connection detection does not take effect
IP reputation does not take effect
Applicable device models and software versions
This document is not restricted to specific software or hardware versions. Procedures and information in the document might be slightly different depending on the software or hardware version of the device.
Table 1 describes the applicable device models and software versions.
Table 1 Applicable device models and software versions
|
Device model |
Software version |
|
F5030-D, F5060-D, F5080-D, F5000-AK515, F5000-AK525 |
R9620 |
|
F5030, F5030-6GW, F5060, F5080, F5000-M, F5000-A, F5000-AI-20, F5000-AI-40, F5000-V30 |
R9628 |
|
F5010, F5020-GM, F5020, F5040, F5000-C, F5000-S |
R9342 |
|
F1000-AI-20, F1000-AI-30, F1000-AI-50 |
R9345 |
|
F1000-AI-60, F1000-AI-70, F1000-AI-80, F1000-AI-90 |
R8601 |
|
F1005, F1010, F1003-L, F1005-L, F1010-L |
R9536 |
|
F1020, F1020-GM, F1030, F1030-GM, F1050, F1060, F1070, F1070-GM, F1070-GM-L, F1080, F1000-V70 |
R9345 |
|
F1090, F1000-V90 |
R8601 |
|
F1000-AK1010, F1000-AK1020, F1000-AK1030 |
R9536 |
|
F1000-AK1110, F1000-AK1120, F1000-AK1130, F1000-AK1140 |
R9536 |
|
F1000-AK1212, F1000-AK1222, F1000-AK1232, F1000-AK1312, F1000-AK1322, F1000-AK1332 |
R9345 |
|
F1000-AK1414, F1000-AK1424, F1000-AK1434, F1000-AK1514, F1000-AK1524, F1000-AK1534, F1000-AK1614 |
R8601 |
|
F1000-AK108, F1000-AK109, F1000-AK110, F1000-AK115, F1000-AK120, F1000-AK125, F1000-AK710 |
R9536 |
|
F1000-AK130, F1000-AK135, F1000-AK140, F1000-AK145, F1000-AK150, F1000-AK155, F1000-AK160, F1000-AK165, F1000-AK170, F1000-AK175, F1000-AK180, F1000-AK185, F1000-AK711, F1000-GM-AK370, F1000-GM-AK380 |
R9345 |
|
F1000-E-G5, F1000-H-G5 |
R8601 |
|
F100-C-G5, F100-M-G5, F100-S-G5 |
R9345 |
|
F1000-A-G3, F1000-C-G3, F1000-E-G3, F1000-S-G3 |
R8601 |
|
F1000-9390-AI, F1000-9385-AI |
R8601 |
|
F1000-990-AI, F1000-980-AI, F1000-970-AI, F1000-960-AI, F1000-950-AI, F1000-930-AI, F1000-920-AI |
R9345 |
|
F1000-910-AI, F1000-905-AI |
R9536 |
|
F1000-720-HI, F1000-710-HI |
R9536 |
|
F100-C-XI, F100-S-XI |
R9536 |
|
F1000-E-G2, F1000-A-G2, F1000-S-G2, F1000-C-G2, F100-A-G2, F100-E-G2, F100-A-G3, F100-E-G3 |
R9345 |
|
F1000-C8180, F1000-C8170, F1000-C8160, F1000-E-VG |
R9345 |
|
F1000-C-EI, F1000-C-HI, F100-A-EI, F100-E-EI, F100-A-HI, F100-A-SI, F100-A80-WiNet |
R9345 |
|
F1000-C8150, F1000-C8130, F1000-C8120, F1000-C8110, F1000-S-VG |
R9536 |
|
F1000-C8395 |
R8601 |
|
F100-C-A6, F100-C-A5, F100-C-A3, F100-C-G3, F100-S-G3, F100-M-G3, F100-M-G2, F100-S-G2, F100-C-G2, F100-C-EI, F100-C-HI, F100-S-HI |
R9536 |
|
F100-C80-WiNet, F100-C60-WiNet, F100-C50-WiNet, F100-S80-WiNet |
R9536 |
|
F100-C-A6-WL, F100-C-A5-W, F100-C-A3-W |
R9602 |
|
LSU3FWCEA0, LSUM1FWCEAB0, LSX1FWCEA1 |
R8239 |
|
LSPM6FWD |
R8533 |
|
LSXM1FWDF1, LSUM1FWDEC0, IM-NGFWX-IV, LSQM1FWDSC0, LSWM1FWD0, LSQM2FWDSC0 |
R8534 |
|
LSPM6FWD8 |
R8535 |
|
LSQM2FWDSC8 |
R8520 |
Introduction
This document provides information about troubleshooting common software and hardware issues with the firewall.
General guidelines
|
|
IMPORTANT: To prevent an issue from causing loss of configuration, save the configuration each time you finish configuring a feature when the system is operating correctly. For configuration recovery, regularly back up the configuration to a remove server. |
When you troubleshoot the firewall, follow these general guidelines:
· To ensure safety, wear an ESD wrist strap when you replace or maintain a hardware component.
· To help identify the cause of the issue, collect system and configuration information, including:
¡ Symptom, time of failure, and configuration.
¡ Network topology information, including the network diagram, port connections, and points of failure.
¡ Steps you have taken, such as reconfiguration, cable swapping, and reboot, and the action results.
¡ Output from the commands executed during the troubleshooting process.
¡ Log messages and diagnostic information.
¡ Information about the captured packets, debugging information, information about repeated reboots of an MPU or switching fabric module.
¡ Physical evidence of failure:
- Photos of the hardware.
- Status of the card, power, and fan tray status LEDs.
· Be clear about the impact of each configuration or operation during the troubleshooting process and make sure any issues caused by the configuration or operation can be fixed and will not cause serious consequences.
· After each operation is performed, wait for a certain time to verify the operation effect.
· To prevent configuration loss, do not save the configuration in the troubleshooting process especially when an IRF split occurs.
Collecting log and operating information
|
|
IMPORTANT: By default, the information center is enabled. If the feature is disabled, you must use the info-center enable command to enable the feature for collecting log messages. |
The device generates common and diagnostic log messages and operating statistics during the operating process.
The common log messages are in the log buffer before they are saved to the log file. The system saves the contents in the log file buffer to the log file at the specified frequency. You can also execute the logfile save command in any view to save the contents of the log file buffer to the log file immediately.
The diagnostic log messages are in the diagnostic log buffer before they are saved to a diagnostic log file. The system saves the contents of the diagnostic log file buffer to the diagnostic log file at the specified frequency. You can also execute the diagnostic-logfile save command in any view to save the contents of the diagnostic log file buffer to the diagnostic log file immediately.
These log files are stored in flash or CF card of the device. You can export these files by using FTP or TFTP.
Table 2 Log and operating information
|
Category |
File name format |
Content |
|
Common log |
logfileX.log |
Command execution, trap, and operational log messages. |
|
Diagnostic log |
diagfileX.log |
Diagnostic log messages about device operation, including the following items: · Parameter settings in effect when an error occurs. · Information about a card startup error. · Handshaking information between the MPU and interface card when a communication error occurs. |
|
Operating statistics |
file-basename.gz |
Device status, CPU status, memory status, configuration, software entries, and hardware entries |
Collecting common log messages
1. Use the logfile save command to save common log messages from the log buffer to the log file.
[H3C] logfile save
The contents in the log file buffer have been saved to the file flash:/logfile/l
ogfile.log.
2. Verify information about the log file.
<H3C> dir flash:/logfile/
Directory of flash:/logfile
0 -rw- 10483632 Jul 08 2014 15:05:22 logfile.log
253156 KB total (77596 KB free)
Collecting diagnostic log messages
1. Use the diagnostic-logfile save command to save diagnostic log messages from the diagnostic log buffer to the diagnostic log file.
<H3C>diagnostic-logfile save
The contents in the diagnostic log file buffer have been saved to the file flash
:/diagfile/diagfile.log.
2. Verify information about the diagnostic log file.
<H3C>dir flash:/diagfile/
Directory of flash:/diagfile
0 -rw- 10485740 Nov 04 2020 17:51:52 diagfile.log
7456492 KB total (6624504 KB free)
Collecting operating statistics
You can use the display diagnostic-information command to display or save diagnostic information.
# To save operating statistics, execute the display diagnostic-information command and enter Y to save diagnostic information when you are promoted to save or display diagnostic information. The information might fail to be collected completely if you enter N to display diagnostic information.
<H3C> display diagnostic-information
Save or display diagnostic information (Y=save, N=display)? [Y/N]:y
Please input the file name(*.gz)[flash:/diag.gz]:flash:/diag.gz
Diagnostic information is outputting to flash:/diag.gz.
Save successfully.
<H3C> dir flash:/
Directory of flash:
......
6 -rw- 898180 Jun 26 2013 09:23:51 diag.gz
1021808 KB total (259072 KB free)
# To display diagnostic information, execute the screen-length disable command to disable pausing between screens of output before executing the display diagnostic-information command.
<H3C> screen-length disable
% Screen-length configuration is disabled for current user.
<H3C> display diagnostic-information
Save or display diagnostic information (Y=save, N=display)? [Y/N]:N
==================================================================
===============display cpu===============
Slot 1 CPU 0 CPU usage:
6% in last 5 seconds
6% in last 1 minute
6% in last 5 minutes
===========================================================
=================================================================
===============display cpu-usage history slot 1 ===============
100%|
95%|
90%|
85%|
80%|
75%|
70%|
65%|
60%|
55%|
50%|
45%|
40%|
35%|
30%|
25%|
20%|
15%|
10%|
5%|############################################################
------------------------------------------------------------
10 20 30 40 50 60 (minutes)
cpu-usage (Slot 1 CPU 0) last 60 minutes (SYSTEM)
……………………………………
Troubleshooting methods
When a fault occurs, first collect related system, configuration, and operation information to identify the fault type and then resolve the fault according to the troubleshooting method for this fault type.
If the fault cannot be identified, provide the fault description together with collected information to the technical support for analysis.
Troubleshooting flowchart
Figure 1 shows the general troubleshooting process for you to identify the fault type.
Figure 1 Troubleshooting flowchart
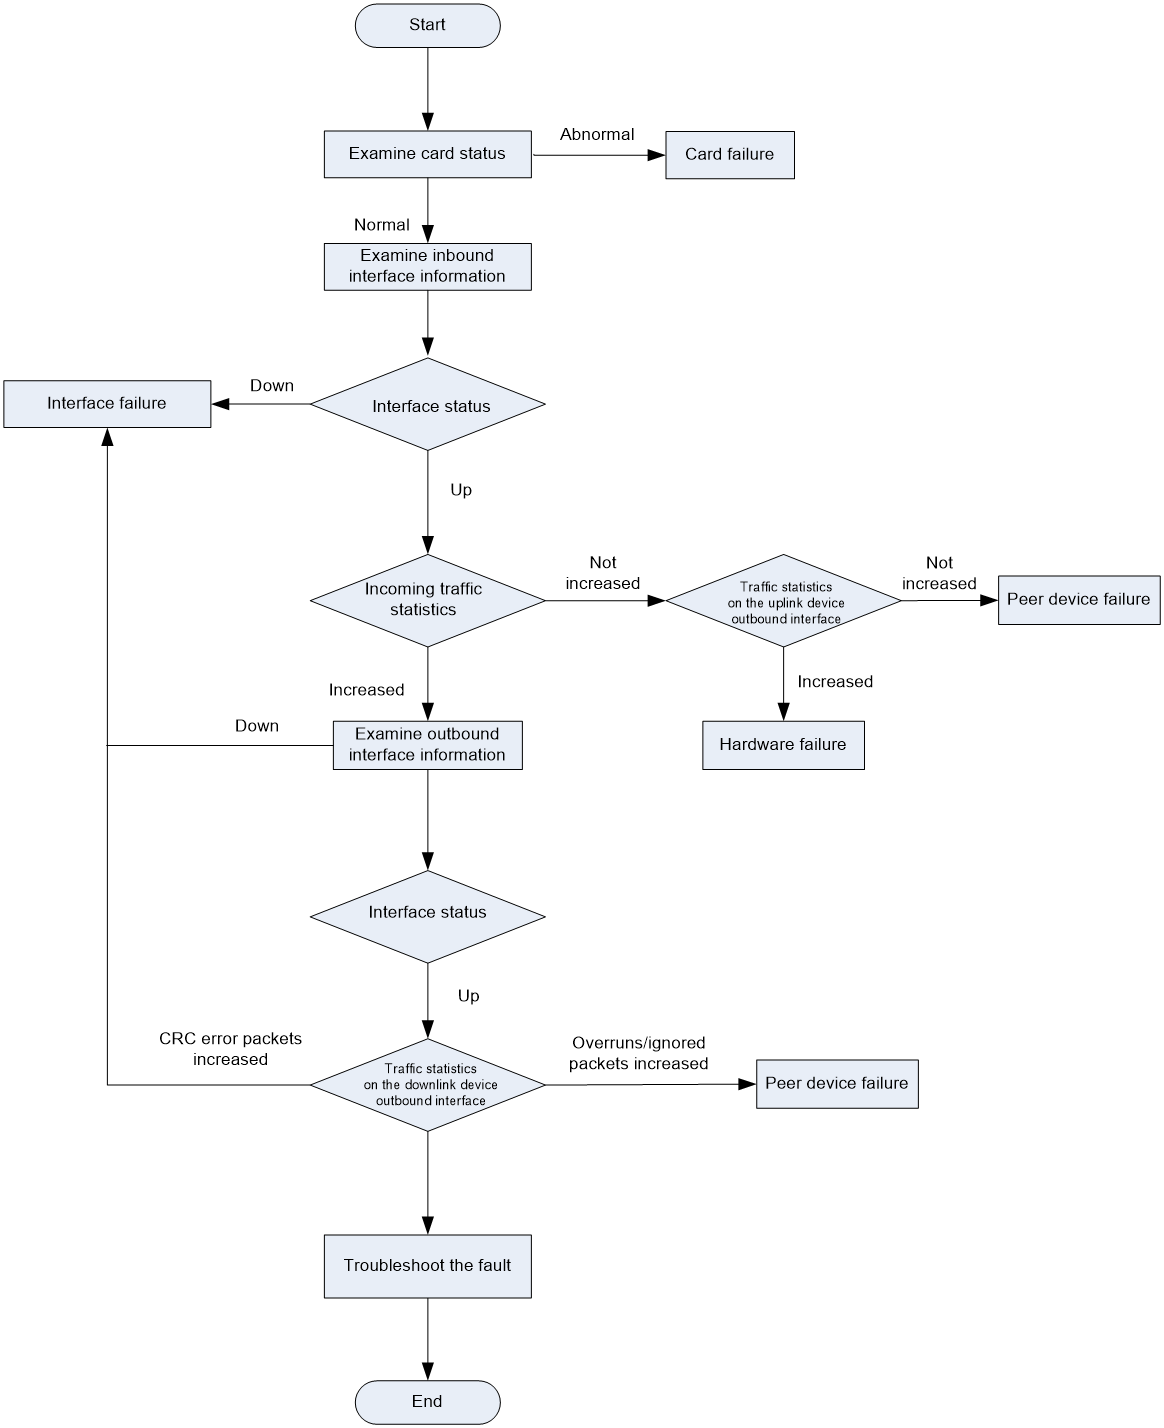
Fault types
The following types of faults might occur on the device:
· Chassis failure—Unexpected reboot, abnormal state, failure to start up, or repeated reboots. For the troubleshooting procedure, see "Chassis failure" in "Troubleshooting hardware."
· Temperature alarm—For the troubleshooting procedure, see "Temperature alarms" in "Troubleshooting hardware."
· Interface failure—If an interface fails to come up, flaps between up and down states, or has error packets, see "Troubleshooting interfaces" for the troubleshooting procedure.
· IRF failure—If devices fail to form an IRF or an IRF split occurs, see "Troubleshooting IRF" for the troubleshooting procedure.
· Hot backup failure—If an exception occurs during master/subordination switchover, forwarding through the redundant port, or service switching to a redundant port, see "Troubleshooting hot backup" for the troubleshooting procedure.
· Load balancing failure—See "Troubleshooting load balancing" for the troubleshooting procedure.
· High CPU usage—See "High CPU usage in "Troubleshooting system management" for the troubleshooting procedure.
· High memory usage—See "High memory usage" in "Troubleshooting system management" for the troubleshooting procedure.
Common service recovery and fault removal methods
Table 3 Common power and air conditioning facilities methods
|
Fault category |
Service recovery methods |
Fault removal methods |
|
Hardware |
· Isolate the faulty card. · Isolate the faulty device by adjusting the traffic forwarding paths. For example, changing the preferences of routes so traffic is switched to other paths. |
Complete required tests on the backup hardware, and replace the failed hardware. |
|
Software |
· Re-enable the protocols on the faulty device. · Isolate the faulty device by adjusting the traffic forwarding paths. |
Upgrade the software version, including the patch version. Adjust the network topology or modify the configuration to remove the failures |
|
Link |
Isolate the faulty link by adjusting the traffic forwarding paths. |
Remove link errors. |
|
Others |
· Correct configuration errors. · Connect the ports of the devices correctly. · Isolate the faulty link by adjusting the traffic forwarding paths. |
· Modify the incorrect configurations. · Correctly connect the device ports. · Repair the power and air conditioner systems for the devices. |
Troubleshooting hardware
Chassis failure
Symptom
The chassis reboots unexpectedly.
Solution
To resolve the issue:
Execute the display version command, and check the last reboot reason field to identify the reason for the chassis reboot.
If the chassis reboot is caused by software anomalies, collect diagnostic information and send it to the H3C Support.
H3C Comware Software, Version 7.1.064, Ess 8601P08
Copyright (c) 2004-2019 New H3C Technologies Co., Ltd. All rights reserved.
H3C SecPath F1090 uptime is 0 weeks, 0 days, 0 hours, 5 minutes
Last reboot reason: User reboot
Boot image: flash:/F1090FW-CMW710-BOOT-E8601P08.bin
Boot image version: 7.1.064, Ess 8601P08
Compiled Sep 10 2019 15:00:00
System image: flash:/F1090FW-CMW710-SYSTEM-E8601P08.bin
System image version: 7.1.064, Ess 8601P08
Compiled Sep 10 2019 15:00:00
SLOT 1
CPU type: Multi-core CPU
DDR4 SDRAM Memory: 8192M bytes
FLASH: 7296M bytes
CPLD_A Version: 1.0
CPLD_B Version: 1.0
Release Version:SecPath F1090-8601P08
Basic BootWare Version:0.30
Extend BootWare Version:1.01
BuckleBoard Version:Ver.A
BackBoard1 Version:Ver.A
BackBoard2 Version:Ver.A
HD_BackBoard Version:Ver.D
Pcb Version:Ver.A
[SUBCARD 0] NSQ1F1MSPUOTXA(Hardware)Ver.A, (Driver)1.0, (Cpld)1.0
Boot Type: Warm
[H3C]display system internal version
H3C SecPath F1090 V800R006B01D645SP08
Comware V700R001B64D045SP08
Fan tray failure
Symptom
The fan tray status LED indicates an abnormal condition exists. The device outputs messages about fan tray failures as follows:
%May 06 10:12:24:805 2017 H3C DEV/3/FAN_ABSENT: -MDC=1; Slot 2 Fan 2 is absent.
%May 06 10:12:32:805 2017 H3C DEVD/2/DRV_DEV_FAN_CHANGE: -MDC=1; Slot 2: Fan communication state changed: Fan 1 changed to fault.
%May 06 10:12:42:405 2017 H3C DEV/2/FAN_FAILED: -MDC=1; Slot 2 Fan 1 failed.
Solution
To resolve the issue:
1. If the fan tray is present in the slot, place your hand at the outlet air vents of the device to verify that wind blows out of the device.
If no wind blows out of the device, the fan tray is faulty.
2. Verify that the inlet and outlet air vents are not blocked and no large amount of dust buildup exists on the inlet and outlet air vents.
3. Verify that the fan tray is present in the slot with normal operating state and normal fan speed.
Execute the display fan command to view the fan tray operating status information. If fan status is not normal, or the displayed fan speed is less than half of the normal fan speed, you can remove and reinstall the fan tray or swap the fan tray with another to verify the failure reason.
<H3C> display fan
SLOT 1 Fan 0 Status: Normal Speed:9500
SLOT 1 Fan 1 Status: Normal Speed:9500
SLOT 1 Fan 2 Status: Normal Speed:9500
4. If the issue persists, replace the fan tray.
If no fan tray is present, power off the device to avoid module damage caused by high temperature. You can continue using the device if you can use cooling measures to keep the device operating temperature below 50°C (122°F).
5. If the issue persists, contact H3C Support.
Temperature alarms
Symptom
The device outputs a high-temperature or low-temperature alarm message as follows:
%Mar 18 04:22:05:893 2017 H3C DEV/4/TEMPERATURE_WARNING: -Context=1; Temperature is greater than the high-temperature warning threshold on slot 2 sensor inflow 1. Current temperature is 43 degrees centigrade.
Solution
To resolve the issue:
1. Verify that the environment temperature is normal.
If the environment temperature is high, verify the cause of high temperature, such as poor ventilation in the equipment room or failure of the air conditioner.
2. Verify that the device temperature does not exceed the upper or lower warning or alarm thresholds.
You can execute the display environment command to view the module temperature or use hands to touch the modules. If the module temperature is high, immediately examine the causes of high temperature to avoid module damage caused by long-time high temperature of the module.
If the Temperature field displays error or a value out of the ordinary, the switch might fail to access the card temperature sensor through the I2C bus. The switch accesses the transceiver modules through the same I2C bus. You can view whether the transceiver module information is displayed correctly. If the switch can access the transceiver modules, use the temperature-limit command to reconfigure the temperature thresholds. Then use the display environment command to view whether the setting takes effect.
[H3C] temperature-limit slot 1 inflow 1 -5 43 51
[H3C] display environment
System Temperature information (degree centigrade):
--------------------------------------------------------------------------------
---------
Slot Sensor Temperature LowerLimit Warning-UpperLimit Alarm-UpperLimit S
hutdown-UpperLimit
1 inflow 1 29 -5 43 51
NA
2 inflow 1 28 -5 48 56
NA
3. If you still cannot find the cause of temperature alarms, obtain the temperature alarm logs and temperature information and send them to H3C Support for help.
Related commands
|
Command |
Description |
|
display device |
Displays device information. |
|
display environment |
Displays temperature information. |
|
display power |
Displays power supply information, including: · Power supply status. · Power supply type, rated input voltage, and rated output voltage. · Number of available power supplies, total available power of power supplies, total used power, and redundant power. · Status of installed power supplies. · Power supply status of the cards. |
|
display version |
Displays system version information, module uptime, and last reboot reason. |
|
save |
Saves the running configuration to a configuration file. |
|
temperature-limit |
Sets the temperature alarm thresholds. |
Troubleshooting interfaces
Error packets on an interface
Symptom
The output from the display interface command shows that error packets exist on an interface.
<H3C>display interface GigabitEthernet 1/0/2
GigabitEthernet1/0/2
Current state: DOWN
Line protocol state: DOWN
Description: GigabitEthernet1/0/2 Interface
Maximum transmission unit: 1500
Internet address: 192.168.2.1/24 (primary)
IP packet frame type: Ethernet II, hardware address: 50da-00dd-1327
IPv6 packet frame type: Ethernet II, hardware address: 50da-00dd-1327
Media type is twisted pair, loopback not set, promiscuous mode not set
Speed Negotiation, Duplex Negotiation, link type is autonegotiation
Output flow-control is disabled, input flow-control is disabled
Last link flapping: Never
Last clearing of counters: Never
Peak input rate: 0 bytes/sec, at 00-00-00 00:00:00
Peak output rate: 0 bytes/sec, at 00-00-00 00:00:00
Last 300 second input: 0 packets/sec 0 bytes/sec -%
Last 300 second output: 0 packets/sec 0 bytes/sec -%
Input (total): 0 packets, 0 bytes
0 unicasts, 0 broadcasts, 0 multicasts, 0 pauses
Input (normal): 0 packets, 0 bytes
0 unicasts, 0 broadcasts, 0 multicasts, 0 pauses
Input: 0 input errors, 0 runts, 0 giants, - throttles
0 CRC, 0 frame, 0 overruns, 0 aborts
0 ignored, - parity errors
Output (total): 0 packets, 0 bytes
0 unicasts, 0 broadcasts, 0 multicasts, 0 pauses
Output (normal): 0 packets, 0 bytes
0 unicasts, 0 broadcasts, 0 multicasts, 0 pauses
Output: 0 output errors, 0 underruns, - buffer failures
0 aborts, 0 deferred, 0 collisions, 0 late collisions
0 lost carrier, 0 no carrier
Fields for incoming error packets
· input errors—Total number of incoming error packets.
· runts—Number of incoming frames that meet the following conditions:
¡ Shorter than 64 bytes.
¡ In correct format.
¡ Containing valid CRCs.
· giants—Number of incoming giants. Giants refer to frames larger than the maximum frame length supported on the interface. For an Ethernet interface that does not permit jumbo frames, the maximum frame length is 1518 bytes (without VLAN tags) or 1522 bytes (with VLAN tags). For an Ethernet interface that permits jumbo frames, the maximum Ethernet frame length is set when you configure jumbo frame support on the interface.
· throttles—Number of incoming frames that had a non-integer number of bytes.
· CRC—Total number of incoming frames that had a normal length but contained CRC errors.
· frame—Total number of incoming frames that contained CRC errors and a non-integer number of bytes.
· overruns—Number of packets dropped because the input rate of the port exceeded the queuing capability.
· aborts—Total number of illegal incoming packets, including fragment frames, jabber frames, symbol error frames, unknown operation code frames, and length error frames.
· ignored—Number of incoming frames dropped because the receiving buffer of the port ran low.
· parity errors—Total number of frames with parity errors.
Fields for outgoing error packets
· output errors—Total number of outgoing packets with errors.
· underruns—Number of packets dropped because the output rate of the interface exceeded the output queuing capability. This is a low-probability hardware anomaly.
· buffer failures—Number of packets dropped because the transmitting buffer of the interface ran low.
· aborts—Number of packets that failed to be transmitted. Transmission of these packets had started, but failed because of various reasons (for example, collision).
· deferred—Number of frames that the interface deferred to transmit because of detected collisions.
· collisions—Number of frames that the interface stopped transmitting because collisions were detected during transmission.
· late collisions—Number of frames that the interface deferred to transmit after transmitting their first 512 bits because of detected collisions.
· lost carrier—Number of carrier losses during transmission. This counter increases by one when a carrier is lost, and applies to serial WAN interfaces.
· no carrier—Number of times that the port failed to detect the carrier when attempting to send frames. This counter increases by one when a port failed to detect the carrier, and applies to serial WAN interfaces.
Solution
To resolve the issue, choose one of the following solutions depending on the symptom:
· Solution for increasing CRC, frame, and throttles errors in the inbound direction
· Solution for increasing giants in the inbound direction
· Solution for increasing error packets in the outbound direction
Solution for increasing CRC, frame, and throttles errors in the inbound direction
1. Test the link performance. If the link is of poor quality or optical signals are attenuated greatly, replace the cable or optical fiber.
2. If the interface is installed with a transceiver module, identify whether the issue is caused by a transceiver module failure as described in "Transceiver module failure."
3. Swap the cable, optical fiber, or transceiver module with that of an interface that is operating correctly, and then swap it over.
¡ If the issue remains the same on the original interface but does not occur on the new interface, the original interface might be the failure cause. Use an interface that can operate correctly to provide services, and send the failure information to H3C Support for analysis.
¡ If the issue does not occur on the original interface but occurs on the new interface, verify that the peer device and the intermediate devices and links are operating correctly.
4. If the issue persists, contact H3C Support.
Solution for increasing giants in the inbound direction
1. Examine the following settings of the jumboframe enable command for the interfaces on two ends:
¡ Verify that the jumbo feature is enabled on both interfaces.
¡ Verify that the default settings for the command are the same.
¡ Verify that the current settings for the command are the same.
2. If the issue persists, contact H3C Support.
Solution for increasing error packets in the outbound direction
1. Verify that the interface is operating in full duplex mode.
2. If the issue persists, contact H3C Support.
Interface fails to come up
Symptom
An interface fails to come up.
Solution
To resolve the issue:
1. Verify that the cables or optical fibers connected to the interface and its peer interface are connected correctly and securely.
2. If the issue persists, swap the cables or optical fibers for cables or optical fibers that can correctly operate to verify that the intermediate link is operating correctly.
3. Examine the settings of the interfaces, including up/down state, duplex mode, speed, autonegotiation mode, and MDI. Verify that the interfaces are configured correctly.
Table 4 Support for duplex modes
|
Speed Duplex |
10G |
1000M |
100M |
10M |
|
Full |
Not supported |
Supported |
Supported |
Supported |
|
Half |
Not supported |
Not supported |
Supported |
Supported |
4. If the interfaces are installed with transceiver modules, verify that the transceiver modules are the same type (including the speed, wavelength, single-mode, and multiple-mode).
5. If the issue persists, swap the suspected transceiver module for a transceiver module that can operate correctly. Identify whether the issue is caused by a transceiver module failure as described in "Transceiver module failure."
<H3C> display transceiver interface GigabitEthernet 1/0/17
GigabitEthernet1/0/17 transceiver information:
Transceiver Type : 1000_BASE_SX_SFP
Connector Type : LC
Wavelength(nm) : 850
Transfer Distance(m) : 550(OM2),270(OM1)
Digital Diagnostic Monitoring : YES
Vendor Name : JDSU
6. If a transceiver module failed, replace the transceiver module and contact H3C Support.
An interface goes down
Symptom
An interface goes down.
Solution
To resolve the issue:
1. Read the log messages for the local and peer devices. Identify whether the interfaces were manually shut down.
2. Display interface status information. Identify whether an interface has protocol issues or was shut down by the diagnostic module because of errors. If yes, contact H3C Support.
<H3C> display interface GigabitEthernet 1/0/2
GigabitEthernet1/0/2
Current state: DOWN
Line protocol state: DOWN
Description: GigabitEthernet1/4/0/1 Interface
Bandwidth: 1000000kbps
Maximum Transmit Unit: 1500
Internet protocol processing: disabled
IP Packet Frame Type:PKTFMT_ETHNT_2, Hardware Address: 8042-0004-5601
IPv6 Packet Frame Type:PKTFMT_ETHNT_2, Hardware Address: 8042-0004-5601
Media type is not sure,Port hardware type is No connector
Last clearing of counters: 16:45:01 Wed 12/11/2013
Peak value of input: 0 bytes/sec, at 2013-12-11 16:45:03
Peak value of output: 0 bytes/sec, at 2013-12-11 16:45:03
Last 300 second input: 0 packets/sec 0 bytes/sec
Last 300 second output: 0 packets/sec 0 bytes/sec
3. As described in Interface fails to come up, verify that the interfaces are correctly configured and the cable, transceiver module, and optical fiber are operating correctly.
4. If the issue persists, contact H3C Support.
Interface state flapping
Symptom
An interface flaps between the up and down states.
Solution
To resolve the issue:
1. If the interface is a fiber port, verify that the transceiver modules at the two ends are operating correctly as described in "Transceiver module failure."
2. If the interface is a copper port, set the speed and duplex mode. The state flapping issue typically occurs in autonegotiation mode. Disable the autonegotiation mode, and configure the same speed and duplex mode for both of the interfaces on two ends.
3. If the issue persists, contact H3C Support.
Transceiver module failure
Symptom
A fiber port installed with a transceiver module cannot operate correctly.
Solution
To resolve the issue:
1. If the interface is a 10-GE fiber port, identify whether the fiber port is installed with a Gigabit transceiver module, which is not supported by the fiber port. If yes, replace the transceiver module with one of the supported model.
2. Execute the display transceiver alarm interface command to examine the alarms present on the transceiver module.
¡ If input errors occurred, verify that the peer port, fiber, and intermediate device are operating correctly.
¡ If output errors, current errors, or voltage errors occurred, verify that the local port is operating correctly.
<H3C> display transceiver alarm interface Ten-GigabitEthernet 1/0/25
Ten-GigabitEthernet1/0/25 transceiver current alarm information:
RX signal loss
Table 5 Transceiver module alarms
|
Field |
Description |
|
SFP/SFP+ |
|
|
RX loss of signal |
Incoming (Rx) signal is lost. |
|
RX power high |
Incoming (Rx) power is high. |
|
RX power low |
Incoming (Rx) power is low. |
|
TX fault |
Transmit fault. |
|
TX bias high |
Tx bias current is high. |
|
TX bias low |
Tx bias current is low. |
|
TX power high |
Tx power is high. |
|
TX power low |
Tx power is low. |
|
Temp high |
Temperature is high. |
|
Temp low |
Temperature is low. |
|
Voltage high |
Voltage is high. |
|
Voltage low |
Voltage is low. |
|
Transceiver info I/O error |
Transceiver information read and write error. |
|
Transceiver info checksum error |
Transceiver information checksum error. |
|
Transceiver type and port configuration mismatch |
The transceiver type does not the match port configuration. |
|
Transceiver type not supported by port hardware |
The port does not support the transceiver type. |
|
XFP |
|
|
RX loss of signal |
Incoming (Rx) signal is lost. |
|
RX not ready |
The receiver is not ready. |
|
RX CDR loss of lock |
Rx clock cannot be recovered. |
|
RX power high |
Rx power is high. |
|
RX power low |
Rx power is low. |
|
TX not ready |
Tx is not ready. |
|
TX fault |
Tx fault. |
|
TX CDR loss of lock |
Tx clock cannot be recovered. |
|
TX bias high |
Tx bias current is high. |
|
TX bias low |
Tx bias current is low. |
|
TX power high |
Tx power is high. |
|
TX power low |
Tx power is low. |
|
Module not ready |
Module is not ready. |
|
APD supply fault |
APD supply fault. |
|
TEC fault |
TEC fault. |
|
Wavelength unlocked |
Wavelength of optical signal exceeds the manufacturer's tolerance. |
|
Temp high |
Temperature is high. |
|
Temp low |
Temperature is low. |
|
Voltage high |
Voltage is high. |
|
Voltage low |
Voltage is low. |
|
Transceiver info I/O error |
Transceiver information read and write error. |
|
Transceiver info checksum error |
Transceiver information checksum error. |
|
Transceiver type and port configuration mismatch |
The transceiver type does not match the port configuration. |
|
Transceiver type not supported by port hardware |
The transceiver type is not supported on the port. |
3. Swap the suspected transceiver module and a transceiver module that can correctly operate, and swap the interfaces.
4. If you are sure that the transceiver module fails, execute the display transceiver diagnosis command to collect the current values of the digital diagnosis parameters on the transceiver module and send them to H3C Support. The display transceiver diagnosis command applies to H3C transceiver modules and might not be able to display information about non-H3C transceiver modules.
<H3C>display transceiver diagnosis interface GigabitEthernet 1/0/17
GigabitEthernet1/0/17 transceiver diagnostic information:
Current diagnostic parameters:
Temp.(°C) Voltage(V) Bias(mA) RX power(dBm) TX power(dBm)
54 3.35 5.39 -5.91 -5.29
Alarm thresholds:
Temp.(°C) Voltage(V) Bias(mA) RX power(dBm) TX power(dBm)
High 73 3.80 11.00 0.00 0.00
Low -3 2.81 1.00 -16.99 -12.52
<H3C>
5. Display the electronic label information for the transceiver module. The Vendor Name field displays H3C for an H3C transceiver module. As a best practice, use only H3C transceiver modules.
<H3C>display transceiver manuinfo interface
GigabitEthernet1/0/16 transceiver manufacture information:
The transceiver is absent.
GigabitEthernet1/0/17 transceiver manufacture information:
The transceiver does not support this function.
GigabitEthernet1/0/18 transceiver manufacture information:
The transceiver is absent.
GigabitEthernet1/0/19 transceiver manufacture information:
The transceiver is absent.
GigabitEthernet1/0/20 transceiver manufacture information:
The transceiver is absent.
GigabitEthernet1/0/21 transceiver manufacture information:
The transceiver is absent.
GigabitEthernet1/0/22 transceiver manufacture information:
The transceiver is absent.
GigabitEthernet1/0/23 transceiver manufacture information:
The transceiver is absent.
GigabitEthernet2/0/16 transceiver manufacture information:
The transceiver is absent.
GigabitEthernet2/0/17 transceiver manufacture information:
The transceiver does not support this function.
GigabitEthernet2/0/18 transceiver manufacture information:
The transceiver is absent.
GigabitEthernet2/0/19 transceiver manufacture information:
The transceiver is absent.
GigabitEthernet2/0/20 transceiver manufacture information:
The transceiver is absent.
GigabitEthernet2/0/21 transceiver manufacture information:
The transceiver is absent.
GigabitEthernet2/0/22 transceiver manufacture information:
The transceiver is absent.
GigabitEthernet2/0/23 transceiver manufacture information:
The transceiver is absent.
6. If the issue persists, contact H3C Support.
Related commands
This section lists the commands that you might use for troubleshooting interfaces.
|
Command |
Description |
|
display current-configuration |
Displays the running configuration. You can display the running configuration for a specific interface. |
|
display interface |
Displays interface information, including the interface status and the incoming and outgoing traffic statistics. |
|
Displays transceiver alarms. |
|
|
display transceiver diagnosis |
Displays the current values of the digital diagnosis parameters on transceiver modules, including the temperature, voltage, bias current, incoming power, and outgoing power. |
|
display transceiver interface |
Displays the key parameters of transceiver modules. |
|
display transceiver manuinfo |
Displays electronic label information for transceiver modules to identify the vendors of the transceiver modules. |
Troubleshooting packet forwarding failures
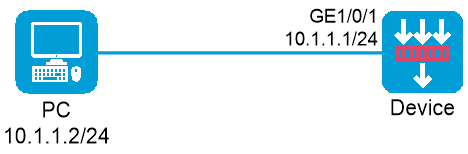
Device ping failure from a directly connected PC
Symptom
The PC is connected to a service interface of the device through a network cable and is in the same subnet as the device. However, you cannot successfully ping the device from the PC.
Figure 2 Network diagram
Solution
To resolve the issue:
1. Log in to the Web interface of the device.
2. Access the Network > Security Zones page.
3. Click the Edit icon for the target security zone.
4. Add the interface that connects the device to the PC as a member interface.
5. Click OK.
6. Access the Policies > Security Policies page.
7. On the Security Policies tab, click Create, and then click Create a policy.
8. Configure policy parameters as needed:
¡ Source zone—Select the zone to which the interface belongs as the source zone. In this example, the source zone is Trust.
¡ Name—Specify the policy name. In this example, the name is trust-local.
¡ Destination zone—Select Local as the destination zone.
¡ Action—Select Permit as the action.
¡ Source IPv4 address—Specify the IP address of the PC as the source IP. In this example, the address is 10.1.1.2.
¡ Destination IPv4 address—Specify the IP address of the device as the destination IP. In this example, the address is 10.1.1.1.
For the device to access the PC, create a security policy to permit packets from the device to the PC.
¡ Name—Specify the policy name. In this example, the name is local-trust.
¡ Source zone—Select Local as the source zone.
¡ Destination zone—Select the zone to which the interface belongs as the destination zone. In this example, the destination zone is Trust.
¡ Action—Select Permit as the action.
¡ Source IPv4 address—Specify the IP address of the device as the source IP. In this example, the address is 10.1.1.1.
¡ Destination IPv4 address—Specify the IP address of the PC as the destination IP. In this example, the address is 10.1.1.2.
9. Click OK.
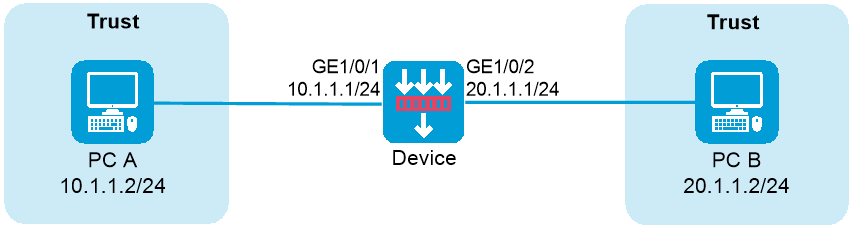
Connectivity failure between two PCs connected through the device
Symptom
Two PCs are connected through the device, and IP and route settings are configured correctly. However, the two PCs cannot reach each other.
Figure 3 Network diagram

Solution
To resolve the issue:
1. Log in to the Web interface of the device.
2. Access the Network > Security Zones page.
3. Click the Edit icon for the target security zone.
4. Add the interface that connects the device to the PC as a member interface.
5. Click OK.
6. Repeat the previous steps to add the device's interface for the other PC to another security zone.
7. Access the Policies > Security Policies page.
8. On the Security Policies tab, click Create, and then click Create a policy. Create a security policy to permit packets from PC A to PC B.
9. Configure policy parameters as needed. As a best practice, specify exact match criteria.
¡ Name—Specify the policy name. In this example, the name is trust-untrust.
¡ Source zone—Select the zone to which the interface connecting PC A belongs as the source zone. In this example, the source zone is Trust.
¡ Destination zone—Select the zone to which the interface connecting PC B belongs as the destination zone. In this example, the destination zone is Untrust.
¡ Action—Select Permit as the action.
¡ Source IPv4 address—Specify the IP address of PC A as the source IP. In this example, the address is 10.1.1.2.
¡ Destination IPv4 address—Specify the IP address of PC B as the destination IP. In this example, the address is 20.1.1.1.
10. For the device to access the PC, create a security policy to permit packets from the device to the PC.
¡ Name—Specify the policy name. In this example, the name is untrust-trust.
¡ Source zone—Select the zone to which the interface connecting PC B belongs as the source zone. In this example, the source zone is Untrust.
¡ Destination zone—Select the zone to which the interface connecting PC A belongs as the destination zone. In this example, the destination zone is Trust.
¡ Action—Select Permit as the action.
¡ Source IPv4 address—Specify the IP address of PC B as the source IP. In this example, the address is 20.1.1.2.
¡ Destination IPv4 address—Specify the IP address of PC A as the destination IP. In this example, the address is 10.1.1.1.
11. Click OK.
Connectivity failure between PCs connected through the device in the same security zone
Symptom
Two PCs are connected through the device, and IP and route settings are configured correctly. The PCs are in the same security zone but cannot reach each other.
Figure 4 Network diagram
Solution
To resolve the issue:
1. Log in to the Web interface of the device.
2. Access the Policies > Security Policies page.
3. On the Security Policies tab, click Create, and then click Create a policy.
4. Configure policy parameters as needed.
¡ Name—Specify the policy name. In this example, the name is trust-trust.
¡ Source zone—Select the zone to which the PCs belong as the source zone. In this example, the source zone is Trust.
¡ Destination zone—Select the same zone as the destination zone.
¡ Action—Select Permit as the action.
¡ Source IPv4 address—Specify the IP addresses of PC A and PC B as the source IPs. In this example, the addresses are 10.1.1.2 and 20.1.1.2 for PC A and PC B, respectively.
¡ Destination IPv4 address—Specify the IP addresses of PC B and PC A as the destination IPs. In this example, the addresses are 20.1.1.2 and 10.1.1.2 for PC B and PC A, respectively.
5. Click OK.
Ping or tracert operation failure
Symptom
The device fails to ping or trace route to a destination.
For example, all ICMP echo requests sent by device 192.168.20.14 to ping device 10.0.0.5 timed out and no replies were received.
<H3C> ping 10.0.0.5
PING 10.0.0.5 (10.0.0.5): 56 data bytes, press CTRL_C to break
Request time out
Request time out
Request time out
Request time out
Request time out
--- 10.0.0.5 ping statistics ---
5 packet(s) transmitted, 0 packet(s) received, 100.0% packet loss
Solution
To resolve the issue:
1. Execute the display security-zone command to verify that the input and output interfaces involved in packet forwarding have been added to a security zone.
<H3C>display security-zone
Name: Local
Members: None
Name: Trust
Members: GigabitEthernet1/0/8 Reth1
Name: DMZ
Members: None
Name: Untrust
Members: GigabitEthernet1/0/10 Reth2
Name: Management
Members: GigabitEthernet1/0/
2. Execute the display security-policy command to verify that security policies have been configured.
<H3C>display security-policy ip
Security-policy ip
rule 0 name 1
action pass
<H3C>display security-policy ipv6
Security-policy ipv6
rule 0 name IPv6
action pass
3. Identify the packet forwarding path and locate where the ICMP packets are lost on the path.
You can compare the ICMP packet statistics collected from the input and output interfaces of a node to identify packet loss. To clear history statistics for an interface, execute the reset counters interface command.
a. If no ICMP packets are received on the input interface, examine the adjacent upstream device for faults.
b. If the number of input ICMP packets matches the number of output ICMP packets, examine the adjacent downstream device for faults.
c. If no ICMP packets are forwarded on the output interface, proceed to the next step.
4. Execute the debugging aspf packet acl and debugging aspf event commands to identify if ICMP packet loss happens during the ASPF process. If Layer 2 ICMP packet forwarding is correct, execute the display ip statistics command to determine the cause for packet loss at Layer 3.
<H3C> display ip statistics
Input: sum 263207520 local 1772
bad protocol 0 bad format 0
bad checksum 0 bad options 0
Output: forwarding 24511617 local 476
dropped 21949 no route 156
compress fails 0
Fragment:input 0 output 0
dropped 0
fragmented 0 couldn't fragment 0
Reassembling:sum 0 timeouts 0
5. If the issue persists, contact Technical Support.
Ping operation failure across NAT
Symptom
The device fails to ping another device in a different subnet despite a successful NAT.
For example, PC1 10.1.1.1 pings PC2 220.1.1.2 across a firewall that translates PC1's IP address into 220.1.1.1. Although PC2 has received PC1's ICMP echo request, PC1 cannot receive an ICMP echo reply from PC2.
Solution
To resolve the issue:
1. Verify that the input and output interfaces of PC1 and PC2 have been added to security zones, and execute the display security-policy command to verify security policies have been configured.
<H3C> display security-policy ip
Security-policy ip
rule 0 name tom-tom1
action pass
counting enable
source-zone tom
destination-zone tom1
2. Execute the display ip routing-table command on the firewall to verify that the firewall RIB contains a route to PC1.
<H3C> display ip routing-table 10.1.1.0
If no routes to PC1 exist, examine the routing protocol configurations and verify that the protocols are operating correctly.
3. Execute the display fib command on the firewall to verify that the firewall FIB contains a route to PC1.
<H3C> display fib 10.1.1.0
If the RIB contains a route to PC1 but the FIB does not, contact Technical Support.
4. Execute the display arp command on the firewall to verify that the firewall ARP table contains an entry for the IP address of PC1 (10.1.1.1).
<H3C> display arp 10.1.1.1
5. Execute the display session command on the firewall to verify that the session is established correctly.
6. Enable security policy packet debugging on the firewall to view packet denial statistics.
If an ASPF policy is applied, you must configure detect icmp for the policy or configure security policies to permit return packets from the destination zone to the source zone. If you do not do so, the firewall denies return packets.
<H3C> debugging security-policy packet ip acl ?
INTEGER<2000-2999> Specify a basic ACL
INTEGER<3000-3999> Specify an advanced ACL
Example output for packet denial is as follows:
*Jul 21 11:00:00:838 2017 F1090-IRF FILTER/7/PACKET: -Context=1; The packet is deny. Src-Zone=tom1, Dst-Zone=tom;If-In=, If-Out=Reth11(134); Packet Info:Src-IP=220.1.1.2, Dst-IP=10.1.1.1, VPN-Instance=,Src-Port=1024, Dst-Port=1025, Protocol= UDP(17), ACL=none, Rule-ID=0.
7. If the issue persists, contact Technical Support.
Packet loss
Symptom
Packet loss occurs during packet forwarding.
Solution
To resolve the issue:
1. Execute the debugging security-policy packet command and determine if the packet loss is caused by incorrect security policy configurations.
<H3C>*Jan 13 16:06:32:298 2020 8350-2 FILTER/7/PACKET: -Context=1; The packet is denied. Src-Zone=Untrust, Dst-Zone=Trust;If-In=GigabitEthernet1/0/14(17), If-Out=GigabitEthernet1/0/10(13); Packet Info:Src-IP=10.1.1.3, Dst-IP=100.1.1.3, VPN-Instance=, Src-MacAddr=3897-d6a9-1e58,Src-Port=1024, Dst-Port=1024, Protocol=TCP(6), Application=general_tcp(2086),Terminal=invalid(0), SecurityPolicy=r0, Rule-ID=0.
If the output from the command contains The packet is denied, the packet loss is caused by incorrect security policy configurations.
2. Execute the debugging ip packet command to view information about lost packets.
Table 6 Command output description
|
Field |
Description |
|
Send the packet. |
|
|
Receive the packet. |
|
|
Deliver IP packets to the upper layer. |
|
|
Interface that received or sent the packet. |
|
|
IP version of the packet. |
|
|
Header length of the packet. |
|
|
Service type of the packet. |
|
|
Total length of the packet. |
|
|
ID of the packet. |
|
|
Fragmentation offset of the packet. |
|
|
Time to live of the packet. |
|
|
Protocol field of the packet. |
|
|
Header checksum of the packet. |
|
|
Source address of the packet. |
|
|
Destination address of the packet. |
|
|
Sending the packet from local at interface-type interface-number |
Send the packet from the local interface. |
|
Receiving IP packet from interface-type interface-number |
Receive the packet from the interface. |
|
Deliver the received packet to the upper layer. |
3. Execute the debugging ip error and debug ip info acl commands to determine the cause for packet loss.
Table 7 Possible causes for packet loss
|
Field |
Description |
|
The number of reassembly queues has exceeded the limit. |
|
|
The number of segments in the reassembly queue has exceeded the limit. |
|
|
Reassembly fails. |
|
|
Fail to obtain the forwarding control block. |
|
|
Release MBUF! Phase Num is num, Service ID is id, Bitmap is %#lx! |
MBUF is released. The num, id, and %#lx arguments represent the phase number, service ID, and bitmap, respectively. |
|
Forwarding of broadcast packets to the output interface subnet is not allowed. |
|
|
Error output interface is assigned. |
4. If the issue persists, contact Technical Support.
Related commands
|
Command |
Description |
|
display arp |
Displays ARP entries. |
|
display current-configuration | include lsr-id |
Displays the current MPLS LSR ID. |
|
display fib |
Displays FIB entries. |
|
display interface |
Displays interface information. |
|
display ip interface brief |
Displays brief IP configuration for Layer 3 interfaces. |
|
display ip routing-table |
Displays routing table information. |
|
display session |
Displays session information. |
|
display this |
Displays the running configuration in the current view. |
|
interface |
Enters interface view. |
|
display nat outbound |
Displays information about outbound dynamic NAT. |
Troubleshooting IRF
IRF fabric establishment failure
Symptom
An IRF fabric cannot be established.
Solution
To resolve the issue:
1. Verify that the number of member devices does not exceed two.
2. Execute the display version and display system internal version commands to verify that the member devices are the same model and run the same software version.
¡ If the models are different, use the same model of devices.
¡ If the software versions are different, upgrade the software to the same version.
<H3C> display version
H3C Comware Software, Version 7.1.064, Ess 8601P08
Copyright (c) 2004-2019 New H3C Technologies Co., Ltd. All rights reserved.
H3C SecPath F1090 uptime is 0 weeks, 0 days, 0 hours, 5 minutes
Last reboot reason: User reboot
Boot image: flash:/F1090FW-CMW710-BOOT-E8601P08.bin
Boot image version: 7.1.064, Ess 8601P08
Compiled Sep 10 2019 15:00:00
System image: flash:/F1090FW-CMW710-SYSTEM-E8601P08.bin
System image version: 7.1.064, Ess 8601P08
Compiled Sep 10 2019 15:00:00
SLOT 1
CPU type: Multi-core CPU
DDR4 SDRAM Memory: 8192M bytes
FLASH: 7296M bytes
CPLD_A Version: 1.0
CPLD_B Version: 1.0
Release Version:SecPath F1090-8601P08
Basic BootWare Version:0.30
Extend BootWare Version:1.01
BuckleBoard Version:Ver.A
BackBoard1 Version:Ver.A
BackBoard2 Version:Ver.A
HD_BackBoard Version:Ver.D
Pcb Version:Ver.A
[SUBCARD 0] NSQ1F1MSPUOTXA(Hardware)Ver.A, (Driver)1.0, (Cpld)1.0
Boot Type: Warm
[H3C] display system internal version
H3C SecPath F1090 V800R006B01D645SP08
Comware V700R001B64D045SP08
3. Verify that the member ID of each member device is unique:
a. Execute the display irf command to view the member ID of each member device.
<H3C> display irf
MemberID Role Priority CPU-Mac Description
*+1 Master 1 00ff-fbec-b003 ---
--------------------------------------------------
* indicates the device is the master.
+ indicates the device through which the user logs in.
The bridge MAC of the IRF is: 00ff-fbec-b001
Auto upgrade : yes
Mac persistent : 6 min
Domain ID : 0
b. If the member IDs are not unique, execute the irf member renumber command to change the member ID of one member device.
4. Verify that the physical interfaces bound to IRF ports can act as IRF physical interfaces. For more information, see IRF configuration in the configuration guides.
5. Verify that the IRF port bindings and physical IRF link connections are correct:
|
|
IMPORTANT: When you connect two neighboring IRF members, you must connect the physical interfaces of IRF-port 1 on one member to the physical interfaces of IRF-port 2 on the other. |
a. Execute the display irf configuration command on each member device, and check the IRF-Port1 and IRF-Port2 fields for IRF port bindings.
b. Verify that the physical IRF connections are consistent with the IRF port bindings.
c. If there are binding errors or connection inconsistencies, reconfigure the IRF port bindings or reconnect the IRF physical interfaces.
6. Verify that a minimum of one IRF physical link is up:
a. Execute the display interface command to verify that the IRF physical interfaces are up.
<H3C> display interface gigabitethernet 1/0/10
GigabitEthernet1/0/10
Current state: UP
Line protocol state: UP
Description: GigabitEthernet1/0/10 Interface
Bandwidth: 1000000kbps
Maximum Transmit Unit: 1500
Internet protocol processing: disabled
IP Packet Frame Type:PKTFMT_ETHNT_2, Hardware Address: 8042-0000-560a
IPv6 Packet Frame Type:PKTFMT_ETHNT_2, Hardware Address: 8042-0000-560a
Media type is twisted pair
Port hardware type is 1000_BASE_T
Last clearing of counters: Never
Peak value of input: 0 bytes/sec, at 2013-12-13 15:15:02
Peak value of output: 0 bytes/sec, at 2013-12-13 15:15:02
Last 300 seconds input: 0 packets/sec 0 bytes/sec
Last 300 seconds output: 0 packets/sec 0 bytes/sec
b. If no IRF physical links are up, locate the issue and bring up a minimum of one IRF physical link. An IRF physical link comes up when the IRF physical interfaces at both ends of the link come up. To bring up an interface, see "Interface fails to come up."
7. If the issue persists, contact H3C Support.
IRF split
Symptom
An IRF fabric splits.
Solution
To resolve the issue:
1. Search the log messages for the IRF port down event. This event helps you determine the time when the IRF fabric split.
%Jun 26 10:13:46:233 2013 H3C STM/2/STM_LINK_STATUS_TIMEOUT: IRF port 1 is down because heartbeat timed out.
%Jun 26 10:13:46:436 2013 H3C STM/3/STM_LINK_STATUS_DOWN: -MDC=1; IRF port 2 is down.
2. Verify that the IRF physical interfaces are operating correctly.
a. Execute the display interface command to identify the state of the IRF physical interfaces. If an IRF physical interface is not up or has other issues, locate and resolve the issue as described in "Troubleshooting interfaces."
<H3C> display interface gigabitethernet 1/0/10
GigabitEthernet1/0/10 current state: UP
Line protocol current state: UP
IP Packet Frame Type: PKTFMT_ETHNT_2, Hardware Address: 0000-e80d-c000
Description: GigabitEthernet2/6/0/1 Interface
Loopback is not set
Media type is optical fiber, Port hardware type is 1000_BASE_SX_SFP
...
b. If the issue persists, remove faulty IRF physical interfaces from the IRF ports and bind new IRF physical interfaces to the IRF ports.
3. Remove hardware issues that might cause recurring IRF split events:
a. Execute the display version command to identify the uptime of IRF member devices and cards (if any) that have IRF links.
b. Compare the uptime of IRF member devices and cards (if any) to determine whether a member device or card had rebooted before the IRF split.
c. If the IRF split is caused by a device or card (if any) reboot or power failure, locate and resolve the issue as described in "Troubleshooting hardware."
4. If the IRF split issue persists, collect device diagnostic information, and then send the information to H3C Support.
Related commands
|
Command |
Description |
|
display interface |
Displays interface information. Use this command to identify whether an IRF physical interface is up. |
|
display irf |
Displays IRF fabric information, including the member ID, role, priority, bridge MAC address, and description of each IRF member. |
|
display irf configuration |
Displays basic IRF settings, including the current member ID, new member ID, and physical interfaces bound to the IRF ports on each IRF member device. The new member IDs take effect at reboot. Use this command to identify whether the physical interfaces of IRF-port 1 on one member are connected to the physical interfaces of IRF-port 2 on the other member. |
|
display version display system internal version |
Displays system version information. Use this command to identify whether the member devices are the same model and run the same software version. |
Troubleshooting RBM
RBM system setup failure
Symptom
Two devices cannot form an RBM system.
Solution
To resolve the issue:
1. Execute the display version command to verify that the member devices of the RBM system are the same model.
<H3C>display version
H3C Comware Software, Version 7.1.064, Feature 8660P08
Copyright (c) 2004-2021 New H3C Technologies Co., Ltd. All rights reserved.
H3C SecPath F1000-AI-60 uptime is 0 weeks, 1 day, 17 hours, 11 minutes
Last reboot reason: User reboot
Boot image: flash:/F1090FW-CMW710-BOOT-F8660P08.bin
Boot image version: 7.1.064, Feature 8660P08
Compiled Jan 18 2021 15:00:00
System image: flash:/F1090FW-CMW710-SYSTEM-F8660P08.bin
System image version: 7.1.064, Feature 8660P08
Compiled Jan 18 2021 15:00:00
Feature image(s) list:
flash:/F1090FW-CMW710-DEVKIT-F8660P08.bin, version: 7.1.064
Compiled Jan 18 2021 15:00:00
flash:/F1090FW-CMW710-SECESCAN-F8660P08.bin, version: 7.1.064
Compiled Jan 18 2021 15:00:00
SLOT 1
CPU type: Multi-core CPU
DDR4 SDRAM Memory: 8192M bytes
FLASH: 7296M bytes
CPLD_A Version: 1.0
CPLD_B Version: 2.0
Release Version:SecPath F1000-AI-60-8660P08
Basic BootWare Version:1.07
Extend BootWare Version:1.07
BuckleBoard Version:Ver.A
BackBoard1 Version:Ver.A
BackBoard2 Version:Ver.D
HD_BackBoard Version:Ver.A
Pcb Version:Ver.B
[SUBCARD 0] NSQ1F1MSPUOTXA(Hardware)Ver.B, (Driver)1.0, (Cpld)1.0
[SUBCARD 2] NSQM1TG4FBA(Hardware)Ver.B, (Driver)1.0, (Cpld)1.0
Boot Type: Warm
2. Verify that the RBM system has only two member devices.
3. Execute the display irf command to verify that the member devices use unique IRF member IDs. If the member devices use the same IRF member ID, use the irf member command to modify the IRF member ID for one of the member devices.
<H3C>display irf
MemberID Role Priority CPU-Mac Description
*+1 Master 1 80e4-55d8-54ae ---
--------------------------------------------------
* indicates the device is the master.
+ indicates the device through which the user logs in.
The bridge MAC of the IRF is: 80e4-55d8-54ac
Auto upgrade : yes
Mac persistent : 6 min
Domain ID : 0
4. Execute the display interface brief command to verify that the RBM data and control channel settings are consistent on the member devices.
5. Verify that the member devices use the same software version.
<H3C>display version
H3C Comware Software, Version 7.1.064, Feature 8660P08
Copyright (c) 2004-2021 New H3C Technologies Co., Ltd. All rights reserved.
H3C SecPath F1000-AI-60 uptime is 0 weeks, 1 day, 17 hours, 11 minutes
Last reboot reason: User reboot
Boot image: flash:/F1090FW-CMW710-BOOT-F8660P08.bin
Boot image version: 7.1.064, Feature 8660P08
Compiled Jan 18 2021 15:00:00
System image: flash:/F1090FW-CMW710-SYSTEM-F8660P08.bin
System image version: 7.1.064, Feature 8660P08
Compiled Jan 18 2021 15:00:00
Feature image(s) list:
flash:/F1090FW-CMW710-DEVKIT-F8660P08.bin, version: 7.1.064
Compiled Jan 18 2021 15:00:00
flash:/F1090FW-CMW710-SECESCAN-F8660P08.bin, version: 7.1.064
Compiled Jan 18 2021 15:00:00
SLOT 1
CPU type: Multi-core CPU
DDR4 SDRAM Memory: 8192M bytes
FLASH: 7296M bytes
CPLD_A Version: 1.0
CPLD_B Version: 2.0
Release Version:SecPath F1000-AI-60-8660P08
Basic BootWare Version:1.07
Extend BootWare Version:1.07
BuckleBoard Version:Ver.A
BackBoard1 Version:Ver.A
BackBoard2 Version:Ver.D
HD_BackBoard Version:Ver.A
Pcb Version:Ver.B
[SUBCARD 0] NSQ1F1MSPUOTXA(Hardware)Ver.B, (Driver)1.0, (Cpld)1.0
[SUBCARD 2] NSQM1TG4FBA(Hardware)Ver.B, (Driver)1.0, (Cpld)1.0
Boot Type: Warm
[H3C-probe]dis system internal version
H3C SecPath F1000-AI-60 V800R006B01D660SP08
Comware V700R001B64D060SP08
6. Verify that the interfaces used to set up the RBM control and data channels are up. If an interface is down, troubleshoot the interface as described in "Interface fails to come up."
<H3C>display interface GigabitEthernet 1/0/1
GigabitEthernet1/0/1
Current state: UP
Line protocol state: UP
Description: GigabitEthernet1/0/1 Interface
Bandwidth: 1000000 kbps
Maximum transmission unit: 1500
Allow jumbo frames to pass
Broadcast max-ratio: 100%
Multicast max-ratio: 100%
Unicast max-ratio: 100%
Internet protocol processing: Disabled
IP packet frame type: Ethernet II, hardware address: 80e4-55d8-54b3
IPv6 packet frame type: Ethernet II, hardware address: 80e4-55d8-54b3
Media type is twisted pair, loopback not set, promiscuous mode not set
1000Mb/s, Full-duplex, link type is autonegotiation
Output flow-control is disabled, input flow-control is disabled
Last link flapping: 1 days 17 hours 29 minutes
Last clearing of counters: Never
Current system time:2021-02-01 08:42:30 Beijing+08:00:00
Last time when physical state changed to up:2021-01-30 15:12:46 Beijing+08:00:00
Last time when physical state changed to down:2021-01-30 15:12:08 Beijing+08:00:00
Peak input rate: 8499998 bytes/sec, at 2021-01-30 15:18:39
Peak output rate: 5172061 bytes/sec, at 2021-01-30 15:12:53
Last 300 second input: 0 packets/sec 22 bytes/sec 0%
Last 300 second output: 0 packets/sec 25 bytes/sec 0%
7. Verify that the member devices use the same destination port to set up the RBM control channel and the RBM control channel is up.
RBM_P[F1090]display remote-backup-group status
Remote backup group information:
Backup mode: Dual-active
Device role: Primary
Data channel interface: Route-Aggregation64
Local IPv6: 100::1
Remote IPv6: 100::2 Destination port: 60064
Control channel status: Connected
Hot backup status:Enabled
Auto configuration synchronization: Enable
Configuration consistency check interval: 1 hour
Delay-time: 1 min
RBM system split
Symptom
An RBM system splits unexpectedly.
Solution
To resolve the issue:
1. Check log messages for the RBM system split time, which is the time when the interfaces used by RBM went down.
RBM_P<F1010-VRRP-ZHU-1>%Feb 1 07:57:49:310 2021 F1010-VRRP-ZHU-1 LLDP/6/LLDP_DELETE_NEIGHBOR: Nearest bridge agent neighbor deleted
on port GigabitEthernet1/0/7 (IfIndex 8), neighbor's chassis ID is d461-fe39-d20c, port ID is GigabitEthernet1/0/7.
%Feb 1 07:57:50:487 2021 F1010-VRRP-ZHU-1 IFNET/3/PHY_UPDOWN: Physical state on the interface GigabitEthernet1/0/7 changed to down.
%Feb 1 07:57:50:487 2021 F1010-VRRP-ZHU-1 IFNET/5/LINK_UPDOWN: Line protocol state on the interface GigabitEthernet1/0/7 changed to
down.
%Feb 1 07:58:00:269 2021 F1010-VRRP-ZHU-1 RBM/6/RBM_CHANNEL: Local IPv6=202::1, remote IPv6=202::2, status=Disconnected
2. Verify that the physical interfaces used by RBM are operating correctly. If an interface is abnormal, troubleshoot it as described in "Troubleshooting interfaces."
3. Check interface information for the cause of DR system split.
RBM_P<F1010-VRRP-ZHU-1>display interface GigabitEthernet 1/0/7
GigabitEthernet1/0/7
Current state: UP
Line protocol state: UP
Description: link-f1010-bei
Bandwidth: 1000000 kbps
Maximum transmission unit: 1500
Allow jumbo frames to pass
Broadcast max-ratio: 100%
Multicast max-ratio: 100%
Unicast max-ratio: 100%
Internet address: 202.1.1.1/24 (Primary)
IP packet frame type: Ethernet II, hardware address: e8f7-24d9-2875
IPv6 packet frame type: Ethernet II, hardware address: e8f7-24d9-2875
Media type is twisted pair, loopback not set, promiscuous mode not set
1000Mb/s, Full-duplex, link type is autonegotiation
Output flow-control is disabled, input flow-control is disabled
Output queue - Urgent queuing: Size/Length/Discards 0/1024/0
Output queue - Protocol queuing: Size/Length/Discards 0/500/0
Output queue - FIFO queuing: Size/Length/Discards 0/75/0
Last link flapping: 0 hours 0 minutes 19 seconds
Last clearing of counters: Never
Current system time:2021-02-01 08:00:09
Last time when physical state changed to up:2021-02-01 07:59:51
Last time when physical state changed to down:2021-02-01 07:57:50
Peak input rate: 1694290 bytes/sec, at 2021-01-30 14:35:26
Peak output rate: 6245465 bytes/sec, at 2021-01-30 14:40:01
Last 300 second input: 1 packets/sec 132 bytes/sec 0%
Last 300 second output: 1 packets/sec 132 bytes/sec 0%
Input (total): 2404856 packets, 808021430 bytes
4. Check the device uptime and log messages for device reboot records or reboot records for the interface modules that provide interfaces for setting up the RBM control channel. If an interface module or a member device reboots when the DR system splits, check for power supply faults.
5. Replace failed transceiver modules or the interfaces used for setting up the RBM control channel to verify that the member devices can form an RBM system again.
6. If the issue persists, collect information about the member devices and contact H3C Support.
Troubleshooting hot backup
A Reth interface is not pingable if not assigned to redundancy group
Symptom
A device cannot ping a directly connected Reth interface when the Reth interface is not in any redundancy group.
Solution
To resolve the issue:
1. Verify that the member interfaces of the Reth interface can correctly receive and send packets:
a. Execute the debugging ethernet packet command to debug packet transmission on the Reth interface and remove errors based on the command output.
debugging ethernet packet interface Reth 1
b. Execute the debugging arp error command to debug ARP learning and remove errors based on the command output.
debugging arp error
c. Execute the debugging ip error command to debug IP forwarding and remove errors based on the command output.
debugging ip error
d. Execute the display ethernet statistics command on both member devices of the hot backup system and identify whether the number of error packets increases with the number of packets transmitted.
[H3C] display ethernet statistics slot 1
ETH receive packet statistics:
Totalnum : 1000888 ETHIINum : 1000888
SNAPNum : 0 RAWNum : 0
LLCNum : 0 UnknownNum : 0
ForwardNum : 884856 ARP : 0
MPLS : 0 ISIS : 0
ISIS2 : 0 IP : 0
IPV6 : 0
ETH receive error statistics:
NullPoint : 0 ErrIfindex : 3
ErrIfcb : 0 IfShut : 5
ErrAnalyse : 0 ErrSrcMAC : 0
ErrHdrLen : 0
ETH send packet statistics:
L3OutNum : 325126 VLANOutNum : 0
FastOutNum : 92115615 L2OutNum : 0
ETH send error statistics:
MbufRelayNum : 0 NullMbuf : 0
ErrAdjFwd : 0 ErrPrepend : 0
ErrHdrLen : 0 ErrPad : 0
ErrQosTrs : 0 ErrVLANTrs : 0
ErrEncap : 287 ErrTagVLAN : 0
IfShut : 0 IfErr : 0
2. If the Reth interface cannot receive or send packets, verify that it is correctly configured:
a. Execute the display reth interface command and check the Physical status and Forwarding status fields.
<H3C>display reth interface Reth 1
Reth1 :
Redundancy group : fqs
Member Physical status Forwarding status Presence status
GE1/1/1.500 UP Active Normal
GE2/0/1.500 UP Inactive Normal
b. If both member interfaces of the Reth interface are inactive or down, locate the cause and resolve it.
c. If the member interfaces are operating correctly, check whether they have correct ARP entries. If the member interfaces are subinterfaces, the ARP entries must contain correct VLAN IDs.
d. Restart the Reth interface to verify that the ARP entries can be refreshed correctly.
e. Check the packet statistics about the physical member interfaces to verify that the driver correctly sends packets to the CPU.
3. If the issue persists, contact H3C Support.
Troubleshooting policy NAT
Failure to access the external network from internal users
Symptom
PC A in the internal network cannot access PC B in the external network through the gateway device.
Figure 5 Network diagram

Solution (security policy)
To resolve the issue:
1. Log in to the Web interface of the device.
2. Access the Policies > Security Policies > Security Policies page.
3. Click Create and then click Create a policy.
4. Configure policy parameters as needed:
¡ Name—Specify the policy name. In this example, the name is secpolicy1.
¡ Source zone—Select the zone to which the interface connected to PC A belongs as the source zone. In this example, the source zone is Trust.
¡ Destination zone—Select the zone to which the interface connected to PC B belongs as the destination zone. In this example, the destination zone is Untrust.
¡ Action—Select Permit as the action.
¡ Source IPv4 address—Specify the IP address of PC A as the source IP. In this example, the address is 192.168.1.1.
¡ Destination IPv4 address—Specify the IP address of PC B as the destination IP. In this example, the address is 10.0.0.2.
5. Click OK.
Solution (policy-based NAT)
To resolve the issue:
1. Log in to the Web interface of the device.
2. Access the Policies > NAT > NAT Policy page.
3. Click Create.
4. Configure policy parameters as needed:
¡ Rule name—Specify the rule name. In this example, the name is policy1.
¡ Change Mode—Select source address translation as the change mode.
¡ Source zone—Select the zone to which the interface connected to PC A belongs as the source zone. In this example, the source zone is Trust.
¡ Destination zone—Select the zone to which the interface connected to PC B belongs as the destination zone. In this example, the destination zone is Untrust.
¡ Source IPv4 address—Specify the IP address of PC A as the source IP. In this example, the address is 192.168.1.1.
¡ Destination IPv4 address—Specify the IP address of PC B as the destination IP. In this example, the address is 10.0.0.2.
¡ Translation method—Select Dynamic IP+port as the translation method.
¡ Address—Select a NAT address type for source address translation. In this example, the address type is NAT address group.
¡ Source address after NAT—Select a public NAT address group for source address translation.
5. Click OK.
Source address translation failure
Symptom
Two PCs are connected through the device configured with source address translation. However, PC A in the internal network cannot access PC B in the external network.
Figure 6 Network diagram

Solution (security policy)
To resolve the issue:
1. Log in to the Web interface of the device.
2. Access the Policies > Security Policies > Security Policies page.
3. Click Create and then click Create a policy.
4. Configure policy parameters as needed:
¡ Name—Specify the policy name. In this example, the name is secpolicy2.
¡ Source zone—Select the zone to which the interface connected to PC A belongs as the source zone. In this example, the source zone is Trust.
¡ Destination zone—Select the zone to which the interface connected to PC B belongs as the destination zone. In this example, the destination zone is Untrust.
¡ Action—Select Permit as the action.
¡ Source IPv4 address—Specify the IP address of PC A as the source IP. In this example, the address is 192.168.1.1.
¡ Destination IPv4 address—Specify the IP address of PC B as the destination IP. In this example, the address is 10.0.0.2.
5. Click OK.
Solution (policy-based NAT)
To resolve the issue:
1. Log in to the Web interface of the device.
2. Access the Policies > NAT > NAT Policy page.
3. Click the Edit icon to modify the source address translation rule.
4. In the Modify NAT policy dialog box that opens, check if addresses of the following parameters are within the 10.0.0.1/24 network:
¡ Source IP addresses after NAT.
¡ Network addresses for address translation.
¡ Address objects in the address group for address translation.
¡ Addresses in the NAT Address group for address translation.
5. If any, modify related configurations to verify return packets can be transmitted to interface GE 1/0/2 on the device.
6. Click OK.
Destination address translation failure
Symptom
Two PCs are connected through the device configured with destination address translation. However, PC B in the external network cannot access PC A in the internal network.
Figure 7 Network diagram

Solution (security policy)
To resolve the issue:
1. Log in to the Web interface of the device.
2. Access the Policies > Security Policies > Security Policies page.
3. Click Create and then click Create a policy.
4. Configure policy parameters as needed:
¡ Name—Specify the policy name. In this example, the name is secpolicy3.
¡ Source zone—Select the zone to which the interface connected to PC B belongs as the source zone. In this example, the source zone is Untrust.
¡ Destination zone—Select the zone to which the interface connected to PC A belongs as the destination zone. In this example, the destination zone is Trust.
¡ Action—Select Permit as the action.
¡ Source IPv4 address—Specify the IP address of PC B as the source IP. In this example, the address is 10.0.0.2.
¡ Destination IPv4 address—Specify the IP address of PC A as the destination IP. In this example, the address is 192.168.1.1.
5. Click OK.
Solution (policy-based NAT)
To resolve the issue:
1. Log in to the Web interface of the device.
2. Access the Policies > NAT > NAT Policy page.
3. Click the Edit icon.
4. Modify the destination address translation rule.
5. Click OK.
Destination address translation failure (source address translation in unification with destination address translation)
Symptom
PC B and PC C are connected through the device configured with the NAT Server feature. However, PC B cannot access PC C by using public address 10.0.0.100 and destination port 80.
Figure 8 Network diagram

Solution (security policy)
To resolve the issue:
1. Log in to the Web interface of the device.
2. Access the Policies > Security Policies > Security Policies page.
3. Click Create and then click Create a policy.
4. Configure policy parameters as needed:
¡ Name—Specify the policy name. In this example, the name is secpolicy4.
¡ Source zone—Select the zone to which the interface connected to PC B belongs as the source zone. In this example, the source zone is Untrust.
¡ Destination zone—Select the zone to which the interface connected to PC C belongs as the destination zone. In this example, the destination zone is DMZ.
¡ Action—Select Permit as the action.
¡ Source IPv4 address—Specify the IP address of PC B as the source IP. In this example, the address is 10.0.0.2.
¡ Destination IPv4 address—Specify the IP address of PC C as the destination IP. In this example, the address is 192.168.2.1.
5. Click OK.
Solution (policy-based NAT)
To resolve the issue:
1. Log in to the Web interface of the device.
2. Access the Policies > NAT > NAT Policy page.
3. If a rule displays Dynamic IP+port in the Translation method column, click the Edit icon.
4. In the dialog box that opens, remove port number 80 from the port range in the NAT address group.
5. Click OK.
IPsec configuration failure (NAT in unification with IPsec)
Symptom
Two PCs are connected through the device configured with both IPsec and source address translation. However, when PC A sends a packet to PC B, the device cannot perform IPsec protection for the packet after source address translation.
Figure 9 Network diagram

Solution
To resolve the issue:
1. Log in to the Web interface of the device.
2. Access the Network > VPN > IPsec > IPsec Policies page.
3. To modify a single IPsec policy, click the Edit icon.
4. In the Data flow filter rule area, change the source and destination addresses to addresses after NAT for the flows to be protected by IPsec.
5. Click OK.
Failure to access the gateway device configured with policy-based NAT from internal users
Symptom
PC A in the internal network cannot access the device.
Figure 10 Network diagram
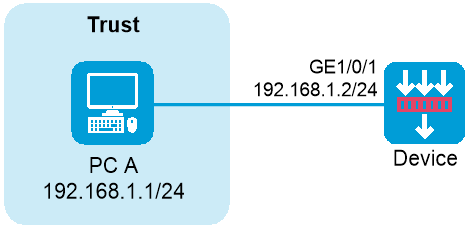
Solution (security policy)
To resolve the issue:
1. Log in to the Web interface of the device.
2. Access the Policies > Security Policies > Security Policies page.
3. Click Create and then click Create a policy.
4. Configure policy parameters as needed:
¡ Name—Specify the policy name. In this example, the name is secpolicy5.
¡ Source zone—Select the zone to which the interface connecting PC A belongs as the source zone. In this example, the source zone is Trust.
¡ Destination zone—Select Local as the destination zone.
¡ Action—Select Permit as the action.
¡ Source IPv4 address—Specify the IP address of PC A as the source IP. In this example, the address is 192.168.1.1.
¡ Destination IPv4 address—Specify the IP address of the interface connected to the internal network as the destination IP. In this example, the address is 192.168.1.2.
5. Click OK.
Solution (policy-based NAT)
To resolve the issue:
1. Log in to the Web interface of the device.
2. Access the Policies > NAT > NAT Policy page.
3. If a rule displays Any in the Source security zone column, click the Edit icon.
4. In the dialog box that opens, modify the following packet match parameters for the destination address translation:
¡ Dst zone—Specify a destination security zone. The value for the parameter cannot be Local.
¡ Source IP—Specify a source IPv4 address. The value for the parameter cannot be 192.168.1.1.
¡ Destination IP—Specify a destination IPv4 address. The value for the parameter cannot be 192.168.1.2.
5. Click OK.
Failure to access the gateway device configured with source address translation from external users
Symptom
Two PCs are connected through the gateway device configured with source address translation. However, PC B cannot access the device.
Figure 11 Network diagram

Solution (security policy)
To resolve the issue:
1. Log in to the Web interface of the device.
2. Access the Policies > Security Policies > Security Policies page.
3. Click Create and then click Create a policy.
4. Configure policy parameters as needed:
¡ Name—Specify the policy name. In this example, the name is secpolicy6.
¡ Source zone—Select the zone to which the interface connected to PC B belongs as the source zone. In this example, the source zone is Untrust.
¡ Destination zone—Select Local as the destination zone.
¡ Action—Select Permit as the action.
¡ Source IPv4 address—Specify the IP address of PC B as the source IP. In this example, the address is 10.0.0.2.
¡ Destination IPv4 address—Specify the IP address of the interface connected to the external network as the destination IP. In this example, the address is 10.0.0.1.
5. Click OK.
Solution (policy-based NAT)
To resolve the issue:
1. Log in to the Web interface of the device.
2. Access the Policies > NAT > NAT Policy page.
3. If a rule of source address translation displays Dynamic IP in the Translation method column, click the Edit icon to edit the rule.
4. If the address object group or NAT address group for source address translation contains the address of the interface connected to the external network, remove the address from the groups.
5. Click OK.
Failure to access the gateway device configured with destination address translation from external users
Symptom
Two PCs are connected through the gateway device configured with destination address translation. However, the external PC B cannot access the device.
Figure 12 Network diagram
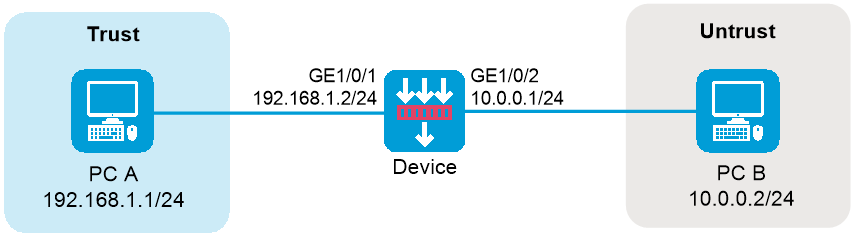
Solution (security policy)
To resolve the issue:
1. Log in to the Web interface of the device.
2. Access the Policies > Security Policies > Security Policies page.
3. Click Create and then click Create a policy.
4. Configure policy parameters as needed:
¡ Name—Specify the policy name. In this example, the name is secpolicy7.
¡ Source zone—Select the zone to which the interface connected to PC B belongs as the source zone. In this example, the source zone is Untrust.
¡ Destination zone—Select Local as the destination zone.
¡ Action—Select Permit as the action.
¡ Source IPv4 address—Specify the IP address of PC B as the source IP. In this example, the address is 10.0.0.2.
¡ Destination IPv4 address—Specify the IP address of the interface connected to the external network on Device as the destination IP. In this example, the address is 10.0.0.1.
5. Click OK.
Solution (policy-based NAT)
To resolve the issue:
1. Log in to the Web interface of the device.
2. Log in to the Web interface of the device.
3. Access the Policies > NAT > NAT Policy page.
4. If a rule entry of destination address translation displays Multiple to one address translation in the Destination address translation method column, click the Edit icon.
5. If the destination address match condition contains the address of the interface connected to the external network on Device, check the service match condition.
6. If the condition contains the service that PC B uses to access Device, perform the following solutions based on the actual situation:
¡ Modify the service that PC B uses to access Device.
¡ Remove the service from the service match condition to ensure the NAT module does not perform destination address translation on traffic containing the service.
7. Click OK.
Troubleshooting interface NAT
Failure to access the external network from internal users
Symptom
PC A in the internal network cannot access PC B in the external network through the gateway device.
Figure 13 Network diagram

Solution (security policy)
To resolve the issue:
1. Log in to the Web interface of the device.
2. Access the Policies > Security Policies > Security Policies page.
3. Click Create and then click Create a policy.
4. Configure policy parameters as needed:
¡ Name—Specify the policy name. In this example, the name is secpolicy1.
¡ Source zone—Select the zone to which the interface connecting PC A belongs as the source zone. In this example, the source zone is Trust.
¡ Destination zone—Select the zone to which the interface connecting PC B belongs as the destination zone. In this example, the destination zone is Untrust.
¡ Action—Select Permit as the action.
¡ Source IPv4 address—Specify the IP address of PC A as the source IP. In this example, the address is 192.168.1.1.
¡ Destination IPv4 address—Specify the IP address of PC B as the destination IP. In this example, the address is 10.0.0.2.
5. Click OK.
Solution (interface NAT)
To resolve the issue:
1. Log in to the Web interface of the device.
2. Access the Policies > NAT > Dynamic NAT page.
3. Click the Outbound Dynamic NAT (ACL-Based) tab.
4. Click Create.
5. Configure policy parameters as needed:
¡ Interface—Specify an interface. In this example, the interface is GE1/0/2.
¡ ACL—Specify an ACL to define the source IP addresses of outgoing packets to be translated by the NAT module.
¡ Source address after NAT—Specify a NAT address group. In this example, IP addresses are public addresses used for source address translation.
¡ Translation mode—Select PAT as the translation mode.
6. Click OK.
Source address translation failure
Symptom
Two PCs are connected through the device configured with source address translation. However, PC A in the internal network cannot access PC B in the external network.
Figure 14 Network diagram

Solution (security policy)
To resolve the issue:
1. Log in to the Web interface of the device.
2. Access the Policies > Security Policies > Security Policies page.
3. Click Create and then click Create a policy.
4. Configure policy parameters as needed:
¡ Name—Specify the policy name. In this example, the name is secpolicy2.
¡ Source zone—Select the zone to which the interface connected to PC A belongs as the source zone. In this example, the source zone is Trust.
¡ Destination zone—Select the zone to which the interface connected to PC B belongs as the destination zone. In this example, the destination zone is Untrust.
¡ Action—Select Permit as the action.
¡ Source IPv4 address—Specify the IP address of PC A as the source IP. In this example, the address is 192.168.1.1.
¡ Destination IPv4 address—Specify the IP address of PC B as the destination IP. In this example, the address is 10.0.0.2.
5. Click OK.
Solution (interface NAT)
To resolve the issue:
1. Log in to the Web interface of the device.
2. Click the Edit icon to modify the source address translation rule.
3. In the dialog box that opens, check if addresses of the following parameters are within the 10.0.0.1/24 network:
¡ Source addresses after NAT.
¡ Network addresses for address translation.
¡ Address objects in the address object group for address translation.
¡ Addresses in the NAT address group for address translation.
4. If any, modify related configurations to verify return packets can be transmitted to interface GE 1/0/2 on the device.
5. Click OK.
Destination address translation failure
Symptom
Two PCs are connected through the device configured with destination address translation. However, PC B in the external network cannot access PC A in the internal network.
Figure 15 Network diagram

Solution (security policy)
To resolve the issue:
1. Log in to the Web interface of the device.
2. Access the Policies > Security Policies > Security Policies page.
3. Click Create and then click Create a policy.
4. Configure policy parameters as needed:
¡ Name—Specify the policy name. In this example, the name is secpolicy3.
¡ Source zone—Select the zone to which the interface connected to PC B belongs as the source zone. In this example, the source zone is Untrust.
¡ Destination zone—Select the zone to which the interface connected to PC A belongs as the destination zone. In this example, the destination zone is Trust.
¡ Action—Select Permit as the action.
¡ Source IPv4 address—Specify the IP address of PC B as the source IP. In this example, the address is 10.0.0.2.
¡ Destination IPv4 address—Specify the IP address of PC A as the destination IP. In this example, the address is 192.168.1.1.
5. Click OK.
Solution (interface NAT)
To resolve the issue:
1. Log in to the Web interface of the device.
2. Access the Policies > NAT > NAT Servers > Policy Configuration page.
3. Check whether the public port of the NAT Server is in actual use.
4. If not, change and verify the public port is in actual use for the NAT Server rule.
5. Click OK.
Destination address translation failure (source address translation in unification with destination address translation)
Symptom
PC B and PC C are connected through the device configured with the NAT Server feature. However, PC B cannot access PC C by using public address 10.0.0.100 and destination port 80.
Figure 16 Network diagram
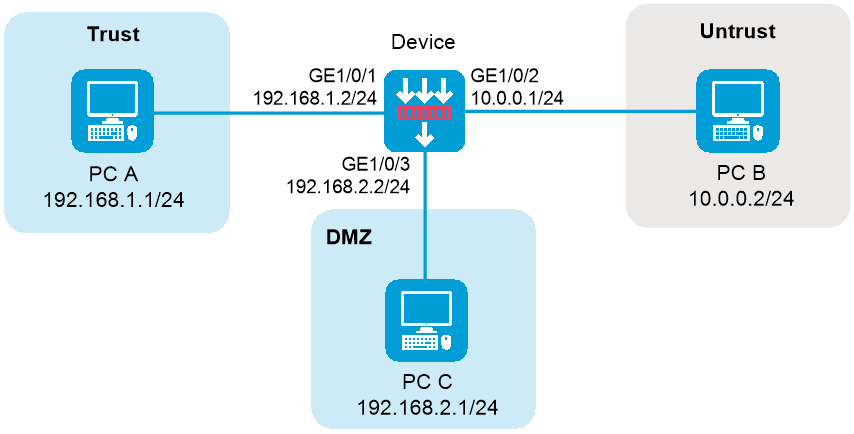
Solution (security policy)
To resolve the issue:
1. Log in to the Web interface of the device.
2. Access the Policies > Security Policies > Security Policies page.
3. Click Create and then click Create a policy.
4. Configure policy parameters as needed:
¡ Name—Specify the policy name. In this example, the name is secpolicy4.
¡ Source zone—Select the zone to which the interface connected to PC B belongs as the source zone. In this example, the source zone is Untrust.
¡ Destination zone—Select the zone to which the interface connected to PC C belongs as the destination zone. In this example, the destination zone is DMZ.
¡ Action—Select Permit as the action.
¡ Source IPv4 address—Specify the IP address of PC B as the source IP. In this example, the address is 10.0.0.2.
¡ Destination IPv4 address—Specify the IP address of PC C as the destination IP. In this example, the address is 192.168.2.1.
5. Click OK.
Solution (interface NAT)
To resolve the issue:
1. Log in to the Web interface of the device.
2. Access the Policies > NAT > Dynamic NAT page.
3. Click the Outbound Dynamic NAT (Group-Based) tab to view rule details.
4. If the action is PAT, click the Edit icon to remove port number 80 from the port range in the NAT address group.
5. Click OK.
6. Click the Outbound Dynamic NAT (ACL-Based) tab to view rule details.
7. If the translation mode is PAT, click the Edit icon to remove port number 80 from the port range in the NAT address group.
8. Click OK.
IPsec configuration failure (NAT in unification with IPsec)
Symptom
Two PCs are connected through the device with both IPsec and source address translation are configured correctly. However, when PC A sends a packet to PC B, the device cannot perform IPsec protection for the packet after source address translation.
Figure 17 Network diagram

Solution
To resolve the issue:
1. Log in to the Web interface of the device.
2. Access the Network > VPN > IPsec > IPsec Policies page.
3. Click the Edit icon to edit the IPsec policy configurations.
4. In the Data flow filter rule area, use addresses after NAT as the source and destination addresses to match packets to be protected by IPsec.
5. Click OK.
Failure to access the gateway device configured with source address translation from external users
Symptom
Two PCs are connected through the gateway Device configured with source address translation. However, PC B cannot access the device.
Figure 18 Network diagram

Solution (security policy)
To resolve the issue:
1. Log in to the Web interface of the device.
2. Access the Policies > Security Policies > Security Policies page.
3. Click Create and then click Create a policy.
4. Configure policy parameters as needed:
¡ Name—Specify the policy name. In this example, the name is secpolicy5.
¡ Source zone—Select the zone to which the interface connecting PC B belongs as the source zone. In this example, the source zone is Untrust.
¡ Destination zone—Select Local as the destination zone.
¡ Action—Select Permit as the action.
¡ Source IPv4 address—Specify the IP address of PC B as the source IP. In this example, the address is 10.0.0.2.
¡ Destination IPv4 address—Specify the IP address of the interface connected to the external network as the destination IP. In this example, the address is 10.0.0.1.
5. Click OK.
Solution (policy-based NAT)
To resolve the issue:
1. Log in to the Web interface of the device.
2. Access the Policies > NAT > Dynamic NAT page.
3. Click the Outbound Dynamic NAT (Group-Based) tab to check if the Action column is NO-PAT.
4. If the action is NO-PAT, click the Edit icon to remove IP address 10.0.0.1 from the NAT address group for packet match.
5. Click OK.
6. Click the Outbound Dynamic NAT (ACL-Based) tab to check if the Translation method column is NO-PAT.
7. If the translation mode is NO-PAT, click the Edit icon to open the NAT Dynamic NAT Rule dialog box:
¡ If IP addresses for address translation belong to an address group, verify the NAT address group does not contain 10.0.0.1.
¡ If the translation mode is Easy IP, the specified interface for address translation cannot be GE1/0/2.
8. Click OK.
Failure to access the gateway device configured with destination address translation from external users
Symptom
Two PCs are connected through the gateway device configured with destination address translation. However, the external PC B cannot access the device.
Figure 19 Network diagram

Solution (security policy)
To resolve the issue:
1. Log in to the Web interface of the device.
2. Access the Policies > Security Policies > Security Policies page.
3. Click Create and then click Create a policy.
4. Configure policy parameters as needed:
¡ Name—Specify the policy name. In this example, the name is secpolicy6.
¡ Source zone—Select the zone to which the interface connecting PC B belongs as the source zone. In this example, the source zone is Untrust.
¡ Destination zone—Select Local as the destination zone.
¡ Action—Select Permit as the action.
¡ Source IPv4 address—Specify the IP address of PC B as the source IP. In this example, the address is 10.0.0.2.
¡ Destination IPv4 address—Specify the IP address of the interface connected to the external network on Device as the destination IP. In this example, the address is 10.0.0.1.
5. Click OK.
Solution (interface NAT)
To resolve the issue:
1. Log in to the Web interface of the device.
2. Access the Policies > NAT > NAT Servers > Policy Configuration page.
3. Check if the IP address 10.0.0.1 is occupied by a NAT Server rule.
4. If it is displayed in the Public IP address column, click the Edit icon for the rule.
5. In the Edit NAT Server Rule dialog box that opens, check if the public port occupies the port for PC B to access Device.
6. If the port is occupied, choose one of the following solutions:
¡ Modify the protocol or destination port for traffic from PC B to the device.
¡ Modify the ACL-based packet match rule to prevent the traffic to be processed by destination address translation.
7. Click OK.
Dynamic NAT failure
Symptom
Dynamic NAT fails or the translated packets cannot be forwarded correctly. PC A in the internal network cannot access PC B in the external network through the gateway device.
Solution
To resolve the issue:
1. Verify that NAT is configured correctly. This section uses outbound NAT as an example.
[H3C] display nat outbound
NAT outbound information:
There are 1 NAT outbound rules.
Interface: Route-Aggregation12
ACL: --- Address group: 257 Port-preserved: N
NO-PAT: N Reversible: N
2. Use the debugging nat packet command to enable debugging of NAT packets and verify that packets can be translated correctly. Example debugging information is as follows:
*May 13 09:58:48:083 2017 H3C NAT/7/COMMON: -slot =1;
PACKET: (Route-Aggregation12-in) Protocol: TCP
4.4.4.6: 21 - 4.4.5.11:11000(VPN: 0) ------>
4.4.4.6: 21 - 192.168.1.2:13249(VPN: 0)
3. Verify that session information is correct.
<H3C> display session table ipv4 verbose
Initiator:
Source IP/port: 192.168.1.2/13790
Destination IP/port: 4.4.4.6/21
DS-Lite tunnel peer: -
VPN instance/VLAN ID/VLL ID: -/-/-
Protocol: TCP(6)
Responder:
Source IP/port: 4.4.4.6/21
Destination IP/port: 4.4.4.27/1060
DS-Lite tunnel peer: -
VPN instance/VLAN ID/VLL ID: -/-/-
Protocol: TCP(6)
State: TCP_ESTABLISHED
Application: FTP
Start time: 2013-12-15 10:49:00 TTL: 3592s
Interface(in) : Route-Aggregation11
Interface(out): Route-Aggregation12
Zone(in) : Trust
Zone(out): menglei
Initiator->Responder: 3 packets 128 bytes
Responder->Initiator: 2 packets 130 bytes
4. If the issue persists, contact H3C Support.
NAT fails but the outbound interface can be pinged successfully from the external network
Symptom
The firewall acts as the gateway at the network egress. NAT fails on the gateway and the internal and external users cannot reach each other, but the outbound interface can be pinged successfully from the external network.
Solution
To resolve the issue:
1. Verify that the NAT address group is in the same subnet as the interface. If they are in different subnets, make sure a route to the NAT address group is configured on the peer end.
2. If the NAT address group or the NAT server address is in the same subnet as the interface, verify that the address group or the NAT server can send gratuitous ARP packets and the peer end has learned to correct MAC addresses. You can verify gratuitous ARP packet sending on a directly connected device.
A device cannot detect link disassociation of a non-directly connected device and cannot update the corresponding ARP entry. Gratuitous ARP enables a device to send ARP packets carrying the address of the sending device as the target address upon device association. Devices that receive the gratuitous ARP packets update their ARP entries. The address pool might fail to update its addresses in time.
3. Enable debugging or capture packets on the firewall, and verify that ping packets can be forwarded correctly (both ping requests and responses can be detected).
4. Ping the NAT address group or NAT server from the peer device continuously. Enable ARP debugging and verify that ARP packets can be received correctly.
5. If the issue persists, contact H3C Support.
Related commands
|
Command |
Description |
|
display nat outbound |
Displays outbound dynamic NAT configuration. |
|
display nat server |
Displays NAT server mappings. |
|
display session |
Displays session version information. |
|
save |
Saves the running configuration to a configuration file. |
Troubleshooting IPsec and IKE
IPsec SAs established successfully but IPsec-protected traffic cannot be forwarded
Symptom
An IKE-based IPsec tunnel is established successfully between FW 1 and FW 2 to protect the traffic between PC 1 and PC 2, but the PCs cannot ping each other.
Figure 20 Network diagram

Settings on FW 1:
· The local address and remote address of the IPsec tunnel are 81.2.0.1 and 14.5.1.1, respectively.
· The ACL rule for IPsec:
rule 0 permit ip source 81.2.0.0 0.0.0.255 destination 82.2.0.0 0.0.0.255
Settings on FW 2:
· The local address and remote address of the IPsec tunnel are 14.5.1.1 and 81.2.0.1, respectively.
· The ACL rule for IPsec:
rule 0 permit ip source 82.2.0.0 0.0.0.255 destination 81.2.0.0 0.0.0.255
Solution
To resolve the issue:
1. Verify that the routes are reachable.
2. View the packet hit counts for the ACL rules, and verify that configuration for the ACL rules matches the traffic to be protected.
3. Verify that the FWs allow ESP or AH encapsulated packets to pass.
4. Use the reset ipsec sa and reset ike sa commands to clear and re-establish IPsec SAs and IKE SAs.
5. If the issue persists, contact H3C Support.
Related commands
|
Command |
Description |
|
display ike sa |
Displays IKE SA information. |
|
display ipsec sa |
Displays IPsec SA information. |
|
reset ike sa |
Clears IKE SAs. |
|
reset ipsec sa |
Clears IPsec SAs. |
|
save |
Saves the running configuration to the specified file. |
IKE SAs established successfully but IPsec SAs cannot be established
Symptom
Establish an IKE-based IPsec tunnel between FW 1 and FW 2 to protect the traffic between PC 1 and PC 2. IKE SAs are established successfully, but IPsec SAs cannot be established.
Figure 21 Network diagram

Settings on FW 1:
· The local address and remote address of the IPsec tunnel are 81.2.0.1 and 14.5.1.1, respectively.
· The ACL rule for IPsec:
rule 0 permit ip source 81.2.0.0 0.0.0.255 destination 82.2.0.0 0.0.0.255
Settings on FW-2:
· The local address and remote address of the IPsec tunnel are 14.5.1.1 and 81.2.0.1, respectively.
· The ACL rule for IPsec:
rule 0 permit ip source 82.2.0.0 0.0.0.255 destination 81.2.0.0 0.0.0.255
Solution
To resolve the issue:
1. View the packet hit counts for the ACL rules, and verify that configuration for the ACL rules matches the traffic to be protected.
2. Verify that the FWs have consistent security protocol, encryption and authentication algorithms, and encapsulation mode settings.
3. Verify that the IPsec configuration is correct and complete. For example, make sure the remote address or IKE profile is correctly configured.
4. Use the reset ipsec sa and reset ike sa commands to clear and re-establish IPsec SAs and IKE SAs.
5. If the issue persists, contact H3C Support.
Related commands
|
Command |
Description |
|
display ike sa |
Displays IKE SA information. |
|
display ipsec sa |
Displays IPsec SA information. |
|
reset ike sa |
Clears IKE SAs. |
|
reset ipsec sa |
Clears IPsec SAs. |
|
display ipsec transform-set |
Displays IPsec transform set information. |
|
display ipsec policy |
Displays IPsec policy information. |
|
save |
Saves the running configuration to the specified file. |
IKE SAs cannot be established
Symptom
Establish an IKE-based IPsec tunnel between FW 1 and FW 2 to protect the traffic between PC 1 and PC 2. However, IKE SAs cannot be established.
Figure 22 Network diagram

Settings on FW 1:
· The local address and remote address of the IPsec tunnel are 81.2.0.1 and 14.5.1.1, respectively.
· The ACL rule for IPsec:
rule 0 permit ip source 81.2.0.0 0.0.0.255 destination 82.2.0.0 0.0.0.255
Settings on FW-2:
· The local address and remote address of the IPsec tunnel are 14.5.1.1 and 81.2.0.1, respectively.
· The ACL rule for IPsec:
rule 0 permit ip source 82.2.0.0 0.0.0.255 destination 81.2.0.0 0.0.0.255
Solution
To resolve the issue:
1. Verify that the FWs have consistent IKE proposal settings, mainly including the encryption and authentication algorithms, and the identify authentication mode.
2. Make sure the IKE identify authentication succeeds:
¡ For preshared key authentication, verify that the preshared keys configured on the FWs are the same.
¡ For certificate authentication, verify the following settings:
- The certificates on the FWs are within the validity period or are not withdrawn.
- The certificates have trusted CAs and are signed by the same CA.
- The FWs have matching keys in the certificates.
¡ Verify that no remote identity conflict exists. The conflict might be caused by identical remote identity configuration in different IKE profiles.
3. If the issue persists, contact H3C Support.
Related commands
|
Command |
Description |
|
display ike proposal |
Displays configuration information about all IKE proposals. |
|
display ike sa |
Displays IKE SA information. |
|
display ipsec sa |
Displays IPsec SA information. |
|
reset ike sa |
Clears IKE SAs. |
|
reset ipsec sa |
Clears IPsec SAs. |
|
save |
Saves the running configuration to the specified file. |
IPsec smart link does not detect link quality
Symptom
The branch accesses the headquarters through IPsec VPN. Configure IPsec smart link selection so the branch can establish an IPsec tunnel to the headquarters over link 1 or link 2, whichever has a better link quality.
· Device A first uses link 1 to establish the IPsec tunnel.
· When link 1 suffers high packet loss ratio or delay, Device A automatically switches traffic to the IPsec tunnel established based on link 2.
However, the IPsec smart link policy cannot function as expected. It does not detect the link qualities for smart link switchover.
Figure 23 Network diagram
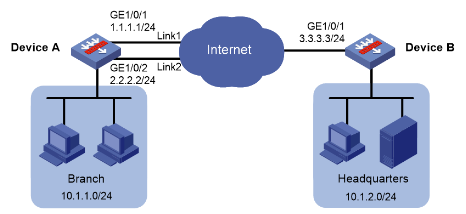
Primary settings on Device A
# Configure interface IP addresses and gateway IP addresses.
<DeviceA> system-view
[DeviceA] interface gigabitethernet 1/0/1
[DeviceA-GigabitEthernet1/0/1] ip address 1.1.1.1 24
[DeviceA-GigabitEthernet1/0/1] gateway 1.1.1.3
[DeviceA-GigabitEthernet1/0/1] quit
[DeviceA] interface gigabitethernet 1/0/2
[DeviceA-GigabitEthernet1/0/2] ip address 2.2.2.2 24
[DeviceA-GigabitEthernet1/0/2] gateway 2.2.2.3
[DeviceA-GigabitEthernet1/0/2] quit
# Configure an IPsec smart link policy named policy1 and configure link 1 and link 2 in the policy.
[DeviceA] ipsec smart-link policy policy1
[DeviceA-ipsec-smart-link-policy-policy1] link 1 interface gigabitethernet 1/0/1 remote 3.3.3.3
[DeviceA-ipsec-smart-link-policy-policy1] link 2 interface gigabitethernet 1/0/2 remote 3.3.3.3
# Set the maximum number of link switchover cycles to 4.
[DeviceA-ipsec-smart-link-policy-policy1] link-switch cycles 4
# Enable IPsec smart link selection in the policy.
[DeviceA-ipsec-smart-link-policy-policy1] smart-link enable
[DeviceA-ipsec-smart-link-policy-policy1] quit
Primary settings on Device B
# Configure the interface IP address.
<DeviceB> system-view
[DeviceB] interface gigabitethernet 1/0/1
[DeviceB-GigabitEthernet1/0/1] ip address 3.3.3.3 24
[DeviceB-GigabitEthernet1/0/1] quit
# Configure an IPv4 ACL to identify data flows to be protected by IPsec.
[DeviceB] acl advanced 3000
[DeviceB-acl-ipv4-adv-3000] rule permit ip source 10.1.2.0 0.0.0.255 destination 10.1.1.0 0.0.0.255
[DeviceB-acl-ipv4-adv-3000] rule permit ip source 3.3.3.0 0.0.0.255 destination 1.1.1.0 0.0.0.255
[DeviceB-acl-ipv4-adv-3000] rule permit ip source 3.3.3.0 0.0.0.255 destination 2.2.2.0 0.0.0.255
[DeviceB-acl-ipv4-adv-3000] quit
# Configure static routes for Device B to reach the subnets connected to Device A. This example uses 3.3.3.1 as the next hop address of the routes.
[DeviceB] ip route-static 10.1.1.0 255.255.255.0 gigabitethernet 1/0/1 3.3.3.1
[DeviceB] ip route-static 1.1.1.0 255.255.255.0 gigabitethernet 1/0/1 3.3.3.1
[DeviceB] ip route-static 2.2.2.0 255.255.255.0 gigabitethernet 1/0/1 3.3.3.1
Solution
To resolve the issue:
1. Verify that the links are valid. For example, make sure the interfaces are assigned IP addresses and the interface state is up.
2. Verify that the smart link configuration is complete. For example, make sure the smart link policy is specified in the IPsec policy, and next hops for the routes are well configured.
3. Verify that IPsec policy settings are correct and complete.
4. Change the maximum number of link switchover cycles to a bigger value to ensure that the failure is not caused by the limit of link switchover cycles count.
5. If the issue persists, contact H3C Support.
Related commands
|
Command |
Description |
|
display ike sa |
Displays IKE SA information. |
|
display ipsec sa |
Displays IPsec SA information. |
|
reset ike sa |
Clears IKE SAs. |
|
reset ipsec sa |
Clears IPsec SAs. |
|
display ipsec smart-link policy |
Displays IPsec smart link policy information. |
|
display ipsec policy |
Displays IPsec policy information (to verify the IPsec policy configuration and view the specified smart link policy). |
|
display acl 3000 |
Displays information about dynamic ACL rules. |
|
save |
Saves the running configuration to the specified file. |
IPsec tunnel interface-based IPsec tunnel cannot be established
Symptom
Both the branch and the headquarters use fixed IP addresses to access the Internet.
To ensure that the IPsec configuration of the headquarters remains stable despite of changes of the branch subnet, IPsec tunnel interface-based IPsec is configured on Device A and Device B. This tunnel is used to protect all the traffic between the branch (10.1.1.0/24) and the headquarters (10.1.2.0/24).
However, the IPsec tunnel interface-based IPsec tunnel cannot be established as expected.
Figure 24 Network diagram
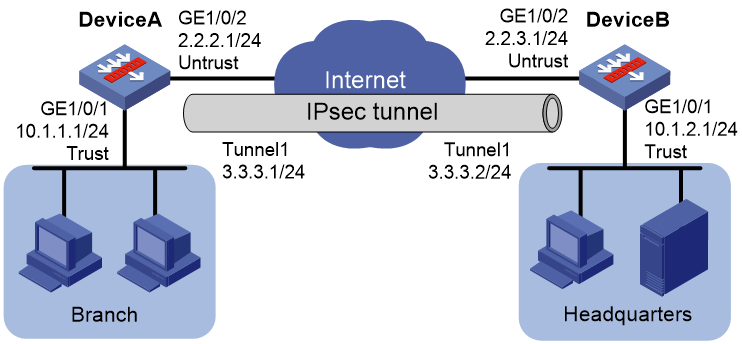
IPsec tunnel interface settings on Device A:
# Create IPsec tunnel interface Tunnel1.
[DeviceA] interface tunnel 1 mode ipsec
# Configure an IP address for the tunnel interface.
[DeviceA-Tunnel1] ip address 3.3.3.1 255.255.255.0
# Configure the IP address of GE 1/0/2 on Device A as the source address of the tunnel.
[DeviceA-Tunnel1] source 2.2.2.1
# Configure the IP address of GE 1/0/2 on Device B as the destination address of the tunnel.
[DeviceA-Tunnel1] destination 2.2.3.1
# Apply an IPsec profile to the tunnel interface.
[DeviceA-Tunnel1] tunnel protection ipsec profile abc
[DeviceA-Tunnel1] quit
# Configure a static route from Device A to Device B that goes through the tunnel interface.
[DeviceA] ip route-static 10.1.2.0 255.255.255.0 tunnel 1
IPsec tunnel interface settings on Device B:
# Create IPsec tunnel interface Tunnel1.
[DeviceB] interface tunnel 1 mode ipsec
# Configure an IP address for the tunnel interface.
[DeviceB-Tunnel1] ip address 3.3.3.2 255.255.255.0
# Configure the IP address of GE 1/0/2 on Device B as the source address of the tunnel.
[DeviceB-Tunnel1] source 2.2.3.1
# Configure the IP address of GE 1/0/2 on Device A as the destination address of the tunnel.
[DeviceB-Tunnel1] destination 2.2.2.1
# Apply an IPsec profile to the tunnel interface.
[DeviceB-Tunnel1] tunnel protection ipsec profile abc
[DeviceB-Tunnel1] quit
# Configure a static route from Device B to Device A that goes through the tunnel interface.
[DeviceB] ip route-static 10.1.1.0 255.255.255.0 tunnel 1
Solution
To resolve the issue:
1. Verify that the IPsec tunnel interface state is up. If the state is down, check the completeness of the tunnel configuration. The common check items include the source address, destination address (the command syntax might be misspelled), and tunnel interface IP address.
2. Verify that the tunnel source interface is up and the tunnel destination address is reachable.
3. Verify that IPsec and IKE basic settings are correct.
4. If the issue persists, contact H3C Support.
Related commands
|
Command |
Description |
|
display ike sa |
Displays IKE SA information. |
|
display ipsec sa |
Displays IPsec SA information. |
|
reset ike sa |
Clears IKE SAs. |
|
reset ipsec sa |
Clears IPsec SAs. |
|
display ip interface brief |
Displays interface state information. |
|
display interface Tunnel 1 |
Displays tunnel state information. |
|
save |
Saves the running configuration to the specified file. |
Troubleshooting load balancing
High CPU usage and memory usage
Symptom
Packet loss occurs on virtual servers, or NQA operations fail.
Solution
To resolve the issue:
1. Display the real server state. High CPU usage might cause failed NQA operations or packet loss on virtual servers.
2. High memory usage causes new requests to be discarded.
Related commands
|
Command |
Description |
|
Display virtual-server statistics |
Displays virtual server statistics. |
|
display real-server statistics |
Displays real server statistics. |
|
debugging lb all |
Enables all debugging functions for load balancing. |
|
debugging lb error |
Enables load balancing error debugging. |
|
debugging lb event |
Enables load balancing event debugging. |
|
debugging lb fsm |
Enables load balancing state machine debugging. |
|
debugging lb packet |
Enables load balancing packet debugging. |
Uneven load balancing
Symptom
Load balancing is uneven.
Solution
To resolve the issue:
1. Use the round robin algorithm for load balancing.
2. The LB card has multiple CPU cores. Load balancing is performed per core. For this reason, connections might be distributed unevenly across real servers. Use the least connection algorithm or random.
3. If the source IP address hash algorithm is used, make sure the number of source IP addresses is sufficient.
4. Configure an LB policy to achieve more granular traffic classification.
Related commands
|
Command |
Description |
|
display real-server statistics [ name real-server-name ] |
Displays real server statistics. |
|
display virtual-server statistics [ name virtual-server-name ] |
Displays virtual server statistics. |
|
reset real-server statistics [ real-server-name ] |
Clears real server statistics. |
|
reset virtual-server statistics [ virtual-server-name ] |
Clears virtual server statistics. |
Troubleshooting system management
High CPU usage
Symptom
The CPU usage of the device remains over 60%, and command executions are very slow.
<H3C> display cpu-usage
Slot 1 CPU 0 CPU usage:
13% in last 5 seconds
13% in last 1 minute
13% in last 5 minutes
The display cpu-usage history command displays the CPU usage in the most recent 60 minutes.
<H3C> display cpu-usage history
100%|
95%|
90%|
85%|
80%|
75%|
70%|
65%|
60%|
55%|
50%|
45%|
40%|
35%|
30%|
25%|
20%|
15%|
10%|
5%| #
------------------------------------------------------------
10 20 30 40 50 60 (minutes)
cpu-usage (CPU 0) last 60 minutes (SYSTEM)
Solution
To resolve the issue:
1. Verify whether too many routing policies have been configured.
Use the display route-policy command to view the configured routing policies and determine whether too many routing policies have been configured leading to high CPU usage.
<H3C> display route-policy
Route-policy: policy1
permit : 1
if-match cost 10
continue: next node 11
apply comm-list a delete
2. Verify whether a traffic loop has occurred.
When a traffic loop occurs, the network flaps and a large number of protocol packets are sent to the CPU for processing, which might result in high CPU usage. A traffic loop might cause broadcasting. Many ports of the device have to process a large amount of traffic, causing the port utilization rate to reach 90% or more.
<H3C> display interface GigabitEthernet1/0/2
GigabitEthernet1/0/2 current state: UP
Line protocol current state: UP
IP Packet Frame Type: PKTFMT_ETHNT_2, Hardware Address: 0000-e80d-c000
Description: GigabitEthernet2/6/0/1 Interface
Loopback is not set
Media type is optical fiber, Port hardware type is 1000_BASE_SX_SFP
1000Mbps-speed mode, full-duplex mode
……
Last clearing of counters: Never
Peak value of input: 123241940 bytes/sec, at 2013-06-27 14:33:15
Peak value of output: 80 bytes/sec, at 2013-06-27 14:13:00
Last 300 second input: 26560 packets/sec 123241940 bytes/sec 99%
Last 300 second output: 0 packets/sec 80 bytes/sec 0%
……
If a traffic loop occurs, perform the following steps.
a. Verify whether the link connection and port configuration are correct.
b. Verify whether STP is enabled on the connected switch, and whether the configuration is correct.
c. Verify whether the routing configuration is correct and whether a routing loop exists.
3. Verify whether the packets are fast forwarded.
Execute the display ip fast-forwarding cache command to view whether the forwarding entry for the packets exist in the output. If the entry does not exist, the packets are not fast forwarded.
<H3C> display ip fast-forwarding cache
Total number of fast-forwarding entries: 78
SIP SPort DIP DPort Pro Input_If Output_If Flg
40.1.20.2 65535 30.1.2.2 1024 6 Reth4 Reth3 1
192.168.96.40 53342 192.168.205.33 23 6 GE1/0/0 N/A 1
30.1.2.2 1024 40.1.20.2 65535 6 Reth3 Reth4 1
192.168.205.33 23 192.168.96.52 60824 6 InLoop0 GE1/0/0 1
120.0.0.1 1701 120.0.0.2 1701 17 InLoop0 GE1/0/2.120 1
40.1.20.2 65529 30.1.2.2 1024 6 Reth4 Reth3 1
130.2.1.115 1701 130.2.1.1 1701 17 Reth4 N/A 1
30.1.2.2 1024 40.1.20.2 65533 6 Reth3 Reth4 1
40.1.20.2 65526 30.1.2.2 1024 6 Reth4 Reth3 1
50.1.1.2 1024 60.1.1.2 1024 6 Reth1 Tun1 1
192.168.205.33 37932 192.168.100.53 0 1 InLoop0 GE1/0/0 1
30.1.2.2 1024 40.1.20.2 65529 6 Reth3 Reth4 1
30.1.2.2 1024 40.1.20.2 65527 6 Reth3 Reth4 1
60.1.1.2 1024 50.1.1.2 1024 6 Tun1 Reth1 1
40.1.20.2 65532 30.1.2.2 1024 6 Reth4 Reth3 1
You can also enter an IP address in the command to verify whether the packets that use the IP address as the source or destination IP address are fast forwarded.
<H3C> display ip fast-forwarding cache 12.1.1.1
Total number of fast-forwarding entries: 2
SIP SPort DIP DPort Pro Input_If Output_If Flg
12.1.1.2 49216 12.1.1.1 3784 17 InLoop0 N/A 1
12.1.1.1 3784 12.1.1.2 49216 17 RAGG5.3101 InLoop0 1
If the issue persists, execute the display cpu-usage command and provide the command output together with other related information to technical support for analysis.
4. Verify whether object policy or ACL acceleration is enabled.
#
object-policy ip EXTERNAL-Local
rule 0 pass vrf external_vpn
rule 1 pass vrf 7tgaklptgb9o19babgnm3kbst8
accelerate
#
An acceleration-disabled object policy or ACL that has more than 50 rules might cause high CPU usage. You can use the display object-policy accelerate summary ip and display acl accelerate summary commands to view which object policies and ACLs are enabled with acceleration.
5. Verify whether the IP address object group for an object policy is configured with excluded IP addresses or a discontinuous wildcard mask.
If an excluded IP address or a discontinuous wildcard mask is configured for the IP address object group, object policy acceleration will fail, causing high CPU usage. You must remove related configurations.
6. Verify whether the NAT444 port block resources are sufficient.
On a network configured with NAT444, bursts of traffic (the source port of the packets changes frequently while the source and destination IP addresses and destination port numbers remain unchanged) might cause exhaustion of NAT444 port resources.
Execute the display system internal nat statistics chassis X slot X cpu 1 | in failed command in probe view to view whether the count for the "NAT444 failed to translate port" field or similar increases significantly.
If the count is increasing significantly, use the display nat port-block static c 1 s X c 1 command to identify which address' s mapping occupies a large amount of port resources, and examine the configuration of NAT address group where the address belongs to determine whether the occupied port resource has reached the upper limit.
If the upper port resource limit is reached, change the configuration and increase the port block resources.
7. Verify whether a large number of broadcast or multicast packets are received on the device.
Execute the display counters rate inbound interface command to verify whether the received broadcast or multicast packet count is increasing significantly.
If the count has a large increase, use QoS to rate limit the packets and identify the reason that causes the large increase.
8. Verify whether bursts of traffic occur.
If a lot of packets are denied and dropped by the security policy, the CPU usage might be high. You can execute the following command to view whether a large number of packets are dropped.
[H3C-probe]display system internal aspf statistics zone-pair ipv4 chassis X slot X cpu 1
[H3C-probe]display system internal ip packet-drop statistics chassis X slot X cpu 1
If a large number of packets are dropped, perform the following steps:
a. Execute the following commands to determine the packet characteristics.
debug ip packet
debug ip info
debug aspf packet
b. Take actions such as permitting the packets in the security policy, configuring attack prevention policies, and QoS based on the packet characteristics
High memory usage
Symptom
The memory usage of a card remains above 70%.
Use the display memory command to display the memory usage of a card. In the command output, Total indicates total memory size, Used indicates used memory size, and FreeRatio indicate free memory ratio.
<H3C> display memory slot 2
The statistics about memory is measured in KB:
Slot 2:
Total Used Free Shared Buffers Cached FreeRatio
Mem: 16375408 2514664 13860744 0 1396 177968 84.6%
-/+ Buffers/Cache: 2335300 14040108
Swap: 0 0 0
Solution
To resolve the issue:
1. Execute the display process memory command multiple times to do the following:
¡ Display the memory usage for all processes on a card.
¡ Identify the process for which memory usage is continuously increasing.
If the memory usage of a process is continuously increasing, this process might have a memory leak. Dynamic memory is heap memory dynamically assigned to the device. Its value becomes large when memory is leaked.
<H3C> display process memory slot 2
JID Text Data Stack Dynamic Name
1 132 700 32 156 scmd
2 0 0 0 0 [kthreadd]
3 0 0 0 0 [migration/0]
4 0 0 0 0 [ksoftirqd/0]
5 0 0 0 0 [watchdog/0]
6 0 0 0 0 [migration/1]
7 0 0 0 0 [ksoftirqd/1]
8 0 0 0 0 [watchdog/1]
9 0 0 0 0 [migration/2]
10 0 0 0 0 [ksoftirqd/2]
11 0 0 0 0 [watchdog/2]
12 0 0 0 0 [migration/3]
13 0 0 0 0 [ksoftirqd/3]
14 0 0 0 0 [watchdog/3]
15 0 0 0 0 [migration/4]
16 0 0 0 0 [ksoftirqd/4]
17 0 0 0 0 [watchdog/4]
……
18919 128 76416 64 2240 diagd
……
The output shows that the process with ID 18919 uses the most memory.
2. Execute the display process memory heap command multiple times to do the following:
¡ Display heap memory usage for user process 18919.
¡ Identify the memory block for which memory usage is continuously increasing.
If the memory usage of a memory block is continuously increasing, the memory might be leaked.
<H3C> display process memory heap job 18919 verbose
Heap usage:
Size Free Used Total Free Ratio
32 541 39 580 93.3%
48 6 43 49 12.2%
64 534 32499 33033 1.6%
80 538 47 585 92.0%
112 0 534 534 0.0%
128 0 4 4 0.0%
160 0 4 4 0.0%
176 0 4 4 0.0%
256 0 2 2 0.0%
288 0 1 1 0.0%
304 0 1 1 0.0%
336 0 1 1 0.0%
688 0 4 4 0.0%
1184 0 2 2 0.0%
1456 0 2 2 0.0%
1984 0 1 1 0.0%
2032 0 2 2 0.0%
4144 0 1 1 0.0%
13792 1 0 1 100.0%
Large Memory Usage:
Used Blocks : 0
Used Memory(in bytes): 0
Free Blocks : 3
Free Memory(in bytes): 211200
Summary:
Total virtual memory heap space(in bytes) : 2490368
Total physical memory heap space(in bytes) : 2293760
Total allocated memory(in bytes) : 2170560
Related commands
|
Command |
Description |
|
display cpu-usage |
Displays current CPU usage statistics. |
|
display cpu-usage history |
Displays historical CPU usage statistics in a coordinate system. |
|
display interface |
Displays interface information. |
|
display memory |
Displays memory usage information. |
|
display process memory |
Displays memory usage information for each process on a card. |
|
display process memory heap |
Displays heap memory usage for a user process. |
|
display system internal kernel memory pool |
Displays kernel memory allocation information. |
Troubleshooting SSL VPN
Failure to log in to the SSL VPN Web interface
Symptom
The client can ping the SSL VPN gateway, but it cannot open the SSL VPN login page.
Solution
To resolve the issue:
1. Verify that a PKI domain has been specified in SSL server policy view.
[H3C] ssl server-policy XXX
[H3C-ssl-server-policy-XXX] display this
#
ssl server-policy XXX
pki-domain XXX
#
return
2. Verify that a CA certificate and local certificate have been imported to the PKI domain. Make sure the local certificate is a certificate issued by the CA to a server, not a certificate for a client.
Use the following command to view certificate information for a PKI domain:
display pki certificate domain XXXX ca
display pki certificate domain XXXX local
3. If you import certificates or modify the SSL server policy after the SSL VPN gateway is enabled, you must re-enable the SSL VPN gateway to make the configurations take effect.
Execute the following commands in sequence to re-enable the SSL VPN gateway:
¡ undo service enable
¡ service enable
4. If the issue persists, contact H3C Support.
Related commands
|
Command |
Description |
|
ssl server-policy policy-name |
Creates an SSL server policy and enters SSL server policy view. |
|
pki-domain domain-name |
Specifies the PKI domain used by the SSL server policy. |
|
display pki certificate domain domain-name { ca | local | peer [ serial serial-num ] } |
Displays certificate information. |
|
sslvpn gateway gateway-name |
Creates an SSL VPN gateway and enters SSL VPN gateway view. |
|
service enable |
Enables the SSL VPN gateway. |
Failure to log in to the SSL VPN gateway from a browser
Symptom
A user can open the SSL VPN Web interface from a browser but cannot log in to the SSL VPN gateway.
Solution
To resolve the issue:
1. Verify that the address of the SSL VPN gateway is reachable.
¡ If ping is allowed, ping the SSL VPN gateway address from a PC.
¡ If ping is not allowed, capture packets to verify the connectivity.
2. View SSL VPN gateway information to verify the following:
¡ Verify that the SSL VPN gateway is up. If the Operation state field displays Up, the SSL VPN gateway is up. If the SSL VPN gateway is not up, enable the SSL VPN gateway from the Web interface or execute the service enable command in SSL VPN gateway view from the CLI.
¡ Verify that the SSL-related configuration is correct. By default, the device uses its self-signed certificate. To use the CA-signed certificate, apply an SSL server policy to the SSL VPN gateway. To cancel the use of the CA-signed certificate, cancel the application of the SSL server policy for the SSL VPN gateway.
¡ Verify that the SSL server policy being used by the SSL VPN gateway is the desired one.
If the used SSL server policy's configuration is edited or another SSL server policy is configured for the SSL VPN gateway, re-enable the SSL VPN gateway to make the new configuration take effect.
To re-enable the SSL VPN gateway, execute the undo service enable command and then the service enable command.
The following is an example of the SSL VPN gateway information:
[Device] display sslvpn gateway
Gateway name: gw
Operation state: Up
IP: 1.1.1.2 Port: 2000
SSL server policy configured: sslnew
SSL server policy in use: ssl
Front VPN instance: Not configured
3. View SSL VPN context information to verify the following:
¡ Verify that the SSL VPN context is up. If the Operation state field displays Up, the SSL VPN context is up. If the SSL VPN context is not up, enable the SSL VPN context from the Web interface or execute the service enable command in SSL VPN context view from the CLI.
¡ Verify that the SSL VPN context is associated with an SSL VPN gateway. The Associated SSL VPN gateway field displays the name of the SSL VPN gateway if the SSL VPN context is associated with an SSL VPN gateway. If the SSL VPN context is not associated with an SSL VPN gateway, associate one from the Web interface, or execute the gateway command in SSL VPN context view from the CLI.
The following is an example of the SSL VPN context information:
[Device] display sslvpn context
Context name: ctx
Operation state: Up
Associated SSL VPN gateway: gw
SSL client policy configured: sslnew
SSL client policy in use: ssl
4. Verify that the SSL VPN gateway listening address and ports are correctly configured on all service modules, and the listening ports on each service module is enabled.
The following is an example of TCP proxy information:
<Device> display tcp-proxy slot 1
Local Addr:port Foreign Addr:port State Service type
1.1.1.2:2000 0.0.0.0:0 LISTEN SSLVPN
5. Verify that the SSL VPN user is configured correctly.
¡ For a local user—Verify that the local user is a network access user, the service type for the user is SSL VPN, the user is authorized to access a resource group, and the resource group is well configured.
¡ For a remote user—Verify that the user's user group on the remote authentication server is configured in the SSL VPN context as a resource group. The user group and the resource group must use the same name.
6. If certificate authentication is enabled on the server and client, make sure certificates are installed correctly on the server and client.
Related commands
|
Command |
Description |
|
display tcp-proxy |
Displays brief information about TCP proxy. |
|
display sslvpn context |
Displays SSL VPN context information. |
|
display sslvpn gateway |
Displays SSL VPN gateway information. |
Failure to access internal resources from a browser
Symptom
A user cannot access internal resources after logging in to the SSL VPN gateway successfully from a browser.
Solution
To resolve the issue:
1. Verify that the access resources are configured in one of the following methods:
¡ Configure a resource list. For example:
# Create a URL item named urlitem and specify the resource URL in the URL item.
[Device-sslvpn-context-ctxweb1] url-item urlitem
[Device-sslvpn-context-ctxweb1-url-item-urlitem] url http://20.2.2.2
[Device-sslvpn-context-ctxweb1-url-item-urlitem] quit
# Create a URL list named urllist in SSL VPN context ctxweb1.
[Device-sslvpn-context-ctxweb1] url-list urllist
# Configure the heading as web for the URL list.
[Device-sslvpn-context-ctxweb1-url-list-urllist] heading web
# Assign URL item urlitem to URL list urllist.
[Device-sslvpn-context-ctxweb1-url-list-urllist] resources url-item urlitem
[Device-sslvpn-context-ctxweb1-url-list-urllist] quit
# Create an SSL VPN policy group named resourcegrp1 for SSL VPN context ctxweb1, and then add URL list urllist to the policy group for Web access.
[Device-sslvpn-context-ctxweb1] policy-group resourcegrp1
[Device-sslvpn-context-ctxweb1-policy-group-resourcegrp1] resources url-list urllist
[Device-sslvpn-context-ctxweb1-policy-group-resourcegrp1] quit
¡ Configure an ACL or a URI ACL to permit access to the internal servers, and then specify the ACL for SSL VPN Web access. For example:
[Device-sslvpn-context-ctxweb1] policy-group resourcegrp1
[Device-sslvpn-context-ctxweb1-policy-group-resourcegrp1] filter web-access acl 3000
2. Verify that the SSL VPN gateway can ping the internal resources successfully. Add routes to reach the peer devices if needed.
3. View SSL VPN gateway information to verify the following:
¡ Verify that the SSL VPN gateway is up. If the Operation state field displays Up, the SSL VPN gateway is up. If the SSL VPN gateway is not up, enable the SSL VPN gateway from the Web interface or execute the service enable command in SSL VPN gateway view from the CLI.
¡ Verify that the SSL-related configuration is correct. By default, the device uses its self-signed certificate. To use the CA-signed certificate, apply an SSL server policy to the SSL VPN gateway. To cancel the use of the CA-signed certificate, cancel the application of the SSL server policy for the SSL VPN gateway.
¡ Verify that the SSL server policy being used by the SSL VPN gateway is the desired one.
If the used SSL server policy's configuration is edited or another SSL server policy is configured for the SSL VPN gateway, re-enable the SSL VPN gateway to make the new configuration take effect.
To re-enable the SSL VPN gateway, execute the undo service enable command and then the service enable command.
The following is an example of the SSL VPN gateway information:
[Device] display sslvpn gateway
Gateway name: gw
Operation state: Up
IP: 1.1.1.2 Port: 2000
SSL server policy configured: sslnew
SSL server policy in use: ssl
Front VPN instance: Not configured
4. View SSL VPN context information to verify the following:
¡ Verify that the SSL VPN context is up. If the Operation state field displays Up, the SSL VPN context is up. If the SSL VPN context is not up, enable the SSL VPN context from the Web interface or execute the service enable command in SSL VPN context view from the CLI.
¡ Verify that the SSL VPN context is associated with an SSL VPN gateway. The Associated SSL VPN gateway field displays the name of the SSL VPN gateway if the SSL VPN context is associated with an SSL VPN gateway. If the SSL VPN context is not associated with an SSL VPN gateway, associate one from the Web interface, or execute the gateway command in SSL VPN context view from the CLI.
The following is an example of the SSL VPN context information:
[Device] display sslvpn context
Context name: ctx
Operation state: Up
Associated SSL VPN gateway: gw
SSL client policy configured: sslnew
SSL client policy in use: ssl
5. Verify that both the uplinks and downlinks operate correctly. An uplink or downlink error might occur in one of the following situations:
¡ The routes to the internal resources are not configured on the SSL VPN gateway. You can check the routing table on the device for route configuration.
¡ The internal servers do not have routes to reach the SSL VPN gateway.
¡ An address conflict occurs.
¡ An improper policy-based routing (PBR) is configured.
¡ Improper SSL VPN load balancing is configured.
¡ The device operates in dual-active mode.
To resolve this issue, change the dual-active mode to the active/standby mode, and the uplink and downlink interfaces to redundant interfaces.
Related commands
|
Command |
Description |
|
url-item |
Creates a URL item and enters its view, or enters the view of an existing URL item. |
|
url-list |
Creates a URL list and enters its view, or enters the view of an existing URL list. |
|
url |
Specifies a URL in a URL item. |
|
heading |
Configures a heading for a URL list. |
|
resources url-item |
Assigns a URL item to a URL list. |
|
policy-group |
Creates an SSL VPN policy group and enters its view, or enters the view of an existing SSL VPN policy group. |
|
resources url-list |
Assigns a URL list to an SSL VPN policy group. |
|
filter web-access acl |
Specifies an advanced ACL for Web access filtering. |
|
display sslvpn context |
Displays SSL VPN context information. |
|
display sslvpn gateway |
Displays SSL VPN gateway information. |
Failure to obtain SSL VPN gateway information from an iNode client
Symptom
A user cannot access the SSL VPN Web interface by entering the address of the SSL VPN gateway in a browser. Or, an iNode client fails to obtain the SSL VPN gateway information after the gateway address is entered.
Solution
To resolve the issue:
1. Verify that the address of the SSL VPN gateway is reachable.
¡ If ping is allowed, ping the SSL VPN gateway address from a PC.
¡ If ping is not allowed, capture packets to verify the connectivity.
2. View SSL VPN gateway information to verify the following:
¡ Verify that the SSL VPN gateway is up. If the Operation state field displays Up, the SSL VPN gateway is up. If the SSL VPN gateway is not up, enable the SSL VPN gateway from the Web interface or execute the service enable command in SSL VPN gateway view from the CLI.
¡ Verify that the SSL-related configuration is correct. By default, the device uses its self-signed certificate. To use the CA-signed certificate, apply an SSL server policy to the SSL VPN gateway. To cancel the use of the CA-signed certificate, cancel the application of the SSL server policy for the SSL VPN gateway.
¡ Verify that the SSL server policy being used by the SSL VPN gateway is the desired one.
If the used SSL server policy's configuration is edited or another SSL server policy is configured for the SSL VPN gateway, re-enable the SSL VPN gateway to make the new configuration take effect.
To re-enable the SSL VPN gateway, execute the undo service enable command and then the service enable command.
The following is an example of the SSL VPN gateway information:
[Device] display sslvpn gateway
Gateway name: gw
Operation state: Up
IP: 1.1.1.2 Port: 2000
SSL server policy configured: sslnew
SSL server policy in use: ssl
Front VPN instance: Not configured
3. View SSL VPN context information to verify the following:
¡ Verify that the SSL VPN context is up. If the Operation state field displays Up, the SSL VPN context is up. If the SSL VPN context is not up, enable the SSL VPN context from the Web interface or execute the service enable command in SSL VPN context view from the CLI.
¡ Verify that the SSL VPN context is associated with an SSL VPN gateway. The Associated SSL VPN gateway field displays the name of the SSL VPN gateway if the SSL VPN context is associated with an SSL VPN gateway. If the SSL VPN context is not associated with an SSL VPN gateway, associate one from the Web interface, or execute the gateway command in SSL VPN context view from the CLI.
The following is an example of the SSL VPN context information:
[Device] display sslvpn context
Context name: ctx
Operation state: Up
Associated SSL VPN gateway: gw
SSL client policy configured: sslnew
SSL client policy in use: ssl
4. Verify that the SSL VPN gateway listening address and ports are correctly configured on all service modules, and the listening ports on each service module is enabled.
The following is an example of TCP proxy information:
<Device> dis tcp-proxy slot 1
Local Addr:port Foreign Addr:port State Service type
1.1.1.2:2000 0.0.0.0:0 LISTEN SSLVPN
Related commands
|
Command |
Description |
|
display tcp-proxy |
Displays brief information about TCP proxy. |
|
display sslvpn context |
Displays SSL VPN context information. |
|
display sslvpn gateway |
Displays SSL VPN gateway information. |
Failure to log in to the SSL VPN gateway from an iNode client
Symptom
An iNode client obtains the SSL VPN gateway information successfully, but SSL VPN login fails.
Solution
To resolve the issue:
1. Verify that the address of the SSL VPN gateway is reachable.
¡ If ping is allowed, ping the SSL VPN gateway address from a PC.
¡ If ping is not allowed, capture packets to verify the connectivity.
2. View SSL VPN gateway information to verify the following:
¡ Verify that the SSL VPN gateway is up. If the Operation state field displays Up, the SSL VPN gateway is up. If the SSL VPN gateway is not up, enable the SSL VPN gateway from the Web interface or execute the service enable command in SSL VPN gateway view from the CLI.
¡ Verify that the SSL-related configuration is correct. By default, the device uses its self-signed certificate. To use the CA-signed certificate, apply an SSL server policy to the SSL VPN gateway. To cancel the use of the CA-signed certificate, cancel the application of the SSL server policy for the SSL VPN gateway.
¡ Verify that the SSL server policy being used by the SSL VPN gateway is the desired one.
If the used SSL server policy's configuration is edited or another SSL server policy is configured for the SSL VPN gateway, re-enable the SSL VPN gateway to make the new configuration take effect.
To re-enable the SSL VPN gateway, execute the undo service enable command and then the service enable command.
The following is an example of the SSL VPN gateway information:
[Device] display sslvpn gateway
Gateway name: gw
Operation state: Up
IP: 1.1.1.2 Port: 2000
SSL server policy configured: sslnew
SSL server policy in use: ssl
Front VPN instance: Not configured
3. View SSL VPN context information to verify the following:
¡ Verify that the SSL VPN context is up. If the Operation state field displays Up, the SSL VPN context is up. If the SSL VPN context is not up, enable the SSL VPN context from the Web interface or execute the service enable command in SSL VPN context view from the CLI.
¡ Verify that the SSL VPN context is associated with an SSL VPN gateway. The Associated SSL VPN gateway field displays the name of the SSL VPN gateway if the SSL VPN context is associated with an SSL VPN gateway. If the SSL VPN context is not associated with an SSL VPN gateway, associate one from the Web interface, or execute the gateway command in SSL VPN context view from the CLI.
The following is an example of the SSL VPN context information:
[Device] display sslvpn context
Context name: ctx
Operation state: Up
Associated SSL VPN gateway: gw
SSL client policy configured: sslnew
SSL client policy in use: ssl
4. Verify that the SSL VPN gateway listening address and ports are correctly configured on all service modules, and the listening ports on each service module is enabled.
The following is an example of TCP proxy information:
<Device> display tcp-proxy slot 1
Local Addr:port Foreign Addr:port State Service type
1.1.1.2:2000 0.0.0.0:0 LISTEN SSLVPN
5. Verify that an SSL VPN AC interface is created, an IP address is configured for the interface, and the interface is specified in the SSL VPN context for the user.
The following is an example of SSL VPN AC interface configuration:
[Device] interface SSLVPN-AC 1
[Device-SSLVPN-AC1] ip address 1.1.1.1 24
[Device-SSLVPN-AC1] quit
[Device] sslvpn context ctx
[Device-sslvpn-context-ctx] ip-tunnel interface SSLVPN-AC 1
[Device-sslvpn-context-ctx] quit
[Device] display interface SSLVPN-AC 1 brief
Brief information on interfaces in route mode:
Link: ADM - administratively down; Stby - standby
Protocol: (s) - spoofing
Interface Link Protocol Primary IP Description
SSLVPN-AC1 UP UP 1.1.1.1
6. Verify that an address pool is configured, and is specified for the SSL VPN context or the authorization resource group for the user. The address pool cannot contain the address of the SSL VPN gateway.
The following is an example of address pool configuration and application:
[Device] sslvpn ip address-pool name 1.1.1.1 1.1.1.10
[Device] sslvpn context ctx
[Device-sslvpn-context-ctx] ip-tunnel address-pool name mask 24
7. Verify that the SSL VPN user is configured correctly.
¡ For a local user—Verify that the local user is a network access user, the service type for the user is SSL VPN, the user is authorized to access a resource group, and the resource group is well configured.
¡ For a remote user—Verify that the user's user group on the remote authentication server is configured in the SSL VPN context as a resource group. The user group and the resource group must use the same name.
8. If certificate authentication is enabled on the server and client, make sure certificates are installed correctly on the server and client.
9. Verify that the iNode client is of the latest version.
Related commands
|
Command |
Description |
|
display tcp-proxy |
Displays brief information about TCP proxy. |
|
display sslvpn context |
Displays SSL VPN context information. |
|
display sslvpn gateway |
Displays SSL VPN gateway information. |
|
sslvpn ip address-pool |
Creates an IPv4 address pool. |
|
ip-tunnel address-pool |
Specifies an IPv4 address pool for IP access. |
Failure to access internal resources from an iNode client
Symptom
A user cannot access internal resources after logging in to the SSL VPN gateway successfully from an iNode client.
Solution
To resolve the issue:
1. Verify that an SSL VPN AC interface is added to a security zone and is permitted by security policies.
2. Verify that the IP address of the VNIC assigned to the iNode client is added to a security zone and is permitted by security policies.
3. Configure an ACL or a URI ACL to permit access to the internal servers, and then specify the ACL for SSL VPN Web access. For example:
[Device-sslvpn-context-ctxip1] policy-group resourcegrp1
[Device-sslvpn-context-ctxip1-policy-group-resourcegrp1] filter web-access acl 3000
4. Verify that the SSL VPN gateway can ping the internal resources successfully. Add routes to reach the peer devices if needed.
5. Verify that the iNode client is of the latest version.
6. Verify that both the uplinks and downlinks operate correctly. An uplink or downlink error might occur in one of the following situations:
¡ The routes to the internal resources are not configured on the SSL VPN gateway. You can check the routing table on the device for route configuration.
¡ The internal servers do not have routes to reach the SSL VPN gateway.
¡ The device operates in dual-active mode.
¡ To resolve this issue, change the dual-active mode to the active/standby mode, and the uplink and downlink interfaces to redundant interfaces.
¡ An address conflict occurs.
¡ An improper policy-based routing (PBR) is configured.
¡ Improper SSL VPN load balancing is configured.
Related commands
|
Command |
Description |
|
policy-group |
Creates an SSL VPN policy group and enters its view, or enters the view of an existing SSL VPN policy group. |
|
filter web-access acl |
Specifies an advanced ACL for Web access filtering. |
Failure to terminate idle SSL VPN sessions of iNode client users
Symptom
The SSL VPN sessions of iNode client users do not age out even if they are idle for a long time, consuming license resources.
Solution
An iNode client periodically sends keepalive messages so the SSL VPN sessions of the iNode client users do not age out. You can configure the idle-cut feature to force users who do not access internal resources to go offline.
The idle-cut feature sets the idle-cut traffic threshold for SSL VPN sessions. SSL VPN sessions that generate traffic less than the specified threshold within the idle timeout time are terminated. The following example sets the idle-cut traffic threshold to 1000 Kilobytes:
<Device> system-view
[Device] sslvpn context ctx1
[Device-sslvpn-context-ctx1] idle-cut traffic-threshold 1000
Related commands
|
Command |
Description |
|
sslvpn context |
Creates an SSL VPN context and enters its view, or enters the view of an existing SSL VPN context. |
|
idle-cut traffic-threshold |
Sets the SSL VPN session idle-cut traffic threshold. |
User filtering, monitoring, and IP binding settings not take effect
Symptom
The ACL filtering, monitoring, and IP binding configuration in local user view for an SSL VPN user does not take effect.
Solution
To resolve the issue, configure these settings in SSL VPN context view instead of in local user view. This is because that some SSL VPN user management settings can only be configured in SSL VPN context view.
Related commands
|
Command |
Description |
|
sslvpn context |
Creates an SSL VPN context and enters its view, or enters the view of an existing SSL VPN context. |
Failure to relog in to the SSL VPN gateway
Symptom
A user fails to relog in to the SSL VPN gateway after previous successful logins.
Solution
To resolve the issue:
1. Check whether a limit is set to the number of concurrent logins for each account. In this example, the maximum number is set to 1.
[Device] sslvpn context ctx
[Device-sslvpn-context-ctx] max-onlines 1
2. You can remove the configuration of the max-onlines command if no such limit is needed. If the limit is set and you do not want to remove it, you can enable the force logout feature. When a login is attempted but logins using the account reach the maximum, this feature logs out the user with the longest idle time to allow the new login.
To configure the force logout feature, execute the following commands:
[Device] sslvpn context ctx
[Device-sslvpn-context-ctx] force-logout max-onlines enable
Related commands
|
Command |
Description |
|
sslvpn context |
Creates an SSL VPN context and enters its view, or enters the view of an existing SSL VPN context. |
|
force-logout max-onlines enable |
Enables the force logout feature. |
Failure to configure WeChat Work (or WeCom) authentication
Symptom
A user failed to access resources from the WeChat Work (or WeCom) client after WeChat Work authentication is configured.
Solution
1. Verify that the device is configured with a DNS server.
2. Verify that a trusted SSL certificate is installed.
3. Verify that the SSL VPN context enabled with WeChat Work authentication is associated to an SSL VPN gateway exclusively. For example:
[H3C]sslvpn context ctx
#
[H3C-sslvpn-context-ctx]display this
sslvpn context ctx
gateway gw domain sslvpn
4. Verify that the parameters in the SSL VPN context are configured correctly, including the API server address, company ID, app secret key, authorization policy group field name, and policy group name. If the authorization policy group is specified, the group name must be the same as the ID of the organization to which users belong on the WeChat Work management platform. If the authorization policy group is not specified, a default policy group must be configured.
[H3C]sslvpn context ctx
[H3C-sslvpn-context-ctx]display this
#
sslvpn context ctx
gateway gw domain sslvpn
wechat-work-authentication enable
wechat-work-authentication url https://qyapi.weixin.qq.com
wechat-work-authentication corp-id ww918e2ea10664acd3
wechat-work-authentication app-secret agZO0L15DmOBw-BBx9s5UmOForvCx-WEtKQWqfBQy
Ts
wechat-work-authentication authorize-field department
wechat-work-authentication open-platform-url user-defined https://open.weixin.qq.com
5. Log in to the WeChat Work management platform and verify that the redirect link to the SSL VPN gateway on the WeChat open platform is configured correctly.
Related commands
|
Command |
Description |
|
sslvpn context |
Creates an SSL VPN context and enters its view, or enters the view of an existing SSL VPN context. |
|
gateway |
Associates an SSL VPN context with an SSL VPN gateway. |
|
wechat-work-authentication enable |
Enables WeChat Work authentication. |
|
wechat-work-authentication url |
Specifies the URL of the WeChat Work API server. |
|
wechat-work-authentication corp-id |
Specifies the company ID for WeChat Work authentication. |
|
wechat-work-authentication app-secret |
Specifies the app secret key for WeChat Work authentication. |
|
wechat-work-authentication authorize-field |
Specifies the name of the authorization policy group field. |
|
wechat-work-authentication open-platform-url |
Specifies the WeChat open platform URL. |
Troubleshooting DPI
IPS or anti-virus mistakenly intercepts legal traffic
Symptom
IPS or anti-virus is configured on the firewall to protect users on the LAN against attacks. A user in the LAN fails to access the Internet and the firewall reports an IPS attack log or anti-virus attack log.
Figure 25 Network diagram

Settings on the firewall:
#
app-profile 0_IPv4
ips apply policy default mode protect
anti-virus apply policy default mode protect
#
security-policy ip
rule 0 name ips
action pass
profile 0_IPv4
#
Solution
To resolve the issue:
1. Verify that the source IP address in the IPS attack log or anti-virus attack log is the IP address of the user and the destination IP address is the IP address of the server. If yes, record the attack ID in the IPS attack log or anti-virus attack log.
2. If IPS mistakenly intercepts legal traffic, perform the following actions:
a. Create an IPS policy.
b. Disable the IPS signature that the traffic matches, or set the actions to permit and logging for the IPS signature.
c. Specify the IPS policy in the security policy applied to the firewall.
3. If anti-virus mistakenly intercepts legal traffic, perform the following actions:
a. Create an anti-virus policy.
b. Disable the virus signature that the traffic matches, or set the actions to permit and logging for the virus signature.
c. Specify the anti-virus policy in the security policy applied to the firewall.
4. Capture packets that the host sends to the server to identify whether the IPS or anti-virus attack log was mistakenly generated.
¡ If yes, modify the IPS or virus signature.
¡ If not, configure the firewall to permit traffic from the user that matches the IPS or virus signature.
Related commands
|
Command |
Description |
|
ips policy policy-name |
Creates an IPS policy and enters its view, or enters the view of an existing IPS policy. By default, an IPS policy named default exists. You cannot edit or delete the default IPS policy. |
|
signature override { pre-defined | user-defined } signature-id { { disable | enable } [ { block-source | drop | permit | redirect | reset } | capture | logging ] * } |
Changes the status and actions for an IPS signature in an IPS policy. By default, predefined IPS signatures use the actions and states defined by the system. User-defined IPS signatures use the actions and states defined in the IPS signature file from which the signatures are imported. The signature actions and status in the default IPS policy cannot be modified. |
|
anti-virus policy policy-name |
Creates an anti-virus policy and enters its view, or enters the view of an existing anti-virus policy. By default, an anti-virus policy named default exists. You cannot edit or delete the default anti-virus policy. |
|
exception signature signature-id |
Sets a signature as a signature exception. |
IPS or WAF fails to intercept attack traffic or generate attack logs
Symptom
IPS or WAF is configured on the firewall to protect users on the LAN against attacks. However, an attacker can successfully launch an attack (such as cross-site script attack or brute force attack) from the Internet to the internal target server and crack the password of the server. The firewall does not generate an attack log.
Figure 26 Network diagram

Settings on the firewall:
#
app-profile 0_IPv4
ips apply policy default mode protect
waf apply policy default mode protect
#
security-policy ip
rule 0 name ips
action pass
profile 0_IPv4
#
Solution
To resolve the issue:
1. Verify that the firewall has installed with the license for IPS or WAF.
2. Verify that DPI is operating correctly on the device.
[H3C] display inspect status
Chassis 0 Slot 1:
Running status: normal
3. Verify that the firewall uses the most up-to-date IPS signature library or most up-to-date WAF signature library.
<H3C> display ips signature library
IPS signature library information:
Type SigVersion ReleaseTime Size
Current 1.0.81 Thu Oct 31 08:35:05 2019 4639264
Last 1.0.80 Sat Oct 12 07:58:23 2019 4565664
Factory 1.0.0 Fri Dec 28 06:27:33 2018 76496
<H3C>display waf signature library
WAF signature library information:
Type SigVersion ReleaseTime Size(bytes)
Current 1.0.2 Thu Oct 31 03:22:10 2019 1018752
Last 1.0.0 Fri Dec 28 08:53:30 2018 19824
Factory 1.0.0 Fri Dec 28 08:53:30 2018 19824
4. Verify that IPS policy settings or WAF policy settings have been activated. You can activate the IPS policy settings or WAF policy settings from the CLI (by using the inspect activate command) or from the Web interface.
[H3C-probe] display system internal inspect dim-rule
Slot 1:
MdcID MoudleName Total MD5 rules
0 Anti-Virus 0
MdcID RuleID ModuleName L4ProName uiAppIdL5
0 1 IPS TCP HTTP
0 2147483649 FFILTER TCP
0 2 IPS TCP HTTP
0 2147483650 FFILTER TCP
0 2147483651 FFILTER TCP
0 4 IPS TCP HTTP
0 2147483652 FFILTER TCP
0 5 IPS TCP HTTP
[H3C-probe]display system internal inspect dim-rule | include WAF
0 1 WAF TCP HTTP
0 16 WAF TCP HTTP
0 37 WAF TCP HTTP
0 38 WAF TCP HTTP
0 43 WAF TCP HTTP
5. Verify that a session that meets the following requirements has been established between the host and the server:
¡ The source IP address and destination IP address are in the specified security zone.
¡ DPI with the IPS policy or WAF policy specified is enabled in the security zone.
# Display information about the IPv4 unicast session initiated by the host.
[H3C] display session table ipv4 source-ip 1.1.1.101 verbose
Slot 1:
Initiator:
Source IP/port: 1.1.1.101/34679
Destination IP/port: 2.2.2.12/5190
DS-Lite tunnel peer: -
VPN instance/VLAN ID/Inline ID: -/-/-
Protocol: TCP(6)
Inbound interface: GigabitEthernet1/0/10
Source security zone: Trust
Responder:
Source IP/port: 2.2.2.12/5190
Destination IP/port: 1.1.1.101/34679
DS-Lite tunnel peer: -
VPN instance/VLAN ID/Inline ID: -/-/-
Protocol: TCP(6)
Inbound interface: GigabitEthernet1/0/11
Source security zone: Untrust
State: TCP_ESTABLISHED
Application: AOL
Start time: 2016-01-21 16:13:16 TTL: 1194s
Initiator->Responder: 3 packets 930 bytes
Responder->Initiator: 1 packets 92 bytes
Total sessions found: 1
# Display the match statistics for DPI engine inspection rules.
[H3C-probe]display system internal inspect hit-statistics
Slot 1:
Rule ID Module Rule hits AC hits PCRE try PCRE hits
5041 APR 0 3 0 0
5126 APR 0 9 0 0
5127 APR 0 9 0 0
8584 IPS 1 2 0 0
9410 APR 0 1 0 0
21768 IPS 0 2 0 0
21852 IPS 1 2 0 0
22114 IPS 0 2 0 0
22406 IPS 1 1 0 0
23089 IPS 2 2 4 2
23213 IPS 0 4 2 2
23271 IPS 0 2 1 0
23341 IPS 1 2 1 1
23722 IPS 2 8 2 2
23804 IPS 0 1 0 0
18096 WAF 0 4 2 0
23311 WAF 1 14 1 1
23791 WAF 0 2 1 0
23915 WAF 0 8 4 0
6. Verify that the IPS signature or WAF signature that the traffic hits has been enabled and actions have been specified for the signature.
¡ You can use the signature override pre-defined 8 enable reset logging command to enable the IPS signature and specify actions for the signature.
¡ You can use the signature override pre-defined pre-defined 56 enable reset logging command to enable a predefined WAF signature and specify actions for the signature.
[H3C]display ips signature pre-defined 8
Type : Pre-defined
Signature ID: 8
Status : Disable
Action : Permit & Logging
Name : (MS11-015)DVR-MS_Vulnerability
Protocol : TCP
Severity : Critical
Fidelity : Medium
Direction : To-client
Category : Vulnerability
Reference : CVE-2011-0042;MS11-015;
[H3C]display waf signature pre-defined 56
Type : Pre-defined
Signature ID: 56
Status : Disable
Action : Permit & Logging
Name : CVE-2012-3351_LongTail_JW_Player_XSS_Vulnerability
Protocol : TCP
Severity : Medium
Fidelity : Medium
Direction : To-server
Category : Vulnerability
Reference : CVE-2012-3351;
7. If the issue persists, it might indicate that the IPS signature library or WAF signature library does not support this attack. In this case, capture the attack packets and contact H3C Support.
Related commands
|
Command |
Description |
|
ips policy policy-name |
Creates an IPS policy and enters its view, or enters the view of an existing IPS policy. By default, an IPS policy named default exists. You cannot edit or delete the default IPS policy. |
|
waf policy policy-name |
Creates a WAF policy and enters its view, or enter the view of an existing WAF policy. By default, a WAF policy named default exists. You cannot edit or delete the default WAF policy. |
|
signature override { pre-defined | user-defined } signature-id { { disable | enable } [ { block-source | drop | permit | redirect | reset } | capture | logging ] * } |
Changes the status and actions for an IPS or WAF signature in an IPS or WAF policy. By default, predefined IPS or WAF signatures use the actions and states defined by the system. User-defined IPS or WAF signatures use the actions and states defined in the IPS or WAF signature file from which the signatures are imported. The signature actions and status in the default IPS or WAF policy cannot be modified. |
|
inspect activate |
Activates the policy and rule configurations for DPI service modules. By default, the creation, modification, and deletion of DPI service policies and rules do not take effect. |
|
display system internal inspect hit-statistics [ module-id ] [ rule-id ] [ slot slot-number [ cpu cpu-number ] ] |
Displays the match statistics for DPI engine inspection rules. |
|
display inspect status |
Displays the status of the DPI engine. |
Application rate limit does not take effect
Symptom
Bandwidth management is configured on the firewall to limit the downstream traffic rate of Thunder, but the downstream traffic rate of Thunder is not correctly limited.
Figure 27 Network diagram

Settings on the firewall:
traffic-policy
rule 1 name Thunder
action qos profile Thunder_20M
source-zone Trust
destination-zone Untrust
application app-group 1
profile name thunder_20m
bandwidth downstream maximum 20000
bandwidth upstream maximum
Solution
To resolve the issue:
1. Verify that the firewall uses the most up-to-date APR signature library. To install the most up-to-date APR signature library, access the company's website and download the signature file.
2. Verify that the DPI engine is enabled. You can use the undo inspect bypass command to enable the DPI engine.
3. Verify that the application audit and management policy settings have been activated. You can use the inspect activate command to activate application audit and management policy settings.
[H3C-probe] display system internal inspect dim-rule
Slot 1:
MdcID MoudleName Total MD5 rules
0 Anti-Virus 0
MdcID RuleID ModuleName L4ProName uiAppIdL5
1 1 AUDIT TCP WECHAT_LOGIN_IOS
_TCP_M
0 1 IPS TCP HTTP
0 2147483649 FFILTER TCP
1 2 AUDIT TCP WECHAT_LOGIN_AND
ROID_TCP_M
0 2 IPS TCP HTTP
0 2147483650 FFILTER TCP
1 3 AUDIT TCP WECHAT_SENDTEXT_
WINDOWS_TCP_M
0 2147483651 FFILTER TCP
1 4 AUDIT TCP WECHAT_SENDTEXT_
IOS_TCP_M
0 4 IPS TCP HTTP
4. Verify that the application audit and management policy has been enabled and the traffic can be processed based on the policy rule. You can use the rule move Thunder before b command to move the traffic rule to a new position to ensure that the firewall uses the policy rule to process the downstream traffic of Thunder.
5. Verify that application signatures in the session are added to user-defined application groups and the application group has been applied with the traffic policy.
<H3C> display session table ipv4 verbose
Slot 1:
Initiator:
Source IP/port: 1.1.1.195/51353
Destination IP/port: 2.2.2.51/59287
DS-Lite tunnel peer: -
VPN instance/VLAN ID/Inline ID: -/-/-
Protocol: TCP(6)
Inbound interface: GigabitEthernet1/0/10
Source security zone: Trust
Responder:
Source IP/port: 2.2.2.51/59287
Destination IP/port: 1.1.1.195/51353
DS-Lite tunnel peer: -
VPN instance/VLAN ID/Inline ID: -/-/-
Protocol: TCP(6)
Inbound interface: GigabitEthernet1/0/11
Source security zone: Untrust
State: TCP_SYN_RECV
Application: GENERAL_TCP
Start time: 2016-01-21 17:51:44 TTL: 951s
Initiator->Responder: 1 packets 56 bytes
Responder->Initiator: 1 packets 56 bytes
If most applications in the session are GENERAL_TCP or GENERAL_UDP, it indicates that new signatures are required to be defined for Thunder. In this case, contact H3C Support.
Related commands
|
Command |
Description |
|
traffic-policy |
Enters traffic policy view. |
|
rule move rule-name1 { after | before } rule-name2 |
Moves a traffic rule to a new position. |
|
display traffic-policy statistics bandwidth { downstream | total | upstream } { per-ip { ipv4 [ ipv4-address ] | ipv6 [ ipv6-address ] } rule rule-name | per-rule [ name rule-name ] | per-user [ user user-name ] rule rule-name } |
Displays traffic statistics for traffic rules. |
File filtering or data filtering does not take effect
Symptom
File filtering is configured on the firewall to block and log confidential files transferred between the LAN and the Internet. However, a user in the LAN still can upload a confidential file to the Internet, and the firewall does not generate a file filtering log.
Data filtering is configured on the firewall to ensure security of the data transferred between the LAN and the Internet. However, a user in the LAN still can upload sensitive data such as bank card numbers and ID card numbers to the Internet. No data filtering log is generated.
Figure 28 Network diagram

Settings on the firewall:
#
file-filter policy ffilter
rule ffilter
filetype-group ffilter
application all
direction both
action drop logging
#
file-filter filetype-group ffilter
pattern 0 text pe
pattern 1 text elf
pattern 10 text vsdx
pattern 11 text msg
pattern 12 text pub
pattern 13 text zip
pattern 14 text rar
pattern 15 text tar.gz
pattern 16 text tgz
pattern 2 text doc
pattern 3 text pdf
pattern 4 text xls
pattern 5 text ppt
pattern 6 text docx
pattern 7 text xlsx
pattern 8 text pptx
pattern 9 text vsd
#
data-filter keyword-group dfilter
pre-defined-pattern name bank-card-number
pre-defined-pattern name credit-card-number
pre-defined-pattern name id-card-number
pre-defined-pattern name phone-number
#
data-filter policy dfilter
rule dfilter
keyword-group dfilter
application all
direction both
action drop logging
#
app-profile 0_IPv4
file-filter apply policy ffilter
data-filter apply policy dfilter
#
security-policy ip
rule 0 name ffilter
action pass
profile 0_IPv4
#
Solution
To resolve the issue:
1. Verify that DPI is operating correctly on the device.
[H3C] display inspect status
Chassis 0 Slot 1:
Running status: normal
The normal running status indicates that DPI is correctly operating.
2. Verify that the file type group includes the type of the transferred file.
3. Verify that the used application layer protocols have been specified for file filtering rules in the file filtering policy or for data filtering rules in the data filtering policy. File filtering rules or data filtering rules can be applied to the following protocols: HTTP, FTP, SMTP, IMAP, NFS, POP3, RTMP, and SMB.
4. Verify that the file filtering policy settings or data filtering policy settings have been activated.
A file filtering rule with a 10-digit ID is a predefined file filtering rule. You can activate predefined file filtering policy settings from the CLI (by using the inspect activate command in system view) or from the Web interface.
You can activate data filtering policy settings from the CLI (by using the inspect activate command in system view) or from the Web interface.
[H3C-probe] display system internal inspect dim-rule | include FFILTER
23 FFILTER TCP HTTP
0 2147483671 FFILTER TCP
1 24 FFILTER TCP FTP
0 2147483672 FFILTER TCP
1 25 FFILTER TCP SMTP
0 2147483673 FFILTER TCP
1 26 FFILTER TCP IMAP
0 2147483674 FFILTER TCP
1 27 FFILTER TCP POP3
0 2147483675 FFILTER TCP
1 28 FFILTER TCP NFS
0 2147483676 FFILTER TCP
1 29 FFILTER TCP MICROSOFT-DS
1 30 FFILTER TCP RTMP
[H3C-probe]display system internal inspect dim-rule | include DFILTER
1 24 DFILTER TCP HTTP
1 25 DFILTER TCP FTP-DATA
1 26 DFILTER TCP SMTP
1 27 DFILTER TCP IMAP
1 28 DFILTER TCP POP3
1 29 DFILTER TCP NFS
1 30 DFILTER TCP MICROSOFT-DS
1 31 DFILTER TCP RTMP
5. Verify that a session that meets the following requirements has been established between the host and the server:
¡ The source IP address and destination IP address are in the specified security zone.
¡ DPI with the file filtering policy or data filtering policy specified is enabled in the security zone.
# Display information about the IPv4 unicast session initiated by the host.
[H3C-probe] display session table ipv4 source-ip 7.0.1.2 verbose
Slot 2:
Initiator:
Source IP/port: 7.0.1.2/50779
Destination IP/port: 7.0.0.2/80
DS-Lite tunnel peer: -
VPN instance/VLAN ID/Inline ID: -/-/-
Protocol: TCP(6)
Inbound interface: GigabitEthernet2/0/2
Source security zone: Trust
Responder:
Source IP/port: 7.0.0.2/80
Destination IP/port: 7.0.1.2/50779
DS-Lite tunnel peer: -
VPN instance/VLAN ID/Inline ID: -/-/-
Protocol: TCP(6)
Inbound interface: GigabitEthernet2/0/3
Source security zone: Untrust
State: TCP_ESTABLISHED
Application: HTTP
Rule ID: 0
Rule name: ips
Start time: 2019-11-15 11:31:01 TTL: 1197s
Initiator->Responder: 7 packets 1073 bytes
Responder->Initiator: 7 packets 2413 bytes
Total sessions found: 1
6. Display the match statistics for DPI engine inspection rules.
[H3C-probe]display system internal inspect hit-statistics
Slot 2:
Rule ID Module Rule hits AC hits PCRE try PCRE hits
2147483650 FFILTER 2 2 0 0
2147483657 FFILTER 1 1 0 0
2147483669 FFILTER 2 2 0 0
3432 APR 2 2 0 0
If only predefined file filtering rules have hit counts, the transferred files might carry false extensions. You can use the file-filter false-extension action drop command to set the drop action for such files, and then observe whether the firewall can block and log the files.
7. If the issue persists, it might indicate that the firewall does not support the encoding format of the files. In this case, capture the packets exchanged between the host and the firewall and then contact H3C Support.
Related commands
|
Command |
Description |
|
file-filter policy policy-name |
Creates a file filtering policy and enters its view, or enters the view of an existing file filtering policy. By default, a file filtering policy named default exists. You cannot edit or delete the default file filtering policy. |
|
filetype-group group-name |
Applies a file type group to a file filtering rule. By default, a file filtering rule contains a file type group named default. |
|
inspect activate |
Activates the policy and rule configurations for DPI service modules. By default, the creation, modification, and deletion of DPI service policies and rules do not take effect. |
|
display system internal inspect hit-statistics [ module-id ] [ rule-id ] [ slot slot-number [ cpu cpu-number ] ] |
Displays the match statistics for DPI engine inspection rules. |
|
display inspect status |
Displays the status of the DPI engine. |
|
file-filter false-extension action { drop | permit } |
Sets the action for packets with files carrying false extensions. |
|
data-filter apply policy policy-name |
Applies a data filtering policy to a DPI application profile. By default, no data filtering policy is applied to a DPI application profile. |
|
data-filter keyword-group keywordgroup-name |
Creates a keyword group and enters its view, or enters the view of an existing keyword group. |
SSL decryption does not take effect
Symptom
An SSL-decryption proxy policy and IPS are configured on the firewall to provide secure HTTPS transport for users on the LAN and Internet. However, an attacker can successfully launch an encrypted HTTPS attack (such as cross-site script attack and brute force attack) from the Internet and crack the password of the target server. IPS on the firewall does not intercept the attack or generate an attack log. The SSL decryption feature does not take effect.
Figure 29 Network diagram

Settings on the firewall:
#
app-proxy-policy
rule 1 name ssl-proxy
action ssl-decrypt
#
app-profile 0_IPv4
ips apply policy default mode protect
#
security-policy ip
rule 0 name ips
action pass
profile 0_IPv4
#
Solution
1. Verify that the firewall can intercept non-encrypted HTTP traffic.
If the firewall fails to intercept non-encrypted HTTP traffic, resolve the issue according to "IPS or WAF fails to intercept attack traffic or generate attack logs".
If the firewall can intercept non-encrypted HTTP traffic, proceed to the next step.
2. Verify that the firewall can implement SSL proxy.
[H3C]display app-proxy server-certificate
Slot 1:
Total server certificates: 1
Certificate info: BreakingPoint_serverA_2048.server.int
Proxy count: 6996
Most recent proxy time: 2019/11/18 10:23:48
First proxy at: 2019/11/15 17:21:12
3. Verify that the network is a Layer 3 network. In the current software version, SSL decryption is not supported on the Layer 2 network.
4. Verify that DPI is operating correctly on the device.
[H3C] display inspect status
Chassis 0 Slot 1:
Running status: normal
The normal running status indicates that DPI is correctly operating.
5. Verify that the HTTPS server is not in the user-defined SSL hostname whitelist.
[H3C] display app-proxy ssl whitelist hostname predefined
Chrome HSTS-defined hostnames:
status Hostname
enabled 2mdn.net
enabled accounts.firefox.com
enabled aclu.org
enabled activiti.alfresco.com
enabled adamkostecki.de
enabled addvocate.com
enabled adsfund.org
enabled aie.de
...
<H3C> display app-proxy ssl whitelist ip all
Slot 1:
IP address Port
--------------------------
9.9.9.5 443
9.9.9.6 443
9.9.9.7 443
9.9.9.8 443
9.9.9.9 443
9.9.9.10 443
9.9.9.11 443
9.9.9.12 443
If the HTTP server is in the whitelist, remove the hostname of the server from the user-defined SSL hostname whitelist by using the following commands:
[H3C] undo app-proxy ssl whitelist user-defined-hostname
<H3C> reset app-proxy ssl whitelist ip
[H3C] app-proxy ssl whitelist activate
6. Verify that the traffic is not forwarded across cards. SSL decryption does not support decrypting inter-card traffic.
<H3C>display session table ipv4 source-ip 7.0.1.2 verbose
Slot 1:
Initiator:
Source IP/port: 7.0.1.2/55933
Destination IP/port: 8.8.8.2/443
DS-Lite tunnel peer: -
VPN instance/VLAN ID/Inline ID: -/-/-
Protocol: TCP(6)
Inbound interface: GigabitEthernet2/0/2
Source security zone: Trust
Responder:
Source IP/port: 8.8.8.2/443
Destination IP/port: 7.0.1.2/55933
DS-Lite tunnel peer: -
VPN instance/VLAN ID/Inline ID: -/-/-
Protocol: TCP(6)
Inbound interface: Reth1
Source security zone: Trust
State: INACTIVE
Application: HTTPS
Rule ID: 0
Rule name: ips
Start time: 2019-11-18 10:59:43 TTL: 299s
Initiator->Responder: 0 packets 0 bytes
Responder->Initiator: 0 packets 0 bytes
Initiator:
Source IP/port: 7.0.1.2/55852
Destination IP/port: 8.8.8.2/80
DS-Lite tunnel peer: -
VPN instance/VLAN ID/Inline ID: -/-/-
Protocol: TCP(6)
Inbound interface: GigabitEthernet2/0/2
Source security zone: Trust
Responder:
Source IP/port: 8.8.8.2/80
Destination IP/port: 7.0.1.2/55852
DS-Lite tunnel peer: -
VPN instance/VLAN ID/Inline ID: -/-/-
Protocol: TCP(6)
Inbound interface: Reth1
Source security zone: Trust
State: INACTIVE
Application: HTTP
Rule ID: 0
Rule name: ips
Start time: 2019-11-18 10:59:02 TTL: 257s
Initiator->Responder: 0 packets 0 bytes
Responder->Initiator: 0 packets 0 bytes
Initiator:
Source IP/port: 7.0.1.2/55932
Destination IP/port: 8.8.8.2/443
DS-Lite tunnel peer: -
VPN instance/VLAN ID/Inline ID: -/-/-
Protocol: TCP(6)
Inbound interface: GigabitEthernet2/0/2
Source security zone: Trust
Responder:
Source IP/port: 8.8.8.2/443
Destination IP/port: 7.0.1.2/55932
DS-Lite tunnel peer: -
VPN instance/VLAN ID/Inline ID: -/-/-
Protocol: TCP(6)
Inbound interface: Reth1
Source security zone: Trust
State: INACTIVE
Application: HTTPS
Rule ID: 0
Rule name: ips
Start time: 2019-11-18 10:59:43 TTL: 299s
Initiator->Responder: 0 packets 0 bytes
Responder->Initiator: 0 packets 0 bytes
Total sessions found: 3
Slot 2:
Initiator:
Source IP/port: 7.0.1.2/55933
Destination IP/port: 8.8.8.2/443
DS-Lite tunnel peer: -
VPN instance/VLAN ID/Inline ID: -/-/-
Protocol: TCP(6)
Inbound interface: GigabitEthernet2/0/2
Source security zone: Trust
Responder:
Source IP/port: 8.8.8.2/443
Destination IP/port: 7.0.1.2/55933
DS-Lite tunnel peer: -
VPN instance/VLAN ID/Inline ID: -/-/-
Protocol: TCP(6)
Inbound interface: Reth1
Source security zone: Trust
State: TCP_TIME_WAIT
Application: HTTPS
Rule ID: 0
Rule name: ips
Start time: 2019-11-18 10:59:43 TTL: 0s
Initiator->Responder: 6 packets 776 bytes
Responder->Initiator: 7 packets 899 bytes
Initiator:
Source IP/port: 7.0.1.2/55852
Destination IP/port: 8.8.8.2/80
DS-Lite tunnel peer: -
VPN instance/VLAN ID/Inline ID: -/-/-
Protocol: TCP(6)
Inbound interface: GigabitEthernet2/0/2
Source security zone: Trust
Responder:
Source IP/port: 8.8.8.2/80
Destination IP/port: 7.0.1.2/55852
DS-Lite tunnel peer: -
VPN instance/VLAN ID/Inline ID: -/-/-
Protocol: TCP(6)
Inbound interface: Reth1
Source security zone: Trust
State: TCP_ESTABLISHED
Application: HTTP
Rule ID: 0
Rule name: ips
Start time: 2019-11-18 10:59:02 TTL: 1157s
Initiator->Responder: 8 packets 1256 bytes
Responder->Initiator: 9 packets 3456 bytes
Initiator:
Source IP/port: 7.0.1.2/55932
Destination IP/port: 8.8.8.2/443
DS-Lite tunnel peer: -
VPN instance/VLAN ID/Inline ID: -/-/-
Protocol: TCP(6)
Inbound interface: GigabitEthernet2/0/2
Source security zone: Trust
Responder:
Source IP/port: 8.8.8.2/443
Destination IP/port: 7.0.1.2/55932
DS-Lite tunnel peer: -
VPN instance/VLAN ID/Inline ID: -/-/-
Protocol: TCP(6)
Inbound interface: Reth1
Source security zone: Trust
State: TCP_TIME_WAIT
Application: HTTPS
Rule ID: 0
Rule name: ips
Start time: 2019-11-18 10:59:43 TTL: 1s
Initiator->Responder: 7 packets 816 bytes
Responder->Initiator: 7 packets 899 bytes
Total sessions found: 3
7. If the issue persists, it might indicate that the firewall does not support defending against this type of encryption attack. In this case, capture the packets exchanged between the host and the firewall and then contact H3C Support.
Related commands
|
Command |
Description |
|
app-proxy-policy |
Enters proxy policy view. |
|
app-proxy ssl whitelist user-defined-hostname host-name |
Adds a hostname to the user-defined SSL hostname whitelist. If the DNS Name or Common Name value in a server certificate contains a hostname on the SSL hostname whitelist, the device does not proxy the SSL connections destined for the server. |
|
display app-proxy ssl whitelist ip { all | ip-address } |
Displays the SSL IP address whitelist. |
|
display inspect status |
Displays the status of the DPI engine. |
Application audit and management does not take effect
Symptom
Application audit and management is configured on the firewall to ensure security of the data transferred between the LAN and the Internet. However, a user can successfully perform a sensitive behavior supposed to be denied by the audit policy (such as file transfer and login) and the firewall does not generate an audit log.
Figure 30 Network diagram

Settings on the firewall:
#
uapp-control
policy name default audit
rule 1 app-category IM behavior FileTransfer bhcontent any keyword include any
action deny audit-logging
#
Solution
To resolve the issue:
1. Verify that the device uses the most up-to-date APR signature library. To install the most up-to-date APR signature library, access the company's website and download the signature file.
2. Verify that the DPI engine is enabled. You can use the undo inspect bypass command to enable the DPI engine.
3. Verify that the application audit and management policy settings have been activated. You can active the application audit and management policy settings from the CLI (by using the inspect activate command in system view) or from the Web interface.
[H3C-probe] display system internal inspect dim-rule
Slot 1:
MdcID MoudleName Total MD5 rules
0 Anti-Virus 0
MdcID RuleID ModuleName L4ProName uiAppIdL5
1 1 AUDIT TCP WECHAT_LOGIN_IOS
_TCP_M
0 1 IPS TCP HTTP
0 2147483649 FFILTER TCP
1 2 AUDIT TCP WECHAT_LOGIN_AND
ROID_TCP_M
0 2 IPS TCP HTTP
0 2147483650 FFILTER TCP
1 3 AUDIT TCP WECHAT_SENDTEXT_
WINDOWS_TCP_M
0 2147483651 FFILTER TCP
1 4 AUDIT TCP WECHAT_SENDTEXT_
IOS_TCP_M
0 4 IPS TCP HTTP
4. Verify that the application audit and management policy has been enabled and the traffic can be processed based on the policy rules.
5. Verify that a session that meets the following requirements has been established between the host and the server:
¡ The source IP address and destination IP address are in the specified security zone.
¡ DPI with the application audit and management policy specified is enabled in the security zone.
[H3C-probe]display session table ipv4 source-ip 7.0.1.2 verbose
Slot 2:
Initiator:
Source IP/port: 7.0.1.2/50779
Destination IP/port: 7.0.0.2/80
DS-Lite tunnel peer: -
VPN instance/VLAN ID/Inline ID: -/-/-
Protocol: TCP(6)
Inbound interface: GigabitEthernet2/0/2
Source security zone: Trust
Responder:
Source IP/port: 7.0.0.2/80
Destination IP/port: 7.0.1.2/50779
DS-Lite tunnel peer: -
VPN instance/VLAN ID/Inline ID: -/-/-
Protocol: TCP(6)
Inbound interface: GigabitEthernet2/0/3
Source security zone: Untrust
State: TCP_ESTABLISHED
Application: HTTP
Rule ID: 0
Rule name: ips
Start time: 2019-11-15 11:31:01 TTL: 1197s
Initiator->Responder: 7 packets 1073 bytes
Responder->Initiator: 7 packets 2413 bytes
Total sessions found: 1
6. If the issue persists, it might indicate that the firewall does not support auditing this application. In this case, capture the packets exchanged between the host and the firewall and then contact H3C Support.
Related commands
|
Command |
Description |
|
inspect activate |
Activates the policy and rule configurations for DPI service modules. By default, the creation, modification, and deletion of DPI service policies and rules do not take effect. |
|
display inspect status |
Displays the status of the DPI engine. |
URL filtering does not take effect
Symptom
URL filtering is configured on the firewall to provide restricted Web access from LAN users to the Internet. However, a user can successfully visit a potentially harmful website (such as a porn website) and the firewall does not generate a URL filtering log.
Figure 31 Network diagram
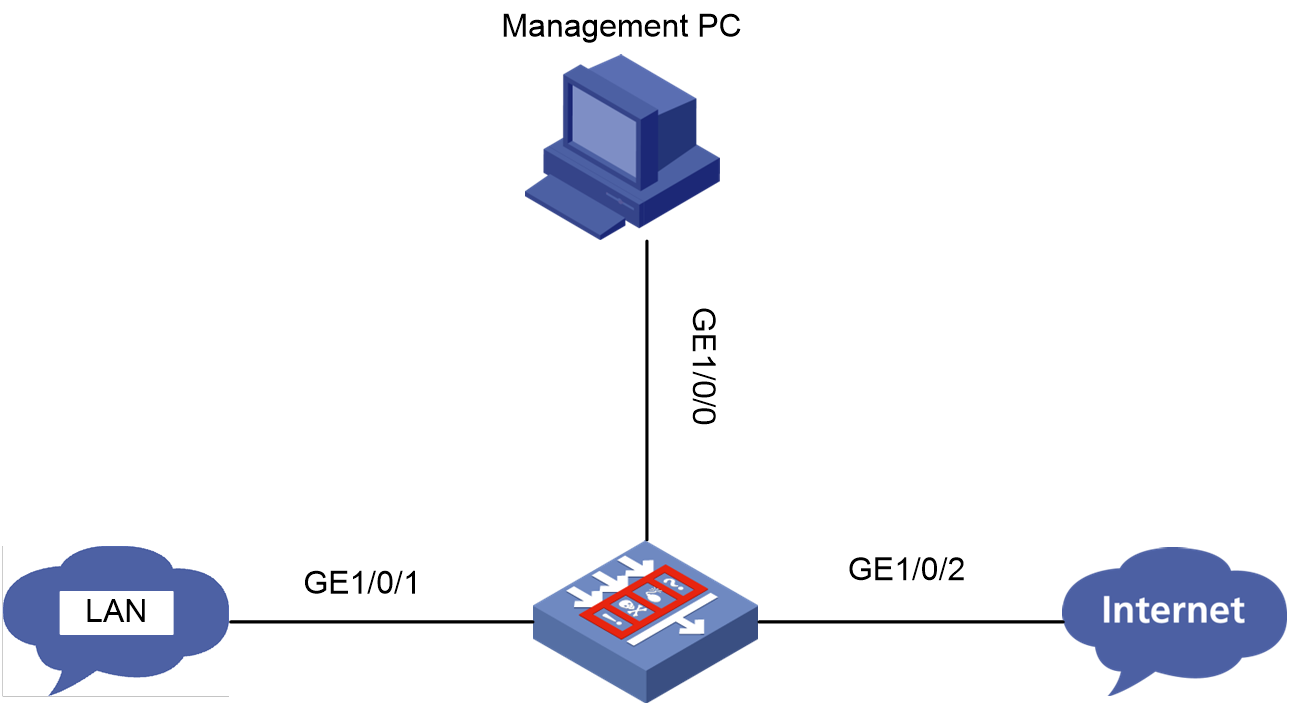
Settings on the firewall:
#
url-filter policy url
default-action permit logging
category Pre-Botnet action reset logging
category Pre-ChildAbuse action reset logging
category Pre-CriminalActivity action reset logging
category Pre-Discrimination action reset logging
category Pre-Divining action reset logging
category Pre-Drugs action reset logging
category Pre-Gamble action reset logging
category Pre-Hacking action reset logging
category Pre-IllegalSoftware action reset logging
category Pre-Lottery action reset logging
category Pre-MaliciousURL action reset logging
category Pre-Phishing action reset logging
category Pre-Pornography action reset logging
category Pre-Religion action reset logging
category Pre-SchoolCheating action reset logging
category Pre-Spam action reset logging
category Pre-Suicide action reset logging
category Pre-Violence action reset logging
#
app-profile 0_IPv4
url-filter apply policy url
#
security-policy ip
rule 0 name url
action pass
counting enable
profile 0_IPv4
#
Solution
To resolve the issue:
1. Verify that the device uses the most up-to-date URL filtering signature library. To install the most up-to-date URL filtering signature library, access the company's website and download the signature file.
2. Verify that the DPI engine is enabled. You can use the undo inspect bypass command to enable the DPI engine.
3. Verify that the visited webpage is an HTTPS encrypted webpage. If yes, enable SSL decryption on the firewall.
4. Verify that the URL filtering policy settings have been activated. You can active the URL filtering policy settings from the CLI (by using the inspect activate command in system view) or from the Web interface.
[H3C-probe] display system internal inspect dim-rule
Slot 1:
MdcID MoudleName Total MD5 rules
0 Anti-Virus 0
MdcID RuleID ModuleName L4ProName uiAppIdL5
0 356581376 UFLT TCP HTTP
0 268435456 UFLT TCP HTTP
0 356646912 UFLT TCP HTTP
0 268435457 UFLT TCP HTTP
0 431030273 UFLT TCP HTTP
0 384958465 UFLT TCP HTTP
0 2147483649 FFILTER TCP
0 447873026 UFLT TCP HTTP
0 268435458 UFLT TCP HTTP
5. Verify that a session that meets the following requirements has been established between the host and the server:
¡ The source IP address and destination IP address are in the specified security zone.
¡ DPI with the URL filtering policy specified is enabled in the security zone.
[H3C-probe]display session table ipv4 source-ip 7.0.1.2 verbose
Slot 2:
Initiator:
Source IP/port: 7.0.1.2/50779
Destination IP/port: 7.0.0.2/80
DS-Lite tunnel peer: -
VPN instance/VLAN ID/Inline ID: -/-/-
Protocol: TCP(6)
Inbound interface: GigabitEthernet2/0/2
Source security zone: Trust
Responder:
Source IP/port: 7.0.0.2/80
Destination IP/port: 7.0.1.2/50779
DS-Lite tunnel peer: -
VPN instance/VLAN ID/Inline ID: -/-/-
Protocol: TCP(6)
Inbound interface: GigabitEthernet2/0/3
Source security zone: Untrust
State: TCP_ESTABLISHED
Application: HTTP
Rule ID: 0
Rule name: ips
Start time: 2019-11-15 11:31:01 TTL: 1197s
Initiator->Responder: 7 packets 1073 bytes
Responder->Initiator: 7 packets 2413 bytes
Total sessions found: 1
6. Verify that the URL that the user visits exactly matches a user-defined URL category.
7. If the issue persists, it might indicate that the website URL is not included in the URL filtering signature library. In this case, capture the packets exchanged between the host and the firewall and then contact H3C Support.
Related commands
|
Command |
Description |
|
url-filter apply policy policy-name |
Applies a URL filtering policy to a DPI application profile. By default, no URL filtering policy is applied to a DPI application profile. |
|
inspect activate |
Activates the policy and rule configurations for DPI service modules. By default, the creation, modification, and deletion of DPI service policies and rules do not take effect. |
|
display inspect status |
Displays the status of the DPI engine. |
Server connection detection does not take effect
Symptom
Server connection detection (SCD) is configured on the firewall to block and log illegal connections initiated by the protected servers. However, the firewall fails to identify and log such connections.
Figure 32 Network diagram

Settings on the firewall:
#
scd policy name default-7.0.0.2
protected-server 7.0.0.2
logging enable
policy enable
rule 1
permit-dest-ip 7.0.0.255
protocol udp port 137 to 138
#
Solution
To resolve the issue:
1. Verify that fast log output is disabled for SCD on the firewall.
Fast log output and syslog output are mutually exclusive. To output SCD logs (syslog), disable fast log output for SCD.
2. Verify that the following conditions exist:
¡ The SCD policy has been enabled and logging has been enabled for illegal connections initiated by the protected server in the policy.
¡ The source IP address of the illegal connection matches the IP address of the protected server. The destination IP addresses of the illegal connection matches the destination IP address criterion for a rule in the SCD policy.
<H3C> display scd policy
Id Name Protected server Rules Logging Policy status
1 12 1.2.2.3 1 Enabled Enabled
2 default-7.0.0.2 7.0.0.2 1 Enabled Enabled
3. Verify the traffic matching order against all the security policy rules. Make sure the firewall processes the traffic of the illegal connection based on the SCD policy rather than other policies.
4. If the issue persists, it might indicate that the firewall does not support identifying this type of traffic. In this case, capture the packets exchanged between the host and the server and then contact H3C Support.
Related commands
|
Command |
Description |
|
scd policy name policy-name |
Creates an SCD policy and enter its view, or enter the view of an existing SCD policy. |
|
display scd policy [ name policy-name ] |
Displays SCD policy information. |
IP reputation does not take effect
Symptom
IP reputation is configured on the firewall to prevent attacks initiated from IP addresses with bad reputations. However, an Internet user at an IP address on the IP reparation list can successfully communicate with a local user, and the firewall does not generate an IP-reputation log.
Figure 33 Network diagram

Settings on the firewall:
#
ip-reputation
global enable
top-hit-statistics enable
attack-category 1 action deny logging enable
attack-category 2 action deny logging disable
attack-category 3 action deny logging enable
attack-category 4 action deny logging enable
attack-category 5 action deny logging enable
attack-category 6 action deny logging enable
attack-category 7 action deny logging enable
attack-category 8 action deny logging enable
attack-category 9 action deny logging enable
attack-category 10 action deny logging enable
attack-category 11 action deny logging enable
attack-category 12 action deny logging enable
attack-category 13 action deny logging enable
attack-category 14 action deny logging enable
attack-category 15 action deny logging enable
attack-category 16 action deny logging enable
attack-category 17 action deny logging enable
attack-category 18 action deny logging enable
attack-category 19 action deny logging enable
attack-category 20 action deny logging enable
attack-category 21 action deny logging enable
attack-category 22 action deny logging enable
#
Solution
To resolve the issue:
1. Verify that the firewall has been installed with the license for IP reputation.
2. Verify that the IP address of the Internet user has not been configured as an exception IP address for IP reputation.
3. Verify that deny is specified as the action to be taken on packets matching the attack category for the IP address and logging is enabled for the attack category.
[H3C-ip-reputation] display ip-reputation attack-category
Attack id Attack name Action Logging
---------------------------------------------------
1 C&C deny enable
2 Network_Worm deny disable
3 Risk_Software deny enable
4 Malware deny enable
5 Trojan deny enable
6 Infectious_Virus deny enable
4. If the issue persists, it might indicate that the IP address of the Internet user is not included in the IP reputation library. In this case, capture the packets exchanged between the host and the server and then contact H3C Support.
Related commands
|
Command |
Description |
|
display ip-reputation attack-category |
Displays information about attack categories for IP reputation. If you do not specify actions for an attack category, the pre-defined actions are displayed. |
|
display ip-reputation exception |
Displays exception IP addresses. The command displays exception IP addresses, if any, when the IP reputation is enabled. |
Data analysis center fails to display or refresh logs
Symptom
DPI services are configured on the firewall to ensure security of the information transferred between the LAN and Internet. The data analysis center is configured to collect log data from various services for central analysis and reporting. However, the data analysis center fails to display logs generated for DPI services or fails to refresh logs.
Figure 34 Network diagram

Settings on the firewall:
#
app-profile 0_IPv4
ips apply policy default mode protect
data-filter apply policy default
url-filter apply policy default
file-filter apply policy default
anti-virus apply policy default mode protect
#
security-policy ip
rule 0 name 1
action pass
profile 0_IPv4
source-zone Trust
source-zone Untrust
destination-zone Trust
destination-zone Untrust
#
Solution
To resolve the issue:
1. Verify that DPI is operating correctly on the device.
[H3C] display inspect status
Chassis 0 Slot 1:
Running status: normal
2. Display the match statistics for DPI engine inspection rules.
[H3C-probe]display system internal inspect hit-statistics
Slot 1:
Rule ID Module Rule hits AC hits PCRE try PCRE hits
0 FFILTER 0 78225 0 0
0 DFILTER 0 545415 0 0
1 FFILTER 0 78225 0 0
1 DFILTER 0 545415 0 0
2 FFILTER 52341 78225 52341 52341
2 DFILTER 0 545415 0 0
3 FFILTER 0 78225 0 0
3 DFILTER 0 545415 0 0
4 FFILTER 25884 78225 25884 25884
4 DFILTER 0 545415 0 0
2147483652 FFILTER 359139 359139 0 0
5 FFILTER 0 78225 0 0
5 DFILTER 0 545415 0 0
2147483653 FFILTER 9 9 0 0
6 FFILTER 0 78225 0 0
6 DFILTER 0 545415 0 0
2147483654 FFILTER 207554 207554 0 0
7 FFILTER 0 78225 0 0
7 DFILTER 0 545415 0 0
2147483656 FFILTER 159715 159715 0 0
2147483657 FFILTER 985048 985048 0 0
3. Wait for a period of time to check whether the firewall generates logs.
4. Verify that the time on the firewall and the local PC are consistent. You can change the system time from the CLI (by using the clock datetime command) or from the Web interface.
<H3C> display clock
18:37:21 UTC Tue 11/26/2019
5. Verify that the firewall is enabled with session statistics collection for software fast forwarding. You can use the session statistics enable command to enable this feature. This feature must be enabled to output some types of logs such as flow log.
6. Verify that the firewall is enabled with URL filtering logging for access to resources of predefined resource types including css, gif, ico, jpg, js, png, swf, and xml. You can use the undo url-filter log except pre-defined { css | gif | ico | jpg | js | png | swf | xml } command to enable URL filtering logging for these resource types.
7. Verify that the storage time limit, storage space usage limit, and the storage limit-triggered action are set appropriately for each service. To set the settings, use the dac storage service service-type service-name limit { hold-time time-value | usage usage-value | action { delete | log-only } } command. You can restore the default settings.
8. If the issue persists, it might indicate that the ntopd process has an exception. In this case, capture the packets exchanged and then contact H3C Support.
Related commands
|
Command |
Description |
|
url-filter log except pre-defined { css | gif | ico | jpg | js | png | swf | xml } |
Disables URL filtering logging for access to resources of a predefined resource type. |
|
session statistics enable |
Enables session statistics collection for software fast forwarding. |
|
display inspect status |
Displays the status of the DPI engine. |
|
dac storage service service-type service-name limit { hold-time time-value | usage usage-value | action { delete | log-only } } |
Sets the storage time limit, storage space usage limit, or the storage limit-triggered action for a service. |