- Released At: 27-12-2022
- Page Views:
- Downloads:
- Table of Contents
- Related Documents
-
|
|
|
H3C Comware 7 SecPath M9000 Series |
|
Troubleshooting Guide |
|
|
|
Copyright © 2022 New H3C Technologies Co., Ltd. All rights reserved. No part of this manual may be reproduced or transmitted in any form or by any means without prior written consent of New H3C Technologies Co., Ltd. The information in this document is subject to change without notice. |
|
Contents
Collecting log and operating information
Collecting common log messages
Collecting diagnostic log messages
About fault location and handling
Failure model and impact analysis
Common service recovery and fault removal methods
Abnormal card state or card failure
Troubleshooting network interfaces
Troubleshooting packet forwarding failures
Ping or tracert operation failure
Ping operation failure across NAT
Troubleshooting stateful failover
Failure to ping the Reth interface not in any redundancy group
NAT failure when the outbound interface can be pinged from the external network
IPsec SAs established successfully but IPsec-protected traffic cannot be forwarded
IPsec exceptions occur when the master firewall in IRF fabric goes down
Failure to log in to the SSL VPN Web interface
Troubleshooting load balancing
High CPU usage and memory usage
Troubleshooting system resource usage issues
Troubleshooting high CPU usage caused by policy rule matching acceleration
CPU usage is high if object policy rules are modified frequently
High CPU usage caused by low-speed security policy matching
Troubleshooting attack detection and prevention failures
FIN flood attack report failure
Troubleshooting threat log generation by IPS
No threat logs generated on the IPS device
Troubleshooting RBM dynamic routing issues
RBM switchover not triggered upon uplink or downlink interface failure
Inconsistent ACL configuration between the RBM member devices
IPv6 access to IPv4 network fails
Unexpected card reboot because of an internal port failure
Unexpected power-off of a card because of an internal port failure
Electronic label reading failure
MPU and service module version inconsistency
Introduction
This document provides information about troubleshooting common software and hardware issues with the H3C SecPath M9000 Multiservice Security Gateway Series.
General guidelines
|
|
IMPORTANT: To prevent an issue from causing loss of configuration, save the configuration each time you finish configuring a feature. For configuration recovery, regularly back up the configuration to a remote server. |
When you troubleshoot the gateway, follow these general guidelines:
· To help identify the cause of the issue, collect system and configuration information, including:
¡ Symptom, time of failure, and configuration.
¡ Network topology information, including the network diagram, port connections, and points of failure.
¡ Log messages and diagnostic information. For more information about collecting this information, see "Collecting log and operating information."
¡ Physical evidence of failure:
- Photos of the hardware.
- Status of the card, power, and fan status LEDs.
¡ Steps you have taken, such as reconfiguration, cable swapping, and reboot.
¡ Output from the commands executed during the troubleshooting process.
· To ensure safety, wear an ESD-preventive wrist strap when you replace or maintain a hardware component.
· If hardware replacement is required, use the release notes to verify hardware and software compatibility.
Collecting log and operating information
|
|
IMPORTANT: By default, the information center is enabled. If the feature is disabled, you must use the info-center enable command to enable the feature for collecting log messages. |
Table 1 shows the types of files that the system uses to store operating log and status information. You can export these files by using FTP or TFTP.
Table 1 Log and operating information
|
Category |
File name format |
Content |
|
Common log |
logfileX.log |
Command execution and operational log messages. |
|
Operating statistics |
file-basename.gz |
Current operating statistics for feature modules, including the following items: · Device status. · CPU status. · Memory status. · Configuration status. · Software entries. · Hardware entries. |
Collecting common log messages
1. Save common log messages from the log buffer to a log file.
By default, log files are saved in the logfile directory of the flash memory on the active MPU (in standalone mode) or global active MPU (in IRF mode).
[sysname] logfile save
The contents in the log file buffer have been saved to the file flash:/logfile/logfile.log.
2. Identify the log files on each MPU:
# Display the log files on the active MPU (in standalone mode) or global active MPU (in IRF mode).
<sysname> dir slot0#flash:/logfile/
Directory of flash:/logfile
0 -rw- 5233116 Apr 27 2013 09:20:44 logfile1.log
1 -rw- 5142919 May 03 2013 14:15:42 logfile2.log
2 -rw- 5193287 May 09 2013 12:28:08 logfile3.log
1021808 KB total (259072 KB free)
# Display the log files on each standby MPU:
¡ In standalone mode, display the log files on the standby MPU.
<sysname> dir slot1#flash:/logfile/
Directory of slot1#flash:/logfile
0 -rw- 5242287 May 13 2013 16:47:46 logfile4.log
1 -rw- 5143837 May 24 2013 22:56:46 logfile5.log
2 -rw- 5149806 Jun 01 2013 13:43:26 logfile6.log
1020068 KB total (643264 KB free)
¡ In IRF mode, display the log files on each standby MPU.
<sysname> dir chassis2#slot0#flash:/logfile/
Directory of chassis2#slot0#flash:/logfile
0 -rw- 5215316 Jun 03 2013 05:49:20 logfile7.log
1 -rw- 5235163 Jun 21 2013 07:31:54 logfile8.log
2 -rw- 3256492 Jun 26 2013 09:01:08 logfile9.log
1021808 KB total (773424 KB free)
|
|
NOTE: If a subordinate chassis has two MPUs, make sure you identify and export the log files on both MPUs. |
3. Transfer the files to the desired destination by using FTP, TFTP, or USB. (Details not shown.)
Collecting diagnostic log messages
Execute the display diagnostic-information command, and then enter Y to save diagnostic log messages from the diagnostic log file buffer to a diagnostic log file.
The more cards on the device, the more time is used to collect log messages. You cannot execute any commands during the log message collection process. Please wait.
<sysname> display diagnostic-information
Save or display diagnostic information (Y=save, N=display)? [Y/N]:y
Please input the file name(*.gz)[flash:/diag.gz]:
The file already exists,overwirte it?[Y/N]:y
Diagnostic information is outputting to flash:/diag.gz.
Save successfully.
<sysname> dir flash:/
Directory of flash:
6 -rw- 898180 Jun 26 2013 09:23:51 diag.gz
1021808 KB total (259072 KB free)
Alternatively, you can display the diagnostic log messages on the screen, which is not recommended. Before you perform this operation, disable pausing between screens of output.
<sysname> screen-length disable
Screen-length configuration is disabled for current user
<Sysname> display diagnostic-information
Save or display diagnostic information (Y=save, N=display)? [Y/N]:n
==================================================================
===============display cpu===============
Chassis 2 Slot 0 CPU 0 CPU usage:
4% in last 5 seconds
0% in last 1 minute
0% in last 5 minutes
Chassis 2 Slot 0 CPU 1 CPU usage:
0% in last 5 seconds
0% in last 1 minute
0% in last 5 minutes
About fault location and handling
· Information described in "General guidelines."
· Product serial numbers.
This information will help the support engineer assist you as quickly as possible.
You can contact H3C Support at [email protected].
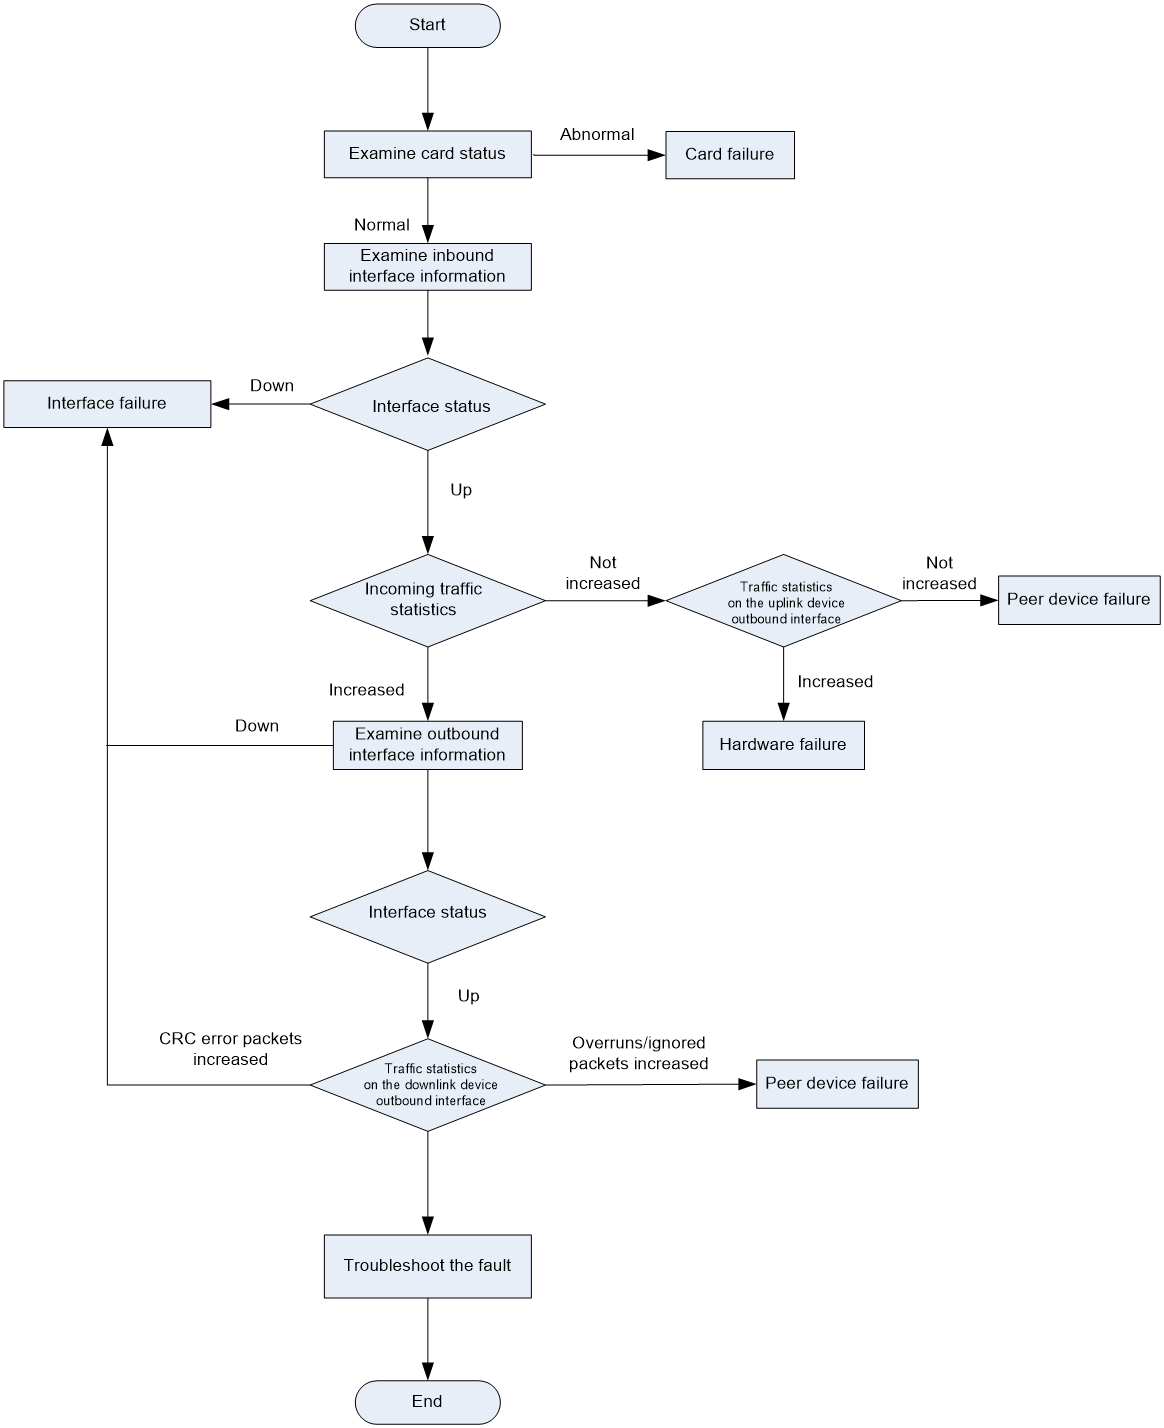
Troubleshooting flowchart
Figure 1 shows the generic troubleshooting procedure for you to identify the fault type.
Figure 1 Troubleshooting flowchart
Troubleshooting methods
The following are some of the common methods you can use to troubleshoot a device issue:
· Examine packet statistics on ports.
· Do port mirroring to send copies of packets to the analyzer.
· Capture packets on ports.
· Examine session states and statistics.
· Examine Layer 2 and Layer 3 forwarding entries and statistics.
· Verify that OpenFlow entries are issued to the device correctly.
· Use debug commands.
Types of issues
The following types of issues might occur on the device:
· Card issues—A card might unexpectedly reboot, change to an abnormal state, fails to start up, or reboot repeatedly. To troubleshoot card issues, see "Abnormal card state or card failure."
|
|
NOTE: Unless otherwise stated, MPU, interface modules (or LPUs), service modules (for example, firewall modules), switching fabric modules (or NPUs), and other functional hardware modules are collectively referred to as cards in this document. |
· Fan tray issues—The fan tray LED shows a fault condition, fans stop rotating, or the system keeps generating fan alarm messages. To troubleshoot fan tray issues, see "Fan tray failure."
· Temperature issues—The system displays temperature alarms. To troubleshoot a temperature issue, see "Temperature alarms."
· Network port issues—A network port cannot come up, flaps between the up and down state, or has error packets. To troubleshoot network port issues, see "Troubleshooting network interfaces".
· Forwarding issues—Forwarding error or failure occurs, including ping failure, packet loss or unreachability detected by the tracert utility, loss of Layer 2 packets or connectivity, loss of Layer 3 packets or connectivity, or service anomaly. To troubleshoot forwarding issues, see "Troubleshooting packet forwarding failures."
· IRF issues—IRF fabric cannot be established or an IRF split occurs. To troubleshoot an IRF issue, see "Troubleshooting IRF."
· Stateful failover—If an exception occurs during master/subordination switchover, forwarding through the redundant port, or service switching to a redundant port, see "Troubleshooting stateful failover" for the troubleshooting procedure.
· NAT and ALG issues—NAT cannot translate addresses correctly or ALG malfunctions. To troubleshoot a NAT or ALG issue, see "Troubleshooting NAT."
· IPsec or IKE issues—The device cannot forward traffic over IPsec tunnels or cannot encapsulate or decapsulate packets correctly. To troubleshoot IPsec or IKE issues, see "Troubleshooting IPsec and IKE."
· CPU usage issues—Persistent high CPU usage occurs. To troubleshoot a persistent high CPU usage issue, see "High CPU usage."
· Memory usage issues—Persistent high memory usage occurs. To troubleshoot a persistent high memory usage issue, see "High memory usage"
Failure model and impact analysis
Figure 2 shows a typical network failure model. To improve availability of network services, deploy two M9000 gateways as an IRF fabric and configure them to operate in active/active mode or active/backup mode.
Figure 2 Points of failure on the network
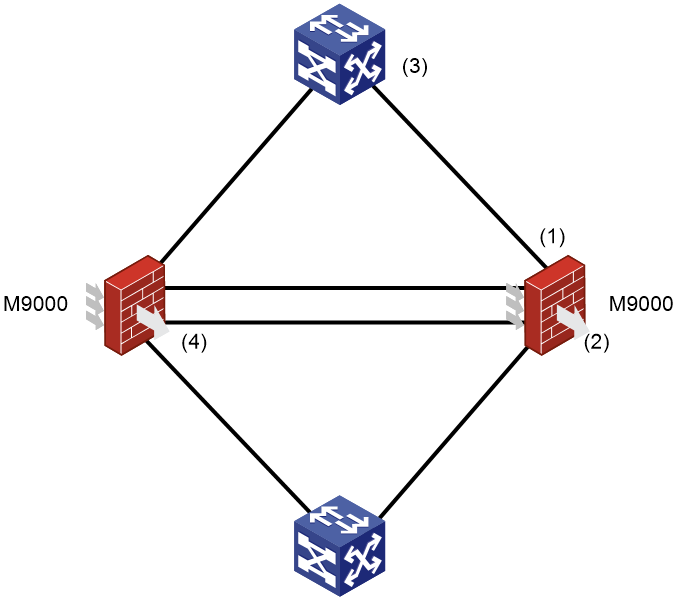
Table 2 Points of failure and their impact
|
Callout |
Failure |
Impact |
|
1 and 3 (including transceiver modules) |
Port down |
Service switchover. |
|
Increased error packets on a port |
All services on the link. The impact is wide. |
|
|
2 |
MPU failure |
Service switchover. |
|
Engine failure |
If track is configured to monitor links, services can automatically switch over to redundancy links. |
|
|
Interface module failure |
Service switchover might occur. |
|
|
4 |
One of the IRF links disconnects. |
Performance degradation without interrupting services. |
|
All IRF links disconnect. |
IRF splits. |
Common service recovery and fault removal methods
|
Fault category |
Service recovery methods |
Fault removal methods |
|
Hardware |
· Isolate the faulty card. · Isolate the faulty device by adjusting the traffic forwarding paths. For example, changing the preferences of routes so traffic is switched to other paths. |
Complete required tests on the backup hardware, and replace the failed hardware. |
|
Software |
· Re-enable the protocols on the faulty device. · Isolate the faulty device by adjusting the traffic forwarding paths. |
· Upgrade the software version, including the patch version. · Adjust the network topology or modify the configuration to remove the failures. |
|
Link |
Isolate the faulty link by adjusting the traffic forwarding paths. |
Remove link errors. |
|
Others |
· Correct configuration errors. · Connect the ports of the devices correctly. · Isolate the faulty link by adjusting the traffic forwarding paths. |
· Modify the incorrect configurations. · Correctly connect the device ports. · Repair the power and air conditioner systems for the devices. |
Troubleshooting hardware
Abnormal card state or card failure
Unless otherwise stated, MPU, interface modules (or LPUs), service modules (for example, firewall modules), switching fabric modules (or NPUs), and other functional hardware modules are collectively referred to as cards in this document.
The card states include Normal, Master, Standby, Absent, and Fault.
· Normal—The card is operating correctly.
· Master—The card is the active MPU.
· Standby—The card is the standby MPU.
· Absent—The card is absent.
· Fault—The card is faulty.
Symptom
The output from the display device command shows that a card is in Absent or Fault state.
<sysname>display device
Slot No. Brd Type Brd Status Subslot Sft Ver Patch Ver
0 NSQM1CGQ4TG24SHA0Normal 0 M9016-V-9153P22 None
1 NONE Absent 0 NONE None
2 NSQM1CGQ4TG24SHA0Normal 0 M9016-V-9153P22 None
3 NONE Absent 0 NONE None
4 NSQM1SUPD0 Master 0 M9016-V-9153P22 None
5 NSQM1SUPD0 Standby 0 M9016-V-9153P22 None
6 NSQM1FWEFGA0 Normal 0 M9016-V-9153P22 None
CPU 1 Normal 0 M9016-V-9153P22
7 NONE Absent 0 NONE None
8 NONE Absent 0 NONE None
9 NONE Absent 0 NONE None
10 NSQM1FAB08E0 Normal 0 M9016-V-9153P22 None
11 NSQM1FAB08E0 Normal 0 M9016-V-9153P22 None
12 NSQM1FAB08E0 Normal 0 M9016-V-9153P22 None
13 NSQM1FAB08E0 Normal 0 M9016-V-9153P22 None
Solution
Handling a card in Absent state
To resolve the issue:
1. Verify that the card is installed securely. Reinstall the card to ensure that the card is installed securely.
2. Verify that the card is not faulty.
a. Install this card into another slot.
b. Install another card that is operating correctly on the chassis into this slot.
3. Verify that the LEDs of card do not indicate any error.
4. If the card is an MPU, service module, or switching fabric module with a console port, connect the card to a configuration terminal to verify that it can start up correctly.
5. If the card is faulty, collect fault information, replace the card, and contact H3C Support.
Handling a card in Fault state
To resolve the issue:
1. Wait approximately 10 minutes, and then check the card status:
¡ If the card remains in Fault state, go to the next step.
¡ If the card state changes to Normal, and then reboots, contact H3C Support.
2. If the card is an MPU or switching fabric module with a console port, connect the card to a configuration terminal through a console cable and verify that the module can start up correctly.
3. Install the card into another slot to determine whether the card is faulty.
4. If the card is faulty, collect fault information, replace the card, and contact H3C Support.
Card reboot
Symptom
A card reboots unexpectedly or repeatedly, or fails to reboot.
Solution
To resolve the issue:
1. View the log messages, or execute the display version command to determine the period during which the card rebooted.
The following is sample output from the display version command:
<sysname>display version
H3C Comware Software, Version 7.1.064, Release 9153P22
Copyright (c) 2004-2020 New H3C Technologies Co., Ltd. All rights reserved.
H3C SecPath M9016-V uptime is 0 weeks, 4 days, 0 hours, 7 minutes
Last reboot reason : User reboot
Boot image: flash:/M9000-CMW710-BOOT-R9153P22.bin
Boot image version: 7.1.064, Release 9153P22
Compiled Dec 10 2020 14:00:00
System image: flash:/M9000-CMW710-SYSTEM-R9153P22.bin
System image version: 7.1.064, Release 9153P22
Compiled Dec 10 2020 14:00:00
Feature image(s) list:
flash:/M9000-CMW710-DEVKIT-R9153P22.bin, version: 7.1.064
Compiled Dec 10 2020 14:00:00
LPU 0:
Uptime is 0 weeks,4 days,0 hours,3 minutes
H3C SecPath M9016-V LPU with 1 LS1043A Processor
BOARD TYPE: NSQM1CGQ4TG24SHA0
DRAM: 2048M bytes
PCB 1 Version: VER.A
Bootrom Version: 108
CPLD 1 Version: 002
CPLD 2 Version: 001
Release Version: H3C SecPath M9016-V-9153P22
Patch Version : None
Reboot Cause : UserReboot
LPU 2:
Uptime is 0 weeks,4 days,0 hours,3 minutes
H3C SecPath M9016-V LPU with 1 LS1043A Processor
BOARD TYPE: NSQM1CGQ4TG24SHA0
DRAM: 2048M bytes
PCB 1 Version: VER.A
Bootrom Version: 108
CPLD 1 Version: 002
CPLD 2 Version: 001
Release Version: H3C SecPath M9016-V-9153P22
Patch Version : None
Reboot Cause : UserReboot
MPU(M) 4:
Uptime is 0 weeks,4 days,0 hours,7 minutes
H3C SecPath M9016-V MPU(M) with 1 XLP316 Processor
BOARD TYPE: NSQM1SUPD0
DRAM: 8192M bytes
FLASH: 500M bytes
NVRAM: 512K bytes
PCB 1 Version: VER.A
Bootrom Version: 132
CPLD 1 Version: 004
CPLD 2 Version: 003
CPLD 3 Version: 003
Release Version: H3C SecPath M9016-V-9153P22
Patch Version : None
Reboot Cause : UserReboot
MPU(S) 5:
Uptime is 0 weeks,4 days,0 hours,6 minutes
H3C SecPath M9016-V MPU(S) with 1 XLP316 Processor
BOARD TYPE: NSQM1SUPD0
DRAM: 8192M bytes
FLASH: 500M bytes
NVRAM: 512K bytes
PCB 1 Version: VER.A
Bootrom Version: 132
CPLD 1 Version: 001
CPLD 2 Version: 001
CPLD 3 Version: 001
Release Version: H3C SecPath M9016-V-9153P22
Patch Version : None
Reboot Cause : UserReboot
LPU 6:
Uptime is 0 weeks,1 day,17 hours,56 minutes
H3C SecPath M9016-V LPU with 1 XLP308 Processor
BOARD TYPE: NSQM1FWEFGA0
DRAM: 2048M bytes
FLASH: 8M bytes
PCB 1 Version: VER.A
PCB 2 Version: VER.B
Bootrom Version: 100
CPLD 1 Version: 002
CPLD 2 Version: 002
Release Version: H3C SecPath M9016-V-9153P22
Patch Version : None
Reboot Cause : UserReboot
SLOT 6 CPU 1
CPU type: Multi-core CPU
DDR4 : 49152M bytes
FLASH: 7122M bytes
Board PCB Version: Ver.A
CPLD Version: 2.0
Release Version: SecBlade FW Enhanced-9153P22
FPGA 0 Version: B50506
FPGA 0 DATE: 2020.11.27
FPGA 1 Version: B50506
FPGA 1 DATE: 2020.11.27
Basic BootWare Version:1.03
Extend BootWare Version:1.03
NPU 10:
Uptime is 0 weeks,4 days,0 hours,3 minutes
H3C SecPath M9016-V NPU with 1 XLS208 Processor
BOARD TYPE: NSQM1FAB08E0
DRAM: 1024M bytes
PCB 1 Version: VER.B
Bootrom Version: 518
CPLD 1 Version: 005
Release Version: H3C SecPath M9016-V-9153P22
Patch Version : None
Reboot Cause : UserReboot
NPU 11:
Uptime is 0 weeks,3 days,23 hours,46 minutes
H3C SecPath M9016-V NPU with 1 XLS208 Processor
BOARD TYPE: NSQM1FAB08E0
DRAM: 1024M bytes
PCB 1 Version: VER.B
Bootrom Version: 518
CPLD 1 Version: 005
Release Version: H3C SecPath M9016-V-9153P22
Patch Version : None
Reboot Cause : ColdReboot
NPU 12:
Uptime is 0 weeks,3 days,23 hours,44 minutes
H3C SecPath M9016-V NPU with 1 XLS208 Processor
BOARD TYPE: NSQM1FAB08E0
DRAM: 1024M bytes
PCB 1 Version: VER.B
Bootrom Version: 511
CPLD 1 Version: 005
Release Version: H3C SecPath M9016-V-9153P22
Patch Version : None
Reboot Cause : ColdReboot
NPU 13:
Uptime is 0 weeks,3 days,23 hours,44 minutes
H3C SecPath M9016-V NPU with 1 XLS208 Processor
BOARD TYPE: NSQM1FAB08E0
DRAM: 1024M bytes
PCB 1 Version: VER.B
Bootrom Version: 518
CPLD 1 Version: 005
Release Version: H3C SecPath M9016-V-9153P22
Patch Version : None
Reboot Cause : ColdReboot
2. Determine whether a user rebooted the card by using the reboot command or by powering off and then powering on the card during the period.
The reason for the most recent reboot is displayed in the display version command output. You can check the Last reboot reason field for the event that caused the most recent reboot.
3. If all cards rebooted simultaneously, verify the following information:
¡ The power supplies are operating correctly.
¡ The device has not been disconnected from the power source.
¡ The power cables are connected securely.
4. Verify that log message "Slot X need to be rebooted automatically!" or "Note:the operating device is sda0,it's not online" is not output during the reboot. If the message was displayed, replace the card and contact H3C Support.
5. If the issue persists, contact H3C Support.
Fan tray failure
Symptom
The fan tray status LED indicates an abnormal condition exists. The device outputs messages about fan tray failures as follows:
%Jun 26 10:12:24:805 2013 H3C DEV/3/FAN_ABSENT: -MDC=1; Chassis 2 Fan 2 is absent.
%Jun 26 10:12:32:805 2013 H3C DEVD/2/DRV_DEV_FAN_CHANGE: -MDC=1; Chassis 2: Fan communication state changed: Fan 1 changed to fault.
%Jun 26 10:12:42:405 2013 H3C DEV/2/FAN_FAILED: -MDC=1; Chassis 2 Fan 1 failed.
Solution
To resolve the issue:
1. If the fan tray is present in the slot, place your hand at the outlet air vents of the device to verify that wind blows out of the device.
If no wind blows out of the device, the fan tray is faulty.
2. Verify that the inlet and outlet air vents are not blocked and no large amount of dust buildup exists on the inlet and outlet air vents.
3. Verify that the fan tray is present in the slot with normal operating state and normal fan speed.
Execute the display fan command to view the fan tray operating status information. If fan status is not normal, or the displayed fan speed is less than half of the normal fan speed, you can remove and reinstall the fan tray or swap the fan tray with another to identify the failure reason.
<sysname> display fan
Chassis 1:
Fan Frame 0 State: Normal
Chassis 2:
Fan Frame 0 State: Normal
4. If the issue persists, replace the fan tray.
If no fan tray is present, power off the device to avoid card damage caused by high temperature. You can continue using the device if you can use cooling measures to keep the device operating temperature below 50°C (122°F).
5. If the issue persists, contact H3C Support.
Temperature alarms
Symptom
The device outputs a high temperature or low temperature alarm message as follows:
%Jun 26 10:13:46:233 2013 H3C DEV/4/TEMPERATURE_WARNING: -MDC=1; Temperature is greater than warning upper limit on Chassis 1 slot 2 sensor inflow 1.
Solution
To resolve the issue:
1. Verify that the ambient environment temperature is in the acceptable range.
If the ambient environment temperature is high, identify the cause of high temperature, such as poor ventilation in the equipment room or failure of the air conditioner.
2. Verify that the device temperature does not exceed the upper or lower warning or alarm thresholds.
You can execute the display environment command to view the card temperature or use hands to touch the cards. If the card temperature is high, immediately locate the causes of high temperature to avoid card damage caused by long-time high temperature of the card.
¡ If the temperature is too high, determine whether a fan tray failure occurs. See "Fan tray failure" to identify and resolve a fan tray failure.
¡ If the Temperature field displays error or a value out of the ordinary, the switch might fail to access the card temperature sensor through the I2C bus. The switch accesses the transceiver modules through the same I2C bus. You can view whether the transceiver module information is displayed correctly. If the switch can access the transceiver modules, use the temperature-limit command to reconfigure the temperature thresholds. Then use the display environment command to view whether the setting takes effect.
[sysname] temperature-limit chassis 2 slot 1 hotspot 1 0 85 90
<sysname> display environment
System temperature information (degree centigrade):
----------------------------------------------------------------------
Chassis Slot Sensor Temperature Lower Warning Alarm Shutdown
1 0 inflow 1 35 0 48 60 NA
1 0 hotspot 1 43 0 80 95 NA
1 1 inflow 1 34 0 48 60 NA
1 1 hotspot 1 38 0 80 95 NA
1 2 hotspot 1 49 0 88 100 110
1 2 hotspot 1 49 0 88 100 110
1 3 hotspot 1 43 0 80 97 NA
1 3 hotspot 2 41 0 80 97 NA
1 4 hotspot 1 42 0 80 97 NA
1 4 hotspot 2 40 0 80 97 NA
1 5 hotspot 1 45 0 80 97 NA
1 5 hotspot 2 41 0 80 97 NA
1 6 hotspot 1 53 0 88 100 110
1 6 hotspot 1 53 0 88 100 110
1 7 hotspot 1 55 0 88 100 110
1 7 hotspot 1 55 0 88 100 110
1 8 hotspot 1 67 0 88 100 110
1 8 hotspot 1 67 0 88 100 110
1 9 hotspot 1 61 0 88 100 110
1 9 hotspot 1 61 0 88 100 110
2 0 inflow 1 34 0 85 90 NA
2 0 hotspot 1 42 0 85 90 NA
2 1 inflow 1 36 0 85 90 NA
2 1 hotspot 1 41 0 85 90 NA
2 2 hotspot 1 56 0 88 100 110
2 2 hotspot 1 56 0 88 100 110
2 3 hotspot 1 47 0 80 97 NA
2 3 hotspot 2 44 0 80 97 NA
3. If you still cannot identify the cause of temperature alarms, collect and send related information to H3C Support for help.
Related commands
This section lists the commands that you might use for troubleshooting hardware
|
Command |
Description |
|
display device |
Displays device information, including card states. |
|
display environment |
Displays device temperature information and whether the temperature exceeds the threshold. |
|
display fan |
Displays the operating states of fan trays. |
|
display power |
Display power system information of the device, including: · Power management enabling status. · Power supply type, rated input voltage, and rated output voltage. · Status of the present power supplies. |
|
display version |
Displays system version information, card uptime, and most recent reboot reason. |
|
save |
Saves the running configuration to a configuration file. |
|
temperature-limit |
Sets the temperature alarm thresholds. |
Troubleshooting network interfaces
This section provides troubleshooting information for common network interface issues.
Error packets on an interface
Symptom
The output from the display interface command shows that error packets exist on an interface.
[sysname] display interface GigabitEthernet 1/4/0/17
GigabitEthernet1/4/0/17
Current state: UP
Line protocol state: UP
Description: GigabitEthernet1/4/0/17 Interface
Bandwidth: 1000000kbps
Maximum Transmit Unit: 1500
Internet protocol processing: disabled
IP Packet Frame Type:PKTFMT_ETHNT_2, Hardware Address: 8042-0004-5611
IPv6 Packet Frame Type:PKTFMT_ETHNT_2, Hardware Address: 8042-0004-5611
Media type is twisted pair
Port hardware type is 1000_BASE_T
Last clearing of counters: 16:45:01 Wed 12/11/2013
Peak value of input: 0 bytes/sec, at 2013-12-11 16:45:03
Peak value of output: 12328675 bytes/sec, at 2013-12-11 17:01:56
Last 300 seconds input: 0 packets/sec 0 bytes/sec
Last 300 seconds output: 85491 packets/sec 12069673 bytes/sec
Input (total): 2 packets, 128 bytes
2 unicasts, 0 broadcasts, 0 multicasts, 0 pauses
Input (normal): 2 packets, - bytes
2 unicasts, 0 broadcasts, 0 multicasts, 0 pauses
Input: 4 input errors, 1 runts, 1 giants, 0 throttles
1 CRC, 1 frame, - overruns, 0 aborts
- ignored, - parity errors
Output (total): 202277882 packets, 28751562624 bytes
202277844 unicasts, 0 broadcasts, 0 multicasts, 0 pauses
Output (normal): 202277844 packets, - bytes
202277844 unicasts, 0 broadcasts, 0 multicasts, 0 pauses
Output: 8 output errors, - underruns, - buffer failures
2 aborts, 2 deferred, 2 collisions, 2 late collisions
0 lost carrier, - no carrier
Fields for incoming error packets
· input errors—Total number of incoming error packets.
· runts—Number of incoming frames that meet the following conditions:
¡ Shorter than 64 bytes.
¡ Containing valid CRCs.
¡ In correct format.
· giants—Number of incoming giant frames. Giant frames refer to frames larger than the maximum frame length supported on the interface.
· CRC—Total number of incoming frames containing CRC errors.
· frame—Total number of incoming frames containing errors.
Fields for outgoing error packets
· output errors—Total number of outgoing packets with errors.
· aborts—Number of packets that failed to be transmitted.
· deferred—Number of frames that the interface deferred to transmit. An interface will defer to transmit a frame when the frame has waited for transmission for more than two times the maximum frame transmission time because the transmission media is busy.
· collisions—Number of frames that the interface stopped transmitting because collisions were detected during transmission.
· late collisions—Number of frames that the interface deferred to transmit after transmitting their first 512 bits because of detected collisions.
Solution
To resolve the issue, choose one of the following solutions depending on the symptom:
· Solution for increasing CRC, frame, and throttles errors in the inbound direction
· Solution for increasing giants in the inbound direction
· Solution for increasing error packets in the outbound direction
Solution for increasing CRC, frame, and throttles errors in the inbound direction
1. Test the link performance. If the link is of poor quality or optical signals are attenuated greatly, replace the cable or optical fiber.
2. If the interface is installed with a transceiver module, identify whether the issue is caused by a transceiver module failure as described in "Transceiver module failure."
3. Swap the cable, optical fiber, or transceiver module with that of an interface that is operating correctly, and then swap it over.
¡ If the issue remains the same on the original interface but does not occur on the new interface, the original interface might be the failure cause. Use an interface that can operate correctly to provide services, and send the failure information to H3C Support for analysis.
¡ If the issue does not occur on the original interface but occurs on the new interface, verify that the peer device and the intermediate devices and links are operating correctly.
4. If the issue persists, contact H3C Support.
Solution for increasing giants in the inbound direction
1. Examine the following settings of the jumboframe enable command for the interfaces on two ends:
¡ Verify that the jumbo feature is enabled on both interfaces.
¡ Verify that the default settings for the command are the same.
¡ Verify that the current settings for the command are the same.
2. If the issue persists, contact H3C Support.
Solution for increasing error packets in the outbound direction
1. Verify that the interface is operating in full duplex mode.
2. If the issue persists, contact H3C Support.
Interface fails to come up
Symptom
An interface fails to come up.
Solution
To resolve the issue:
1. Verify that the cables or optical fibers connected to the interface and its peer interface are connected correctly and securely.
2. If the issue persists, swap the cables or optical fibers for cables or optical fibers that can correctly operate to verify that the intermediate link is operating correctly.
3. Examine the settings of the interfaces, including up/down state, duplex mode, speed, autonegotiation mode, and MDI. Verify that the interfaces are configured correctly.
4. If the interfaces are installed with transceiver modules, verify that the transceiver modules are the same type (including the speed, wavelength, single-mode, and multiple-mode).
5. If the issue persists, swap the suspected transceiver module for a transceiver module that can operate correctly. Identify whether the issue is caused by a transceiver module failure as described in "Transceiver module failure."
[sysname] display transceiver interface Ten-GigabitEthernet 1/5/0/1
Ten-GigabitEthernet1/5/0/1 transceiver information:
Transceiver Type : 10G_BASE_LR_XFP
Connector Type : LC
Wavelength(nm) : 1310
Transfer Distance(km) : 10(SMF)
Digital Diagnostic Monitoring : YES
Vendor Name : SumitomoElectric
6. If a transceiver module failed, replace the transceiver module and contact H3C Support.
An interface goes down
Symptom
An interface goes down.
Solution
To resolve the issue:
1. Read the log messages for the local and peer devices. Identify whether the interfaces were manually shut down.
2. Display interface status information. Identify whether an interface has protocol issues or was shut down by the diagnostic module because of errors. If yes, contact H3C Support.
[sysname] display interface GigabitEthernet 1/4/0/1
GigabitEthernet1/4/0/1
Current state: DOWN
Line protocol state: DOWN
Description: GigabitEthernet1/4/0/1 Interface
Bandwidth: 1000000kbps
Maximum Transmit Unit: 1500
Internet protocol processing: disabled
IP Packet Frame Type:PKTFMT_ETHNT_2, Hardware Address: 8042-0004-5601
IPv6 Packet Frame Type:PKTFMT_ETHNT_2, Hardware Address: 8042-0004-5601
Media type is not sure,Port hardware type is No connector
Last clearing of counters: 16:45:01 Wed 12/11/2013
Peak value of input: 0 bytes/sec, at 2013-12-11 16:45:03
Peak value of output: 0 bytes/sec, at 2013-12-11 16:45:03
Last 300 seconds input: 0 packets/sec 0 bytes/sec
Last 300 seconds output: 0 packets/sec 0 bytes/sec
3. As described in "Interface fails to come up," verify that the interfaces are correctly configured and the cable, transceiver module, and optical fiber are operating correctly.
4. If the issue persists, contact H3C Support.
Interface state flapping
Symptom
An interface flaps between the up and down states.
Solution
To resolve the issue:
1. If the interface is a fiber port, verify that the transceiver modules at the two ends are operating correctly as described in "Transceiver module failure."
2. If the interface is a copper port, set the speed and duplex mode. The state flapping issue typically occurs in autonegotiation mode. Disable the autonegotiation mode, and configure the same speed and duplex mode for both of the interfaces on two ends.
3. If the issue persists, verify that the link, peer device, and intermediate devices are operating correctly.
4. If the issue persists, contact H3C Support.
Transceiver module failure
Symptom
A fiber port installed with a transceiver module cannot operate correctly.
Solution
To resolve the issue:
1. Execute the display transceiver alarm interface command to examine the alarms present on the transceiver module.
¡ If input errors occurred, verify that the peer port, fiber, and intermediate device are operating correctly.
¡ If output errors, current errors, or voltage errors occurred, verify that the local port is operating correctly.
[sysname] display transceiver alarm interface Ten-GigabitEthernet 1/5/0/1
Ten-GigabitEthernet1/5/0/1 transceiver current alarm information:
None
Table 3 Transceiver module alarms
|
Field |
Description |
|
SFP/SFP+ |
|
|
RX loss of signal |
Incoming (Rx) signal is lost. |
|
RX power high |
Incoming (Rx) power is high. |
|
RX power low |
Incoming (Rx) power is low. |
|
TX fault |
Transmit fault. |
|
TX bias high |
Tx bias current is high. |
|
TX bias low |
Tx bias current is low. |
|
TX power high |
Tx power is high. |
|
TX power low |
Tx power is low. |
|
Temp high |
Temperature is high. |
|
Temp low |
Temperature is low. |
|
Voltage high |
Voltage is high. |
|
Voltage low |
Voltage is low. |
|
Transceiver info I/O error |
Transceiver information read and write error. |
|
Transceiver info checksum error |
Transceiver information checksum error. |
|
Transceiver type and port configuration mismatch |
The transceiver type does not the match port configuration. |
|
Transceiver type not supported by port hardware |
The port does not support the transceiver type. |
|
XFP |
|
|
RX loss of signal |
Incoming (Rx) signal is lost. |
|
RX not ready |
The receiver is not ready. |
|
RX CDR loss of lock |
Rx clock cannot be recovered. |
|
RX power high |
Rx power is high. |
|
RX power low |
Rx power is low. |
|
TX not ready |
Tx is not ready. |
|
TX fault |
Tx fault. |
|
TX CDR loss of lock |
Tx clock cannot be recovered. |
|
TX bias high |
Tx bias current is high. |
|
TX bias low |
Tx bias current is low. |
|
TX power high |
Tx power is high. |
|
TX power low |
Tx power is low. |
|
Module not ready |
Module is not ready. |
|
APD supply fault |
APD supply fault. |
|
TEC fault |
TEC fault. |
|
Wavelength unlocked |
Wavelength of optical signal exceeds the manufacturer's tolerance. |
|
Temp high |
Temperature is high. |
|
Temp low |
Temperature is low. |
|
Voltage high |
Voltage is high. |
|
Voltage low |
Voltage is low. |
|
Transceiver info I/O error |
Transceiver information read and write error. |
|
Transceiver info checksum error |
Transceiver information checksum error. |
|
Transceiver type and port configuration mismatch |
The transceiver type does not match the port configuration. |
|
Transceiver type not supported by port hardware |
The transceiver type is not supported on the port. |
2. Swap the suspected transceiver module and a transceiver module that can correctly operate, and swap the interfaces.
3. If you are sure that the transceiver module fails, execute the display transceiver diagnosis command to collect the current values of the digital diagnosis parameters on the transceiver module and send them to H3C Support. The display transceiver diagnosis command applies to H3C transceiver modules and might not be able to display information about non-H3C transceiver modules.
[sysname] display transceiver diagnosis interface Ten-GigabitEthernet 1/5/0/2
Ten-GigabitEthernet1/5/0/2 transceiver diagnostic information:
Current diagnostic parameters:
Temp.(°C) Voltage(V) Bias(mA) RX power(dBm) TX power(dBm)
48 3.33 39.10 0.13 -1.35
Alarm thresholds:
Temp.(°C) Voltage(V) Bias(mA) RX power(dBm) TX power(dBm)
High 73 3.63 75.00 2.50 8.16
Low -5 2.97 1.00 -12.30 -11.20
4. Display the electronic label information for the transceiver module. The Vendor Name field displays H3C for an H3C transceiver module. As a best practice, use only H3C transceiver modules.
[sysname] display transceiver manuinfo interface
Ten-GigabitEthernet1/2/0/1 transceiver manufacture information:
The transceiver does not support this function.
Ten-GigabitEthernet1/2/0/2 transceiver manufacture information:
The transceiver does not support this function.
Ten-GigabitEthernet1/2/0/3 transceiver manufacture information:
The transceiver is absent.
Ten-GigabitEthernet1/2/0/4 transceiver manufacture information:
The transceiver is absent.
Ten-GigabitEthernet1/2/0/5 transceiver manufacture information:
Manu. Serial Number : 210231A0G1X122000082
Manufacturing Date : 2012-02-28
Vendor Name : H3C
Ten-GigabitEthernet1/2/0/6 transceiver manufacture information:
Manu. Serial Number : 210231A0G1X122000083
Manufacturing Date : 2012-02-28
Vendor Name : H3C
Related commands
This section lists the commands that you might use for troubleshooting interfaces.
|
Command |
Description |
|
display current-configuration |
Displays the running configuration. You can display the running configuration for a specific interface. |
|
display interface |
Displays interface information, including the interface status and the incoming and outgoing traffic statistics. |
|
Displays transceiver alarms. |
|
|
display transceiver diagnosis |
Displays the current values of the digital diagnosis parameters on transceiver modules, including the temperature, voltage, bias current, incoming power, and outgoing power. |
|
display transceiver interface |
Displays the key parameters of transceiver modules. |
|
display transceiver manuinfo |
Displays electronic label information for transceiver modules to identify the vendors of the transceiver modules. |
Troubleshooting packet forwarding failures
Ping or tracert operation failure
Symptom
The device fails to ping or trace route to a destination.
For example, all ICMP echo requests sent by the device to ping device 10.0.0.5 timed out and no replies were received.
<sysname> ping 10.0.0.5
PING 10.0.0.5 (10.0.0.5): 56 data bytes, press CTRL_C to break
Request time out
Request time out
Request time out
Request time out
Request time out
--- 10.0.0.5 ping statistics ---
5 packet(s) transmitted, 0 packet(s) received, 100.0% packet loss
Solution
To resolve the issue:
1. Verify whether the input and output ports involved in packet forwarding have been added to a security zone.
By default, the ports in an M9000 device are not added to any security zone.
2. If the ports above have been added to a security zone, verify whether they are configured with security policies.
The default action is deny for packets exchanged in the same security zone, between two security zones, or between a security zone and security zone Local.
3. Identify the packet forwarding path and locate where the ICMP packets are lost on the path.
You can compare the ICMP packet statistics collected from the input and output interfaces of a node to identify packet loss. To clear history packet statistics for an interface, use the reset counters interface command.
a. If no ICMP packets are received on the input interface, examine the adjacent upstream device for faults.
b. If the number of input ICMP packets matches the number of output ICMP packets, examine the adjacent downstream device for faults.
c. If no ICMP packets are forwarded on the output interface, proceed to the next step.
4. Use the display ethernet statistics command to check whether Layer 2 ICMP packet forwarding is correct.
<sysname> display ethernet statistics chassis 1 slot 3
ETH receive packet statistics:
Totalnum : 0 ETHIINum : 0
SNAPNum : 0 RAWNum : 0
LLCNum : 0 UnknownNum : 0
ForwardNum : 0 ARP : 0
MPLS : 0 ISIS : 0
ISIS2 : 0 IP : 0
IPV6 : 0
ETH receive error statistics:
NullPoint : 0 ErrIfindex : 0
ErrIfcb : 0 IfShut : 0
ErrAnalyse : 0 ErrSrcMAC : 0
ErrHdrLen : 0
ETH send packet statistics:
L3OutNum : 0 VLANOutNum : 0
FastOutNum : 0 L2OutNum : 0
ETH send error statistics:
MbufRelayNum : 0 NullMbuf : 0
ErrAdjFwd : 0 ErrPrepend : 0
ErrHdrLen : 0 ErrPad : 0
ErrQosTrs : 0 ErrVLANTrs : 0
ErrEncap : 0 ErrTagVLAN : 0
IfShut : 0 IfErr : 0
If Layer 2 ICMP packet forwarding is correct, use the display ip statistics command to determine the cause for packet loss at Layer 3.
<sysname> display ip statistics
Input: sum 263207520 local 1772
bad protocol 0 bad format 0
bad checksum 0 bad options 0
Output: forwarding 24511617 local 476
dropped 21949 no route 156
compress fails 0
Fragment:input 0 output 0
dropped 0
fragmented 0 couldn't fragment 0
Reassembling:sum 0 timeouts 0
In addition, you can use the debugging aspf packet acl and debugging aspf event commands to identify if ICMP packet loss happens during the ASPF process.
5. If the issue persists, contact the technical support.
Ping operation failure across NAT
Symptom
The device fails to ping another device in a different subnet despite a successful NAT.
For example, PC1 10.1.1.1 pings PC2 220.1.1.2 across a M9000 device that translates PC1's IP address into 220.1.1.1. Although PC2 has received PC1's ICMP echo request, PC1 cannot receive an ICMP echo reply from PC2.
Solution
To resolve the issue:
1. Verify that the input and output interfaces of PC1 and PC2 have been added to security zones, and use the display security-policy command to verify security policies have been configured.
<sysname>dis security-policy ip
Security-policy ip
rule 0 name 0
action pass
2. Use the display ip routing-table command on the device to verify that the RIB contains a route to PC1.
[sysname] display ip routing-table 10.1.1.0
If no routes to PC1 exist, examine the routing protocol configurations and verify that the protocols are operating correctly.
3. Use the display fib command on the device to verify that the FIB contains a route to PC1.
[sysname] display fib 10.1.1.0
If the RIB contains a route to PC1 but the FIB does not, contact the technical support.
4. Use the display arp command on the device to verify that the ARP table contains an entry for the IP address of PC1 (10.1.1.1).
[sysname] display arp 10.1.1.1
5. Use the display session command on the device to verify that the session is established correctly.
6. Enable packet filtering debugging on the device to view packet denial statistics.
If an ASPF policy is applied, you must configure detect icmp for the policy or configure security policies to permit return packets from the destination zone to the source zone. If you do not do so, the device denies return packets.
<sysname> debugging packet-filter packet ip acl ?
INTEGER<2000-2999> Specify a basic ACL
INTEGER<3000-3999> Specify an advanced ACL
Example output for packet denial is as follows:
*Dec 12 16:49:07:188 2013 H3C FILTER/7/PACKET: -Slot=3.1; The packet is deny. SrcZoneName=tom1, DstZoneName=tom; Packet Info:Src-IP=220.1.1.2, Dst-IP=10.1.1.1, VPN-Instance=none,Src-Port=1024, Dst-Port=1025, Protocol=UDP(17), ACL=none.
7. If you find no problems during the examinations above, check the OpenFlow table.
First, check the flow table on the interface module as follows:
a. Configure a one-to-one mapping for outbound static NAT.
[sysname] nat static outbound 10.1.1.1 220.1.1.1
b. Enable static NAT on the interface module.
c. Use the display system internal openflow instance command to check whether the flow table on the interface module is flushed correctly.
Example output for correct flow table flushing is as follows:
[H3C-probe] display system internal openflow instance inner-redirect flow-table
Instance 4097 Flow Table Information:
Table 200 information:
Table type: Extensibility, flow entry count: 25, total flow entry count: 25
Flow entry rule 6 information:
cookie: 0x0, priority: 7861, hard time: 0, idle time: 0, flags: check_overlap
|reset_counts|no_pkt_counts|no_byte_counts, byte count: --, packet count: --
Match information:
Input interface: RAGG11
Ethernet type: 0x0800
IP Range: IPv4 destination address from 220.1.1.1 to 220.1.1.1
Instruction information:
Write actions:
Output interface: Blade2/10/0/1
Flow entry rule 7 information:
cookie: 0x0, priority: 7840, hard time: 0, idle time: 0, flags: check_overlap
|reset_counts|no_pkt_counts|no_byte_counts, byte count: --, packet count: --
Match information:
Ethernet type: 0x0800
IP Range: IPv4 source address from 10.10.1.1 to 10.10.1.1
VRF index: 0
Instruction information:
Write actions:
Output interface: Blade2/10/0/1
Flow entry rule 8 information:
cookie: 0x0, priority: 7841, hard time: 0, idle time: 0, flags: check_overlap
|reset_counts|no_pkt_counts|no_byte_counts, byte count: --, packet count: --
Match information:
Ethernet type: 0x0800
IP Range: IPv4 destination address from 10.10.1.1 to 10.10.1.1
VRF index: 0
Instruction information:
Write actions:
Output interface: Blade2/10/0/1
If flow entry rule 6, 7, or 8 is missing, a packet forwarding failure will occur.
If no exceptions are found, use the display system internal openflow instance command to check whether the flow table on the service module is flushed correctly.
Example output for correct flow table flushing is as follows:
[H3C-probe]display system internal openflow instance inner flow-table
Instance 4096 Flow Table Information:
Table 200 information:
Table type: Extensibility, flow entry count: 27, total flow entry count: 27
Flow entry rule 6 information:
cookie: 0x0, priority: 7860, hard time: 0, idle time: 0, flags: check_overlap
|reset_counts|no_pkt_counts|no_byte_counts, byte count: --, packet count: --
Match information:
Ethernet type: 0x0800
IP Range: IPv4 destination address from 220.1.1.1 to 220.1.1.1
VRF index: 0
Instruction information:
Write actions:
Output interface: Blade2/10/0/1
Flow entry rule 7 information:
cookie: 0x0, priority: 7840, hard time: 0, idle time: 0, flags: check_overlap
|reset_counts|no_pkt_counts|no_byte_counts, byte count: --, packet count: --
Match information:
Ethernet type: 0x0800
IP Range: IPv4 source address from 10.10.1.1 to 10.10.1.1
VRF index: 0
Instruction information:
Write actions:
Output interface: Blade2/10/0/1
Flow entry rule 8 information:
cookie: 0x0, priority: 7841, hard time: 0, idle time: 0, flags: check_overlap
|reset_counts|no_pkt_counts|no_byte_counts, byte count: --, packet count: --
Match information:
Ethernet type: 0x0800
IP Range: IPv4 destination address from 10.10.1.1 to 10.10.1.1
VRF index: 0
Instruction information:
Write actions:
Output interface: Blade2/10/0/1
If flow entry rule 6, 7, or 8 is missing, a packet forwarding failure will occur.
8. If the issue persists, contact the technical support.
Related commands
|
Command |
Description |
|
display arp |
Displays ARP entries. |
|
display current-configuration | include lsr-id |
Displays the current MPLS LSR ID. |
|
display current-configuration configuration mpls-ldp |
Displays the current MPLS LDP configuration. |
|
display fib |
Displays FIB entries. |
|
display interface |
Displays interface information. |
|
display ip interface brief |
Displays brief IP configuration for Layer 3 interfaces. |
|
display ip routing-table |
Displays routing table information. |
|
display session |
Displays session information. |
|
display this |
Displays the running configuration in the current view. |
|
interface |
Enters interface view. |
|
display system internal openflow instance |
Displays flow table information. |
|
display nat outbound |
Displays information about outbound dynamic NAT. |
Troubleshooting IRF
This section provides troubleshooting information for common IRF issues.
IRF fabric setup failure
Symptom
A chassis cannot be added to an IRF fabric.
Solution
1. Verify that the member devices are running the same software version and using the same type of MPU.
<sysname> display device
Chassis Slot Type State Subslot Soft Ver Patch Ver
1 0 NSQ1GT48EA0 Normal 0 M9014-9106 None
1 1 NONE Absent 0 NONE None
1 2 NONE Absent 0 NONE None
1 3 NSQ1TGS8EA0 Normal 0 M9014-9106 None
1 4 NSQ1FWCEA0 Normal 0 M9014-9106 None
1 5 NONE Absent 0 NONE None
1 6 NSQ1SUPB0 Master 0 M9014-9106 None
1 7 NONE Absent 0 NONE None
1 8 NONE Absent 0 NONE None
1 9 NONE Absent 0 NONE None
1 10 NONE Absent 0 NONE None
1 11 NONE Absent 0 NONE None
1 12 NSQ1QGS4SF0 Normal 0 M9014-9106 None
1 13 NSQ1GP48EB0 Normal 0 M9014-9106 None
1 14 NONE Absent 0 NONE None
1 15 NSQ1FAB12D0 Normal 0 M9014-9106 None
1 16 NONE Absent 0 NONE None
1 17 NONE Absent 0 NONE None
...
2. Verify that the IRF physical interfaces are up.
<sysname> display interface GigabitEthernet 1/0/0/10
GigabitEthernet1/0/0/10
Current state: UP
Line protocol state: UP
Description: GigabitEthernet1/0/0/10 Interface
Bandwidth: 1000000kbps
Maximum Transmit Unit: 1500
Internet protocol processing: disabled
IP Packet Frame Type:PKTFMT_ETHNT_2, Hardware Address: 8042-0000-560a
IPv6 Packet Frame Type:PKTFMT_ETHNT_2, Hardware Address: 8042-0000-560a
Media type is twisted pair
Port hardware type is 1000_BASE_T
Last clearing of counters: Never
Peak value of input: 0 bytes/sec, at 2013-12-13 15:15:02
Peak value of output: 0 bytes/sec, at 2013-12-13 15:15:02
Last 300 seconds input: 0 packets/sec 0 bytes/sec
Last 300 seconds output: 0 packets/sec 0 bytes/sec
3. Verify that the physical IRF links are connected correctly:
|
|
IMPORTANT: When you connect two neighboring IRF members, you must connect the physical interfaces of IRF-port 1 on one member to the physical interfaces of IRF-port 2 on the other. |
<sysname> display irf configuration
4. Verify that all physical interfaces in the IRF ports at both ends are set to the same binding mode.
[sysname] irf-port 1/2
[H3C-irf-port1/2] display this
irf-port 1/2
port group interface Ten-GigabitEthernet1/3/0/1 mode enhanced
5. If the issue persists, contact H3C Support.
IRF split
Symptom
An IRF fabric splits.
Solution
To resolve the issue:
1. Review the system log file for the most recent IRF port down event to identify the time when the IRF fabric split.
%Jun 26 10:13:46:233 2013 H3C STM/2/STM_LINK_STATUS_TIMEOUT: IRF port 1 is down because heartbeat timed out.
%Jun 26 10:13:46:436 2013 H3C STM/3/STM_LINK_STATUS_DOWN: -MDC=1; IRF port 2 is down.
2. Verify that all interface modules that contain the IRF physical interfaces are operating correctly.
These interface modules are called IRF-connect module for brevity.
a. Identify the state of each IRF-connect module.
<sysname> display device
Chassis Slot Type State Subslot Soft Ver Patch Ver
2 0 NSQ1GT48EA0 Normal 0 M9014-9153P22 None
2 1 NONE Absent 0 NONE None
2 2 NONE Absent 0 NONE None
2 3 NSQ1TGS8EA0 Normal 0 M9014-9153P22 None
2 4 NSQ1FWCEA0 Normal 0 M9014-9153P22 None
2 5 NONE Absent 0 NONE None
2 6 NSQ1SUPB0 Master 0 M9014-9153P22 None
2 7 NSQ1SUPB0 Standby 0 M9014-9153P22 None
2 8 NONE Absent 0 NONE None
2 9 NONE Absent 0 NONE None
2 10 NSQ1FWCEA0 Normal 0 M9014-9153P22 None
2 11 NONE Absent 0 NONE None
2 12 NONE Absent 0 NONE None
2 13 LSU1GP24TXEB0 Normal 0 M9014-9153P22 None
2 14 NONE Absent 0 NONE None
2 15 NSQ1FAB12D0 Normal 0 M9014-9153P22 None
2 16 NSQ1FAB12D0 Normal 0 M9014-9153P22 None
2 17 NSQ1FAB12D0 Normal 0 M9014-9153P22 None
b. If an IRF-connect module is faulty, remove the issue as described in "Abnormal card state or card failure."
3. Verify that all IRF physical interfaces are up and operating correctly.
a. Identify the state of each IRF physical interface.
<sysname> display interface GigabitEthernet2/6/0/1
GigabitEthernet2/6/0/1 current state: UP
Line protocol current state: UP
IP Packet Frame Type: PKTFMT_ETHNT_2, Hardware Address: 0000-e80d-c000
Description: GigabitEthernet2/6/0/1 Interface
Loopback is not set
Media type is optical fiber, Port hardware type is 1000_BASE_SX_SFP
...
b. If an IRF physical interface is not up or has other issues, remove the issues as described in "Troubleshooting network interfaces."
4. Examine the uptime of each IRF member device and review the log to identify hardware issues that might have resulted in the IRF split.
a. Execute the display version command to identify the uptime of each IRF member device and their IRF-connect module.
<sysname>dis version
H3C Comware Software, Version 7.1.064, Release 9153P22
Copyright (c) 2004-2020 New H3C Technologies Co., Ltd. All rights reserved.
H3C SecPath M9016-V uptime is 0 weeks, 4 days, 0 hours, 16 minutes
Last reboot reason : User reboot
Boot image: flash:/M9000-CMW710-BOOT-R9153P22.bin
Boot image version: 7.1.064, Release 9153P22
Compiled Dec 10 2020 14:00:00
System image: flash:/M9000-CMW710-SYSTEM-R9153P22.bin
System image version: 7.1.064, Release 9153P22
Compiled Dec 10 2020 14:00:00
Feature image(s) list:
flash:/M9000-CMW710-DEVKIT-R9153P22.bin, version: 7.1.064
Compiled Dec 10 2020 14:00:00
LPU Chassis 1 Slot 0:
Uptime is 0 weeks,1 day,18 hours,32 minutes
H3C SecPath M9014 LPU with 1 XLS408 Processor
BOARD TYPE: NSQ1GT48EA0
DRAM: 1024M bytes
FLASH: 0M bytes
NVRAM: 0K bytes
PCB 1 Version: VER.B
Bootrom Version: 511
CPLD 1 Version: 003
Release Version: H3C SecPath M9014-9153P22
Patch Version : None
Reboot Cause : DEVHandShakeReboot
...
b. Compare the uptime of each member device and their IRF-connect modules to determine whether a member device or IRF-connect module had rebooted before the IRF split.
5. If the IRF split resulted from a chassis or IRF-connect reboot or a power failure, check for faulty hardware such as a faulty transceiver module or interface module. Then, replace the faulty hardware, if any.
6. If the IRF split issue persists, collect device diagnostic information, and then send the information to H3C Support.
Related commands
This section lists the commands that you can use to troubleshoot IRF:
|
Command |
Description |
|
display device |
Displays device information. Use this command to identify the consistency of IRF member devices in software version and MPU type. |
|
display interface |
Displays interface information. Use this command to identify the state of IRF physical interfaces. |
|
display irf configuration |
Displays the IRF configuration on each member device. Use this command to verify that IRF links are connected correctly and in normal state. Make sure the physical interfaces in IRF-port 1 on one member device are connected to the physical interfaces in IRF-port 2 on its neighbor member device. |
|
display current-configuration |
Displays the running configuration in the current view. Use this command in system view to verify the consistency of IRF member devices in IRF mode, which is configurable with the irf mode enhanced command. |
|
display version |
Displays system version information and uptime of each card. Use this command to check for possible device, MPU, and IRF-connect module reboot events prior to an IRF split. |
Troubleshooting stateful failover
Failure to ping the Reth interface not in any redundancy group
Symptom
The Reth interface not added to any redundancy group can provide the redundancy capability. The redundancy group switchover occurs only in case of an interface up or down event. All service logics are based on Reth interfaces. The member interfaces are responsible for only sending and receiving packets.
The issue occurs during the packet sending and receiving process. The directly connected Reth interface cannot be pinged.
Solution
To resolve the issue:
1. Verify that packets are sent or received on the Reth interface. If packets can be correctly received, a forwarding issue might exist. Perform the following operations to locate the fault:
a. Execute the debugging ethernet packet command to enable debugging for sent and received packets. For Reth interface 1, execute the debugging ethernet packet interface Reth 1 command.
b. Execute the debugging arp error command to check for errors.
If an error exists, ARP entry learning is abnormal.
c. Execute the debugging ip error command check for errors.
If an error exists, locate the packet loss reason according to the information.
d. Execute the display ethernet statistics command to check whether the number of error increases as the more packets are received or sent.
<sysname> display ethernet statistics chassis 1 slot 0
ETH receive packet statistics:
Totalnum : 48668 ETHIINum : 48668
SNAPNum : 0 RAWNum : 0
LLCNum : 0 UnknownNum : 0
ForwardNum : 48668 ARP : 0
MPLS : 0 ISIS : 0
ISIS2 : 0 IP : 0
IPV6 : 0
ETH receive error statistics:
NullPoint : 0 ErrIfindex : 0
ErrIfcb : 0 IfShut : 0
ErrAnalyse : 0 ErrSrcMAC : 0
ErrHdrLen : 0
ETH send packet statistics:
L3OutNum : 80843 VLANOutNum : 0
FastOutNum : 215 L2OutNum : 0
ETH send error statistics:
MbufRelayNum : 0 NullMbuf : 0
ErrAdjFwd : 0 ErrPrepend : 0
ErrHdrLen : 0 ErrPad : 0
ErrQosTrs : 0 ErrVLANTrs : 0
ErrEncap : 1045 ErrTagVLAN : 0
IfShut : 0 IfErr : 0
2. If no packet information exists on the Reth interface, perform the following operations:
a. Verify that redundant entries are created.
[sysname] display eth-trunk interface RETH-Trunk 1
RETH-Trunk1 :
Physical status : UP
Link status : UP
Number of members : 2
Eth-trunk group : 100
Member Physical status Active status Hold status
RAGG1 UP Active Normal
RAGG5 UP Inactive Normal
<sysname>display reth interface Reth 1
Reth1 :
Redundancy group : 1
Member Physical status Forwarding status Presence status
XGE1/4/0/9 UP Active Normal
XGE2/4/0/9 UP Inactive Normal
If the physical status for all interface are down, a system anomaly exists. If the forwarding statuses for all interfaces are inactive, a member interface anomaly exists.
b. If the entries exist but the member status is normal (that is, certain packets can be correctly received), check for entry errors.
c. Shut down a Reth interface and refresh the entry to verify that the entry can be set up again. If the Reth member is a subinterface, you need to check whether the entry contains a tag.
d. If the Reth interface and ARP entry is correct, check whether the driver has sent packets. View the physical interface counter to check whether the packets have been received.
3. If the issue persists, contact H3C Support.
¡ Packet sending and receiving are a bidirectional process. Both ends must be able to exchange packets. You can identify the location (which end) where the packet loss occurs, and then locate the issue in the specific process. You can ping the remote end from the local end, and then ping the local end from the remote end. If both ping operations succeed, no packet receiving or sending issue exists. If one end (for example, the remote end) cannot be pinged, first verify the ping packets can be sent out according to the previous procedure. Then verify that the remote end can receive the packets.
¡ When checking entry and control block information, check the blade module values for where the packets are received and sent and whether the packets are delivered to the MPU. For packets forwarded by the interface module, you cannot obtain correct information by the checking MPU information.
Stateful failover failure
Symptom
Figure 3 Network diagram
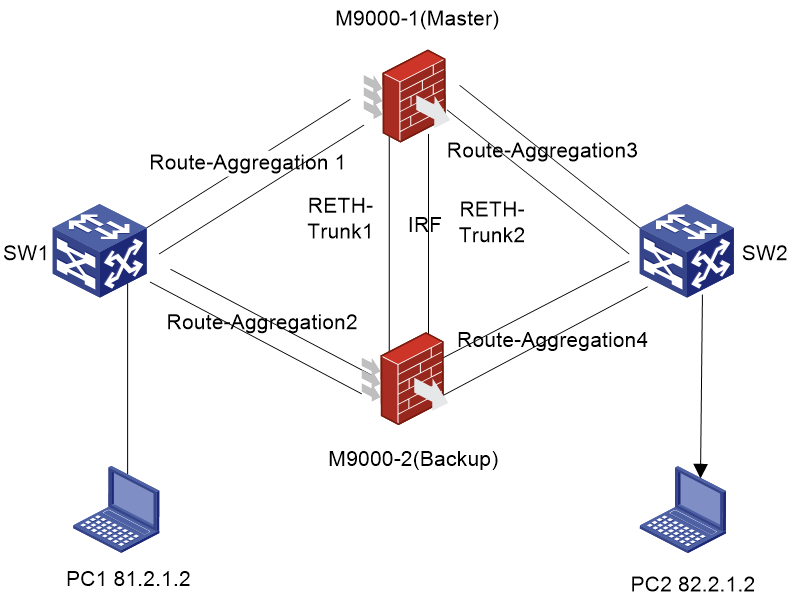
Network configuration
Two firewalls, M9000-1 and M9000-2, form an IRF system. Reth 1 is an uplink interface with members Route-Aggregation1 and Route-Aggregation2. Route-Aggregation1 has a higher priority.
Reth 2 is a downlink interface with members Route-Aggregation3 and Route-Aggregation4. Route-Aggregation3 has a higher priority.
Both Reth 1 and Reth 2 have IP addresses configured. Redundancy group 1 contains Reth 1 and Reth 2.
Procedure
interface Reth 1
ip address 100.1.1.1 255.255.255.0
member interface Route-Aggregation1 priority 100
member interface Route-Aggregation2 priority 1
interface Reth 2
ip address 100.1.1.1 255.255.255.0
member interface Route-Aggregation3 priority 100
member interface Route-Aggregation4 priority 1
track 11 interface Route-Aggregation1
track 12 interface Route-Aggregation2
track 13 interface Route-Aggregation3
track 14 interface Route-Aggregation4
redundancy group 1
member interface Reth1
member interface Reth2
member failover group 1
member failover group 2
node 1
bind chassis 1
priority 100
track 1 interface Blade1/2/0/1
track 3 interface Blade1/3/0/1
track 11 interface Route-Aggregation1
track 13 interface Route-Aggregation3
node 2
bind chassis 2
priority 50
track 2 interface Blade2/2/0/1
track 4 interface Blade2/3/0/1
track 12 interface Route-Aggregation2
track 14 interface Route-Aggregation4
Issues
Master/subordinate switchover fails for the IRF system through the redundancy group.
Solution
1. Check the track information for the redundancy group.
Track information is the only data source for the redundancy group to make decisions. Track configuration is of great importance for the redundancy group. If Track is incorrectly configured, the redundancy group might make wrong decisions.
a. For the redundancy group repeatedly activates members, check whether the associated track events are reported. In addition, check whether relationship of the interfaces is consistent with the nodes where the track entries are configured.
b. If no such problems exist, identify whether the track events match the interface status.
c. When a master/subordinate switchover occurs in the IRF system, identify whether the interfaces associated with the track event are in Positive status. If an interface is in Negative status, an anomaly exists.
d. If no such problems exist, identify whether the track entry status is consistent with that in the redundancy group.
# View the track entry status.
<sysname>dis track 5
Track ID: 5
State: Positive
Duration: 0 days 0 hours 0 minutes 6 seconds
Tracked object type: Interface
Notification delay: Positive 0, Negative 0 (in seconds)
Tracked object:
Interface: Route-Aggregation1
Protocol: None
# View the track entry status in the redundancy group.
<sysname>display redundancy group 1
Redundancy group 1 (ID 1):
Node ID Chassis Priority Status Track weight
1 Chassis1 100 Primary 255
2 Chassis2 50 Secondary 255
Preempt delay time remained : 0 min
Preempt delay timer setting : 1 min
Remaining hold-down time : 0 sec
Hold-down timer setting : 1 sec
Manual switchover request : No
Member interfaces:
Reth1
Reth2
Member failover groups:
1
2
Node 1:
Track info:
Track Status Reduced weight Interface
1 Positive 255 Blade1/2/0/1
3 Positive 255 Blade1/3/0/1
11 Positive 255 RAGG1
13 Positive 255 RAGG3
Node 2:
Track info:
Track Status Reduced weight Interface
2 Positive 255 Blade2/2/0/1
4 Positive 255 Blade2/3/0/1
12 Positive 255 RAGG2
14 Positive 255 RAGG4
If the information are not consistent, a track issue exists.
2. Verify that the weight processing for the redundancy is correct during IRF master/subordinate switchover
Each redundancy group node has a weight. The default value is 255. Each redundancy group node must be associated with at least one track entry. Each track entry corresponds to a weight increment value. When the track entry status becomes NotReady or Negative, the redundancy node substracts the associated weight increment from the current weight to obtain the new weight. When the track entry status becomes Positive, the redundancy node adds the associated weight increment to the current weight to obtain the new weight. When the weight is less than or equal to 0, the node is considered faulty and cannot operate correctly. A switchover or switchback operation is performed for the redundancy group.
# View the redundancy information as follows:
<sysname>display redundancy group 1
Redundancy group 1 (ID 1):
Node ID Chassis Priority Status Track weight
1 Chassis1 100 Secondary 0
2 Chassis2 50 Primary 255
Preempt delay time remained : 0 min
Preempt delay timer setting : 1 min
Remaining hold-down time : 0 sec
Hold-down timer setting : 1 sec
Manual switchover request : No
Member interfaces:
Reth1
Member failover groups:
1
2
Node 1:
Track info:
Track Status Reduced weight Interface
1 Positive 255 Blade1/2/0/1
3 Positive 255 Blade1/3/0/1
11 Negative(Faulty) 255 RAGG11
13 Positive 255 RAGG3
Node 2:
Track info:
Track Status Reduced weight Interface
2 Positive 255 Blade2/2/0/1
4 Positive 255 Blade2/3/0/1
12 Positive 255 RAGG2
14 Positive 255 RAGG4
3. If the issue persists, contact H3C Support.
Related commands
|
Command |
Description |
|
display redundancy group |
Displays redundancy group information. |
|
display track |
Displays track entry information. |
|
display reth interface Reth |
Displays Reth interface status. |
|
display interface |
Displays interface information. |
Troubleshooting NAT
Dynamic NAT failure
Symptom
Figure 4 Network diagram

Network configuration
Configure dynamic NAT on M9000 to allow PC1 to access PC2. The NAT address pool contains IP addresses 4.4.4.25 to 4.4.4.30. M9000 has two firewall modules.
M9000 configuration
nat address-group 0
address 4.4.4.25 4.4.4.30
interface Route-Aggregation1023
ip binding vpn-instance vpn11
ip address 192.168.1.254 24
interface Route-Aggregation1021
ip address 4.4.4.254 255.255.255.0
nat outbound address-group 0
Issues
Dynamic NAT fails or the NAT-translated packets cannot be forwarded correctly.
Solution
To resolve the issue:
1. Verify that NAT is configured correctly. This section uses outbound NAT as an example.
[sysname] display nat outbound
NAT outbound information:
There are 1 NAT outbound rules.
Interface: Route-Aggregation1021
ACL: --- Address group: 257 Port-preserved: N
NO-PAT: N Reversible: N
2. Use the debugging nat packet command to enable debugging for NAT packets and verify that packets can be translated correctly.
*Dec 13 09:58:48:082 2013 H3C NAT/7/COMMON: -Chassis=2-Slot=10.1;
PACKET: (Route-Aggregation1021-out) Protocol: TCP
192.168.1.2:13249 - 4.4.4.6: 21(VPN: 16) ------>
4.4.5.11:11000 - 4.4.4.6: 21(VPN: 0)
*Dec 13 09:58:48:083 2013 H3C NAT/7/COMMON: -Chassis=2-Slot=10.1;
PACKET: (Route-Aggregation1021-in) Protocol: TCP
4.4.4.6: 21 - 4.4.5.11:11000(VPN: 0) ------>
4.4.4.6: 21 - 192.168.1.2:13249(VPN: 16)
3. Use the display session table ipv4 verbose command to identify the engine on which sessions are created.
<sysname> display session table ipv4 verbose
Slot 0 in chassis 1:
Total sessions found: 0
Slot 3 in chassis 1:
Total sessions found: 0
CPU 0 on slot 4 in chassis 1:
Total sessions found: 0
Slot 6 in chassis 1:
Initiator:
Source IP/port: 192.168.1.2/13790
Destination IP/port: 4.4.4.6/21
DS-Lite tunnel peer: -
VPN instance/VLAN ID/VLL ID: vpn11/-/-
Protocol: TCP(6)
Responder:
Source IP/port: 4.4.4.6/21
Destination IP/port: 4.4.4.27/1060
DS-Lite tunnel peer: -
VPN instance/VLAN ID/VLL ID: vpn12/-/-
Protocol: TCP(6)
State: TCP_ESTABLISHED
Application: FTP
Start time: 2013-12-15 10:49:00 TTL: 3592s
Interface(in) : Route-Aggregation1023
Interface(out): Route-Aggregation1021
Zone(in) : Trust
Zone(out): menglei
Initiator->Responder: 3 packets 128 bytes
Responder->Initiator: 2 packets 130 bytes
4. Verify that the service module that processes flows redirected based on OpenFlow entries is the service module that creates the session entries.
For dynamic NAT, NAT entries are deployed to each service module.
[H3C-probe] display system internal openflow instance inner flow-table
Flow entry rule 6 information:
cookie: 0x0, priority: 7301, hard time: 0, idle time: 0, flags: check_overlap
|reset_counts|no_pkt_counts|no_byte_counts, byte count: --, packet count: --
Match information:
Input interface: RAGG1021
Ethernet type: 0x0800
IP Range: IPv4 destination address from 4.4.4.25 to 4.4.4.27
Instruction information:
Write actions:
Output interface: Blade2/4/0/1
Flow entry rule 7 information:
cookie: 0x0, priority: 7301, hard time: 0, idle time: 0, flags: check_overlap
|reset_counts|no_pkt_counts|no_byte_counts, byte count: --, packet count: --
Match information:
Input interface: RAGG1021
Ethernet type: 0x0800
IP Range: IPv4 destination address from 4.4.4.28 to 4.4.4.30
Instruction information:
Write actions:
Output interface: Blade2/10/0/1
5. If the issue persists, contact H3C Support.
Static NAT444 failure
Symptom
Figure 5 Network diagram

Network configuration
Configure static NAT444 on M9000 to allow PC1 to access PC2. The public address pool contains IP addresses 4.4.5.11 to 4.4.5.13. M9000 has two firewall modules.
M9000 configuration
# Configure NAT444 port block group.
nat port-block-group 256
local-ip-address 192.168.1.2 192.168.1.11 vpn-instance vpn11
global-ip-pool 4.4.5.11 4.4.5.12
block-size 1000
port-range 10000 19000
# Configure the input interface.
interface Route-Aggregation1023
ip binding vpn-instance vpn11
ip address 192.168.1.254 24
# Configure the output interface.
interface Route-Aggregation1021
ip address 4.4.4.254 255.255.255.0
nat outbound port-block-group 256
# Configure routes from vpn11 to the public network. (Details not shown.)
Issues
NAT444 fails, or the NAT-translated packets or return packets cannot be forwarded correctly.
Solution
To resolve the issue:
1. Verify that the port block group is configured correctly.
<sysname> display nat port-block-group 256
Port block group 256:
Port range: 10000-19000
Block size: 1000
Local IP address information:
Start address End address VPN instance
192.168.1.2 192.168.1.11 vpn11
Global IP pool information:
Start address End address
4.4.5.11 4.4.5.12
2. Verify that the number of port blocks and public addresses meet the private address requirements.
The port block for each private network has 1000 ports.
The private address range 192.168.1.2 to 192.168.1.11 requires 10 port blocks.
The port range is 10000 to 19000. Each public address can provide nine port blocks.
Ten private addresses require two public addresses. The settings meet the requirements.
3. Use the debugging nat packet command to enable debugging for NAT packets and verify that packets can be translated correctly.
4. Use the display session table ipv4 verbose command to verify that session information is correct.
5. Verify that the flow entries are deployed correctly.
[H3C-probe] display system internal openflow instance inner flow-table
Flow entry rule 24 information:
cookie: 0x0, priority: 7521, hard time: 0, idle time: 0, flags: check_overlap
|reset_counts|no_pkt_counts|no_byte_counts, byte count: --, packet count: --
Match information:
Input interface: RAGG1021
Ethernet type: 0x0800
IP Range: IPv4 destination address from 4.4.5.11 to 4.4.5.12
Instruction information:
Write actions:
Output interface: Blade2/10/0/1
Flow entry rule 25 information:
cookie: 0x0, priority: 7500, hard time: 0, idle time: 0, flags: check_overlap
|reset_counts|no_pkt_counts|no_byte_counts, byte count: --, packet count: --
Match information:
Ethernet type: 0x0800
IP Range: IPv4 source address from 192.168.1.2 to 192.168.1.11
VRF index: 16
[sysname] display ip vpn-instance instance-name
Instruction information:
Write actions:
Output interface: Blade2/10/0/1
Flow entry rule 26 information:
cookie: 0x0, priority: 7501, hard time: 0, idle time: 0, flags: check_overlap
|reset_counts|no_pkt_counts|no_byte_counts, byte count: --, packet count: --
Match information:
Ethernet type: 0x0800
IP Range: IPv4 destination address from 192.168.1.2 to 192.168.1.11
VRF index: 16
Instruction information:
Write actions:
Output interface: Blade2/10/0/1
A total of three flow entries are deployed. For static NAT444, all flow entries are deployed to the main security engine.
Use the display blade-controller-team default command to identify the main security engine.
<M9KS-2>display blade-controller-team Default
ID: 1 Name: Default
Chassis Slot CPU Status LBGroupID
2 3 1 Normal 1
* 2 4 1 Normal 1
* : Primary blade controller of the team.
¡ IP Range:IPv4 destination address from 4.4.5.11 to 4.4.5.11—Indicates the security engine to which the traffic (addresses after NAT translation) from PC2 to PC1 is sent.
¡ IP Range:IPv4 source address from 192.168.1.2 to 192.168.1.2—Indicates the security engine to which the traffic from PC1 to PC2 is sent.
¡ IP Range:IPv4 destination address from 192.168.1.2 to 192.168.1.2—Indicates the security engine to which the traffic from another PC (on the same network side as PC1) to PC1 is sent.
6. Verify that the session entries and flow entries are consistent.
7. If the issue persists, contact H3C Support.
NAT failure when the outbound interface can be pinged from the external network
Symptom
M9000 acts as the gateway at the network egress. NAT fails on the gateway and the internal and external users cannot reach each other, but the outbound interface can be pinged from the external network.
Solution
To resolve the issue:
1. Verify that the NAT address pool is in the same subnet as the interface. If they are in different subnets, make sure a route to the NAT address pool is configured on the peer end.
2. If the NAT address pool or the NAT server address is in the same subnet as the interface, verify that the address pool or the NAT server can send gratuitous ARP packets and the peer end has learned correct MAC addresses. You can verify gratuitous ARP packet sending on a directly connected device.
A device cannot detect link failure of a non-directly connected device and cannot update the corresponding ARP entry. When the device comes onine, the local interface send gratuitous ARP packets carrying the address of the sending device. Devices that receive the gratuitous ARP packets update their ARP entries. The address pool might fail to update its addresses in time.
3. Enable debugging or capture packets on the gateway, and verify that ping packets can be forwarded correctly.
4. Ping the NAT address pool or NAT server continuously. Enable ARP debugging and verify that ARP packets can be received correctly.
5. If the issue persists, contact H3C Support.
Related commands
|
Command |
Description |
|
display nat outbound |
Displays outbound dynamic NAT configuration. |
|
display nat server |
Displays NAT server mappings. |
|
display blade-controller-team Default |
Displays the main security engine of the security engine group. |
|
display openflow instance |
Displays flow entry information. |
|
display session |
Displays session information. |
|
save |
Saves the running configuration to a configuration file. |
Troubleshooting IPsec and IKE
IPsec SAs established successfully but IPsec-protected traffic cannot be forwarded
Symptom
An IKE-based IPsec tunnel is established successfully between M9000-1 and M9000-2 to protect the traffic between PC 1 and PC 2, but the PCs cannot ping each other.
Figure 6 Network diagram
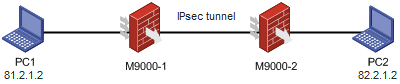
Settings on M9000-1:
· The local address and remote address of the IPsec tunnel are 9.9.9.9 and 9.9.9.19, respectively.
· The ACL rule for IPsec:
rule 0 permit ip source 81.2.0.0 0.0.0.255 destination 82.2.0.0 0.0.0.255
Settings on M9000-2:
· The local address and remote address of the IPsec tunnel are 9.9.9.19 and 9.9.9.9, respectively.
· The ACL rule for IPsec:
rule 0 permit ip source 82.2.0.0 0.0.0.255 destination 81.2.0.0 0.0.0.255
Solution
To resolve the issue:
1. Verify that the IKE SAs and IPsec SAs have been established on M9000-1, and the status of the IPsec SAs and the OpenFlow entries deployed by IPsec is active.
# Display the IKE SAs on M9000-1.
[sysname]dis ike sa
Connection-ID Remote Flag DOI
------------------------------------------------------------------
1 9.9.9.9 RD IPsec
Flags:
RD--READY RL--REPLACED FD-FADING RK-REKEY
# Display the IPsec SAs generated on M9000-1.
[sysname]dis ipsec sa
-------------------------------
Interface: Ten-GigabitEthernet8/2/20
-------------------------------
-----------------------------
IPsec policy: ipsec
Sequence number: 1
Mode: ISAKMP
Flow table status: Active
-----------------------------
Tunnel id: 0
Encapsulation mode: tunnel
Perfect Forward Secrecy:
Inside VPN:
Extended Sequence Numbers enable: N
Traffic Flow Confidentiality enable: N
Path MTU: 1428
Tunnel:
local address: 9.9.9.19
remote address: 9.9.9.9
Flow:
sour addr: 152.2.0.0/255.255.0.0 port: 0 protocol: ip
dest addr: 151.1.0.0/255.255.0.0 port: 0 protocol: ip
[Inbound ESP SAs]
SPI: 42602698 (0x028a10ca)
Connection ID: 4294967296
Transform set: ESP-ENCRYPT-AES-CBC-128 ESP-AUTH-SHA1
SA idle time: 86400
SA duration (kilobytes/sec): 1843200/3600
SA remaining duration (kilobytes/sec): 1843199/3154
Max received sequence-number: 4
Anti-replay check enable: Y
Anti-replay window size: 64
UDP encapsulation used for NAT traversal: N
Status: Active
[Outbound ESP SAs]
SPI: 3182510800 (0xbdb142d0)
Connection ID: 4294967297
Transform set: ESP-ENCRYPT-AES-CBC-128 ESP-AUTH-SHA1
SA idle time: 86400
SA duration (kilobytes/sec): 1843200/3600
SA remaining duration (kilobytes/sec): 1843199/3154
Max sent sequence-number: 4
UDP encapsulation used for NAT traversal: N
Status: Active
2. Verify that the flow entries have been deployed by IPsec on the interface modules of M9000-2.
If phase 1 and phase 2 negotiations are successful, IPsec deploys two OpenFlow entries:
¡ For encryption, upon receiving a clear text packet, IPsec deploys an entry in the form of an ACL rule indicating the source address and destination address of the flow.
¡ For decryption, upon receiving an encrypted packet, IPsec deploys an entry indicating the source and destination IP addresses of the tunnel, and the VRF index.
[h3c-probe]display system internal openflow instance inner-redirect flow-tab
le
Instance 4097 flow table information:
Flow entry 41 information:
cookie: 0x0, priority: 8102, hard time: 0, idle time: 0, flags: check_overlap
|reset_counts|no_pkt_counts|no_byte_counts, byte count: --, packet count: --
Match information:
Ethernet type: 0x0800
IP protocol: 50
IPv4 source address: 9.9.9.19, mask: 255.255.255.255
IPv4 destination address: 9.9.9.9, mask: 255.255.255.255
VRF index: 0
Instruction information:
Write actions:
Group: 4026531873
Flow entry 42 information:
cookie: 0x0, priority: 8300, hard time: 0, idle time: 0, flags: check_overlap
|reset_counts|no_pkt_counts|no_byte_counts, byte count: --, packet count: --
Match information:
IPv4 source address: 151.1.0.0, mask: 255.255.0.0
IPv4 destination address: 152.2.0.0, mask: 255.255.0.0
Instruction information:
Write actions:
Group: 4026531873
3. Verify that the flow entries have been deployed by IPsec on the service modules of M9000-2.
[h3c-probe]display system internal openflow instance inner flow-table
Instance 4096 flow table information:
Flow entry 21 information:
cookie: 0x0, priority: 8102, hard time: 0, idle time: 0, flags: check_overlap
|reset_counts|no_pkt_counts|no_byte_counts, byte count: --, packet count: --
Match information:
Ethernet type: 0x0800
IP protocol: 50
IPv4 source address: 9.9.9.19, mask: 255.255.255.255
IPv4 destination address: 9.9.9.9, mask: 255.255.255.255
VRF index: 0
Instruction information:
Write actions:
Group: 4026531873
Flow entry 22 information:
cookie: 0x0, priority: 8300, hard time: 0, idle time: 0, flags: check_overlap
|reset_counts|no_pkt_counts|no_byte_counts, byte count: --, packet count: --
Match information:
Ethernet type: 0x0800
IPv4 source address: 151.1.0.0, mask: 255.255.0.0
IPv4 destination address: 152.2.0.0, mask: 255.255.0.0
Instruction information:
Write actions:
Group: 4026531873
4. Use the reset ipsec sa and reset ike sa commands to clear and re-establish IPsec SAs and IKE SAs.
5. If the issue persists, contact Technical Support.
IPsec exceptions occur when the master firewall in IRF fabric goes down
Symptom
Firewalls M9000-1 and M9000-2 form an IRF fabric, where M9000-1 is the master and M9000-2 is the backup. An IKE-based IPsec tunnel is established successfully between the FW and the IRF fabric to protect the traffic between PC 1 and PC 2. Normally, the IPsec traffic is transmitted on M9000-1. When M9000-1 becomes down, the PCs cannot ping each other.
Figure 7 Network diagram
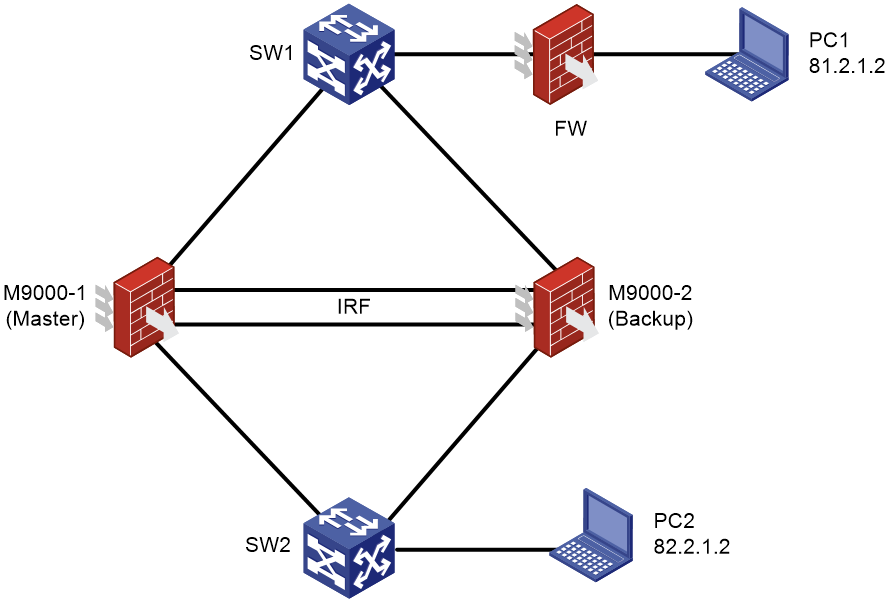
Solution
To resolve the issue:
1. Verify that the IKE SAs and IPsec SAs have been established on M9000-2.
2. If the IKE SAs and IPsec SAs have not been established on M9000-2, use the display system internal openflow instance command to verify that IPsec-related flow entries exist on M9000-2.
For example, the following output shows that IPsec-related flow entries have not been cleared after the master firewall M9000-1 is down. Therefore, no new SAs can be established.
[h3c-probe]display system internal openflow instance inner-redirect flow-table
Instance 4097 flow table information:
Flow entry 41 information:
cookie: 0x0, priority: 8102, hard time: 0, idle time: 0, flags: check_overlap
|reset_counts|no_pkt_counts|no_byte_counts, byte count: --, packet count: --
Match information:
Ethernet type: 0x0800
IP protocol: 50
IPv4 source address: 9.9.9.19, mask: 255.255.255.255
IPv4 destination address: 9.9.9.9, mask: 255.255.255.255
VRF index: 0
Instruction information:
Write actions:
Group: 4026531873
Flow entry 42 information:
cookie: 0x0, priority: 8300, hard time: 0, idle time: 0, flags: check_overlap
|reset_counts|no_pkt_counts|no_byte_counts, byte count: --, packet count: --
Match information:
IPv4 source address: 151.1.0.0, mask: 255.255.0.0
IPv4 destination address: 152.2.0.0, mask: 255.255.0.0
Instruction information:
Write actions:
3. Perform a master-to-backup switchover, and verify that the current IPsec SAs can be re-established.
After master-to-backup switchover, if the service modules processing IPsec services on the master device or the master device becomes down, IPsec SAs can be re-established through the backup device. If the IPsec SAs are not established, go to the next step.
4. Use the reset ipsec sa and reset ike sa commands to clear and re-establish IPsec SAs and IKE SAs.
5. Use the debugging ipsec and debugging ike commands to debug exceptions.
6. If the issue persists, contact Technical Support.
Related commands
|
Command |
Description |
|
display ike sa |
Displays IKE SA information. |
|
display ipsec sa |
Displays IPsec SA information. |
|
display system internal openflow instance |
Displays instance and flow table information. |
|
reset ike sa |
Clears IKE SAs. |
|
reset ipsec sa |
Clears IPsec SAs. |
|
save |
Saves the running configuration to the specified file. |
Troubleshooting SSL VPN
This section provides troubleshooting information for SSL VPN.
Failure to log in to the SSL VPN Web interface
Symptom
The client can ping the SSL VPN gateway, but it cannot open the SSL VPN login page.
Solution
1. Verify that a PKI domain has been specified in SSL server policy view.
[sysname] ssl server-policy XXX
[H3C-ssl-server-policy-XXX] dis this
ssl server-policy XXX
pki-domain ssl
return
2. Verify that a CA certificate and local certificate have been imported to the PKI domain. Make sure the local certificate is a certificate issued by the CA to a server, not a certificate for a client.
Use the following command to view certificate information for a PKI domain:
display pki certificate domain XXXX ca
display pki certificate domain XXXX local
3. If you import certificates or modify the SSL server policy after the SSL VPN gateway is enabled, you must re-enable the SSL VPN gateway to make the configurations take effect.
Execute the following commands in sequence to re-enable the SSL VPN gateway:
¡ undo service enable
¡ service enable
Related commands
|
Command |
Description |
|
ssl server-policy policy-name |
Creates an SSL server policy and enters SSL server policy view. |
|
pki-domain domain-name |
Specifies the PKI domain used by the SSL server policy. |
|
display pki certificate domain domain-name { ca | local } |
Displays certificate information. |
|
sslvpn gateway gateway-name |
Creates an SSL VPN gateway and enters SSL VPN gateway view. |
|
service enable |
Enables the SSL VPN gateway. |
Troubleshooting load balancing
Traffic forwarding failure from client to server when the virtual and real servers are active in Layer 4 server load balancing
Symptom
As shown in Figure 8, physical servers Server A, Server B, and Server C provide FTP services, and are in descending order of hardware configuration. Configure server load balancing on the device to distribute user requests among the servers based on their hardware performance, and use health monitoring to monitor the reachability of the servers.
Configure virtual server vs on the network. The virtual server and real servers rs1, rs2, and rs3 are all active, but the client cannot access the virtual server address.
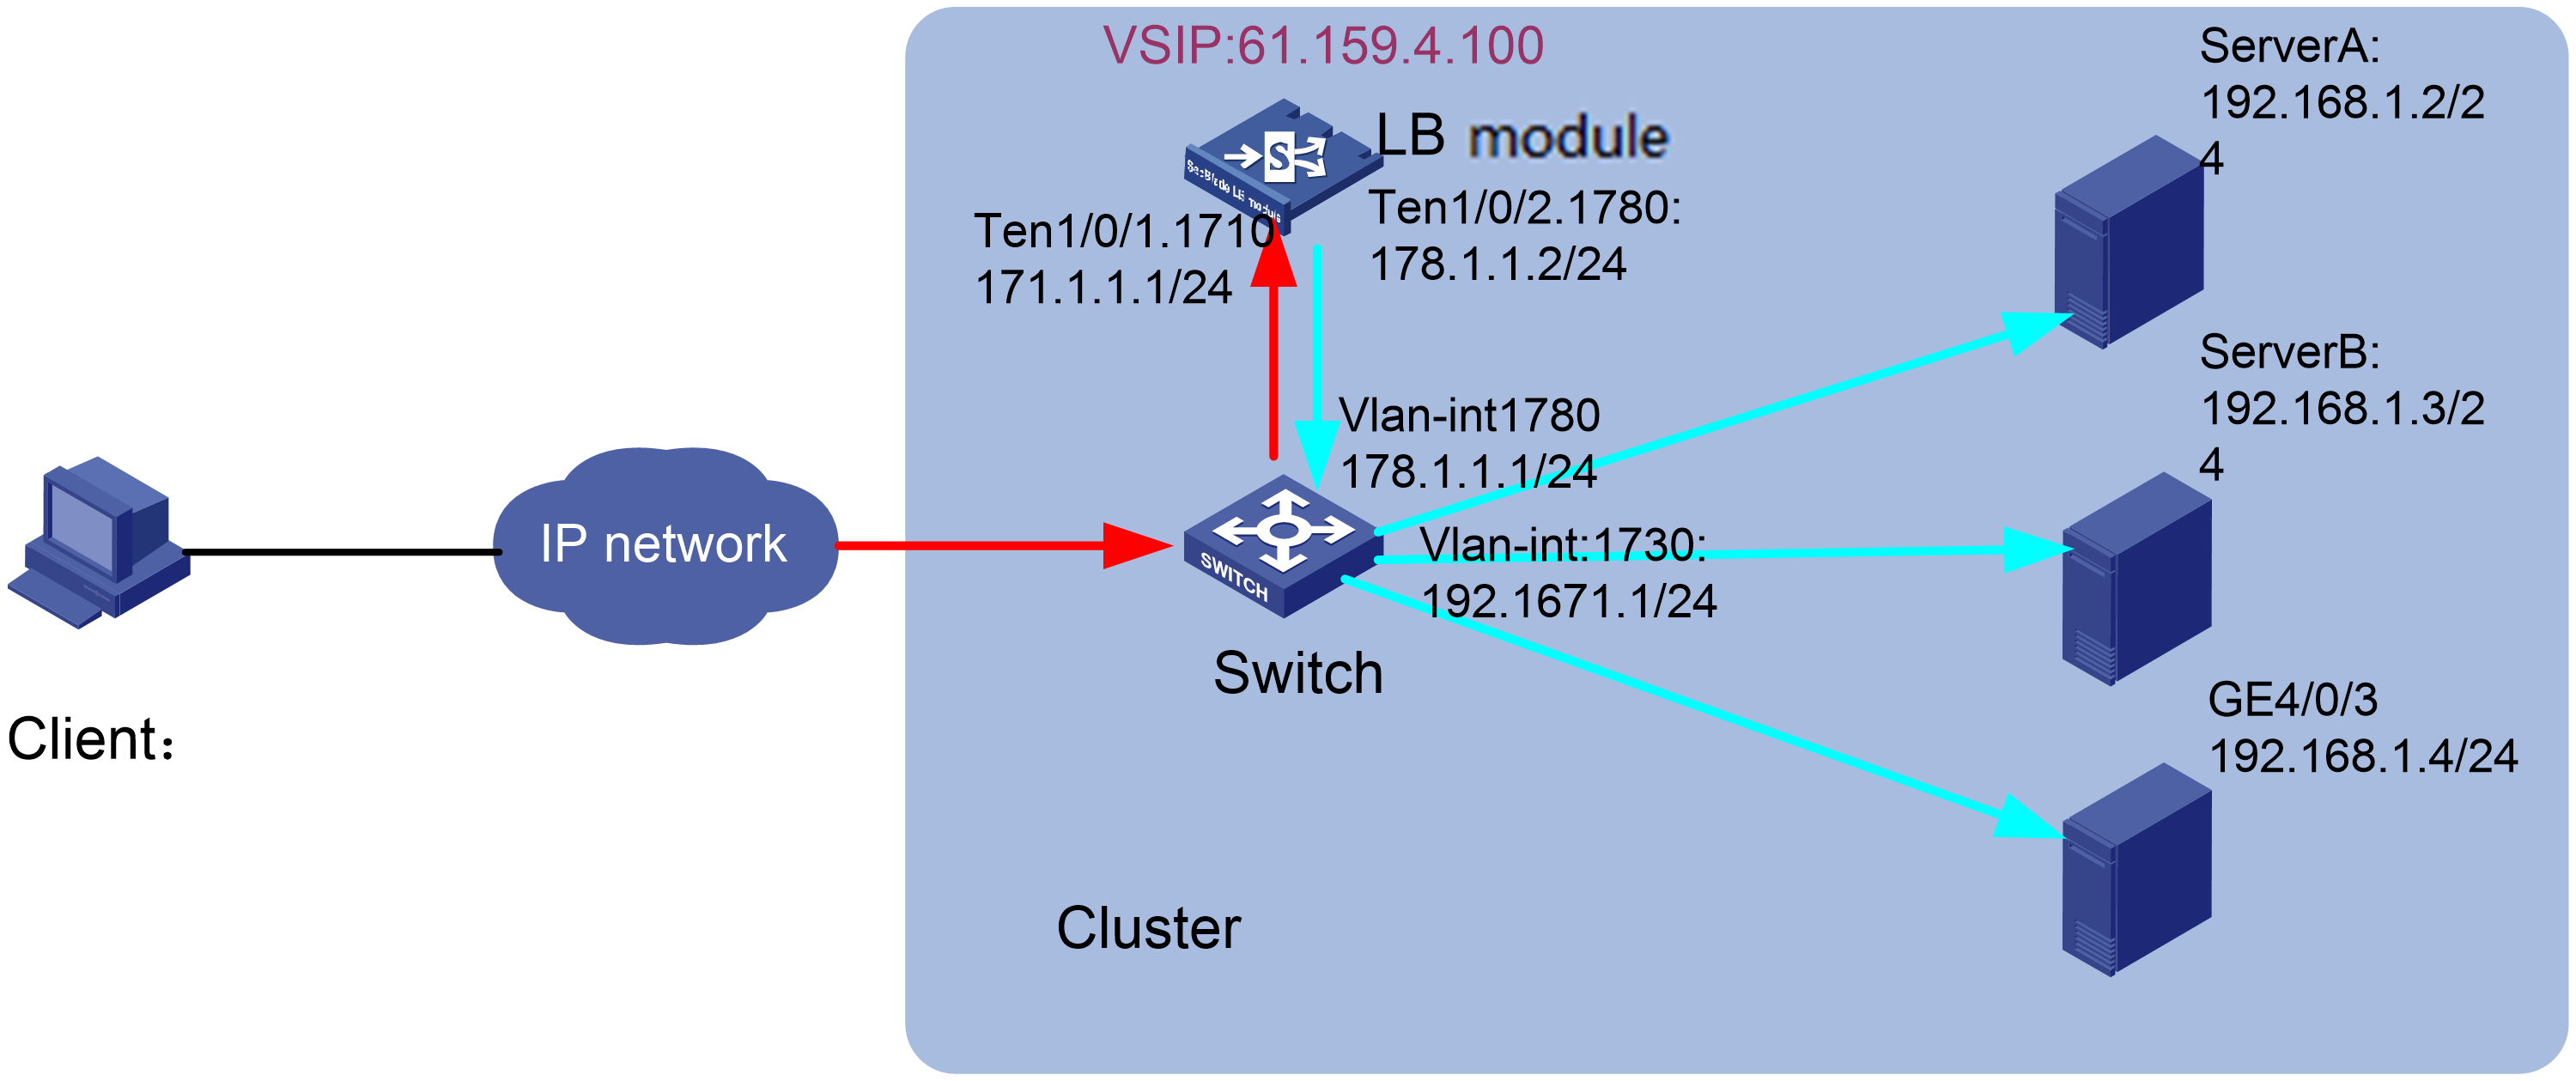
The following is the configuration procedure:
1. Configure a server farm.
# Create the ICMP NQA template t1.
#
nqa template icmp t1
#
Create the server farm sf, and specify the scheduling algorithm as weighted round robin and health monitoring method as t1.
#
server-farm sf
probe t1
#
2. Configure real servers.
# Create real server rs1 with IPv4 address 192.168.1.1 and weight 150, and add it to server farm sf.
#
real-server rs1
ip address 192.168.1.1
weight 150
server-farm sf
#
# Create real server rs2 with IPv4 address 192.168.1.2 and weight 120, and add it to server farm sf.
#
real-server rs2
ip address 192.168.1.2
weight 120
server-farm sf
#
# Create real server rs3 with IPv4 address 192.168.1.3 and weight 80, and add it to server farm sf.
#
real-server rs3
ip address 192.168.1.3
weight 80
server-farm sf
#
3. Configure a virtual server.
# Create TCP virtual server vs with VSIP 61.159.4.100, specify its default primary server farm sf, and enable the virtual server.
#
virtual-server vs type tcp
virtual ip address 61.159.4.100
default server-farm sf
service enable
#
Solution
1. View the virtual server statistics on the LB device to verify the reachability between the client and the LB device and the packet loss of the virtual server.
If the client cannot reach the LB device, the virtual server has no statistics. In this scenario, resolve the reachability issue and view the statistics again. If the statistics shows that packets are lost, enable debugging for load balancing or perform PCAP analysis on the client.
# Display statistics of virtual server vs.
[LB] display virtual-server statistics name vs
Slot 1:
Virtual server: vs
Total connections: 10
Active connections: 3
Max connections: 3
Connections per second: 0
Max connections per second: 1
Client input: 3210 bytes
Client output: 14074 bytes
Throughput: 0 bytes/s
Max throughput: 7554 bytes/s
Received packets: 1365
Sent packets: 2796
Dropped packets: 0
2. If the virtual server statistics is normal and has no packet loss, identify whether real servers in the server farm have packet loss.
If a real server has packet loss, enable debugging for load balancing or perform PCAP analysis on the responding server. From the results, verify the reachability between the real server and the LB device, and identify whether the service or port is enabled on the real server.
# Display statistics of real servers.
[LB] display real-server statistics name rs1
Slot 1:
Real server: rs1
Total connections: 5
Active connections: 1
Max connections: 1
Connections per second: 0
Max connections per second: 1
Server input: 307462 bytes
Server output: 27460 bytes
Throughput: 0 bytes/s
Max throughput: 316457 bytes/s
Received packets: 319
Sent packets: 236
Dropped packets: 0
Received requests: 0
Dropped requests: 0
Sent responses: 0
Dropped responses: 0
[LB]display real-server statistics name rs2
Slot 1:
Real server: rs2
Total connections: 2
Active connections: 1
Max connections: 1
Connections per second: 0
Max connections per second: 1
Server input: 870147 bytes
Server output: 45163 bytes
Throughput: 0 bytes/s
Max throughput: 580348 bytes/s
Received packets: 748
Sent packets: 511
Dropped packets: 0
Received requests: 0
Dropped requests: 0
Sent responses: 0
Dropped responses: 0
[LB]display real-server statistics name rs3
Slot 1:
Real server: rs3
Total connections: 2
Active connections: 1
Max connections: 1
Connections per second: 0
Max connections per second: 1
Server input: 870147 bytes
Server output: 45163 bytes
Throughput: 0 bytes/s
Max throughput: 580348 bytes/s
Received packets: 178
Sent packets: 311
Dropped packets: 0
Received requests: 0
Dropped requests: 0
Sent responses: 0
Dropped responses: 0
3. If no issues are identified from the statistics, enable debugging for load balancing and locate the failure from debugging information.
4. If the issue persists, contact H3C Support.
High CPU usage and memory usage
Symptom
Packet loss occurs on the virtual server, NQA operations fail, or concurrent connection count is low and new connections fail.
Solution
1. Display the real server state.
High CPU usage might cause failed NQA operations or packet loss on the virtual server. High memory usage causes new requests to be discarded.
2. If the issue persist, contact H3C Support.
Uneven load balancing
Symptom
Load balancing is uneven.
Solution
1. View real server statistics. Use the round robin algorithm for load balancing.
2. Use the least connection or random algorithm. The LB card has multiple CPU cores. Load balancing is performed per core. For this reason, connections might be distributed unevenly across real servers.
3. If the source IP address hash algorithm is used, make sure the number of source IP addresses is sufficient.
4. Configure an LB policy to achieve more granular traffic classification. Adjust the server state based on service requirements and actual network environment.
Related commands
|
Command |
Description |
|
debugging lb all |
Enables all debugging functions for load balancing. |
|
debugging lb error |
Enables load balancing error debugging. |
|
debugging lb event |
Enables load balancing event debugging. |
|
debugging lb fsm |
Enables load balancing state machine debugging. |
|
debugging lb packet |
Enables load balancing packet debugging. |
|
display real-server statistics [ name real-server-name ] |
Displays real server statistics. |
|
display virtual-server statistics [ name virtual-server-name ] |
Displays virtual server statistics. |
|
reset real-server statistics [ real-server-name ] |
Clears real server statistics. |
|
reset virtual-server statistics [ virtual-server-name ] |
Clears virtual server statistics. |
Troubleshooting DPI
Normal traffic blocked by IPS
Symptom
As shown in Figure 9, the security gateway is deployed to control access between the LAN and the Internet. IPS is configured on the security gateway to prevent attacks. The security gateway incorrectly blocks normal traffic from an internal user and generates an IPS attack log.
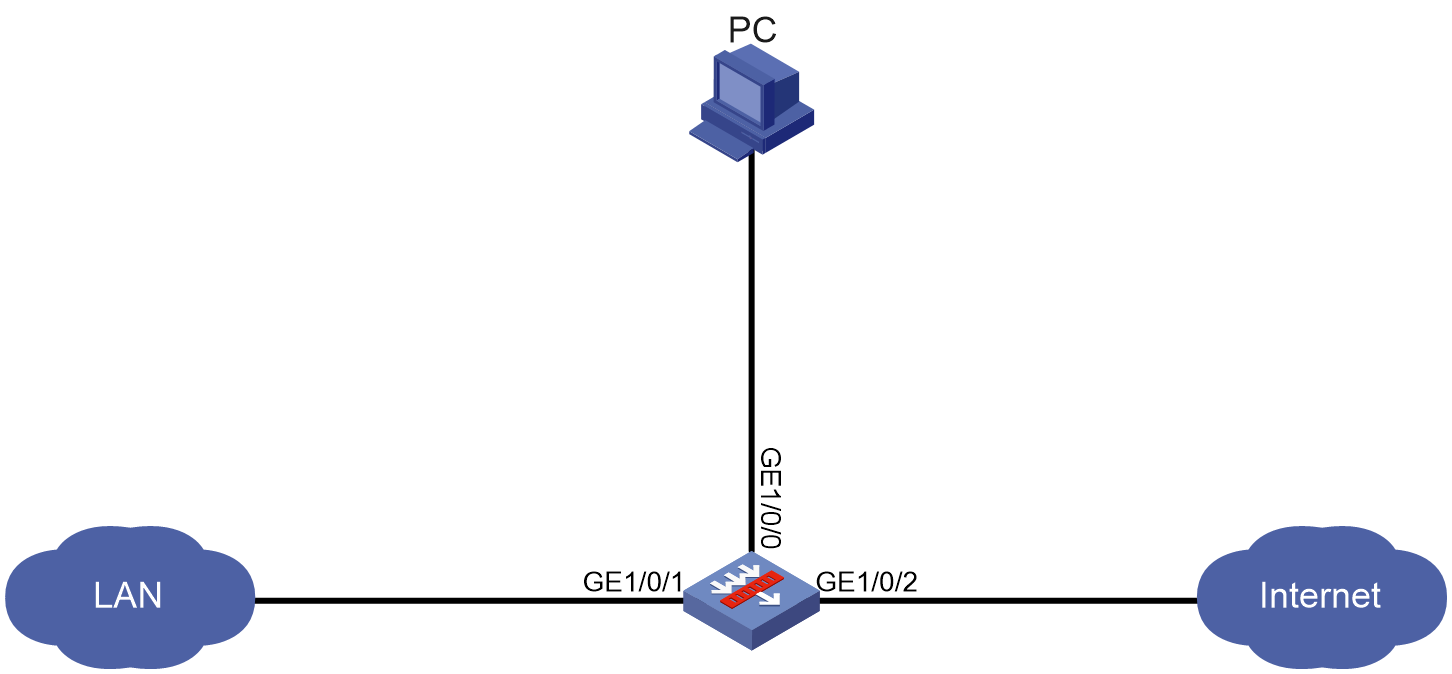
The following is the configuration procedure:
# Enable IPS in an interzone policy.
#
app-profile 3_5_54752_IPv4
ips apply policy default mode protect
#
object-policy ip Trust-Untrust
rule 54752 inspect 3_5_54752_IPv4
#
zone-pair security source Trust destination Untrust
object-policy apply ip Trust-Untrust
#
Solution
To resolve the issue:
1. View the attack log to check whether the source IP address and port number are the IP address and port number of the client and whether the destination IP address and port number are the IP address and port number of the server. If yes, record the attack ID in the attack log.
2. Create an IPS policy, disable the IPS signature or set the action to permit and logging, and reference the IPS policy in an interzone policy.
3. Capture the packets of the client and analyze them. If the packets are mistakenly blocked, modify the signature settings. If the packets should be blocked, permit the corresponding signature.
Related commands
|
Command |
Description |
|
ips policy policy-name |
An IPS policy named default exists. You cannot delete the default IPS policy or modify its signatures. |
|
signature override { pre-defined | user-defined } signature-id { { disable | enable } [ { block-source | drop | permit | redirect | reset } | capture | logging ] * } |
Predefined IPS signatures use the actions and states defined by the system. User-defined IPS signatures use the actions and states defined in the IPS signature file from which the signatures are imported. The signature actions and status in the default IPS policy cannot be modified. |
Troubleshooting system resource usage issues
This section provides troubleshooting information for system management.
High CPU usage
Symptom
The CPU usage of the device remains over 60%, and command executions are very slow.
<sysname> display cpu-usage
Chassis 1 Slot 0 CPU 0 CPU usage:
1% in last 5 seconds
2% in last 1 minute
2% in last 5 minutes
Chassis 1 Slot 4 CPU 0 CPU usage:
1% in last 5 seconds
4% in last 1 minute
4% in last 5 minutes
Chassis 1 Slot 7 CPU 0 CPU usage:
84% in last 5 seconds
27% in last 1 minute
27% in last 5 minutes
Chassis 1 Slot 8 CPU 0 CPU usage:
3% in last 5 seconds
6% in last 1 minute
6% in last 5 minutes
Chassis 1 Slot 9 CPU 0 CPU usage:
3% in last 5 seconds
6% in last 1 minute
6% in last 5 minutes
Chassis 2 Slot 0 CPU 0 CPU usage:
0% in last 5 seconds
2% in last 1 minute
2% in last 5 minutes
Chassis 2 Slot 4 CPU 0 CPU usage:
0% in last 5 seconds
4% in last 1 minute
4% in last 5 minutes
Chassis 2 Slot 6 CPU 0 CPU usage:
3% in last 5 seconds
6% in last 1 minute
6% in last 5 minutes
Chassis 2 Slot 7 CPU 0 CPU usage:
3% in last 5 seconds
6% in last 1 minute
6% in last 5 minutes
Chassis 2 Slot 8 CPU 0 CPU usage:
15% in last 5 seconds
6% in last 1 minute
6% in last 5 minutes
Chassis 2 Slot 9 CPU 0 CPU usage:
3% in last 5 seconds
6% in last 1 minute
6% in last 5 minutes
The command output displays the CPU usage information on each slot of each chassis in an IRF fabric.
The display cpu-usage history command displays the CPU usage in the most recent 60 minutes. If the value on the horizontal axis is 20, the value on the vertical axis represents the CPU usage of 20 minutes ago.
<sysname> display cpu-usage history
100%|
95%|
90%|
85%|
80%|
75%|
70%|
65%|
60%|
55%|
50%|
45%|
40%|
35%|
30%|
25%|
20%|
15%|
10%|
5%| #
------------------------------------------------------------
10 20 30 40 50 60 (minutes)
cpu-usage (CPU 0) last 60 minutes (SYSTEM)
Solution
To resolve the issue:
1. Verify whether too many routing policies have been configured.
Use the display route-policy command to view the configured routing policies and determine whether too many routing policies have been configured leading to high CPU usage.
<sysname> display route-policy
Route-policy: policy1
permit : 1
if-match cost 10
continue: next node 11
apply comm-list a delete
2. Check for traffic loops.
When a traffic loop occurs, the network flaps and a large number of protocol packets are sent to the CPU for processing, which might result in high CPU usage. A traffic loop might cause broadcasting. Many ports of the device have to process a large amount of traffic, causing the port utilization rate to reach 90% or more.
<sysname>display interface Ten-GigabitEthernet6/0/11
Ten-GigabitEthernet6/0/11
Current state: UP
Line protocol state: UP
Description: Ten-GigabitEthernet6/0/11 Interface
Bandwidth: 10000000 kbps
Maximum transmission unit: 1500
Allow jumbo frames to pass
Broadcast max-ratio: 100%
Multicast max-ratio: 100%
Unicast max-ratio: 100%
Internet protocol processing: Disabled
IP packet frame type: Ethernet II, hardware address: 1234-660e-0012
IPv6 packet frame type: Ethernet II, hardware address: 1234-660e-0012
Media type is optical fiber,Port hardware type is 10G_BASE_SR_SFP
Output queue - Urgent queuing: Size/Length/Discards 0/1024/0
Output queue - Protocol queuing: Size/Length/Discards 0/500/0
Output queue - FIFO queuing: Size/Length/Discards 0/75/0
10Gbps-speed mode, Full-duplex mode
Link speed type is autonegotiation, link duplex type is autonegotiation
Flow-control is not enabled
The Maximum Frame Length is 9216
Last link flapping: 1 hours 31 minutes 7 seconds
Last clearing of counters: 09:48:08 Mon 12/28/2020
Current system time:2020-12-28 11:06:14 Beijing+08:00:00
Last time when physical state changed to up:2020-12-28 09:35:07 Beijing+08:00:00
Last time when physical state changed to down:2020-12-28 09:34:55 Beijing+08:00:00
Peak input rate: 29 bytes/sec, at 2020-12-28 09:54:00
Peak output rate: 373 bytes/sec, at 2020-12-28 10:40:17
Last 300 second input: 0 packets/sec 24 bytes/sec 0%
Last 300 second output: 2 packets/sec 212 bytes/sec 0%
Input (total): 785 packets, 116898 bytes
5 unicasts, 0 broadcasts, 780 multicasts, 0 pauses
Input (normal): 785 packets, - bytes
5 unicasts, 0 broadcasts, 780 multicasts, 0 pauses
Input: 0 input errors, 0 runts, 0 giants, 0 throttles
0 CRC, 0 frame, - overruns, 0 aborts
- ignored, - parity errors
Output (total): 10296 packets, 1119042 bytes
772 unicasts, 0 broadcasts, 9524 multicasts, 0 pauses
Output (normal): 10296 packets, - bytes
772 unicasts, 0 broadcasts, 9524 multicasts, 0 pauses
Output: 0 output errors, - underruns, - buffer failures
0 aborts, 0 deferred, 0 collisions, 0 late collisions
0 lost carrier, - no carrier
If a traffic loop occurs, perform the following steps:
a. Verify whether the link connection and port configuration are correct.
b. Verify whether STP is enabled on the connected switch, and whether the configuration is correct.
c. Verify whether the routing configuration is correct and whether a routing loop exists.
3. Verify whether the packets are fast forwarded.
Execute the display ip fast-forwarding cache command to view whether the forwarding entry for the packets exist in the output. If the entry does not exist, the packets are not fast forwarded.
<sysname> display ip fast-forwarding cache
Total number of fast-forwarding entries: 10
SIP SPort DIP DPort Pro Input_If Output_If Flg
192.168.96.39 162 192.168.210.20 11586 17 M-GE1/0/0/0 InLoop0 1
192.168.96.18 162 192.168.210.20 11585 17 M-GE1/0/0/0 InLoop0 1
192.168.96.16 162 192.168.210.20 11584 17 M-GE1/0/0/0 InLoop0 1
12.1.1.1 3784 12.1.1.2 49216 17 N/A InLoop0 1
192.168.210.20 11585 192.168.96.18 162 17 InLoop0 M-GE1/0/0/0 1
192.168.210.20 11584 192.168.96.16 162 17 InLoop0 M-GE1/0/0/0 1
192.168.210.20 11586 192.168.96.39 162 17 InLoop0 M-GE1/0/0/0 1
12.1.1.2 49216 12.1.1.1 3784 17 InLoop0 N/A 1
192.168.96.40 50356 192.168.210.20 23 6 M-GE1/0/0/0 InLoop0 1
192.168.210.20 23 192.168.96.40 50356 6 InLoop0 M-GE1/0/0/0 1
You can also enter an IP address in the command to verify whether the packets that use the IP address as the source or destination IP address are fast forwarded.
<sysname> display ip fast-forwarding cache 12.1.1.1
Total number of fast-forwarding entries: 2
SIP SPort DIP DPort Pro Input_If Output_If Flg
12.1.1.2 49216 12.1.1.1 3784 17 InLoop0 N/A 1
12.1.1.1 3784 12.1.1.2 49216 17 RAGG5.3101 InLoop0 1
4. If the issue persists, execute the display cpu-usage command and provide the command output together with other related information to H3C Support for analysis.
High memory usage
Symptom
The memory usage of a card stays above 70%.
Use the display memory command to display the memory usage of a card. In the command output, Total indicates total memory size, Used indicates used memory size, and FreeRatio indicate free memory ratio.
<sysname> display memory chassis 1 slot 2
Memory statistics are measured in KB:
Chassis 1 Slot 2:
Total Used Free Shared Buffers Cached FreeRatio
Mem: 984640 313232 671408 0 0 26568 68.2%
-/+ Buffers/Cache: 286664 697976
Swap: 0 0 0
Chassis 1 Slot 2 CPU 1:
Total Used Free Shared Buffers Cached FreeRatio
Mem: 14834944 3342376 11492568 0 600 124500 77.5%
-/+ Buffers/Cache: 3217276 11617668
Swap: 0 0 0
Solution
To resolve the issue:
1. Execute the display process memory command multiple times to do the following:
¡ View the memory usage for each process on a card.
¡ Identify the process for which memory usage is continuously increasing.
If the memory usage of a process is continuously increasing, this process might have a memory leak. Dynamic memory is heap memory dynamically assigned to the device. Its value becomes large when memory is leaked. The following example searches for the diagd process with ID as 78:
<sysname> display process memory chassis 2 slot 2
JID Text Data Stack Dynamic Name
1 168 604 24 64 scmd
2 0 0 0 0 [kthreadd]
3 0 0 0 0 [ksoftirqd/0]
...
78 112 9368 12 320 diagd
79 76 1040 8 8 mdcagentd
80 116 8860 8 16 fsd
81 140 992 16 212 dbmd
83 72 496 8 20 syslogd
84 168 41980 16 44 drvdiagd
85 172 17112 16 12 devd
94 112 8864 12 12 edev
...
2. Execute the display process memory heap command multiple times to do the following:
¡ View the heap memory usage for user process 78.
¡ Identify the memory block for which memory usage is continuously increasing.
If the usage of a memory block is continuously increasing, memory leak might have occurred.
<Sysname> display process memory heap job 78 verbose
Heap usage:
Size Free Used Total Free Ratio
16 0 385 385 0.0%
24 2 49 51 3.9%
32 0 13 13 0.0%
40 0 7 7 0.0%
64 0 411 411 0.0%
72 0 4 4 0.0%
80 1 0 1 100.0%
96 1 0 1 100.0%
104 0 8 8 0.0%
136 0 8 8 0.0%
152 0 9 9 0.0%
184 0 1 1 0.0%
368 0 8 8 0.0%
3080 0 1 1 0.0%
8200 1 0 1 100.0%
29376 1 0 1 100.0%
Large Memory Usage:
Used Blocks : 24
Used Memory(in bytes): 2031616
Free Blocks : 0
Free Memory(in bytes): 0
Summary:
Total virtual memory heap space(in bytes) : 2113536
Total physical memory heap space(in bytes) : 454656
Total allocated memory(in bytes) : 2075736
Related commands
|
Command |
Description |
|
display cpu-usage |
Displays current CPU usage statistics. |
|
display cpu-usage history |
Displays historical CPU usage statistics in a coordinate system. |
|
display interface |
Displays interface information. |
|
display memory |
Displays memory usage information. |
|
display process memory |
Displays memory usage information for each process on a card. |
|
display process memory heap |
Displays heap memory usage for a user process. |
|
display route-policy |
Displays routing policy information. |
Troubleshooting high CPU usage caused by policy rule matching acceleration
CPU usage is high if object policy rules are modified frequently
Symptom
The system activates rule matching acceleration each time an object policy rule is created or modified, which causes high CPU usage if multiple rules are modified in a short period of time.
Solution
To resolve the issue, upgrade the software to a version that supports delayed rule matching acceleration. This feature enables the system to activate rule matching acceleration for multiple rules together after the rules are completely deployed to prevent frequent acceleration from causing high CPU usage.
Delayed rule matching acceleration for object policies is available in the following software versions:
· D032SP26 and later.
· D045SP07 and later.
High CPU usage caused by low-speed security policy matching
Symptom
Security policies that are not accelerated match packets at a low speed. In this case, multi-policy configuration consumes a large amount of CPU resources.
Solution
To resolve the issue, upgrade the software to a version that supports automatic rule matching acceleration for security policies and enable the automatic acceleration feature. This feature allows the system to activate rule matching acceleration 2 seconds after a policy is created or modified if 100 or fewer policies exist or 20 seconds if over 100 policies exist.
Automatic rule matching acceleration for security polices is available for all D032SP and D045SP software versions.
Troubleshooting RBM and VRRP
Two backups in a VRRP group
Symptom
As shown in Figure 10, configure VRRP groups on two security gateways, which are connected to Layer 2 switches in the uplink and downlink directions. The uplink and downlink interfaces on the devices are operating at Layer 3. However, both security gateways are backup nodes in the VRRP groups.
The following is the configuration:
|
Device |
Configuration |
|
Security gateways |
Set up an RBM channel between the two security gateways. Configure two VRRP groups on the security gateways in the uplink and downlink directions, and associate the VRRP groups with RBM as follows: · Add VRRP groups 1 and 3 on the uplink and downlink interfaces of Device A to the active group. Add VRRP groups 2 and 4 on the uplink and downlink interfaces of Device A to the standby group. · Add VRRP groups 1 and 3 on the uplink and downlink interfaces of Device B to the standby group. Add VRRP groups 2 and 4 on the uplink and downlink interfaces of Device B to the active group. Specify the next hop of the routes on the devices destined to the Internet as the IP address of the router interface connected to the devices (2.1.1.15). |
|
Router |
Specify the next hop for the route destined to Host A as the virtual IP address of VRRP group 1 (2.1.1.3). Specify the next hop for the route destined to Host B as the virtual IP address of VRRP group 2 (2.1.1.4). |
|
Host A |
Specify the default gateway IP address as the virtual IP address of VRRP group 3 (10.1.1.3). |
|
Host B |
Specify the default gateway IP address as the virtual IP address of VRRP group 4 (10.1.1.4). |
|
Switch A |
Add the interfaces connected to the devices and router to the same VLAN. |
|
Switch B |
Add the interfaces connected to the devices and hosts to the same VLAN. |
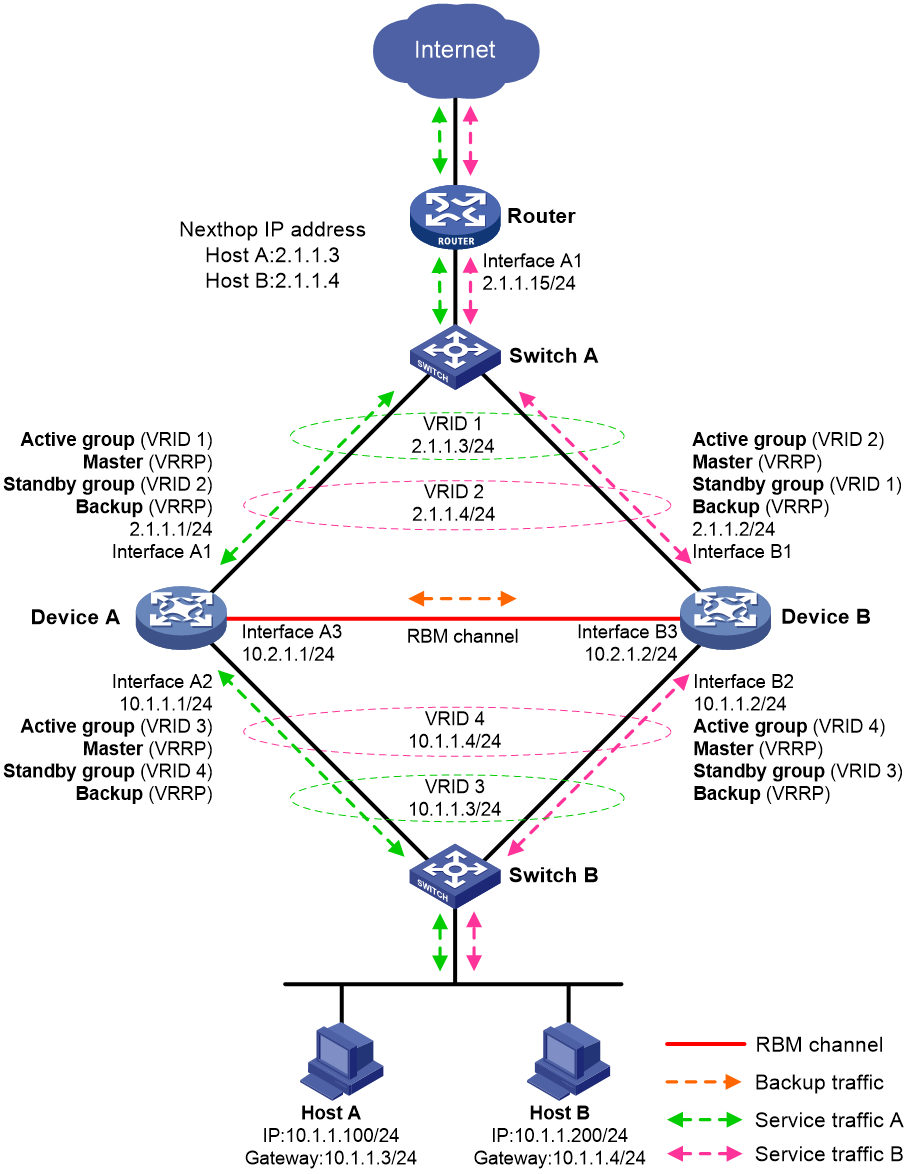
Solution
To resolve the issue:
1. Execute the display remote-backup-group status command to verify that the RBM control channel connection is normal.
RBM_P[M9012_1]dis remote-backup-group status
Remote backup group information:
Backup mode: Dual-active
Device management role: Primary
Device running status: Active
Data channel interface: Route-Aggregation1023
Local IP: 30.24.0.1
Remote IP: 30.24.0.2 Destination port: 60164
Control channel status: Connected
Keepalive interval: 1s
Keepalive count: 10
Configuration consistency check interval: 1 hour
Configuration consistency check result: Consistent(2020-12-17 10:55:15)
Configuration backup status: Auto sync enabled
Session backup status: Hot backup enabled
Delay-time: 1 min
If the control channel status is connected, the control channel connection status is normal. If the control channel status is disconnected, check the status of the physical interface used by the RBM control channel.
2. Execute the display link-aggregation verbose Blade-Aggregation command to verify that the service module is in Selected status.
RBM_P[M9012_1]dis link-aggregation verbose Blade-Aggregation
Loadsharing Type: Shar -- Loadsharing, NonS -- Non-Loadsharing
Port Status: S -- Selected, U -- Unselected, I -- Individual
Port: A -- Auto port
Flags: A -- LACP_Activity, B -- LACP_Timeout, C -- Aggregation,
D -- Synchronization, E -- Collecting, F -- Distributing,
G -- Defaulted, H -- Expired
Aggregate Interface: Blade-Aggregation1
Aggregation Mode: Static
Loadsharing Type: Shar
Port Status Priority Oper-Key
--------------------------------------------------------------------------------
Blade4/0/1 S 32768 4
Blade7/0/1 S 32768 4
Aggregate Interface: Blade-Aggregation257
Aggregation Mode: Static
Loadsharing Type: Shar
Port Status Priority Oper-Key
--------------------------------------------------------------------------------
Blade4/0/2 S 32768 5
Blade7/0/2 S 32768 5
The blade aggregate interface status is S (normal). If the statuses for all blade aggregate interfaces are U, or no blade aggregate interfaces are displayed, check the service engine module status.
3. If the issue persists, contact H3C Support.
Troubleshooting attack detection and prevention failures
FIN flood attack report failure
Symptom
Devices on the external network access the server through the firewall. Attack detection and prevention is configured on the firewall to protect the server from attacks.
However, when external users launch FIN flood attacks on the server, the firewall fails to log FIN flood attack events as configured or forward the traffic.
Figure 11 Network diagram
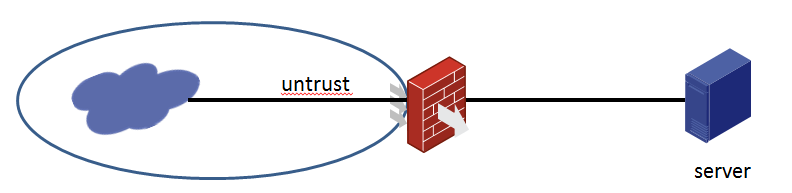
Attack detection and prevention settings on the firewall:
# Create attack defense policy 1, enable global FIN flood attack detection, and specify global actions against FIN flood attacks.
attack-defense policy 1
fin-flood detect non-specific
fin-flood action logging drop client-verify
# Apply attack defense policy 1 to inbound security zone Untrust.
security-zone name Untrust
attack-defense apply policy 1
Solution
To resolve the issue:
1. Verify that the attack defense policy is applied to the inbound security zone, FIN flood attack detection is enabled, and global actions against FIN flood attacks are specified.
2. Use the display attack-defense malformed-packet statistics command to display statistics about malformed packets and check if malformed packets are dropped.
FIN packets belong to malformed packets.
3. Check if the destination address of the traffic is the same. If yes, check the receiving rate of FIN packets destined for the address. If the rate does not reach the global threshold for triggering FIN flood attack prevention, the firewall does not drop FIN packets. This is normal. If the rate exceeds that threshold, go to the next step.
4. If the issue persists, contact Technical Support.
Related commands
|
Command |
Description |
|
display attack-defense policy {name} |
Displays attack defense policy configuration. |
|
display attack-defense statistics security-zone{ zone } |
Displays dropped attack packet statistics. |
|
display blacklist { ip | ipv6 } |
Displays source IPv4 or IPv6 blacklist entries. |
Troubleshooting threat log generation by IPS
This section provides troubleshooting information for threat log generation by IPS.
No threat logs generated on the IPS device
Symptom
As shown in Figure 12, traffic from or to the PC is forwarded by the switch. The M9012-S device is attached to the switch and performs IPS on the received mirroring traffic.
However, no threat logs have been generated on the IPS device for a long time when attacks are present in the network.
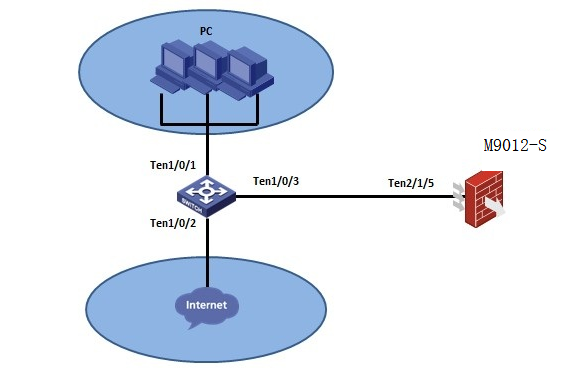
The following settings are configured:
· Configure a mirroring group and mirroring source and destination interfaces.
· Create a blackhole-type bridge instance for inline forwarding, and add interfaces to the instance.
· Configure security zones and add interfaces to the security zones.
· Use an IPS policy in a security policy.
Troubleshooting flowchart
Figure 13 Flowchart for troubleshooting threat log generation failure on the IPS device

Solution
1. Verify that a session is running on the device and the session is normal. You can identify whether the session is normal according to the session status, application, and whether a one-direction flow exists.
Initiator:
Source IP/port: 8:7:6:5:4:3:2:2/6158
Destination IP/port: 1:2:3:4:5:6:7:7/110
VPN instance/VLAN ID/Inline ID: -/-/-
Protocol: TCP(6)
Inbound interface: Ten-GigabitEthernet2/2/0/10
Source security zone: Untrust
Responder:
Source IP/port: 1:2:3:4:5:6:7:7/110
Destination IP/port: 8:7:6:5:4:3:2:2/6158
VPN instance/VLAN ID/Inline ID: -/-/-
Protocol: TCP(6)
Inbound interface: Ten-GigabitEthernet2/2/0/9
Source security zone: Trust
State: TCP_ESTABLISHED //If the session state is abnormal, three handshakes cannot finish successfully. In this case, the device cannot perform IPS insepction and generate IPS logs.
Application: POP3 //If the device cannot identify the application, the device cannot generate IPS logs.
Rule ID: 0
Rule name: v6
Start time: 2018-12-27 18:49:14 TTL: 1199s
Initiator->Responder: 5 packets 406 bytes
Responder->Initiator: 4 packets 303 bytes
//If the flow is one-direction flow, IPS inspection fails and the device cannot generate IPS logs.
2. If no session exists, execute the display counters rate inbound interface command to identify whether traffic is mirrored on an interface. If no traffic mirroring is performed, verify that the mirroring settings are correct on the device.
3. Verify that no packet loss occurs by executing the display system internal ip packet-drop statistics and display system internal aspf statistics zone-pair ipv4 commands.
If packets are lost before they reach the DPI module due to configuration errors, the device cannot generate IPS logs.
4. If a session exists but the session is incomplete. Typically, inbound and outbound packets mirrored from the switch do not reach the device through the same physical port or logical interface. In this case, verify that blackhole-type bridge forwarding settings are correct.
5. If the session is normal, perform the following tasks:
a. Identify the license and signature library version.
b. Execute the display security-policy ip command to obtain security policy information. Verify that an IPS policy is used in a security policy and identify security policy hit statistics. Make sure packets are matched with the security policy that is enabled with content security.
c. Execute the display inspect status command to verify that the status of the DPI engine is normal. If the status of the DPI engine is normal is in bypass state, the device does not perform DPI inspection.
display inspect status
Chassis 1 Slot 0:
Running status: normal
d. Execute the display system internal inspect hit-statistics command to verify that the device performs DPI inspection on packets.
display system internal inspect hit-statistics
Rule ID Module Rule hits AC hits PCRE try PCRE hits
1855 IPS 0 1 0 0
The output shows that the device has performed DPI inspection, but the packet hits only the AC part and does not match the whole signature. In this case, the device does not generate a log. If the value for the Rule hits field is not 0, a rule is matched with packets.
Troubleshooting RBM dynamic routing issues
RBM switchover not triggered upon uplink or downlink interface failure
Symptom
Traffic is still sent to an RBM member device for forwarding after its uplink or downlink interface fails.
Solution
To resolve the issue:
1. Log in to the RBM member devices and verify that they have the same number of service modules.
2. Configure the primary member device as follows:
RBM_P[M9016_1-remote-backup-group] track 1 interface Route-Aggregation1
RBM_P[M9016_1-remote-backup-group] track 2 interface Route-Aggregation11
RBM_P[M9016_1-remote-backup-group] display this
#
remote-backup group
backup-mode dual-active
data-channel interface Route-Aggregation1000
delay-time 1
adjust-cost bgp enable absolute 10000
adjust-cost ospf enable absolute 10000
adjust-cost ospfv3 enable absolute 10000
track 1
track 2
local-ip 192.168.195.9
remote-ip 192.168.195.10
device-role primary
3. Configure the secondary member device as follows:
RBM_S[M9016_2-remote-backup-group] track 1 interface Route-Aggregation1
RBM_S[M9016_2-remote-backup-group] track 2 interface Route-Aggregation11
RBM_S[M9016_2-remote-backup-group] display this
#
remote-backup group
backup-mode dual-active
data-channel interface Route-Aggregation1000
delay-time 1
adjust-cost bgp enable absolute 10000
adjust-cost ospf enable absolute 10000
adjust-cost ospfv3 enable absolute 10000
track 1
track 2
local-ip 192.168.195.10
remote-ip 192.168.195.9
device-role secondary
Inconsistent ACL configuration between the RBM member devices
Symptom
The RBM member devices have inconsistent ACL configuration, such as the following:
RBM_P[M9016_1]%Dec 17 14:25:43:191 2020 M9016_1 RBM/6/RBM_CFG_COMPARE_START: Started configuration consistency check.
%Dec 17 14:25:44:775 2020 M9016_1 RBM/6/RBM_CFG_COMPARE_RESULT: The following modules have inconsistent configuration: acl.
%Dec 17 14:25:44:775 2020 M9016_1 RBM/6/RBM_CFG_COMPARE_FINISH: Finished configuration consistency check.
Solution
To resolve the issue:
· If an ACL exists only on the secondary member device, perform the following tasks:
¡ To retain the ACL, create it on the primary member device, and save the running configuration of both RBM member devices.
¡ To delete the ACL, execute the configuration manual-sync command on the primary member device, and save the running configuration of both RBM member devices.
· If an ACL exists only on the primary member device, perform the following tasks:
¡ To retain the ACL, execute the configuration manual-sync command on the primary member device, and save the running configuration of both RBM member devices.
¡ To delete the ACL, delete it from the primary member device, execute the configuration manual-sync command on the primary member device, and save the running configuration of both RBM member devices.
Troubleshooting AFT
IPv6 access to IPv4 network fails
Symptom
This section uses IPv6-to-IPv4 source address dynamic translation and IPv4-to-IPv6 source address static translation as an example.
To allow PC1 to access PC2 in the IPv4 network, the following AFT policies are configured on the M9000 firewall:
· An IPv4-to-IPv6 source address static mapping to map destination IPv4 address 1.1.1.1 to IPv6 address 23::1.
· An IPv6-to-IPv4 source address dynamic translation policy to translate the source addresses in IPv6 packets to IPv4 address 30.30.40.100.
However, AFT fails or the translated packets cannot be forwarded correctly.
Figure 14 Network diagram
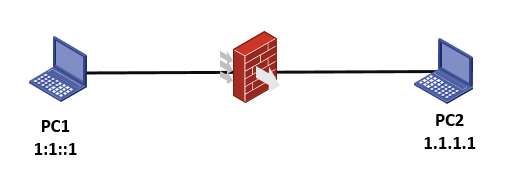
Settings on the firewall
acl ipv6 number 2000
rule 0 permit source 1:1::1/128
#
aft address-group 0
address 30.30.40.100 30.30.40.100
#
aft v6tov4 source acl ipv6 number 2000 address-group 0
#
aft v4tov6 source 1.1.1.1 23::1
#
interface Route-Aggregation10.900
aft enable
interface Route-Aggregation10.901
aft enable
Solution
To resolve the issue:
1. Verify that AFT is configured correctly and AFT is enabled on both the input interface and output interface on the M9000 firewall.
[sysname]dis aft configuration
aft address-group 0
address 30.30.40.100 30.30.40.100
aft v6tov4 source acl ipv6 number 2000 address-group 0
aft v4tov6 source 1.1.1.1 23::1
interface Route-Aggregation10.900
aft enable
interface Route-Aggregation10.901
aft enable
AFT ALG:
DNS : Enabled
FTP : Enabled
HTTP : Enabled
ICMP-ERROR : Enabled
RTSP : Enabled
SIP : Enabled
2. Use the debugging aft packet ip command to enable debugging of AFT packets and verify that packets can be translated correctly. If the following information is displayed, AFT packets are translated correctly.
<sysname>debugging aft packet ip
Dec 16 15:08:22:697 2020 H3C AFT/7/COMMON: -Slot=6.1;
PACKET: (Route-Aggregation10.900) Protocol: UDP
1.1.1.1/69 - 30.30.40.100/1128(VPN:0) ------>
23::1/69 – 1:1::1/35017(VPN:0)
Or
<sysname>debugging aft packet ipv6
Dec 16 15:09:13:696 2020 H3C AFT/7/COMMON: -Slot=6.1;
PACKET: (Route-Aggregation10.901) Protocol: UDP
1:1::1/6677 - 23::1/5060(VPN:0) ------>
30.30.40.100/1149 - 1.1.1.1/5060(VPN:0)
3. Verify that the flow tables are deployed normally.
[H3C-probe]dis system internal openflow instance inner-redirect flow-table
Flow entry 3305 information:
cookie: 0x0, priority: 5045, hard time: 0, idle time: 0, flags: check_overlap
|reset_counts|no_pkt_counts|no_byte_counts, byte count: --, packet count: --
Match information:
Input interface: RAGG10
VLAN ID: 900, mask: 0xfff
IP Range: IPv4 destination address from 30.30.40.100 to 30.30.40.100
Instruction information:
Write actions:
Group: 4026531857
Flow entry 3306 information:
cookie: 0x0, priority: 5045, hard time: 0, idle time: 0, flags: check_overlap
|reset_counts|no_pkt_counts|no_byte_counts, byte count: --, packet count: --
Match information:
Input interface: RAGG10
VLAN ID: 4094, mask: 0xfff
IP Range: IPv4 destination address from 30.30.40.100 to 30.30.40.100
Instruction information:
Write actions:
Group: 4026531857
Flow entry 3307 information:
cookie: 0x0, priority: 5080, hard time: 0, idle time: 0, flags: check_overlap
|reset_counts|no_pkt_counts|no_byte_counts, byte count: --, packet count: --
Match information:
IPv4 source address: 1.1.1.1, mask: 255.255.255.255
Instruction information:
Write actions:
Group: 4026531865
Flow entry 3308 information:
cookie: 0x0, priority: 5085, hard time: 0, idle time: 0, flags: check_overlap
|reset_counts|no_pkt_counts|no_byte_counts, byte count: --, packet count: --
Match information:
IPv4 destination address: 1.1.1.1, mask: 255.255.255.255
Instruction information:
Write actions:
Group: 4026531865
Flow entry 3309 information:
cookie: 0x0, priority: 7085, hard time: 0, idle time: 0, flags: check_overlap
|reset_counts|no_pkt_counts|no_byte_counts, byte count: --, packet count: --
Match information:
Input interface: RAGG10
VLAN ID: 900, mask: 0xfff
IPv6 destination address: 23::1
IPv6 destination address mask: FFFF:FFFF:FFFF:FFFF:FFFF:FFFF:FFFF:FFFF
Instruction information:
Write actions:
Group: 4026531865
Flow entry 3310 information:
cookie: 0x0, priority: 7085, hard time: 0, idle time: 0, flags: check_overlap
|reset_counts|no_pkt_counts|no_byte_counts, byte count: --, packet count: --
Match information:
Input interface: RAGG10
VLAN ID: 4094, mask: 0xfff
IPv6 destination address: 23::1
IPv6 destination address mask: FFFF:FFFF:FFFF:FFFF:FFFF:FFFF:FFFF:FFFF
Instruction information:
Write actions:
Group: 4026531865
4. If the issue persists, contact Technical Support.
Miscellaneous
Unexpected card reboot because of an internal port failure
Symptom
A card reboots unexpectedly because of an internal port failure.
· As shown in the diagfile.log file, an internal port of the card connected to the peer card went down, and then came up after the module restarted.
<M9k>more diagfile/diagfile.log
%@12527^Dec 19 16:10:56:906 2020 M9k DRV/3/HG_MONITOR_PORT_ERROR: -Chassis=1-Slot=10; Chassis 1 Slot 10 Unit 0 Port 3 to Chassis 1 Slot 3 Unit 0 Port 1: The source port went down.
%@12528^Dec 19 16:10:56:640 2020 M9k DRV/3/HG_MONITOR_PORT_ERROR: -Chassis=1-Slot=13; Chassis 1 Slot 13 Unit 0 Port 3 to Chassis 1 Slot 3 Unit 0 Port 8: The source port went down.
%@12529^Dec 19 16:10:57:376 2020 M9k DRV/3/HG_MONITOR_PORT_ERROR: -Chassis=1-Slot=11; Chassis 1 Slot 11 Unit 0 Port 3 to Chassis 1 Slot 3 Unit 0 Port 3: The source port went down.
%@12530^Dec 19 16:10:56:740 2020 M9k DRV/3/HG_MONITOR_PORT_ERROR: -Chassis=1-Slot=12; Chassis 1 Slot 12 Unit 0 Port 3 to Chassis 1 Slot 3 Unit 0 Port 6: The source port went down.
%@12554^Dec 19 16:11:11:959 2020 M9k DRV/3/FAULT_MONITOR_BITMAP:
Fault PhySlot List: 3
Fault Reason BitMap:
slot : 0 1 2 3 4 5 6 7 8 9 10 11 12 13 14 15 16 17
-----------------------------------------------------
Fabric1 : 5 5 5 2 5 5 5 5 5 5 5 5 5 5 5 5 5 5
Fabric2 : 5 5 5 2 5 5 5 5 5 5 5 5 5 5 5 5 5 5
Fabric3 : 5 5 5 2 5 5 5 5 5 5 5 5 5 5 5 5 5 5
Fabric4 : 5 5 5 2 5 5 5 5 5 5 5 5 5 5 5 5 5 5
-----------------------------------------------------
IO board: 5 5 5 5 5 5 5 5 5 5 5 5 5 5 5 5 5 5
Fault Reason: 0-RFCS, 1-RERPKT, 2-DOWN, 3-UNRESP, 4-1bit, 5-NORMAL
%@12555^Dec 19 16:11:11:960 2020 M9k DRV/3/FAULT_MONITOR_REBOOT: Chassis 1 Slot 3: The module will be restarted due to a hardware failure.
· As shown in the logfile.log file, an internal port of the card connected to the peer card went down, and then came up after the card is restarted.
<M9k>more logfile/logfile.log
%@4387931%Dec 19 16:10:56:906 2020 M9k DRV/3/HG_MONITOR_PORT_ERROR: -Chassis=1-Slot=10; Chassis 1 Slot 10 Unit 0 Port 3 to Chassis 1 Slot 3 Unit 0 Port 1: The connectivity of the internal port failed.
%@4387932%Dec 19 16:10:56:640 2020 M9k DRV/3/HG_MONITOR_PORT_ERROR: -Chassis=1-Slot=13; Chassis 1 Slot 13 Unit 0 Port 3 to Chassis 1 Slot 3 Unit 0 Port 8: The connectivity of the internal port failed.
%@4387933%Dec 19 16:10:57:376 2020 M9k DRV/3/HG_MONITOR_PORT_ERROR: -Chassis=1-Slot=11; Chassis 1 Slot 11 Unit 0 Port 3 to Chassis 1 Slot 3 Unit 0 Port 3: The connectivity of the internal port failed.
%@4387934%Dec 19 16:10:56:740 2020 M9k DRV/3/HG_MONITOR_PORT_ERROR: -Chassis=1-Slot=12; Chassis 1 Slot 12 Unit 0 Port 3 to Chassis 1 Slot 3 Unit 0 Port 6: The connectivity of the internal port failed.
%@4387947%Dec 19 16:11:11:960 2020 M9k DRV/3/FAULT_MONITOR_REBOOT: Chassis 1 Slot 3: The module will be restarted due to a hardware failure.
%@4387948%Dec 19 16:11:12:151 2020 M9k DEV/2/BOARD_STATE_FAULT: Board state changed to Fault on chassis 1 slot 3, type is NSQM1FWEFGA0.
Solution
Collect and send the logs to H3C Support for analysis.
Unexpected power-off of a card because of an internal port failure
Symptom
A card powers off unexpectedly because of an internal port failure.
Solution
· As shown in the diagfile.log file, a card rebooted three times within half an hour because of failure of an internal port connected to the peer card, and a message "The module will be isolated due to a hardware failure" is output. This internal port failure cannot be resolved through card reboot and the card will be isolated.
<M9k>more diagfile/diagfile.log
%@12574^Dec 19 17:15:53:091 2020 M9k DRV/3/HG_MONITOR_PORT_ERROR: -Chassis=1-Slot=10; Chassis 1 Slot 10 Unit 0 Port 3 to Chassis 1 Slot 3 Unit 0 Port 1: The source port went down.
%@12584^Dec 19 17:23:57:002 2020 M9k DRV/3/HG_MONITOR_PORT_ERROR: -Chassis=1-Slot=10; Chassis 1 Slot 10 Unit 0 Port 3 to Chassis 1 Slot 3 Unit 0 Port 1: The source port went down.
%@12605^Dec 19 17:32:34:001 2020 M9k DRV/3/HG_MONITOR_PORT_ERROR: -Chassis=1-Slot=10; Chassis 1 Slot 10 Unit 0 Port 3 to Chassis 1 Slot 3 Unit 0 Port 1: The source port went down.
%@12615^Dec 19 17:32:54:996 2020 M9k DRV/3/FAULT_MONITOR_BITMAP:
Fault PhySlot List: 10
Fault Reason BitMap:
slot : 0 1 2 3 4 5 6 7 8 9 10 11 12 13 14 15 16 17
-----------------------------------------------------
Fabric1 : 5 5 5 2 5 5 5 5 5 5 5 5 5 5 5 5 5 5
Fabric2 : 5 5 5 5 5 5 5 5 5 5 5 5 5 5 5 5 5 5
Fabric3 : 5 5 5 5 5 5 5 5 5 5 5 5 5 5 5 5 5 5
Fabric4 : 5 5 5 5 5 5 5 5 5 5 5 5 5 5 5 5 5 5
-----------------------------------------------------
IO board: 5 5 5 5 5 5 5 5 5 5 5 5 5 5 5 5 5 5
Fault Reason: 0-RFCS, 1-RERPKT, 2-DOWN, 3-UNRESP, 4-1bit, 5-NORMAL
%@12616^Dec 19 17:32:54:996 2020 M9k DRV/3/FAULT_MONITOR_ISOLATE: Chassis 1 Slot 10: The module will be isolated due to a hardware failure.
· As shown in the logfile.log file, a card rebooted three times within half an hour because of failure of an internal port connected to the peer card, and a message "The card will be isolated due to a hardware failure" is output. This internal port failure cannot be resolved through card reboot and the card will be isolated.
<M9k>more logfile/logfile.log
%@4388208%Dec 19 17:15:40:345 2020 M9k DRV/3/HG_MONITOR_PORT_ERROR: -Chassis=1-Slot=10; Chassis 1 Slot 10 Unit 0 Port 3 to Chassis 1 Slot 3 Unit 0 Port 1: The connectivity of the internal port failed.
%@4388291%Dec 19 17:23:57:002 2020 M9k DRV/3/HG_MONITOR_PORT_ERROR: -Chassis=1-Slot=10; Chassis 1 Slot 10 Unit 0 Port 3 to Chassis 1 Slot 3 Unit 0 Port 1: The connectivity of the internal port failed.
%@4388385%Dec 19 17:32:34:001 2020 M9k DRV/3/HG_MONITOR_PORT_ERROR: -Chassis=1-Slot=10; Chassis 1 Slot 10 Unit 0 Port 3 to Chassis 1 Slot 3 Unit 0 Port 1: The connectivity of the internal port failed.
%@4388389%Dec 19 17:32:54:996 2020 M9k DRV/3/FAULT_MONITOR_ISOLATE: Chassis 1 Slot 10: The module will be isolated due to a hardware failure.
Solution
Replace the faulty card and send related logs to H3C Support.
Electronic label reading failure
An electronic label is a profile of a device. It contains the permanent configuration, including the name, serial number, MAC address, vendor name, and product code of the device.
The device SN and DID used for license activation file application is contained in the electronic label.
Symptom
The display device manuinf command shows that the electronic label of the device is missing. As a result, the device cannot be licensed because the device SN and DID information cannot be obtained.
Solution
To resolve the issue:
1. View related logs to identify the cause of the issue.
An active/standby MPU switchover might cause loss of the electronic label.
[B-probe]local logbuffer 10 display
Sep 08 2020 16:54:36:488937:
LINE:152-TASK:ofpd-FUNC:BSP_E2PROM_Read_OnSelec:
get I2C MutexSem1 fail.
Sep 08 2020 16:54:36:596761:
LINE:2077-TASK:TEMP-FUNC:drv_sysm_get_power_size_75X:
get I2C MutexSem1 fail.
Sep 08 2020 16:54:37:489907:
LINE:5780-TASK:ofpd-FUNC:DRV_SYSM_SysGetManufactureInfo:
In function:BSP_E2PROM_Read_OnSelec, Read manual infoerror
Sep 08 2020 16:54:37:489967:
LINE:6089-TASK:ofpd-FUNC:DRV_SYSM_ManuInfoResolve:
Read manufacture information Fail!
Sep 08 2020 16:54:37:490005:
LINE:12303-TASK:ofpd-FUNC:DRV_DEVM_GetManuInfo:
get chassis manu info failed!
2. Collect and send related information to H3C Support for help.
MPU and service module version inconsistency
Symptom
A service module is in Fault state because it runs a different software version than the MPU.
You can use the display device or dis version command in any view or the display system internal version command in probe view to view system version information of the device.
Solution
· If the module remains in Fault state and reboots repeatedly, upgrade the version of the module from BootWare.
· If the module is stuck in Fault state, remove and then reinstall the module to reboot it and upgrade the version of the module from BootWare
Related commands
This section lists the commands that you might use for troubleshooting the preceding miscellaneous issues.
|
Command |
Description |
|
display boot-loader |
Displays current software images and startup software images. |
|
display device manuinfo |
Displays electronic label information for the device. |