- Released At: 08-05-2025
- Page Views:
- Downloads:
- Table of Contents
- Related Documents
-
H3C MSR Routers
Troubleshooting Guide
H3C MSR 810 routers (centralized devices)
H3C MSR 2600 routers (centralized devices)
H3C MSR 3600 routers (centralized devices)
H3C MSR 5600 routers (distributed devices)
Document version: 6W100-20200112
Copyright © 2020 New H3C Technologies Co., Ltd. All rights reserved.
No part of this manual may be reproduced or transmitted in any form or by any means without prior written consent of New H3C Technologies Co., Ltd.
Except for the trademarks of New H3C Technologies Co., Ltd., any trademarks that may be mentioned in this document are the property of their respective owners.
The information in this document is subject to change without notice.
Contents
Collecting log and operating information
Collecting common log messages
Collecting diagnostic log messages
Collecting operating statistics
Troubleshooting Ethernet interfaces
Failure to ping the directly connected device
Troubleshooting E1 and T1 interfaces
Common E1 and T1 interface issue troubleshooting methods
Troubleshooting the configuration
Troubleshooting through looping
Troubleshooting E1/T1 interfaces
Troubleshooting physical interface anomaly
Failure to negotiate IPsec SAs through IKE
Authentication failure in PPPoE dialup
Introduction
This document provides information about troubleshooting common software and hardware problems with H3C MSR routers.
The MSR5600 routers are distributed devices. All other router series are centralized devices.
General guidelines
|
|
IMPORTANT: To prevent a problem from causing loss of configuration, save the configuration each time you finish configuring a feature. For configuration recovery, regularly back up the configuration to a remote server. |
When you troubleshoot H3C MSR routers, follow these general guidelines:
· To help identify the cause of the problem, collect system and configuration information, including:
¡ Symptom, time of failure, and configuration.
¡ Network topology information, including the network diagram, port connections, and points of failure.
¡ Log messages and diagnostic information. For more information about collecting this information, see "Collecting log and operating information."
¡ Physical evidence of failure:
- Photos of the hardware.
- Status of the card, power, and fan status LEDs.
¡ Steps you have taken, such as reconfiguration, cable swapping, and rebooting.
¡ Output from the commands executed during the troubleshooting process.
· To ensure safety, wear an ESD-preventive wrist strap when you replace or maintain a hardware component.
· If hardware replacement is required, use the release notes to verify the hardware and software compatibility.
Collecting log and operating information
|
|
IMPORTANT: By default, the information center is enabled. If the feature has been disabled, you must use the info-center enable command to enable the feature for collecting log messages. |
Table 1 shows the types of files that the system uses to store operating log and status information. You can export these files by using FTP, TFTP, or USB. To more easily locate log information, use a consistent rule to categorize and name files. For example, save log information files to a separate folder for each MPU on a distributed device, and include their chassis and slot numbers in the folder names.
Table 1 Log and operating information
|
Category |
File name format |
Content |
|
Common log |
logfileX.log |
Command execution and operational log messages. |
|
Diagnostic log |
diagfileX.log |
Diagnostic log messages about device operation, including the following items: · Parameter settings in effect when an error occurs. · Information about a card startup error. · Handshaking information between the MPU and interface card when a communication error occurs. |
|
Operating statistics |
file-basename.gz |
Collecting operating statistics decreases system performance. Current operating statistics for feature modules, including the following items: · Device status. · CPU status. · Memory status. · Configuration status. · Software entries. · Hardware entries. |
|
|
NOTE: For common and diagnostic log files, the system automatically compresses them into .gz files when they are full. |
Collecting common log messages
Collecting common log messages on a standalone centralized device
# Save common log messages from the log buffer to a log file.
By default, the log file is saved in the logfile directory of the storage medium on the device.
<Sysname> logfile save
The contents in the log file buffer have been saved to the file cfa0:/logfile/logfile8.log
# Identify the log file on the device.
<Sysname> dir cfa0:/logfile/
Directory of cfa0:/logfile
0 -rw- 21863 Jul 11 2013 16:00:37 logfile8.log
1021104 KB total (421552 KB free)
# Transfer the files to the desired destination by using FTP, TFTP, or USB. (Details not shown.)
Collecting common log messages on an IRF fabric that contains centralized devices
1. Save common log messages from the log buffer to a log file.
By default, the log file is saved in the logfile directory of the storage medium on the master device.
<Sysname> logfile save
The contents in the log file buffer have been saved to the file cfa0:/logfile/logfile8.log
2. Identify the log file on each member device:
# Display the log file on the master device.
<Sysname> dir cfa0:/logfile/
Directory of cfa0:/logfile
0 -rw- 21863 Jul 11 2013 16:00:37 logfile.log
1021104 KB total (421552 KB free)
# Display the log file on each subordinate device.
<Sysname> dir slot2#cfa0:/logfile/
Directory of slot2#cfa0:/logfile
0 -rw- 21863 Jul 11 2013 16:00:37 logfile.log
1021104 KB total (421552 KB free)
3. Transfer the files to the desired destination by using FTP, TFTP, or USB. (Details not shown.)
Collecting common log messages on a standalone distributed device or on an IRF fabric that contains distributed devices
1. Save common log messages from the log buffer to a log file.
By default, the log file is saved in the logfile directory of the storage medium on the active MPU (in standalone mode) or global active MPU (in IRF mode).
<Sysname> logfile save
The contents in the log file buffer have been saved to the file cfa0:/logfile/logfile8.log
2. Identify the log file on each MPU:
# Display the log file on the active MPU (in standalone mode) or global active MPU (in IRF mode).
<Sysname> dir cfa0:/logfile/
Directory of cfa0:/logfile
0 -rw- 21863 Jul 11 2013 16:00:37 logfile8.log
1021104 KB total (421552 KB free)
# Display the log file on each standby MPU:
¡ In standalone mode, display the log file on the standby MPU.
<Sysname> dir slot1#cfa0:/logfile/
Directory of slot1#cfa0:/logfile
0 -rw- 21863 Jul 11 2013 16:00:37 logfile8.log
1021104 KB total (421552 KB free)
¡ In IRF mode, display the log file on each standby MPU.
<Sysname> dir chassis2#slot0#cfa0:/logfile/
Directory of chassis2#slot0#cfa0:/logfile
0 -rw- 21863 Jul 11 2013 16:00:37 logfile8.log
1021104 KB total (421552 KB free)
|
|
NOTE: If a subordinate chassis has two MPUs, make sure you identify and export the log files on both MPUs. |
3. Transfer the files to the desired destination by using FTP, TFTP, or USB. (Details not shown.)
Collecting diagnostic log messages
Collecting diagnostic log messages on a standalone centralized device
# Save diagnostic log messages from the diagnostic log file buffer to a diagnostic log file.
By default, the diagnostic log file is saved in the diagfile directory of the storage medium on the device.
<Sysname> diagnostic-logfile save
The contents in the diagnostic log file buffer have been saved to the file cfa0:/diagfile/diagfile18.log
# Identify the diagnostic log file on the device.
<Sysname> dir cfa0:/diagfile/
Directory of cfa0:/diagfile
0 -rw- 161321 Jul 11 2013 16:16:00 diagfile18.log
1021104 KB total (421416 KB free)
# Transfer the files to the desired destination by using FTP, TFTP, or USB. (Details not shown.)
Collecting diagnostic log messages on an IRF fabric that contains centralized devices
1. Save diagnostic log messages from the diagnostic log file buffer to a diagnostic log file.
By default, the diagnostic log file is saved in the diagfile directory of the storage medium on the master device.
<Sysname> diagnostic-logfile save
The contents in the diagnostic log file buffer have been saved to the file cfa0:/diagfile/diagfile18.log
2. Identify the log file on each member device:
# Display the log file on the master device.
<Sysname> dir cfa0:/diagfile/
Directory of cfa0:/diagfile
0 -rw- 161321 Jul 11 2013 16:16:00 diagfile18.log
1021104 KB total (421416 KB free)
# Display the log file on each subordinate device.
<Sysname> dir slot2#cfa0:/diagfile/
Directory of slot2#cfa0:/diagfile
0 -rw- 161321 Jul 11 2013 16:16:00 diagfile18.log
1021104 KB total (421416 KB free)
3. Transfer the files to the desired destination by using FTP, TFTP, or USB. (Details not shown.)
Collecting diagnostic log messages on a standalone distributed device or on an IRF fabric that contains distributed devices
1. Save diagnostic log messages from the diagnostic log file buffer to a diagnostic log file.
By default, the diagnostic log file is saved in the diagfile directory of the storage medium on the active MPU (in standalone mode) or global active MPU (in IRF mode).
<Sysname> diagnostic-logfile save
The contents in the diagnostic log file buffer have been saved to the file cfa0:/diagfile/diagfile18.log
2. Identify the diagnostic log file on each MPU:
# Display the diagnostic log file on the active MPU (in standalone mode) or global active MPU (in IRF mode).
<Sysname> dir cfa0:/diagfile/
Directory of cfa0:/diagfile
0 -rw- 161321 Jul 11 2013 16:16:00 diagfile18.log
1021104 KB total (421416 KB free)
# Display the diagnostic log file on each standby MPU:
¡ In standalone mode, display the diagnostic log file on the standby MPU.
<Sysname> dir slot1#cfa0:/diagfile/
Directory of slot1#cfa0:/diagfile
0 -rw- 161321 Jul 11 2013 16:16:00 diagfile18.log
1021104 KB total (421416 KB free)
¡ In IRF mode, display the diagnostic log file on each standby MPU.
<Sysname> dir chassis2#slot0#cfa0:/diagfile/
Directory of chassis2#slot0#cfa0:/diagfile
0 -rw- 161321 Jul 11 2013 16:16:00 diagfile18.log
1021104 KB total (421416 KB free)
|
|
NOTE: If a subordinate chassis has two MPUs, make sure you identify and export the diagnostic log files on both MPUs. |
3. Transfer the files to the desired destination by using FTP, TFTP, or USB. (Details not shown.)
Collecting operating statistics
You can collect operating statistics by saving the statistics to a file or displaying the statistics on the screen.
When you collect operating statistics, follow these guidelines:
· Log in to the device through a network or management port instead of the console port, if possible. Network and management ports are faster than the console port.
· Do not execute commands while operating statistics are being collected.
· H3C recommends saving operating statistics to a file to retain the information.
|
|
NOTE: The amount of time to collect statistics increases along with the number of cards. |
To collect operating statistics:
1. Disable pausing between screens of output if you want to display operating statistics on the screen. Skip this step if you are saving statistics to a file.
<Sysname> screen-length disable
2. Collect operating statistics for multiple feature modules.
<Sysname> display diagnostic-information
Save or display diagnostic information (Y=save, N=display)? [Y/N] :
3. At the prompt, choose to save or display operating statistics:
# To save operating statistics, enter y at the prompt and then specify the destination file path.
Save or display diagnostic information (Y=save, N=display)? [Y/N] :y
Please input the file name(*.tar.gz)[cfa0:/diag.tar.gz] :cfa0:/diag.tar.gz
Diagnostic information is outputting to cfa0:/diag.tar.gz.
Please wait...
Save successfully.
<Sysname> dir cfa0:/
Directory of cfa0:
…
6 -rw- 898180 Jun 26 2013 09:23:51 diag.tar.gz
1021808 KB total (259072 KB free)
# To display operating statistics on the monitor terminal, enter n at the prompt.
Save or display diagnostic information (Y=save, N=display)? [Y/N] :n
===========================================================
===============display alarm===============
No alarm information.
=========================================================
===============display boot-loader===============
Software images on slot 0:
Current software images:
cfa0:/MSR-CMW710-BOOT-R7328_mrpnc.bin
cfa0:/MSR-CMW710-SYSTEM-R7328_mrpnc.bin
Main startup software images:
cfa0:/MSR-CMW710-BOOT-R7328_mrpnc.bin
cfa0:/MSR-CMW710-SYSTEM-R7328_mrpnc.bin
Backup startup software images:
None
=========================================================
===============display counters inbound interface===============
Interface Total (pkts) Broadcast (pkts) Multicast (pkts) Err (pkts)
BAGG1 0 0 0 0
GE4/0/1 0 0 0 0
GE4/0/2 2 2 0 0
GE4/0/3 0 0 0 0
GE4/0/4 0 0 0 0
GE4/0/5 0 0 0 0
GE4/0/6 0 0 0 0
GE4/0/7 0 0 0 0
GE4/0/8 0 0 0 0
GE4/0/9 0 0 0 0
GE4/0/10 0 0 0 0
……
Contacting technical support
· Information described in "General guidelines."
· Product serial numbers.
This information will help the support engineer assist you as quickly as possible.
The following is the contact of H3C Support:
· Telephone number—400-810-0504.
Troubleshooting Ethernet interfaces
This section provides troubleshooting information for common problems with Ethernet interfaces.
Failure to ping the directly connected device
Symptom
An Ethernet interface cannot ping the directly connected device.
Solution
To resolve the problem:
1. Execute the display interface command and perform the following tasks:
¡ Verify that the interface is up.
¡ Verify that the speed and duplex mode of the local end match the speed and duplex mode of the peer end.
¡ Verify that the cable and interface are operating correctly by viewing the packet statistics of the interface.
¡ Verify that the transceiver module of the local end matches the transceiver module of the peer end if the interface is a fiber port.
2. Use the display arp command to verify that the interface can receive ARP packets sent by the directly connected device. If not, use the debugging arp packet command to verify that the interface can send and receive ARP packets correctly.
3. Use the debugging ip packet command to verify that the interface can send and receive packets correctly.
4. Use the debugging ip icmp command to verify that the interface can send and receive ICMP packets correctly.
5. Collect the following information for the interface:
¡ Execute the display hardware internal module interface-name interface-number statistics command in probe view to collect the interface statistics.
¡ Execute the display hardware internal module interface-name interface-number status command in probe view to collect the status information.
¡ Execute the display hardware internal module interface-name interface-number reg 1 command in probe view to collect the FPGA information.
¡ Execute the display hardware internal module interface-name interface-number reg 2 command in probe view to collect the MAC information.
¡ Execute the display hardware internal module interface-name interface-number reg 3 command in probe view to collect the PHY information.
6. Contact H3C Support.
Failure to forward packets
Symptom
An Ethernet interface on an intermediate router cannot forward packets.
Solution
To resolve the problem:
1. Verify that the Ethernet interface can ping the directly connected device. If the ping operation fails, see "Failure to ping the directly connected device."
2. Use the debugging ip packet command to verify that the interface can transmit packets correctly.
3. Collect the following information for the interface:
¡ Execute the display hardware internal module interface-name interface-number statistics command in probe view to collect the interface statistics.
¡ Execute the display hardware internal module interface-name interface-number status command in probe view to collect the status information.
¡ Execute the display hardware internal module interface-name interface-number reg 1 command in probe view to collect the FPGA information.
¡ Execute the display hardware internal module interface-name interface-number reg 2 command in probe view to collect the MAC information.
¡ Execute the display hardware internal module interface-name interface-number reg 3 command in probe view to collect the PHY information.
4. Contact H3C Support.
Packet dropping
Symptom
An Ethernet interface drops packets.
Solution
To resolve the problem:
1. Determine whether the packets are dropped by the local end or the peer end by executing the following commands to compare the rates of the two ends:
¡ Execute the display counters rate inbound interface command on the local end to view the inbound traffic rate statistics.
¡ Execute the display counters rate outbound interface command on the peer end to view the outbound traffic rate statistics.
The end with a lower rate drops packets.
2. Use the display interface command to view the traffic statistics for the interface to verify that no packets are dropped by the interface.
3. Collect the following information for the interface:
¡ Execute the display hardware internal module interface-name interface-number statistics command in probe view to collect the interface statistics.
¡ Execute the display hardware internal module interface-name interface-number status command in probe view to collect the status information.
¡ Execute the display hardware internal module interface-name interface-number reg 1 command in probe view to collect the FPGA information.
¡ Execute the display hardware internal module interface-name interface-number reg 2 command in probe view to collect the MAC information.
¡ Execute the display hardware internal module interface-name interface-number reg 3 command in probe view to collect the PHY information.
¡ Execute the display hardware internal ibd pkt-info slot slot-number slot-number command in probe view to collect inter-card packet statistics.
4. Contact H3C Support.
Related commands
This section lists the commands that you might use for troubleshooting Ethernet interfaces.
|
Command |
Description |
|
display interface |
Displays Ethernet interface information. |
|
display arp [ [ all | dynamic | multiport |static ] | vlan vlan-id | interface interface-type interface-number ] [ count | verbose ] |
Displays ARP entries. |
|
display counters rate inbound interface |
Displays outbound traffic rate statistics. |
|
display counters rate outbound interface |
Displays inbound traffic rate statistics. |
|
display hardware internal module interface-name interface-number statistics |
Displays Ethernet interface statistics. |
|
display hardware internal module interface-name interface-number status |
Displays status information for an Ethernet interface. |
|
display hardware internal module interface-name interface-number message |
Displays configuration information for an Ethernet interface. |
|
display hardware internal module interface-name interface-number reg 1 |
Displays FPGA information for an Ethernet interface. |
|
display hardware internal module interface-name interface-number reg 2 |
Displays MAC information for an Ethernet interface. |
|
display hardware internal module interface-name interface-number reg 3 |
Displays PHY information for an Ethernet interface. |
|
display hardware internal ibd pkt-info slot slot-number slot-number |
Displays inter-card packet statistics. |
|
debugging arp packet |
Enables ARP debugging. |
|
debugging ip packet |
Enables IP debugging. |
|
debugging ip icmp |
Enables ICMP debugging. |
Troubleshooting E1 and T1 interfaces
This section/document provides troubleshooting information for common E1 and T1 interface issues.
Common E1 and T1 interface issue troubleshooting methods
Common E1 and T1 interface issue troubleshooting methods include:
· Troubleshooting the hardware
· Troubleshooting the cables
· Troubleshooting the configuration
· Troubleshooting the clocks
· Troubleshooting grounding
· Troubleshooting through looping
Troubleshooting the hardware
1. Examine the external power supply connection.
Perform an independent power supply test for the faulty device to verify that the power supply is operating properly.
2. Perform a local loopback test:
a. Execute the loopback local command on the E1/T1 interface or execute the {fe1 | ft1} loopback local command on the E1-F/T1-F interface.
b. Identify whether the interface comes up physically, and identify whether the logical serial interface performs local loopback correctly.
- If local loopback succeeds, the card has no hardware problems.
- If local loopback fails, proceed with the following steps.
3. If local loopback succeeds after the card is installed in another slot, the device has hardware problems. In this case, proceed with the device component analysis process.
4. Replace the card.
If local loopback succeeds after the card is replaced, the card has hardware problems. In this case, proceed with the card component analysis process.
5. Replace the host.
If local loopback succeeds after the host is replaced, the host has hardware problems. In this case, proceed with the device component analysis process.
Troubleshooting the cables
1. Examine the cable quality.
¡ Verify the cables are H3C-standard cables.
¡ Replace cables.
¡ Connect the Tx and Rx ends of the cable. Identify whether the interface can perform self loopback. If self loopback succeeds, the cable has no problems. For how to perform self loopback, see “Troubleshooting through looping.”
2. Identify whether the cable impedance matches the interface impedance.
a. Execute the display controller or display fe1 command to view the interface impedance (text in blue in the command output).
[H3C] display controller E1 1/0/0
E1 1/0/0 current state :DOWN
Description : E1 1/0/0 Interface
Basic Configuration:
Work mode is E1 framed, Cable type is 120 Ohm balanced.
b. Replace the cable or adjust the DIP switch on the card to ensure that the cable impedance matches the interface impedance. (For an HMIM-8E1T1 card, use the hardware jumper and the cable-type command to identify the card impedance.)
Interface type: E1 interface
Command: cable-type { 75 | 120 }
Parameters:
- 75: Matches 75-Ω transmission lines.
- 120: Matches 120-Ω transmission lines.
3. Identify whether the cable length matches the configuration.
An E1/T1 interface poses a limit on the cable length. Typically, the maximum length cannot exceed 500 meters. A longer cable will cause more serious signal attenuation. In this case, you need to compensate the signal or connect an external CSU. The router provides the cable command to set the attenuation or length for the transmission line of an interface. This command configures the wave pattern for transmitted signals to adapt to different transmission requirements. Use this command according to the quality of the received signals. If the received signals are of good quality, use the default settings.
¡ Interface type: E1 interface
Command: cable { long | short }
Parameters:
- long: Matches 199.6-meter (655-feet) and longer cable length.
- short: Matches a cable length shorter than 199.6 meters (655 feet).
¡ Interface type: T1/T1-F interface
Command: cable { long { 0db | -7.5db | -15db | -22.5db } | short { 133ft | 266ft | 399ft | 533ft | 655ft } }
Parameters
- long: Matches 199.6-meter (655-feet) and longer cable length. The options for this parameter include 0db, -7.5db, -15db, and -22.5db. The attenuation is selected depending on the signal quality received at the receiving end. A poorer line quality results in a more serious signal attenuation. In this case, you need to compensate the signal attenuation. No external CSU is needed.
- short: Matches a cable length shorter than 199.6 meters (655 feet). The options for this parameter include 133ft, 266ft, 399ft, 533ft, and 655ft. The length is selected depending on the actual transmission distance.
Troubleshooting the configuration
1. Verify that the local end and peer end have the same configuration.
The configuration includes operating mode (framed or unframed), framing format, CRC mode, coding format, line idle code, and interframe filling tags.
|
|
TIP: The Cisco E1 interfaces use the CRC4 framing format by default. The H3C E1 interfaces use the no-CRC4 framing format by default. When interconnecting such E1 interfaces, make sure they use the same configuration. |
2. Troubleshoot the AIS alarm problems.
If the line properly transmits all-one bit streams and the idle code is FF, AIS alarms are generated when no service data is transmitted over the line and the line transmits only all-1 idle codes.
To resolve this issue, perform one of the following tasks:
¡ Execute the undo detect-ais command on the interface to disable AIS detection.
¡ Modify the interframe filling tags to 7E.
Troubleshooting the clocks
1. Select a standard clock scheme.
Depending on whether the transmission network provides a clock, an E1 interface has two available clock schemes:
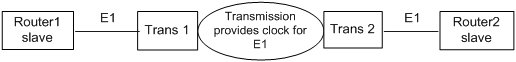
¡ When the transmission network provides a clock, the transmission network provides the master clock, and both local and peer E1 interfaces use the slave clock mode.
Figure 1 Clock scheme when the transmission network provides a clock
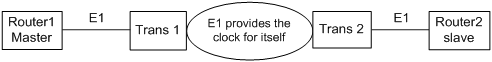
¡ When the transmission network does not provide a clock, the transmission network transparently transmits packets. Set the clock mode to master on one end and slave on the other end.
Figure 2 Clock scheme when the transmission network does not provide a clock
2. Measure the frequency deviation
If the clock configuration is incorrect, frequency deviation will occur on the transmission line. The normal frequency deviation on an E1 interface is -50ppm to +50ppm. If the frequency deviation exceeds the range, normal packet forwarding cannot be guaranteed. The frequency deviation will accumulate, and will continuously be bigger as time goes by. Accordingly, error packets will appear on the E1 interface, and at last the E1 interface will become unavailable.
To restore the frequency deviation to the initial value, shut down and then bring up the interface.
Typically, you can use the ETEN meter to measure the frequency deviation of the lines. Connect the ETEN meter to the Tx or Rx line of the E1 interface in serial, and measure the Tx and Rx frequency deviations of the line separately.
Troubleshooting the grounding
Typically bad grounding and common grounding
· The device is installed in a 19-inch cabinet, but the grounding cable of the device is not connected to the grounding strip of the cabinet.
· The device and its peer device are in the same equipment room, both devices are grounded, but they are not commonly grounded.
Influence of bad common grounding
Bad common grounding will cause different reference voltages on the two devices. As a result, the Rx/Tx and other signals are not detected on the same voltage platform. Then, the data transmitted on the local end will be different from the data received on the peer end, and error packets appear. More seriously, the protocol might come up and go down. Additionally, the normal signals transmitted on the local end might fail to be detected or be incorrectly detected on the peer end. As a result, alarms will appear on physical links, and physical E1 interfaces come up and go down.
Grounding requirements
· Make sure the devices are well grounded.
· If the device and its peer device are in the same equipment room, both devices must be grounded and commonly grounded.
· The grounding cable must be a copper cable in order to reduce the high-frequency impedance. Make sure the grounding cable is as thick and short as possible. Do not use aluminum cables.
· Make sure both ends of the grounding cable have good electric contact and have antiseptic and antirust processing.
· Do not use other devices for electric contact of the grounding cable.
· The grounding cable cannot be parallel to or twisted with signal cables.
· The connectors, on-off switches, or fuse protectors cannot be added to the grounding cable.
· The grounding cable must be yellow-green plastic-insulated copper conductor.
· The grounding cable must be shorter than 30 meters, and try to be as short as possible. When the cable exceeds 30 meters, the customer must place grounding strips nearby.
· If an UPS is used for power supply, the UPS must also be grounded.
Reliable grounding is the basic requirements for good protection against lightening, electric shock, and interference, and is the prerequisites for long-period reliable, stable operation of the device.
Different grounding methods in different environments
Grounding strips are provided in the installation environment
When the grounding strips are provided in the installation environment, perform the following tasks:
1. Make sure the grounding strip is well grounded.
2. Connect one end of the yellow-green grounding cable to the grounding post on the grounding strip, and fasten the nut.
The sectional area of the grounding cable must be no smaller than 4mm2. Make sure the cable is as short as possible, and do not twist the cable.
Figure 3 Grounding when grounding strips are provided
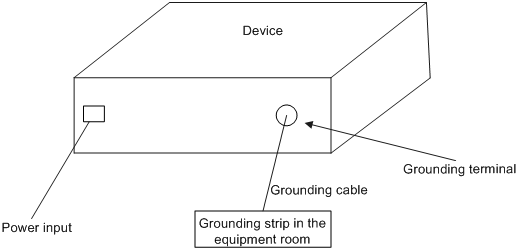
When the device is installed in a 19-inch cabinet, you can connect the yellow-green grounding cable to the grounding terminal of the cabinet, and make sure the grounding terminal of the 19-inch cabinet is well connected to the grounding strips of the equipment room.
Grounding strips are not provided and the grounding conductor cannot be buried in the earth in the installation environment
When grounding strips are not provided and the grounding conductor cannot be buried in the earth the installation environment, follow these guidelines.
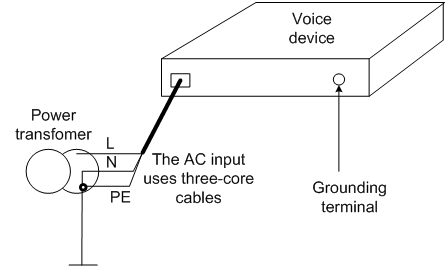
· When the device uses a 220V AC power supply, you can use the PE wire of the AC power supply for grounding, as shown in Figure 4. Make sure the PE wire of the AC power supply is well grounded in the electric distribution room or the AC power transformer. Additionally, make sure the PE terminal of the device is well connected to the PE wire of the AC power supply. The power cable of the device must be a three-core cable with a grounding cable. If the PE wire of the AC power supply is not grounded in the electric distribution room or the AC power transformer, submit the rectification requirements to the customer as soon as possible.
Figure 4 Grounding using the PE wire of the AC power supply
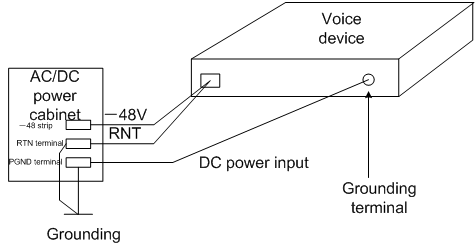
· When the device uses a -48V (or +24V) DC power supply, you can use the RTN or PGND cable of the DC power supply for grounding, as shown in Figure 5. Make sure the RTN or PGND wire of the DC power supply is well grounded in DC power supply output of the DC power supply cabinet. Otherwise, submit the rectification requirements to the customer as soon as possible.
Figure 5 Grounding using the PGND wire of the DC power supply cabinet
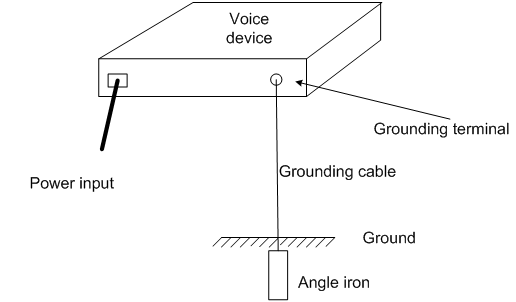
Grounding strips are not provided and the grounding conductor can be buried in the earth in the installation environment
If no grounding strips are provided and earth is available at the installation site, hammer a 0.5 m (1.64 ft) or longer angle iron or steel tube into the earth to serve as a grounding conductor. The cross section of the angle iron must be no smaller than L×W×H = 50×50×5 mm, and the thickness of the steel tube must be no smaller than 3.5mm. Galvanized steel is required. Weld the yellow-green grounding cable to the angel iron or steel tube and treat the joint for corrosion protection. The sectional area of the grounding cable must be no smaller than 4mm2. Make sure the cable is as short as possible, and do not twist the cable, as shown in Figure 6.
Figure 6 Grounding when the grounding conductor can be buried in the earth
|
|
NOTE: Method 3 is simple, and the ground resistance might be very high. Use method 3 only when method 1 or method 2 cannot be used. |
Ground resistance
Determine the ground resistance of the grounding strips according to the equipment room environment requirements. For the central telecom equipment room, determine the ground resistance according to YDJ26-89 (which requires the ground resistance to be smaller than 1Ω). For non-central telecom equipment rooms, the ground resistance must be lower than 5W. For angle irons hammered into the earth, the ground resistance can be relaxed appropriately to be smaller than 10W. In an area with a higher ground resistance, reduce the ground resistance by using brine or resistance reducing agent around the grounding conductor.
Commonly grounding devices
The interconnected devices must be commonly grounded and well grounded.
· If the interconnected devices are both installed in a 19-inch cabinet, connect the grounding cables of these devices to the grounding strip of the cabinet for common grounding.
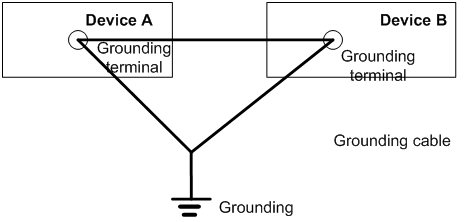
· If the interconnected devices are placed in the same equipment room and not far from each other, you can join the grounding cables of the interconnected devices and then connect the cables to the ground, as shown in Figure 7.
Figure 7 Common grounding for devices
· If the interconnected devices are not in the same equipment room, make sure all interconnected devices are well grounded.
Identifying whether the devices are commonly grounded well
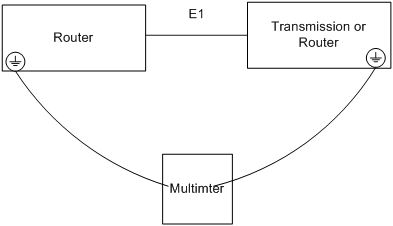
As shown in Figure 8, use the grounding cable to the lead out the grounding terminals of the interconnected devices, and use the multimeter to measure the voltage and resistance between the two grounding terminals.
· If they are well grounded, the resistance between the two terminals quickly returns to zero and the voltage is lower than 1V.
· If they are not well grounded, the resistance between the two terminals is not zero or slowly returns to zero, or the voltage is higher than 1V.
Figure 8 Identifying whether the devices are commonly grounded well
Troubleshooting through looping
Common looping points
Figure 9 Common looping points (vice versa)
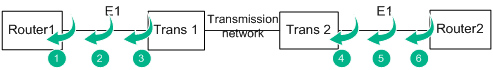
Looping point 1
Method: Execute the loopback local command on the E1 interface of the router, and execute the fe1 loopback local command on the FE1 interface.
Purpose: Verify that the router interface can properly send and receive packets.
Looping points 2 and 3
Method: Short connect the Rx and Tx cables between Router1 and transmission device 1 or form a leftwards loop on the transmission device.
Purpose: Verify that the line between Router1 and transmission device 1 is normal.
Looping point 4
Method: Form a leftwards loop on transmission device 2.
Purpose: Verify that the transmission network is normal.
Looping point 5
Method: Short connect the E1 Rx and Tx cables between Router1 and transmission device 1.
Purpose: Verify that the line whole physical link between Router1 and Router 2 is normal.
Looping point 6
Method: Execute the loopback remote/payload command on the E1 interface of Router 2, and execute the fe1 loopback remote/payload command on the FE1 interface of Router 2.
Purpose: Verify that the whole link including Router 2 is normal.
Troubleshooting lines after looping
Use the self-loopback test function of the router to troubleshoot lines
1. Enable PPP encapsulation on the interface.
2. Display the interface information.
¡ If the command output shows that the number of received packets evenly increases by 12 packets, loopback is detected, and no error packets appear, the link is normal.
¡ Otherwise, the link fails.
[H3C]dis int ser 1/0:0
Serial1/0:0
Current state: UP
Line protocol state: DOWN
Description: Serial1/0:0 Interface
Bandwidth: 64kbps
Maximum Transmit Unit: 1500
Hold timer: 10 seconds, retry times: 5
Derived from E1 1/0, Timeslot(s) Used: 1, Baudrate is 64000 bps
Internet protocol processing: disabled
Link layer protocol: PPP, Loopback: detected
LCP: closed
Output queue - Urgent queuing: Size/Length/Discards 0/100/0
Output queue - Protocol queuing: Size/Length/Discards 0/500/0
Output queue - FIFO queuing: Size/Length/Discards 0/75/0
Last clearing of counters: Never
Last 300 seconds input rate: 0.00 bytes/sec, 0 bits/sec, 0.00 packets/sec
Last 300 seconds output rate: 0.00 bytes/sec, 0 bits/sec, 0.00 packets/sec
Input:
12 packets, 156 bytes
0 broadcasts, 0 multicasts
0 errors, 0 runts, 0 giants
0 CRC, 0 align errors, 0 overruns
0 aborts, 0 no buffers, 0 frame errors
Output:
12 packets, 156 bytes
0 errors, 0 underruns, 0 collisions
0 deferred
Use the error code meter to troubleshoot lines
3. Replace the router with an error code meter.
4. Connect the Rx and Tx cables previously connected to the router to the error code meter.
In this case, the error code meter can display whether error codes exist on the line.
Troubleshooting E1/T1 interfaces
Common E1/T1 module problems include the following types:
· Physical interface anomaly, for example, the LOS, LFA, AIS, or RAI alarms exist on the controller interface and the controller interface stays down or flaps.
· The physical interface is up, and has no alarms. However, the data cannot be sent or received properly. For example, error packets exist on the local and peer interfaces, and the link layer protocol comes up and go down.
Troubleshooting physical interface anomaly
Symptom
The physical interface is abnormal, for example, the LOS, LFA, AIS, or RAI alarms exist on the controller interface and the controller interface stays down or flaps.
Solution
To resolve this issue:
1. Troubleshoot the hardware.
2. Troubleshoot the cables.
3. Troubleshoot the configuration.
4. Troubleshoot the clocks.
5. Troubleshoot grounding.
6. Troubleshoot through looping.
Data transmission anomaly
Symptom
The physical interface is up, and has no alarms. However, the data cannot be sent or received properly. For example, error packets exist on the local and peer interfaces, and the link layer protocol comes up and go down.
Solution
To resolve this issue:
1. Troubleshoot the hardware.
2. Troubleshoot the cables.
3. Troubleshoot the configuration.
4. Troubleshoot the clocks.
5. Troubleshoot grounding.
6. Troubleshoot through looping.
Collecting information
If the issue persists, execute the following commands to collect information and contact H3C Support.
· display diagnostic-information
· display device verbose
· display controller or display fe1/ft1
· display interface serial (If the number of inbound or outbound error packets increases, execute this command multiple times)
· Enter the hidden view, and use hidden commands to obtain the physical chip status. Available commands are as follows:
Enter the hidden view in Comware 7:
<H3C>system-view
System View: return to User View with Ctrl+Z.
[H3C]probe
[H3C-probe]
[H3C-probe]dis hardware internal physical Serial slot-number/port-number(:sub-channel-number) ?
boardinfo show board info
diag_info Cellular diagnosis information
intinfo Base information
intinfo_priv Private information
rx_queue show receive queue
rxbd show receive BD
statistic show state
tx_queue show transmit queue
txbd show transmit BD
Troubleshooting IPsec
This section provides troubleshooting information for common problems with IPsec.
Failure to negotiate IPsec SAs through IKE
Symptom
Network diagram:
168.201.0.0 10.1.1.1 10.1.1.2 168.68.2.200
------------------------------MSR G1-----------------------------------------MSR G2--------------------
MSR G1 and MSR G2 establish an IPsec tunnel through IKE aggressive negotiation. MSR G1 is the initiator and MSR G2 is the receiver. IKE SA negotiation succeeded but IPsec SA negotiation failed.
<Router>display ike sa
Connection-ID Remote Flag DOI
------------------------------------------------------------------
2 10.1.1.1 RD IPSEC
Flags:
RD--READY RL--REPLACED FD-FADING
<Router>display ipsec sa
<Router>
Solution
The aggressive mode exchange is as follows:
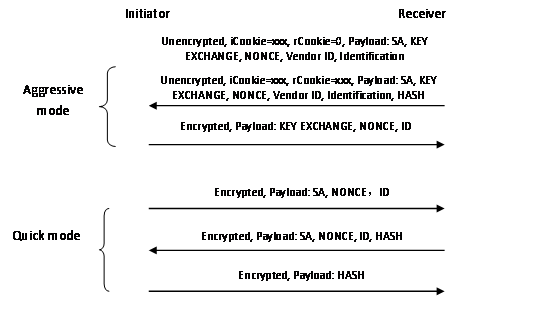
IPsec SA negotiation is performed in phase 2 negotiation. Something wrong might occur in phase 2 negotiation.
To resolve the problem:
1. On the initiator, display IKE debugging information by using the debugging ike all command. The key debugging information is as follows:
*Nov 7 09:23:08:808 2014 ROUTER IKE/7/DEBUG: send message:
//The initiator sent the first packet for negotiation.
*Nov 7 09:23:08:808 2014 ROUTER IKE/7/DEBUG: ICOOKIE: 0xb8a20d7c014806fa
*Nov 7 09:23:08:808 2014 ROUTER IKE/7/DEBUG: RCOOKIE: 0x0000000000000000
…………………
*Nov 7 09:23:09:365 2014 ROUTER IKE/7/DEBUG: exchange state machine(I): finished step 0, advancing...
*Nov 7 09:23:09:415 2014 ROUTER IKE/7/DEBUG: received message:
//The device received a reply packet from the peer (the second packet for negotiation).
*Nov 7 09:23:09:516 2014 ROUTER IKE/7/DEBUG: ICOOKIE: 0xb8a20d7c014806fa
*Nov 7 09:23:09:566 2014 ROUTER IKE/7/DEBUG: RCOOKIE: 0x67a9145eb46c41d9
…………………
*Nov 7 09:23:13:510 2014 ROUTER IKE/7/DEBUG: exchange state machine(I): finished step 1, advancing...
…………………
*Nov 7 09:23:14:820 2014 ROUTER IKE/7/DEBUG: send message:
//The device sent the third packet for negotiation.
*Nov 7 09:23:14:920 2014 ROUTER IKE/7/DEBUG: ICOOKIE: 0xb8a20d7c014806fa
*Nov 7 09:23:14:971 2014 ROUTER IKE/7/DEBUG: RCOOKIE: 0x67a9145eb46c41d9
…………………
*Nov 7 09:23:15:524 2014 ROUTER IKE/7/DEBUG: exchange state machine(I): finished step 2, advancing...
//Phase 1 negotiation finished.
…………………
*Nov 7 09:23:21:801 2014 ROUTER IKE/7/DEBUG: send message:
//The device sent the first packet for the phase 2 negotiation.
*Nov 7 09:23:21:902 2014 ROUTER IKE/7/DEBUG: ICOOKIE: 0xb8a20d7c014806fa
*Nov 7 09:23:22:002 2014 ROUTER IKE/7/DEBUG: RCOOKIE: 0x67a9145eb46c41d9
…………………
*Nov 7 09:23:22:506 2014 ROUTER IKE/7/DEBUG: exchange state machine(I): finished step 0, advancing...
*Nov 7 09:23:22:606 2014 ROUTER IKE/7/DEBUG: received message:
//The device received a reply packet from the peer.
*Nov 7 09:23:22:657 2014 ROUTER IKE/7/DEBUG: ICOOKIE: 0xb8a20d7c014806fa
*Nov 7 09:23:22:757 2014 ROUTER IKE/7/DEBUG: RCOOKIE: 0x67a9145eb46c41d9
…………………
*Nov 7 09:23:24:571 2014 ROUTER IKE/7/DEBUG: validate payload NOTIFY
*Nov 7 09:23:24:621 2014 ROUTER IKE/7/DEBUG: DOI: IPSEC
*Nov 7 09:23:24:722 2014 ROUTER IKE/7/DEBUG: PROTO: IPSEC_ESP
*Nov 7 09:23:24:822 2014 ROUTER IKE/7/DEBUG: SPI_SZ: 4
*Nov 7 09:23:24:873 2014 ROUTER IKE/7/DEBUG: MSG_TYPE: INVALID_ID_INFORMATION
//The device received a reply packet of the INVALID_ID_INFORMATION type. The negotiation failed.
*Nov 7 09:23:24:973 2014 ROUTER IKE/7/DEBUG: exchange setup(R): 9c16530
*Nov 7 09:23:25:024 2014 ROUTER IKE/7/DEBUG: exchange check: checking for required INFO
*Nov 7 09:23:25:124 2014 ROUTER IKE/7/DEBUG: got NOTIFY of type INVALID_ID_INFORMATION
The previous debugging information shows that packet exchanges were normal in phase 1 negotiation. In phase 2 negotiation, however, the initiator received an INVALID_ID_INFORMATION packet from the peer. This packet resulted in the IPsec SA negotiation failure. We need to identify why the peer device (the receiver) sent such a packet.
2. On the receiver, display IKE debugging information by using the debugging ike all command. The key debugging information is as follows:
*Nov 6 17:03:05:527 2014 ROUTER IKE/7/Event: IKE thread 366519722672 processes a job.
*Nov 6 17:03:05:527 2014 ROUTER IKE/7/Packet: Begin a new phase 1 negotiation as responder.
*Nov 6 17:03:05:527 2014 ROUTER IKE/7/Event: Responder created an SA for peer 10.1.1.1, local port 500, remote port 500.
*Nov 6 17:03:05:527 2014 ROUTER IKE/7/Event: Set IKE SA state to IKE_P1_STATE_INIT.
*Nov 6 17:03:05:527 2014 ROUTER IKE/7/Packet: Received ISAKMP Security Association Payload.
//The device received the first negotiation packet from the peer.
………
*Nov 6 17:03:05:527 2014 ROUTER IKE/7/Packet: The profile 1 is matched.
//A matching IKE profile was found.
………
*Nov 6 17:03:05:528 2014 ROUTER IKE/7/Event: Found pre-shared key in keychain 1 matching address 10.1.1.1.
//A matching keychain was found.
……….
*Nov 6 17:03:05:535 2014 ROUTER IKE/7/Event: IKE SA state changed from IKE_P1_STATE_INIT to IKE_P1_STATE_SEND2.
*Nov 6 17:03:05:535 2014 ROUTER IKE/7/Packet: Sending packet to 10.1.1.1 remote port 500, local port 500.
//The device sent a packet to the peer (the second packet for negotiation).
………..
*Nov 6 17:03:05:739 2014 ROUTER IKE/7/Packet: Received packet from 10.1.1.1 source port 500 destination port 500.
//The device received a packet from the peer (the third packet for negotiation).
……….
*Nov 6 17:03:05:741 2014 ROUTER IKE/7/Event: IKE SA state changed from IKE_P1_STATE_SEND2 to IKE_P1_STATE_ESTABLISHED.
//Phase 1 negotiation finished.
*Nov 6 17:03:05:741 2014 ROUTER IKE/7/Event: Add tunnel, alloc new tunnel with ID [1].
*Nov 6 17:03:05:983 2014 ROUTER IKE/7/Packet: Received packet from 10.1.1.1 source port 500 destination port 500.
//The device received the first packet for phase 2 negotiation.
………….
*Nov 6 17:03:05:984 2014 ROUTER IKE/7/Event: IPsec SA state changed from IKE_P2_STATE_INIT to IKE_P2_STATE_GETSP.
*Nov 6 17:03:05:985 2014 ROUTER IKE/7/Error: Failed to get IPsec policy for phase 2 responder. Delete IPsec SA.
*Nov 6 17:03:05:985 2014 ROUTER IKE/7/Error: Failed to negotiate IPsec SA.
//No matching IPsec policy was found. IPsec SA negotiation failed.
*Nov 6 17:03:05:985 2014 ROUTER IKE/7/Event: Delete IPsec SA.
*Nov 6 17:03:05:985 2014 ROUTER IKE/7/Packet: Encrypt the packet.
*Nov 6 17:03:05:985 2014 ROUTER IKE/7/Packet: Construct notification packet: INVALID_ID_INFORMATION.
*Nov 6 17:03:05:985 2014 ROUTER IKE/7/Packet: Sending packet to 10.1.1.1 remote port 500, local port 500.
//The device notified the peer of the failure.
The previous debugging information shows that the IPsec SA negotiation failed because no matching IPsec policy was found on the receiver. So we need to examine the IPsec policy configuration.
3. Display the IPsec policy configuration on the initiator and the receiver. The following shows the IPsec policy configuration on the receiver:
ipsec policy hzbank 7000 isakmp
transform-set 1
security acl 3000
ike-profile 1
reverse-route dynamic
reverse-route tag 10
4. Verify that the transform set configuration (such as the encryption and authentication algorithms) is consistent on both devices.
5. Check whether the remote IP address is configured in the IPsec policy. If not, configure the remote IP address in the IPsec policy, for example:
[Router]ipsec policy hzbank 7000 isakmp
[Router-ipsec-policy-isakmp-hzbank-7000]remote-address 10.1.1.1
|
|
NOTE: The initiator and the receiver must specify the remote IP address of the IPsec tunnel by using the remote-address command in the IPsec policy. If the receiver uses an IPsec policy template, the remote IP address configuration is optional on the receiver. |
6. Verify that the protection flows configuration is consistent on both devices.
IPsec uses ACLs to identify the traffic to be protected. Make sure the ACL rules in an IPsec policy are correctly configured, and make sure the ACL rules on one device are the mirror images of the rules on the peer device. For example, on IPsec peers A and B, if the ACL rule in the IPsec policy on device B is b->a, the ACL rule in the IPsec policy on device A must be a->b.
If the ACL rules on IPsec peers do not form mirror images of each other, SAs can be set up only when the range specified by an ACL rule on the initiator is covered by its counterpart ACL rule on the receiver. For example:
The ACL on the initiator is as follows:
acl number 3001
rule 5 permit ip source 168.201.0.0 0.0.0.7 destination 168.68.2.200 0
The ACL on the receiver is as follows:
acl number 3000
rule 7 permit ip source 168.68.2.200 0 destination 168.201.0.0 0.0.127.255
|
|
NOTE: If the receiver uses an IPsec policy template, the ACL is optional. If no ACL is specified, the IPsec protection range has no limit. So the receiver accepts all ACL settings of the negotiation initiator. If an ACL is configured, all the rules of the ACL must comply with the previous requirements. |
Related commands
This section lists the commands that you might use for troubleshooting IPsec.
|
Command |
Description |
|
display ike sa [ verbose [ connection-id connection-id | remote-address [ ipv6 ] remote-address [ vpn-instance vpn-name ] ] ] |
Displays detailed information about current IKE SAs. |
|
display ipsec sa [ brief | count | interface interface-type interface-number | { ipv6-policy | policy } policy-name [ seq-number ] | profile profile-name | remote [ ipv6 ] ip-address ] |
Displays information about IPsec SAs. |
|
debugging ike error |
Displays IKE error debugging information. |
|
debugging ike event |
Displays IKE event debugging information. |
|
debugging ike packet |
Displays IKE packet debugging information. |
|
debugging ike all |
Displays information about all types of IKE debugging. |
|
debugging ipsec all |
Displays information about all types of IPsec debugging. |
Troubleshooting PPPoE
Authentication failure in PPPoE dialup
Symptom
![]()
In a standard PPPoE network, the MSR router acts as a PPPoE server, and the CAMS server acts as an authentication server.
Client authentication failed.
The client carries an incorrect username (not assigned by the system):
Host Len: 42 Name:a:2yZsyoBNb16F355VlFaYDJ6ZyNqx8cb::b052204
Host Len: 9 Name:^^b052204
Solution
To resolve the issue:
1. Troubleshoot the MSR router. Execute the debugging ppp all command and the debugging radius packet command to view the debugging information:
*Oct 22 14:00:07:012 2014 3640 PPP/7/PAP_PACKET_0:
PPP Packet:
Virtual-Access0 Input PAP(c023) Packet, PktLen 32
State ServerListen, code Request(01), id 9, Len 28
0W'ZK5A9fd00001 16 Name:
Pwd Len: * Pwd :******
*Oct 22 14:00:07:012 2014 3640 PPP/7/PAP_EVENT_0:
PPP Event:
Virtual-Access0 PAP Receive Request Event
State ServerListen
*Oct 22 14:00:07:013 2014 3640 PPP/7/PAP_STATE_0:
PPP State Change:
Virtual-Access0 PAP: ServerListen --> WaitAAA
*Oct 22 14:00:07:013 2014 3640 RADIUS/7/PACKET:
User-Name="\r0W'ZK5A9fd00001"
User-Password=******
Service-Type=Framed-User
NAS-Identifier="3640"
NAS-Port=4096
NAS-Port-Type=Ethernet
Calling-Station-Id="8c21-0a7e-71c5"
Acct-Session-Id="00000005201410221400070000001e001 225"
NAS-Port-Id="slot=65535;subslot=0;port=0;vlanid=0"
H3c-Ip-Host-Addr="255.255.255.255 8c:21:0a:7e:71:c5"
NAS-IP-Address=60.191.123.92
H3c-Product-Id="H3C MSR36-40"
H3c-Nas-Startup-Timestamp=1413972953
….
*Oct 22 13:59:46:225 2014 3640 PPP/7/PAP_EVENT_0:
PPP Event:
Virtual-Access0 PAP Receive AAA Result Event
State WaitAAA
*Oct 22 13:59:46:225 2014 3640 PPP/7/AUTH_ERROR_0:
PPP Error:
Virtual-Access0 PAP: Receive AAA reject message, authentication failed!
As the debugging information shows, the username received by PPP is incorrect. The MSR router has no problems.
2. Troubleshoot the dialup mode of the small home router.
A small home router typically uses the automatic dialup method. At first, the router uses the normal dialup mode. If the dialup fails, the router will try various special dialup modes. Typical authentication servers do not support special dialup modes. As a result, a large number of authentication failures occur. When such problems occur, you need to troubleshoot the failure reason for the first dialup failure.
|
|
TIP: You do not need to be concerned about the abnormal usernames caused by special dialup modes on the small home router. |
Related commands
This section lists the commands that you might use for troubleshooting PPPoE.
|
Command |
Description |
|
display pppoe-server session summary |
Displays PPPoE session information. |
|
debugging ppp lcp all |
Enables debugging for the PPP LCP phase. |
|
debugging ppp pap all |
Enables debugging for the PPP PAP phase. |
|
debugging ppp ipcp all |
Enables debugging for the PPP IPCP phase. |
|
debugging radius packet |
Enables debugging for the RADIUS packets. |
