- Released At: 17-04-2024
- Page Views:
- Downloads:
- Table of Contents
- Related Documents
-
|
|
|
Telemetry Technology White Paper |
|
|
|
|
|
|
Copyright © 2024 New H3C Technologies Co., Ltd. All rights reserved.
No part of this manual may be reproduced or transmitted in any form or by any means without prior written consent of New H3C Technologies Co., Ltd.
Except for the trademarks of New H3C Technologies Co., Ltd., any trademarks that may be mentioned in this document are the property of their respective owners.
This document provides generic technical information, some of which might not be applicable to your products.
The information in this document is subject to change without notice.
Contents
Proto definition files in dial-in mode
Proto definition files in dial-out mode
Obtaining proto definition files
Telemetry
Technical background
Driven by the popularity of networking and the emergence of new technologies, networks have grown radically in size and deployment complexity. Users also have increasingly high demands for service quality. The demands require network operations and maintenance should be more refined and intelligent. Network O&M are facing the following challenges:
· Mass scale—The number of managed devices and the amount of monitored information are large.
· Fast fault location—Second-level or even subsecond-level fault location is required in complex networks.
· Granular monitoring—There is a need for a wider variety of data types and finer monitoring granularity to fully and accurately reflect the network status. This enables the prediction of potential faults and provides strong data support for network optimization. Network operation and maintenance systems need to monitor not only traffic statistics on interfaces, packet loss on each flow, CPU, and memory usage but also each flow's latency jitter, the delay of each packet along the transmission path, and buffer occupancy on each device.
Traditional monitoring methods (for example, SNMP, CLI, and logging) cannot meet the network requirements.
· SNMP and CLI use the pull mode to request information from a device, which limits the number of monitored devices and the speed of obtaining information.
· Although SNMP traps and logging use the push mode to automatically obtain information from devices, the obtained information is limited to events and alarms and cannot accurately reflect the network status.
Telemetry is a remote data collection technology that monitors device performance and faults. It uses the push mode to obtain rich monitoring data and help rapidly locate faults.
Technical benefits
Telemetry has the following benefits:
· Multiple implementation methods, including Google Remote Procedure Call (gRPC), Inband Network Telemetry (INT), and Encapsulated Remote SPAN (ERSPAN), meeting various user requirements.
· Finer granularity and rich types of data to be collected.
· Subscription-based data streaming alleviates the burden of network devices to process requests. Once a management system subscribes to telemetry data of interest with a network device, that network device continuously streams the subscribed data to the subscriber.
· More rapid and accurate fault location.
Telemetry network model
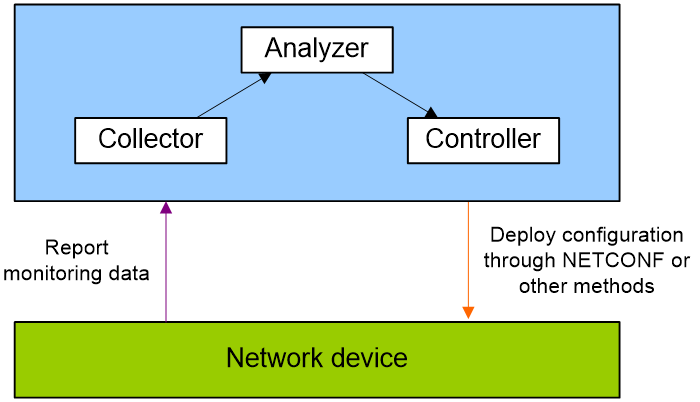
As shown in Figure 1, a telemetry network contains the following components:
· Network device—Monitored device. It samples monitored data and sends sampled data to the collector at intervals through gRPC, INT, or ERSPAN.
· Collector—Receives and stores the monitoring data reported by a network device.
· Analyzer—Analyzes and processes monitoring data received by the collector and presents the data to users in a GUI interface.
· Controller—Manages a network device by deploying configuration to it through NETCONF or other methods. It can deploy configuration or adjust the forwarding behaviors of the device based on the analyzed data. Additionally, it can control the data sampled and reported by the device.
Figure 1 Telemetry network model
Telemetry implementation
Based on the data reporting mode, telemetry can be implemented in the following methods:
· gRPC-based telemetry.
gRPC is an open-source, high-performance RPC framework that uses HTTP 2.0 for transport. gRPC supports a variety of programming languages to configure and manage network devices.
gRPC-based telemetry can collect interface traffic statistics, CPU usage, and alarms. It uses protocol buffers to encode collected data and reports it to the collector in real time.
· INT-based telemetry.
Proposed by Barefoot, Arista, Dell, Intel, and VMware, INT is a network monitoring technology designed to collect data from the device. The device proactively sends data to a collector in real time for device performance monitoring and network monitoring.
INT collects per-packet data plane information such as path and delay information and can implement comprehensive and real-time monitoring.
· ERSPAN-based telemetry
ERSPAN encapsulates mirrored packets into GRE packets with protocol number 0x88BE and sends them to a remote monitoring device.
You can define the packets to be mirrored as required. For example, you can mirror TCP three-way handshake messages to monitor TCP connection setup or mirror RDMA signaling messages to monitor the RDMA session state.
Typical network applications
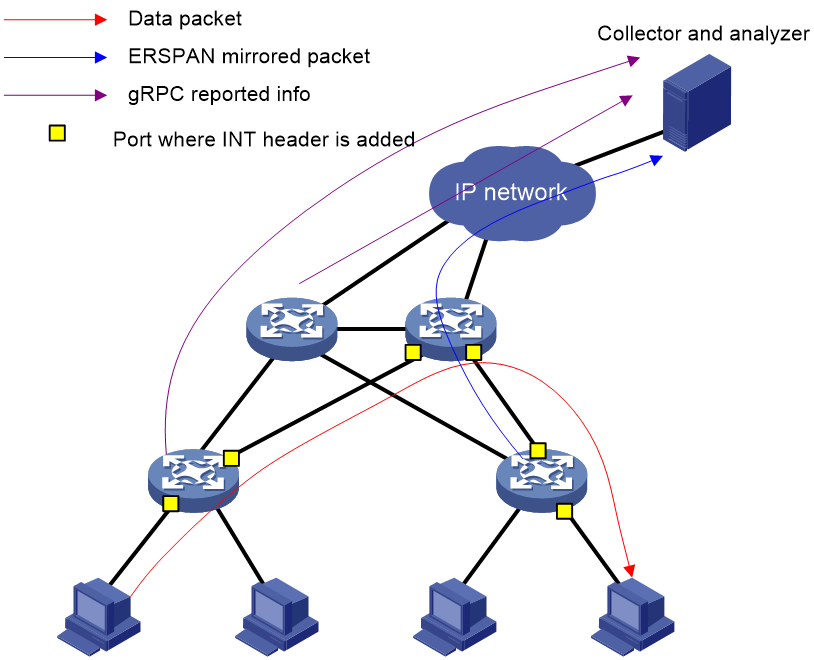
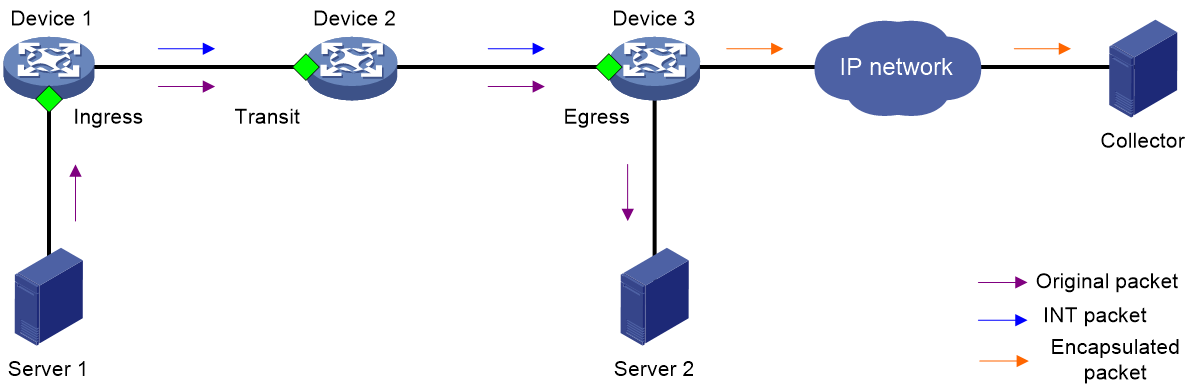
As shown in Figure 2, you can deploy multiple telemetry technologies in a network to implement comprehensive and multifaceted monitoring. Alternatively, you can deploy a single telemetry technology to monitor a specific aspect.
After a telemetry technology sends collected data to the collector, the administrator can present it through a GUI interface on the collector for rapid fault location. The administrator can also identify potential issues and optimize the network in time.
Figure 2 Typical network applications
gRPC-based telemetry
gRPC-based telemetry enables the device to read various statistics (for example, CPU, memory, and interface statistics) and push data to collectors as subscribed. Compared with traditional monitoring methods, gRPC-based telemetry features real-time and high-efficiency data collection.
About gRPC
gRPC protocol stack
Figure 3 gRPC protocol stack
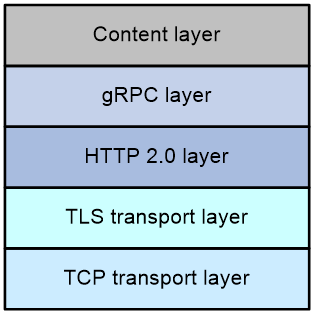
Table 1 describes the gRPC protocol stack layers from the bottom up.
Table 1 gRPC protocol stack layers
|
Layer |
Description |
|
TCP transport layer |
Provides connection-oriented reliable data links. |
|
TLS transport layer |
(Optional.) Provides channel encryption and mutual certificate authentication. |
|
HTTP 2.0 layer |
The transport protocol for gRPC. HTTP 2.0 provides enhanced features such as header field compression, multiplexing requests on a single connection, and flow control. |
|
gRPC layer |
Defines the interaction format for RPC calls. Public proto definition files such as the grpc_dialout.proto file define the public RPC methods. |
|
Content layer |
Carries encoded service data. This layer supports the following encoding formats: · Google Protocol Buffer (GPB)—A highly efficient binary encoding format. This format uses proto definition files to describe the structure of data to be serialized. GPB is more efficient in data transmission than protocols such as JavaScript Object Notation. · JavaScript Object Notation (JSON)—A lightweight data exchange format. It uses a text format that is language neutral to store and represent data, which is easy to read and compile. If service data is in JSON format, you can use the public proto files to decode the data without having to use the proto file specific to the service module. |
Network architecture
As shown in Figure 4, the gRPC network uses the client/server model. It uses HTTP 2.0 for packet transport.
Figure 4 gRPC network architecture
![]()
The gRPC network uses the following mechanism:
1. The gRPC server listens to connection requests from clients at the gRPC service port.
2. A user runs the gRPC client application to log in to the gRPC server, and uses methods provided in the .proto file to send requests.
3. The gRPC server responds to requests from the gRPC client.
H3C devices can act as gRPC servers or clients.
Telemetry modes
The device supports the following telemetry modes:
· Dial-in mode—The device acts as a gRPC server and the collectors act as gRPC clients. A collector initiates a gRPC connection to the device to subscribe to device data.
Dial-in mode applies to small-scale networks and scenarios where collectors need to deploy configuration to the device.
· Dial-out mode—The device acts as a gRPC client and the collectors act as gRPC servers. The device initiates gRPC connections to the collectors and pushes device data to the collectors as configured.
Dial-out mode applies to scenarios where a large number of devices need to be monitored.
Protocol buffer code format
Google Protocol Buffers provide a flexible mechanism for serializing structured data. Different from XML code and JSON code, the protocol buffer code is binary and provides higher performance.
Table 2 compares a protocol buffer code format example and the corresponding JSON code format example. The JSON code format is used for all service data notifications.
Table 2 Protocol buffer and JSON code format examples
|
Protocol buffer code format example |
|
Proto definition files
You can define data structures in a proto definition file. Then, you can compile the file with utility protoc to generate code in a programing language such as Java and C++. Using the generated code, you can develop an application for a collector to communicate with the device.
H3C provides proto definition files for both dial-in mode and dial-out mode.
Proto definition files in dial-in mode
Public proto definition files
The grpc_service.proto file defines the public RPC methods in dial-in mode (for example, login and logout).
The following are the contents of the grpc_service.proto file:
syntax = "proto2";
package grpc_service;
message GetJsonReply { // Reply to the Get method
required string result = 1;
}
message SubscribeReply { // Subscription result
required string result = 1;
}
message ConfigReply { // Configuration result
required string result = 1;
}
message ReportEvent { // Subscribed event
required string token_id = 1; // Login token_id
required string stream_name = 2; // Event stream name
required string event_name = 3; // Event name
required string json_text = 4; // Subscription result, a JSON string
}
message GetReportRequest{ // Obtains the event subscription result
required string token_id = 1; // Returns the token_id upon a successful login
}
message LoginRequest { // Login request parameters
required string user_name = 1; // Username
required string password = 2; // Password
}
message LoginReply { // Reply to a login request
required string token_id = 1; // Returns the token_id upon a successful login
}
message LogoutRequest { // Logout parameter
required string token_id = 1; // token_id
}
message LogoutReply { // Reply to a logout request
required string result = 1; // Logout result
}
message SubscribeRequest { // Event stream name
required string stream_name = 1;
}
service GrpcService { // gRPC methods
rpc Login (LoginRequest) returns (LoginReply) {} // Login method
rpc Logout (LogoutRequest) returns (LogoutReply) {} // Logout method
rpc SubscribeByStreamName (SubscribeRequest) returns (SubscribeReply) {} // Event subscription method
rpc GetEventReport (GetReportRequest) returns (stream ReportEvent) {} // Method for obtaining the subscribed event
}
Proto definition files for service modules
The dial-in mode supports proto definition files for the following service modules: Device, Ifmgr, IPFW, LLDP, and Syslog.
The following are the contents of the Device.proto file, which defines the RPC methods for the Device module:
syntax = "proto2";
import "grpc_service.proto";
package device;
message DeviceBase { // Structure for obtaining basic device information
optional string HostName = 1; // Device name
optional string HostOid = 2; // sysoid
optional uint32 MaxChassisNum = 3; // Maximum number of chassis
optional uint32 MaxSlotNum = 4; // Maximum number of slots
optional string HostDescription = 5; // Device description
}
message DevicePhysicalEntities { // Structure for obtaining physical entity information of the device
message Entity {
optional uint32 PhysicalIndex = 1; // Entity index
optional string VendorType = 2; // Vendor type
optional uint32 EntityClass = 3;// Entity class
optional string SoftwareRev = 4; // Software version
optional string SerialNumber = 5; // Serial number
optional string Model = 6; // Model
}
repeated Entity entity = 1;
}
service DeviceService { // RPC methods
rpc GetJsonDeviceBase(DeviceBase) returns (grpc_service.GetJsonReply) {} // Method for obtaining basic device information
rpc GetJsonDevicePhysicalEntities(DevicePhysicalEntities) returns (grpc_service.GetJsonReply) {}
} // Method for obtaining physical entity information of the device
Proto definition files in dial-out mode
The grpc_dialout.proto file defines the public RPC methods in dial-out mode. The following are the contents of the file:
syntax = "proto2";
package grpc_dialout;
message DeviceInfo{ // Pushed device information
required string producerName = 1; // Vendor name
required string deviceName = 2; // Device name
required string deviceModel = 3; // Device model
}
message DialoutMsg{ // Format of the pushed data
required DeviceInfo deviceMsg = 1; // Device information described by DeviceInfo
required string sensorPath = 2; // Sensor path, which corresponds to xpath in NETCONF
required string jsonData = 3; // Sampled data, a JSON string
}
message DialoutResponse{ // Response from the collector. Reserved. The value is not processed.
required string response = 1;
}
service gRPCDialout { // Data push method
rpc Dialout(stream DialoutMsg) returns (DialoutResponse);
}
Obtaining proto definition files
Contact H3C Support.
Supported service data types
In dial-in mode, the device can provide data of the following service modules: Device, Ifmgr, IPFW, LLDP, and Syslog. For more information, see the proto definition files provided by H3C.
In dial-out mode, the device can collect the following types of service data:
· Event-triggered sampling—Samples data when certain events occur. For more information about the events, see the NETCONF XML API references for the module except for NETCONF XML API Event Reference.
· Periodic sampling—Samples data at intervals. For more information about supported data types, see the NETCONF XML API references for the module except for NETCONF XML API Event Reference.
To view the types of service data that can be sampled in dial-out mode, execute the sensor path command.
INT-based telemetry
Overview
Technical background
In recent years, data center network technologies have developed rapidly, but there has been a long-standing lack of attention to traffic management and fault monitoring. With the rapid expansion of the data center network scale, the absence of reliable automated management and maintenance platforms presents significant challenges to network management and maintenance.
In traditional networks, the radar detection technology is typically used to detect the packet forwarding paths. However, the radar detection technology requires the intervention of controller software. The design implementation is relatively complex without hardware support, and the technology cannot fully simulate the actual packet forwarding.
Ping and tracert can monitor the network delay and path, but they cannot accurately determine on which interface a packet is longest delayed in a delay-sensitive network.
As an important part of network visualization, INT is the first and the most important step in the journey towards automated operations and maintenance. With INT, we can know information about each device on the actual forwarding path, the ingress port, egress port, and queue information of each device, and corresponding timestamps.
Technical benefits
INT provides visibility into the following information on the forwarding path:
· Ingress port, egress port, and queue information of each device.
· Ingress timestamp and egress timestamp.
· Queue congestion information.
On the last hop in the forwarding path, INT encapsulates monitored packets with the UDP header and IP header and sends the packets to the collector. Then, the NMS software deployed on the collector analyzes the monitored data and extracts useful information.
INT provides the following benefits:
· Full hardware support.
· One configuration deployment for continuous data reporting.
· You can configure the sampling rate for INT collection of mirroring original packets.
· You can configure QoS policies to flexibly match original packets that require path detection.
· INT can directly encapsulate and send packets to the collector at the last hop of path detection.
· INT can collect information about devices, ports, queues, and timestamps on the detection path, and information about forwarding paths.
Technical standardization
INT is defined in the IETF's Internet Draft Inband Flow Analyzer draft-kumar-ifa-00. This draft describes the formats of the INT header and metadata in detail. Theoretically, network devices that support this draft can implement INT packet analysis and processing functions.
Network model
As shown in Figure 5, an INT network contains the following components:
· Entry node—The first device on the INT network samples packets and mirrors packets to the INT processor within the device, adds the INT header and monitoring information to the packets, and sends packets to a transit node.
· Transit node—A transit node recognizes INT packets, adds monitoring information to the packets, and sends packets to a downstream node.
· Exit node—The last hop device on the INT network automatically recognizes INT packets, adds the monitoring information to the packets, encapsulates the monitoring information with the UDP header and IP header according to the configured encapsulation parameters, and sends the packets to the collector.
· Ingress port—For the entry node, this port is the input interface of original packets. For the transit nodes and exit node, this port is the input interface of INT packets.
· Egress port—For the entry node and transit nodes, this port is the output interface of INT packets. For the exit node, this port is the output interface of encapsulated packets.
· INT processor—The INT processor is a dedicated processor in the CPU used for processing INT packets. For the mirrored packets on the entry node, the INT processor adds the INT header to generate INT packets. On the exit node, the INT processor performs a consistency check on the encapsulation format of monitoring information and encapsulates the UDP header for the INT packets.
Packet formats
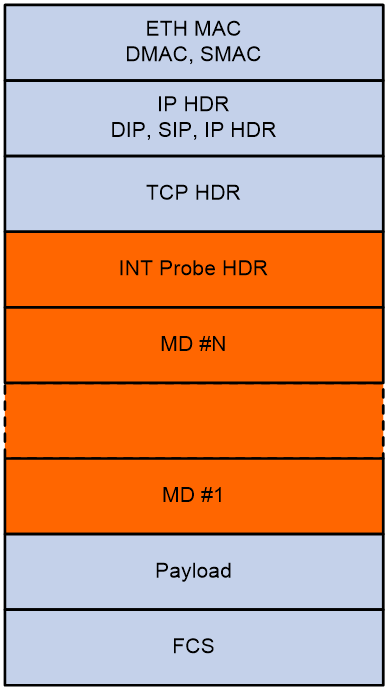
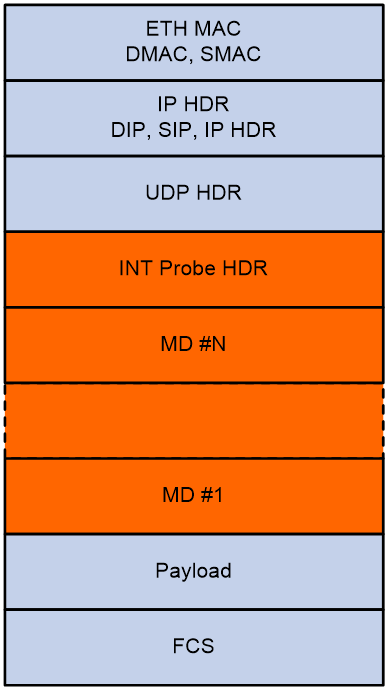
INT packet header
As shown in Figure 6 and Figure 7, an INT packet header contains two parts: INT Probe HDR (header inherent to INT) and MD #1-N (inserted metadata). INT has two packet types: INT over TCP and INT over UDP.
An original TCP packet is called an INT-over-TCP packet after it is mirrored and inserted with an INT header.
An original UDP packet is called an INT-over-UDP packet after it is mirrored and inserted with an INT header.
Inherent header format
Figure 8 shows the format of the inherent header.
Figure 8 Inherent header format
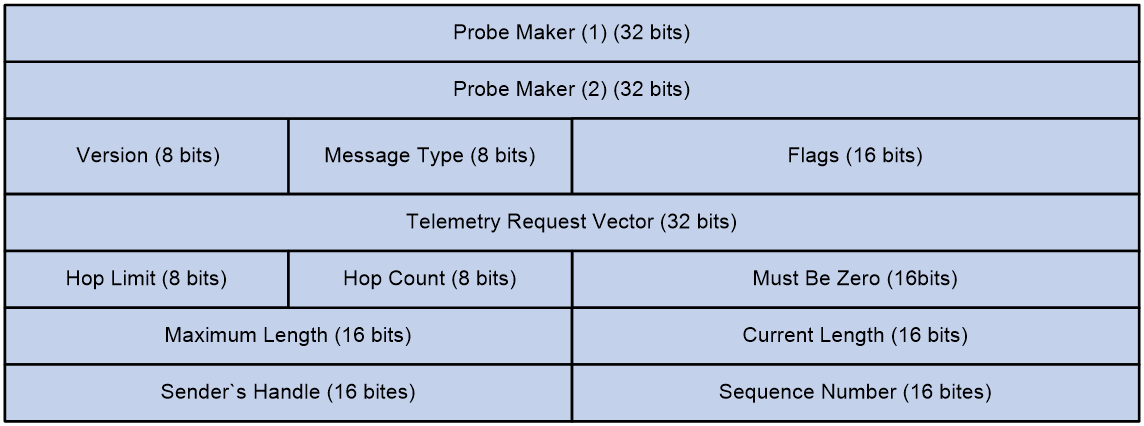
The following explains the meanings of the fields:
· Probe Marker—Used by the device to identify INT packets. Its value is fixed at 0xaaaaaaaabbbbbbbb.
· Version—Currently fixed at 0x01.
· Message Type—Currently fixed at 0x01.
· Flags—A reserved field, currently fixed at 0x0000.
· Telemetry Request Vector—Currently fixed at 0xffffffff.
· Hop Limit—Maximum number of hops allowed.
· Hop Count—Number of nodes the packet has traversed.
· Maximum Length—Maximum length of collected data, in bytes.
· Current Length—Current length of collected data, in bytes.
· Sender's Handle—Set by the entry node for the collector to uniquely identify an INT flow.
· Sequence Number—Sequence number of a packet in an INT flow.
Metadata format
Figure 9 shows the format of the metadata.
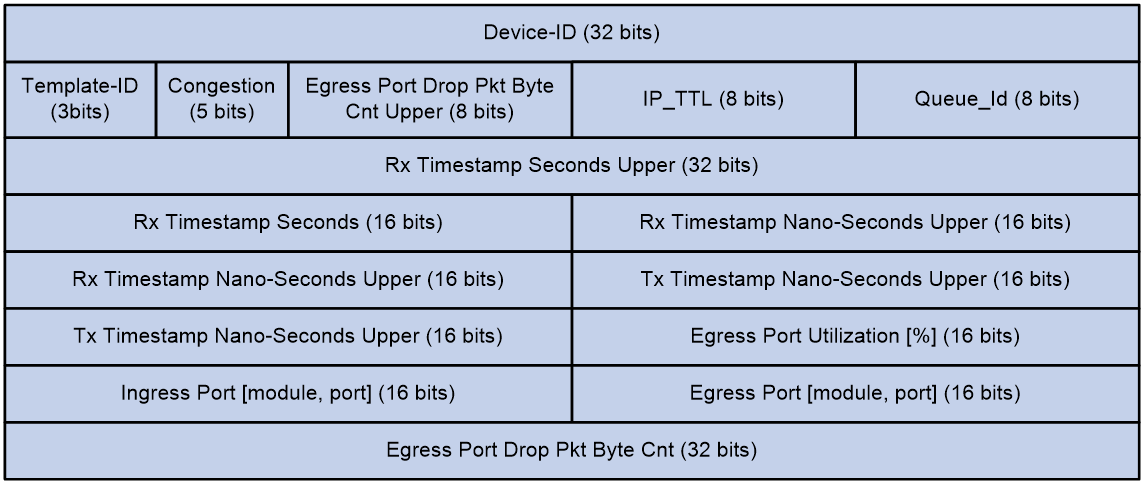
The following explains the meanings of the fields:
· Device-ID—ID of the device.
· Template-Id—A reserved field, currently fixed at 000.
· Congestion—Indicates the congestion state. The three high bits are fixed at 000, and the two low bits indicate the ECN field.
· Egress Port Drop Pkt Byte Cnt Upper—Drop count in bytes for the egress port, currently fixed at 0x00.
· IP_TTL—TTL value.
· Queue-Id—Egress port queue ID, currently fixed at 0x00.
· Rx Timestamp Seconds Upper/Rx Timestamp Seconds—Ingress timestamp in seconds.
· Rx Timestamp Nano-Seconds Upper—Ingress timestamp in nanoseconds.
· Tx Timestamp Nano-Seconds Upper—Egress timestamp in nanoseconds.
· Egress Port Utilization [%]—Egress port usage in percentage, currently fixed at 0x0000.
· Ingress Port [module, port]—Ingress port.
· Egress Port [module, port]—Egress port.
· Egress Port Drop Pkt Byte Cnt—Drop count in bytes for the egress port, currently fixed at 0x00000000.
Operating mechanism
INT-capable devices form an INT zone. Each INT device performs different functions in the INT zone.
· Entry node—Apply a QoS policy to the inbound direction of the ingress port to classify received traffic and mirror the classified traffic to the INT processor. The INT processor adds the inherent INT header to the mirrored packets, sends them to the forwarding logic of the chip, adds metadata, and then forwards the packet.
· Transit node—The transit node automatically identifies INT packets, adds metadata to them, and forwards them.
· Exit node—The egress port automatically identifies INT packets, sends the INT packets to the INT processor, and performs the following actions on the packets:
a. Adds metadata.
b. Encapsulates the UDP header for the INT packets.
c. Encapsulates the IP header for the INT packets based on the configured encapsulation parameters.
d. Routes the packets to the remote collector according to the IP address in the IP header.
Metadata that INT can collect
INT can collect and monitor the following metadata:
· Device ID—The device ID of each device on the packet forwarding path, which is the device ID specified when you configure INT.
· Ingress port ID—Logical input interface of packets on each node in the INT network.
· Ingress timestamp—The local time on the device when a packet enters the ingress port. For the entry node, it is the time when an INT packet enters the loopback interface.
· Egress port ID—Logical output interface of packets on each node in the INT network.
· Egress timestamp—The local time on the device when a packet leaves the egress port.
· Cache information—Options include:
¡ Queue ID—ID of the queue that caches original packets.
¡ ECN information.
ERSPAN-based telemetry
Overview
ERSPAN is a Layer 3 remote port mirroring technology that copies packets passing through a port, VLAN, or CPU and routes the packets to the remote monitoring device for monitoring and troubleshooting.
Network model
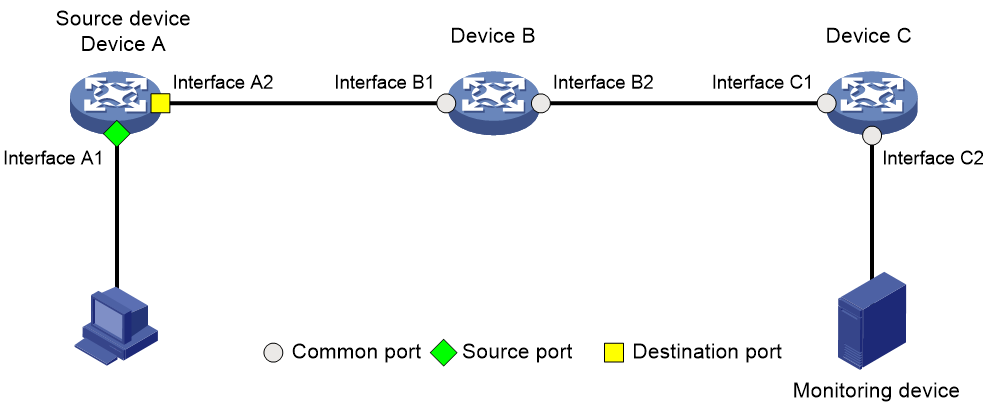
As shown in Figure 10, an ERSPAN network contains the following components:
· Mirroring source—Can be one or more monitored ports (called source ports), VLANs (called source VLANs), or CPUs (called source CPUs). Packets passing through mirroring sources are copied to a data monitoring device for packet analysis. The copies are called mirrored packets.
· Source device—The device where the mirroring sources reside.
· Mirroring destination—The mirroring destination connects to a data monitoring device and is the destination port (also known as the monitor port) of mirrored packets. Mirrored packets are sent out of the monitor port to the data monitoring device.
· Mirroring direction—The mirroring direction specifies the direction of the traffic that is copied on a mirroring source.
¡ Inbound—Copies packets received.
¡ Outbound—Copies packets sent.
¡ Bidirectional—Copies packets received and sent.
Figure 10 ERSPAN network model
Packet encapsulation formats
ERSPAN has three packet encapsulation formats. The device supports only the Type II format, which encapsulates mirrored packets into GRE packets with protocol number 0x88BE, as shown in Figure 11.
Figure 11 Packet encapsulation format
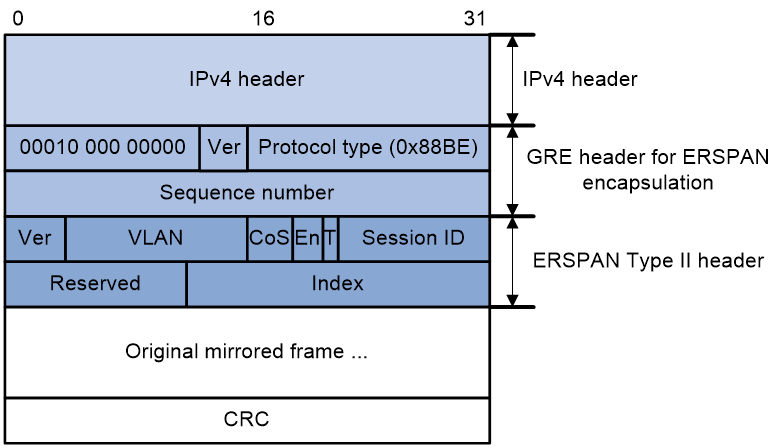
ERSPAN adds an ERSPAN header, recalculates the CRC, and adds a GRE header and an IPv4 header for mirrored packets.
The meanings of fields in the GRE header and ERSPAN header are described as follows:
· GRE header:
¡ Flags—The S bit is 1, which indicates that a packet can be determined as an in-order or out-of-order packet through the sequence number. All other bits are 0.
¡ Ver—Version number, which is fixed at 0.
¡ Protocol type (0x88BE) —The passenger protocol of GRE is ERSPAN type II.
¡ Sequence number—The sequence number increases by 1 when a new packet is received.
· ERSPAN header:
¡ Ver—ERSPAN version number. The version number for ERSPAN type II is 1.
¡ VLAN—Original VLAN of a mirrored packet.
¡ CoS—Original class of service (CoS) of the mirrored packet.
¡ En—Data frame encapsulation type of the ERSPAN traffic source port. Value 00 indicates encapsulation without VLAN tags. Value 01 indicates ISL encapsulation. Value 10 indicates 802.1Q encapsulation. Value 11 indicates encapsulation with VLAN tags.
¡ T—Value 1 indicates that the mirrored packet was fragmented when being encapsulated in ERSPAN because it exceeded the interface MTU.
¡ Session ID—ERSPAN session ID. This ID must be unique for the same source device and destination device.
¡ Index—Index for the source port and mirroring direction.
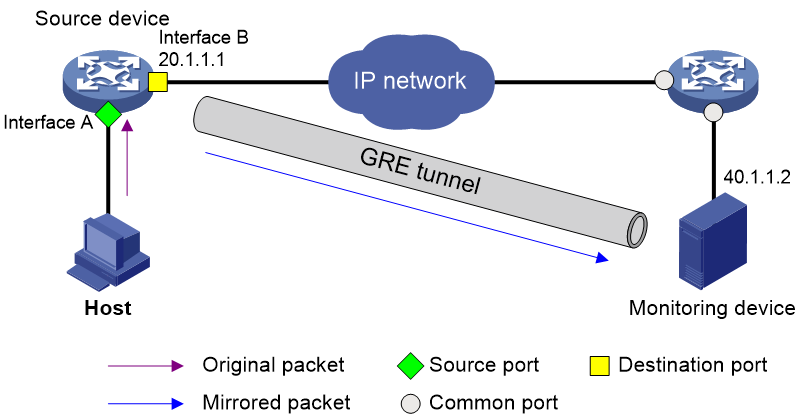
Operating mechanism
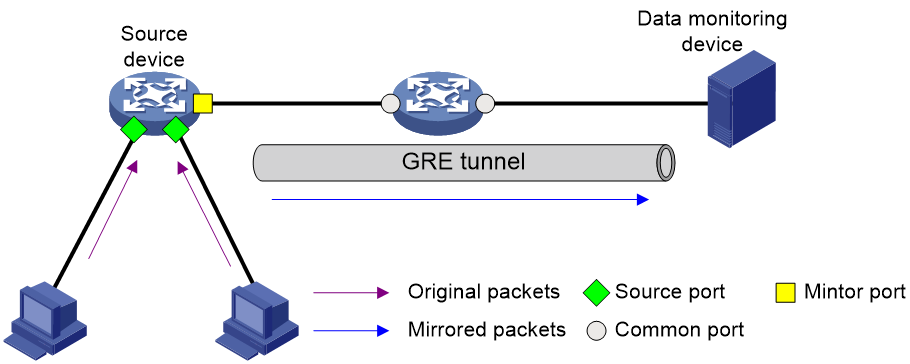
As shown in Figure 12, ERSPAN mirrors packets as follows:
1. The source device copies a packet passing through a source port, source VLAN, or source CPU.
2. The source device encapsulates the copied packet with the specified encapsulation parameters, 40.1.1.2 as destination IP and 20.1.1.1 as source IP.
3. The encapsulated packet is sent to the monitoring device through the GRE tunnel.
4. The monitoring device decapsulates the packet and analyzes the packet contents.
Figure 12 ERSPAN operating mechanism
Application scenarios
ERSPAN allows you to mirror packets of interest to a remote monitoring device for analysis and monitoring. For example, you can mirror TCP three-way handshake messages to monitor TCP connection setup or mirror RDMA signaling messages to monitor the RDMA session state.
Figure 13 ERSPAN application scenario