- Released At: 18-12-2024
- Page Views:
- Downloads:
- Table of Contents
- Related Documents
-
Comware 7 Open Programmability Technology White Paper
Copyright © 2024 New H3C Technologies Co., Ltd. All rights reserved.
No part of this manual may be reproduced or transmitted in any form or by any means without prior written consent of New H3C Technologies Co., Ltd.
Except for the trademarks of New H3C Technologies Co., Ltd., any trademarks that may be mentioned in this document are the property of their respective owners.
The content in this article is general technical information. Some information may not be applicable to the product you have purchased.
Overview
With the widespread use of networks and the emergence of new technologies, the network scale is increasingly growing, gradually elevating the complexity of deployment and maintenance. Traditional manual O&M and semi-automatic O&M methods can no longer meet user requirements, mainly reflected in the following aspects:
· Slow service provisioning. If users have new service requirements, they must go through stages such as requirement analysis, function development, testing and verification, and release to complete service provisioning. The inability to timely introduce new services might cause users to miss out on new service markets.
· When there are a large number of network devices, the workload for manual configuration is huge and prone to errors.
· The interface standards vary by device manufacturer. Typically, a manufacturer's SDN controller can only control and manage its own devices, unable to achieve end-to-end network automation deployment.
Clearly, network O&M urgently requires automation and intelligence. However, automated and intelligent O&M depend on the openness of network devices.
Comware 7 has excellent openness.
· Comware 7 uses the universal Linux operating system and offers open standard programming interfaces. Open source programs or user-written programs can run on the Comware 7 system after cross compilation. This enhances the openness of the Comware 7 system and accelerates service provisioning.
· Comware 7 has programmability, allowing administrators to operate services on devices, manage devices, and deploy services through third-party systems such as RESTful clients and NETCONF clients. For example, users can use RESTful or NETCONF to manage devices via standard Application Programmatic Interfaces (APIs). The programmable framework of Comware 7 offers various configuration methods, adaptable to different automated configuration models, enhancing network deployment efficiency. At the same time, Comware 7 provides a publicly released programming environment and interfaces, enabling administrators to utilize the programming interfaces to develop unique functions.
· Comware 7 supports visualization, which allows for monitoring device performance and network operation state through telemetry. Telemetry is a remote data collection technology for monitoring device performance and faults. It collects rich monitoring data in time, quickly locates and resolves network issues, and realizes visual network O&M. Common telemetry technologies include gRPC and INT.
This document lists and briefly introduces the key open technologies supported by Comware 7.
Open technologies
RESTful
About RESTful
Representational State Transfer (REST) is a resource-oriented lightweight, cross-platform, and cross-language program schema that features a clear structure and easy management and expansion. RESTful is an application that adheres to the REST program schema. Comware devices provide the RESTful API. Users can use the RESTful function to operate the RESTful API, thereby facilitating configuration and maintenance of Comware devices.
Operating mechanism
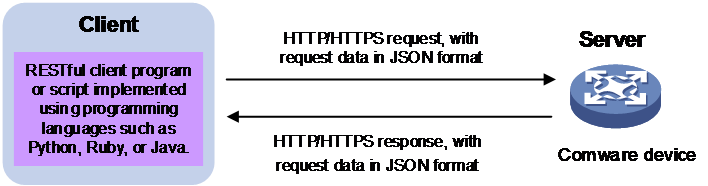
As shown in Figure 1, RESTful uses a C/S model. The RESTful client is a RESTful client program or script developed using programming languages such as Python, Ruby, or Java. The RESTful server is a network device. The process of configuring and maintaining devices through RESTful is as follows:
1. The client sends an HTTP/HTTPS request to the server to operate RESTful API using HTTP methods. The HTTP methods supported by RESTful include GET, PUT, POST, and DELETE.
2. The server complete operating the RESTful API based on the HTTP/HTTPS request. Then, it sends an HTTP/HTTPS response that contains the operation result to the client.
In the HTTP/HTTPS request and response, both the request and response data are encoded in JSON format.
Figure 1 RESTful operating mechanism
Tcl
Comware 7 provides a built-in tool command language (Tcl) interpreter. From user view, you can use the tclsh command to enter Tcl configuration view to execute the following commands:
· Tcl 8.5 commands.
· Comware commands.
The Tcl configuration view is equivalent to the user view. You can use Comware commands in Tcl configuration view in the same way they are used in user view.
Python
Python is a simple and powerful programming language that has a high-efficient high-level data structure. It provides an easy and efficient method for object-oriented programming. Its concise syntax, support for dynamic input, and interpretive nature make it an ideal script language for rapid application development across many platforms and areas.
On the Comware 7 system, you can use Python to perform the following tasks:
· Execute the python command to execute Python scripts to implement automatic device configuration.
· Enter Python shell to configure the device by using the following items:
¡ Python 2.7 commands.
¡ Python 2.7 standard API.
¡ Extended API. Extended API is Comware's extension to Python, aiming to facilitate users in system configuration.
NETCONF
About NETCONF
Network Configuration Protocol (NETCONF) is an XML-based network management protocol. It provides programmable mechanisms to manage and configure network devices. Through NETCONF, you can configure device parameters, retrieve parameter values, and collect statistics. For a network that has devices from vendors, you can develop a NETCONF-based NMS system to configure and manage devices in a simple and effective way.
NETCONF structure
NETCONF has the following layers: content layer, operations layer, RPC layer, and transport protocol layer.
Table 1 NETCONF layers and XML layers
|
NETCONF layer |
XML layer |
Description |
|
Content |
Configuration data, status data, and statistics |
Contains a set of managed objects, which can be configuration data, status data, and statistics. For information about the operable data, see the NETCONF XML API reference for the device. |
|
Operations |
<get>, <get-config>, <edit-config>… |
Defines a set of base operations invoked as RPC methods with XML-encoded parameters. NETCONF base operations include data retrieval operations, configuration operations, lock operations, and session operations. |
|
RPC |
<rpc> and <rpc-reply> |
Provides a simple, transport-independent framing mechanism for encoding RPCs. The <rpc> and <rpc-reply> elements are used to enclose NETCONF requests and responses (data at the operations layer and the content layer). |
|
Transport protocol |
In non-FIPS mode: Console, Telnet, SSH, HTTP, HTTPS, and TLS In FIPS mode: Console, SSH, HTTPS, and TLS |
Provides reliable, connection-oriented, serial data links. The following transport layer sessions are available in non-FIPS mode: · CLI sessions, including NETCONF over Telnet sessions, NETCONF over SSH sessions, and NETCONF over console sessions. · NETCONF over HTTP sessions and NETCONF over HTTPS sessions. · NETCONF over SOAP sessions, including NETCONF over SOAP over HTTP sessions and NETCONF over SOAP over HTTPS sessions. The following transport layer sessions are available in FIPS mode: · CLI sessions, including NETCONF over SSH sessions and NETCONF over console sessions. · NETCONF over HTTPS sessions. · NETCONF over SOAP over HTTPS sessions. |
Basic NETCONF architecture
Figure 2 Basic NETCONF architecture
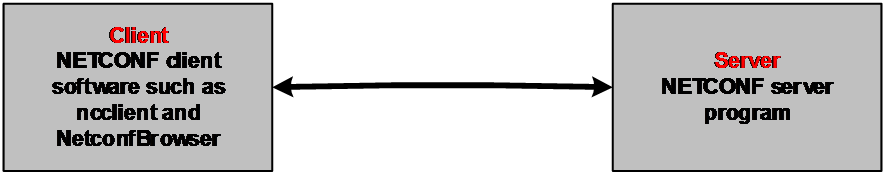
NETCONF architecture is based on the client-server model.
· The client needs to install NETCONF client software (such as ncclient and NetconfBrowser), or run scripts or programs based on SOAP requests. The main functions of the client are as follows:
¡ Manage and configure network devices through NETCONF.
¡ Actively query the state of network devices.
¡ Receive alarms and events actively transmitted by network devices to learn their current state.
· The server (the network device to be managed) needs to run the NETCONF server program, that is, support NETCONF. The server is mainly used to respond to client requests, and proactively announces to the client when a fault or event occurs.
Ansible
About Ansible
Ansible is an automation management tool developed based on Python, integrating the advantages of numerous operational tools, realizing bulk system configuration, bulk program deployment, and bulk command execution functions. This tool uses the SSH (Secure Shell) protocol to establish a connection with network devices, achieving centralized configuration management of network devices.
Network architecture
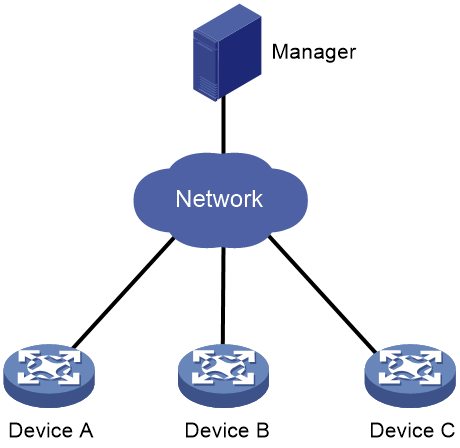
As shown in Figure 3, an Ansible system consists of the following elements:
· Manager—A host installed with the Ansible environment. For more information about the Ansible environment, see Ansible documentation.
· Managed devices—Devices to be managed. These devices do not need to install any agent software. They only need to be able to act as an SSH server. The manager communicates with managed devices through SSH to deploy configuration files.
Comware devices can act as managed devices.
Figure 3 Ansible network architecture
How Ansible works
The following the steps describe how Ansible works:
1. Edit the configuration file on the manager.
2. The manager (SSH client) initiates an SSH connection to the device (SSH server).
3. The manager deploys the configuration file to the device.
4. The device automatically executes the configuration issued by the manager.
Features
Ansible provides the following features:
· The manager establishes a connection and exchanges data with the devices based on SSH, without the need to install client software on the devices, making deployment easy.
· Based on the Python language, it is easy to learn and understand.
· Supports bulk deployment.
· In push mode, the manager deploys configuration to the devices, thus configuring and managing the device.
· Ansible focuses on simplicity and speed, making it suitable for scenarios where devices need to be quickly deployed and run.
Puppet
About Puppet
Puppet is an open-source configuration management tool. It provides the Puppet language. You can use the Puppet language to create configuration manifests and save them to a server. You can then use the server for centralized configuration enforcement and management.
Network architecture
Figure 4 Puppet network architecture
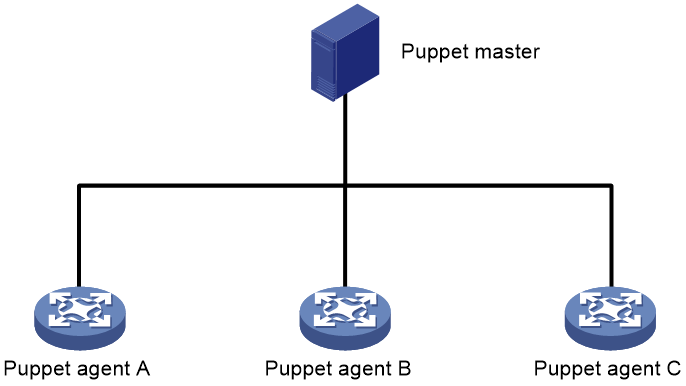
As shown in Figure 4, Puppet operates in a client/server network framework. In the framework, the Puppet master (server) stores configuration manifests for Puppet agents (clients). The Puppet agents establish SSL connections to the Puppet master to obtain their respective latest configurations.
Puppet master
The Puppet master runs the Puppet daemon process to listen to requests from Puppet agents, authenticates Puppet agents, and sends configurations to Puppet agents on demand.
For information about installing and configuring a Puppet master, access the official Puppet website at https://puppetlabs.com/.
Puppet agent
Comware devices support Puppet 3.7.3 agent. The following is the communication process between a Puppet agent and the Puppet master:
1. The Puppet agent sends an authentication request to the Puppet master.
2. The Puppet agent checks with the Puppet master for the authentication result periodically (every two minutes by default). Once the Puppet agent passes the authentication, a connection is established to the Puppet master.
3. After the connection is established, the Puppet agent sends a request to the Puppet master periodically (every 30 minutes by default) to obtain the latest configuration.
4. After obtaining the latest configuration, the Puppet agent compares the configuration with its running configuration. If a difference exists, the Puppet agent overwrites its running configuration with the newly obtained configuration.
After overwriting the running configuration, the Puppet agent sends a feedback to the Puppet master.
Features
Puppet provides the following features:
· Puppet appeared early, and it's relatively mature and stable.
· Puppet adopts a client/server network framework. The client requires installation of client software, resulting in complex deployment.
· Puppet uses the Puppet Domain Specific Language (Puppet DSL), which is difficult to learn.
· Puppet uses the pull mode to configure and manage devices. The client actively retrieves the latest configuration from the server.
· Puppet is primarily designed for system administrators.
· Puppet is applicable to heterogeneous networks.
Chef
About Chef
Chef is an open-source configuration management tool. It uses the Ruby language. You can use the Ruby language to create cookbooks and save them to a server, and then use the server for centralized configuration enforcement and management.
Network architecture
Figure 5 Chef network architecture
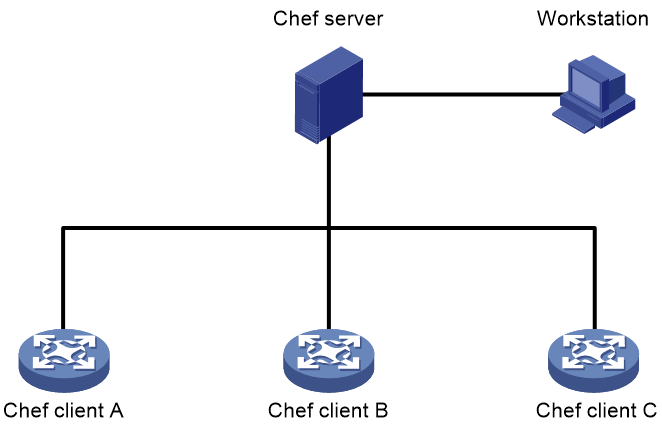
As shown in Figure 5, Chef operates in a client/server network framework. Basic Chef network components include the Chef server, Chef clients, and workstations.
Chef server
The Chef server is used to centrally manage Chef clients. It has the following functions:
· Creates and deploys cookbooks to Chef clients on demand.
· Creates .pem key files for Chef clients and workstations. Key files include the following two types:
¡ User key file—Stores user authentication information for a Chef client or a workstation. The Chef server uses this file to verify the validity of a Chef client or workstation. Before the Chef client or workstation initiates a connection to the Chef server, make sure the user key file is downloaded to the Chef client or workstation.
¡ Organization key file—Stores authentication information for an organization. For management convenience, you can classify Chef clients or workstations that have the same type of attributes into organizations. The Chef server uses organization key files to verify the validity of organizations. Before a Chef client or workstation initiates a connection to the Chef server, make sure the organization key file is downloaded to the Chef client or workstation.
For information about installing and configuring the Chef server, see the official Chef website at https://www.chef.io.
Workstation
Workstations provide the interface for you to interact with the Chef server. You can create or modify cookbooks on a workstation and then upload the cookbooks to the Chef server.
A workstation can be hosted by the same host as the Chef server. For information about installing and configuring the workstation, see the official Chef website at https://www.chef.io.
Chef client
Chef clients are network devices managed by the Chef server. Chef clients download cookbooks from the Chef server and use the settings in the cookbooks.
The device supports Chef 12.3.0 client.
Features
Chef provides the following features:
· Chef adopts a client/server network framework. The client requires installation of client software, resulting in complex deployment.
· Based on Ruby language, it is not easy to learn.
· Chef uses the pull mode to configure and manage devices. The client actively retrieves the latest configuration from the server.
· Chef is primarily designed for developers.
· Chef is applicable to heterogeneous networks.
gRPC
About gRPC
gRPC is an open source remote procedure call (RPC) system initially developed at Google. It uses HTTP 2.0 and provides network device configuration and management methods that support multiple programming languages.
Currently, the most widely used telemetry technology is gRPC-based telemetry. It is a model-driven telemetry technology that provides protobuf definition files. Third-party software can directly use gRPC to communicate with Comware, or use the H3C SDK interface encapsulated based on gRPC to communicate with Comware.
gRPC supports both Dial-in and Dial-out modes. With gRPC-based telemetry configured, a device automatically reads various statistics information (CPU, memory, and interfaces). Then, it encodes the collected data in protocol buffer code format based on the subscription requirements of the collector, and reports it to the collector through gRPC. This realizes more real-time and efficient data collection.
gRPC protocol stack
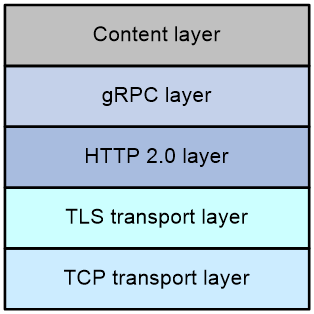
Table 2 describes the gRPC protocol stack layers from the bottom up.
Table 2 gRPC protocol stack layers
|
Layer |
Description |
|
TCP transport layer |
Provides connection-oriented reliable data links. |
|
TLS transport layer |
(Optional.) Provides channel encryption and mutual certificate authentication. |
|
HTTP 2.0 layer |
The transport protocol for gRPC. HTTP 2.0 provides enhanced features such as header field compression, multiplexing requests on a single connection, and flow control. |
|
gRPC layer |
Defines the interaction format for RPC calls. Public proto definition files such as the grpc_dialout.proto file define the public RPC methods. |
|
Content layer |
Carries encoded service data. This layer supports the following encoding formats: · Google Protocol Buffer (GPB)—A highly efficient binary encoding format. This format uses proto definition files to describe the structure of data to be serialized. GPB is more efficient in data transmission than protocols such as JavaScript Object Notation. · JavaScript Object Notation (JSON)—A lightweight data exchange format. It uses a text format that is language neutral to store and represent data, which is easy to read and compile. If service data is in JSON format, you can use the public proto files to decode the data without having to use the proto file specific to the service module. |
Network architecture
As shown in Figure 7, the gRPC network uses the client/server model. It uses HTTP 2.0 for packet transport.
Figure 7 gRPC network architecture
![]()
The gRPC network uses the following mechanism:
1. The gRPC server listens to connection requests from clients at the gRPC service port.
2. A user runs the gRPC client application to log in to the gRPC server, and uses methods provided in the .proto file to send requests.
3. The gRPC server responds to requests from the gRPC client.
H3C devices can act as gRPC servers or clients.
|
|
NOTE: The .proto files are written in the Protocol Buffers language. Protocol Buffers is a data description language developed by Google. It is used to develop custom data structures and generate code based on various languages. It simplifies serialization and data structuring, and resolves faster than the XML language. |
Telemetry modes
The device supports the following telemetry modes:
· Dial-in mode—The device acts as a gRPC server and the collectors act as gRPC clients. A collector initiates a gRPC connection to the device to subscribe to device data.
Dial-in mode supports the following operations:
¡ Get—Obtains device status and settings.
¡ CLI—Executes commands on the device.
¡ gNMI—gRPC Network Management Interface operations, which include the following subtypes of operations:
- gNMI Capabilities—Obtains the capacities of the device.
- gNMI Get—Obtains the status and settings of the device.
- gNMI Set—Deploys settings to the device.
- gNMI Subscribe—Subscribes to data push services provided by the device. The data might be generated by periodical data collection or event-triggered data collection.
· Dial-out mode—The device acts as a gRPC client and the collectors act as gRPC servers. The device initiates gRPC connections to the collectors and pushes device data to the collectors as configured.
INT
About INT
In-band Telemetry (INT) is a network monitoring technology that collects data from network devices. As shown in Figure 8, the ingress and transit nodes on the transmission path add the collected data to the packet. The egress node passes the collected data to the collector through the packet. The network management software deployed on the collector analyzes and extracts useful information from the monitoring data, aiming to monitor the network device performance and network operation.
Figure 8 INT operating mechanism
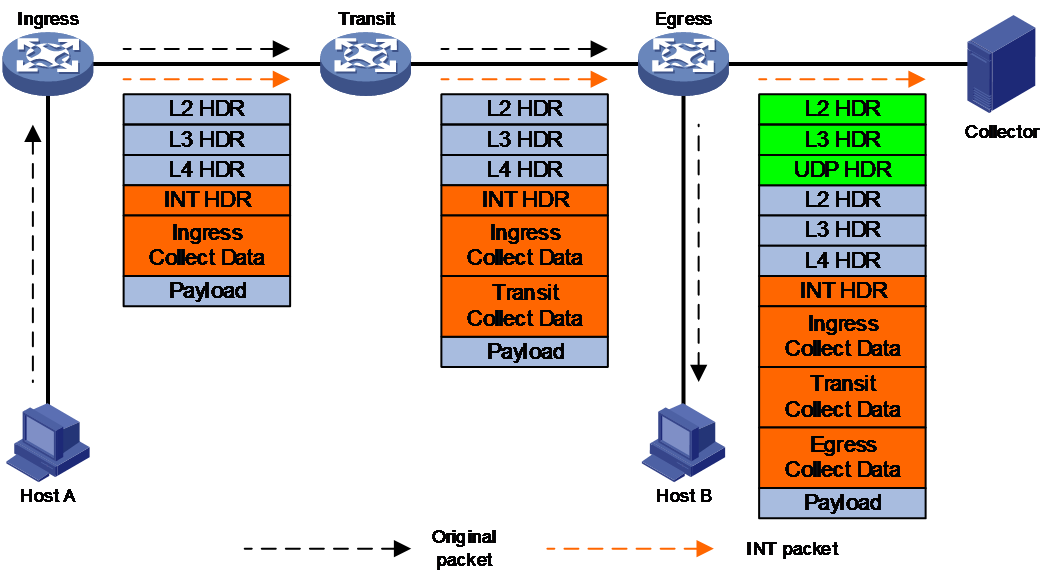
Data collected by INT
INT is mainly used to collect data plane information such as the path that packets pass through and their transmission delay. The monitoring granularity of INT is per packet, which can achieve complete real-time network state monitoring. Through INT technology, it is possible to monitor the ingress port, egress port, and queue information of each device on the packet forwarding path, the ingress timestamp and egress timestamp, and queue congestion information.
Telemetry stream
About telemetry stream
Telemetry stream is a network traffic monitoring technology based on packet sampling, mainly used for precise positioning of traffic transmission paths and transmission delay. In networks with high real-time requirements, it is necessary to accurately identify the device port that takes the longest time to forward packets. When a network device is equipped with a chip that supports telemetry stream, it can collect information about the input/output interfaces of packets and the timestamps when packets enter/exit the device, and proactively report the information to the collector. This enables network management software to monitor the transmission paths and delay of packets in the network, allowing targeted configuration deployment to optimize the network architecture and reduce network delay.
Operating mechanism
Taking Device B in Figure 9 as an example, telemetry stream works as follows:
1. All devices involved in the measurement use PTP to achieve nanosecond-level time synchronization.
2. The device samples matching packets on the input interface based on the specified sampling rate and copies the packets.
3. The device encapsulates the replicated packets with the following contents:
¡ Telemetry stream padding header (records the input and output interfaces of original packets).
¡ UDP header and Layer 2 and Layer 3 headers (record the port number and MAC/IP address of the collector).
¡ Rx timestamp.
¡ Tx timestamp.
4. The device sends the sampled packets to the collector. The Rx and Tx timestamps of the sampled packets include the information of the devices they belong to (Device IDs).
Figure 9 Telemetry stream operating mechanism
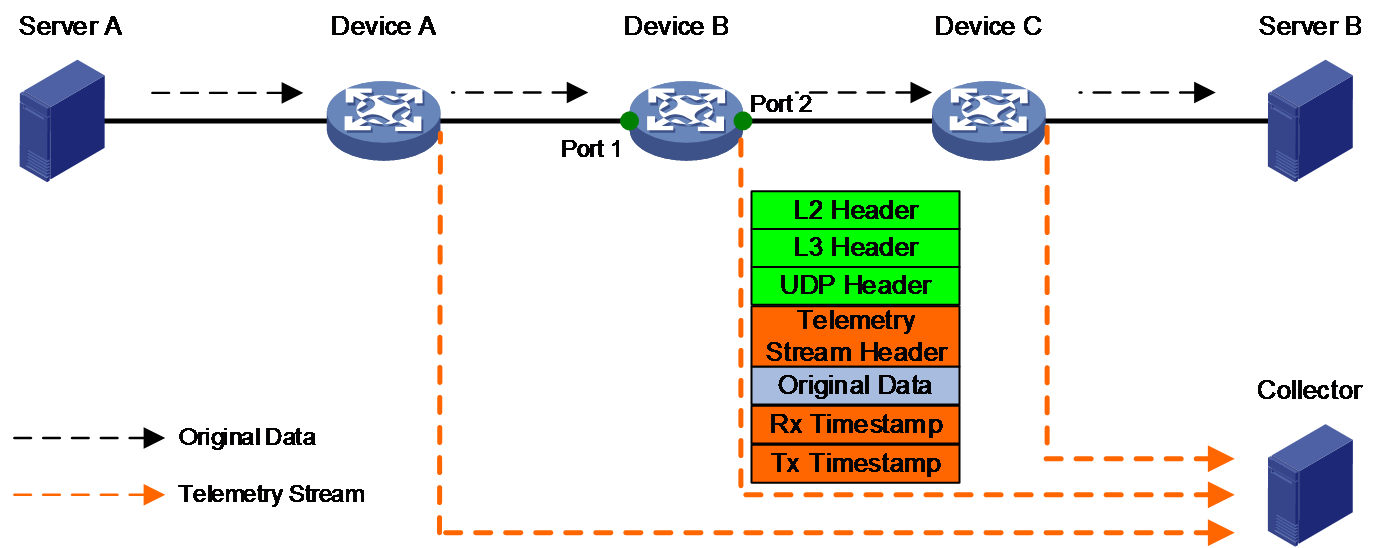
Multiple nodes each send their collected data to the collector. The collector can calculate the path and delay based on the collected information.
· Transmission delay of traffic passing through the specified device = Tx timestamp – Rx timestamp.
· Transmission delay of traffic passing through multiple devices = Tx timestamp for the device on which the output interface resides – Rx timestamp for the device on which the input interface resides.
Data that can be monitored by telemetry stream
The data that can be monitored by telemetry stream includes: device ID, traffic input interface and its timestamp, and traffic output interface and its timestamp. The device ID, specified when configuring telemetry stream, is used to uniquely identify a device on the transmission path.
ERSPAN
Encapsulated Remote Switch Port Analyzer (ERSPAN) is a Layer 3 remote port mirroring technology that copies packets passing through a port, VLAN, or CPU and routes the packets to the remote monitoring device for monitoring and troubleshooting.
Users can define the packets to be mirrored as required. For example, they can mirror TCP three-way handshake packets to monitor the state of TCP connection establishment or mirror RDMA signaling packets to monitor the state of RDMA sessions.
ERSPAN supports port mirroring and flow mirroring.
Flow groups and MOD
About flow groups and MOD
Mirror On Drop (MOD) is a technical method specifically used to monitor packet loss during the internal transmission process within a device. Once MOD detects a packet is dropped, it instantly collects the packet drop time, packet drop reason, and characteristics of the dropped packet, and reports the information to the remote collector. This allows administrators to timely understand the packet loss situation within the device.
MOD uses the flow entries generated based on a flow group to detect dropped packets. A flow group allows you to identify flows based on flow generation rules. The device extracts traffic characteristics (for example, 5-tuples in the packet header) and generates flow entries according to the header fields specified in a flow generation rule.
Operating mechanism
MOD uses the flow entries generated based on a flow group to detect dropped packets as follows:
1. The device generates flow entries based on a flow group.
2. Based on the packet drop reason list of MOD, the device monitors packet drops for packets matching the flow entries.
3. If a packet is dropped for a reason on the packet drop reason list, the device sends the packet drop reason and the characteristics of the dropped packet (flow entry matching the packet) to the collector.
Related documentation
· Comware 7 Architecture Technology White Paper
· Telemetry Technology White Paper