- Released At: 29-09-2023
- Page Views:
- Downloads:
- Related Documents
-
H3C S6805 & S6825 & S6850 & S9850 & S9820 Traffic Statistics Collection
S6805 Switch Series
S6825 Switch Series
S6850 Switch Series
S9850 Switch Series
S9820-64H Switch
S9820-8C Switch
|
Copyright © 2023 New H3C Technologies Co., Ltd. All rights reserved. No part of this manual may be reproduced or transmitted in any form or by any means without prior written consent of New H3C Technologies Co., Ltd. The information in this document is subject to change without notice. |
About traffic statistics collection
Traffic statistics collection techniques
MIB and view-based MIB access control
Telemetry technology based on gRPC
Collecting interface traffic statistics
Collecting traffic statistics for a Layer 2 Ethernet interface or a Layer 2 aggregate interface
Collecting error packet statistics for an Ethernet interface
Collecting Layer 2 aggregate interface traffic statistics
Collecting Layer 3 aggregate interface traffic statistics
Collecting Layer 3 aggregate subinterface traffic statistics
Collecting VLAN interface traffic statistics
Collecting dropped packet statistics of an interface through MQC
Collecting Ethernet interface traffic statistics through MQC
Collecting GRE packet statistics through MQC
Collecting PPPoE packet statistics through MQC
Collecting VXLAN traffic statistics
Collecting AC traffic statistics
Collecting VSI traffic statistics
Collecting VXLAN tunnel traffic statistics
Collecting VSI interface traffic statistics
Collecting AC traffic statistics through MQC
Collecting VLAN traffic statistics
Example: Obtain traffic statistics
Example: Obtain traffic statistics
Collecting VPN instance traffic statistics
Example: Obtain traffic statistics
Example: Obtain traffic statistics
Example: Obtain traffic statistics
Example: Obtain traffic statistics
Collecting queue traffic statistics
Collecting traffic statistics for interface queues
Collecting buffer traffic statistics for queues
Collecting packet drop statistics for queues
Troubleshooting the connectivity issues between devices through ICMP packet statistics
Troubleshooting IP address allocation failures through DHCP packet statistics
About traffic statistics collection
The traffic statistics collection feature classifies the incoming and outgoing traffic of a device and collects their statistics. This feature can collect traffic statistics for multiple features, for example, interface, tunnel, virtual private network (VPN), and virtual extensible local area network (VXLAN). You can use traffic statistics for data analysis, traffic accounting, and troubleshooting.
To meet the requirements of different users in different scenarios, H3C switches support the following traffic statistics collection methods:
· CLI—Command line interface, a method provided by the device for traffic statistics collection that does not require third-party functionality. For more information about CLI-based traffic statistics collection, see "CLI."
· SNMP—Simple Network Management Protocol. In this method, a network management system (NMS) collects traffic statistics of devices with different vendors, physical characteristics, and interconnection technologies on the network by using SNMP. For more information about SNMP, see "SNMP."
· NETCONF—Network Configuration Protocol. NETCONF is an extensible markup language (XML)-based network management protocol that provides a programmable method for configuring and managing network devices. You can obtain traffic statistics of devices through this protocol. For more information about NETCONF, see "NETCONF."
· gRPC—Google Remote Procedure Call. By configuring the gRPC dial-out mode on a device, you can enable the device to periodically push statistics to the collectors. For more information about gRPC, see "gRPC."
Configuring traffic statistics collection on a device will impact device forwarding performance. For example, when modular quality of service (QoS) configuration (MQC) is used to collect traffic statistics, the more interfaces that use MQC for traffic statistics collection, the lower the device forwarding performance. Use this feature as appropriate in necessary scenarios.
Traffic statistics collection techniques
CLI
You can collect traffic statistics at the CLI in the following methods:
· Execute the display interface/display ip interface/display ipv6 interface command to directly display the traffic statistics of the specified interface. This method is available for the following types of interfaces:
¡ Layer 2 Ethernet interface.
¡ Layer 3 Ethernet interface/subinterface.
¡ Layer 2 aggregate interface.
¡ Layer 3 aggregate interface/subinterface.
¡ VLAN interface.
¡ Breakout interface.
· First enable Layer 3 traffic statistics collection on the specified interface, and then execute the display interface command to display traffic statistics of the interface. This method is available for Layer 2 Ethernet interfaces and Layer 3 Ethernet interfaces.
· Configure the specified function first, and then enable the traffic statistics collection feature at the specified locations. For example, read the traffic statistics of attachment circuit (AC) or virtual switching instance (VSI) interfaces.
· Obtain traffic statistics at a specific location through MQC. MQC defines actions to take on different types of traffic through QoS policies, and applies these policies to different destinations (for example, interfaces and VLANs) to collect traffic statistics. Compared with other CLI-based traffic statistics collection methods, MQC can collect statistics for more types of traffic. For example, you can configure traffic classes to match packets through various criteria, such as 802.1p priority in inner VLAN tag, DSCP, and ACL. The statistics include forwarded and dropped packets in packets or bytes, and packets dropped by filter actions or committed access rate (CAR) in packets or bytes.
The statistics that can be collected might vary by statistics collection method. For example, the display interface/display ip interface/display ipv6 interface commands only support collecting traffic statistics of interfaces and do not support collecting traffic statistics of VLANs or VPNs. MQC supports collecting traffic statistics of not only interfaces (except VLAN interfaces) but also VXLANs, VPNs, and VLANs.
SNMP
About SNMP
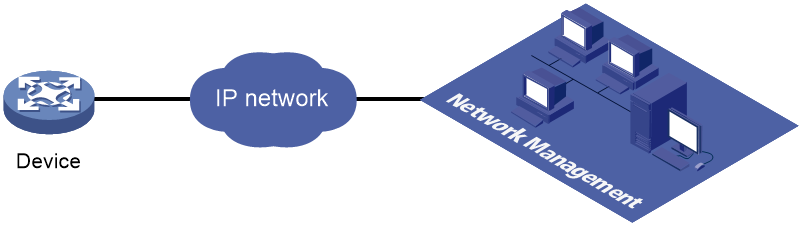
Simple Network Management Protocol (SNMP) is used for a management station to manage and collect traffic statistics for devices on a network, regardless of their vendors, physical characteristics, and interconnect technologies.
You can collect traffic statistics for H3C devices with SNMP get operations.
SNMP framework
The SNMP framework contains the following elements:
· SNMP manager—Works on an NMS to monitor and manage the SNMP-capable devices in the network. It can get and set values of MIB objects on the agent.
· SNMP agent—Works on a managed device to receive and handle requests from the NMS, and sends notifications to the NMS when events, such as an interface state change, occur.
· Management Information Base (MIB)—Specifies the variables (for example, interface status and CPU usage) maintained by the SNMP agent for the SNMP manager to read and set.
Figure 1 Relationship between NMS, agent, and MIB

MIB and view-based MIB access control
A MIB stores variables called "nodes" or "objects" in a tree hierarchy and identifies each node with a unique OID. An OID is a dotted numeric string that uniquely identifies the path from the root node to a leaf node. For example, object B in Figure 2 is uniquely identified by the OID {1.2.1.1}.

A MIB view represents a set of MIB objects (or MIB object hierarchies) with certain access privileges and is identified by a view name. The MIB objects included in the MIB view are accessible while those excluded from the MIB view are inaccessible.
A MIB view can have multiple view records each identified by a view-name oid-tree pair.
You control access to the MIB by assigning MIB views to SNMP groups or communities.
Protocol versions
SNMPv1, SNMPv2c, and SNMPv3 are supported in non-FIPS mode. Only SNMPv3 is supported in FIPS mode. An NMS and an SNMP agent must use the same SNMP version to communicate with each other.
· SNMPv1—Uses community names for authentication. To access an SNMP agent, an NMS must use the same community name as set on the SNMP agent. If the community name used by the NMS differs from the community name set on the agent, the NMS cannot establish an SNMP session to access the agent or receive traps from the agent.
· SNMPv2c—Uses community names for authentication. SNMPv2c is compatible with SNMPv1, but supports more operation types, data types, and error codes.
· SNMPv3—Uses a user-based security model (USM) to secure SNMP communication. You can configure authentication and privacy mechanisms to authenticate and encrypt SNMP packets for integrity, authenticity, and confidentiality.
Access control modes
SNMP uses the following modes to control access to MIB objects:
· View-based Access Control Model—VACM mode controls access to MIB objects by assigning MIB views to SNMP communities or users.
· Role based access control—RBAC mode controls access to MIB objects by assigning user roles to SNMP communities or users.
¡ SNMP communities or users with the network-admin, mdc-admin, or level-15 predefined user role have read and write access to all MIB objects.
¡ SNMP communities or users with the network-operator or mdc-operator predefined user role have read-only access to all MIB objects.
¡ SNMP communities or users with a user-defined user role have access rights to MIB objects as specified by the rule command.
RBAC mode controls access on a per MIB object basis, and VACM mode controls access on a MIB view basis. As a best practice to enhance MIB security, use the RBAC mode.
If you create the same SNMP community or user with both modes multiple times, the most recent configuration takes effect.
NETCONF
About NETCONF
Network Configuration Protocol (NETCONF) is an XML-based network management protocol. It provides a programmable mechanism to manage and configure network devices. Network administrators can use NETCONF to configure network devices and retrieve their configuration and operational data. On a network that has devices from different vendors, you can develop a NETCONF-based management system to configure and manage devices in a simple and effective way.
NETCONF protocol stack
The NETCONF protocol stack contains a content layer, operations layer, remote procedure call (RPC) layer, and transport protocol layer.
Table 1 NETCONF layer and XML layer mappings
|
NETCONF layer |
XML layer |
Description |
|
Content layer |
Configuration data, operational state data, and statistics |
Contains a set of managed objects, which can be configuration data, operational state data, and statistics. For information about permission of access to the data nodes, see the NETCONF XML API references for the device. |
|
Operations |
<get>, <get-config>… |
Defines a set of base operations invoked as RPC methods with XML-encoded parameters. NETCONF comprehensively defines various traffic statistics operations for managed devices. |
|
RPC |
<rpc> and <rpc-reply> |
Provides a simple, transport-independent framing mechanism for encoding RPCs. The <rpc> and <rpc-reply> elements are used to enclose NETCONF requests and responses (data at the operations layer and the content layer). |
|
Transport protocol |
In non-FIPS mode: Console, Telnet, SSH, HTTP, HTTPS, and TLS In FIPS mode: Console, SSH, HTTPS, and TLS |
Provides reliable, connection-oriented, serial data links. The following transport layer sessions are supported in non-FIPS mode: · CLI sessions, including NETCONF over Telnet, NETCONF over SSH, and NETCONF over console sessions. · NETCONF over SOAP sessions, including NETCONF over SOAP over HTTP and NETCONF over SOAP over HTTPS sessions. The following transport layer sessions are supported in FIPS mode: · CLI sessions, including NETCONF over SSH and NETCONF over console sessions. · NETCONF over SOAP over HTTPS sessions. |
NETCONF message formats
NETCONF
All NETCONF messages are XML-encoded and comply with the formats defined in RFC 4741. Any incoming NETCONF messages must pass XML Schema check before it can be processed. If a NETCONF message fails XML Schema check, the device sends an error message to the client.
For information about the NETCONF operations supported by the device and the operable data, see the NETCONF XML API references for the device.
The following example shows a NETCONF request that retrieves all data from all interfaces on the target device:
<?xml version="1.0" encoding="utf-8"?>
<rpc message-id="100" xmlns="urn:ietf:params:xml:ns:netconf:base:1.0">
<get-bulk>
<filter type="subtree">
<top xmlns="http://www.h3c.com/netconf/data:1.0">
<Ifmgr>
<Interfaces>
<Interface/>
</Interfaces>
</Ifmgr>
</top>
</filter>
</get-bulk>
</rpc>
NETCONF over SOAP
· The SOAP messages must be XML encoded.
· SOAP messages must use the SOAP Envelope namespaces and SOAP Encoding namespaces.
· The SOAP messages cannot contain the following information:
¡ DTD references.
¡ XML processing instructions.
The following example shows a NETCONF over SOAP message for getting all parameters of all interfaces on the target device:
<env:Envelope xmlns:env="http://www.w3.org/2003/05/soap-envelope">
<env:Header>
<auth:Authentication env:mustUnderstand="1" xmlns:auth="http://www.h3c.com/netconf/base:1.0">
<auth:AuthInfo>800207F0120020C</auth:AuthInfo>
</auth:Authentication>
</env:Header>
<env:Body>
<rpc message-id="100" xmlns="urn:ietf:params:xml:ns:netconf:base:1.0">
<get-bulk>
<filter type="subtree">
<top xmlns="http://www.h3c.com/netconf/data:1.0">
<Ifmgr>
<Interfaces>
<Interface/>
</Interfaces>
</Ifmgr>
</top>
</filter>
</get-bulk>
</rpc>
</env:Body>
</env:Envelope>
NETCONF connection methods
The switch series supports different NETCONF connection methods in non-FIPS mode and FIPS mode.
· In non-FIPS mode:
¡ NETCONF over SSH.
¡ NETCONF over Telnet.
¡ NETCONF over console.
¡ NETCONF over SOAP over HTTP.
¡ NETCONF over SOAP over HTTPS.
· In FIPS mode:
¡ NETCONF over SSH.
¡ NETCONF over console.
¡ NETCONF over SOAP over HTTPS.
Select a connection method depending on the configuration method, as shown in Table 2.
Table 2 Configuration methods and NETCONF connection methods matrix
|
Configuration method |
Login method |
NETCONF connection method |
|
CLI in XML view |
Telnet |
NETCONF over Telnet |
|
Console port |
NETCONF over console
The console port has rate limiting, and the device does not generate prompts or warning in XML view. As a best practice to avoid configuration errors, do not use this method. |
|
|
SSH |
NETCONF over SSH |
|
|
SSH-based configuration tool |
SSH |
NETCONF over SSH |
|
SOAP-based configuration tool |
HTTP or HTTPS |
NETCONF over SOAP over HTTP/HTTPS |
|
|
NOTE: This document only introduces the NETCONF over SOAP method. For information about other methods, see H3C NETCONF-Based Device Configuration and Management Guide. |
gRPC
About gRPC
gRPC is an open source remote procedure call (RPC) system initially developed at Google. It uses HTTP 2.0 and provides methods neutral to programming languages for network device configuration and management. The server and client developers can develop server-side and client-side custom capabilities in the gRPC framework.
gRPC protocol stack layers
Table 3 shows the gRPC protocol stack.
Table 3 gRPC protocol stack layers
|
Layer |
Description |
|
Content layer |
Defines the data of the service module. Two parties of communication must notify each other of the data models that they are using. |
|
Protocol buffer encoding layer |
gRPC encodes data by using the protocol buffer code format. |
|
gRPC layer |
Defines the protocol interaction format for remote procedure calls. |
|
HTTP 2.0 layer |
Carries gRPC. |
|
TCP layer |
TCP provides connection-oriented, reliable, and sequential data links. |
gRPC network architecture
As shown in Figure 3, a gRPC network uses the client/server model and transports messages between the client and the server over HTTP 2.0.
Figure 3 gRPC network architecture
![]()
The gRPC network uses the following mechanism:
1. The gRPC server listens to connection requests from clients at the gRPC service port.
2. A user or system runs a gRPC client application to connect to the gRPC server.
3. The gRPC client calls methods provided in the .proto file to send requests.
4. The gRPC server responds to the requests from the gRPC client.
H3C devices can act as gRPC servers or clients.
Telemetry technology based on gRPC
As shown in Figure 4, after a gRPC connection is established between the device and NMSs, the NMSs can subscribe to data of modules on the device.
Figure 4 Telemetry technology based on gRPC
Telemetry modes
The device supports the following telemetry modes:
· Dial-in mode—The device acts as a gRPC server and the collectors act as gRPC clients. A collector initiates a gRPC connection to the device to subscribe to device data.
Dial-in mode typically applies to small networks and scenarios where collectors deploy configurations to devices.
· Dial-out mode—The device acts as a gRPC client and the collectors act as gRPC servers. The device initiates gRPC connections to the collectors and pushes device data to the collectors as configured.
Dial-out mode typically applies to large networks where the collectors must collect data from a large number of devices.
H3C devices implement traffic statistics collection in dial-out mode.
Protocol buffer code format
Google Protocol Buffers provide a flexible mechanism for serializing structured data. Different from XML code and JSON code, the protocol buffer code is binary and provides higher performance.
Proto definition files
You can define data structures in a proto definition file. Then, you can compile the file with utility protoc to generate code in a programing language such as Java and C++. Using the generated code, you can develop an application for a collector to communicate with the device.
H3C provides proto definition files for both dial-in mode and dial-out mode.
Proto definition files in dial-in mode
· Public proto definition files.
The dial-in mode supports the grpc_service.proto public proto definition file, which defines the public RPC methods in dial-in mode (for example, login and logout).
· Proto definition files for service modules.
The dial-in mode supports proto definition files for the following service modules: Device, Ifmgr, IPFW, LLDP, and Syslog.
Proto definition file in dial-out mode
The grpc_dialout.proto file defines the public RPC methods in dial-out mode.
Obtaining proto definition files
To obtain proto files, contact H3C Support.
Collecting interface traffic statistics
Collecting traffic statistics for a Layer 2 Ethernet interface or a Layer 2 aggregate interface
|
|
IMPORTANT: · Ethernet interfaces in this section include fixed interfaces and the 25-GE or 10-GE breakout interfaces split from 100-GE or 400-GE interfaces. · For S6850, S6825, and S9820-8C, traffic statistics collection for breakout interfaces is not supported. · The traffic statistics collection procedure for Layer 2 Ethernet interfaces is the same as that for Layer 2 aggregate interfaces. The following uses Layer 2 Ethernet interfaces as an example. |
CLI
Task
Obtain the traffic statistics for interface HundredGigE 2/0/25.
Restrictions and guidelines
· You can use the display interface command to obtain the traffic statistics for Layer 2 Ethernet interfaces.
· For Layer 2 aggregate interfaces, the statistics is not differentiated between IPv4 and IPv6 packets.
· Layer 2 Ethernet interfaces support enabling Layer 3 traffic statistics collection. After Layer 3 traffic statistics collection is enabled, you can use the display interface command to view the IPv4 and IPv6 traffic statistics for an interface.
· You cannot use the display ip interface and display ipv6 interface commands to view the traffic statistics for an interface.
· To collect traffic statistics for an interface within a certain period of time, use the reset counters interface command in user view to clear the interface statistics and start a new statistics collection task.
· The reset counters interface command can clear the interface statistics collected at the CLI, but cannot clear the interface statistics on MIB.
Procedure
# (Optional.) Enable Layer 3 traffic statistics collection for HundredGigE 2/0/25.
<H3C> sys-view
[H3C] interface hundredgige 2/0/25
[H3C-HundredGigE2/0/25] statistics l3-packet enable inbound
[H3C-HundredGigE2/0/25] statistics l3-packet enable outbound
Example: Obtain traffic statistics
· If Layer 3 traffic statistics collection is not enabled, use the display interface command to perform traffic statistics collection.
# Obtain the traffic statistics for interface HundredGigE 2/0/25.
[H3C]display interface HundredGigE 2/0/25
HundredGigE2/0/25
........
Peak input rate: 0 bytes/sec, at 2022-04-07 16:07:11
Peak output rate: 0 bytes/sec, at 2022-04-07 16:07:11
Last 300 seconds input: 0 packets/sec 0 bytes/sec 0%
Last 300 seconds output: 0 packets/sec 0 bytes/sec 0%
Input (total): 612 packets, 77760 bytes
606 unicasts, 1 broadcasts, 5 multicasts, 0 pauses
Input (normal): 612 packets, - bytes
606 unicasts, 1 broadcasts, 5 multicasts, 0 pauses
Input: 0 input errors, 0 runts, 0 giants, 0 throttles
0 CRC, 0 frame, - overruns, 0 aborts
- ignored, - parity errors
Output (total): 614 packets, 77888 bytes
607 unicasts, 3 broadcasts, 4 multicasts, 0 pauses
Output (normal): 614 packets, - bytes
607 unicasts, 3 broadcasts, 4 multicasts, 0 pauses
Output: 0 output errors, - underruns, 0 buffer failures
0 aborts, 0 deferred, 0 collisions, 0 late collisions
0 lost carrier, - no carrier
|
Field |
Description |
|
HundredGigE2/0/25 |
Obtain the traffic statistics for interface HundredGigE 2/0/25 |
|
Peak input rate |
Peak rate of inbound traffic in Bps, and the time when the peak inbound traffic rate occurred. |
|
Peak output rate |
Peak rate of outbound traffic in Bps, and the time when the peak outbound traffic rate occurred. |
|
Last interval seconds input: 0 packets/sec 0 bytes/sec 0% Last interval seconds output: 0 packets/sec 0 bytes/sec 0% |
Average inbound or outbound traffic rate (in pps and Bps) in the last statistics polling interval, and the ratio of the actual rate to the interface bandwidth. To set the statistics polling interval (interval), use the flow-interval command. A hyphen (-) indicates that the statistical item is not supported. |
|
Input(total): 0 packets, 0 bytes 0 unicasts, 0 broadcasts, 0 multicasts, 0 pauses |
The two fields on the first line represent the inbound traffic statistics (in packets and bytes) for the interface. All inbound normal packets, abnormal packets, and normal pause frames were counted. · The four fields on the second line represent: · Number of inbound unicast packets. · Number of inbound broadcasts. · Number of inbound multicasts. · Number of inbound pause frames. A hyphen (-) indicates that the statistical item is not supported. |
|
Input(normal): 0 packets, 0 bytes 0 unicasts, 0 broadcasts, 0 multicasts, 0 pauses |
The two fields on the first line represent the inbound normal traffic and pause frame statistics (in packets and bytes) for the interface. The four fields on the second line represent: · Number of inbound normal unicast packets. · Number of inbound normal broadcasts. · Number of inbound normal multicasts. · Number of inbound normal pause frames. A hyphen (-) indicates that the statistical item is not supported. |
|
input errors |
Statistics for incoming error packets. |
|
runts |
Number of inbound frames meeting the following conditions: · Shorter than 64 bytes. · In correct format. · Containing valid CRCs. |
|
giants |
Number of inbound giants. Giants refer to frames larger than the maximum frame length supported on the interface. · For an Ethernet interface that does not permit jumbo frames, the maximum frame length is as follows: ¡ 1518 bytes (without VLAN tags). ¡ 1522 bytes (with VLAN tags). · For an Ethernet interface that permits jumbo frames, the maximum Ethernet frame length is set when you configure jumbo frame support on the interface. |
|
throttles |
Number of inbound frames that had a non-integer number of bytes. |
|
CRC |
Total number of inbound frames that had a normal length, but contained CRC errors. |
|
frame |
Total number of inbound frames that contained CRC errors and a non-integer number of bytes. |
|
overruns |
Number of packets dropped because the input rate of the port exceeded the queuing capability. |
|
aborts |
Total number of illegal inbound packets: · Fragment frames—CRC error frames shorter than 64 bytes. The length (in bytes) can be an integral or non-integral value. · Jabber frames—CRC error frames greater than the maximum frame length supported on the Ethernet interface (with an integral or non-integral length). For an Ethernet interface that does not permit jumbo frames, the maximum frame length is 1518 bytes (without VLAN tags) or 1522 bytes (with VLAN tags). For an Ethernet interface that permits jumbo frames, the maximum Ethernet frame length is set when you configure jumbo frame support on the interface. · Symbol error frames—Frames that contained a minimum of one undefined symbol. · Unknown operation code frames—Non-pause MAC control frames. · Length error frames—Frames whose 802.3 length fields did not match the actual frame length (46 to 1500 bytes). |
|
ignored |
Number of inbound frames dropped because the receiving buffer of the port ran low. |
|
parity errors |
Total number of frames with parity errors. |
|
Output(total): 0 packets, 0 bytes 0 unicasts, 0 broadcasts, 0 multicasts, 0 pauses |
The two fields on the first line represent the outbound traffic statistics (in packets and bytes) for the interface. All outbound normal packets, abnormal packets, and normal pause frames were counted. The four fields on the second line represent: · Number of outbound unicast packets. · Number of outbound broadcasts. · Number of outbound multicasts. · Number of outbound pause frames. A hyphen (-) indicates that the statistical item is not supported. |
|
Output(normal): 0 packets, 0 bytes 0 unicasts, 0 broadcasts, 0 multicasts, 0 pauses |
The two fields on the first line represent the outbound normal traffic and pause frame statistics (in packets and bytes) for the interface. The four fields on the second line represent: · Number of outbound normal unicast packets. · Number of outbound normal broadcasts. · Number of outbound normal multicasts. · Number of outbound normal pause frames. A hyphen (-) indicates that the statistical item is not supported. |
|
output errors |
Number of outbound packets with errors. |
|
underruns |
Number of packets dropped because the output rate of the interface exceeded the output queuing capability. This is a low-probability hardware anomaly. |
|
buffer failures |
Number of packets dropped because the transmitting buffer of the interface ran low. |
|
aborts |
Number of packets that failed to be transmitted, for example, because of Ethernet collisions. |
|
deferred |
Number of frames that the interface deferred to transmit because of detected collisions. |
|
collisions |
Number of frames that the interface stopped transmitting because Ethernet collisions were detected during transmission. |
|
late collisions |
Number of frames that the interface deferred to transmit after transmitting their first 512 bits because of detected collisions. |
|
lost carrier |
Number of carrier losses during transmission. This counter increases by one when a carrier is lost, and applies to serial WAN interfaces. |
|
no carrier |
Number of times that the port failed to detect the carrier when attempting to send frames. This counter increases by one when a port failed to detect the carrier, and applies to serial WAN interfaces. |
· After Layer 3 traffic statistics collection is enabled, use the display interface to perform traffic statistics.
# Obtain the traffic statistics for interface HundredGigE 2/0/25.
[H3C]display interface HundredGigE 2/0/25
HundredGigE2/0/25
........
Peak input rate: 0 bytes/sec, at 2022-04-07 16:07:11
Peak output rate: 0 bytes/sec, at 2022-04-07 16:07:11
Last 300 seconds input: 0 packets/sec 0 bytes/sec 0%
Last 300 seconds output: 0 packets/sec 0 bytes/sec 0%
Input (total): 612 packets, 77760 bytes
606 unicasts, 1 broadcasts, 5 multicasts, 0 pauses
Input (normal): 612 packets, - bytes
606 unicasts, 1 broadcasts, 5 multicasts, 0 pauses
Input: 0 input errors, 0 runts, 0 giants, 0 throttles
0 CRC, 0 frame, - overruns, 0 aborts
- ignored, - parity errors
Output (total): 614 packets, 77888 bytes
607 unicasts, 3 broadcasts, 4 multicasts, 0 pauses
Output (normal): 614 packets, - bytes
607 unicasts, 3 broadcasts, 4 multicasts, 0 pauses
Output: 0 output errors, - underruns, 0 buffer failures
0 aborts, 0 deferred, 0 collisions, 0 late collisions
0 lost carrier, - no carrier
IPv4 traffic statistics:
Last 300 seconds input rate: 0 packets/sec, 0 bytes/sec
Last 300 seconds output rate: 0 packets/sec, 0 bytes/sec
Input: 300 packets, 38400 bytes
Output: 300 packets, 38400 bytes
IPv6 traffic statistics:
Last 300 seconds input rate: 0 packets/sec, 0 bytes/sec
Last 300 seconds output rate: 0 packets/sec, 0 bytes/sec
Input: 300 packets, 38400 bytes
Output: 300 packets, 38400 bytes
Table 5 Command output
|
Field |
Description |
|
HundredGigE2/0/25 |
Obtain the traffic statistics for interface HundredGigE 2/0/25 |
|
Peak input rate |
Peak rate of inbound traffic in Bps, and the time when the peak inbound traffic rate occurred. |
|
Peak output rate |
Peak rate of outbound traffic in Bps, and the time when the peak outbound traffic rate occurred. |
|
Last interval seconds input: 0 packets/sec 0 bytes/sec 0% Last interval seconds output: 0 packets/sec 0 bytes/sec 0% |
Average inbound or outbound traffic rate (in pps and Bps) in the last statistics polling interval, and the ratio of the actual rate to the interface bandwidth. To set the statistics polling interval (interval), use the flow-interval command. A hyphen (-) indicates that the statistical item is not supported. |
|
Input(total): 0 packets, 0 bytes 0 unicasts, 0 broadcasts, 0 multicasts, 0 pauses |
The two fields on the first line represent the inbound traffic statistics (in packets and bytes) for the interface. All inbound normal packets, abnormal packets, and normal pause frames were counted. The four fields on the second line represent: · Number of inbound unicast packets. · Number of inbound broadcasts. · Number of inbound multicasts. · Number of inbound pause frames. A hyphen (-) indicates that the statistical item is not supported. |
|
Input(normal): 0 packets, 0 bytes 0 unicasts, 0 broadcasts, 0 multicasts, 0 pauses |
The two fields on the first line represent the inbound normal traffic and pause frame statistics (in packets and bytes) for the interface. The four fields on the second line represent: · Number of inbound normal unicast packets. · Number of inbound normal broadcasts. · Number of inbound normal multicasts. · Number of inbound normal pause frames. A hyphen (-) indicates that the statistical item is not supported. |
|
input errors |
Statistics for incoming error packets. |
|
runts |
Number of inbound frames meeting the following conditions: · Shorter than 64 bytes. · In correct format. · Containing valid CRCs. |
|
giants |
Number of inbound giants. Giants refer to frames larger than the maximum frame length supported on the interface. · For an Ethernet interface that does not permit jumbo frames, the maximum frame length is as follows: ¡ 1518 bytes (without VLAN tags). ¡ 1522 bytes (with VLAN tags). · For an Ethernet interface that permits jumbo frames, the maximum Ethernet frame length is set when you configure jumbo frame support on the interface. |
|
throttles |
Number of inbound frames that had a non-integer number of bytes. |
|
CRC |
Total number of inbound frames that had a normal length, but contained CRC errors. |
|
frame |
Total number of inbound frames that contained CRC errors and a non-integer number of bytes. |
|
overruns |
Number of packets dropped because the input rate of the port exceeded the queuing capability. |
|
aborts |
Total number of illegal inbound packets: · Fragment frames—CRC error frames shorter than 64 bytes. The length (in bytes) can be an integral or non-integral value. · Jabber frames—CRC error frames greater than the maximum frame length supported on the Ethernet interface (with an integral or non-integral length). For an Ethernet interface that does not permit jumbo frames, the maximum frame length is 1518 bytes (without VLAN tags) or 1522 bytes (with VLAN tags). For an Ethernet interface that permits jumbo frames, the maximum Ethernet frame length is set when you configure jumbo frame support on the interface. · Symbol error frames—Frames that contained a minimum of one undefined symbol. · Unknown operation code frames—Non-pause MAC control frames. · Length error frames—Frames whose 802.3 length fields did not match the actual frame length (46 to 1500 bytes). |
|
ignored |
Number of inbound frames dropped because the receiving buffer of the port ran low. |
|
parity errors |
Total number of frames with parity errors. |
|
Output(total): 0 packets, 0 bytes 0 unicasts, 0 broadcasts, 0 multicasts, 0 pauses |
The two fields on the first line represent the outbound traffic statistics (in packets and bytes) for the interface. All outbound normal packets, abnormal packets, and normal pause frames were counted. The four fields on the second line represent: · Number of outbound unicast packets. · Number of outbound broadcasts. · Number of outbound multicasts. · Number of outbound pause frames. A hyphen (-) indicates that the statistical item is not supported. |
|
Output(normal): 0 packets, 0 bytes 0 unicasts, 0 broadcasts, 0 multicasts, 0 pauses |
The two fields on the first line represent the outbound normal traffic and pause frame statistics (in packets and bytes) for the interface. The four fields on the second line represent: · Number of outbound normal unicast packets. · Number of outbound normal broadcasts. · Number of outbound normal multicasts. · Number of outbound normal pause frames. A hyphen (-) indicates that the statistical item is not supported. |
|
output errors |
Number of outbound packets with errors. |
|
underruns |
Number of packets dropped because the output rate of the interface exceeded the output queuing capability. This is a low-probability hardware anomaly. |
|
buffer failures |
Number of inbound frames dropped because the receiving buffer of the port ran low. |
|
aborts |
Number of packets that failed to be transmitted, for example, because of Ethernet collisions. |
|
deferred |
Number of frames that the interface deferred to transmit because of detected collisions. |
|
collisions |
Number of frames that the interface stopped transmitting because Ethernet collisions were detected during transmission. |
|
late collisions |
Number of frames that the interface deferred to transmit after transmitting their first 512 bits because of detected collisions. |
|
lost carrier |
Number of carrier losses during transmission. This counter increases by one when a carrier is lost, and applies to serial WAN interfaces. |
|
no carrier |
Number of times that the port failed to detect the carrier when attempting to send frames. This counter increases by one when a port failed to detect the carrier, and applies to serial WAN interfaces. |
|
Peak input rate |
Peak rate of inbound traffic in Bps, and the time when the peak inbound traffic rate occurred. |
|
Peak output rate |
Peak rate of outbound traffic in Bps, and the time when the peak outbound traffic rate occurred. |
|
IPv4 traffic statistics |
IPv4 packet statistics. |
|
IPv6 traffic statistics |
IPv6 packet statistics. |
|
Last 300 seconds input rate: 0 packets/sec, 0 bytes/sec |
Average inbound traffic rate (in pps and Bps) in the last 300 seconds. A hyphen (-) indicates that the statistical item is not supported. |
|
Last 300 seconds output rate: 0 packets/sec, 0 bytes/sec |
Average outbound traffic rate (in pps and Bps) in the last 300 seconds. A hyphen (-) indicates that the statistical item is not supported. |
|
Input: 0 packets, 0 bytes |
Inbound traffic statistics (in packets and bytes) for the interface. A hyphen (-) indicates that the statistical item is not supported. |
|
Output: 0 packets, 0 bytes |
Outbound traffic statistics (in packets and bytes) for the interface. A hyphen (-) indicates that the statistical item is not supported. |
SNMP
Task
Use an NMS to obtain the inbound traffic statistics for Layer 2 Ethernet interface HGE 2/0/25 on the device (agent) through SNMP.
Figure 5 Network diagram for SNMP

Restrictions and guidelines
· For Layer 2 Ethernet interfaces, traffic statistics can be obtained using the following tables:
¡ ifEntry (with OID 1.3.6.1.2.1.2.2.1)
¡ ifXEntry (with OID 1.3.6.1.2.1.31.1.1)
¡ hh3cIfFlowStatEntry (with OID 1.3.6.1.4.1.25506.2.40.2.1.2.1.1)
¡ hh3cIfHCFlowStatEntry (with OID 1.3.6.1.4.1.25506.2.40.2.1.2.3.1)
¡ hh3cifPortProtocolStatEntry (with OID 1.3.6.1.4.1.25506.8.35.5.1.13.1)
· For Layer 2 aggregate interfaces, traffic statistics can be obtained using the following tables:
¡ ifEntry (with OID 1.3.6.1.2.1.2.2.1)
¡ ifXEntry (with OID 1.3.6.1.2.1.31.1.1)
¡ hh3cifPortProtocolStatEntry (with OID 1.3.6.1.4.1.25506.8.35.5.1.13.1)
· In the ifEntry table, the data length for the interface traffic statistics collection node is 32 bits and is 64 bits in the ifXEntry table. Therefore, the interface traffic statistics collection node in the ifEntry table might overflow but that in the ifXEntry table will not when traffic statistics collection is performed. The nodes in the ifEntry table and the ifXEntry table are not exactly the same, and the two tables have an overlapping relationship. The interface traffic statistics in the ifXEntry table take precedence. If no interface traffic statistics are available in the ifXEntry table, check the ifEntry table.
· You can use the nodes in the ifEntry, ifXEntry, hh3cIfFlowStatEntry, hh3cIfHCFlowStatEntry, and hh3cifPortProtocolStatEntry tables to obtain different data. For more information about the tables, see the MIB references for your device.
Procedure
· SNMPv1 or SNMPv2c (SNMPv1/v2c community creation by community name)
# Create an SNMPv2c read-write community named readtest for the agent.
<Agent> system-view
[Agent] snmp-agent sys-info version v2c
[Agent] snmp-agent community read readtest
# Configure the system contact and location information for the device for maintenance purposes.
[Agent] snmp-agent sys-info contact Mr.Wang-Tel:3306
[Agent] snmp-agent sys-info location telephone-closet,3rd-floor
# Create an SNMPv2c read-write community named readtest for the NMS. In addition, you can set the timeout timer and maximum number of retries. For more information, see the NMS manual.
|
|
IMPORTANT: For correct communication between the NMS and agent, make sure the SNMP settings on the agent and the NMS match. The access control method depends on the NMS you are using. For more information, see the NMS manual. |
· SNMPv1 or SNMPv2c (SNMPv1/v2c community creation by creating a user and the group that the user is assigned to)
# Create SNMPv2c group readCom. Add user readtest to readCom.
<Sysname> system-view
[Sysname] snmp-agent sys-info version v2c
[Sysname] snmp-agent group v2c readCom
[Sysname] snmp-agent usm-user v2c readtest readCom
# Create an SNMPv2c read-write community named readtest for the NMS. In addition, you can set the timeout timer and maximum number of retries. For more information, see the NMS manual.
|
|
IMPORTANT: For correct communication between the NMS and agent, make sure the SNMP settings on the agent and the NMS match. The access control method depends on the NMS you are using. For more information, see the NMS manual. |
· SNMPv3 (VACM)
# Enable SNMPv3.
<Agent> system-view
[Agent] snmp-agent sys-info version v3
# Include the subtree with OID 1.3.6.1.2.1.2 in the mibtest view.
[Agent] snmp-agent mib-view included mibtest 1.3.6.1.2.1.2
# Create SNMPv3 group managev3group and assign managev3group read-only access to the objects under the node in the mibtest view.
[Agent] snmp-agent group v3 managev3group privacy read-view mibtest
# Add user managev3user to SNMPv3 group managev3group, and set the authentication algorithm to SHA-1, authentication key to 123456TESTauth&!, encryption algorithm to AES, and encryption key to 123456TESTencr&!.
[Agent] snmp-agent usm-user v3 managev3user managev3group simple authentication-mode sha 123456TESTauth&! privacy-mode aes128 123456TESTencr&!
# Configure the contact and location information for the device for maintenance purposes.
[Agent] snmp-agent sys-info contact Mr.Wang-Tel:3306
[Agent] snmp-agent sys-info location telephone-closet,3rd-floor
# Specify SNMPv3. Create SNMPv3 user VACMtest. Enable authentication and encryption. Set the authentication algorithm to SHA-1, authentication key to 123456TESTauth&!, encryption algorithm to AES, and encryption key to 123456TESTencr&!. Set the timeout timer and maximum number of retries. In addition, you can set the timeout timer and maximum number of retries. For more information, see the NMS manual.
|
|
IMPORTANT: For correct communication between the NMS and agent, make sure the SNMP settings on the agent and the NMS match. The access control method depends on the NMS you are using. For more information, see the NMS manual. |
· SNMP (RBAC)
# Enable SNMPv3.
<Agent> system-view
[Agent] snmp-agent sys-info version v3
# Include the subtree with OID 1.3.6.1 in the mibtest view.
[Agent] role name test
[Agent-role-test] rule 1 permit read oid 1.3.6.1
[Agent-role-test] quit
# Add user RBACtest to SNMPv3 group managev3group and assign the user role test to it. Set the authentication algorithm to SHA-1, authentication key to 123456TESTauth&!, encryption algorithm to AES, and encryption key to 123456TESTencr&!.
[Agent] snmp-agent usm-user v3 RBACtest user-role test simple authentication-mode sha 123456TESTauth&! privacy-mode aes128 123456TESTencr&!
# Configure the contact and location information for the device for maintenance purposes.
[Agent] snmp-agent sys-info contact Mr.Wang-Tel:3306
[Agent] snmp-agent sys-info location telephone-closet,3rd-floor
# Specify SNMPv3. Create SNMPv3 user RBACtest. Enable authentication and encryption. Set the authentication algorithm to SHA-1, authentication key to 123456TESTauth&!, encryption algorithm to AES, and encryption key to 123456TESTencr&!. Set the timeout timer and maximum number of retries. In addition, you can set the timeout timer and maximum number of retries. For more information, see the NMS manual.
|
|
IMPORTANT: For correct communication between the NMS and agent, make sure the SNMP settings on the agent and the NMS match. The access control method depends on the NMS you are using. For more information, see the NMS manual. |
Example: Obtain traffic statistics
|
|
IMPORTANT: · To obtain traffic statistics for an interface, you must first obtain the index of the interface and then use the index to obtain traffic statistics for the interface. · The interface index might vary by the ID of the IRF member device hosting the interface. · This example obtains the inbound traffic statistics for interface HundredGigE 2/0/25 through the MIB browser. |
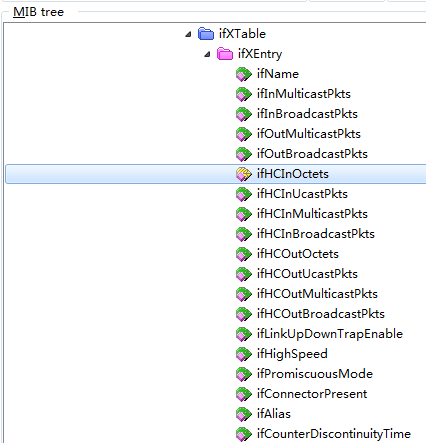
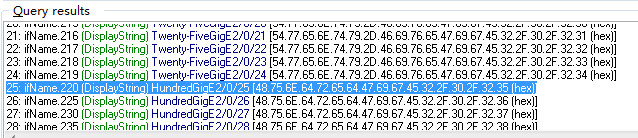
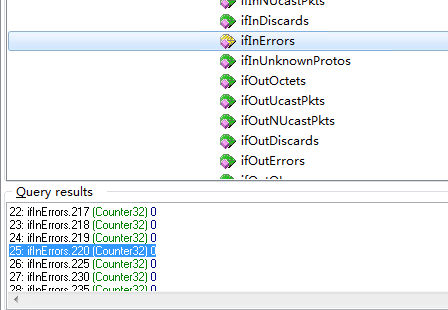
# As shown in Figure 6, obtain the index of interface HGE 1/0/25 through the ifName node (1.3.6.1.2.1.31.1.1.1.1). As shown in Figure 7, the query results dialog box shows that the index is 220 for HGE2/0/25.
Figure 6 Obtaining the interface index

Figure 7 Query results for the index

# As shown in Figure 8, use the hh3cCBQoSAccountingRunInfoEntry table (with OID 1.3.6.1.4.1.25506.2.65.2.1.5.6.8.1) to obtain the inbound traffic statistics (in packets) of interface HGE 2/0/25.
# As shown in Figure 9, the query results are displayed in the Query results window.
Figure 8 Obtaining traffic statistics

Learn more
For more information about configuring SNMP, see SNMP configuration in the configuration guides for your device.
For more information about MIB files, see the MIB references for your device.
NETCONF
Task
Install the NETCONF client software on the host, and use NETCONF to obtain traffic statistics for Layer 2 Ethernet interface HGE 2/0/25 on the device named Agent.
Figure 10 Network diagram for NETCONF

|
|
IMPORTANT: The NETCONF client obtains interface traffic statistics through the NETCONF XML APIs provided by the device. |
Procedure
· Enable the NETCONF over SOAP over HTTP feature.
# Enable the NETCONF over SOAP feature.
<H3C> system-view
[H3C] netconf soap http enable
Create user admin with permission to operate the device via NETCONF.
# Create a local device management user named admin. Set its password to admin and service type to HTTP.
[H3C] local-user admin
[H3C-luser-manage-admin] password simple admin
[H3C-luser-manage-admin] service-type http
# Configure the user role authorized to user admin as network-admin.
[H3C-luser-manage-admin] authorization-attribute user-role network-admin
· Enable the NETCONF over SOAP over HTTPS feature.
# Enable the NETCONF over SOAP feature.
<H3C> system-view
[H3C] netconf soap https enable
Create user admin with permission to operate the device via NETCONF.
# Create a local device management user named admin. Set its password to admin and service type to HTTP.
[H3C] local-user admin
[H3C-luser-manage-admin] password simple admin
[H3C-luser-manage-admin] service-type https
# Assign user role network-admin to the user..
[H3C-luser-manage-admin] authorization-attribute user-role network-admin
Example: Obtain traffic statistics
|
|
NOTE: · The device provides two tables for interface traffic statistics collection: Ifmgr/Statistics table and IPFW/IPStatistic table. Using the Ifmgr/Statistics table, you can query statistics for the interfaces in packets and bytes, including statistics on unicast, non-unicast, unknown, and discarded packets. Using the IPFW/IPStatistic table, you can query statistics for IPv4 or IPv6 packets of an interface in packets. · The following is an example of using the Ifmgr/Statistics table to query the statistics for interface HundredGigE 2/0/25. The configuration procedure for using the IPFW/IPStatistic table to query interface statistics is similar. For more information about the Ifmgr/Statistics table and the IPFW/IPStatistic table, see the NETCONF XML structure. |
# Copy and paste the following message to the NETCONF client.
<rpc message-id="100" xmlns="urn:ietf:params:xml:ns:netconf:base:1.0">
<get-bulk>
<filter type="subtree">
<top xmlns="http://www.h3c.com/netconf/data:1.0">
<Ifmgr>
<Statistics>
<Interface>
<IfIndex></IfIndex>
<Name>HundredGigE2/0/25</Name>
<AbbreviatedName></AbbreviatedName>
<InOctets></InOctets>
<InUcastPkts></InUcastPkts>
<InNUcastPkts></InNUcastPkts>
<InDiscards></InDiscards>
<InErrors></InErrors>
<InUnknownProtos></InUnknownProtos>
<InRate></InRate>
<OutOctets></OutOctets>
<OutUcastPkts></OutUcastPkts>
<OutNUcastPkts></OutNUcastPkts>
<OutDiscards></OutDiscards>
<OutErrors></OutErrors>
<OutRate></OutRate>
<LastClear></LastClear>
</Interface>
</Statistics>
</Ifmgr>
</top>
</filter>
</get-bulk>
</rpc>
# If the client receives a message like the following, it indicates that the operation was successful.
<rpc-reply message-id="100" xmlns="urn:ietf:params:xml:ns:netconf:base:1.0">
<data>
<top xmlns="http://www.h3c.com/netconf/data:1.0">
<Ifmgr>
<Statistics>
<Interface>
<IfIndex>220</IfIndex>
<Name>HundredGigE2/0/25</Name>
<AbbreviatedName>HGE2/0/25</AbbreviatedName>
<InOctets>77760</InOctets>
<InUcastPkts>606</InUcastPkts>
<InNUcastPkts>6</InNUcastPkts>
<InDiscards>0</InDiscards>
<InErrors>0</InErrors>
<InUnknownProtos>0</InUnknownProtos>
<InRate>0</InRate>
<OutOctets>77888</OutOctets>
<OutUcastPkts>607</OutUcastPkts>
<OutNUcastPkts>7</OutNUcastPkts>
<OutDiscards>0</OutDiscards>
<OutErrors>0</OutErrors>
<OutRate>0</OutRate>
<LastClear>0000-00-00T00:00:00</LastClear>
</Interface>
</Statistics>
</Ifmgr>
</top>
</data>
</rpc-reply>
Learn more
For more information about configuring NETCONF, see NETCONF configuration in the configuration guides for your device.
For more information about Ifmgr/Statistics and IPFW/IPStatistic, see H3C Comware 7 NETCONF XML API Reference.
gRPC
Task
Use a collector to obtain traffic statistics for Layer 2 Ethernet interface HGE 2/0/25 on the device by using gRPC.
Figure 11 Network diagram for gRPC

Procedure
# Configure IP addresses as required so the device and the collector can reach each other. (Details not shown.)
# Enable gRPC.
<H3C> system-view
[H3C] grpc enable
# Create a sensor group named test, and add sensor path Ifmgr/Statistics.
|
|
IMPORTANT: After sensor path Ifmgr/Statistics is added, the device will collect traffic statistics for all interfaces and upload the statistics to the collector. |
[H3C] telemetry
[H3C-telemetry] sensor-group test
[H3C-telemetry-sensor-group-test] sensor path ifmgr/statistics
[H3C-telemetry-sensor-group-test] quit
# Create a destination group named collector1 and add a collector to the group. In this example, the collector receives data on port 50050 at IPv4 address 192.168.2.1.
[H3C-telemetry] destination-group collector1
[H3C-telemetry-destination-group-collector1] ipv4-address 192.168.2.1 port 50050
[H3C-telemetry-destination-group-collector1] quit
# Create subscription A, configure the associated sensor group as test, data sampling and push interval as 30 seconds, and associate the target group with collector1.
[H3C-telemetry] subscription A
[H3C-telemetry-subscription-A] sensor-group test sample-interval 30
[H3C-telemetry-subscription-A] destination-group collector1
[H3C-telemetry-subscription-A] quit
Obtaining traffic statistics
The collector receives interface statistics pushed by the device every 30 seconds.
Learn more
For more information about configuring gRPC, see gRPC configuration in the configuration guides for your device.
Collecting error packet statistics for an Ethernet interface
CLI
Task
Obtain error packet statistics for interface HundredGigE 2/0/25.
Restrictions and guidelines
· You can use the display interface command to obtain the error traffic statistics for Ethernet interface.
· The statistics for error packets only support counting in the inbound direction and do not support counting in the outbound direction. The statistical value for input errors is equal to the sum of the values of runts, giants, throttles, CRC, frame, and aborts.
· To collect traffic statistics for an interface within a certain period of time, use the reset counters interface command in user view to clear the interface statistics and start a new statistics collection task.
· The reset counters interface command can clear the interface statistics collected at the CLI, but cannot clear the interface statistics on MIB.
Example: Obtain traffic statistics
Use the display interface to perform traffic statistics.
# Obtain the traffic statistics for interface HundredGigE 2/0/25.
[H3C]display interface HundredGigE 2/0/25
HundredGigE2/0/25
........
Input: 0 input errors, 0 runts, 0 giants, 0 throttles
0 CRC, 0 frame, - overruns, 0 aborts
- ignored, - parity errors
........
Output: 0 output errors, - underruns, 0 buffer failures
0 aborts, 0 deferred, 0 collisions, 0 late collisions
0 lost carrier, - no carrier
Table 6 Command output
|
Field |
Description |
|
HundredGigE2/0/25 |
Obtain the traffic statistics of interface HundredGigE 2/0/25 |
|
input errors |
Statistics for incoming error packets. |
|
runts |
Number of inbound frames meeting the following conditions: Shorter than 64 bytes.
|
|
giants |
Number of inbound giants. Giants refer to frames larger than the maximum frame length supported on the interface. · For an Ethernet interface that does not permit
jumbo frames, the maximum frame length is as follows: · · For an Ethernet interface that permits jumbo frames, the maximum Ethernet frame length is set when you configure jumbo frame support on the interface. |
|
throttles |
Number of inbound frames that had a non-integer number of bytes. |
|
CRC |
Total number of inbound frames that had a normal length, but contained CRC errors. |
|
frame |
Total number of inbound frames that contained CRC errors and a non-integer number of bytes. |
|
overruns |
Number of packets dropped because the input rate of the port exceeded the queuing capability. |
|
aborts |
Total number of illegal inbound packets: · Fragment frames—CRC error frames shorter than 64 bytes. The length (in bytes) can be an integral or non-integral value. · Jabber frames—CRC error frames greater than the maximum frame length supported on the Ethernet interface (with an integral or non-integral length). For an Ethernet interface that does not permit jumbo frames, the maximum frame length is 1518 bytes (without VLAN tags) or 1522 bytes (with VLAN tags). For an Ethernet interface that permits jumbo frames, the maximum Ethernet frame length is set when you configure jumbo frame support on the interface. · Symbol error frames—Frames that contained a minimum of one undefined symbol. · Unknown operation code frames—Non-pause MAC control frames. · Length error frames—Frames whose 802.3 length fields did not match the actual frame length (46 to 1500 bytes). |
|
ignored |
Number of inbound frames dropped because the receiving buffer of the port ran low. |
|
parity errors |
Total number of frames with parity errors. |
|
output errors |
Number of outbound packets with errors. |
|
underruns |
Number of packets dropped because the output rate of the interface exceeded the output queuing capability. This is a low-probability hardware anomaly. |
|
buffer failures |
Number of outbound frames dropped because the receiving buffer of the port ran low. |
|
aborts |
Number of packets that failed to be transmitted, for example, because of Ethernet collisions. |
|
deferred |
Number of frames that the interface deferred to transmit because of detected collisions. |
|
collisions |
Number of frames that the interface stopped transmitting because Ethernet collisions were detected during transmission. |
|
late collisions |
Number of frames that the interface deferred to transmit after transmitting their first 512 bits because of detected collisions. |
|
lost carrier |
Number of carrier losses during transmission. This counter increases by one when a carrier is lost, and applies to serial WAN interfaces. |
|
no carrier |
Number of times that the port failed to detect the carrier when attempting to send frames. This counter increases by one when a port failed to detect the carrier, and applies to serial WAN interfaces. |
SNMP
Task
Use an NMS to obtain the error packet statistics for Layer 2 Ethernet interface HGE 2/0/25 on the device (agent) through SNMP.
Figure 12 Network diagram for SNMP

Procedure
Configure SNMP. For more information, see "Procedure."
Example: Obtain traffic statistics
|
|
IMPORTANT: · To obtain error packet statistics for an interface, you must first obtain the index of the interface and then use the index to obtain error packet statistics for the interface. · The interface index might vary by the ID of the IRF member device hosting the interface. · You can view packet loss and error packet statistics on an interface by querying the ifInDiscards, ifOutDiscards, ifInErrors, and ifOutErrors nodes. The statistical method is the same for different tables. This example uses MIB Browser to query the ifInErrors node and obtain the inbound error traffic statistics for the interface HundredGigE 2/0/25. |
# As shown in Figure 13, obtain the index of interface HGE 1/0/25 through the ifName node (1.3.6.1.2.1.31.1.1.1.1). The query results dialog box shows that the index is 220 for HGE2/0/25.
Figure 13 Obtaining the interface index
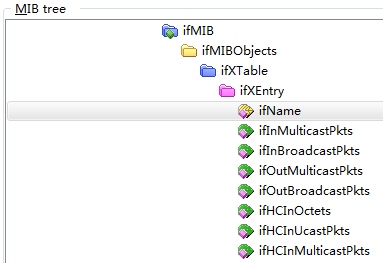
Figure 14 Query results for the index
# Use the ifInErrors table (with OID 1.3.6.1.2.1.31.1.1.1.6) to obtain the inbound error packet statistics for HGE 2/0/25. As shown in Figure 15, the query results are displayed in the Query results window.
Figure 15 Obtaining traffic statistics
Learn more
For more information about configuring SNMP, see SNMP configuration in the configuration guides for your device.
For more information about MIB files, see the MIB references for your device.
NETCONF
Task
Install the NETCONF client software on the host, and use NETCONF to obtain traffic statistics for Layer 2 Ethernet interface HGE 2/0/25 on the device named Agent.
Figure 16 Network diagram for SNMP

|
|
IMPORTANT: The NETCONF client obtains interface traffic statistics through the NETCONF XML APIs provided by the device. |
Procedure
Configure NETCONF. For more information, see "Procedure."
Example: Obtain traffic statistics
|
|
NOTE: · The device provides two tables for interface traffic statistics collection: Ifmgr/Statistics table and IPFW/IPStatistic table. Using the Ifmgr/Statistics table, you can query statistics for the interfaces in packets and bytes, including statistics on unicast, non-unicast, unknown, and discarded packets. Using the IPFW/IPStatistic table, you can query statistics for IPv4 or IPv6 packets of an interface in packets. · The following is an example of using the Ifmgr/Statistics table to query the statistics for interface HundredGigE 2/0/25. The configuration procedure for using the IPFW/IPStatistic table to query interface statistics is similar. For more information about the Ifmgr/Statistics table and the IPFW/IPStatistic table, see the NETCONF XML structure. |
# Obtaining the interface index.
[H3C-probe]display system internal ifmgr list | in HundredGigE2/0/25
Bridge-Aggregation2(index:220)
# Copy and paste the following message to the NETCONF client.
<rpc message-id="100" xmlns="urn:ietf:params:xml:ns:netconf:base:1.0">
<get-bulk>
<filter type="subtree">
<top xmlns="http://www.h3c.com/netconf/data:1.0">
<Ifmgr>
<Statistics>
<Interface>
<IfIndex>220</IfIndex>
<Name>HundredGigE2/0/25</Name>
<AbbreviatedName></AbbreviatedName>
<InOctets></InOctets>
<InUcastPkts></InUcastPkts>
<InNUcastPkts></InNUcastPkts>
<InDiscards></InDiscards>
<InErrors></InErrors>
<InUnknownProtos></InUnknownProtos>
<InRate></InRate>
<OutOctets></OutOctets>
<OutUcastPkts></OutUcastPkts>
<OutNUcastPkts></OutNUcastPkts>
<OutDiscards></OutDiscards>
<OutErrors></OutErrors>
<OutRate></OutRate>
<LastClear></LastClear>
</Interface>
</Statistics>
</Ifmgr>
</top>
</filter>
</get-bulk>
</rpc>
# If the client receives a message like the following, it indicates that the operation was successful.
<rpc-reply message-id="100" xmlns="urn:ietf:params:xml:ns:netconf:base:1.0">
<data>
<top xmlns="http://www.h3c.com/netconf/data:1.0">
<Ifmgr>
<Statistics>
<Interface>
<IfIndex>220</IfIndex>
<Name>HundredGigE2/0/25</Name>
<AbbreviatedName>HGE2/0/25</AbbreviatedName>
<InOctets>5090007388288</InOctets>
<InUcastPkts>39350156658</InUcastPkts>
<InNUcastPkts>0</InNUcastPkts>
<InDiscards>0</InDiscards>
<InErrors>415526968</InErrors>
<InUnknownProtos>0</InUnknownProtos>
<InRate>1081146628</InRate>
<OutOctets>55212</OutOctets>
<OutUcastPkts>0</OutUcastPkts>
<OutNUcastPkts>172</OutNUcastPkts>
<OutDiscards>0</OutDiscards>
<OutErrors>0</OutErrors>
<OutRate>0</OutRate>
<LastClear>2001-01-01T21:16:23</LastClear>
</Interface>
</Statistics>
</Ifmgr>
</top>
</data>
</rpc-reply>
Learn more
For more information about configuring NETCONF, see NETCONF configuration in the configuration guides for your device.
For more information about Ifmgr/Statistics and IPFW/IPStatistic, see H3C Comware 7 NETCONF XML API Reference.
gRPC
Task
Use a collector to obtain traffic statistics for Layer 2 Ethernet interface HGE 2/0/25 on the device by using gRPC.
Figure 17 Network diagram for gRPC

Procedure
Configure gRPC. For more information, see "Procedure."
Obtain traffic statistics
The collector receives interface statistics pushed by the device every 30 seconds.
Learn more
For more information about configuring gRPC, see gRPC configuration in the configuration guides for your device.
Collecting traffic statistics for Layer 3 Ethernet interfaces/Layer 3 Ethernet subinterfaces/Layer 3 aggregation group member interfaces.
|
|
IMPORTANT: · This section covers Layer 3 Ethernet interfaces or Layer 3 Ethernet subinterfaces, which include the fixed interfaces of the device, the 25-GE or 10-GE breakout interfaces split from 100-GE or 40-GE interfaces, and 5-GE or 10-GE subinterfaces. · For S6850, S6825, and S9820-8C, traffic statistics for breakout interfaces or breakout subinterfaces are not supported. · The traffic statistics for Layer 3 Ethernet interfaces are the same as the statistics for Layer 3 Ethernet subinterfaces and Layer 3 aggregation group member interfaces. Take Layer 3 Ethernet interface traffic statistics as an example. |
CLI
Task
Obtain the traffic statistics for interface HundredGigE 2/0/25.
Restrictions and guidelines
· You can use the display interface command to obtain the traffic statistics for Layer 2 Ethernet interface. For Layer 3 aggregated member interfaces, the statistics is not differentiated between IPv4 and IPv6 packets..
· Layer 3 Ethernet interfaces support Layer 3 traffic statistics. After Layer 3 traffic statistics collection is enabled, use the display interface command to view the IPv4 and IPv6 traffic statistics for an interface.
· You can use the display ip interface or display ipv6 interface command to display traffic statistics for Layer 3 Ethernet interfaces and Layer 3 Ethernet subinterfaces but not Layer 3 aggregate interfaces.
· For a Layer 3 Ethernet interface or Layer 3 Ethernet subinterface, unicast, multicast, and broadcast traffic is all counted in the unicast statistics.
· If subinterfaces are created under a Layer 3 Ethernet interface, the traffic statistics for the Layer 3 Ethernet interface include the traffic statistics for the subinterfaces. Assume that interface Ten-GigabitEthernet 1/0/1 has forwarded 10,000 packets, subinterface Ten-GigabitEthernet 1/0/1.1 has forwarded 10,000 packets, and subinterface Ten-GigabitEthernet 1/0/1.2 has forwarded 10,000 packets. The number of packets forwarded by Ten-GigabitEthernet 1/0/1 is 30000, and the numbers of packets forwarded by Ten-GigabitEthernet 1/0/1.1 and Ten-GigabitEthernet 1/0/1.2 are both 10,000 in the traffic statistics.
· The system does not distinguish traffic between subinterfaces with the same number under different main interfaces when collecting traffic statistics in the outbound direction of a Layer 3 Ethernet subinterface. For example, if both Ten-GigabitEthernet 1/0/1.2 and Ten-GigabitEthernet 1/0/2.2 use the resources of VLAN-interface 2 in the outbound direction, the outbound traffic for both interfaces is the sum of the traffic of these two interfaces.
· To collect traffic statistics for an interface within a certain period of time, use the reset counters interface command in user view to clear the interface statistics and start a new statistics collection task.
· The reset counters interface command can clear the interface statistics collected at the CLI, but cannot clear the interface statistics on MIB.
Procedure
# Configure HundredGigE 2/0/25 to operate in a Layer 3 mode.
<H3C> sys-view
[H3C] interface hundredgige 2/0/25
[H3C-HundredGigE2/0/25] port link-mode route
# Configure IP addresses. (Details not shown)
# (Optional.) Enable Layer 3 traffic statistics collection for HundredGigE 2/0/25.
[H3C-HundredGigE2/0/25] statistics l3-packet enable inbound
[H3C-HundredGigE2/0/25] statistics l3-packet enable outbound
Example: Obtain traffic statistics
· If Layer 3 traffic statistics collection is not enabled, use the display interface command to obtain traffic statistics.
# Obtain the traffic statistics for interface HundredGigE 2/0/25.
[H3C]display interface HundredGigE 2/0/25
HundredGigE2/0/25
........
Peak input rate: 0 bytes/sec, at 2022-04-07 16:07:11
Peak output rate: 0 bytes/sec, at 2022-04-07 16:07:11
Last 300 seconds input: 0 packets/sec 0 bytes/sec 0%
Last 300 seconds output: 0 packets/sec 0 bytes/sec 0%
Input (total): 612 packets, 77760 bytes
606 unicasts, 1 broadcasts, 5 multicasts, 0 pauses
Input (normal): 612 packets, - bytes
606 unicasts, 1 broadcasts, 5 multicasts, 0 pauses
Input: 0 input errors, 0 runts, 0 giants, 0 throttles
0 CRC, 0 frame, - overruns, 0 aborts
- ignored, - parity errors
Output (total): 614 packets, 77888 bytes
607 unicasts, 3 broadcasts, 4 multicasts, 0 pauses
Output (normal): 614 packets, - bytes
607 unicasts, 3 broadcasts, 4 multicasts, 0 pauses
Output: 0 output errors, - underruns, 0 buffer failures
0 aborts, 0 deferred, 0 collisions, 0 late collisions
0 lost carrier, - no carrier
Table 7 Command output
|
Field |
Description |
|
HundredGigE2/0/25 |
Obtain the traffic statistics for interface HundredGigE 2/0/25 |
|
Peak input rate |
Peak rate of inbound traffic in Bps, and the time when the peak inbound traffic rate occurred. |
|
Peak output rate |
Peak rate of outbound traffic in Bps, and the time when the peak outbound traffic rate occurred. |
|
Last interval seconds input: 0 packets/sec 0 bytes/sec 0% Last interval seconds output: 0 packets/sec 0 bytes/sec 0% |
Average inbound or outbound traffic rate (in pps and Bps) in the last statistics polling interval, and the ratio of the actual rate to the interface bandwidth. To set the statistics polling interval (interval), use the flow-interval command. A hyphen (-) indicates that the statistical item is not supported. |
|
Input(total): 0 packets, 0 bytes 0 unicasts, 0 broadcasts, 0 multicasts, 0 pauses |
The two fields on the first line represent the inbound traffic statistics (in packets and bytes) for the interface. All inbound normal packets, abnormal packets, and normal pause frames were counted. The four fields on the second line represent: · Number of inbound unicast packets. · Number of inbound broadcasts. · Number of inbound multicasts. · Number of inbound pause frames. A hyphen (-) indicates that the statistical item is not supported. |
|
Input(normal): 0 packets, 0 bytes 0 unicasts, 0 broadcasts, 0 multicasts, 0 pauses |
The two fields on the first line represent the inbound normal traffic and pause frame statistics (in packets and bytes) for the interface. The four fields on the second line represent: · Number of inbound normal unicast packets. · Number of inbound normal broadcasts. · Number of inbound normal multicasts. · Number of inbound normal pause frames. A hyphen (-) indicates that the statistical item is not supported. |
|
input errors |
Statistics for incoming error packets. |
|
runts |
Number of inbound frames meeting the following conditions: · Shorter than 64 bytes. · In correct format. · Containing valid CRCs. |
|
giants |
Number of inbound giants. Giants refer to frames larger than the maximum frame length supported on the interface. · For an Ethernet interface that does not permit jumbo frames, the maximum frame length is as follows: ¡ 1518 bytes (without VLAN tags). ¡ 1522 bytes (with VLAN tags). · For an Ethernet interface that permits jumbo frames, the maximum Ethernet frame length is set when you configure jumbo frame support on the interface. |
|
throttles |
Number of inbound frames that had a non-integer number of bytes. |
|
CRC |
Total number of inbound frames that had a normal length, but contained CRC errors. |
|
frame |
Total number of inbound frames that contained CRC errors and a non-integer number of bytes. |
|
overruns |
Number of packets dropped because the input rate of the port exceeded the queuing capability. |
|
aborts |
Total number of illegal inbound packets: · Fragment frames—CRC error frames shorter than 64 bytes. The length (in bytes) can be an integral or non-integral value. · Jabber frames—CRC error frames greater than the maximum frame length supported on the Ethernet interface (with an integral or non-integral length). For an Ethernet interface that does not permit jumbo frames, the maximum frame length is 1518 bytes (without VLAN tags) or 1522 bytes (with VLAN tags). For an Ethernet interface that permits jumbo frames, the maximum Ethernet frame length is set when you configure jumbo frame support on the interface. · Symbol error frames—Frames that contained a minimum of one undefined symbol. · Unknown operation code frames—Non-pause MAC control frames. · Length error frames—Frames whose 802.3 length fields did not match the actual frame length (46 to 1500 bytes). |
|
ignored |
Number of inbound frames dropped because the receiving buffer of the port ran low. |
|
parity errors |
Total number of frames with parity errors. |
|
Output(total): 0 packets, 0 bytes 0 unicasts, 0 broadcasts, 0 multicasts, 0 pauses |
The two fields on the first line represent the outbound traffic statistics (in packets and bytes) for the interface. All outbound normal packets, abnormal packets, and normal pause frames were counted. The four fields on the second line represent: · Number of outbound unicast packets. · Number of outbound broadcasts. · Number of outbound multicasts. · Number of outbound pause frames. A hyphen (-) indicates that the statistical item is not supported. |
|
Output(normal): 0 packets, 0 bytes 0 unicasts, 0 broadcasts, 0 multicasts, 0 pauses |
The two fields on the first line represent the outbound normal traffic and pause frame statistics (in packets and bytes) for the interface. The four fields on the second line represent: · Number of outbound normal unicast packets. · Number of outbound normal broadcasts. · Number of outbound normal multicasts. · Number of outbound normal pause frames. A hyphen (-) indicates that the statistical item is not supported. |
|
output errors |
Number of outbound packets with errors. |
|
underruns |
Number of packets dropped because the output rate of the interface exceeded the output queuing capability. This is a low-probability hardware anomaly. |
|
buffer failures |
Number of outbound frames dropped because the receiving buffer of the port ran low. |
|
aborts |
Number of packets that failed to be transmitted, for example, because of Ethernet collisions. |
|
deferred |
Number of frames that the interface deferred to transmit because of detected collisions. |
|
collisions |
Number of frames that the interface stopped transmitting because Ethernet collisions were detected during transmission. |
|
late collisions |
Number of frames that the interface deferred to transmit after transmitting their first 512 bits because of detected collisions. |
|
lost carrier |
Number of carrier losses during transmission. This counter increases by one when a carrier is lost, and applies to serial WAN interfaces. |
|
no carrier |
Number of times that the port failed to detect the carrier when attempting to send frames. This counter increases by one when a port failed to detect the carrier, and applies to serial WAN interfaces. |
· After Layer 3 traffic statistics collection is enabled, use the display interface to perform traffic statistics.
# Obtain the traffic statistics for interface HundredGigE 2/0/25.
[H3C]display interface HundredGigE 2/0/25
HundredGigE2/0/25
........
Peak input rate: 0 bytes/sec, at 2022-04-07 16:07:11
Peak output rate: 0 bytes/sec, at 2022-04-07 16:07:11
Last 300 seconds input: 0 packets/sec 0 bytes/sec 0%
Last 300 seconds output: 0 packets/sec 0 bytes/sec 0%
Input (total): 612 packets, 77760 bytes
606 unicasts, 1 broadcasts, 5 multicasts, 0 pauses
Input (normal): 612 packets, - bytes
606 unicasts, 1 broadcasts, 5 multicasts, 0 pauses
Input: 0 input errors, 0 runts, 0 giants, 0 throttles
0 CRC, 0 frame, - overruns, 0 aborts
- ignored, - parity errors
Output (total): 614 packets, 77888 bytes
607 unicasts, 3 broadcasts, 4 multicasts, 0 pauses
Output (normal): 614 packets, - bytes
607 unicasts, 3 broadcasts, 4 multicasts, 0 pauses
Output: 0 output errors, - underruns, 0 buffer failures
0 aborts, 0 deferred, 0 collisions, 0 late collisions
0 lost carrier, - no carrier
IPv4 traffic statistics:
Last 300 seconds input rate: 0 packets/sec, 0 bytes/sec
Last 300 seconds output rate: 0 packets/sec, 0 bytes/sec
Input: 300 packets, 38400 bytes
Output: 300 packets, 38400 bytes
IPv6 traffic statistics:
Last 300 seconds input rate: 0 packets/sec, 0 bytes/sec
Last 300 seconds output rate: 0 packets/sec, 0 bytes/sec
Input: 300 packets, 38400 bytes
Output: 300 packets, 38400 bytes
Table 8 Command output
|
Field |
Description |
|
HundredGigE2/0/25 |
Obtain the traffic statistics for interface HundredGigE 2/0/25 |
|
Peak input rate |
Peak rate of inbound traffic in Bps, and the time when the peak inbound traffic rate occurred. |
|
Peak output rate |
Peak rate of outbound traffic in Bps, and the time when the peak outbound traffic rate occurred. |
|
Last interval seconds input: 0 packets/sec 0 bytes/sec 0% Last interval seconds output: 0 packets/sec 0 bytes/sec 0% |
Average inbound or outbound traffic rate (in pps and Bps) in the last statistics polling interval, and the ratio of the actual rate to the interface bandwidth. To set the statistics polling interval (interval), use the flow-interval command. A hyphen (-) indicates that the statistical item is not supported. |
|
Input(total): 0 packets, 0 bytes 0 unicasts, 0 broadcasts, 0 multicasts, 0 pauses |
The two fields on the first line represent the inbound traffic statistics (in packets and bytes) for the interface. All inbound normal packets, abnormal packets, and normal pause frames were counted. The four fields on the second line represent: · Number of inbound unicast packets. · Number of inbound broadcasts. · Number of inbound multicasts. · Number of inbound pause frames. A hyphen (-) indicates that the statistical item is not supported. |
|
Input(normal): 0 packets, 0 bytes 0 unicasts, 0 broadcasts, 0 multicasts, 0 pauses |
The two fields on the first line represent the inbound normal traffic and pause frame statistics (in packets and bytes) for the interface. The four fields on the second line represent: · Number of inbound normal unicast packets. · Number of inbound normal broadcasts. · Number of inbound normal multicasts. · Number of inbound normal pause frames. A hyphen (-) indicates that the statistical item is not supported. |
|
input errors |
Statistics for incoming error packets. |
|
runts |
Number of inbound frames meeting the following conditions: · Shorter than 64 bytes. · In correct format. · Containing valid CRCs. |
|
giants |
Number of inbound giants. Giants refer to frames larger than the maximum frame length supported on the interface. · For an Ethernet interface that does not permit jumbo frames, the maximum frame length is as follows: ¡ 1518 bytes (without VLAN tags). ¡ 1522 bytes (with VLAN tags). · For an Ethernet interface that permits jumbo frames, the maximum Ethernet frame length is set when you configure jumbo frame support on the interface. |
|
throttles |
Number of inbound frames that had a non-integer number of bytes. |
|
CRC |
Total number of inbound frames that had a normal length, but contained CRC errors. |
|
frame |
Total number of inbound frames that contained CRC errors and a non-integer number of bytes. |
|
overruns |
Number of packets dropped because the input rate of the port exceeded the queuing capability. |
|
aborts |
Total number of illegal inbound packets: · Fragment frames—CRC error frames shorter than 64 bytes. The length (in bytes) can be an integral or non-integral value. · Jabber frames—CRC error frames greater than the maximum frame length supported on the Ethernet interface (with an integral or non-integral length). For an Ethernet interface that does not permit jumbo frames, the maximum frame length is 1518 bytes (without VLAN tags) or 1522 bytes (with VLAN tags). For an Ethernet interface that permits jumbo frames, the maximum Ethernet frame length is set when you configure jumbo frame support on the interface. · Symbol error frames—Frames that contained a minimum of one undefined symbol. · Unknown operation code frames—Non-pause MAC control frames. · Length error frames—Frames whose 802.3 length fields did not match the actual frame length (46 to 1500 bytes). |
|
ignored |
Number of inbound frames dropped because the receiving buffer of the port ran low. |
|
parity errors |
Total number of frames with parity errors. |
|
Output(total): 0 packets, 0 bytes 0 unicasts, 0 broadcasts, 0 multicasts, 0 pauses |
The two fields on the first line represent the outbound traffic statistics (in packets and bytes) for the interface. All outbound normal packets, abnormal packets, and normal pause frames were counted. The four fields on the second line represent: · Number of outbound unicast packets. · Number of outbound broadcasts. · Number of outbound multicasts. · Number of outbound pause frames. A hyphen (-) indicates that the statistical item is not supported. |
|
Output(normal): 0 packets, 0 bytes 0 unicasts, 0 broadcasts, 0 multicasts, 0 pauses |
The two fields on the first line represent the outbound normal traffic and pause frame statistics (in packets and bytes) for the interface. The four fields on the second line represent: · Number of outbound normal unicast packets. · Number of outbound normal broadcasts. · Number of outbound normal multicasts. · Number of outbound normal pause frames. A hyphen (-) indicates that the statistical item is not supported. |
|
output errors |
Number of outbound packets with errors. |
|
underruns |
Number of packets dropped because the output rate of the interface exceeded the output queuing capability. This is a low-probability hardware anomaly. |
|
buffer failures |
Number of outbound frames dropped because the receiving buffer of the port ran low. |
|
aborts |
Number of packets that failed to be transmitted, for example, because of Ethernet collisions. |
|
deferred |
Number of frames that the interface deferred to transmit because of detected collisions. |
|
collisions |
Number of frames that the interface stopped transmitting because Ethernet collisions were detected during transmission. |
|
late collisions |
Number of frames that the interface deferred to transmit after transmitting their first 512 bits because of detected collisions. |
|
lost carrier |
Number of carrier losses during transmission. This counter increases by one when a carrier is lost, and applies to serial WAN interfaces. |
|
no carrier |
Number of times that the port failed to detect the carrier when attempting to send frames. This counter increases by one when a port failed to detect the carrier, and applies to serial WAN interfaces. |
|
Peak input rate |
Peak rate of inbound traffic in Bps, and the time when the peak inbound traffic rate occurred. |
|
Peak output rate |
Peak rate of outbound traffic in Bps, and the time when the peak outbound traffic rate occurred. |
|
IPv4 traffic statistics |
IPv4 packet statistics. |
|
IPv6 traffic statistics |
IPv6 packet statistics. |
|
Last 300 seconds input rate: 0 packets/sec, 0 bytes/sec |
Average inbound traffic rate (in pps and Bps) in the last 300 seconds. A hyphen (-) indicates that the statistical item is not supported. |
|
Last 300 seconds output rate: 0 packets/sec, 0 bytes/sec |
Average outbound traffic rate (in pps and Bps) in the last 300 seconds. A hyphen (-) indicates that the statistical item is not supported. |
|
Input: 0 packets, 0 bytes |
Inbound traffic statistics (in packets and bytes) for the interface. A hyphen (-) indicates that the statistical item is not supported. |
|
Output: 0 packets, 0 bytes |
Outbound traffic statistics (in packets and bytes) for the interface. A hyphen (-) indicates that the statistical item is not supported. |
· IPv4 packet statistics.
# Obtain the IPv4 traffic statistics for interface HundredGigE 2/0/25.
[H3C]dis ip interface hundredgige 2/0/25
HundredGigE2/0/25 current state: UP
Line protocol current state: UP
Internet Address is 41.41.41.2/24 Primary
Broadcast address: 41.41.41.255
The Maximum Transmit Unit: 1500 bytes
input packets : 300, bytes : 38400, multicasts : 0
output packets : 300, bytes : 38382, multicasts : 0
TTL invalid packet number: 0
ICMP packet input number: 0
Echo reply: 0
Unreachable: 0
Source quench: 0
Routing redirect: 0
Echo request: 0
Router advert: 0
Router solicit: 0
Time exceed: 0
IP header bad: 0
Timestamp request: 0
Timestamp reply: 0
Information request: 0
Information reply: 0
Netmask request: 0
Netmask reply: 0
Unknown type: 0
|
Field |
Description |
|
current state |
Physical link state of the interface: · Administratively DOWN—The interface has been shut down by using the shutdown command. · DOWN—The interface is administratively up, but its physical state is down (possibly because no physical link exists or the link has failed). · UP—The interface is both administratively and physically up. |
|
Line protocol current state |
Data link layer state of the interface. · DOWN—The data link layer protocol is down. · UP—The data link layer protocol is up. · UP (spoofing)—The data link layer protocol is up, but the link is an on-demand link or does not exist. |
|
Internet Address |
IP address of the interface. Possible IP address types include: · Primary—Manually configured primary IP address. · Sub—Manually configured secondary IP address. If the interface has both primary and secondary IP addresses, the primary IP address is displayed. If the interface has only secondary IP addresses, the lowest secondary IP address is displayed. · DHCP-Allocated—DHCP allocated IP address. For more information, see DHCP client configuration in Layer 3—IP Services Configuration Guide. · BOOTP-Allocated—BOOTP allocated IP address. For more information, see BOOTP client configuration in Layer 3—IP Services Configuration Guide. · Unnumbered—IP address borrowed from another interface. · Cellular-Allocated—IP address allocated through the modem manufacturer's proprietary protocol. For more information, see 3G/4G modem management in Layer 2—WAN Access Configuration Guide. · MAD—IP address assigned to an IRF member device for MAD on the interface. For more information, see IRF configuration in Virtual Technologies Configuration Guide. |
|
Broadcast address |
Broadcast address of the subnet attached to an interface. |
|
The Maximum Transmit Unit |
MTU of the interface, in bytes. |
|
input packets, bytes, multicasts output packets, bytes, multicasts |
All received and sent packets and bytes, and received and sent multicast packets on an interface (statistics start at the device startup). |
|
TTL invalid packet number |
Number of TTL-invalid packets received on the interface (statistics start at the device startup). |
|
ICMP packet input number: Echo reply: Unreachable: Source quench: Routing redirect: Echo request: Router advert: Router solicit: Time exceed: IP header bad: Timestamp request: Timestamp reply: Information request: Information reply: Netmask request: Netmask reply: Unknown type: |
Total number of ICMP packets received on the interface (statistics start at the device startup): · Echo reply packets. · Unreachable packets. · Source quench packets. · Routing redirect packets. · Echo request packets. · Router advertisement packets. · Router solicitation packets. · Time exceeded packets. · IP header bad packets. · Timestamp request packets. · Timestamp reply packets. · Information request packets. · Information reply packets. · Netmask request packets. · Netmask reply packets. · Unknown type packets. |
· IPv6 packet statistics.
# Obtain the IPv4 traffic statistics for interface HundredGigE 2/0/25.
[H3C]dis ipv6 interface H2/0/25
HundredGigE2/0/25 current state: UP
Line protocol current state: UP
IPv6 is enabled, link-local address is FE80::2E0:FCFF:FE00:6851
Global unicast address(es):
41::2, subnet is 41::/64
Joined group address(es):
FF02::1
FF02::2
FF02::1:FF00:2
FF02::1:FF00:6851
MTU is 1500 bytes
ND DAD is enabled, number of DAD attempts: 1
ND reachable time is 30000 milliseconds
ND retransmit interval is 1000 milliseconds
Hosts use stateless autoconfig for addresses
IPv6 Packet statistics:
InReceives: 300
InTooShorts: 0
InTruncatedPkts: 0
InHopLimitExceeds: 0
InBadHeaders: 0
InBadOptions: 0
ReasmReqds: 0
ReasmOKs: 0
InFragDrops: 0
InFragTimeouts: 0
OutFragFails: 0
InUnknownProtos: 0
InDelivers: 304
OutRequests: 4
OutForwDatagrams: 300
InNoRoutes: 0
InTooBigErrors: 0
OutFragOKs: 0
OutFragCreates: 0
InMcastPkts: 0
InMcastNotMembers: 0
OutMcastPkts: 1
InAddrErrors: 0
InDiscards: 0
OutDiscards: 0
SNMP
Task
Use an NMS to obtain the inbound traffic statistics for Layer 3 Ethernet interface HGE 2/0/25 through SNMP.
Figure 18 Network diagram for SNMP

Restrictions and guidelines
· For S6850, S9850, S6805, S6825, and S9820-64H switches, the inbound traffic statistics are supported for Layer 3 aggregated subinterfaces, while the outbound traffic statistics are not supported. The statistical data does not distinguish between IPv4 and IPv6 packets.
· For S9820-8C switch, IPv6 traffic statistics for Layer 3 aggregated subinterfaces are not supported by SNMP.
· For Layer 3 Ethernet interfaces, traffic statistics can be obtained using the following tables:
¡ ifEntry (with OID 1.3.6.1.2.1.2.2.1)
¡ ifXEntry (with OID 1.3.6.1.2.1.31.1.1)
¡ hh3cIfFlowStatEntry (with OID 1.3.6.1.4.1.25506.2.40.2.1.2.1.1)
¡ ipIfStatsEntry (with OID 1.3.6.1.2.1.4.31.3.1)
· In the ifEntry table, the data length for the interface traffic statistics collection node is 32 bits and is 64 bits in the ifXEntry table. Therefore, the interface traffic statistics collection node in the ifEntry table might overflow but that in the ifXEntry table will not when traffic statistics collection is performed. The nodes in the ifEntry table and the ifXEntry table are not exactly the same, and the two tables have an overlapping relationship. The interface traffic statistics in the ifXEntry table take precedence. If no interface traffic statistics are available in the ifXEntry table, check the ifEntry table.
· You can use the nodes in the ifEntry, ifXEntry, hh3cIfFlowStatEntry, hh3cIfHCFlowStatEntry, and hh3cifPortProtocolStatEntry tables to obtain different data. For more information about the tables, see the MIB references for your device.
Procedure
# Switch to a Layer 3 Ethernet interface.
<H3C> sys-view
[H3C] interface hundredgige 2/0/25
[H3C-HundredGigE2/0/25] port link-mode route
# Configure IP address (Details not shown)
# Configure SNMP. For more information, see "Procedure."
Example: Obtain traffic statistics
|
|
IMPORTANT: · To obtain error packet statistics for an interface, you must first obtain the index of the interface and then use the index to obtain error packet statistics for the interface. · The interface index might vary by the ID of the IRF member device hosting the interface. · You can view packet loss and error packet statistics on an interface by querying the ifInDiscards, ifOutDiscards, ifInErrors, and ifOutErrors nodes. The statistical method is the same for different tables. This example uses MIB Browser to query the ifInErrors node and obtain the inbound error traffic statistics for the interface HundredGigE 2/0/25. |
# Obtain the index of interface HGE 2/0/25 through the ifName node (1.3.6.1.2.1.31.1.1.1.1). The query results dialog box shows that the index is 220 for HGE 2/0/25.
Figure 19 Obtaining the interface index

Figure 20 Query result for index

# As shown in Figure 21, use the ifHCInOctets table (with OID 1.3.6.1.2.1.31.1.1.1.6) to obtain the inbound traffic statistics (in packets) of HGE 2/0/25.
# The query results dialog box shows that the index is.
Figure 21 Obtaining traffic statistics

Figure 22 Obtaining traffic statistics
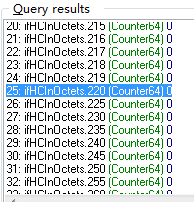
Learn more
For more information about configuring SNMP, see SNMP configuration in the configuration guides for your device.
For more information about MIB files, see the MIB references for your device.
NETCONF
Task
Install the NETCONF client software on the host, and use NETCONF to obtain traffic statistics for Layer 2 Ethernet interface HGE 2/0/25 on the device named Agent.
Figure 23 Network diagram for SNMP

|
|
IMPORTANT: The NETCONF client obtains interface traffic statistics through the NETCONF XML APIs provided by the device. |
Procedure
# Switch to a Layer 3 Ethernet interface.
<H3C> sys-view
[H3C] interface hundredgige 2/0/25
[H3C-HundredGigE2/0/25] port link-mode route
# Configure IP address (Details not shown)
# Configure NETCONF. For more information, see "Procedure."
Example: Obtain traffic statistics
|
|
NOTE: · The device provides two tables for interface traffic statistics collection: Ifmgr/Statistics table and IPFW/IPStatistic table. Using the Ifmgr/Statistics table, you can query statistics for the interfaces in packets and bytes, including statistics on unicast, non-unicast, unknown, and discarded packets. Using the IPFW/IPStatistic table, you can query statistics for IPv4 or IPv6 packets of an interface in packets. · The following is an example of using the Ifmgr/Statistics table to query the statistics for interface HundredGigE 2/0/25. The configuration procedure for using the IPFW/IPStatistic table to query interface statistics is similar. For more information about the Ifmgr/Statistics table and the IPFW/IPStatistic table, see the NETCONF XML structure. |
[H3C-probe]display system internal ifmgr list | in HundredGigE2/0/25
Bridge-Aggregation2(index:220)
# Copy and paste the following message to the NETCONF client.
<rpc message-id="100" xmlns="urn:ietf:params:xml:ns:netconf:base:1.0">
<get-bulk>
<filter type="subtree">
<top xmlns="http://www.h3c.com/netconf/data:1.0">
<Ifmgr>
<Statistics>
<Interface>
<IfIndex>220</IfIndex>
<Name>HundredGigE2/0/25</Name>
<AbbreviatedName></AbbreviatedName>
<InOctets></InOctets>
<InUcastPkts></InUcastPkts>
<InNUcastPkts></InNUcastPkts>
<InDiscards></InDiscards>
<InErrors></InErrors>
<InUnknownProtos></InUnknownProtos>
<InRate></InRate>
<OutOctets></OutOctets>
<OutUcastPkts></OutUcastPkts>
<OutNUcastPkts></OutNUcastPkts>
<OutDiscards></OutDiscards>
<OutErrors></OutErrors>
<OutRate></OutRate>
<LastClear></LastClear>
</Interface>
</Statistics>
</Ifmgr>
</top>
</filter>
</get-bulk>
</rpc>
# If the client receives a message like the following, it indicates that the operation was successful.
<rpc-reply message-id="100" xmlns="urn:ietf:params:xml:ns:netconf:base:1.0">
<data>
<top xmlns="http://www.h3c.com/netconf/data:1.0">
<Ifmgr>
<Statistics>
<Interface>
<IfIndex>220</IfIndex>
<Name>HundredGigE2/0/25</Name>
<AbbreviatedName>HGE2/0/25</AbbreviatedName>
<InOctets>77760</InOctets>
<InUcastPkts>606</InUcastPkts>
<InNUcastPkts>6</InNUcastPkts>
<InDiscards>0</InDiscards>
<InErrors>0</InErrors>
<InUnknownProtos>0</InUnknownProtos>
<InRate>0</InRate>
<OutOctets>77888</OutOctets>
<OutUcastPkts>607</OutUcastPkts>
<OutNUcastPkts>7</OutNUcastPkts>
<OutDiscards>0</OutDiscards>
<OutErrors>0</OutErrors>
<OutRate>0</OutRate>
<LastClear>0000-00-00T00:00:00</LastClear>
</Interface>
</Statistics>
</Ifmgr>
</top>
</data>
</rpc-reply>
Learn more
For more information about configuring NETCONF, see NETCONF configuration in the configuration guides for your device.
For more information about Ifmgr/Statistics and IPFW/IPStatistic, see H3C Comware 7 NETCONF XML API Reference.
gRPC
Task
Use a collector to obtain traffic statistics for Layer 3 Ethernet interface HGE 2/0/25 on the device by using gRPC.
Figure 24 Network diagram for gRPC

Procedure
Configure gRPC. For more information, see "Procedure."
Obtaining traffic statistics
The collector receives interface statistics pushed by the device every 30 seconds.
Learn more
For more information about configuring gRPC, see gRPC configuration in the configuration guides for your device.
Collecting Layer 2 aggregate interface traffic statistics
CLI
Task
Obtain the traffic statistics for Layer 2 aggregate interface Bridge-Aggregation 2
Restrictions and guidelines
· To obtain the traffic statistics for a Layer 2 aggregate interface, use the display interface command. The device does not distinguish between IPv4 and IPv6 packets when collecting traffic statistics.
· Layer 3 traffic statistics collection is not available for Layer 2 aggregate interfaces.
· The display ip interface and display ipv6 interface commands do not display traffic statistics for interfaces.
· To determine whether an interface works correctly within a period by collecting the traffic statistics within that period, first use the reset counters interface command to clear the statistics.
· The reset counters interface command can clear the counters in the output from the display interface command, but does not clear the counters of MIB nodes.
Example: Obtain traffic statistics
# Obtain the traffic statistics for Layer 2 aggregate interface Bridge-Aggregation 2.
[H3C]display interface Bridge-Aggregation2
Bridge-Aggregation2
.........
Last 300 seconds input: 1 packets/sec 254 bytes/sec 0%
Last 300 seconds output: 1 packets/sec 254 bytes/sec 0%
Input (total): 610 packets, 77632 bytes
603 unicasts, 2 broadcasts, 5 multicasts, 0 pauses
Input (normal): 610 packets, - bytes
603 unicasts, 2 broadcasts, 5 multicasts, 0 pauses
Input: 0 input errors, 0 runts, 0 giants, 0 throttles
0 CRC, 0 frame, - overruns, 0 aborts
- ignored, - parity errors
Output (total): 619 packets, 78296 bytes
605 unicasts, 6 broadcasts, 8 multicasts, 0 pauses
Output (normal): 619 packets, - bytes
605 unicasts, 6 broadcasts, 8 multicasts, 0 pauses
Output: 0 output errors, - underruns, 0 buffer failures
0 aborts, 0 deferred, 0 collisions, 0 late collisions
0 lost carrier, - no carrier
Table 10 Command output
|
Field |
Description |
|
Bridge-Aggregation1 |
Layer 2 aggregate interface name. |
|
Last clearing of counters |
Time when the reset counters interface command was last used to clear the interface statistics. This field displays Never if the reset counters interface command has never been used on the interface since device startup. |
|
Last 300 seconds input rate |
Average input rate over the last 300 seconds. |
|
Last 300 seconds output rate |
Average output rate over the last 300 seconds. |
|
Input/Output (total) |
Statistics of all packets received or sent on the interface. |
|
Input/Output (normal) |
Statistics of all normal packets received or sent on the interface. |
SNMP
Task
Use an NMS to obtain the inbound traffic statistics for interface Bridge-Aggregation 2 through SNMP.
Figure 25 Network diagram for SNMP
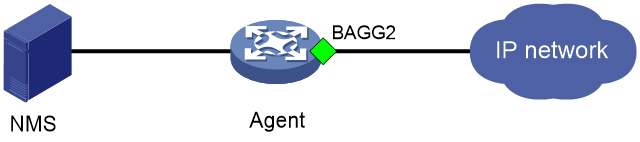
Restrictions and guidelines
· For Layer 2 aggregate interfaces, traffic statistics collection is performed by using the following tables: ifEntry (with OID 1.3.6.1.2.1.2.2.1), ifXEntry (with OID 1.3.6.1.2.1.31.1.1), hh3cIfFlowStatEntry (with OID 1.3.6.1.4.1.25506.2.40.2.1.2.1.1), and ipIfStatsEntry (with OID 1.3.6.1.2.1.4.31.3.1).
· The data length of the interface traffic statistics nodes in the ifEntry table is 32 bits, and the data length of some nodes in the ifXEntry table are 64 bits. Therefore, the interface traffic statistics nodes of the ifEntry table might have data overflow in collecting interface traffic statistics. The interface traffic statistics nodes of the ifXEntry table do not have data overflow issues. The nodes in the ifEntry table and the ifXEntry table are not completely identical, but they have some overlapping nodes. If target data can be found in the ifXEntry table, use the data in the ifXEntry table. If the data cannot be found in the ifXEntry table, check the ifEntry table.
· You can use the nodes in the following tables to obtain different traffic statistics: ifEntry, ifXEntry, hh3cIfFlowStatEntry, hh3cIfHCFlowStatEntry, and hh3cifPortProtocolStatEntry. For more information about the ifEntry, ifXEntry, hh3cIfFlowStatEntry, hh3cIfHCFlowStatEntry, and ipIfStatsEntry tables, see the MIB references for your device.
Procedure
Configure SNMP. For more information, see "Procedure."
Example: Obtain traffic statistics
|
|
NOTE: · To obtain traffic statistics for an interface, you must first obtain the index of the interface, and then use the index to obtain traffic statistics for the interface. · A main interface and its subinterfaces use unique indexes. You must obtain the index of the target interface or subinterface. · The interface index might vary by the ID of the IRF member device hosting the interface. · This example obtains the inbound traffic statistics for the Bridge-Aggregation 2 interface through the MIB browser. |
# Use the ifDescr node (1.3.6.1.2.1.2.2.1.2) to obtain the index of the Bridge-Aggregation 2 interface. The query results dialog box shows that the index is 2178 for interface Bridge-Aggregation 2, as shown in Figure 26.
Figure 26 Obtaining the interface index
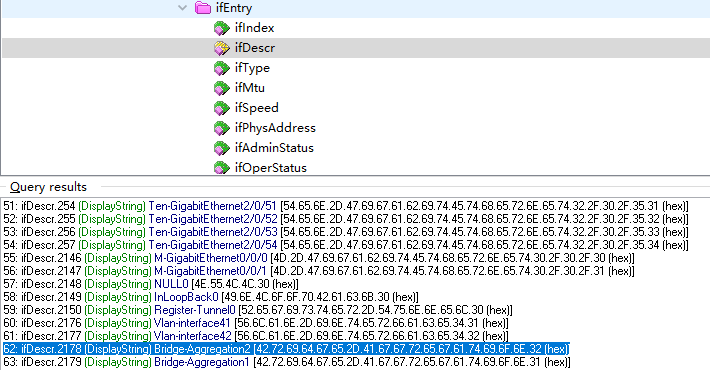
# As shown in Figure 27, use the ifHCInOctets table (with OID 1.3.6.1.2.1.31.1.1.1.6) to obtain the inbound traffic statistics (in Byte) of interface Bridge-Aggregation 2.
Figure 27 Obtain traffic statistics
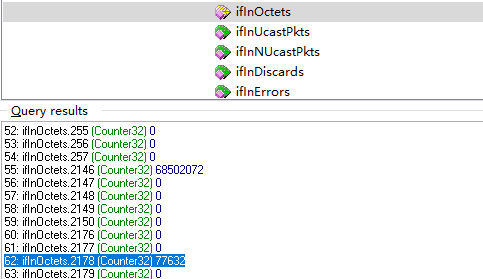
Learn more
For more information about configuring SNMP, see SNMP configuration in the configuration guides for your device.
For more information about MIB files, see the MIB references for your device.
NETCONF
Task
Install the NETCONF client software on the host, and use NETCONF to obtain traffic statistics for Layer 2 aggregate interface Bridge-Aggregation 2 on the device named Agent.
Figure 28 Network diagram for SNMP

|
|
NOTE: The NETCONF client obtains interface traffic statistics through the NETCONF XML APIs provided by the device. |
Procedure
Configure NETCONF. For more information, see "Procedure."
Example: Obtain traffic statistics
|
|
NOTE: · The device provides the Ifmgr/Statistics and IPFW/IPStatistic tables for collecting interface traffic statistics. Use the Ifmgr/Statistics table to obtain interface traffic statistics in both bytes and packets, including statistics for unicast packets, non-unicast packets, unknown packets, discarded packets, and other types of packets. Use the IPFW/IPStatistic table to obtain interface traffic statistics about IPv4 or IPv6 packets in packets. · The following procedure uses the Ifmgr/Statistics table to obtain the traffic statistics for Bridge-Aggregation 2. The procedure is similar if you use the IPFW/IPStatistic table. For more information about the Ifmgr/Statistics and IPFW/IPStatistic tables, see the NETCONF XML structure. |
# Obtain the interface index.
[H3C-probe]display system internal ifmgr list | in Bridge-Aggregation2
Bridge-Aggregation2(index:2178)
# Copy and paste the following message to the NETCONF client.
<rpc message-id="100" xmlns="urn:ietf:params:xml:ns:netconf:base:1.0">
<get-bulk>
<filter type="subtree">
<top xmlns="http://www.h3c.com/netconf/data:1.0">
<Ifmgr>
<Statistics>
<Interface>
<IfIndex>2178</IfIndex>
<Name>Bridge-Aggregation2</Name>
<AbbreviatedName></AbbreviatedName>
<InOctets></InOctets>
<InUcastPkts></InUcastPkts>
<InNUcastPkts></InNUcastPkts>
<InDiscards></InDiscards>
<InErrors></InErrors>
<InUnknownProtos></InUnknownProtos>
<InRate></InRate>
<OutOctets></OutOctets>
<OutUcastPkts></OutUcastPkts>
<OutNUcastPkts></OutNUcastPkts>
<OutDiscards></OutDiscards>
<OutErrors></OutErrors>
<OutRate></OutRate>
<LastClear></LastClear>
</Interface>
</Statistics>
</Ifmgr>
</top>
</filter>
</get-bulk>
</rpc>
# If the client receives a message like the following, it indicates that the operation was successful.
<rpc-reply message-id="100" xmlns="urn:ietf:params:xml:ns:netconf:base:1.0">
<data>
<top xmlns="http://www.h3c.com/netconf/data:1.0">
<Ifmgr>
<Statistics>
<Interface>
<IfIndex>2178</IfIndex>
<Name>Bridge-Aggregation2</Name>
<AbbreviatedName>BAGG2/0/25</AbbreviatedName>
<InOctets>77632</InOctets>
<InUcastPkts>603</InUcastPkts>
<InNUcastPkts>7</InNUcastPkts>
<InDiscards>0</InDiscards>
<InErrors>0</InErrors>
<InUnknownProtos>0</InUnknownProtos>
<InRate>0</InRate>
<OutOctets>78296</OutOctets>
<OutUcastPkts>605</OutUcastPkts>
<OutNUcastPkts>14</OutNUcastPkts>
<OutDiscards>0</OutDiscards>
<OutErrors>0</OutErrors>
<OutRate>0</OutRate>
<LastClear>0000-00-00T00:00:00</LastClear>
</Interface>
</Statistics>
</Ifmgr>
</top>
</data>
</rpc-reply>
Learn more
For more information about configuring NETCONF, see NETCONF configuration in the configuration guides for your device.
For more information about the Ifmgr/Statistics and IPFW/IPStatistic tables, see H3C Comware 7 NETCONF XML API Reference.
gRPC
Task
Use a collector to obtain traffic statistics for Layer 2 aggregate interface Bridge-Aggregation 2 on the device by using gRPC.
Figure 29 Network diagram for gRPC

Procedure
See "Procedure" for detailed configuration procedure.
Obtain traffic statistics
The collector receives interface traffic statistics pushed by the device every 30 seconds.
Learn more
For more information about configuring gRPC, see gRPC configuration in the configuration guides for your device.
Collecting Layer 3 aggregate interface traffic statistics
CLI
Task
Obtain the traffic statistics for Layer 3 aggregate interface Route-Aggregation 2.
Restrictions and guidelines
· To obtain the traffic statistics for a Layer 3 aggregate subinterface, use the display interface command. The device does not distinguish between IPv4 and IPv6 packets when collecting traffic statistics.
· Layer 3 traffic statistics collection is not available for Layer 3 aggregate interfaces.
· If subinterfaces are created on a Layer 3 aggregate interface, the traffic statistics for the main interface contains statistics for the traffic forwarded by the subinterfaces.
· If the number of a Layer 3 subinterface is the same as the number of another Layer 3 subinterface or a VLAN interface's tag, the statistics data will be accumulated in collecting outbound packet statistics. For example, if Route-Aggregation 1.3 and Route-Aggregation 2.3 exist or Route-Aggregation 1.3 and VLAN-interface 3 exist, VLAN tag 3 is used in the outbound direction for the subinterfaces and VLAN interface. In this case, the statistics for the two interfaces will be accumulated and counted together.
· To determine whether an interface works correctly within a period by collecting the traffic statistics within that period, first use the reset counters interface command to clear the statistics.
· The reset counters interface command can clear the counters in the output from the display interface command, but does not clear the counters of MIB nodes.
Procedure
# Create Layer 3 aggregate interface Route-Aggregation 2.
<H3C> sys-view
[H3C] interface route-aggregation 2
Example: Obtain traffic statistics
# Obtain the traffic statistics for Layer 3 aggregate interface Route-Aggregation 2.
[H3C]display interface route-aggregation 2
Route-Aggregation2
........
Last 300 seconds input rate: 255 bytes/sec, 2040 bits/sec, 2 packets/sec
Last 300 seconds output rate: 255 bytes/sec, 2040 bits/sec, 2 packets/sec
611 packets input, 77696 bytes, 0 drops
627 packets output, 78912 bytes, 0 drops
Table 11 Command output
|
Field |
Description |
|
Bridge-Aggregation2 |
Layer 2 aggregate interface name. |
|
Last 300 seconds input rate |
Average input rate over the last 300 seconds. |
|
Last 300 seconds output rate |
Average output rate over the last 300 seconds. |
|
Input |
Statistics of all packets received on the interface. |
|
output |
Statistics of all normal packets sent on the interface. |
SNMP
Task
Use an NMS to obtain the inbound traffic statistics for interface Route-Aggregation 2 through SNMP.
Figure 30 Network diagram for SNMP

Restrictions and guidelines
· The device does not distinguish between IPv4 and IPv6 packets when collecting traffic statistics for Layer 3 aggregate interfaces.
· For Layer 3 aggregate interfaces, traffic statistics collection is performed by using the following tables: ifEntry (with OID 1.3.6.1.2.1.2.2.1), ifXEntry (with OID 1.3.6.1.2.1.31.1.1), hh3cIfFlowStatEntry (with OID 1.3.6.1.4.1.25506.2.40.2.1.2.1.1), and hh3cIfHCFlowStatEntry (with OID 1.3.6.1.4.1.25506.2.40.2.1.2.3.1).
· The data length of the interface traffic statistics nodes in the ifEntry table is 32 bits, and the data length of some nodes in the ifXEntry table are 64 bits. Therefore, the interface traffic statistics nodes of the ifEntry table might have data overflow in collecting interface traffic statistics. The interface traffic statistics nodes of the ifXEntry table do not have data overflow issues. The nodes in the ifEntry table and the ifXEntry table are not completely identical, but they have some overlapping nodes. If target data can be found in the ifXEntry table, use the data in the ifXEntry table. If the data cannot be found in the ifXEntry table, check the ifEntry table.
· You can use the nodes in the following tables to obtain different traffic statistics: ifEntry, ifXEntry, hh3cIfFlowStatEntry, and hh3cIfHCFlowStatEntry. For more information about the ifEntry, ifXEntry, hh3cIfFlowStatEntry, hh3cIfHCFlowStatEntry, and hh3cIfHCFlowStatEntry tables, see the MIB references for your device.
Procedure
# Create Layer 3 aggregate interface Route-Aggregation 2.
<H3C> sys-view
[H3C] interface route-aggregation 2
# Assign interfaces HundredGigE 1/0/25 through HundredGigE 1/0/27 to aggregation group 2.
[H3C] interface hundredgige 1/0/25
[H3C-HundredGigE1/0/25] port link-aggregation group 2
[H3C] interface hundredgige 1/0/26
[H3C-HundredGigE1/0/26] port link-aggregation group 2
[H3C] interface hundredgige 1/0/27
[H3C-HundredGigE1/0/27] port link-aggregation group 2
# Configure SNMP. For more information, see "Procedure."
Example: Obtain traffic statistics
|
|
NOTE: · To obtain traffic statistics for an interface, you must first obtain the index of the interface, and then use the index to obtain traffic statistics for the interface. · The interface index might vary by the ID of the IRF member device hosting the interface. · This example obtains inbound traffic statistics for the Route-Aggregation 2 interface from the ifXTable table through the MIB browser. |
# Use the ifDescr node (1.3.6.1.2.1.2.2.1.2) to obtain the index of the Route-Aggregation 2 interface. The query results dialog box shows that the index is 2180 for interface Route-Aggregation 2, as shown in Figure 31.
Figure 31 Obtaining the interface index
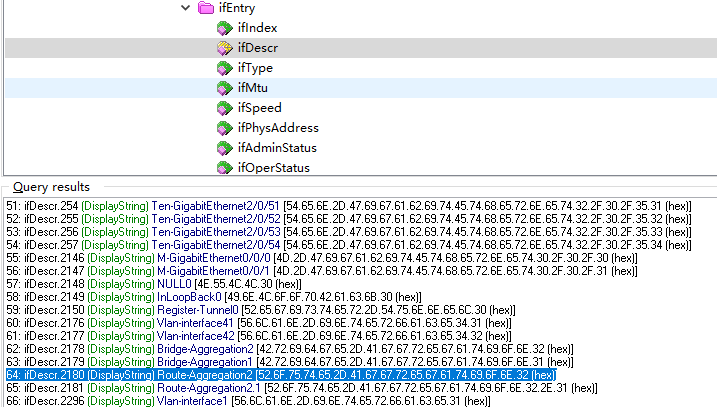
# As shown in Figure 32, use the ifInOctets table (with OID 1.3.6.1.2.1.2.2.1.10) to obtain the inbound traffic statistics (in bytes) of interface Route-Aggregation 2. The query results dialog box shows the query results.
Figure 32 Obtain traffic statistics
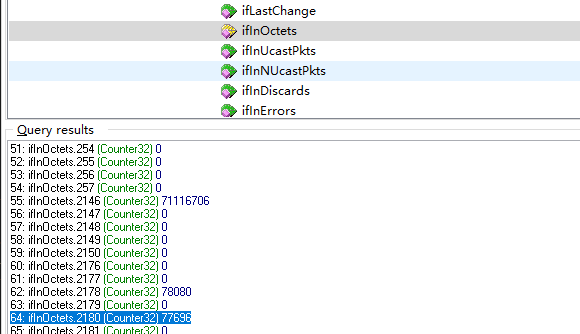
Learn more
For more information about configuring SNMP, see SNMP configuration in the configuration guides for your device.
For more information about MIB files, see the MIB references for your device.
NETCONF
Task
Install the NETCONF client software on the host, and use NETCONF to obtain traffic statistics for Layer 3 aggregate interface Route-Aggregation 2 on the device named Agent.
Figure 33 Network diagram for SNMP

|
|
NOTE: The NETCONF client obtains interface traffic statistics through the NETCONF XML APIs provided by the device. |
Restrictions and guidelines
The device does not distinguish between IPv4 and IPv6 packets when collecting traffic statistics for Layer 3 aggregate interfaces.
Procedure
# Create Layer 3 aggregate interface Route-Aggregation 2.
<H3C> sys-view
[H3C] interface route-aggregation 2
# Assign interfaces HundredGigE 1/0/25 through HundredGigE 1/0/27 to aggregation group 2.
[H3C] interface hundredgige 1/0/25
[H3C-HundredGigE1/0/25] port link-aggregation group 2
[H3C] interface hundredgige 1/0/26
[H3C-HundredGigE1/0/26] port link-aggregation group 2
[H3C] interface hundredgige 1/0/27
[H3C-HundredGigE1/0/27] port link-aggregation group 2
Configure NETCONF. For more information, see "Procedure."
Example: Obtain traffic statistics
|
|
NOTE: · Use the Ifmgr/Statistics table to obtain interface traffic statistics in both bytes and packets, including statistics for unicast packets, non-unicast packets, unknown packets, discarded packets, and other types of packets. · The following procedure uses the Ifmgr/Statistics table to obtain the traffic statistics for Route-Aggregation 2. The procedure is similar if you use the IPFW/IPStatistic table. For more information about the Ifmgr/Statistics and IPFW/IPStatistic tables, see the NETCONF XML structure. |
# Obtain the interface index.
[H3C-probe]display system internal ifmgr list | in Route-Aggregation2
Route-Aggregation2(index:2180)
# Copy and paste the following message to the NETCONF client.
<rpc message-id="100" xmlns="urn:ietf:params:xml:ns:netconf:base:1.0">
<get-bulk>
<filter type="subtree">
<top xmlns="http://www.h3c.com/netconf/data:1.0">
<Ifmgr>
<Statistics>
<Interface>
<IfIndex>2180</IfIndex>
<Name>Route-Aggregation2</Name>
<AbbreviatedName></AbbreviatedName>
<InOctets></InOctets>
<InUcastPkts></InUcastPkts>
<InNUcastPkts></InNUcastPkts>
<InDiscards></InDiscards>
<InErrors></InErrors>
<InUnknownProtos></InUnknownProtos>
<InRate></InRate>
<OutOctets></OutOctets>
<OutUcastPkts></OutUcastPkts>
<OutNUcastPkts></OutNUcastPkts>
<OutDiscards></OutDiscards>
<OutErrors></OutErrors>
<OutRate></OutRate>
<LastClear></LastClear>
</Interface>
</Statistics>
</Ifmgr>
</top>
</filter>
</get-bulk>
</rpc>
# If the client receives a message like the following, it indicates that the operation was successful.
<rpc-reply message-id="100" xmlns="urn:ietf:params:xml:ns:netconf:base:1.0">
<data>
<top xmlns="http://www.h3c.com/netconf/data:1.0">
<Ifmgr>
<Statistics>
<Interface>
<IfIndex>2180</IfIndex>
<Name>Route-Aggregation2</Name>
<AbbreviatedName>RAGG2</AbbreviatedName>
<InOctets>77696</InOctets>
<InUcastPkts>603</InUcastPkts>
<InNUcastPkts>8</InNUcastPkts>
<InDiscards>0</InDiscards>
<InErrors>0</InErrors>
<InUnknownProtos>0</InUnknownProtos>
<InRate>0</InRate>
<OutOctets>78912</OutOctets>
<OutUcastPkts>605</OutUcastPkts>
<OutNUcastPkts>22</OutNUcastPkts>
<OutDiscards>0</OutDiscards>
<OutErrors>0</OutErrors>
<OutRate>0</OutRate>
<LastClear>0000-00-00T00:00:00</LastClear>
</Interface>
</Statistics>
</Ifmgr>
</top>
</data>
</rpc-reply>
Learn more
For more information about configuring NETCONF, see NETCONF configuration in the configuration guides for your device.
For more information about the Ifmgr/Statistics and IPFW/IPStatistic tables, see H3C Comware 7 NETCONF XML API Reference.
gRPC
Task
Use a collector to obtain traffic statistics for Layer 3 aggregate interface Route-Aggregation 2 on the device by using gRPC.
Figure 34 Network diagram for gRPC

Restrictions and guidelines
The device does not distinguish between IPv4 and IPv6 packets when collecting traffic statistics for Layer 3 aggregate interfaces.
Procedure
# Create Layer 3 aggregate interface Route-Aggregation 2.
<H3C> sys-view
[H3C] interface route-aggregation 2
# Assign interfaces HundredGigE 1/0/25 through HundredGigE 1/0/27 to aggregation group 2.
[H3C] interface hundredgige 1/0/25
[H3C-HundredGigE1/0/25] port link-aggregation group 2
[H3C] interface hundredgige 1/0/26
[H3C-HundredGigE1/0/26] port link-aggregation group 2
[H3C] interface hundredgige 1/0/27
[H3C-HundredGigE1/0/27] port link-aggregation group 2
[H3C-HundredGigE1/0/27] quit
# See "Procedure" for detailed configuration procedure.
Obtain traffic statistics
The collector receives interface traffic statistics pushed by the device every 30 seconds.
Learn more
For more information about configuring gRPC, see gRPC configuration in the configuration guides for your device.
Collecting Layer 3 aggregate subinterface traffic statistics
CLI
Task
Obtain the traffic statistics for Layer 3 aggregate subinterface Route-Aggregation 2.1.
Restrictions and guidelines
This task is supported only in Release 6635 and later.
Procedure
# Create Layer 3 aggregate interface Route-Aggregation 2.
<H3C> sys-view
[H3C] interface route-aggregation 2
[H3C-Route-Aggregation2] quit
# Create Layer 3 aggregate subinterface Route-Aggregation 2.1.
[H3C] interface route-aggregation 2.1
Example: Obtain traffic statistics
# Obtain the traffic statistics for Layer 3 aggregate subinterface Bridge-Aggregation 2.1.
[H3C]display interface route-aggregation 2.1
Route-Aggregation2.1
........
Input (total): 416 packets, 54258 bytes
Output (total): 400 packets, 52800 bytes
Table 12 Command output
|
Field |
Description |
|
Bridge-Aggregation2.1 |
Layer 2 aggregate subinterface name. |
|
Input |
Statistics of all packets received on the interface. |
|
output |
Statistics of all normal packets sent on the interface. |
SNMP
Task
Use an NMS to obtain the inbound traffic statistics for subinterface Route-Aggregation 2.1 through SNMP.
Figure 35 Network diagram for SNMP

Restrictions and guidelines
For more information about the ifEntry table, see the MIB references for your device.
For the S6850, S9850, S6805, and S6825 switch series and S9820-64H switch, only Release 6635 and later supports collecting outbound traffic statistics for Layer 3 aggregate subinterfaces.
The device does when the not distinguish between IPv4 and IPv6 packets when collecting traffic statistics for Layer 3 aggregate subinterfaces.
Procedure
# Create Layer 3 aggregate interface Route-Aggregation 2.
<H3C> sys-view
[H3C] interface route-aggregation 2
[H3C-Route-Aggregation2] quit
# Assign interfaces HundredGigE 1/0/25 through HundredGigE 1/0/27 to aggregation group 2.
[H3C] interface hundredgige 1/0/25
[H3C-HundredGigE1/0/25] port link-aggregation group 2
[H3C] interface hundredgige 1/0/26
[H3C-HundredGigE1/0/26] port link-aggregation group 2
[H3C] interface hundredgige 1/0/27
[H3C-HundredGigE1/0/27] port link-aggregation group 2
# Create Layer 3 aggregate subinterface Route-Aggregation 2.1.
[H3C-Route-Aggregation2] interface route-aggregation 2.1
[H3C-Route-Aggregation2] quit
# Configure SNMP. For more information, see "Procedure."
Example: Obtain traffic statistics
|
|
NOTE: · To obtain traffic statistics for an interface, you must first obtain the index of the interface, and then use the index to obtain traffic statistics for the interface. · The interface index might vary by the ID of the IRF member device hosting the interface. · This example obtains inbound traffic statistics for the Route-Aggregation 2.1 subinterface from the ifEntry table through the MIB browser. |
# Use the ifDescr node (1.3.6.1.2.1.2.2.1.2) to obtain the index of the Route-Aggregation 2.1 subinterface. The query results dialog box shows that the index is 2181 for subinterface Route-Aggregation 2.1, as shown in Figure 36.
Figure 36 Obtaining the interface index
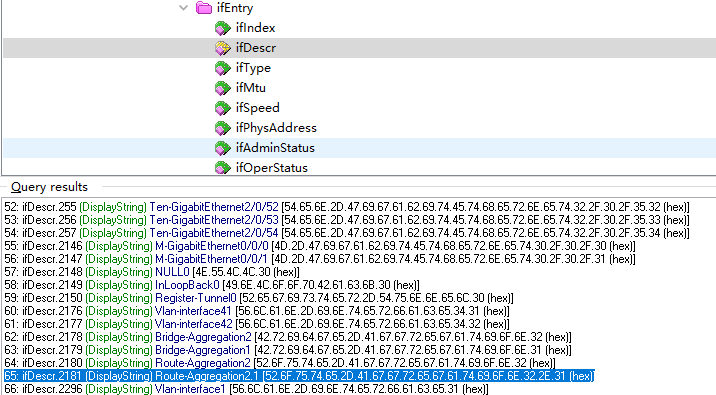
# As shown in Figure 37, use the ifInOctets table (with OID 1.3.6.1.2.1.2.2.1.10) to obtain the inbound traffic statistics (in bytes) of subinterface Route-Aggregation 2.1. The query results dialog box shows the query results.
Figure 37 Obtain traffic statistics
Learn more
For more information about configuring SNMP, see SNMP configuration in the configuration guides for your device.
For more information about MIB files, see the MIB references for your device.
NETCONF
Task
Install the NETCONF client software on the host, and use NETCONF to obtain traffic statistics for Layer 3 aggregate subinterface Route-Aggregation 2.1 on the device named Agent.
Figure 38 Network diagram for SNMP

Restrictions and guidelines
· The NETCONF client obtains interface traffic statistics through the NETCONF XML APIs provided by the device.
· For the S6850, S9850, S6805, and S6825 switch series and S9820-64H switch, only Release 6635 and later supports collecting outbound traffic statistics for Layer 3 aggregate subinterfaces.
· The device does when the not distinguish between IPv4 and IPv6 packets when collecting traffic statistics for Layer 3 aggregate subinterfaces.
Procedure
# Create Layer 3 aggregate interface Route-Aggregation 2.
<H3C> sys-view
[H3C] interface route-aggregation 2
[H3C-Route-Aggregation2] quit
# Assign interfaces HundredGigE 1/0/25 through HundredGigE 1/0/27 to aggregation group 2.
[H3C] interface hundredgige 1/0/25
[H3C-HundredGigE1/0/25] port link-aggregation group 2
[H3C] interface hundredgige 1/0/26
[H3C-HundredGigE1/0/26] port link-aggregation group 2
[H3C] interface hundredgige 1/0/27
[H3C-HundredGigE1/0/27] port link-aggregation group 2
# Create Layer 3 aggregate subinterface Route-Aggregation 2.1.
[H3C-Route-Aggregation2] interface route-aggregation 2.1
[H3C-Route-Aggregation2] quit
Configure NETCONF. For more information, see "Procedure."
Example: Obtain traffic statistics
|
|
NOTE: · Use the Ifmgr/Statistics table to obtain interface traffic statistics in both bytes and packets, including statistics for unicast packets, non-unicast packets, unknown packets, discarded packets, and other types of packets. · The following procedure uses the Ifmgr/Statistics table to obtain the traffic statistics for Route-Aggregation 2. The procedure is similar if you use the IPFW/IPStatistic table. For more information about the Ifmgr/Statistics and IPFW/IPStatistic tables, see the NETCONF XML structure. |
# Obtain the interface index.
[H3C-probe]dis system internal ifmgr list | in Route-Aggregation2.1
|--------Route-Aggregation2.1(index:2181)
# Copy and paste the following message to the NETCONF client.
<rpc message-id="100" xmlns="urn:ietf:params:xml:ns:netconf:base:1.0">
<get-bulk>
<filter type="subtree">
<top xmlns="http://www.h3c.com/netconf/data:1.0">
<Ifmgr>
<Statistics>
<Interface>
<IfIndex>2181</IfIndex>
<Name>Route-Aggregation2.1</Name>
<AbbreviatedName></AbbreviatedName>
<InOctets></InOctets>
<InUcastPkts></InUcastPkts>
<InNUcastPkts></InNUcastPkts>
<InDiscards></InDiscards>
<InErrors></InErrors>
<InUnknownProtos></InUnknownProtos>
<InRate></InRate>
<OutOctets></OutOctets>
<OutUcastPkts></OutUcastPkts>
<OutNUcastPkts></OutNUcastPkts>
<OutDiscards></OutDiscards>
<OutErrors></OutErrors>
<OutRate></OutRate>
<LastClear></LastClear>
</Interface>
</Statistics>
</Ifmgr>
</top>
</filter>
</get-bulk>
</rpc>
# If the client receives a message like the following, it indicates that the operation was successful.
<rpc-reply message-id="100" xmlns="urn:ietf:params:xml:ns:netconf:base:1.0">
<data>
<top xmlns="http://www.h3c.com/netconf/data:1.0">
<Ifmgr>
<Statistics>
<Interface>
<IfIndex>2181</IfIndex>
<Name>Route-Aggregation2.1</Name>
<AbbreviatedName>RAGG2.1</AbbreviatedName>
<InOctets>80256</InOctets>
<InUcastPkts>613</InUcastPkts>
<InNUcastPkts>0</InNUcastPkts>
<InDiscards>18446744073709551615</InDiscards>
<InErrors>18446744073709551615</InErrors>
<InUnknownProtos>18446744073709551615</InUnknownProtos>
<InRate>80256</InRate>
<OutOctets>0</OutOctets>
<OutUcastPkts>0</OutUcastPkts>
<OutNUcastPkts>0</OutNUcastPkts>
<OutDiscards>18446744073709551615</OutDiscards>
<OutErrors>18446744073709551615</OutErrors>
<OutRate>0</OutRate>
<LastClear>0000-00-00T00:00:00</LastClear>
</Interface>
</Statistics>
</Ifmgr>
</top>
</data>
</rpc-reply>
Learn more
For more information about configuring NETCONF, see NETCONF configuration in the configuration guides for your device.
For more information about the Ifmgr/Statistics and IPFW/IPStatistic tables, see H3C Comware 7 NETCONF XML API Reference.
gRPC
Task
Use a collector to obtain traffic statistics for Layer 3 aggregate subinterface Route-Aggregation 2.1 on the device by using gRPC.
Figure 39 Network diagram for gRPC

Restrictions and guidelines
For the S6850, S9850, S6805, and S6825 switch series and S9820-64H switch, only Release 6635 and later supports collecting outbound traffic statistics for Layer 3 aggregate subinterfaces.
The device does when the not distinguish between IPv4 and IPv6 packets when collecting traffic statistics for Layer 3 aggregate subinterfaces.
Procedure
# Create Layer 3 aggregate interface Route-Aggregation 2.
<H3C> sys-view
[H3C] interface route-aggregation 2
[H3C-Route-Aggregation2] quit
# Assign interfaces HundredGigE 1/0/25 through HundredGigE 1/0/27 to aggregation group 2.
[H3C] interface hundredgige 1/0/25
[H3C-HundredGigE1/0/25] port link-aggregation group 2
[H3C] interface hundredgige 1/0/26
[H3C-HundredGigE1/0/26] port link-aggregation group 2
[H3C] interface hundredgige 1/0/27
[H3C-HundredGigE1/0/27] port link-aggregation group 2
# Create Layer 3 aggregate subinterface Route-Aggregation 2.1.
[H3C-Route-Aggregation2] interface route-aggregation 2.1
[H3C-Route-Aggregation2] quit
# Configure IP addresses as required so the device and the collector can reach each other. (Details not shown.)
# Enable gRPC.
[H3C] grpc enable
# Create a sensor group named test, and add sensor path Ifmgr/Statistics to it.
|
|
NOTE: After sensor path Ifmgr/Statistics is added, the device will collect traffic statistics for all interfaces and upload the statistics to the collector. |
[H3C] telemetry
[H3C-telemetry] sensor-group test
[H3C-telemetry-sensor-group-test] sensor path ifmgr/statistics
[H3C-telemetry-sensor-group-test] quit
# Create a destination group named collector1 and add a collector to the group. In this example, the collector receives data on port 50050 at IPv4 address 192.168.2.1.
[H3C-telemetry] destination-group collector1
[H3C-telemetry-destination-group-collector1] ipv4-address 192.168.2.1 port 50050
[H3C-telemetry-destination-group-collector1] quit
# Create subscription A, specify sensor group test for the subscription, set the data collection interval to 30 seconds, and specify destination group collector1 for the subscription.
[H3C-telemetry] subscription A
[H3C-telemetry-subscription-A] sensor-group test sample-interval 30
[H3C-telemetry-subscription-A] destination-group collector1
[H3C-telemetry-subscription-A] quit
Obtain traffic statistics
The collector receives interface traffic statistics pushed by the device every 30 seconds.
Learn more
For more information about configuring gRPC, see gRPC configuration in the configuration guides for your device.
Collecting VLAN interface traffic statistics
CLI
Task
Obtain the traffic statistics for VLAN-interface 20.
Restrictions and guidelines
· To obtain the traffic statistics for a VLAN interface, use the display interface command. The device does not distinguish between IPv4 and IPv6 packets when collecting traffic statistics.
· For a Layer 3 interface, unicast, multicast, and broadcast traffic are all counted as unicast packets.
· If subinterfaces are created on a main interface, the traffic statistics for the main interface contains statistics for the traffic forwarded by the subinterfaces.
· If the number of a Layer 3 subinterface same as the number of another Layer 3 subinterface or a VLAN interface's tag, the statistics data will be accumulated in collecting outbound packet statistics. For example, if Ten-GigabitEthernet 1/0/1.3 and Ten-GigabitEthernet 1/0/2.3 or Ten-GigabitEthernet 1/0/1.3 and VLAN-interface 3 exist, VLAN tag 3 is used in the outbound direction for the subinterfaces and VLAN interface. In this case, the statistics for the two interfaces will be accumulated and counted together.
· The outbound traffic statistics for VLAN interfaces only counts Layer 3 packets, and both Layer 2 and Layer 3 packets are counted in the inbound direction.
· To determine whether an interface works correctly within a period by collecting the traffic statistics within that period, first use the reset counters interface command to clear the statistics.
· The reset counters interface command can clear the counters in the output from the display interface command, but does not clear the counters of MIB nodes.
Example: Obtain traffic statistics
# Create VLAN 20.
<H3C> sys-view
[H3C] vlan 20
[H3C-vlan20] quit
# Create VLAN-interface 20.
[H3C] interface vlan-interface 20
# Obtain traffic statistics for VLAN-Interface 20.
[H3C]display interface vlan-interface 20
Vlan-interface20
Current state: UP
Line protocol state: UP
Description: Vlan-interface20 Interface
Bandwidth: 100000000 kbps
Maximum transmission unit: 1500
Internet address: 20.1.1.1/24 (Primary)
IP packet frame type: Ethernet II, hardware address: 00e0-fc00-6846
IPv6 packet frame type: Ethernet II, hardware address: 00e0-fc00-6846
Last clearing of counters: Never
Input (total): 63 packets, 7872 bytes
Output (total): 30 packets, 3840 bytes
Table 13 Command output
|
Field |
Description |
|
Bridge-Aggregation1 |
Layer 2 aggregate interface name. |
|
Last clearing of counters |
Time when the reset counters interface command was last used to clear the interface statistics. This field displays Never if the reset counters interface command has never been used on the interface since device startup. |
|
Last 300 seconds input rate |
Average input rate over the last 300 seconds. |
|
Last 300 seconds output rate |
Average output rate over the last 300 seconds. |
|
Input/Output (total) |
Statistics of all packets received or sent on the interface. |
|
Input/Output (normal) |
Statistics of all normal packets received or sent on the interface. |
SNMP
Task
Use an NMS to obtain the inbound traffic statistics for interface VLAN-interface 2 through SNMP.
Figure 40 Network diagram for SNMP

Restrictions and guidelines
· Interfaces traffic statistics collection is performed by using the ifEntry (with OID 1.3.6.1.2.1.2.2.1) and ifXEntry (with OID 1.3.6.1.2.1.31.1.1) tables. The device does when the not distinguish between IPv4 and IPv6 packets when collecting traffic statistics for VLAN interfaces.
· The data length of the interface traffic statistics nodes in the ifEntry table is 32 bits, and the data length of some nodes in the ifXEntry table are 64 bits. Therefore, the interface traffic statistics nodes of the ifEntry table might have data overflow in collecting interface traffic statistics. The interface traffic statistics nodes of the ifXEntry table do not have data overflow issues. The nodes in the ifEntry table and the ifXEntry table are not completely identical, but they have some overlapping nodes. If target data can be found in the ifXEntry table, use the data in the ifXEntry table. If the data cannot be found in the ifXEntry table, check the ifEntry table.
· You can use the nodes in the ifEntry and ifXEntry tables to obtain different traffic statistics. For more information about the ifEntry and ifXEntry tables, see the MIB references for your device.
Procedure
# Create VLAN 20.
<H3C> sys-view
[H3C] vlan 20
[H3C-vlan20] quit
# Create VLAN-interface 20.
[H3C] interface vlan-interface 20
# Configure SNMP. For more information, see "Procedure."
Example: Obtain traffic statistics
|
|
NOTE: · To obtain traffic statistics for an interface, you must first obtain the index of the interface, and then use the index to obtain traffic statistics for the interface. · A main interface and its subinterfaces use unique indexes. You must obtain the index of the target interface or subinterface. · The interface index might vary by the ID of the IRF member device hosting the interface. · This example obtains inbound traffic statistics for the VLAN-interface 20 interface from the ifXTable table through the MIB browser.
|
# Use the ifDescr node (1.3.6.1.2.1.2.2.1.2) to obtain the index of the VLAN-interface 20 interface. The query results dialog box shows that the index is 2180 for interface VLAN-interface 20, as shown in Figure 41.
Figure 41 Obtaining the interface index
# As shown in Figure 42, use the ifInOctets table (with OID 1.3.6.1.2.1.2.2.1.10) to obtain the inbound traffic statistics (in bytes) of VLAN-interface 20.
Figure 42 Obtain traffic statistics
Learn more
For more information about configuring SNMP, see SNMP configuration in the configuration guides for your device.
For more information about MIB files, see the MIB references for your device.
NETCONF
Task
Install the NETCONF client software on the host, and use NETCONF to obtain traffic statistics for VLAN-interface 20 on the device named Agent.
Figure 43 Network diagram for SNMP

|
|
NOTE: The NETCONF client obtains interface traffic statistics through the NETCONF XML APIs provided by the device. |
Procedure
# Create VLAN 20.
<H3C> sys-view
[H3C] vlan 20
[H3C-vlan20] quit
# Create VLAN-interface 20.
[H3C] interface vlan-interface 20
Configure NETCONF. For more information, see "Procedure."
Example: Obtain traffic statistics
|
|
NOTE: · The device provides the Ifmgr/Statistics and IPFW/IPStatistic tables for collecting interface traffic statistics. Use the Ifmgr/Statistics table to obtain interface traffic statistics in both bytes and packets, including statistics for unicast packets, non-unicast packets, unknown packets, discarded packets, and other types of packets. Use the IPFW/IPStatistic table to obtain interface traffic statistics about IPv4 or IPv6 packets in packets. The device does when the not distinguish between IPv4 and IPv6 packets when collecting traffic statistics for VLAN interfaces. · The following procedure uses the Ifmgr/Statistics table to obtain the traffic statistics for Bridge-Aggregation 2. The procedure is similar if you use the IPFW/IPStatistic table. For more information about the Ifmgr/Statistics and IPFW/IPStatistic tables, see the NETCONF XML structure. |
# Obtain the interface index.
[H3C] probe
[H3C-probe]dis system internal ifmgr list | include vlan-interface20
Vlan-interface20(index:2180)
# Copy and paste the following message to the NETCONF client.
<rpc message-id="100" xmlns="urn:ietf:params:xml:ns:netconf:base:1.0">
<get-bulk>
<filter type="subtree">
<top xmlns="http://www.h3c.com/netconf/data:1.0">
<Ifmgr>
<Statistics>
<Interface>
<IfIndex>2180</IfIndex>
<Name></Name>
<AbbreviatedName></AbbreviatedName>
<InOctets></InOctets>
<InUcastPkts></InUcastPkts>
<InNUcastPkts></InNUcastPkts>
<InDiscards></InDiscards>
<InErrors></InErrors>
<InUnknownProtos></InUnknownProtos>
<InRate></InRate>
<OutOctets></OutOctets>
<OutUcastPkts></OutUcastPkts>
<OutNUcastPkts></OutNUcastPkts>
<OutDiscards></OutDiscards>
<OutErrors></OutErrors>
<OutRate></OutRate>
<LastClear></LastClear>
</Interface>
</Statistics>
</Ifmgr>
</top>
</filter>
</get-bulk>
</rpc>
# If the client receives a message like the following, it indicates that the operation was successful.
<rpc-reply message-id="100" xmlns="urn:ietf:params:xml:ns:netconf:base:1.0">
<data>
<top xmlns="http://www.h3c.com/netconf/data:1.0">
<Ifmgr>
<Statistics>
<Interface>
<IfIndex>2180</IfIndex>
<Name>Vlan-interface20</Name>
<AbbreviatedName>Vlan20</AbbreviatedName>
<InOctets>8000</InOctets>
<InUcastPkts>65</InUcastPkts>
<InNUcastPkts>0</InNUcastPkts>
<InDiscards>0</InDiscards>
<InErrors>0</InErrors>
<InUnknownProtos>0</InUnknownProtos>
<InRate>8000</InRate>
<OutOctets>3840</OutOctets>
<OutUcastPkts>30</OutUcastPkts>
<OutNUcastPkts>0</OutNUcastPkts>
<OutDiscards>0</OutDiscards>
<OutErrors>0</OutErrors>
<OutRate>3840</OutRate>
<LastClear>0000-00-00T00:00:00</LastClear>
</Interface>
</Statistics>
</Ifmgr>
</top>
</data>
</rpc-reply>
Learn more
For more information about configuring NETCONF, see NETCONF configuration in the configuration guides for your device.
For more information about the Ifmgr/Statistics tables, see H3C Comware 7 NETCONF XML API Reference.
gRPC
Task
Use a collector to obtain traffic statistics for VLAN-interface 20 on the device by using gRPC.
Figure 44 Network diagram for gRPC

|
|
NOTE: The device does when the not distinguish between IPv4 and IPv6 packets when collecting traffic statistics for VLAN interfaces. |
Procedure
# Configure IP addresses as required so the device and the collector can reach each other. (Details not shown.)
# Create VLAN 20.
<H3C> sys-view
[H3C] vlan 20
[H3C-vlan20] quit
# Create VLAN-interface 20.
[H3C] interface vlan-interface 20
[H3C-Vlan-interface20] quit
# See "Procedure" for detailed configuration procedure.
Obtain traffic statistics
The collector receives interface traffic statistics pushed by the device every 30 seconds.
Learn more
For more information about configuring gRPC, see gRPC configuration in the configuration guides for your device.
Collecting dropped packet statistics of an interface through MQC
Requirements
Configure MQC to obtain statistics of packets dropped by CAR on an interface.
|
|
NOTE: If you have configured both CAR through MQC and queue scheduling profiles in the outbound direction of an interface, the device processes the traffic first based on queue scheduling profiles and then based on CAR. Therefore, even if some packets are colored red and dropped by CAR, these packets still occupy the scheduling bandwidth in the queue scheduling profiles. |
CLI
Task
Obtain the statistics of packets dropped by CAR on interface HundredGigE 1/0/30.
Procedure
# Configure traffic class car to match all traffic.
<H3C> sys-view
[H3C] traffic classifier car
[H3C-classifier-car] if-match any
[H3C-classifier-car] quit
# Create traffic behavior car. Configure traffic policing (CAR) in the traffic behavior, and set the committed information rate (CIR) to 10000 kbps and committed burst size (CBS) to 625152 bytes.
[H3C]traffic behavior car
[H3C-behavior-car] car cir 10000 cbs 625152
[H3C-behavior-car] quit
# Create a QoS policy, and associate traffic class car with traffic behavior car in the QoS policy.
[H3C]qos policy car
[H3C-qospolicy-car] classifier car behavior car
[H3C-qospolicy-car] quit
# Apply the QoS policy to the outbound direction of interface HundredGigE 1/0/30.
[H3C] interface hundredgige 1/0/30
[H3C-HundredGigE1/0/30] qos apply policy car outbound
[H3C-HundredGigE1/0/30] quit
Obtain traffic statistics
# Obtain the statistics of packets dropped by CAR on interface HundredGigE 1/0/30.
[H3C]display qos policy interface hundredgige1/0/30
Interface: HundredGigE1/0/30
Direction: Inbound
Policy: car
Classifier: car
Operator: AND
Rule(s) :
If-match any
Behavior: car
Committed Access Rate:
CIR 10000 (kbps), CBS 625152 (Bytes), EBS 0 (Bytes)
Green action : pass
Yellow action : pass
Red action : discard
Green packets : 208137 (Packets) 26656384 (Bytes)
Yellow packets: 0 (Packets) 0 (Bytes)
Red packets : 43306977 (Packets) 5543306496 (Bytes)
SNMP
Task
Use an NMS to obtain statistics of packets dropped by CAR on interface HundredGigE 1/0/30 through SNMP.
Figure 45 Network diagram for SNMP

Procedure
Configure CAR-based traffic management. For more information, see "Procedure."
Configure SNMP. For more information, see "Procedure."
Example: Obtain traffic statistics
|
|
NOTE: This example uses the MIB browser to obtain the statistics of packets dropped by CAR on interface HundredGigE 1/0/30 of the device named Agent. |
# As shown in Figure 46, use the ifDescr node (1.3.6.1.2.1.2.2.1.2) to obtain the index of the Ethernet interface. The query results dialog box shows that the index is 50 for interface HundredGigE 1/0/30.
Figure 46 Obtaining the interface index

# Obtain the index of the QoS policy applied to the interface by the interface index in the hh3cCBQoSIntApplyObjectIndex table with OID 1.3.6.1.4.1.25506.2.65.2.1.5.5.2.1.2. As shown in Figure 47, the index of the QoS policy applied to interface HundredGigE 1/0/30 is 5.
Figure 47 Obtaining the index of a QoS policy applied to an interface

# Obtain the statistics of packets dropped by CAR on interface HundredGigE 1/0/30 through the hh3cCBQoSCarRunInfoEntry table with OID 1.3.6.1.4.1.25506.2.65.2.1.5.6.3.1.
Figure 48 Statistics of packets dropped by CAR
Learn more
For more information about configuring SNMP, see SNMP configuration in the configuration guides for your device.
For more information about MIB files, see the MIB references for your device.
NETCONF
Task
Install the NETCONF client software on the host, and use NETCONF to obtain queue buffer traffic statistics of interface HGE 1/0/30 on the device named Agent.
Figure 49 Network diagram for SNMP

|
|
NOTE: The NETCONF client obtains interface traffic statistics through the NETCONF XML APIs provided by the device. |
Procedure
Configure NETCONF. For more information, see "Procedure."
Example: Obtain traffic statistics
|
|
NOTE: The device provides the QSTAT/QueueStat table for collecting interface queue traffic statistics. You can obtain statistics in bytes or packets by using the QSTAT/InterfaceStat table. |
This example uses the QSTAT/InterfaceStat table to obtain statistics of interface HundredGigE 1/0/30.
# Execute the display system internal ifmgr list | include HundredGigE1/0/30 command in probe view on the device to obtain the index of interface HundredGigE 1/0/30.
<H3C> sys-view
[H3C] probe
[H3C-probe]display system internal ifmgr list | include HundredGigE1/0/30
HundredGigE1/0/30(index:50)
# Copy and paste the following message to the NETCONF client.
<rpc message-id="100" xmlns="urn:ietf:params:xml:ns:netconf:base:1.0">
<get-bulk>
<filter type="subtree">
<top xmlns="http://www.h3c.com/netconf/data:1.0">
<QSTAT>
<InterfaceStat>
<Statistics>
<IfIndex>50</IfIndex>
<Direction></Direction>
<QueueID></QueueID>
<PassPkt></PassPkt>
<PassByte></PassByte>
<DropPkt></DropPkt>
<DropByte></DropByte>
<PacketRate></PacketRate>
<BitRate></BitRate>
<PeakPacketRate></PeakPacketRate>
<PeakBitRate></PeakBitRate>
<TotalQueLen></TotalQueLen>
<CurrQueLen></CurrQueLen>
<QueUseRatio></QueUseRatio>
</Statistics>
</InterfaceStat>
</QSTAT>
</top>
</filter>
</get-bulk>
</rpc>
# If the client receives a message like the following, it indicates that the operation was successful.
<rpc-reply message-id="100" xmlns="urn:ietf:params:xml:ns:netconf:base:1.0">
<data>
<top xmlns="http://www.h3c.com/netconf/data:1.0">
<QSTAT>
<QueueStat>
<Statistics>
<IfIndex>50</IfIndex>
<Direction>1</Direction>
<QueueID>0</QueueID>
<PassPkt>0</PassPkt>
<PassByte>0</PassByte>
<DropPkt>0</DropPkt>
<DropByte>0</DropByte>
<PacketRate>0</PacketRate>
<BitRate>0</BitRate>
<CurrQueLen>0</CurrQueLen>
</Statistics>
<Statistics>
<IfIndex>50</IfIndex>
<Direction>1</Direction>
<QueueID>1</QueueID>
<PassPkt>0</PassPkt>
<PassByte>0</PassByte>
<DropPkt>0</DropPkt>
<DropByte>0</DropByte>
<PacketRate>0</PacketRate>
<BitRate>0</BitRate>
<CurrQueLen>0</CurrQueLen>
</Statistics>
<Statistics>
<IfIndex>50</IfIndex>
<Direction>1</Direction>
<QueueID>2</QueueID>
<PassPkt>3983693702452</PassPkt>
<PassByte>533804491661232</PassByte>
<DropPkt>2705999003341</DropPkt>
<DropByte>346367872427648</DropByte>
<PacketRate>11260285</PacketRate>
<BitRate>11528004744</BitRate>
<CurrQueLen>2</CurrQueLen>
</Statistics>
<Statistics>
<IfIndex>50</IfIndex>
<Direction>1</Direction>
<QueueID>3</QueueID>
<PassPkt>0</PassPkt>
<PassByte>0</PassByte>
<DropPkt>0</DropPkt>
<DropByte>0</DropByte>
<PacketRate>0</PacketRate>
<BitRate>0</BitRate>
<CurrQueLen>0</CurrQueLen>
</Statistics>
<Statistics>
<IfIndex>50</IfIndex>
<Direction>1</Direction>
<QueueID>4</QueueID>
<PassPkt>0</PassPkt>
<PassByte>0</PassByte>
<DropPkt>0</DropPkt>
<DropByte>0</DropByte>
<PacketRate>0</PacketRate>
<BitRate>0</BitRate>
<CurrQueLen>0</CurrQueLen>
</Statistics>
<Statistics>
<IfIndex>50</IfIndex>
<Direction>1</Direction>
<QueueID>5</QueueID>
<PassPkt>0</PassPkt>
<PassByte>0</PassByte>
<DropPkt>0</DropPkt>
<DropByte>0</DropByte>
<PacketRate>0</PacketRate>
<BitRate>0</BitRate>
<CurrQueLen>0</CurrQueLen>
</Statistics>
<Statistics>
<IfIndex>50</IfIndex>
<Direction>1</Direction>
<QueueID>6</QueueID>
<PassPkt>0</PassPkt>
<PassByte>0</PassByte>
<DropPkt>0</DropPkt>
<DropByte>0</DropByte>
<PacketRate>0</PacketRate>
<BitRate>0</BitRate>
<CurrQueLen>0</CurrQueLen>
</Statistics>
<Statistics>
<IfIndex>50</IfIndex>
<Direction>1</Direction>
<QueueID>7</QueueID>
<PassPkt>314548</PassPkt>
<PassByte>39913188</PassByte>
<DropPkt>0</DropPkt>
<DropByte>0</DropByte>
<PacketRate>0</PacketRate>
<BitRate>0</BitRate>
<CurrQueLen>0</CurrQueLen>
</Statistics>
</QueueStat>
</QSTAT>
</top>
</data>
</rpc-reply>
Learn more
For more information about configuring NETCONF, see NETCONF configuration in the configuration guides for your device.
For more information about QSTAT/QueueStat, see H3C Comware 7 NETCONF XML API Reference.
gRPC
Task
Use a collector to obtain the queue buffer traffic statistics of interface HGE 1/0/30 on the device through gRPC.
Figure 50 Network diagram for gRPC

Procedure
# Configure IP addresses as required so the device and the collector can reach each other. (Details not shown.)
# Enable gRPC.
<H3C> system-view
[H3C] grpc enable
# Create a sensor group named test, and add sensor path QSTAT/QueueStat.
|
|
NOTE: After sensor path QSTAT/QueueStat is added, the device will collect traffic statistics of all interface queue buffers and upload the statistics to the collector. |
[H3C] telemetry
[H3C-telemetry] sensor-group test
[H3C-telemetry-sensor-group-test] sensor path qstat/queuestat
[H3C-telemetry-sensor-group-test] quit
# Create a destination group named collector1 and add a collector to the group. In this example, the collector receives data on port 50050 at IPv4 address 192.168.2.1.
[H3C-telemetry] destination-group collector1
[H3C-telemetry-destination-group-collector1] ipv4-address 192.168.2.1 port 50050
[H3C-telemetry-destination-group-collector1] quit
# Configure a subscription named A to bind sensor group test with destination group collector1. Set the data sampling interval to 30 seconds.
[H3C-telemetry] subscription A
[H3C-telemetry-subscription-A] sensor-group test sample-interval 30
[H3C-telemetry-subscription-A] destination-group collector1
[H3C-telemetry-subscription-A] quit
Obtain traffic statistics
The collector receives data pushed by the device every 30 seconds.
Learn more
For more information about configuring gRPC, see gRPC configuration in the configuration guides for your device.
Collecting Ethernet interface traffic statistics through MQC
Requirements
Obtain Ethernet interface traffic statistics through MQC.
CLI
Task
Obtain inbound traffic statistics of interface HundredGigE 1/0/30 through MQC.
|
|
NOTE: · The device supports configuring a traffic accounting action by using the accounting [ byte | packet ]* command. · The accounting byte command collects traffic statistics in bytes, while the accounting packet command collects traffic statistics in packets. If neither the byte keyword nor the packet keyword is specified for the accounting command, the device collects traffic statistics in packets. If both the byte and packet keywords are specified for the accounting command, the device collects traffic statistics in packets and bytes. · This example collects traffic statistics in packets. |
Procedure
# Configure traffic class aa to match all traffic.
<H3C> sys-view
[H3C] traffic classifier aa
[H3C-classifier-aa] if-match any
[H3C-classifier-aa] quit
# Configure traffic behavior aa to collect traffic statistics in packets.
[H3C]traffic behavior aa
[H3C-behavior-aa] accounting packet
[H3C-behavior-aa] quit
# Create a QoS policy, and associate traffic class aa with traffic behavior aa in the QoS policy.
[H3C]qos policy aa
[H3C-qospolicy-aa] classifier aa behavior aa
[H3C-qospolicy-aa] quit
# Apply the QoS policy to the inbound direction of interface HundredGigE 1/0/30.
[H3C] interface hundredgige 1/0/30
[H3C-HundredGigE1/0/30] qos apply policy aa inbound
[H3C-HundredGigE1/0/30] quit
Obtain traffic statistics
# Obtain the traffic statistics of interface HundredGigE 1/0/30.
[H3C]dis qos policy interface hun 1/0/30
Interface: HundredGigE1/0/30
Direction: Inbound
Policy: car
Classifier: car
Operator: AND
Rule(s) :
If-match any
Behavior: car
Accounting enable:
29287176 (Packets)
Table 14 Command output
|
Field |
Description |
|
Direction |
Direction in which the QoS policy is applied. |
|
policy |
QoS policy name. |
|
Classifier |
Traffic class name and its contents, which could be of various types. |
|
Operator |
Logical relationship between match criteria. |
|
Rule(s) |
Match criteria. |
|
if-match any |
Matches all packets passing through the interface. |
|
Behavior |
Name and content of the traffic behavior. |
|
Accounting enable |
Traffic accounting action. |
Learn more
For more information about configuring MQC, see QoS configuration and QoS commands for your device.
SNMP
Task
Use an NMS to obtain the inbound traffic statistics of interface HundredGigE 1/0/30 through SNMP.
Figure 51 Network diagram for SNMP

Procedure
Configure MQC to collect traffic statistics of the Ethernet interface. For more information, see "Procedure."
Configure SNMP. For more information, see "Procedure."
Example: Obtain traffic statistics
|
|
NOTE: · To obtain traffic statistics of an Ethernet interface, you must first obtain the index of the Ethernet interface and then use the index to obtain traffic statistics of the Ethernet interface. · The Ethernet interface index might vary by the ID of the IRF member device hosting the interface. · To obtain the traffic statistics of interface HundredGigE 1/0/30, you must first use the ifDescr node (1.3.6.1.2.1.2.2.1.2) to obtain the index of the interface. Then, use the hh3cCBQoSIntApplyObjectIndex table with OID 1.3.6.1.4.1.25506.2.65.2.1.5.5.2.1.2 to obtain the index of the QoS policy applied to the specified interface. Finally, use the index of the QoS policy applied to the specified interface to obtain the traffic statistics of the interface in the subtable of the hh3cCBQoSAccountingRunInfoEntry table with OID 1.3.6.1.4.1.25506.2.65.2.1.5.6.8.1. For more information about the hh3cCBQoSAccountingRunInfoEntry table, see the MIB references for your device. · This example obtains the inbound traffic statistics of the Ethernet interface through the MIB browser. |
As shown in Figure 52, use the ifDescr node (1.3.6.1.2.1.31.1.1.1.1.2) to obtain the index of the Ethernet interface. The query results dialog box shows that the index is 50 for interface HundredGigE 1/0/30.
Figure 52 Obtaining the interface index

# Obtain the index of the QoS policy applied to the interface by the interface index in the hh3cCBQoSIntApplyObjectIndex table with OID 1.3.6.1.4.1.25506.2.65.2.1.5.5.2.1.2. As shown in Figure 53, the index of the QoS policy applied to interface HundredGigE 1/0/30 is 5.
Figure 53 Obtaining the index of a QoS policy applied to an interface
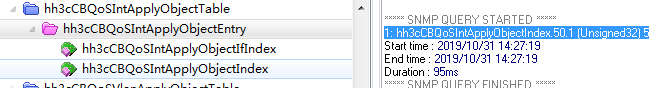
# As shown in Figure 54, use the hh3cCBQoSAccountingRunInfoEntry table (with OID 1.3.6.1.4.1.25506.2.65.2.1.5.6.8.1) to obtain the inbound traffic statistics (in packets) of interface HundredGigE 1/0/30.
Figure 54 Obtain traffic statistics
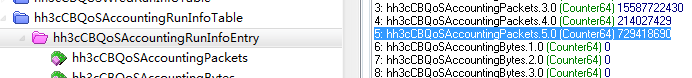
Learn more
For more information about configuring SNMP, see SNMP configuration in the configuration guides for your device.
For more information about MIB files, see the MIB references for your device.
NETCONF
Task
Install the NETCONF client software on the host, and use NETCONF to obtain traffic statistics of Layer 2 Ethernet interface HGE 1/0/30 on the device named Agent.
Figure 55 Network diagram for SNMP

|
|
NOTE: The NETCONF client obtains Ethernet interface traffic statistics through the NETCONF XML APIs provided by the device. |
Procedure
Configure MQC to collect traffic statistics of the Ethernet interface. For more information, see "Procedure."
Configure the device as described in "Procedure."
Example: Obtain traffic statistics
|
|
NOTE: The device provides the MQC/AccountRunInfo table for collecting traffic statistics through MQC. You can obtain statistics in bytes and packets by using the MQC/AccountRunInfo table. |
This example uses the MQC/AccountRunInfo table to obtain statistics of interface HundredGigE 2/0/25.
# Copy and paste the following message to the NETCONF client.
<rpc message-id="100" xmlns="urn:ietf:params:xml:ns:netconf:base:1.0">
<get-bulk>
<filter type="subtree">
<top xmlns="http://www.h3c.com/netconf/data:1.0">
<MQC>
<AccountRunInfo>
<AccountRunInfoEntry>
<AppType></AppType> //MQC application destination: 1 for interface and 2 for VLAN
<AppMainIndex></AppMainIndex> //Main index of the MQC application destination
<AppSubIndex></AppSubIndex> //Subindex of the MQC application destination
<AppDirection></AppDirection> //Direction in which the MQC policy is applied: 1 for inbound and 2 for outbound
<CBMapIndex></CBMapIndex> //Index of the classifier-behavior association
<AccountPkts></AccountPkts> //Traffic statistics in packets
<AccountBytes></AccountBytes> //Traffic statistics in bytes
</AccountRunInfoEntry>
</AccountRunInfo>
</MQC>
</top>
</filter>
</get-bulk>
</rpc>
# If the client receives a message like the following, it indicates that the operation was successful.
<rpc-reply message-id="100" xmlns="urn:ietf:params:xml:ns:netconf:base:1.0">
<data>
<top xmlns="http://www.h3c.com/netconf/data:1.0">
<MQC>
<AccountRunInfo>
<AccountRunInfoEntry>
<AppType>1</AppType>
<AppMainIndex>50</AppMainIndex>
<AppSubIndex>0</AppSubIndex>
<AppDirection>1</AppDirection>
<CBMapIndex>0</CBMapIndex>
<AccountPkts>150</AccountPkts>
</AccountRunInfoEntry>
</AccountRunInfo>
/MQC>
</top>
</data>
</rpc-reply>
Learn more
For more information about configuring NETCONF, see NETCONF configuration in the configuration guides for your device.
For more information about MQC/AccountRunInfo, see H3C Comware 7 NETCONF XML API Reference.
gRPC
Task
Use a collector to obtain traffic statistics of Layer 2 Ethernet interface HGE 2/0/25 on the device by using gRPC.
Figure 56 Network diagram for gRPC

Procedure
# Configure IP addresses as required so the device and the collector can reach each other. (Details not shown.)
# Configure MQC to collect traffic statistics of the Ethernet interface. For more information, see "Procedure."
# Enable gRPC.
<H3C> system-view
[H3C] grpc enable
# Create a sensor group named test, and add sensor path MQC/AccountRunInfo.
|
|
NOTE: After sensor path MQC/AccountRunInfo is added, the device will collect traffic statistics of all interfaces and upload the statistics to the collector. |
[H3C] telemetry
[H3C-telemetry] sensor-group test
[H3C-telemetry-sensor-group-test] sensor path mqc/accountruninfo
[H3C-telemetry-sensor-group-test] quit
# Create a destination group named collector1 and add a collector to the group. In this example, the collector receives data on port 50050 at IPv4 address 192.168.2.1.
[H3C-telemetry] destination-group collector1
[H3C-telemetry-destination-group-collector1] ipv4-address 192.168.2.1 port 50050
[H3C-telemetry-destination-group-collector1] quit
# Configure a subscription named A to bind sensor group test with destination group collector1. Set the data sampling interval to 30 seconds.
[H3C-telemetry] subscription A
[H3C-telemetry-subscription-A] sensor-group test sample-interval 30
[H3C-telemetry-subscription-A] destination-group collector1
[H3C-telemetry-subscription-A] quit
Obtain traffic statistics
The collector receives data pushed by the device every 30 seconds.
Learn more
For more information about configuring gRPC, see gRPC configuration in the configuration guides for your device.
Collecting GRE packet statistics through MQC
Requirements
Obtain GRE packet statistics through MQC.
|
|
NOTE: Before collecting GRE packet statistics through MQC, you must configure traffic classes to use ACLs to match GRE packets, and apply a QoS policy that references the traffic classes to the Ethernet interface through which GRE packets pass. |
CLI
Task
Collect outbound GRE packet statistics for interface HundredGigE 1/0/30 through MQC.
|
|
NOTE: · The device supports configuring a traffic accounting action by using the accounting [ byte | packet ]* command. · The accounting byte command collects traffic statistics in bytes, while the accounting packet command collects traffic statistics in packets. If neither the byte keyword nor the packet keyword is specified for the accounting command, the device collects traffic statistics in packets. If both the byte and packet keywords are specified for the accounting command, the device collects traffic statistics in packets and bytes. · This example collects traffic statistics in packets. |
Restrictions and guidelines
· When applying QoS policies to the devices at both ends of a GRE tunnel for collecting GRE packet statistics, you can only collect GRE packet statistics in the outbound direction of the physical output interface on the source device of GRE packets. You cannot collect GRE packet statistics in the inbound direction of the physical input interface on the destination device of GRE packets.
· When applying QoS policies to the intermediate devices through which the GRE packets of a GRE tunnel pass for collecting GRE packet statistics, you can collect the statistics in both the outbound and inbound directions of the Ethernet interfaces traversed by the tunnel through MQC.
Procedure
# Create advanced ACL 3999 and configure rule 0 to match all GRE packets.
<H3C> system-view
[H3C]acl advanced 3999
[H3C-acl-ipv4-adv-3999]rule 0 permit gre
[H3C-acl-ipv4-adv-3999]quit
# Configure traffic class aa to match ACL 3999.
[H3C] traffic classifier aa
[H3C-classifier-aa] if-match acl 3999
[H3C-classifier-aa] quit
# Configure traffic behavior aa to collect traffic statistics in packets.
[H3C]traffic behavior aa
[H3C-behavior-aa] accounting packet
[H3C-behavior-aa] quit
# Create a QoS policy, and associate traffic class aa with traffic behavior aa in the QoS policy.
[H3C]qos policy aa
[H3C-qospolicy-aa] classifier aa behavior aa
[H3C-qospolicy-aa] quit
# Apply the QoS policy to the outbound direction of HundredGigE 1/0/30 (the physical interface of GRE tunnel Tunnel 0).
[H3C] interface hundredgige 1/0/30
[H3C-HundredGigE1/0/30] qos apply policy aa outbound
[H3C-HundredGigE1/0/30] quit
Example: Obtain traffic statistics
# Obtain traffic statistics for interface HundredGigE 1/0/30.
[H3C] display qos policy interface HundredGigE1/0/30
Interface: HundredGigE1/0/30
Direction: outbound
Policy: aa
Classifier: aa
Operator: AND
Rule(s) :
If-match acl 3999
Behavior: aa
Accounting enable:
15969853 (Packets)
Table 15 Command output
|
Field |
Description |
|
Direction |
Direction in which the QoS policy is applied. |
|
Policy |
QoS policy name. |
|
Classifier |
Traffic class name and its contents, which could be of various types. |
|
Operator |
Logical relationship between match criteria. |
|
Rule(s) |
Match criteria. |
|
if-match acl 3999 |
Matches packets that match ACL 3999 and pass through the interface. |
|
Behavior |
Name and content of the traffic behavior. |
|
Accounting enable |
Traffic accounting action. |
|
15969853 (Packets) |
Number of packets in the statistics. |
Learn more
For more information about configuring MQC, see QoS configuration and QoS commands for your device.
SNMP
Task
Use an NMS to obtain outbound GRE packet statistics for interface HundredGigE 1/0/30 through SNMP.
Figure 57 Network diagram for SNMP

Procedure
# Configure MQC to collect GRE packet statistics. For more information, see the configuration procedure in "CLI."
# Configure SNMP. For more information, see the configuration procedure for SNMP in "Collecting traffic statistics for a Layer 2 Ethernet interface or a Layer 2 aggregate interface."
Example: Obtain traffic statistics
|
|
NOTE: · This example obtains outbound GRE packet statistics for interface HundredGigE 1/0/30 through the MIB browser. · To obtain outbound GRE packet statistics for interface HundredGigE 1/0/30, you must first use the ifDescr node (1.3.6.1.2.1.2.2.1.2) to obtain the index of the interface. Then, use the hh3cCBQoSIntApplyObjectIndex table with OID 1.3.6.1.4.1.25506.2.65.2.1.5.5.2.1.2 to obtain the index of the QoS policy applied to the specified interface. Finally, use the index of the QoS policy applied to the specified interface to obtain traffic statistics for the interface in the subtable of the hh3cCBQoSAccountingRunInfoEntry table with OID 1.3.6.1.4.1.25506.2.65.2.1.5.6.8.1. For more information about the hh3cCBQoSAccountingRunInfoEntry table, see the MIB references for your device. |
# As shown in Figure 58, obtain the index of interface HGE 1/0/30 through the ifDescr node (1.3.6.1.2.1.2.2.1.2). The query results dialog box shows that the index is 50 for interface HGE 1/0/30.
Figure 58 Obtaining the interface index

# As shown in Figure 59, obtain the index of the QoS policy applied to the interface by the interface index in the hh3cCBQoSIntApplyObjectIndex table with OID 1.3.6.1.4.1.25506.2.65.2.1.5.5.2.1.2. As shown in Figure 59, the index of the QoS policy applied to interface HundredGigE 1/0/30 is 1.
Figure 59 Obtaining the index of the QoS policy applied to the interface

# As shown in Figure 60, use the hh3cCBQoSAccountingRunInfoEntry table (with OID 1.3.6.1.4.1.25506.2.65.2.1.5.6.8.1) to obtain outbound GRE packet statistics for HundredGigE 1/0/30.
Figure 60 Obtain traffic statistics

Learn more
For more information about configuring SNMP, see SNMP configuration in the configuration guides for your device.
For more information about MIB files, see the MIB references for your device.
NETCONF
Task
Install the NETCONF client software on the host, and use NETCONF to obtain outbound GRE packet statistics for HundredGigE 1/0/30.
|
|
NOTE: The NETCONF client obtains interface traffic statistics through the NETCONF XML APIs provided by the device. |
Procedure
# Configure MQC to obtain outbound GRE packet statistics for interface HundredGigE 1/0/30. For more information, see the configuration procedure in "CLI."
# Configure NETCONF. For more information, see the configuration procedure for NETCONF in "Collecting traffic statistics for a Layer 2 Ethernet interface or a Layer 2 aggregate interface."
Example: Obtain traffic statistics
|
|
NOTE: The device provides the MQC/IfPolicyAccount table for collecting GRE packet statistics. You can obtain statistics in bytes or packets by using the MQC/IfPolicyAccount table. |
This example uses the MQC/AccountRunInfo table to obtain outbound GRE packet statistics for interface HundredGigE 1/0/30.
# Execute the display system internal ifmgr list | include HundredGigE1/0/30 command in probe view on the device to obtain the index of interface HundredGigE 1/0/30.
<H3C> system-view
[H3C] probe
[H3C-probe] display system internal ifmgr list | include HundredGigE1/0/30
HundredGigE1/0/30(index:50)
# Copy and paste the following message to the NETCONF client:
<rpc message-id="100" xmlns="urn:ietf:params:xml:ns:netconf:base:1.0">
<get-bulk>
<filter type="subtree">
<top xmlns="http://www.h3c.com/netconf/data:1.0">
<MQC>
<IfPolicyAccount>
<Interface>
<IfIndex>50</IfIndex> //Interface index
<Direction></Direction> //Direction in which the QoS policy is applied
<ClassName></ClassName> //Traffic class name
<Packets></Packets> //Traffic statistics in packets
<Bytes></Bytes> //Traffic statistics in bytes
<pps></pps> //Traffic statistics in pps
<bps></bps> //Traffic statistics in bps
</Interface>
</IfPolicyAccount>
</MQC>
</top>
</filter>
</get-bulk>
</rpc>
# If the client receives a message like the following, it indicates that the operation was successful.
<rpc-reply message-id="100" xmlns="urn:ietf:params:xml:ns:netconf:base:1.0">
<data>
<top xmlns="http://www.h3c.com/netconf/data:1.0">
<MQC>
<IfPolicyAccount>
<Interface>
<IfIndex>50</IfIndex>
<Direction>1</Direction>
<ClassName>aa</ClassName>
<Packets>98928876</Packets>
<pps>0</pps>
</Interface>
</IfPolicyAccount>
</MQC>
</top>
</data>
</rpc-reply>
Learn more
For more information about configuring NETCONF, see NETCONF configuration in the configuration guides for your device.
For more information about MQC/IfPolicyAccount, see H3C Comware 7 NETCONF XML API Reference.
gRPC
Task
Use a collector to obtain outbound GRE packet statistics for interface HundredGigE 1/0/30 by using gRPC.
Figure 61 Network diagram for gRPC

Procedure
# Configure IP addresses as required so the device and the collector can reach each other. (Details not shown.)
# Enable gRPC.
<H3C> system-view
[H3C] grpc enable
# Create a sensor group named test, and add sensor path MQC/IfPolicyAccount.
|
|
NOTE: After sensor path MQC/IfPolicyAccount is added, the device will collect traffic statistics for all interfaces on the device and upload the statistics to the collector. |
[H3C] telemetry
[H3C-telemetry] sensor-group test
[H3C-telemetry-sensor-group-test] sensor path mqc/ifpolicyaccount
[H3C-telemetry-sensor-group-test] quit
# Create a destination group named collector1 and add a collector to the group. In this example, the collector receives data on port 50050 at IPv4 address 192.168.2.1.
[H3C-telemetry] destination-group collector1
[H3C-telemetry-destination-group-collector1] ipv4-address 192.168.2.1 port 50050
[H3C-telemetry-destination-group-collector1] quit
# Create subscription A, specify sensor group test for the subscription, set the data collection and push interval to 30 seconds, and specify destination group collector1 for the subscription.
[H3C-telemetry] subscription A
[H3C-telemetry-subscription-A] sensor-group test sample-interval 30
[H3C-telemetry-subscription-A] destination-group collector1
[H3C-telemetry-subscription-A] quit
Obtain traffic statistics
The collector receives data pushed by the device every 30 seconds.
Learn more
For more information about configuring gRPC, see gRPC configuration in the configuration guides for your device.
Collecting PPPoE packet statistics through MQC
Requirements
Obtain PPPoE packet statistics through MQC.
|
|
NOTE: · This switch series does not support Point-to-Point Protocol over Ethernet (PPPoE). This example uses MQC to obtain statistics of PPPoE packets passing through the device. · PPPoE is a network tunneling protocol that encapsulates PPP frames inside Ethernet frames. It has two stages: Discovery (EtherType 0x8863 in frames) and Session (EtherType 0x8864 in frames). · Before obtaining PPPoE packets through MQC, you must configure ACLs to match Ethernet types 0x8863 and 0x8864 in traffic classes, and apply a QoS policy that references the traffic classes to the Ethernet interface through which PPPoE packets pass. |
CLI
Task
Obtain inbound PPPoE packet statistics of interface HundredGigE 1/0/30 through MQC.
|
|
NOTE: · The device supports configuring a traffic accounting action by using the accounting [ byte | packet ]* command. · The accounting byte command collects traffic statistics in bytes, while the accounting packet command collects traffic statistics in packets. If neither the byte keyword nor the packet keyword is specified for the accounting command, the device collects traffic statistics in packets. If both the byte and packet keywords are specified for the accounting command, the device collects traffic statistics in packets and bytes. · This example collects traffic statistics in packets. |
Procedure
# Create Layer 2 ACL 4000. Configure rule 0 to match packets with EtherType 0x8863 or 0x8864 (0x8863 in this example).
<H3C> system-view
[H3C]acl mac 4000
[H3C-acl-ipv4-adv-3999] rule 0 permit type 8863 ffff
[H3C-acl-ipv4-adv-3999] quit
# Configure traffic class aa to match all traffic.
[H3C] traffic classifier aa
[H3C-classifier-aa] if-match acl 4000
[H3C-classifier-aa] quit
# Configure traffic behavior aa to collect traffic statistics in packets.
[H3C] traffic behavior aa
[H3C-behavior-aa] accounting packet
[H3C-behavior-aa] quit
# Create a QoS policy, and associate traffic class aa with traffic behavior aa in the QoS policy.
[H3C] qos policy aa
[H3C-qospolicy-aa] classifier aa behavior aa
[H3C-qospolicy-aa] quit
# Apply the QoS policy to the inbound direction of Ethernet interface HundredGigE 1/0/30.
[H3C] interface hundredgige 1/0/30
[H3C-HundredGigE1/0/30] qos apply policy aa inbound
[H3C-HundredGigE1/0/30] quit
Obtain traffic statistics
# Obtain the traffic statistics of interface HundredGigE 1/0/30.
[H3C] display qos policy interface HundredGigE1/0/30
Interface: HundredGigE1/0/30
Direction: Inbound
Policy: aa
Classifier: aa
Operator: AND
Rule(s) :
If-match acl 4000
Behavior: car
Accounting enable:
9984510 (Packets)
Table 16 Command output
|
Field |
Description |
|
Direction |
Direction in which the QoS policy is applied. |
|
policy |
QoS policy name. |
|
Classifier |
Traffic class name and its contents, which could be of various types. |
|
Operator |
Logical relationship between match criteria. |
|
Rule(s) |
Match criteria. |
|
if-match acl 3999 |
Matches packets that match ACL 4000 and pass through the interface. |
|
Behavior |
Name and content of the traffic behavior. |
|
Accounting enable |
Traffic accounting action. |
|
9984510 (Packets) |
Number of packets in the statistics. |
Learn more
For more information about configuring MQC, see QoS configuration and QoS commands for your device.
SNMP
Task
Use an NMS to obtain inbound PPPoE packet statistics of interface HundredGigE 1/0/30 through SNMP.
Figure 62 Network diagram for SNMP

Procedure
Configure MQC to collect PPPoE packet statistics. For more information, see "Procedure."
Configure SNMP. For more information, see "Procedure."
Example: Obtain traffic statistics
|
|
NOTE: · This example obtains inbound PPPoE packet statistics of interface HundredGigE 1/0/30 through the MIB Browser. · To obtain the inbound PPPoE packet statistics of interface HundredGigE 1/0/30, you must first use the ifDescr node (1.3.6.1.2.1.2.2.1.2) to obtain the index of the interface. Then, use the hh3cCBQoSIntApplyObjectIndex table with OID 1.3.6.1.4.1.25506.2.65.2.1.5.5.2.1.2 to obtain the index of the QoS policy applied to the specified interface. Finally, use the index of the QoS policy applied to the specified interface to obtain the traffic statistics of the interface in the subtable of the hh3cCBQoSAccountingRunInfoEntry table with OID 1.3.6.1.4.1.25506.2.65.2.1.5.6.8.1. For more information about the hh3cCBQoSAccountingRunInfoEntry table, see the MIB references for your device. |
# As shown in Figure 63, obtain the index of interface HGE 1/0/30 through the ifDescr node (1.3.6.1.2.1.2.2.1.2). The query results dialog box shows that the index is 50 for interface HGE 1/0/30.
Figure 63 Obtaining the interface index
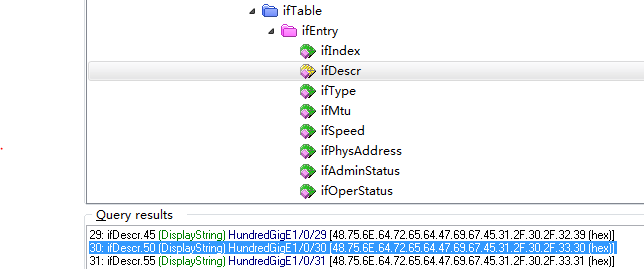
# As shown in Figure 64, obtain the index of the QoS policy applied to the interface by the interface index in the hh3cCBQoSIntApplyObjectIndex table with OID 1.3.6.1.4.1.25506.2.65.2.1.5.5.2.1.2. As shown in Figure 64, the index of the QoS policy applied to interface HundredGigE 1/0/30 is 1.
Figure 64 Obtaining the index of a QoS policy applied to an interface

# As shown in Figure 65, use the hh3cCBQoSAccountingRunInfoEntry table (with OID 1.3.6.1.4.1.25506.2.65.2.1.5.6.8.1) to obtain the inbound VXLAN traffic statistics of HundredGigE 1/0/30.
Figure 65 Obtain traffic statistics

Learn more
For more information about configuring SNMP, see SNMP configuration in the configuration guides for your device.
For more information about MIB files, see the MIB references for your device.
NETCONF
Task
Install the NETCONF client software on the host, and use NETCONF to obtain inbound PPPoE packet statistics of HundredGigE 1/0/30.
|
|
NOTE: The NETCONF client obtains interface traffic statistics through the NETCONF XML APIs provided by the device. |
Procedure
Configure MQC to collect inbound PPPoE packet statistics of interface HundredGigE 1/0/30. For more information, see "Procedure."
Configure NETCONF. For more information, see "Procedure."
Example: Obtain traffic statistics
|
|
NOTE: The device provides the MQC/IfPolicyAccount table for collecting PPPoE packet statistics. You can obtain statistics in bytes or packets by using the MQC/IfPolicyAccount table. |
This example uses the MQC/AccountRunInfo table to obtain the inbound PPPoE statistics of interface HundredGigE 1/0/30.
# Execute the display system internal ifmgr list | include HundredGigE1/0/30 command in probe view on the device to obtain the index of interface HundredGigE 1/0/30.
<H3C> system-view
[H3C] probe
[H3C-probe]display system internal ifmgr list | include HundredGigE1/0/30
HundredGigE1/0/30(index:50)
# Copy and paste the following message to the NETCONF client.
<rpc message-id="100" xmlns="urn:ietf:params:xml:ns:netconf:base:1.0">
<get-bulk>
<filter type="subtree">
<top xmlns="http://www.h3c.com/netconf/data:1.0">
<MQC>
<IfPolicyAccount>
<Interface>
<IfIndex>50</IfIndex> //Interface index
<Direction></Direction> //Direction in which the QoS policy is applied
<ClassName></ClassName> //Traffic class name
<Packets></Packets> //Traffic statistics in packets
<Bytes></Bytes> //Traffic statistics in bytes
<pps></pps> //Traffic statistics in pps
<bps></bps> //Traffic statistics in bps
</Interface>
</IfPolicyAccount>
</MQC>
</top>
</filter>
</get-bulk>
</rpc>
# If the client receives a message like the following, it indicates that the operation was successful.
<rpc-reply message-id="100" xmlns="urn:ietf:params:xml:ns:netconf:base:1.0">
<data>
<top xmlns="http://www.h3c.com/netconf/data:1.0">
<MQC>
<IfPolicyAccount>
<Interface>
<IfIndex>50</IfIndex>
<Direction>0</Direction>
<ClassName>aa</ClassName>
<Packets>1056105101</Packets>
<pps>0</pps>
</Interface>
</IfPolicyAccount>
</MQC>
</top>
</data>
</rpc-reply>
Learn more
For more information about configuring NETCONF, see NETCONF configuration in the configuration guides for your device.
For more information about MQC/IfPolicyAccount, see H3C Comware 7 NETCONF XML API Reference.
gRPC
Task
Use a collector to obtain the inbound PPPoE packet statistics of interface HGE 1/0/30 on the device by using gRPC.
Figure 66 Network diagram for gRPC

Procedure
# Configure IP addresses as required so the device and the collector can reach each other. (Details not shown.)
# Enable gRPC.
<H3C> system-view
[H3C] grpc enable
# Create a sensor group named test, and add sensor path MQC/IfPolicyAccount.
|
|
NOTE: After sensor path MQC/IfPolicyAccount is added, the device will collect traffic statistics of all interfaces on the device and upload the statistics to the collector. |
[H3C] telemetry
[H3C-telemetry] sensor-group test
[H3C-telemetry-sensor-group-test] sensor path mqc/ifpolicyaccount
[H3C-telemetry-sensor-group-test] quit
# Create a destination group named collector1 and add a collector to the group. In this example, the collector receives data on port 50050 at IPv4 address 192.168.2.1.
[H3C-telemetry] destination-group collector1
[H3C-telemetry-destination-group-collector1] ipv4-address 192.168.2.1 port 50050
[H3C-telemetry-destination-group-collector1] quit
# Configure a subscription named A to bind sensor group test with destination group collector1. Set the data sampling interval to 30 seconds.
[H3C-telemetry] subscription A
[H3C-telemetry-subscription-A] sensor-group test sample-interval 30
[H3C-telemetry-subscription-A] destination-group collector1
[H3C-telemetry-subscription-A] quit
Obtain traffic statistics
The collector receives data pushed by the device every 30 seconds.
Learn more
For more information about configuring gRPC, see gRPC configuration in the configuration guides for your device.
Collecting VXLAN traffic statistics
|
|
NOTE: The S9820-64H and S9820-8C switches do not support VXLAN traffic statistics. |
Collecting AC traffic statistics
Requirements
Obtain traffic statistics for ACs.
Restrictions and guidelines
The VTEP uses the following methods to assign customer frames to a VXLAN:
· Ethernet service instance-to-VSI mapping—This method uses the frame match criterion of an Ethernet service instance to match a list of VLANs or all packets on a Layer 2 Ethernet interface. The received data packets that match the Ethernet service instance on the Layer Ethernet interface 2 belong to the VSI and VXLAN associated with the Ethernet service instance.
· VLAN-based VXLAN assignment—This method maps a VLAN to a VXLAN. The VTEP assigns all frames of the VLAN to the VXLAN.
Traffic statistics collection for Ethernet service instances takes effect only if frame match criteria are configured for the Ethernet service instances and the Ethernet service instances are mapped to VSIs. If the frame match criterion or VSI mapping is modified for an Ethernet service instance, traffic statistics for the Ethernet service instance are cleared for recollection.
If VLAN-based VXLAN assignment is used, enable AC traffic statistics for ACs of a VLAN for the device to collection traffic statistics for the automatically generated ACs in that VLAN. If you enable VLAN-based VXLAN assignment and map a VLAN to a VXLAN, the device automatically performs the following operations:
1. Creates an Ethernet service instance that uses the VLAN ID as its instance ID on each interface in the VLAN. The matching outer VLAN ID of the Ethernet service instances is the VLAN ID.
2. Maps the Ethernet service instances to the VSI of the VXLAN.
For ACs, inbound Layer 2 broadcast packets will also be counted as outgoing packets in AC traffic statistics.
To determine whether an AC works correctly within a period by collecting AC traffic statistics within that period, first use the reset l2vpn statistics ac command in user view to clear the statistics.
CLI
Task
Obtain traffic statistics for Ethernet service instance 1000.
Procedure
· Method 1:
# Create Ethernet service instance 1000 on HundredGigE 2/0/25, and mapped the Ethernet service instance to a VSI.
<H3C> sys-view
[H3C] interface HundredGigE 2/0/25
[H3C-HundredGigE2/0/25] service-instance 1000
[H3C-HundredGigE2/0/25-srv1000] encapsulation s-vid 1000
[H3C-HundredGigE2/0/25-srv1000] xconnect vsi aa
# Enable VSI traffic statistics.
[H3C-HundredGigE2/0/25-srv1000] statistics enable
[H3C-HundredGigE2/0/25-srv1000] quit
· Method 2:
# Create VSI aa and enter VSI view.
<H3C> sys-view
[H3C] vsi aa
# Create a VXLAN and enter VXLAN view.
[H3C-vsi-aa] vxlan 1000
[H3C-vsi-aa] quit
# Enable VLAN-based VXLAN assignment.
[H3C] vxlan vlan-based
# Create VLAN 1000 and enter the VLAN view.
[H3C] vlan 1000
# Map the VLAN to the VXLAN.
[H3C-vlan1000] vxlan vni 1000
# Enable AC traffic statistics for the VLAN.
[H3C-vlan1000] ac statistics enable
Example: Obtain traffic statistics
[H3C]dis l2vpn service-instance verbose
Interface: HGE2/0/25
Service Instance: 1000
Type : Manual
Encapsulation : s-vid 10
Bandwidth : Unlimited
VSI Name : aa
Link ID : 0
State : Up
Statistics : Enabled
Input Statistics:
Octets :1142929408
Packets :8929136
Output Statistics:
Octets :0
Packets :9062436
Table 17 Command output
|
Field |
Description |
|
Interface |
Name of a Layer 2 Ethernet interface or Layer 2 aggregate interface. |
|
Service Instance |
Ethernet service instance ID. |
|
Type |
Type and traffic match mode of the Ethernet service instance: · Dynamic (MAC-based)—Dynamic Ethernet service instance in MAC-based traffic match mode. · Dynamic (VLAN-based)—Dynamic Ethernet service instance in VLAN-based traffic match mode. · Manual—Static Ethernet service instance in VLAN-based traffic match mode. |
|
Encapsulation |
Frame match criterion of the Ethernet service instance. If the Ethernet service instance does not contain a frame match criterion, the command does not display this field. |
|
Bandwidth |
Bandwidth limit in kbps. If no bandwidth limit is set for the Ethernet service instance, Unlimited is displayed. |
|
Link ID |
Ethernet service instance's link ID on the VSI. |
|
State |
Ethernet service instance state: · Up. · Down. |
|
DF state |
Whether the device is the designated forwarder for the AC at a multihomed EVPN site: · BDF—The device is a backup designated forwarder. · DF—The device is the designated forwarder. This field is not displayed if no Ethernet segment identifier is configured on the interface.
|
|
Statistics |
Packet statistics state: · Enabled—The packet statistics feature is enabled for the Ethernet service instance. · Disabled—The packet statistics feature is disabled for the Ethernet service instance. |
|
Input Statistics |
Incoming traffic statistics: · Octets—Number of incoming bytes. · Packets—Number of incoming packets. |
|
Output Statistics |
Outgoing traffic statistics: · Octets—Number of outgoing bytes. · Packets—Number of outgoing packets. |
SNMP
Task
Obtain traffic statistics for Ethernet service instance 1000.
Procedure
Configure VXLAN. For more information, see "Procedure."
Configure SNMP. For more information, see "Procedure."
Example: Obtain traffic statistics
|
|
NOTE: · To obtain traffic statistics for an Ethernet service instance, you must first obtain the index of the interface hosting the Ethernet service instance and use the index to obtain traffic statistics for the Ethernet service instance. · The interface index might vary by the ID of the IRF member device hosting the interface. · The following procedure uses a MIB browser to obtain inbound traffic statistics for Ethernet service instance 1000 on HundredGigE 2/0/25 from the hh3cEvcSrvInstStatInfoEntry table (with OID 1.3.6.1.4.1.25506.2.106.1.4.1). · For more information about the hh3cEvcSrvInstStatInfoEntry table, see the MIB references for your device. |
# As shown in Figure 67, use the ifDescr node (1.3.6.1.2.1.31.1.1.1.1) to obtain the index of interface HundredGigE 2/0/25. The query results dialog box shows that the index is 220 for interface HundredGigE 2/0/25, as shown in Figure 67.
Figure 67 Obtaining the interface index

Figure 68 Interface index query result

# As shown in Figure 69, obtain inbound traffic statistics for Ethernet service instance 1000 on HundredGigE 2/0/25 from the hh3cEvcSrvInstInPackets node (with OID 1.3.6.1.4.1.25506.2.106.1.4.1.1) in the hh3cEvcSrvInstStatInfoEntry table.
Figure 69 Obtaining traffic statistics for Ethernet service instance 1000
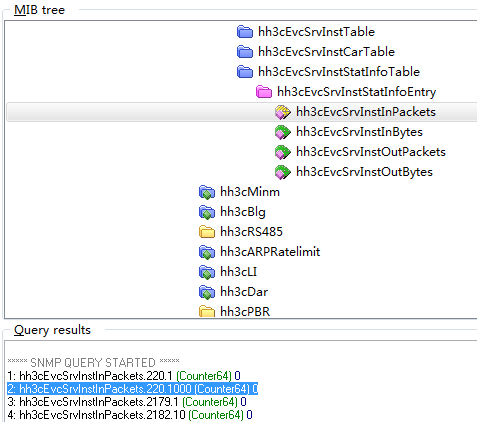
Learn more
For more information about configuring SNMP, see SNMP configuration in the configuration guides for your device.
For more information about MIB files, see the MIB references for your device.
NETCONF
Task
Obtain traffic statistics for Ethernet service instance 1000.
Procedure
Configure VXLAN. For more information, see "Procedure."
Configure NETCONF. For more information, see "Procedure."
Example: Obtain traffic statistics
|
|
NOTE: · Use the L2VPN/VSIStatistics table to obtain the traffic statistics for VSI interfaces. For more information about L2VPN/VSIStatistics, see H3C Comware 7 NETCONF XML API Reference. · This example uses Ethernet service instance 1000. |
# Copy and paste the following message to the NETCONF client.
<rpc message-id="100" xmlns="urn:ietf:params:xml:ns:netconf:base:1.0">
<get>
<filter type="subtree">
<top xmlns="http://www.h3c.com/netconf/data:1.0">
<L2VPN>
<ACs>
<AC>
<IfIndex></IfIndex>
<SrvID>1000</SrvID>
<VsiName></VsiName>
<AccessMode></AccessMode>
<Hub></Hub>
<Statistics></Statistics>
<Bandwidth></Bandwidth>
<LearningMode></LearningMode>
<InPkts></InPkts>
<InOctets></InOctets>
<OutPkts></OutPkts>
<OutOctets></OutOctets>
<Flooding></Flooding>
<FloodType></FloodType>
<ForwardingMode></ForwardingMode>
<TrackEntryNumber></TrackEntryNumber>
<InPktsRate></InPktsRate>
<InOctetsRate></InOctetsRate>
<OutPktsRate></OutPktsRate>
<OutOctetsRate></OutOctetsRate>
</AC>
</ACs>
</L2VPN>
</top>
</filter>
</get>
</rpc>
# If the client receives a message like the following, it indicates that the operation was successful.
<rpc-reply message-id="100" xmlns="urn:ietf:params:xml:ns:netconf:base:1.0">
<data>
<top xmlns="http://www.h3c.com/netconf/data:1.0">
<L2VPN>
<ACs>
<AC>
<IfIndex>49</IfIndex>
<SrvID>1000</SrvID>
<VsiName>aa</VsiName>
<AccessMode>1</AccessMode>
<Statistics>true</Statistics>
<Bandwidth>4294967295</Bandwidth>
<LearningMode>0</LearningMode>
<Flooding>true</Flooding>
<InPkts>12815354350</InPkts>
<InOctets>1640365356800</InOctets>
<OutPkts>12815447070</OutPkts>
<OutOctets>0</OutOctets>
<InPktsRate>8261191</InPktsRate>
<InOctetsRate>1057432529</InOctetsRate>
<OutPktsRate>8261223</OutPktsRate>
<OutOctetsRate>0</OutOctetsRate>
</AC>
</ACs>
</L2VPN>
</top>
</data>
</rpc-reply>
gRPC
Task
Obtain traffic statistics for Ethernet service instance 1000.
Procedure
# Configure IP addresses as required so the device and the collector can reach each other. (Details not shown.)
# Enable gRPC.
<H3C> system-view
[H3C] grpc enable
# Create a sensor group named test, and add sensor path L2VPN/VSIStatistics to it.
[H3C] telemetry
[H3C-telemetry] sensor-group test
[H3C-telemetry-sensor-group-test] sensor path l2vpn/vsistatistics
[H3C-telemetry-sensor-group-test] quit
# Create a destination group named collector1 and add a collector to the group. In this example, the collector receives data on port 50050 at IPv4 address 192.168.2.1.
[H3C-telemetry] destination-group collector1
[H3C-telemetry-destination-group-collector1] ipv4-address 192.168.2.1 port 50050
[H3C-telemetry-destination-group-collector1] quit
# Create subscription A, specify sensor group test for the subscription, set the data collection interval to 30 seconds, and specify destination group collector1 for the subscription.
[H3C-telemetry] subscription A
[H3C-telemetry-subscription-A] sensor-group test sample-interval 30
[H3C-telemetry-subscription-A] destination-group collector1
[H3C-telemetry-subscription-A] quit
Obtain traffic statistics
The collector receives data pushed by the device every 30 seconds.
Learn more
For more information about configuring gRPC, see gRPC configuration in the configuration guides for your device.
Collecting VSI traffic statistics
Requirements
Obtain VSI traffic statistics.
CLI
Task
Obtain traffic statistics for VSI vpna.
Restrictions and guidelines
· To enable VSI traffic statistics, execute the statistics enable command in VSI view. To obtain traffic statistics, execute the display l2vpn vsi verbose command.
· To determine whether a VSI works correctly within a period by collecting VSI traffic statistics within that period, first use the reset l2vpn statistics vsi command to clear the statistics.
Procedure
Enable traffic statistics for manually created tunnels.
<H3C> sys-view
[H3C] vsi vpna
[H3C-vsi-vsiaa] statistics enable
Example: Obtain traffic statistics
[H3C]display l2vpn vsi verbose
VSI Name: vpna
VSI Index : 0
VSI State : Up
........
Statistics : Enabled
Input Statistics :
Octets :6737029504
Packets :52633043
Errors :0
Discards :0
Output Statistics :
Octets :9158149482
Packets :105266086
Errors :0
Discards :0
........
Table 18 Command output
|
Field |
Description |
|
Statistics |
Packet statistics state: · Enabled—The packet statistics feature is enabled for the VSI. · Disabled—The packet statistics feature is disabled for the VSI. |
|
Input statistics |
Incoming traffic statistics: · Octets—Number of incoming bytes. · Packets—Number of incoming packets. · Errors—Number of error packets. · Discards—Number of discarded packets. |
|
Output statistics |
Outgoing traffic statistics: · Octets—Number of outgoing bytes. · Packets—Number of outgoing packets. · Errors—Number of error packets. · Discards—Number of discarded packets. |
SNMP
Task
Use an NMS to obtain the inbound traffic statistics in bytes for VSI vpna from the device Agent through SNMP.
Figure 70 Network diagram for SNMP
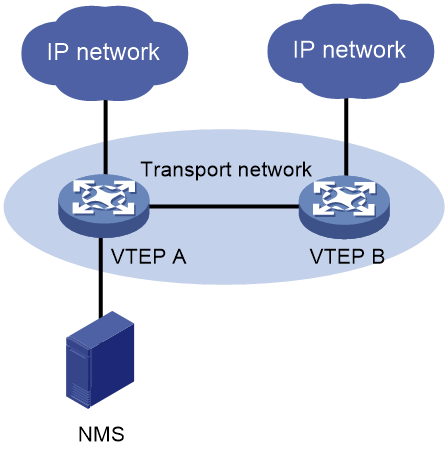
Procedure
See "Procedure."
Example: Obtain traffic statistics
|
|
NOTE: · To obtain traffic statistics for a VSI, you must first obtain the index of the VSI, and then use the index to obtain traffic statistics for the VSI. · To obtain traffic statistics for a VSI, use the nodes under the hh3cVsiEntry (with OID 1.3.6.1.4.1.25506.2.105.1.2.1) and hh3cVsiPerfEntry (with OID 1.3.6.1.4.1.25506.2.105.1.7.1) nodes. For more information about the nodes under the hh3cVsiEntry and hh3cVsiPerfEntry nodes, see the MIB references for your device. · This example obtains the inbound traffic statistics in bytes of VSI vpna through the MIB browser. |
# As shown in Figure 71, obtain the index of VSI vpna from the hh3cVsiEntry node (with OID 1.3.6.1.4.1.25506.2.105.1.2.1). The query results dialog box shows that the index is 1 for VSI vpna.
Figure 71 Obtaining the VSI index
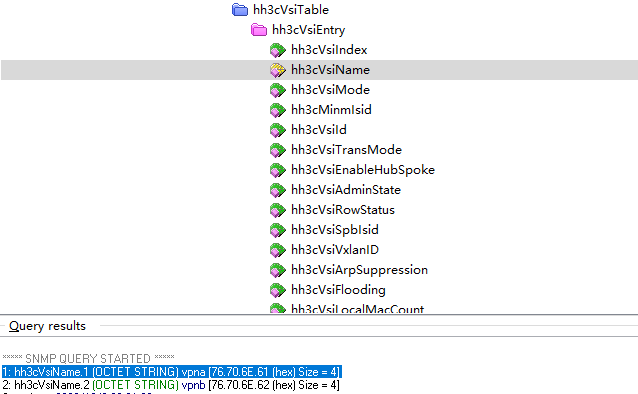
# As shown in Figure 72, use the hh3cVsiPerfEntry node (with OID 1.3.6.1.4.1.25506.2.105.1.7.1) to obtain the inbound traffic statistics in bytes for the index value of 0 1. The query results dialog box shows the query results.
Figure 72 Obtain traffic statistics
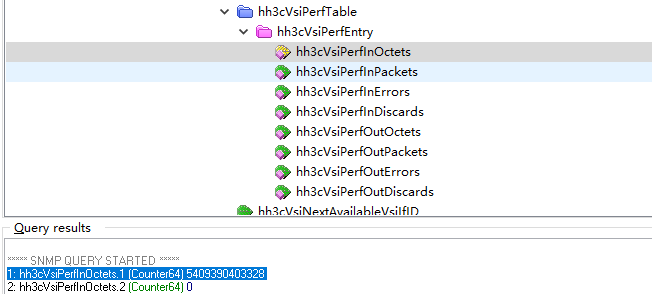
Learn more
For more information about configuring SNMP, see SNMP configuration in the configuration guides for your device.
For more information about MIB files, see the MIB references for your device.
NETCONF
Task
Obtain traffic statistics for VSI vpna.
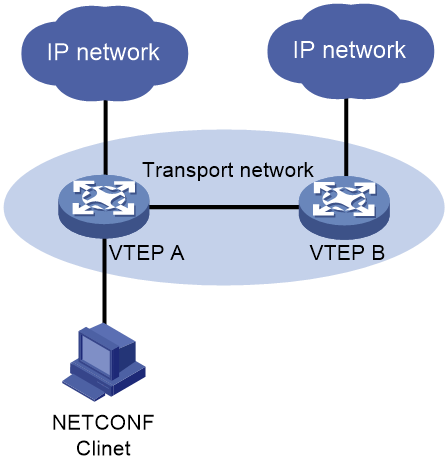
Procedure
Configure the device as described in "Procedure."
Example: Obtain traffic statistics
|
|
NOTE: Use the L2VPN/VSIStatistics table to obtain VSI traffic statistics. The L2VPN/VSIStatistics table provides interface traffic statistics in both bytes and packets, including statistics for incoming or outgoing normal packets, error packets, and discarded packets. |
The following procedure uses the L2VPN/VSIStatistics table to obtain traffic statistics for VSI vpna.
# Copy and paste the following message to the NETCONF client.
<rpc message-id="100" xmlns="urn:ietf:params:xml:ns:netconf:base:1.0">
<get-bulk>
<filter type="subtree">
<top xmlns="http://www.h3c.com/netconf/data:1.0">
<L2VPN>
<VSIStatistics>
<Statistics>
<VsiName>vpna</VsiName> //VSI name
<InPkts></InPkts> //Inbound packet count
<InOctets></InOctets> //Inbound byte count
<InErrors></InErrors> //Inbound error packet count
<InDiscards></InDiscards> //Inbound dropped packet count
<OutPkts></OutPkts> //Outbound packet count
<OutOctets></OutOctets> //Outbound byte count
<OutErrors></OutErrors> //Outbound error packet count
<OutDiscards></OutDiscards> //Outbound dropped packet count
<InPktsRate></InPktsRate> //Inbound packet rate
<InOctetsRate></InOctetsRate> //Inbound byte rate
<OutPktsRate></OutPktsRate> //Outbound packet rate
<OutOctetsRate></OutOctetsRate> //Outbound byte rate
<AcInPkts></AcInPkts> //AC inbound packet count
<AcInOctets></AcInOctets> //AC inbound byte count
<AcOutPkts></AcOutPkts> //AC outbound packet count
<AcOutOctets></AcOutOctets> //AC outbound byte count
<AcInPktsRate></AcInPktsRate> //AC inbound packet rate
<AcInOctetsRate></AcInOctetsRate> //AC inbound byte rate
<AcOutPktsRate></AcOutPktsRate> //AC outbound packet rate
<AcOutOctetsRate></AcOutOctetsRate> //AC outbound byte rate
</Statistics>
</VSIStatistics>
</L2VPN>
# If the requested operation succeeds, the server responds with the following information.
<rpc-reply message-id="100" xmlns="urn:ietf:params:xml:ns:netconf:base:1.0">
<data>
<top xmlns="http://www.h3c.com/netconf/data:1.0">
<L2VPN>
<VSIStatistics>
<Statistics>
<VsiName>vpna</VsiName>
<InPkts>45537431676</InPkts>
<InOctets>5828791254528</InOctets>
<InErrors>0</InErrors>
<InDiscards>0</InDiscards>
<OutPkts>91075403010</OutPkts>
<OutOctets>7923560061870</OutOctets>
<OutErrors>0</OutErrors>
<OutDiscards>0</OutDiscards>
<InPktsRate>8575395</InPktsRate>
<InOctetsRate>1097650645</InOctetsRate>
<OutPktsRate>17151031</OutPktsRate>
<OutOctetsRate>1492139697</OutOctetsRate>
<AcInPkts>0</AcInPkts>
<AcInOctets>0</AcInOctets>
<AcOutPkts>0</AcOutPkts>
<AcOutOctets>0</AcOutOctets>
<AcInPktsRate>0</AcInPktsRate>
<AcInOctetsRate>0</AcInOctetsRate>
<AcOutPktsRate>0</AcOutPktsRate>
<AcOutOctetsRate>0</AcOutOctetsRate>
</Statistics>
</VSIStatistics>
</L2VPN>
</top>
</data>
</rpc-reply>
</top>
</filter>
</get>
</rpc>
gRPC
Task
Obtain traffic statistics for VSI vpna.
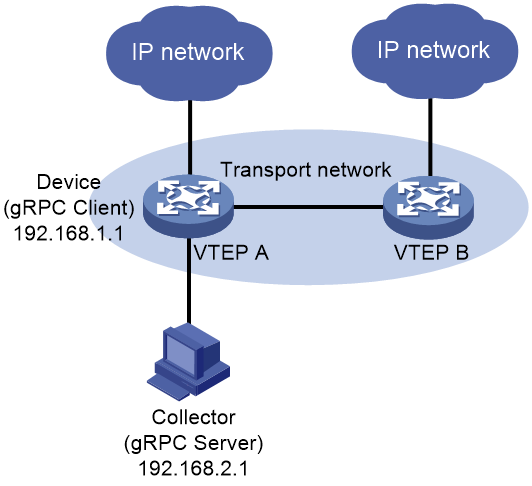
Procedure
# Configure IP addresses as required so the device and the collector can reach each other. (Details not shown.)
# Enable gRPC.
<H3C> system-view
[H3C] grpc enable
# Create a sensor group named test, and add sensor path l2vpn/vsistatistics to it.
|
|
NOTE: After sensor path l2vpn/vsistatistics is added, the device will collect traffic statistics for all interfaces and upload the statistics to the collector. |
[H3C] telemetry
[H3C-telemetry] sensor-group test
[H3C-telemetry-sensor-group-test] sensor path l2vpn/vsistatistics
[H3C-telemetry-sensor-group-test] quit
# Create a destination group named collector1 and add a collector to the group. In this example, the collector receives data on port 50050 at IPv4 address 192.168.2.1.
[H3C-telemetry] destination-group collector1
[H3C-telemetry-destination-group-collector1] ipv4-address 192.168.2.1 port 50050
[H3C-telemetry-destination-group-collector1] quit
# Create subscription A, specify sensor group test for the subscription, set the data collection interval to 30 seconds, and specify destination group collector1 for the subscription.
[H3C-telemetry] subscription A
[H3C-telemetry-subscription-A] sensor-group test sample-interval 30
[H3C-telemetry-subscription-A] destination-group collector1
[H3C-telemetry-subscription-A] quit
Obtain traffic statistics
The collector receives data pushed by the device every 30 seconds.
Learn more
For more information about configuring gRPC, see gRPC configuration in the configuration guides for your device.
Collecting VXLAN tunnel traffic statistics
Requirements
Obtain traffic statistics for VXLAN tunnels.
CLI
Task
Obtain traffic statistics for tunnel 0.
Restrictions and guidelines
VXLAN tunnels can be created manually or automatically by using protocols such as EVPN. To enable traffic statistics for manual VXLAN tunnels, execute the statistics enable command in tunnel interface view. To enable traffic statistics for automatic VXLAN tunnels, execute the tunnel statistics vxlan auto command in system view.
Procedure
· Enable traffic statistics for manually created tunnels.
# Create a VXLAN tunnel, and enable traffic statistics for it.
<H3C> system-view
[H3C] interface tunnel0 mode vxlan
[H3C-Tunnel0] statistics enable
· Enable traffic statistics for automatically created tunnels.
# Enable traffic statistics for the automatic VXLAN tunnel with destination address 2.2.2.2.
|
|
NOTE: · After you enable traffic statistics for automatic VXLAN tunnels, the device will start collecting statistics about the traffic forwarded over all automatic VXLAN tunnels or automatic VXLAN tunnels destined for an IP address. The device will also track the traffic for subsequently created automatic VXLAN tunnels until traffic statistics for automatic VXLAN tunnels is disabled. · Automatic VXLAN tunnels include VXLAN tunnels created automatically by EVPN and OVSDB VTEP. · When you enable traffic statistics for automatic VXLAN tunnels without specifying a destination address, this feature is enabled for all automatic VXLAN tunnels. |
<H3C> sys-view
[H3C] tunnel statistics vxlan auto destination 2.2.2.2
Example: Obtain traffic statistics
[H3C]display interface tunnel 0
Tunnel0
........
Tunnel source 4.4.4.4, destination 2.2.2.2
Tunnel protocol/transport UDP_VXLAN/IP
Last 300 seconds input rate: 0 bytes/sec, 0 bits/sec, 0 packets/sec
Last 300 seconds output rate: 0 bytes/sec, 0 bits/sec, 0 packets/sec
Input: 100 packets, 17400 bytes, 0 drops
Output: 100 packets, 17400 bytes, 0 drops
Table 19 Command output
|
Field |
Description |
|
Tunnel source |
Source address of the tunnel. If a source interface is specified for the tunnel interface, this field also displays the source interface in parentheses. |
|
destination |
Destination address of the tunnel. |
|
Tunnel protocol/transport |
Tunnel mode and transport protocol: · UDP_VXLAN/IP—UDP-encapsulated IPv4 VXLAN tunnel mode. · UDP_VXLAN/IPv6—UDP-encapsulated IPv6 VXLAN tunnel mode. · UDP_VXLAN_DCI/IP—UDP-encapsulated IPv4 VXLAN-DCI tunnel mode. · UDP_VXLAN_DCI/IPv6—UDP-encapsulated IPv6 VXLAN-DCI tunnel mode. |
|
Last 300 seconds input rate: 0 bytes/sec, 0 bits/sec, 0 packets/sec |
Average input rate in the last 300 seconds. |
|
Last 300 seconds output rate: 0 bytes/sec, 0 bits/sec, 0 packets/sec |
Average output rate in the last 300 seconds. |
|
Input: 100 packets, 17400 bytes, 0 drops |
Total input packets, total input bytes, and total input packets dropped. Input packets are counted after software de-encapsulation. |
|
Output: 100 packets, 17400 bytes, 0 drops |
Total output packets, total output bytes, and total output packets dropped. Output packets are counted before software encapsulation. |
SNMP
Task
Use an NMS to obtain traffic statistics for tunnel 0 on VTEP A through SNMP.
Figure 73 Network diagram for SNMP
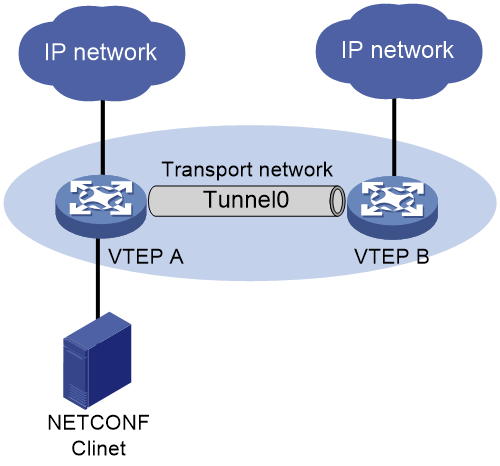
|
|
NOTE: Interface traffic statistics collection is performed by using the ifEntry (with OID 1.3.6.1.2.1.2.2.1) and ifXEntry (with OID 1.3.6.1.2.1.31.1.1) tables. The data length of the interface traffic statistics nodes in the ifEntry table is 32 bits, and the data length of some nodes in the ifXEntry table are 64 bits. Therefore, the interface traffic statistics nodes of the ifEntry table might have data overflow in collecting interface traffic statistics. The interface traffic statistics nodes of the ifXEntry table do not have data overflow issues. The nodes in the ifEntry table and the ifXEntry table are not completely identical, but they have some overlapping nodes. If target data can be found in the ifXEntry table, use the data in the ifXEntry table. If the data cannot be found in the ifXEntry table, check the ifEntry table. |
Procedure
Configure SNMP. For more information, see "Procedure."
Example: Obtain traffic statistics
|
|
NOTE: · To obtain traffic statistics for a tunnel interface, you must first obtain the index of the tunnel interface, and then use the index to obtain traffic statistics for the tunnel interface. · The tunnel interface index might vary by the ID of the IRF member device hosting the interface. · You can use the nodes in the ifEntry (with OID1.3.6.1.2.1.2.2.1) and ifXEntry (with OID 1.3.6.1.2.1.31.1.1) tables to obtain different traffic statistics. For more information about the nodes in the ifEntry and ifXEntry tables, see the MIB references for your device. · This example obtains the inbound traffic statistics for the tunnel 0 interface through the MIB browser. |
As shown in Figure 74, use the ifDescr node (1.3.6.1.2.1.31.1.1.1.1.2) under the ifName node (1.3.6.1.2.1.31.1.1.1.1) to obtain the index of the tunnel interface. The query results dialog box shows that the index is 2181 for interface tunnel 0.
Figure 74 Obtaining the interface index
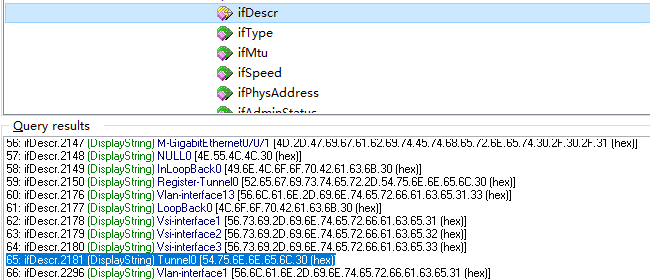
# As shown in Figure 75, use the ifHCInOctets table (with OID 1.3.6.1.2.1.31.1.1.1.6) to obtain the traffic statistics (in bytes) for tunnel 0 2.
Figure 75 Obtain traffic statistics

Learn more
For more information about configuring SNMP, see SNMP configuration in the configuration guides for your device.
For more information about MIB files, see the MIB references for your device.
NETCONF
Task
Obtain traffic statistics for tunnel 0.
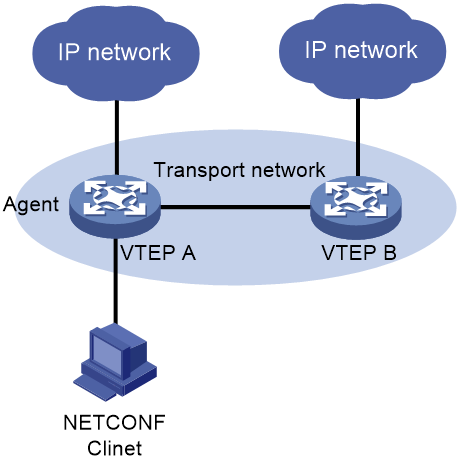
Procedure
Configure NETCONF. For more information, see "Procedure."
Example: Obtain traffic statistics
|
|
NOTE: · The device provides the Ifmgr/Statistics and IPFW/IPStatistic tables for collecting interface traffic statistics. Use the Ifmgr/Statistics table to obtain interface traffic statistics in both bytes and packets, including statistics for unicast packets, non-unicast packets, unknown packets, discarded packets, and other types of packets. Use the IPFW/IPStatistic table to obtain interface traffic statistics about IPv4 or IPv6 packets in packets. · The following procedure uses the Ifmgr/Statistics table to obtain the traffic statistics for Route-Aggregation 2. The procedure is similar if you use the IPFW/IPStatistic table. For more information about the Ifmgr/Statistics and IPFW/IPStatistic tables, see the NETCONF XML structure. |
The following procedure uses the Ifmgr/Statistics table to obtain the traffic statistics for tunnel 0. The procedure is similar if you use the IPFW/IPStatistic table.
# Copy and paste the following message to the NETCONF client.
<rpc message-id="100" xmlns="urn:ietf:params:xml:ns:netconf:base:1.0">
<get-bulk>
<filter type="subtree">
<top xmlns="http://www.h3c.com/netconf/data:1.0">
<Ifmgr>
<Statistics>
<Interface>
<IfIndex></IfIndex>
<Name>tunnel0</Name>
<AbbreviatedName></AbbreviatedName>
<InOctets></InOctets>
<InUcastPkts></InUcastPkts>
<InNUcastPkts></InNUcastPkts>
<InDiscards></InDiscards>
<InErrors></InErrors>
<InUnknownProtos></InUnknownProtos>
<InRate></InRate>
<OutOctets></OutOctets>
<OutUcastPkts></OutUcastPkts>
<OutNUcastPkts></OutNUcastPkts>
<OutDiscards></OutDiscards>
<OutErrors></OutErrors>
<OutRate></OutRate>
<LastClear></LastClear>
</Interface>
</Statistics>
</Ifmgr>
</top>
</filter>
</get-bulk>
</rpc>
# If the client receives a message like the following, it indicates that the operation was successful.
<rpc-reply message-id="100" xmlns="urn:ietf:params:xml:ns:netconf:base:1.0">
<data>
<top xmlns="http://www.h3c.com/netconf/data:1.0">
<Ifmgr>
<Statistics>
<Interface>
<IfIndex>2181</IfIndex>
<Name>Tunnel0</Name>
<AbbreviatedName>Tun0</AbbreviatedName>
<InOctets>17400</InOctets>
<InUcastPkts>100</InUcastPkts>
<InNUcastPkts>0</InNUcastPkts>
<InDiscards>0</InDiscards>
<InErrors>0</InErrors>
<InUnknownProtos>0</InUnknownProtos>
<InRate>0</InRate>
<OutOctets>17400</OutOctets>
<OutUcastPkts>100</OutUcastPkts>
<OutNUcastPkts>0</OutNUcastPkts>
<OutDiscards>0</OutDiscards>
<OutErrors>0</OutErrors>
<OutRate>0</OutRate>
<LastClear>0000-00-00T00:00:00</LastClear>
</Interface>
</Statistics>
</Ifmgr>
</top>
</data>
</rpc-reply>
gRPC
Task
Obtain traffic statistics for tunnel 0.
Procedure
# Configure IP addresses as required so the device and the collector can reach each other. (Details not shown.)
# Enable gRPC.
<H3C> system-view
[H3C] grpc enable
# Create a sensor group named test, and add sensor path Ifmgr/Statistics to it.
|
|
NOTE: After sensor path Ifmgr/Statistics is added, the device will collect traffic statistics for all interfaces and upload the statistics to the collector. |
[H3C] telemetry
[H3C-telemetry] sensor-group test
[H3C-telemetry-sensor-group-test] sensor path ifmgr/statistics
[H3C-telemetry-sensor-group-test] quit
# Create a destination group named collector1 and add a collector to the group. In this example, the collector receives data on port 50050 at IPv4 address 192.168.2.1.
[H3C-telemetry] destination-group collector1
[H3C-telemetry-destination-group-collector1] ipv4-address 192.168.2.1 port 50050
[H3C-telemetry-destination-group-collector1] quit
# Create subscription A, specify sensor group test for the subscription, set the data collection interval to 30 seconds, and specify destination group collector1 for the subscription.
[H3C-telemetry] subscription A
[H3C-telemetry-subscription-A] sensor-group test sample-interval 30
[H3C-telemetry-subscription-A] destination-group collector1
[H3C-telemetry-subscription-A] quit
Obtain traffic statistics
The collector receives data pushed by the device every 30 seconds.
Learn more
For more information about configuring gRPC, see gRPC configuration in the configuration guides for your device.
Collecting VSI interface traffic statistics
Requirements
Obtain VSI interface traffic statistics.
|
|
NOTE: · To collect VSI interface traffic statistics, first execute the statistics enable command in VSI view. After you disable packet statistics for a VSI, the incoming and outgoing traffic statistics on its VSI interface will be cleared. · The device collects both Layer 2 and Layer 3 traffic statistics for VSI interfaces. · You can obtaining VSI interface traffic statistics only from the CLI. |
CLI
Task
Obtain the traffic statistics for VSI interface 2.
Procedure
# Creating a VSI interface.
[H3C] interface vsi-interface 2
[H3C-Vsi-interface2] ip address 10.1.1.1 255.255.255.0
[H3C-Vsi-interface2] quit
# Specify VSI-interface 2 as the gateway interface for VSI vpna.
[H3C] vsi vpna
[H3C-vsi-vpna] gateway vsi-interface 2
# Enable VSI traffic statistics.
[H3C-vsi-vpna] statistics enable
[H3C-vsi-vpna] quit
Example: Obtain traffic statistics
[H3C]dis interface Vsi-interface 2
Vsi-interface2
........
Last clearing of counters: Never
Input (total): 31 packets, 3904 bytes
Output (total): 34 packets, 4096 bytes
Table 20 Command output
|
Field |
Description |
|
Last clearing of counters |
Last time when the reset counters interface vsi-interface command was used to clear interface statistics. This field displays Never if the reset counters interface vsi-interface command has never been used on the interface since the device startup. |
|
Input (total): 31 packets, 3904 bytes |
Total numbers of input packets and bytes. |
|
Output (total): 34 packets, 4096 bytes |
Total numbers of output packets and bytes. |
Collecting AC traffic statistics through MQC
Requirements
Obtain AC traffic statistics through MQC.
|
|
NOTE: Before you obtain AC traffic statistics through MQC, configure rules to match the target VXLAN tunnel in a traffic behavior, and apply the QoS policy referencing the traffic behavior to the Layer 2 Ethernet interface that acts as the outgoing interface for the target VXLAN tunnel. |
CLI
Task
Obtain traffic statistics for interface HundredGigE 1/0/30 through MQC.
|
|
NOTE: · The device supports configuring a traffic accounting action by using the accounting [ byte | packet ]* command. · The accounting byte command collects traffic statistics in bytes, while the accounting packet command collects traffic statistics in packets. If neither the byte keyword nor the packet keyword is specified for the accounting command, the device collects traffic statistics in packets. If both the byte and packet keywords are specified for the accounting command, the device collects traffic statistics in packets and bytes. · This example collects traffic statistics in packets. |
Procedure
|
|
NOTE: If sites are interconnected at Layer 2, specify the inner MAC addresses of traffic. If sites are interconnected at Layer 3, specify the inner IP addresses of traffic. |
· For Layer 2 interconnection:
# Create Layer 2 ACL 4000, and configure rule 0 to match VXLAN packets source from MAC address 0000-0000-0001 and destined for MAC address 0000-0000-0006.
<H3C> sys-view
[H3C] acl mac 4000
[H3C-acl-ipv4-adv-4000] rule 0 permit vxlan inner-source-mac 0000-0000-0001 ffff-ffff-ffff inner-dest-mac 0000-0000-0006 ffff-ffff-ffff
[H3C-acl-ipv4-adv-4000] quit
# Configure traffic class aa to match all traffic.
[H3C] traffic classifier aa
[H3C-classifier-aa] if-match acl 4000
[H3C-classifier-aa] quit
· For Layer 3 interconnection:
# Create advanced ACL 3000, and configure rule 0 to match VXLAN packets sourced from IP address 100.0.0.1 and destined for IP address 101.0.0.1 in VXLAN 1.
<H3C> sys-view
[H3C] acl advance 3000
[H3C-acl-ipv4-adv-3000] rule 0 permit vxlan vxlan-id 1 inner-protocol ip inner-source 100.0.0.1 0 inner-destination 101.0.0.1 0
[H3C-acl-ipv4-adv-3000] quit
# Configure traffic class aa to match all traffic.
[H3C] traffic classifier aa
[H3C-classifier-aa] if-match acl 3000
[H3C-classifier-aa] quit
# Configure traffic behavior aa to collect traffic statistics in packets.
[H3C]traffic behavior aa
[H3C-behavior-aa] accounting packet
[H3C-behavior-aa] quit
# Create a QoS policy, and associate traffic class aa with traffic behavior aa in the QoS policy.
[H3C]qos policy aa
[H3C-qospolicy-aa] classifier aa behavior aa
[H3C-qospolicy-aa] quit
# Apply the QoS policy to the inbound direction of interface HundredGigE 1/0/30.
[H3C] interface hundredgige 1/0/30
[H3C-HundredGigE1/0/30] qos apply policy aa inbound
[H3C-HundredGigE1/0/30] quit
Obtain traffic statistics
· # Obtain the VXLAN traffic statistics for interface HundredGigE 1/0/30 (Layer 2 interconnection).
[H3C]display qos policy interface HundredGigE 1/0/30
Interface: HundredGigE1/0/30
Direction: inbound
Policy: aa
Classifier: aa
Operator: AND
Rule(s) :
If-match acl 4000
Behavior: aa
Accounting enable:
98928876 (Packets)
· # Obtain the VXLAN traffic statistics for interface HundredGigE 1/0/30 (Layer 3 interconnection).
[H3C]display qos policy interface HundredGigE 1/0/30
Interface: HundredGigE1/0/30
Direction: inbound
Policy: aa
Classifier: aa
Operator: AND
Rule(s) :
If-match acl 3000
Behavior: aa
Accounting enable:
98928876 (Packets)
Table 21 Command output
|
Field |
Description |
|
Direction |
Direction in which the QoS policy is applied. |
|
policy |
QoS policy name. |
|
Classifier |
Traffic class name and its match criteria. |
|
Operator |
Operator for match criteria in the traffic class. |
|
Rule(s) |
Match criteria. |
|
Behavior |
Behavior name and its contents. |
|
Accounting enable |
Class-based accounting action. |
Learn more
For more information about configuring MQC, see QoS configuration and QoS commands for your device.
SNMP
Task
Use an NMS to obtain the VXLAN traffic statistics on interface HundredGigE 1/0/30 through SNMP.
Procedure
Obtain VXLAN traffic statistics for interface HundredGigE 1/0/30 through MQC, as shown in "Procedure."
Configure SNMP. For more information, see "Procedure."
Example: Obtain traffic statistics
|
|
NOTE: · This example uses the MIB browser to obtain the VXLAN traffic statistics on HundredGigE 1/0/30. · To obtain the VXLAN traffic statistics, you must first use the hh3cCBQoSIntApplyObjectIndex table with OID 1.3.6.1.4.1.25506.2.65.2.1.5.5.2.1.2 to obtain the object index of the QoS policy applied to the related interface. Then, use the index to obtain outbound VXLAN traffic statistics in the subtable of the hh3cCBQoSAccountingRunInfoEntry table with OID 1.3.6.1.4.1.25506.2.65.2.1.5.6.8.1. For more information about the hh3cCBQoSAccountingRunInfoEntry table, see the MIB references for your device. |
# As shown in Figure 76, obtain the index of interface HGE 1/0/30 through the ifDescr node (1.3.6.1.2.1.2.2.1.2). The query results dialog box shows that the index is 50 for interface HGE 1/0/30.
Figure 76 Obtaining the interface index

# Obtain the index of the QoS policy applied to the interface by the interface index in the hh3cCBQoSIntApplyObjectIndex table with OID 1.3.6.1.4.1.25506.2.65.2.1.5.5.2.1.2. As shown in Figure 77, the index of the QoS policy applied to interface HundredGigE 1/0/30 is 1.
Figure 77 Obtaining the index of a QoS policy applied to an interface
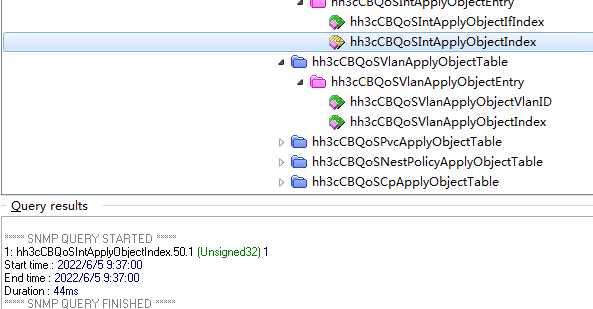
# As shown in Figure 78, use the hh3cCBQoSAccountingRunInfoEntry table (with OID 1.3.6.1.4.1.25506.2.65.2.1.5.6.8.1) to obtain the inbound VXLAN traffic statistics for HundredGigE 1/0/30.
Figure 78 Obtain traffic statistics
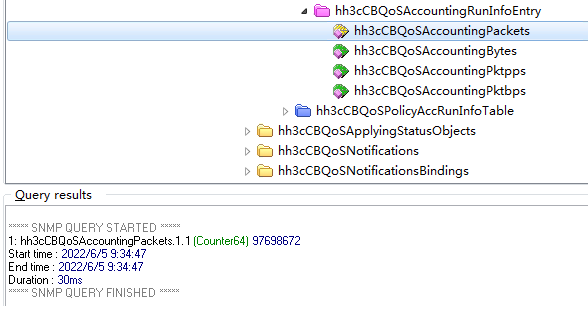
Learn more
For more information about configuring SNMP, see SNMP configuration in the configuration guides for your device.
For more information about MIB files, see the MIB references for your device.
NETCONF
Task
Install the NETCONF client software on the host, and use NETCONF to obtain VXLAN packet statistics for HundredGigE 1/0/30.
|
|
NOTE: The NETCONF client obtains interface traffic statistics through the NETCONF XML APIs provided by the device. |
Procedure
Obtain VXLAN traffic statistics for interface HundredGigE 1/0/30 through MQC, as shown in "Procedure."
Configure NETCONF. For more information, see "Procedure."
Example: Obtain traffic statistics
|
|
NOTE: The device provides the MQC/IfPolicyAccount table for collecting VXLAN traffic statistics. You can obtain statistics in bytes or packets by using the MQC/IfPolicyAccount table. |
This example uses the MQC/AccountRunInfo table to obtain statistics for interface HundredGigE 2/0/30.
# Execute the display system internal ifmgr list | include HundredGigE1/0/30 command in probe view on the device to obtain the index of interface HundredGigE 1/0/30.
<H3C> sys-view
[H3C] probe
[H3C-probe]display system internal ifmgr list | include HundredGigE1/0/30
HundredGigE1/0/30(index:50)
# Copy and paste the following message to the NETCONF client.
<rpc message-id="100" xmlns="urn:ietf:params:xml:ns:netconf:base:1.0">
<get-bulk>
<filter type="subtree">
<top xmlns="http://www.h3c.com/netconf/data:1.0">
<MQC>
<IfPolicyAccount>
<Interface>
<IfIndex>50</IfIndex> //Interface index
<Direction></Direction> //Direction in which the QoS policy is applied
<ClassName></ClassName> //Traffic class name
<Packets></Packets> //Traffic statistics in packets
<Bytes></Bytes> //Traffic statistics in bytes
<pps></pps> //Traffic statistics in pps
<bps></bps> //Traffic statistics in bps
</Interface>
</IfPolicyAccount>
</MQC>
</top>
</filter>
</get-bulk>
</rpc>
# If the client receives a message like the following, it indicates that the operation was successful.
<rpc-reply message-id="100" xmlns="urn:ietf:params:xml:ns:netconf:base:1.0">
<data>
<top xmlns="http://www.h3c.com/netconf/data:1.0">
<MQC>
<IfPolicyAccount>
<Interface>
<IfIndex>50</IfIndex>
<Direction>0</Direction>
<ClassName>aa</ClassName>
<Packets>98928876</Packets>
<pps>0</pps>
</Interface>
</IfPolicyAccount>
</MQC> </top>
</data>
</rpc-reply>
Learn more
For more information about configuring NETCONF, see NETCONF configuration in the configuration guides for your device.
For more information about MQC/IfPolicyAccount, see H3C Comware 7 NETCONF XML API Reference.
gRPC
Task
Use a collector to obtain the VXLAN traffic statistics for interface HundredGig E1/0/30 on the device through gRPC.
Figure 79 Network diagram for gRPC

Procedure
# Configure IP addresses as required so the device and the collector can reach each other. (Details not shown.)
# Enable gRPC.
<H3C> system-view
[H3C] grpc enable
# Create a sensor group named test, and add sensor path MQC/IfPolicyAccount.
|
|
NOTE: After sensor path MQC/IfPolicyAccount is added, the device will collect traffic statistics for all interfaces on the device and upload the statistics to the collector. |
[H3C] telemetry
[H3C-telemetry] sensor-group test
[H3C-telemetry-sensor-group-test] sensor path mqc/ifpolicyaccount
[H3C-telemetry-sensor-group-test] quit
# Create a destination group named collector1 and add a collector to the group. In this example, the collector receives data on port 50050 at IPv4 address 192.168.2.1.
[H3C-telemetry] destination-group collector1
[H3C-telemetry-destination-group-collector1] ipv4-address 192.168.2.1 port 50050
[H3C-telemetry-destination-group-collector1] quit
# Create subscription A, specify sensor group test for the subscription, set the data collection interval to 30 seconds, and specify destination group collector1 for the subscription.
[H3C-telemetry] subscription A
[H3C-telemetry-subscription-A] sensor-group test sample-interval 30
[H3C-telemetry-subscription-A] destination-group collector1
[H3C-telemetry-subscription-A] quit
Obtain traffic statistics
The collector receives data pushed by the device every 30 seconds.
Learn more
For more information about configuring gRPC, see gRPC configuration in the configuration guides.
Collecting VLAN traffic statistics
Requirements
Obtain VLAN traffic statistics through MQC.
CLI
Task
Obtain inbound and outbound traffic statistics of VLAN 2 through MQC.
|
|
NOTE: · The device supports configuring a traffic accounting action by using the accounting [ byte | packet ]* command. · The accounting byte command collects traffic statistics in bytes, while the accounting packet command collects traffic statistics in packets. If neither the byte keyword nor the packet keyword is specified for the accounting command, the device collects traffic statistics in packets. If both the byte and packet keywords are specified for the accounting command, the device collects traffic statistics in packets and bytes. · This example collects traffic statistics in packets. |
Procedure
# Configure traffic class aa to match all traffic.
<H3C> sys-view
[H3C] traffic classifier aa
[H3C-classifier-aa] if-match any
[H3C-classifier-aa] quit
# Configure traffic behavior aa to collect traffic statistics in packets.
[H3C]traffic behavior aa
[H3C-behavior-aa] accounting packet
[H3C-behavior-aa] quit
# Create a QoS policy, and associate traffic class aa with traffic behavior aa in the QoS policy.
[H3C]qos policy aa
[H3C-qospolicy-aa] classifier aa behavior aa
[H3C-qospolicy-aa] quit
# Apply the QoS policy to the inbound direction and outbound direction of the VLAN.
[H3C] qos vlan-policy aa vlan 2 inbound
[H3C] qos vlan-policy aa vlan 2 outbound
Obtain traffic statistics
# Obtain traffic statistics of VLAN 2.
[H3C]display qos vlan-policy 2
Vlan 2
Direction: Inbound
Policy: test
Classifier: test
Operator: AND
Rule(s) :
If-match any
Behavior: test
Accounting enable:
1193773738 (Packets)
Vlan 2
Direction: Outbound
Policy: test
Classifier: test
Operator: AND
Rule(s) :
If-match any
Behavior: test
Accounting enable:
250116562 (Packets)
Table 22 Command output
|
Field |
Description |
|
Direction |
Direction in which the QoS policy is applied. |
|
policy |
QoS policy name. |
|
Classifier |
Traffic class name and its contents, which could be of various types. |
|
Operator |
Logical relationship between match criteria. |
|
Rule(s) |
Match criteria |
|
if-match any |
Matches all packets passing through the interface. |
|
Behavior |
Name and content of the traffic behavior. |
|
Accounting enable |
Traffic accounting action. |
Learn more
For more information about configuring MQC, see QoS configuration and QoS commands for your device.
SNMP
Task
Use an NMS to obtain inbound traffic statistics of VLAN 2 through SNMP.
Figure 80 Network diagram for SNMP

Procedure
Configure MQC to obtain traffic statistics of the VLAN. For more information, see "Procedure."
Configure SNMP. For more information, see "Procedure."
Example: Obtain traffic statistics
|
|
NOTE: · This example obtains the inbound traffic statistics of tunnel0 through the MIB browser. · Assume that a QoS policy has been configured and applied to the inbound direction of VLAN 2 on the device. · To obtain the traffic statistics of the VLAN, you must first use the hh3cCBQoSVlanApplyObjectIndex table with OID 1.3.6.1.4.1.25506.2.65.2.1.5.5.3.1.2 to obtain the index of the QoS policy applied to the VLAN. Then, use the index of the QoS policy to obtain the traffic statistics of the VLAN in the subtable of the hh3cCBQoSAccountingRunInfoEntry table with OID 1.3.6.1.4.1.25506.2.65.2.1.5.6.8.1. For more information about the hh3cCBQoSAccountingRunInfoEntry table, see the MIB references for your device. |
# Use the hh3cCBQoSVlanApplyObjectIndex table with OID 1.3.6.1.4.1.25506.2.65.2.1.5.5.3.1.2 to obtain the index of the QoS policy applied to VLAN 2. As shown in Figure 81, the query results dialog box shows that the index is 1 for the QoS policy applied to the VLAN.
Figure 81 Obtaining the interface index
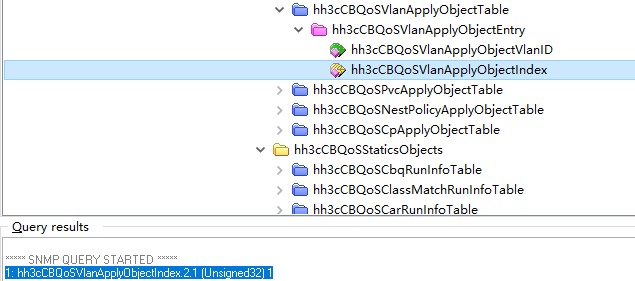
|
|
NOTE: In the query results of the hh3cCBQoSVlanApplyObjectIndex table as shown in Figure 81, 2.1 indicates that the QoS policy is applied in the inbound direction of VLAN 2, and 1 is the index of the QoS policy applied to VLAN 2. |
# Use the index obtained in the preceding step to obtain the traffic statistics of VLAN 2 in the subtable of the hh3cCBQoSAccountingRunInfoEntry table with OID 1.3.6.1.4.1.25506.2.65.2.1.5.6.8.1. As shown in Figure 82, obtain the statistics in packets. The query results dialog shows that 100 packets are received in VLAN 2.
Figure 82 Obtain traffic statistics
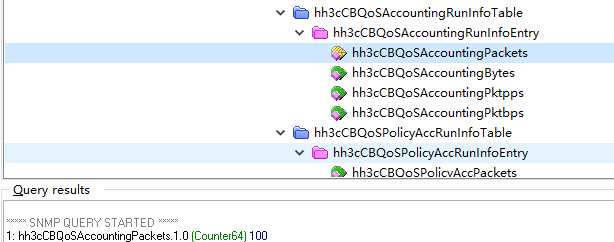
Learn more
For more information about configuring SNMP, see SNMP configuration in the configuration guides for your device.
For more information about MIB files, see the MIB references for your device.
NETCONF
Task
Install the NETCONF client software on the host, and use NETCONF to obtain traffic statistics of VLAN 2 on the device named Agent.
Figure 83 Network diagram for SNMP

|
|
NOTE: The NETCONF client obtains interface traffic statistics through the NETCONF XML APIs provided by the device. |
Procedure
Configure MQC to obtain traffic statistics of the VLAN. For more information, see "Procedure."
Configure NETCONF. For more information, see "Procedure."
Example: Obtain traffic statistics
|
|
NOTE: The device provides the MQC/VLANPolicyAccount table for collecting packet statistics of a VLAN. You can obtain statistics in bytes or packets by using the MQC/VLANPolicyAccount table. |
This example uses the MQC/AccountRunInfo table to obtain statistics of VLAN 2.
# Copy and paste the following message to the NETCONF client.
<rpc message-id="100" xmlns="urn:ietf:params:xml:ns:netconf:base:1.0">
<get-bulk>
<filter type="subtree">
<top xmlns="http://www.h3c.com/netconf/data:1.0">
<MQC>
<VLANPolicyAccount>
<VLAN>
<VLANID>2</VLANID>
<Direction></Direction>
<ClassName></ClassName>
<Packets></Packets>
<Bytes></Bytes>
<pps></pps>
<bps></bps>
</VLAN>
</VLANPolicyAccount>
</MQC>
</top>
</filter>
</get-bulk>
</rpc>
# If the client receives a message like the following, it indicates that the operation was successful.
<rpc-reply message-id="100" xmlns="urn:ietf:params:xml:ns:netconf:base:1.0">
<data>
<top xmlns="http://www.h3c.com/netconf/data:1.0">
<MQC>
<VLANPolicyAccount>
<VLAN>
<VLANID>2</VLANID> //VLAN ID
<Direction>0</Direction> //0 for inbound and 1 for outbound
<ClassName>test</ClassName> //Traffic class name
<Packets>52133621124</Packets> //Traffic statistics in packets
<Bytes></Bytes> //Traffic statistics in bytes
<pps>12668937</pps> //Traffic statistics in pps
<bps></bps> //Traffic statistics in bps
</VLAN>
</VLANPolicyAccount>
/MQC>
</top>
</data>
</rpc-reply>
Learn more
For more information about configuring NETCONF, see NETCONF configuration in the configuration guides for your device.
For more information about MQC/AccountRunInfo, see H3C Comware 7 NETCONF XML API Reference.
gRPC
Task
Use a collector to obtain traffic statistics of the device by using gRPC.
Figure 84 gRPC network diagram

Procedure
# Configure IP addresses as required so the device and the collector can reach each other. (Details not shown.)
# Configure MQC to obtain traffic statistics of the VLAN. For more information, see "Procedure."
# Enable gRPC.
<H3C> system-view
[H3C] grpc enable
# Create a sensor group named test, and add sensor path MQC/VLANPolicyAccount.
|
|
NOTE: After sensor path MQC/VLANPolicyAccount is added, the device will collect traffic statistics of all VLANs with QoS policies applied and upload the statistics to the collector. |
[H3C] telemetry
[H3C-telemetry] sensor-group test
[H3C-telemetry-sensor-group-test] sensor path mqc/vlanpolicyaccount
[H3C-telemetry-sensor-group-test] quit
# Create a destination group named collector1 and add a collector to the group. In this example, the collector receives data on port 50050 at IPv4 address 192.168.2.1.
[H3C-telemetry] destination-group collector1
[H3C-telemetry-destination-group-collector1] ipv4-address 192.168.2.1 port 50050
[H3C-telemetry-destination-group-collector1] quit
# Configure a subscription named A to bind sensor group test with destination group collector1. Set the data sampling interval to 30 seconds.
[H3C-telemetry] subscription A
[H3C-telemetry-subscription-A] sensor-group test sample-interval 30
[H3C-telemetry-subscription-A] destination-group collector1
[H3C-telemetry-subscription-A] quit
Obtain traffic statistics
The collector receives data pushed by the device every 30 seconds.
Learn more
For more information about configuring gRPC, see gRPC configuration in the configuration guides for your device.
Collecting VPN instance traffic statistics
Requirements
Obtain traffic statistics for a VPN instance through MQC.
|
|
NOTE: · Only the S6850, S9850, S6805, and S6825 switch series support VPN instance traffic statistics. · Before obtaining the traffic of a VPN instance through MQC, you must configure an ACL to match the VPN instance in a traffic class, and apply a QoS policy that references the traffic class to the interface bound to the VPN instance. The device supports obtaining MQC traffic statistics through CLI, SNMP, NETCONF, and gRPC. |
CLI
Task
Obtain inbound traffic statistics for VPN instance vpn1 through MQC.
|
|
NOTE: · The device supports configuring a traffic accounting action by using the accounting [ byte | packet ]* command. · The accounting byte command collects traffic statistics in bytes, while the accounting packet command collects traffic statistics in packets. If neither the byte keyword nor the packet keyword is specified for the accounting command, the device collects traffic statistics in packets. If both the byte and packet keywords are specified for the accounting command, the device collects traffic statistics in packets and bytes. · This example collects traffic statistics in packets. |
Procedure
# Create advanced ACL 3000. Configure rule 0 to match inbound IP packets of VPN instance vpn1.
<H3C> sys-view
[H3C] acl advance 3000
[H3C-acl-ipv4-adv-3000] rule 0 permit ip vpn-instance vpn1
[H3C-acl-ipv4-adv-3000] quit
# Configure traffic class aa to match all traffic.
[H3C] traffic classifier aa
[H3C-classifier-aa] if-match any
[H3C-classifier-aa] quit
# Configure traffic behavior aa to collect traffic statistics in packets.
[H3C]traffic behavior aa
[H3C-behavior-aa] accounting packet
[H3C-behavior-aa] quit
# Create a QoS policy, and associate traffic class aa with traffic behavior aa in the QoS policy.
[H3C]qos policy aa
[H3C-qospolicy-aa] classifier aa behavior aa
[H3C-qospolicy-aa] quit
# Apply the QoS policy to the inbound direction of interface HundredGigE 1/0/30.
[H3C] interface hundredgige 1/0/30
[H3C-HundredGigE1/0/30] qos apply policy aa inbound
[H3C-HundredGigE1/0/30] quit
Example: Obtain traffic statistics
# Obtain the traffic statistics for interface HundredGigE 1/0/30.
[H3C]display qos policy interface HundredGigE 1/0/30
Interface: HundredGigE1/0/30
Direction: Inbound
Policy: aa
Classifier: aa
Operator: AND
Rule(s) :
If-match acl 3000
Behavior: aa
Accounting enable:
98928876 (Packets)
|
Field |
Description |
|
Direction |
Direction in which the QoS policy is applied. |
|
policy |
QoS policy name. |
|
Classifier |
Traffic class name and its contents, which could be of various types. |
|
Operator |
Logical relationship between match criteria. |
|
Rule(s) |
Match criteria. |
|
if-match acl 3000 |
Matches packets that match ACL 3000 and pass through the interface. |
|
Behavior |
Name and content of the traffic behavior. |
|
Accounting enable |
Traffic accounting action. |
Learn more
For more information about configuring MQC, see QoS configuration and QoS commands for your device.
SNMP
Task
Use an NMS to obtain the inbound traffic statistics for VPN instance vpn1 through SNMP.
Figure 85 Network diagram for SNMP

Procedure
Configure MQC to obtain inbound traffic statistics for VPN instance vpn1. For more information, see "Procedure."
Configure SNMP. For more information, see "SNMP."
Example: Obtain traffic statistics
|
|
NOTE: · This example obtains the inbound traffic statistics for VPN instance vpn1 through the MIB browser. · To obtain the traffic statistics for the VPN, you must first use the hh3cCBQoSIntApplyObjectIndex table with OID 1.3.6.1.4.1.25506.2.65.2.1.5.5.3.1.2 to obtain the index of the QoS policy applied to the specified interface. Then, use the index of the QoS policy to obtain the traffic statistics for the VPN instance in the subtable of the hh3cCBQoSAccountingRunInfoEntry table with OID 1.3.6.1.4.1.25506.2.65.2.1.5.6.8.1. For more information about the hh3cCBQoSAccountingRunInfoEntry table, see the MIB references for your device. |
As shown in Figure 86, use the ifDescr node (1.3.6.1.2.1.31.1.1.1.1.2) to obtain the index of interface HGE 1/0/30. The query results dialog box shows that the index is 50 for interface HGE 1/0/30.
Figure 86 Obtaining the interface index

# Obtain the index of the QoS policy applied to the interface by the interface index in the hh3cCBQoSIntApplyObjectIndex table with OID 1.3.6.1.4.1.25506.2.65.2.1.5.5.2.1.2. As shown in Figure 87, the index of the QoS policy applied to interface HundredGigE 1/0/30 is 6.
Figure 87 Obtaining the index of a QoS policy applied to an interface
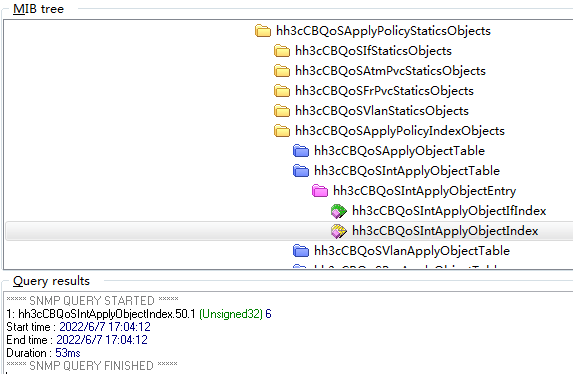
# As shown in Figure 88, use the hh3cCBQoSAccountingRunInfoEntry table (with OID 1.3.6.1.4.1.25506.2.65.2.1.5.6.8.1) to obtain the inbound traffic statistics (in packets) of VPN instance vpn1.
Figure 88 Obtain traffic statistics
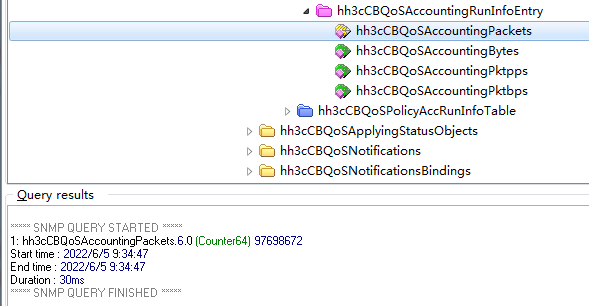
Learn more
For more information about configuring SNMP, see SNMP configuration in the configuration guides for your device.
For more information about MIB files, see the MIB references for your device.
NETCONF
Task
Install the NETCONF client software on the host, and use NETCONF to obtain traffic statistics for Layer 2 Ethernet interface HGE 2/0/25 on the device named Agent.
Figure 89 Network diagram for NETCONF

|
|
NOTE: The NETCONF client obtains interface traffic statistics through the NETCONF XML APIs provided by the device. |
Procedure
Configure MQC to obtain inbound traffic statistics for VPN instance vpn1. For more information, see "Procedure."
Configure NETCONF. For more information, see "NETCONF."
Example: Obtain traffic statistics
|
|
NOTE: The device provides the MQC/IfPolicyAccount table for collecting packet statistics for an interface. You can obtain statistics in bytes or packets by using the MQC/IfPolicyAccount table. |
This example uses the MQC/IfPolicyAccount table to obtain statistics for interface HundredGigE 2/0/25.
# Copy and paste the following message to the NETCONF client.
<rpc message-id="100" xmlns="urn:ietf:params:xml:ns:netconf:base:1.0">
<get-bulk>
<filter type="subtree">
<top xmlns="http://www.h3c.com/netconf/data:1.0">
<MQC>
<IfPolicyAccount>
<Interface>
<IfIndex>50</IfIndex> //Interface index
<Direction></Direction> //QoS policy application direction
<ClassName></ClassName> //Traffic class name
<Packets></Packets> //Traffic statistics in packets
<Bytes></Bytes> //Traffic statistics in bytes
<pps></pps> //Traffic statistics in pps
<bps></bps> //Traffic statistics in bps
</Interface>
</IfPolicyAccount>
</MQC>
</top>
</filter>
</get-bulk>
</rpc>
# If the client receives a message like the following, it indicates that the operation was successful.
<rpc-reply message-id="100" xmlns="urn:ietf:params:xml:ns:netconf:base:1.0">
<data>
<top xmlns="http://www.h3c.com/netconf/data:1.0">
<MQC>
<IfPolicyAccount>
<Interface>
<IfIndex>50</IfIndex>
<Direction>0</Direction>
<ClassName>aa</ClassName>
<Packets>98928876</Packets>
<pps>0</pps>
</Interface>
</IfPolicyAccount>
</MQC> </top>
</data>
</rpc-reply>
Learn more
For more information about configuring NETCONF, see NETCONF configuration in the configuration guides for your device.
For more information about MQC/AccountRunInfo, see H3C Comware 7 NETCONF XML API Reference.
gRPC
Task
Use a collector to obtain traffic statistics for Layer 2 Ethernet interface HGE 1/0/30 on the device by using gRPC.
Figure 90 Network diagram for gRPC

Procedure
# Configure IP addresses as required so the device and the collector can reach each other. (Details not shown.)
# Configure MQC to obtain inbound traffic statistics for VPN instance vpn1. For more information, see "Procedure."
# Enable gRPC.
<H3C> system-view
[H3C] grpc enable
# Create a sensor group named test, and add sensor path MQC/IfPolicyAccount.
|
|
NOTE: After sensor path MQC/IfPolicyAccount is added, the device will collect traffic statistics for all interfaces on the device and upload the statistics to the collector. |
[H3C] telemetry
[H3C-telemetry] sensor-group test
[H3C-telemetry-sensor-group-test] sensor path mqc/ifpolicyaccount
[H3C-telemetry-sensor-group-test] quit
# Create a destination group named collector1 and add a collector to the group. In this example, the collector receives data on port 50050 at IPv4 address 192.168.2.1.
[H3C-telemetry] destination-group collector1
[H3C-telemetry-destination-group-collector1] ipv4-address 192.168.2.1 port 50050
[H3C-telemetry-destination-group-collector1] quit
# Configure a subscription named A to bind sensor group test with destination group collector1. Set the data sampling interval to 30 seconds.
[H3C-telemetry] subscription A
[H3C-telemetry-subscription-A] sensor-group test sample-interval 30
[H3C-telemetry-subscription-A] destination-group collector1
[H3C-telemetry-subscription-A] quit
Example: Obtain traffic statistics
The collector receives data pushed by the device every 30 seconds.
Learn more
For more information about configuring gRPC, see gRPC configuration in the configuration guides for your device.
Collecting queue traffic statistics
|
|
NOTE: This chapter describe how to collect queue traffic statistics by using the following methods: CLI, SNMP, NETCONF, and gRPC. Before you can collect queue traffic statistics, configure a QoS policy for traffic statistics collection and apply it to an interface or VLAN. |
Collecting traffic statistics for interface queues
Requirements
Obtain outbound traffic statistics of interface queues.
|
· |
NOTE: · Only outbound traffic statistics collection is supported. · The number of forwarded packets, the number of dropped packets, and the current queue length can be collected. |
CLI
Task
Obtain per-queue traffic statistics in the outbound direction of HundredGigE 1/0/29.
Obtain traffic statistics
# Obtain the traffic statistics of interface HundredGigE 1/0/29.
<H3C> display qos queue-statistics interface hundredgige 1/0/29 outbound
Interface: HundredGigE1/0/29
Direction: outbound
Forwarded: 8614890247 packets, 1498990957070 bytes
Dropped: 22096410 packets, 2828340480 bytes
Queue 0
Forwarded: 0 packets, 0 bytes, 0 pps, 0 bps
Dropped: 0 packets, 0 bytes
Current queue length: 0 packets
Queue 1
Forwarded: 0 packets, 0 bytes, 0 pps, 0 bps
Dropped: 0 packets, 0 bytes
Current queue length: 0 packets
Queue 2
Forwarded: 8614889788 packets, 1498990823112 bytes, 7184 pps, 10001024 bps
Dropped: 22096410 packets, 2828340480 bytes
Current queue length: 26142 packets
Queue 3
Forwarded: 0 packets, 0 bytes, 0 pps, 0 bps
Dropped: 0 packets, 0 bytes
Current queue length: 0 packets
Queue 4
Forwarded: 0 packets, 0 bytes, 0 pps, 0 bps
Dropped: 0 packets, 0 bytes
Current queue length: 0 packets
Queue 5
Forwarded: 0 packets, 0 bytes, 0 pps, 0 bps
Dropped: 0 packets, 0 bytes
Current queue length: 0 packets
Queue 6
Forwarded: 0 packets, 0 bytes, 0 pps, 0 bps
Dropped: 0 packets, 0 bytes
Current queue length: 0 packets
Queue 7
Forwarded: 459 packets, 133958 bytes, 0 pps, 0 bps
Dropped: 0 packets, 0 bytes
Current queue length: 0 packets
Table 24 Command output
|
Field |
Description |
|
Interface |
Interface whose per-queue traffic statistics are to be displayed. |
|
Direction |
Direction whose per-queue traffic statistics are to be displayed. |
|
Forwarded |
The number of packets forwarded and the number of bytes forwarded. |
|
Dropped |
The number of packets dropped and the bytes of packets dropped. The two 1-Gbps SFP interfaces on rear panels of the S9850-4C, S9850-32H, and S6850-56HF switches do not support the number of packets dropped and the bytes of packets dropped. |
|
Queue 0, Queue 1, Queue 2, Queue 3, Queue 4, Queue 5, Queue 6, Queue 7 |
Traffic statistics of a queue |
|
Current queue length |
The current queue length. |
Learn more
For more information about configuring MQC, see QoS configuration and QoS commands for your device.
SNMP
Task
Use an NMS to obtain the outbound queue traffic statistics of interface HundredGigE 1/0/29 through SNMP.
Figure 91 Network diagram for SNMP

Procedure
Configure SNMP. For more information, see "Procedure."
Example: Obtain traffic statistics
|
· |
NOTE: · This example uses the MIB browser to obtain the queue traffic statistics on the device named Agent. · To obtain the queue traffic statistics for an interface, first obtain the interface index by using the ifDescr table (OID: 1.3.6.1.2.1.2.2.1.2). · The interface index might vary by the ID of the IRF member device hosting the interface. |
As shown in Figure 92, use the ifDescr subnode (1.3.6.1.2.1.31.1.1.1.1.2) of the ifName (1.3.6.1.2.1.31.1.1.1.1) node to obtain the index of HGE1/0/29. The query results dialog box shows that the index is 45 for interface HGE 1/0/29.
Figure 92 Obtaining the interface index

# Obtain the queue traffic statistics by the interface index in the hh3cIfQoSHardwareQueueRunInfoEntry table with OID 1.3.6.1.4.1.25506.2.65.1.1.2.1.1, as shown in Figure 93.
|
· |
NOTE: You can obtain the following queue traffic statistics in the hh3cIfQoSHardwareQueueRunInfoEntry table: · Number of packets forwarded (hh3cIfQoSPassPackets, OID: 1.3.6.1.4.1.25506.2.65.1.1.2.1.1.1). · Number of packets dropped (hh3cIfQoSDropPackets, OID: 1.3.6.1.4.1.25506.2.65.1.1.2.1.1.2). · Number of bytes forwarded (hh3cIfQoSPassBytes, OID: 1.3.6.1.4.1.25506.2.65.1.1.2.1.1.3). · Number of bytes dropped (hh3cIfQoSDropPBytes, OID: 1.3.6.1.4.1.25506.2.65.1.1.2.1.1.6). · Current queue length (hh3cIfQoSCurQueuePkts, OID: 1.3.6.1.4.1.25506.2.65.1.1.2.1.1.1; hh3cIfQoSCurQueueBytes, OID: 1.3.6.1.4.1.25506.2.65.1.1.2.1.1.10). |
The following takes obtaining the number of packets forwarded as an example. For more information, see the MIB files for the device.
Figure 93 Obtaining the number of packets forwarded
Learn more
For more information about configuring SNMP, see SNMP configuration in the configuration guides for your device.
For more information about MIB files, see the MIB references for your device.
NETCONF
Task
Install the NETCONF client software on a host, and use NETCONF to obtain the queue traffic statistics of interface HGE 1/0/29 on the device named Agent.
Figure 94 Network diagram for SNMP

|
|
NOTE: The NETCONF client obtains interface traffic statistics through the NETCONF XML APIs provided by the device. |
Procedure
Configure NETCONF. For more information, see "Procedure."
Example: Obtain traffic statistics
|
|
NOTE: The device provides the QSTAT/InterfaceStat table for collecting interface queue traffic statistics. You can obtain statistics in bytes or packets by using the QSTAT/InterfaceStat table. |
This example uses the QSTAT/InterfaceStat table to obtain statistics of interface HundredGigE 1/0/29.
# Execute the display system internal ifmgr list | include HundredGigE21/0/29 command in probe view on the device to obtain the index of interface HundredGigE 1/0/29.
[H3C-probe]display system internal ifmgr list | include HundredGigE1/0/29
HundredGigE1/0/29(index:45)
# Copy and paste the following message to the NETCONF client.
<rpc message-id="100" xmlns="urn:ietf:params:xml:ns:netconf:base:1.0">
<get-bulk>
<filter type="subtree">
<top xmlns="http://www.h3c.com/netconf/data:1.0">
<QSTAT>
<InterfaceStat>
<Statistics>
<IfIndex>45</IfIndex>
<Direction></Direction>
<PassPacket></PassPacket>
<PassByte></PassByte>
<DropPacket></DropPacket>
<DropByte></DropByte>
<AgingPacket></AgingPacket>
<AgingByte></AgingByte>
</Statistics>
</InterfaceStat>
</QSTAT>
</top>
</filter>
</get-bulk>
</rpc>
If the requested operation succeeds, the device responds with the requested NETCONF configuration datastore. The following is a sample response:
<rpc-reply message-id="100" xmlns="urn:ietf:params:xml:ns:netconf:base:1.0">
<data>
<top xmlns="http://www.h3c.com/netconf/data:1.0">
<QSTAT>
<InterfaceStat>
<Statistics>
<IfIndex>45</IfIndex>
<Direction>1</Direction>
<PassPacket>578853253273</PassPacket>
<PassByte>97793557880219</PassByte>
<DropPacket>67748792372</DropPacket>
<DropByte>8671845423616</DropByte>
<AgingPacket></AgingPacket>
<AgingByte></AgingByte>
</Statistics>
</InterfaceStat>
</QSTAT>
</top>
</data>
</rpc-reply>
Learn more
For more information about configuring NETCONF, see NETCONF configuration in the configuration guides for your device.
For more information about QSTAT/QueueStat, see H3C Comware 7 NETCONF XML API Reference.
gRPC
Task
Use a collector to obtain the outbound traffic statistics of interface HGE 1/0/29 on the device through gRPC.
Figure 95 Network diagram for gRPC

Procedure
# Configure IP addresses as required so the device and the collector can reach each other. (Details not shown.)
# Enable gRPC.
<H3C> system-view
[H3C] grpc enable
# Create a sensor group named test, and add sensor path QSTAT/InterfaceStat.
|
|
NOTE: After sensor path QSTAT/InterfaceStat is added, the device will collect traffic statistics of all interfaces on the device and upload the statistics to the collector. |
[H3C] telemetry
[H3C-telemetry] sensor-group test
[H3C-telemetry-sensor-group-test] sensor path qstat/interfacestat
[H3C-telemetry-sensor-group-test] quit
# Create a destination group named collector1 and add a collector to the group. In this example, the collector receives data on port 50050 at IPv4 address 192.168.2.1.
[H3C-telemetry] destination-group collector1
[H3C-telemetry-destination-group-collector1] ipv4-address 192.168.2.1 port 50050
[H3C-telemetry-destination-group-collector1] quit
# Configure a subscription named A to bind sensor group test with destination group collector1. Set the data sampling interval to 30 seconds.
[H3C-telemetry] subscription A
[H3C-telemetry-subscription-A] sensor-group test sample-interval 30
[H3C-telemetry-subscription-A] destination-group collector1
[H3C-telemetry-subscription-A] quit
Obtain traffic statistics
The collector receives data pushed by the device every 30 seconds.
Learn more
For more information about configuring gRPC, see gRPC configuration in the configuration guides for your device.
Collecting buffer traffic statistics for queues
Requirements
Obtain buffer traffic statistics for queues.
CLI
Task
Obtain buffer traffic statistics for queues of HundredGigE 1/0/30.
Obtain traffic statistics
# Obtain buffer traffic statistics for queues of HundredGigE 1/0/30.
[H3C]display buffer usage interface HundredGigE 1/0/30
Interface QueueID Total Used Threshold(%) Violations
--------------------------------------------------------------------------------
HGE1/0/30 0 26214 0 70 0
1 26214 0 70 0
2 26214 0 70 0
3 26214 0 70 0
4 26214 0 70 0
5 26214 0 70 0
6 26214 0 70 0
7 26214 0 70 0
Table 25 Command output
|
Field |
Description |
|
Interface |
Interface name. |
|
QueueID |
Queue number |
|
Total |
Data buffer size allowed for a queue, in number of cell resources. |
|
Used |
Data buffer size that has been used by a queue, in number of cell resource. |
|
Threshold(%) |
Buffer usage threshold for a queue. The threshold value is the same as the per-interface threshold value. |
|
Violations |
Number of threshold violations for a queue. The value of this field is reset upon a switch reboot. |
SNMP
Task
Use an NMS to obtain the buffer traffic statistics for queues of interface HundredGigE 1/0/30 through SNMP.
Figure 96 Network diagram for SNMP

Procedure
Configure SNMP. For more information, see "Procedure."
Example: Obtain traffic statistics
|
|
NOTE: This example uses the MIB browser to obtain the buffer traffic statistics for queues of interface HundredGigE 1/0/30 on the device named Agent. |
Learn more
For more information about configuring SNMP, see SNMP configuration in the configuration guides for your device.
For more information about MIB files, see the MIB references for your device.
NETCONF
Task
Install the NETCONF client software on the host, and use NETCONF to obtain queue buffer traffic statistics of interface HGE 1/0/30 on the device named Agent.
Figure 97 Network diagram for SNMP

|
· |
NOTE: The NETCONF client obtains interface traffic statistics through the NETCONF XML APIs provided by the device. |
Procedure
Configure NETCONF. For more information, see "Procedure."
Example: Obtain traffic statistics
|
· |
NOTE: The device provides the QSTAT/QueueStat table for collecting interface queue traffic statistics. You can obtain statistics in bytes or packets by using the QSTAT/InterfaceStat table. |
This example uses the QSTAT/InterfaceStat table to obtain statistics of interface HundredGigE 1/0/30.
# Execute the display system internal ifmgr list | include HundredGigE1/0/30 command in probe view on the device to obtain the index of interface HundredGigE 1/0/30.
[H3C-probe]display system internal ifmgr list | include HundredGigE1/0/30
HundredGigE1/0/30(index:50)
# Copy and paste the following message to the NETCONF client.
<rpc message-id="100" xmlns="urn:ietf:params:xml:ns:netconf:base:1.0">
<get-bulk>
<filter type="subtree">
<top xmlns="http://www.h3c.com/netconf/data:1.0">
<QSTAT>
<InterfaceStat>
<Statistics>
<IfIndex>50</IfIndex>
<Direction></Direction>
<QueueID></QueueID>
<PassPkt></PassPkt>
<PassByte></PassByte>
<DropPkt></DropPkt>
<DropByte></DropByte>
<PacketRate></PacketRate>
<BitRate></BitRate>
<PeakPacketRate></PeakPacketRate>
<PeakBitRate></PeakBitRate>
<TotalQueLen></TotalQueLen>
<CurrQueLen></CurrQueLen>
<QueUseRatio></QueUseRatio>
</Statistics>
</InterfaceStat>
</QSTAT>
</top>
</filter>
</get-bulk>
</rpc>
If the requested operation succeeds, the device responds with the requested NETCONF configuration datastore. The following is a sample response:
<rpc-reply message-id="100" xmlns="urn:ietf:params:xml:ns:netconf:base:1.0">
<data>
<top xmlns="http://www.h3c.com/netconf/data:1.0">
<QSTAT>
<QueueStat>
<Statistics>
<IfIndex>50</IfIndex>
<Direction>1</Direction>
<QueueID>0</QueueID>
<PassPkt>0</PassPkt>
<PassByte>0</PassByte>
<DropPkt>0</DropPkt>
<DropByte>0</DropByte>
<PacketRate>0</PacketRate>
<BitRate>0</BitRate>
<CurrQueLen>0</CurrQueLen>
</Statistics>
<Statistics>
<IfIndex>50</IfIndex>
<Direction>1</Direction>
<QueueID>1</QueueID>
<PassPkt>0</PassPkt>
<PassByte>0</PassByte>
<DropPkt>0</DropPkt>
<DropByte>0</DropByte>
<PacketRate>0</PacketRate>
<BitRate>0</BitRate>
<CurrQueLen>0</CurrQueLen>
</Statistics>
<Statistics>
<IfIndex>50</IfIndex>
<Direction>1</Direction>
<QueueID>2</QueueID>
<PassPkt>3983693702452</PassPkt>
<PassByte>533804491661232</PassByte>
<DropPkt>2705999003341</DropPkt>
<DropByte>346367872427648</DropByte>
<PacketRate>11260285</PacketRate>
<BitRate>11528004744</BitRate>
<CurrQueLen>2</CurrQueLen>
</Statistics>
<Statistics>
<IfIndex>50</IfIndex>
<Direction>1</Direction>
<QueueID>3</QueueID>
<PassPkt>0</PassPkt>
<PassByte>0</PassByte>
<DropPkt>0</DropPkt>
<DropByte>0</DropByte>
<PacketRate>0</PacketRate>
<BitRate>0</BitRate>
<CurrQueLen>0</CurrQueLen>
</Statistics>
<Statistics>
<IfIndex>50</IfIndex>
<Direction>1</Direction>
<QueueID>4</QueueID>
<PassPkt>0</PassPkt>
<PassByte>0</PassByte>
<DropPkt>0</DropPkt>
<DropByte>0</DropByte>
<PacketRate>0</PacketRate>
<BitRate>0</BitRate>
<CurrQueLen>0</CurrQueLen>
</Statistics>
<Statistics>
<IfIndex>50</IfIndex>
<Direction>1</Direction>
<QueueID>5</QueueID>
<PassPkt>0</PassPkt>
<PassByte>0</PassByte>
<DropPkt>0</DropPkt>
<DropByte>0</DropByte>
<PacketRate>0</PacketRate>
<BitRate>0</BitRate>
<CurrQueLen>0</CurrQueLen>
</Statistics>
<Statistics>
<IfIndex>50</IfIndex>
<Direction>1</Direction>
<QueueID>6</QueueID>
<PassPkt>0</PassPkt>
<PassByte>0</PassByte>
<DropPkt>0</DropPkt>
<DropByte>0</DropByte>
<PacketRate>0</PacketRate>
<BitRate>0</BitRate>
<CurrQueLen>0</CurrQueLen>
</Statistics>
<Statistics>
<IfIndex>50</IfIndex>
<Direction>1</Direction>
<QueueID>7</QueueID>
<PassPkt>314548</PassPkt>
<PassByte>39913188</PassByte>
<DropPkt>0</DropPkt>
<DropByte>0</DropByte>
<PacketRate>0</PacketRate>
<BitRate>0</BitRate>
<CurrQueLen>0</CurrQueLen>
</Statistics>
</QueueStat>
</QSTAT>
</top>
</data>
</rpc-reply>
Learn more
For more information about configuring NETCONF, see NETCONF configuration in the configuration guides for your device.
For more information about QSTAT/QueueStat, see H3C Comware 7 NETCONF XML API Reference.
gRPC
Task
Use a collector to obtain the queue buffer traffic statistics of interface HGE 1/0/30 on the device through gRPC.
Figure 98 Network diagram for gRPC

Procedure
# Configure IP addresses as required so the device and the collector can reach each other. (Details not shown.)
# Enable gRPC.
<H3C> system-view
[H3C] grpc enable
# Create a sensor group named test, and add sensor path QSTAT/QueueStat.
|
|
NOTE: After sensor path QSTAT/QueueStat is added, the device will collect traffic statistics of all interface queue buffers and upload the statistics to the collector. |
[H3C] telemetry
[H3C-telemetry] sensor-group test
[H3C-telemetry-sensor-group-test] sensor path qstat/queuestat
[H3C-telemetry-sensor-group-test] quit
# Create a destination group named collector1 and add a collector to the group. In this example, the collector receives data on port 50050 at IPv4 address 192.168.2.1.
[H3C-telemetry] destination-group collector1
[H3C-telemetry-destination-group-collector1] ipv4-address 192.168.2.1 port 50050
[H3C-telemetry-destination-group-collector1] quit
# Configure a subscription named A to bind sensor group test with destination group collector1. Set the data sampling interval to 30 seconds.
[H3C-telemetry] subscription A
[H3C-telemetry-subscription-A] sensor-group test sample-interval 30
[H3C-telemetry-subscription-A] destination-group collector1
[H3C-telemetry-subscription-A] quit
Obtain traffic statistics
The collector receives data pushed by the device every 30 seconds.
Learn more
For more information about configuring gRPC, see gRPC configuration in the configuration guides for your device.
Collecting packet drop statistics for queues
Requirements
Obtain packet drop statistics for queues.
CLI
Task
Obtain the packet drop statistics for queues of HundredGigE 1/0/29.
Procedure
No configuration is required.
Obtain packet drop statistics
# Obtain the packet drop statistics of HundredGigE 1/0/29.
[H3C]display packet-drop interface hundredgige1/0/29
HundredGigE1/0/29:
Packets dropped due to Fast Filter Processor (FFP): 0
Packets dropped due to Egress Filter Processor (EFP): : 0
Packets dropped due to STP non-forwarding state: 0
Packets dropped due to insufficient data buffer. Input dropped: 0 Output dropped: 2126145448
Packets of ECN marked: 0
Packets of WRED droped: 0
Table 26 Command output
|
Field |
Description |
|
Packets dropped due to Fast Filter Processor (FFP) |
Number of packets dropped by inbound packet filters. |
|
Packets dropped due to Egress Filter Processor (EFP) |
Number of packets dropped by outbound packet filters. |
|
Packets dropped due to STP non-forwarding state |
Number of packets dropped because STP is in the non-forwarding state. |
|
Packets dropped due to insufficient data buffer. Input dropped: 0 Output dropped:0 |
Inbound and outbound packets that are dropped due to insufficient data buffer. The two 1-Gbps SFP interfaces on rear panels of the S9850-4C, S9850-32H, and S6850-56HF switches do not support this field. |
|
Packets of ECN marked |
Number of packets with the ECN field set to 11 because WRED queue thresholds are reached. For more information about WRED and ECN, see ACL and QoS Configuration Guide. The two 1-Gbps SFP interfaces on rear panels of the S9850-4C, S9850-32H, and S6850-56HF switches do not support this field. |
|
Packets of WRED dropped |
Number of packets dropped because the WRED queue thresholds are reached. The two 1-Gbps SFP interfaces on rear panels of the S9850-4C, S9850-32H, and S6850-56HF switches do not support this field. |
SNMP
Task
Use an NMS to obtain the packet drop statistics of interface HundredGigE 1/0/29 through SNMP.
Figure 99 Network diagram for SNMP

Procedure
Configure SNMP. For more information, see "Procedure."
Example: Obtain packet drop statistics
|
|
NOTE: Use the reset counters interface command to clear history packet drop statistics if you want to collect packet drop statistics for a specific time period. |
As shown in Figure 100, use the ifDescr subnode (1.3.6.1.2.1.31.1.1.1.1.2) of the ifName (1.3.6.1.2.1.31.1.1.1.1) node to obtain the index of HGE1/0/29. The query results dialog box shows that the index is 45 for interface HGE 1/0/30.
Figure 100 Obtaining the interface index
# Obtain the packet drop statistics by the interface index in the hh3cifPktBufEgDrop table with OID 1.3.6.1.4.1.25506.8.35.1.5.1.6, as shown in Figure 101.
Figure 101 Obtaining the packet drop statistics
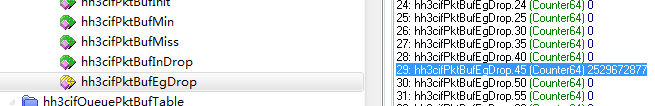
Learn more
For more information about configuring SNMP, see SNMP configuration in the configuration guides for your device.
For more information about MIB files, see the MIB references for your device.
NETCONF
Task
Install the NETCONF client software on a host, and use NETCONF to obtain the packet drop statistics of interface HGE 1/0/29 on the device named Agent.
Figure 102 Network diagram for SNMP

|
|
NOTE: The NETCONF client obtains packet drop statistics through the NETCONF XML APIs provided by the device. |
Procedure
Configure NETCONF. For more information, see "Procedure."
Example: Obtain traffic statistics
|
|
NOTE: The device provides the QSTAT/InterfaceStat table for collecting packet drop statistics for interfaces. You can obtain statistics in bytes or packets by using the QSTAT/InterfaceStat table. |
This example uses the QSTAT/InterfaceStat table to obtain the packet drop statistics for HundredGigE 1/0/29.
# Execute the display system internal ifmgr list | include HundredGigE1/0/29 command in probe view on the device to obtain the index of interface HundredGigE 1/0/29.
[H3C-probe]display system internal ifmgr list | include HundredGigE1/0/29
HundredGigE1/0/29(index:45)
# Copy and paste the following message to the NETCONF client.
<rpc message-id="100" xmlns="urn:ietf:params:xml:ns:netconf:base:1.0">
<get-bulk>
<filter type="subtree">
<top xmlns="http://www.h3c.com/netconf/data:1.0">
<QSTAT>
<InterfaceStat>
<Statistics>
<IfIndex>45</IfIndex>
<Direction></Direction>
<PassPacket></PassPacket>
<PassByte></PassByte>
<DropPacket></DropPacket>
<DropByte></DropByte>
</Statistics>
</InterfaceStat>
</QSTAT>
</top>
</filter>
</get-bulk>
</rpc>
If the requested operation succeeds, the device responds with the requested NETCONF configuration datastore. The following is a sample response:
<rpc-reply message-id="100" xmlns="urn:ietf:params:xml:ns:netconf:base:1.0">
<data>
<top xmlns="http://www.h3c.com/netconf/data:1.0">
<QSTAT>
<InterfaceStat>
<Statistics>
<IfIndex>45</IfIndex>
<Direction>1</Direction>
<PassPacket>578853253273</PassPacket>
<PassByte>97793557880219</PassByte>
<DropPacket>67748792372</DropPacket>
<DropByte>8671845423616</DropByte>
</Statistics>
</InterfaceStat>
</QSTAT>
</top>
</data>
</rpc-reply>
Learn more
For more information about configuring NETCONF, see NETCONF configuration in the configuration guides for your device.
For more information about QSTAT/QueueStat, see H3C Comware 7 NETCONF XML API Reference.
gRPC
Task
Use a collector to obtain the packet drop statistics for interface HGE 1/0/29 on the device through gRPC.
Figure 103 Network diagram for gRPC

Procedure
# Configure IP addresses as required so the device and the collector can reach each other. (Details not shown.)
# Enable gRPC.
<H3C> system-view
[H3C] grpc enable
# Create a sensor group named test, and add sensor path QSTAT/InterfaceStat.
|
|
NOTE: After sensor path QSTAT/InterfaceStat is added, the device will collect packet drop statistic of all interfaces on the device and upload the statistics to the collector. |
[H3C] telemetry
[H3C-telemetry] sensor-group test
[H3C-telemetry-sensor-group-test] sensor path qstat/interfacestat
[H3C-telemetry-sensor-group-test] quit
# Create a destination group named collector1 and add a collector to the group. In this example, the collector receives data on port 50050 at IPv4 address 192.168.2.1.
[H3C-telemetry] destination-group collector1
[H3C-telemetry-destination-group-collector1] ipv4-address 192.168.2.1 port 50050
[H3C-telemetry-destination-group-collector1] quit
# Configure a subscription named A to bind sensor group test with destination group collector1. Set the data sampling interval to 30 seconds.
[H3C-telemetry] subscription A
[H3C-telemetry-subscription-A] sensor-group test sample-interval 30
[H3C-telemetry-subscription-A] destination-group collector1
[H3C-telemetry-subscription-A] quit
Obtain traffic statistics
The collector receives data pushed by the device every 30 seconds.
Learn more
For more information about configuring gRPC, see gRPC configuration in the configuration guides for your device.
Traffic statistics cases
Troubleshooting the connectivity issues between devices through ICMP packet statistics
Requirements
You can use the ping function to check whether a specific address is reachable and whether the network connection is faulty.
The ping function is based on ICMP. The source sends an ICMP echo request to a destination device. If the device receives an ICMP echo reply, the destination device is reachable. The round-trip time for packets reflects the quality of the link.
To troubleshoot failed ping operation, you can configure traffic statistics collection on devices in the path.
As shown in Figure 104, PC A fails to ping PC B. Configure traffic statistics collection on SW A, SW B, and SW C to identify the device that fails to forward the packets.
Figure 104 Troubleshooting the connectivity issues between devices
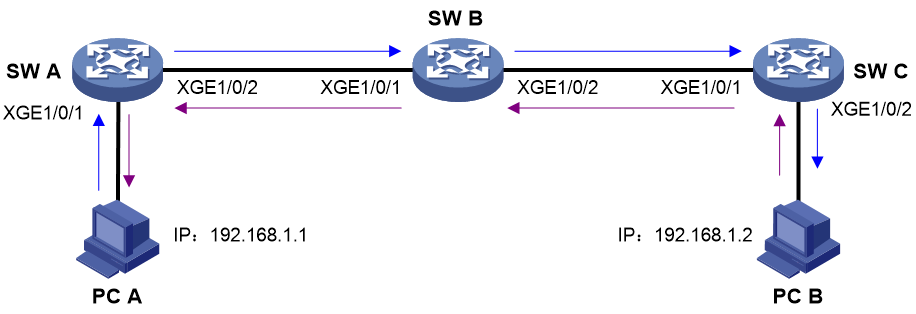
Analysis
Take troubleshooting on SW B as an example.
ICMP echo requests enter SW B from Ten-GigabitEthernet 1/0/1 and leave SW B from Ten-GigabitEthernet 1/0/2. If the number of outgoing packets on Ten-GigabitEthernet 1/0/2 is smaller than the number of incoming packets on Ten-GigabitEthernet 1/0/1, it indicates that packets are dropped on SW B. The same rule applies in the reverse direction.
Procedure
# Create IPv4 advanced ACL 3000, and configure a rule to match ICMP echo requests with source IP address 192.168.1.1 and destination IP address 192.168.1.2.
<SWB> system-view
[SWB] acl advanced 3000
[SWB-acl-ipv4-adv-3000] rule permit icmp source 192.168.1.1 0 destination 192.168.1.2 0
# Create a traffic class named classifier_1, and use ACL 3000 as a match criterion. # Create a traffic behavior named behavior_1, and configure an accounting action.
[SWB] traffic classifier classifier_1
[SWB-classifier-classifier_1] if-match acl 3000
[SWB-classifier-classifier_1] quit
[SWB] traffic behavior behavior_1
[SWB-behavior-behavior_1] accounting packet
[SWB-behavior-behavior_1] quit
# Create a QoS policy named policy_1, and associate the traffic class with the traffic behavior.
[SWB] qos policy policy_1
[SWB-qos-policy-policy_1] classifier classifier_1 behavior behavior_1
[SWB-qos-policy-policy_1] quit
# Apply the QoS policy to the inbound direction of Ten-GigabitEthernet 1/0/1 and the outbound direction of Ten-GigabitEthernet 1/0/2.
[SWB]interface ten-gigabitethernet 1/0/1
[SWB-Ten-GigabitEthernet1/0/1] qos apply policy policy_1 inbound
[SWB-Ten-GigabitEthernet1/0/1] quit
[SWB] interface ten-gigabitethernet 1/0/2
[SWB-Ten-GigabitEthernet1/0/2] qos apply policy policy_1 outbound
[SWB-Ten-GigabitEthernet1/0/2] quit
# Use the display qos policy interface inbound and display qos policy interface outbound commands to view the traffic statistics. The output shows that Ten-GigabitEthernet 1/0/1 received five ICMP echo requests and Ten-GigabitEthernet 1/0/2 sent five ICMP echo requests. This indicates that SW B did not drop any ICMP echo requests.
[SWB] display qos policy interface ten-gigabitethernet 1/0/1 inbound
Interface: Ten-GigabitEthernet1/0/1
Direction: Inbound
Policy: policy_1
Classifier: classifier_1
Operator: AND
Rule(s) :
If-match acl 3000
Behavior: behavior_1
Accounting enable:
5 (Packets)
[SWB] display qos policy interface ten-gigabitethernet 1/0/2 outbound
Interface: Ten-GigabitEthernet1/0/2
Direction: Outbound
Policy: policy_1
Classifier: classifier_1
Operator: AND
Rule(s) :
If-match acl 3000
Behavior: behavior_1
Accounting enable:
5 (Packets)
# Before the next ping test and traffic statistics collection, use the reset counters interface command to clear interface statistics.
[SWB] quit
<SWB> reset counters interface ten-gigabitethernet 1/0/1
<SWB> reset counters interface ten-gigabitethernet 1/0/2
Troubleshooting IP address allocation failures through DHCP packet statistics
Requirements
DHCP is used to allocate IP addresses to endpoints. If an endpoint fails to obtain an IP address through DHCP, configure traffic statistics collection on each device in the patch from the endpoint to the DHCP server to identify the device that fails to forward DHCP packets.
As shown in Figure 105, configure traffic statistics collection on SW A to identify whether SW A forwarded DHCP packets.
Figure 105 Troubleshooting IP address allocation failures through DHCP packet statistics
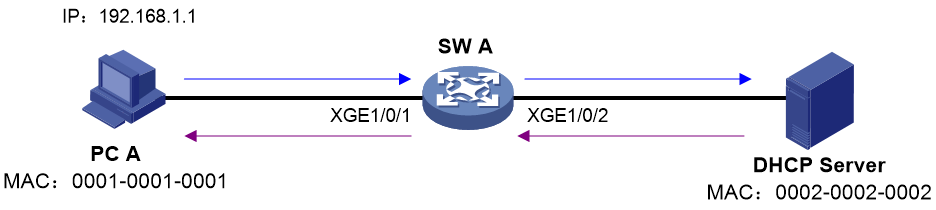
Analysis
An endpoint sends a DHCP-DISCOVER message to obtain an IP address. The DHCP server offers an IP address to the client in a DHCP-OFFER message. The endpoint sends a DHCP-REQUEST message to formally request the IP address. The DHCP server returns a DHCP-ACK message to confirm that the IP address has been allocated to the endpoint.
All DHCP messages are UDP packets. The source UDP port of DHCP packets sent by the endpoint is 68, and the source UDP port of DHCP packets sent by the DHCP server is 67. DHCP packets can be matched based on source MAC addresses and UDP ports.
Procedure
# Create IPv4 advanced ACL 3010, and configure a rule to match the DHCP packets sent by the endpoint.
<SWA> system-view
[SWA] acl advanced 3010
[SWA-acl-ipv4-adv-3010] rule 0 permit udp source-port eq bootpc destination-port eq bootps
[SWA-acl-ipv4-adv-3010] quit
# Create IPv4 advanced ACL 3011, and configure a rule to match the DHCP packets sent by the DHCP server.
[SWA] acl advanced 3011
[SWA-acl-ipv4-adv-3011] rule 0 permit udp source-port eq bootps destination-port eq bootpc
[SWA-acl-ipv4-adv-3011] quit
# Create a traffic class named client, and use ACL 3010 as a match criterion. Create a traffic behavior named client, and configure an accounting action. Create a QoS policy named client, and associate the traffic class with the traffic behavior.
[SWA] traffic classifier client
[SWA-classifier-client] if-match acl 3010
[SWA-classifier-client] if-match source-mac 1-1-1
[SWA-classifier-client] quit
[SWA] traffic behavior client
[SWA-behavior-client] accounting packet
[SWA-behavior-client] quit
[SWA] qos policy client
[SWA-qos-policy-client] classifier client behavior client
[SWA-qos-policy-client] quit
# Create a traffic class named server, and use ACL 3011 as a match criterion. Create a traffic behavior named server, and configure an accounting action. Create a QoS policy named server, and associate the traffic class with the traffic behavior.
[SWA] traffic classifier server
[SWA-classifier-server] if-match acl 3011
[SWA-classifier-server] if-match source-mac 2-2-2
[SWA-classifier-server] quit
[SWA] traffic behavior server
[SWA-behavior-server] accounting packet
[SWA-behavior-server] quit
[SWA] qos policy server
[SWA-qos-policy-server] classifier server behavior server
[SWA-qos-policy-server] quit
# Apply QoS policy client to the inbound direction of Ten-GigabitEthernet 1/0/1 and the outbound direction of Ten-GigabitEthernet 1/0/2.
[SWA]interface ten-gigabitethernet 1/0/1
[SWA-Ten-GigabitEthernet1/0/1] qos apply policy client inbound
[SWA-Ten-GigabitEthernet1/0/1] quit
[SWA] interface ten-gigabitethernet 1/0/2
[SWA-Ten-GigabitEthernet1/0/2] qos apply policy client outbound
[SWA-Ten-GigabitEthernet1/0/2] quit
# Apply QoS policy server to the inbound direction of Ten-GigabitEthernet 1/0/2 and the outbound direction of Ten-GigabitEthernet 1/0/1.
[SWA] interface ten-gigabitethernet 1/0/2
[SWA-Ten-GigabitEthernet1/0/2] qos apply policy server inbound
[SWA-Ten-GigabitEthernet1/0/2] quit
[SWA]interface ten-gigabitethernet 1/0/1
[SWA-Ten-GigabitEthernet1/0/1] qos apply policy server outbound
[SWA-Ten-GigabitEthernet1/0/1] quit
# Use the display qos policy interface inbound and display qos policy interface outbound commands to view the traffic statistics and identify whether DHCP packets are dropped between the endpoint and the DHCP server.
