- Released At: 14-09-2023
- Page Views:
- Downloads:
- Related Documents
-
|
|
|
H3C SeerEngine-SDWAN Controller |
|
System Log Messages Reference |
|
|
|
|
Document version: 5W200-20220106
Copyright © 2022 New H3C Technologies Co., Ltd. All rights reserved.
No part of this manual may be reproduced or transmitted in any form or by any means without prior written consent of New H3C Technologies Co., Ltd.
Except for the trademarks of New H3C Technologies Co., Ltd., any trademarks that may be mentioned in this document are the property of their respective owners.
The information in this document is subject to change without notice.
Contents
Displaying system log messages
Link jitter reaching threshold
Link packet loss rate reaching threshold
Link bandwidth usage reaching threshold
Device CPU usage reaching threshold
Device temperature reaching threshold
Device free memory lower than threshold·
Failure to obtain device model
Device disconnection from controller
Disconnection from MongoDB host
Controller memory usage reaching threshold
Controller hard disk usage reaching threshold
Introduction
This document includes system messages about internal events of the controller. System log messages include parameter description, reason for the event, and recommended actions, providing references for system analysis and maintenance.
This document assumes that the readers are familiar with data communications technologies and H3C SNA Center and SeerEngine-SDWAN products.
Displaying system log messages
To view system log messages:
1. Log in to H3C SNA Center, click the System tab, and then click Settings
2. On the top navigation bar, click Logs.
3. From the navigation pane, select Logs > Information. Click the System Logs tab to open the system log page.
4. Select SeerEngine-SDWAN from the Components Name list.
5. Click Search.
The system log messages of the SeerEngine-SDWAN controller are displayed, as shown in Figure 1.
Figure 1 System log message list
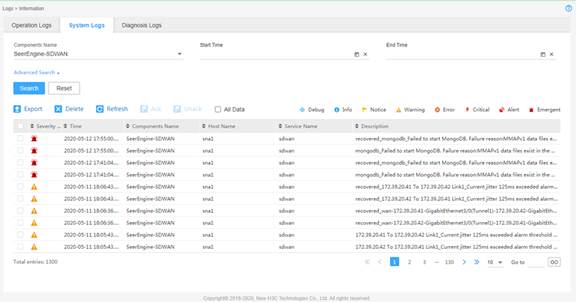
Table 1 System log message fields
|
Field |
Description |
|
Severity Level |
Severity level of the log message. System log messages support eight severity levels, identified by different icons. For more information, see Table 5. |
|
Time |
Date and time when the log message was generated. |
|
Components Name |
Name of the component that generated the log message. |
|
Host Name |
Host name or IP address of the host that generated the log message. |
|
Service Name |
Name of the service that generated the log message. |
|
Description |
Log message text, a description for the event or error. |
System log message format
The SeerEngine-SDWAN controller supports sending system log messages to syslog servers through the syslog protocol. The syslog server's IP address and port number are configurable on the Log > Configuration > System Log page of SNA Center.
By default, the system log messages use the following format:
<PRI>TIMESTAMP Hostname Origin/severity/Keywords CONTENT
Table 2 System log message elements
|
Element |
Description |
|
<PRI> |
Priority identifier. It is calculated by using the following formula: Priority identifier=facility×8+severity Where: · Facility is used by a log host to identify log sources and filter log messages. The facility of system log messages sent by SeerEngine-SDWAN is usually user-level, and the facility value is 1. · Severity represents the importance of the message. This severity is defined by the syslog protocol. For more information about severity levels defined by syslog, see Table 4. |
|
TIMESTAMP |
Date and time when the log message was generated. |
|
Hostname |
Host name or IP address of the server or VM where the controller that generated the log message resides. |
|
Origin |
Name of the software module that generated the log message. For more information, see Table 3. |
|
severity |
Severity level of the log message defined by SeerEngine-SDWAN. For more information about severity levels defined by SeerEngine-SDWAN, see Table 5. |
|
Keywords |
Keywords of the log message, which facilitate searching or memorizing. |
|
CONTENT |
A description of the event or error. |
|
Module name expansion |
|
|
LINK |
Link module |
|
DEVICE |
Device module |
|
DATABASE |
Database module |
|
CONTROLLER |
Controller module |
Syslog classifies system log messages into eight severity levels from 0 to 7. The lower the number, the higher the severity, as shown in Table 4.
Table 4 Syslog-defined log message severity levels
|
Level |
Severity |
Description |
|
0 |
Emergency |
The system is unusable. For example, the system authorization has expired. |
|
1 |
Alert |
Action must be taken immediately. For example, traffic on an interface exceeds the upper limit. |
|
2 |
Critical |
Critical condition. For example, the device temperature exceeds the upper limit, the power module fails, or the fan tray fails. |
|
3 |
Error |
Error condition. For example, the link state changes or a storage card is unplugged. |
|
4 |
Warning |
Warning condition. For example, an interface is disconnected, or the memory resources are used up. |
|
5 |
Notice |
Normal but significant condition. For example, a terminal logs in to the device, or the device reboots. |
|
6 |
Informational |
Informational message. For example, a command or a ping operation is executed. |
|
7 |
Debug |
Debugging message. |
The SeerEngine-SDWAN controller classifies system log messages into eight severity levels from 0 to 7. The lower the number, the higher the severity, as shown in Table 5.
Table 5 Controller-defined system log message severity levels
|
Level |
Icon |
Severity |
Description |
|
0 |
|
Emergency |
The system is unusable. For example, the system authorization has expired. |
|
1 |
|
Alert |
Action must be taken immediately. For example, traffic on an interface exceeds the upper limit. |
|
2 |
|
Critical |
Critical condition. For example, the device temperature exceeds the upper limit, the power module fails, or the fan tray fails. |
|
3 |
|
Error |
Error condition. For example, the link state changes or a storage card is unplugged. |
|
4 |
|
Warning |
Warning condition. For example, an interface is disconnected, or the memory resources are used up. |
|
5 |
|
Notice |
Normal but significant condition. For example, a terminal logs in to the device, or the device reboots. |
|
6 |
|
Informational |
Informational message. For example, a command or a ping operation is executed. |
|
7 |
|
Debug |
Debugging message. |
Using this document
This document categorizes system log messages by software module.
This document explains messages in tables. Table 6 describes information provided in these tables.
Table 6 Message explanation table contents
|
Item |
Content |
Example |
|
Keyword |
Summary of the message that facilitates searching or memorizing. |
OPENFLOW_SESSION_UP |
|
Message text |
Presents the message description. |
An OpenFlow device with datapath ID $1 OpenFlow IP $2 descriptor $3 was connected to the controller $4. |
|
Variable fields |
Briefly describes the variable fields in the order that they appear in the message text. The variable fields are numbered in the "$Number" form to help you identify their location in the message text. |
$1: Datapath ID of the OpenFlow device. $2: Management IP address of the OpenFlow device. $3: Description for the OpenFlow device. $4: IP address of the controller. |
|
Severity level |
Provides the severity level of the message. |
Info |
|
Example |
Provides a real message example. |
An OpenFlow device with datapath ID 01:21:cc:3e:5f:09:04:7f OpenFlow IP 192.168.100.1 descriptor 192.168.200.1 was connected to the controller 10.10.10.1. |
|
Explanation |
Explains the message, including the event or error cause. |
An OpenFlow device was connected to the controller. This message is sent when a network device establishes an OpenFlow connection with the controller. |
|
Recommended action |
Provides recommended actions. For informational messages, no action is required. |
No action is required. |
Restrictions and guidelines
When an event occurs, the system sends a log message to record the event. When the event recovers, the system sends a log message for the event to indicate the event recovery.
The recovery state field of a log message is displayed only when the logged event is recovered, and the value is recovered.
LINK messages
This section contains link related messages.
Link down
|
Keyword |
LINK_OFFLINE |
|
Message text |
$1_$2_Link status changed to down |
|
Variable fields |
$1: Recovery state of the logged event. $2: Source of the log message. |
|
Severity level |
Emergency |
|
Example |
Link status changed to down |
|
Explanation |
When a link goes down, the system sends a log message for the event (unrecovered state). When the link comes up again, the system sends a recovered log message for the event. |
|
Recommended action |
Verify the online status of the link related devices, interfaces, and BGP peers. |
Link delay reaching threshold
|
Keyword |
LINK_DELAY_EXCEED_THRESHOLD |
|
Message text |
$1_$2_Current delay $3 exceeded alarm threshold $4 |
|
Variable fields |
$1: Recovery state of the logged event. $2: Source of the log message. $3: Current link delay. $4: Link delay threshold. |
|
Severity level |
Warning, Emergency |
|
Example |
172.39.20.73 To 172.39.20.76 Link1_Current delay 250ms exceeded alarm threshold 200ms |
|
Explanation |
When the delay of a link reaches the link delay threshold, the system sends a log message for the event (unrecovered state). When the link delay drops below the threshold, the system sends a recovered log message for the event. The thresholds for link delay are configurable. By default, the Warning threshold is 200 ms, and the Emergency threshold is 500 ms. |
|
Recommended action |
This log notifies users of the current network quality. No action is required. |
Link jitter reaching threshold
|
Keyword |
LINK_JITTER_EXCEED_THRESHOLD |
|
Message text |
$1_$2_Current jitter $3 exceeded alarm threshold $4 |
|
Variable fields |
$1: Recovery state of the logged event. $2: Source of the log message. $3: Current link jitter. $4: Link jitter threshold. |
|
Severity level |
Warning, Emergency |
|
Example |
172.39.20.72 To 172.39.20.73 Link1_Current jitter 228ms exceeded alarm threshold 200ms |
|
Explanation |
When the jitter of a link reaches the link jitter threshold, the system sends a log message for the event (unrecovered state). When the link jitter drops below the threshold, the system sends a recovered log message for the event. The thresholds for link jitter are configurable. By default, the Warning threshold is 50 ms, and the Emergency threshold is 200 ms. |
|
Recommended action |
This log notifies users of the current network quality. No action is required. |
Link packet loss rate reaching threshold
|
Keyword |
LOSS_PACKET_EXCEED_THRESHOLD |
|
Message text |
$1_$2_Current packet loss ratio $3 exceeded alarm threshold $4 |
|
Variable fields |
$1: Recovery state of the logged event. $2: Source of the log message. $3: Current packet loss rate of the link. $4: Packet loss rate threshold of the link. |
|
Severity level |
Warning, Emergency |
|
Example |
wan-172.39.20.73-Tunnel4-172.39.20.72-Tunnel4_Current packet loss 55% exceeded alarm threshold 50% |
|
Explanation |
When the packet loss rate of a link reaches the packet loss rate threshold, the system sends a log message for the event (unrecovered state). When the packet loss rate of the link drops below the threshold, the system sends a recovered log message for the event. The thresholds for link packet loss rate are configurable. By default, the Warning threshold is 30%, and the Emergency threshold is 50%. |
|
Recommended action |
This log notifies users of the current network quality. No action is required. |
Link bandwidth usage reaching threshold
|
Keyword |
LOSS_BANDWIDTH_USAGE_THRESHOLD |
|
Message text |
$1_$2_Current bandwidth usage ratio $3 exceeded alarm threshold $4 |
|
Variable fields |
$1: Recovery state of the logged event. $2: Source of the log message. $3: Current link bandwidth usage ratio. $4: Link bandwidth usage threshold. |
|
Severity level |
Warning, Emergency |
|
Example |
172.39.20.72 To 172.39.20.73 Link1 Current bandwidth usage 100.0% exceeded alarm threshold 90% |
|
Explanation |
When the bandwidth usage of a link reaches the link bandwidth usage threshold, the system sends a log message for the event (unrecovered state). When the bandwidth usage of the link drops below the threshold, the system sends a recovered log message for the event. The thresholds for link bandwidth usage are configurable. By default, the Warning threshold is 80%, and the Emergency threshold is 90%. |
|
Recommended action |
This log notifies users of the current network quality. No action is required. |
DEVICE messages
This section contains device related messages.
Device CPU usage reaching threshold
|
Keyword |
CPU_USAGE_EXCEED_THRESHOLD |
|
Message text |
$1_$2_Current CPU usage $3 exceeded alarm threshold $4 |
|
Variable fields |
$1: Recovery state of the logged event. $2: Source of the log message. $3: Current CPU usage percentage. $4: CPU usage threshold. |
|
Severity level |
Warning, Emergency |
|
Example |
172.39.20.72_Current CPU usage 86% exceeded alarm threshold 85% |
|
Explanation |
When the CPU usage of the device reaches the CPU usage threshold, the system sends a log message for the event (unrecovered state). When the CPU usage of the device drops below the threshold, the system sends a recovered log message for the event. The thresholds for CPU usage are configurable. By default, the thresholds are as follows: · For the H3C MSR series of devices, only the Emergency threshold is set, and the threshold value is 99%. · For devices of other models, the Warning threshold is 85%, and the Emergency threshold is 90%. |
|
Recommended action |
If the event is not recovered for a long time, contact H3C Support. |
Device temperature reaching threshold
|
Keyword |
TEMPERATURE_EXCEED_THRESHOLD |
|
Message text |
$1_$2_Current temperature $3 exceeded alarm threshold $4 |
|
Variable fields |
$1: Recovery state of the logged event. $2: Source of the log message. $3: Current temperature of the device. $4: Temperature threshold. |
|
Severity level |
Warning, Emergency |
|
Example |
172.39.20.72_Current temperature 68°C exceeded alarm threshold 65°C |
|
Explanation |
When the temperature of the device reaches the temperature threshold, the system sends a log message for the event (unrecovered state). When the temperature of the device drops below the threshold, the system sends a recovered log message for the event. The thresholds for device temperature are configurable. By default, the thresholds are as follows: · For the H3C MSR series of devices, the Warning threshold is 65°C, and the Emergency threshold is 75°C. · For the H3C SR6600 series of devices, the Warning threshold is 72°C, and the Emergency threshold is 77°C. · For devices of other models, the Warning threshold is 75°C, and the Emergency threshold is 88°C. |
|
Recommended action |
Verify that the cooling system of the equipment room and that of the device operate normally. |
Device free memory lower than threshold
|
Keyword |
MEMORY_FREE_LOW_THRESHOLD |
|
Message text |
$1_$2_Current free memory $3 is lower than alarm threshold $4 |
|
Variable fields |
$1: Recovery state of the logged event. $2: Source of the log message. $3: Current free memory. $4: Free memory threshold. |
|
Severity level |
Warning, Emergency |
|
Example |
172.39.20.72_Current free memory 135MB is lower than alarm threshold 256MB |
|
Explanation |
When the free memory of the device drops below the free memory threshold, the system sends a log message for the event (unrecovered state). When the free memory of the device reaches the threshold, the system sends a recovered log message for the event. The thresholds for device free memory are configurable. By default, the thresholds are as follows: · For the H3C MSR series of devices, the Warning threshold is 256 MB, and the Emergency threshold is 96MB. · For devices of other models, the Warning threshold is 128 MB, and the Emergency threshold is 48 MB. |
|
Recommended action |
If the event is not recovered for a long time, contact H3C Support. |
Device offline
|
Keyword |
DEVICE_OFFLINE |
|
Message text |
$1_$2_Device went offline. Reason: $3 |
|
Variable fields |
$1: Recovery state of the logged event. $2: Source of the log message. $3: Reason why the device was offline. |
|
Severity level |
Emergency |
|
Example |
172.39.20.72_Device went offline. Reason: UnManageable |
|
Explanation |
A device went offline. |
|
Recommended action |
Take actions according to the device offline reason. |
Device restart
|
Keyword |
DEVICE_UPGRADE_REBOOT |
|
Message text |
$1_$2_The device restarted after the controller upgraded software for it. |
|
Variable fields |
$1: Recovery state of the logged event. $2: Source of the log message. |
|
Severity level |
Warning, Emergency |
|
Example |
recovered_172.39.20.72_The device restarted after the controller upgraded software for it. |
|
Explanation |
A device restarted after the controller upgraded software for the device. |
|
Recommended action |
No action is required. |
Failure to obtain device model
|
Keyword |
GET_DEVICE_MODEL_FAILED |
|
Message text |
$1_$2_Failed to get the device model |
|
Variable fields |
$1: Recovery state of the logged event. $2: Source of the log message. |
|
Severity level |
Emergency |
|
Example |
172.39.20.72_Failed to get the device model |
|
Explanation |
The controller failed to obtain the device model. |
|
Recommended action |
Verify that the NETCONF configuration is correct on the device and controller. Or, manually configure the device model information on the controller. |
Device disconnection from controller
|
Keyword |
CONTROLLER_DEVICE_DISCONNECT |
|
Message text |
$1_$2_The connection between controller and device is disconnected |
|
Variable fields |
$1: Recovery state of the logged event. $2: Source of the log message. |
|
Severity level |
Emergency |
|
Example |
172.39.20.72_The connection between controller and device is disconnected |
|
Explanation |
When a device is disconnected from the controller, the system sends a log message for the event. The log message text varies depending on how the device was added to the controller: · If the device was manually added to the controller, the message text is Connection Lost. · If the device was automatically discovered by OpenFlow, the message text is OpenFlow Connection Lost. |
|
Recommended action |
Verify that the NETCONF configurations are correct on the device and the controller. |
Device conflict
|
Keyword |
DEVICE_CONFLICT |
|
Message text |
$1_$2_The device conflicts with device $3. Reason: $4 |
|
Variable fields |
$1: Recovery state of the logged event. $2: Source of the log message. $3: Name of the device that conflicts with the current device. $4: Reason for the conflict. Possible reasons include IP address, MAC address, and serial number. |
|
Severity level |
Emergency |
|
Example |
172.39.20.72_The device conflicts with device1. Reason: IP |
|
Explanation |
The devices had conflicted IP address, MAC address, or serial number. |
|
Recommended action |
Edit device information or delete one of the devices. |
Module running exception
|
Keyword |
BOARD_ALARM |
|
Message text |
$1_$2_The board is running exceptionally. Board position: $3 |
|
Variable fields |
$1: Recovery state of the logged event. $2: Source of the log message. $3: Location of the module. |
|
Severity level |
Warning |
|
Example |
3_Main Processing Unit_The board is running exceptionally. Board position: 2/4 |
|
Explanation |
A module encountered a running or startup exception. |
|
Recommended action |
· If the module is restarting, wait for the restart to complete. · If the module has been removed, navigate to the Network > Inventory > Devices page of the SeerEngine-SDWAN controller, click the Modules tab, and then click Ack Removal for the module to invalidate the alarm. · If the module has been damaged, contact H3C Support. |
Module failure
|
Keyword |
BOARD_ERROR |
|
Message text |
$1_$2_The board fails. Please handle the board as soon as possible. Board position: $3 |
|
Variable fields |
$1: Recovery state of the logged event. $2: Source of the log message. $3: Location of the module. |
|
Severity level |
Emergency |
|
Example |
3_Main Processing Unit_The board fails. Please handle the board as soon as possible. Board position: 2/4 |
|
Explanation |
A module was damaged, restarted, or removed during operation. |
|
Recommended action |
Navigate to the Network > Inventory > Devices page of the SeerEngine-SDWAN controller, click the Modules tab, and then view the operating state of the module. If the module cannot resume normal operating state after a period of time, contact H3C Support. |
Module serial number conflict
|
Keyword |
BOARD_SN_CONFLICT |
|
Message text |
$1_$2_The boards of the device have the same serial number. Board positions: $3 |
|
Variable fields |
$1: Recovery state of the logged event. $2: Source of the log message. $3: Location of the module. |
|
Severity level |
Warning |
|
Example |
3_Main Processing Unit_The boards of the device have the same serial number. Board positions: 3/4, 2/4 |
|
Explanation |
Modules of the same device have the same serial number. |
|
Recommended action |
Remove one module. If one of the conflicting modules is the MPU, remove the other module. |
Module replace
|
Keyword |
BOARD_REPLACE |
|
Message text |
$1_$2_The board of the device is replaced. Board position: $3 |
|
Variable fields |
$1: Recovery state of the logged event. $2: Source of the log message. $3: Location of the module. |
|
Severity level |
Emergency |
|
Example |
3_Main Processing Unit_The board of the device is replaced. Board position: 2/4 |
|
Explanation |
The controller detected that a module's serial number changed. |
|
Recommended action |
· If the module has been replaced, navigate to the Network > Inventory > Devices page of the SeerEngine-SDWAN controller, click the Modules tab, and then click Ack Replaced for the module. · If the module is not replaced, contact H3C Support. |
Submodule fault
|
Keyword |
SUB_BOARD_ERROR |
|
Message text |
$1_$2_There is a fault on the sub card. Please handle it as soon as possible. Sub card position: $3 |
|
Variable fields |
$1: Recovery state of the logged event. $2: Source of the log message. $3: Location of the submodule. |
|
Severity level |
Emergency |
|
Example |
VNIC-E1000_There is a fault on the sub card. Please handle it as soon as possible. Sub card position: 2/4 |
|
Explanation |
A submodule was damaged, restarted, or removed during operation. |
|
Recommended action |
· If the submodule is restarting, wait for the restart to complete. · If the submodule has been removed, navigate to the Network > Inventory > Devices page of the SeerEngine-SDWAN controller, click the Modules tab, and then click Ack Removal for the submodule to invalidate the alarm. · If the submodule is damaged, contact H3C Support. |
Submodule replace
|
Keyword |
SUB_BOARD_REPLACED |
|
Message text |
$1_$2_The sub card of the device is replaced. Sub card position: $3 |
|
Variable fields |
$1: Recovery state of the logged event. $2: Source of the log message. $3: Location of the submodule. |
|
Severity level |
Emergency |
|
Example |
VNIC-E1000_The subcard of the device is replaced. Subcard position: 2/4 |
|
Explanation |
The controller detected that a submodule's serial number changed. |
|
Recommended action |
· If the submodule has been replaced, navigate to the Network > Inventory > Devices page of the SeerEngine-SDWAN controller, click the Modules tab, and then click Ack Replaced for the submodule. · If the submodule is not replaced, contact H3C Support. |
DATABASE messages
This section contains database messages.
MongoDB startup failure
|
Keyword |
MONGODB_START_FAILED |
|
Message text |
$1_$2_Failed to start MongoDB. Failure reason:$3 |
|
Variable fields |
$1: Recovery state of the logged event. $2: Source of the log message. $3: Reason for the failure. |
|
Severity level |
Critical |
|
Example |
172.39.20.120_Failed to start MongoDB. Failure reason: host format error |
|
Explanation |
The controller failed to start MongoDB. |
|
Recommended action |
Take actions according to the failure reason: · port occupied—Use another port to try again, or shut down the process that is occupying the port. · host format error—Specify the correct IP address of the host. · failed connection host—Examine the network connectivity and make sure the firewall permits the traffic between the controller and the database server. · the database version is below 3.0—Upgrade the software version of MongoDB. · the path of database is invalid—Specify the correct database path. · MMAPv1 data files exist in the database path or there is already a database instance running—Start MongoDB manually, or stop the running database. · Unknown—Try to start MongoDB manually. |
MongoDB connection failure
|
Keyword |
MONGODB_CONNECT_FAILED |
|
Message text |
$1_$2_Failed to connect to MongoDB. Failure reason: $3 |
|
Variable fields |
$1: Recovery state of the logged event. $2: Source of the log message. $3: Reason for the failure. |
|
Severity level |
Critical |
|
Example |
172.39.20.120_Failed to connect to MongoDB. Failure reason: account has not authorization |
|
Explanation |
The controller failed to connect to the MongoDB database. |
|
Recommended action |
Take actions according to the failure reason: · host or port is wrong,or database service is not started—Verify that the host and port number of the MongoDB server are correct and the MongoDB database is started. · account has not authorization—Set a database account that has required privileges. |
Disconnection from MongoDB
|
Keyword |
MONGODB_LOST_CONNECT |
|
Message text |
$1_$2_lost to connect to MongoDB. Failure reason: $3 |
|
Variable fields |
$1: Recovery state of the logged event. $2: Source of the log message. $3: Reason for the failure. |
|
Severity level |
Critical |
|
Example |
mongodb_Lost connection to MongoDB. Failure reason: account has not authorization |
|
Explanation |
The controller has disconnected from MongoDB. |
|
Recommended action |
Take actions according to the failure reason: · host or port is wrong,or database service is not started—Verify that the host and port number of the MongoDB server are correct and the MongoDB database is started. · account has not authorization—Set a database account that has required privileges. |
Disconnection from MongoDB host
|
Keyword |
MONGODB_LOST_HOST_CONNECT |
|
Message text |
$1_$2_Lost connection to the host of MongoDB |
|
Variable fields |
$1: Recovery state of the logged event. $2: Source of the log message. |
|
Severity level |
Critical |
|
Example |
mongodb_Lost connection to the host of MongoDB. |
|
Explanation |
The controller has disconnected from the MongoDB host. |
|
Recommended action |
Take actions according to the failure reason: host or port is wrong,or database service is not started—Verify that the host and port number of the MongoDB server are correct and the MongoDB database is started. |
Datastore not available
|
Keyword |
DATA_STORE_INTERRUPT |
|
Message text |
$1_$2_The database is unavailable |
|
Variable fields |
$1: Recovery state of the logged event. $2: Source of the log message. |
|
Severity level |
Critical |
|
Example |
172.39.18.26_The database is unavailable |
|
Explanation |
If the controller cluster splits, the ODL database read or write is unavailable. When this event occurs, the system sends a log message for the event (unrecovered state). When the cluster recovers, the system sends a recovered log message for the event. |
|
Recommended action |
Navigate to the Assurance > Controller > Controller Status page of the SeerEngine-SDWAN controller, identify and repair the controllers with abnormal status. |
CONTROLLER messages
This section contains the controller messages.
Controller memory usage reaching threshold
|
Keyword |
CONTROLLER_MEMORY_EXCEED_THRESHOLD |
|
Message text |
$1_$2_Current controller memory usage $3 exceeded alarm threshold $4 |
|
Variable fields |
$1: Recovery state of the logged event. $2: Source of the log message. $3: Current memory usage percentage. $4: Memory usage threshold. |
|
Severity level |
Warning, Emergency |
|
Example |
172.39.36.5_Current controller memory usage 54.38% exceeded alarm threshold 50% |
|
Explanation |
The controller memory usage percentage reached the threshold. The memory usage thresholds are configurable. By default, the Warning threshold is 80% and the Emergency threshold is 90%. |
|
Recommended action |
· Verify that the memory usage thresholds are set properly. · View the controller's processes, and shut down redundant processes to release memory. |
Controller hard disk usage reaching threshold
|
Keyword |
CONTROLLER_DISK_EXCEED_THRESHOLD |
|
Message text |
$1_$2_Current disk usage $3 of controller disk partition $4 exceeded alarm threshold $5 |
|
Variable fields |
$1: Recovery state of the logged event. $2: Source of the log message. $3: Current hard disk usage percentage. $4: Name of the hard disk partition. $5: Hard disk usage threshold. |
|
Severity level |
Warning, Emergency |
|
Example |
172.39.36.5_Current disk usage 81% of controller disk partition / exceeded alarm threshold 80% |
|
Explanation |
A hard disk partition of the controller reached the threshold. The thresholds are configurable. By default, the Warning threshold is 80% and the Emergency threshold is 90%. |
|
Recommended action |
· Verify that the hard disk usage thresholds are set properly. · Delete redundant files on the disk to release disk space. |
Controller CPU usage reaching threshold
|
Keyword |
CONTROLLER_CPU_EXCEED_THRESHOLD |
|
Message text |
$1_$2_Current controller CPU usage $3 exceeded alarm threshold $4 |
|
Variable fields |
$1: Recovery state of the logged event. $2: Source of the log message. $3: Current CPU usage percentage. $4: CPU usage percent threshold. |
|
Severity level |
Warning, Emergency |
|
Example |
172.39.36.5_Current controller CPU usage 85% exceeded alarm threshold 80% |
|
Explanation |
The CPU usage percentage of the controller reached the threshold. The thresholds for controller CPU usage are configurable. By default, the Warning threshold is 80% and the Emergency threshold is 90%. |
|
Recommended action |
· Verify that the CPU usage thresholds are set properly. · View the controller's processes, and shut down redundant processes to release the CPU load. |
Leader change in Akka cluster
|
Keyword |
AKKA_LEADER_CHANGE |
|
Message text |
$1_$2_Cluster akka leader changed. New leader: $3 |
|
Variable fields |
$1: Recovery state of the logged event. $2: Source of the log message. $3: IP address of the new leader in the Akka cluster. |
|
Severity level |
Informational |
|
Example |
192.168.25.46_Cluster akka leader changed. New leader: 192.168.25.46 |
|
Explanation |
If the leader of a controller cluster changes, both the old leader and the new leader will send a log message for the event. |
|
Recommended action |
No action is required. |
