
- Released At: 24-02-2023
- Page Views:
- Downloads:
- Table of Contents
- Related Documents
-
AD-Campus 6.2
Routine Inspection Guide
Document version: 5W100-20230221
Copyright © 2023 New H3C Technologies Co., Ltd. All rights reserved.
No part of this manual may be extracted or reproduced or transmitted in any form or by any means without prior written consent of New H3C Technologies Co., Ltd.
Except for the trademarks of New H3C Technologies Co., Ltd., any trademarks, product labels, and goods names that may be mentioned in this document are the property of their respective owners.
The information in this document is subject to change without notice.
Contents
Routine inspection and maintenance guide for Unified Platform
Size of the database backup directory
License server network quality
Execute the one-click check script
Execute the script to collect supplemental logs
Check whether the service states of the node, pod and host are normal
Network transmission between cluster node IP and virtual IP
Redundant or decompressed installation packages in the /opt/matrix/app/install/packages directory
Grafana and jobservice file and directory permissions
Check the automatic inspection items
One-click check for E0706L01 and later versions
Auto inspection script check for versions E0706L01 and E06
High memory usage for Kafka pod
High memory usage for Elasticsearch pod
High memory usage for Syslog pod
Routine inspection guide for SeerEngine-Campus
Foreground service inspection methods
Background service inspection methods
Check the running state of the host (left to Unified Platform)
Running load of each cluster host node
Whether ScrollLock for the server where the controller is located is disabled
Inspect basic functions of the controller
Inspect the system information
Inspect external service state and global parameters
Inspect the network service state
Communication among components
Running state of background of EIA
Communication among components
Analysis (analyzer not installed)
Communication among components
Running state of background of WSM
Check the state of Mysql cluster
Check the state of Mongo cluster
Check the state of Rabbitmq cluster
Check the status code returned by the microservice interface
Inspection guide for SeerAnalyzer front pages
Inspection guide for SeerAnalyzer background
Check the system CPU and memory
Inspection guide for network devices
Inspection guide for network devices
Inspection report for the front pages of the analyzer
Inspection report for the background of the analyzer
Network device inspection report
Inspection guide for vDHCP monitoring
Check the critical processes and port number of vDHCP
Inspection guide for Microsoft DHCP
Check patches of Windows Server 2012 R2
Check whether DHCP plugin matches SeerEngine-Campus
Check whether the UDP port 67 is occupied by Microsoft's DHCP server NIC
Check whether the UDP port 8958 is occupied by DHCP plugin
Check whether time difference between two DHCP servers is within 1 minute
Check whether two DHCP servers are put on the domain controller
Check whether the DHCP server failover name is adcam
Check the state of the two DHCP servers during failover
The maximum client lead time of two DHCP servers during failover is 1 hour
Check the VLAN 4094 scope and its policies on the DHCP server
Check the system log size of the DHCP server
Check the activity log size of the DHCP server
Check the DHCP fail-permit server
Check whether the OS system is a matched version
Check patches of Windows Server 2012 R2
Check the DHCP Plugin version of the DHCP server that matches SeerEngine-Campus
Check whether the DHCP fail-permit server is deployed with the DHCP server
Check whether the UDP port 8958 is occupied by DHCP plugin
Routine inspection guide for campus core devices
Routine maintenance checklist for software
Routine maintenance checklist for hardware entry resources of campus core switches
Routine inspection guide for campus access switches
Routine inspection guide for high-end M9000
Check the running information of each card
Check stacking interface status
Check memory usage of each card
Check CRC error packet statistics of interfaces
Check optical power statistics of interfaces
Check session establishment rate and concurrent sessions on service modules
Check the vCPU usage of service modules
Check the number of sessions on logical banks
Check dynamic NAT444 resources
Check for software reset in logic
Routine inspection guide for mid-end and low-end products
Security device inspection report
Security device inspection report
Security device inspection report
Security device inspection report
V800R008B03 F5000-AI-20&F5000-AI-40)
Security device inspection report
Routine inspection guide for Wireless AC
Collect AC diagnostic information
Compress the AC diagnostic information as a diagxxxxxxx.zip file
Upload the diagnostic information to the iService platform
Routine inspection guide for SR88
Collect diagnostic information
Routine inspection and maintenance guide for Unified Platform
|
|
NOTE: The appendix of this part is not available. Contact relevant technicians to obtain the appendix if needed. |
This document is intended to guide the daily operation and maintenance for Unified Platform. It mainly outlines the procedures of performing a health check periodically (daily, weekly, monthly, or yearly) for Unified Platform by the customer support department.
This document is intended for engineers who maintain Unified Platform.
Check services
Access to Unified Platform
· Check item
Access to Unified Platform from a browser
· Targets
Time used for logging in to Unified Platform.
· Pass criteria
The system can load the dashboard within 10 seconds after login.
· Example
Web page response
· Check item
Response time of the web pages to operations
· Targets
Response time for the alarm management page and monitoring list page.
· Pass criteria
The system loads the pages within 5 seconds.
· Example
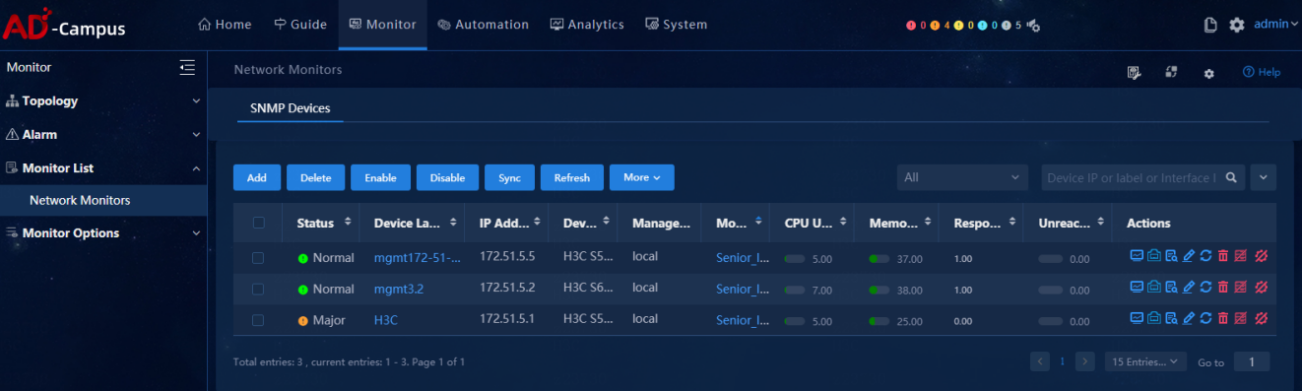
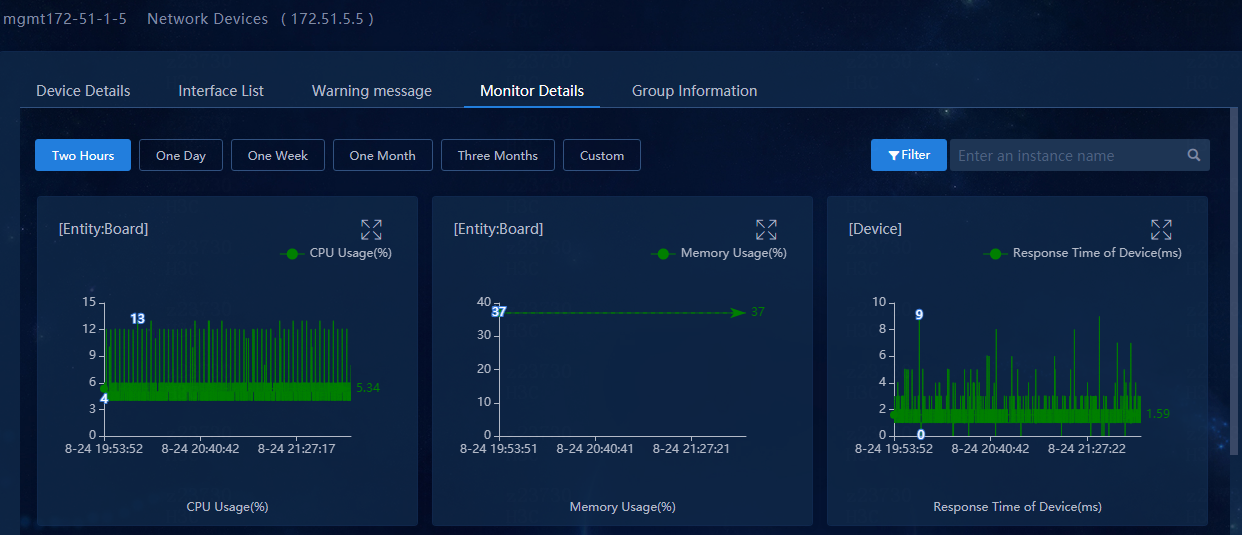
Data collection
· Check item
Functionality of data collection
· Targets
Collection items configured in the monitoring template.
· Pass criteria
The system can correctly collect data for the collection items at an interval of 5 minutes.
· Example
Select Monitor > Monitor List > Network Monitors, and click the device label of a monitor-enabled device.

View monitoring details on the page that opens.
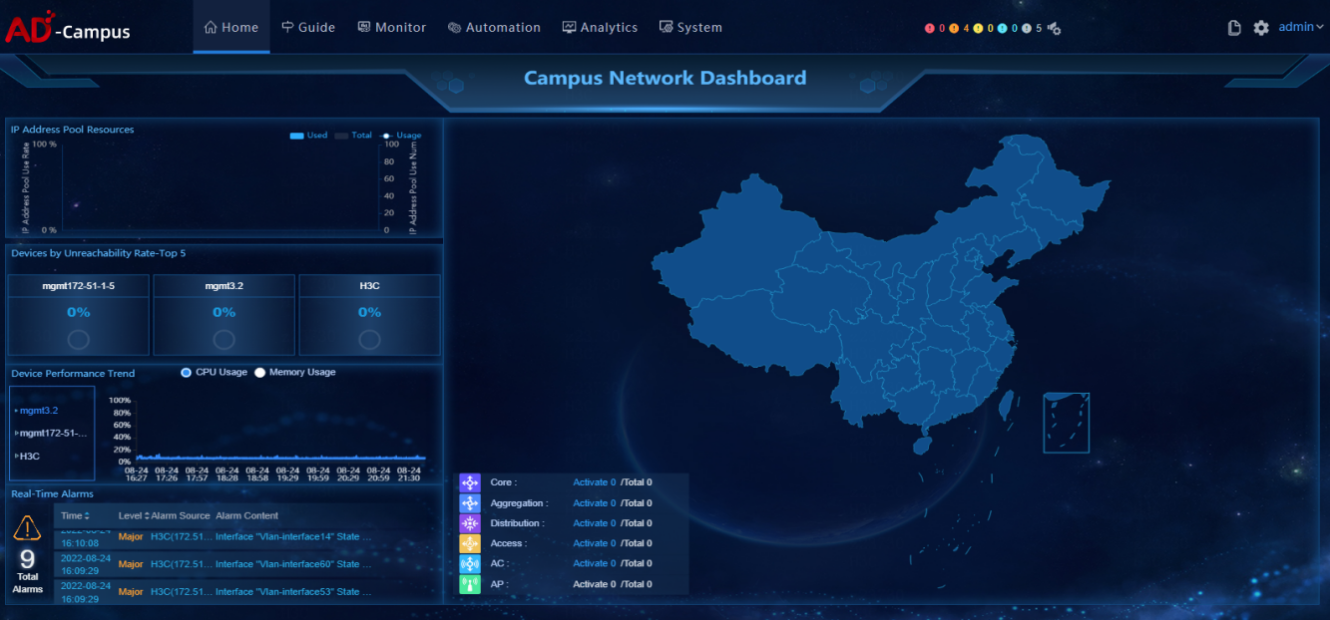
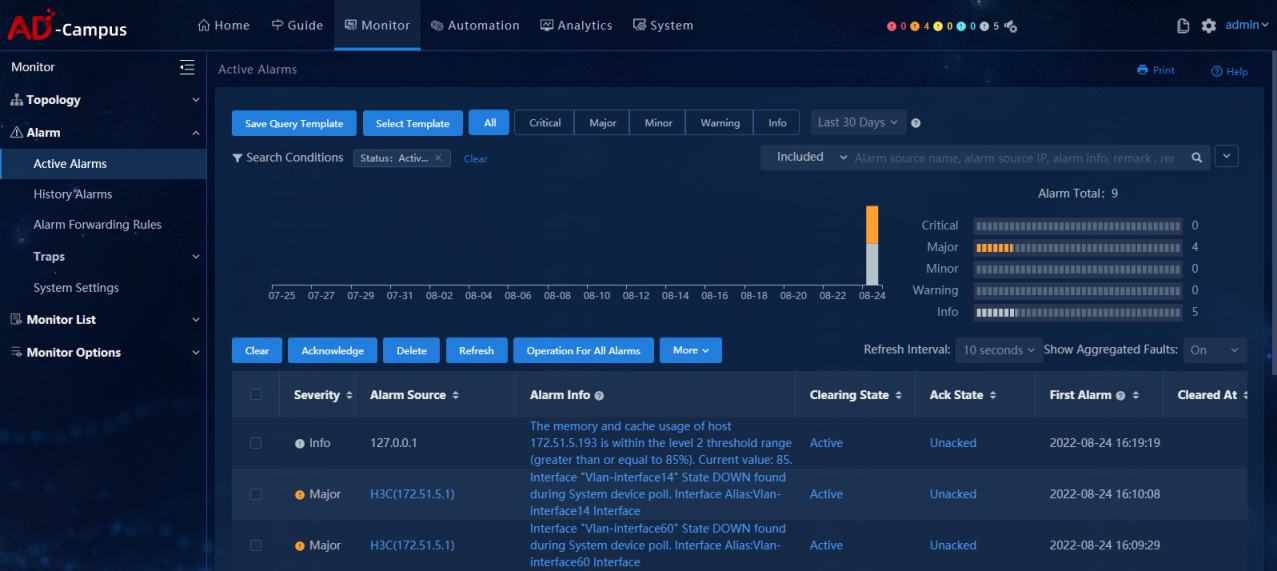
Alarming
· Check item
Alarm functionality
· Targets
Active alarms, alarming functionality, and alarm classification.
· Pass criteria
The system can generate active alarms and display the alarms by alarm level.
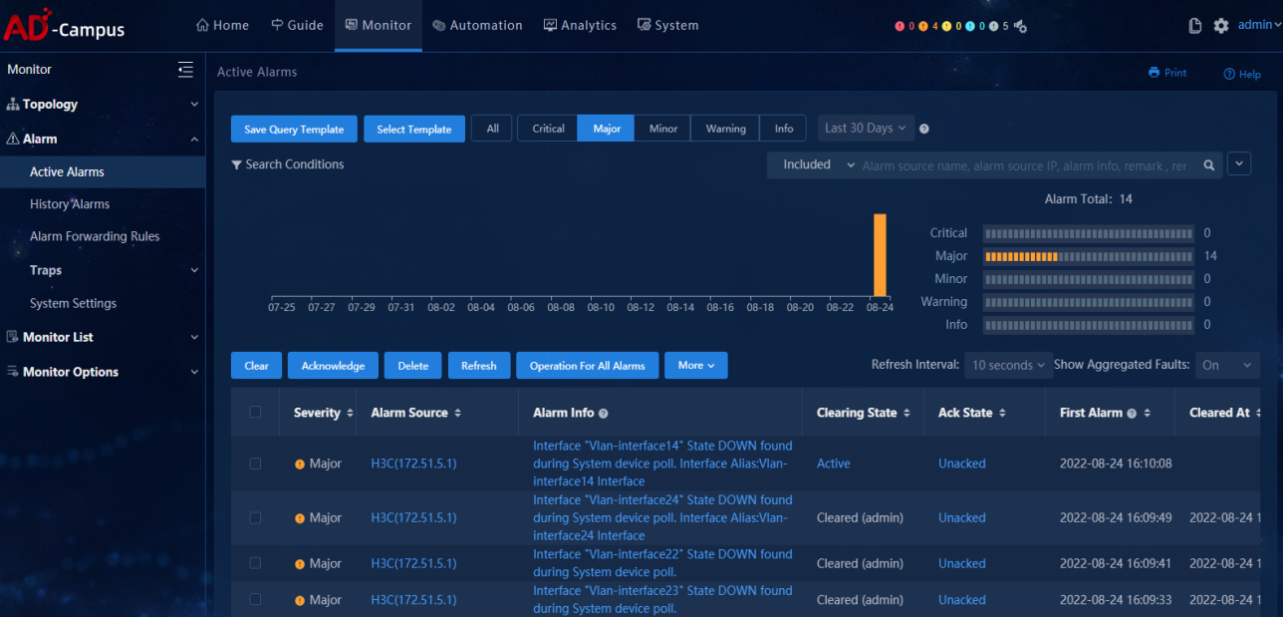
· Example
Select Monitor > Alarm > Active Alarms, and view alarm information.

Select Monitor > Alarm > Active Alarms, click the alarm level, and view alarm levels.
Check the running environment
Size of the database backup directory
· Check item
Size of the database backup directory
· Targets
The size of the database backup directory.
· Pass criteria
The database backup directory does not exceed 50 GB.
· Example
The database backup is performed at 0 o'clock every day. Check the size of the database backup directory.
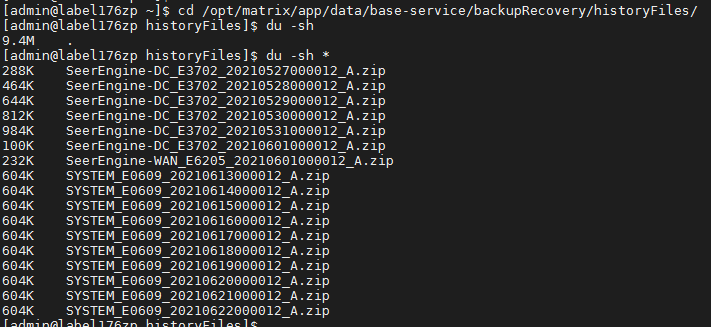
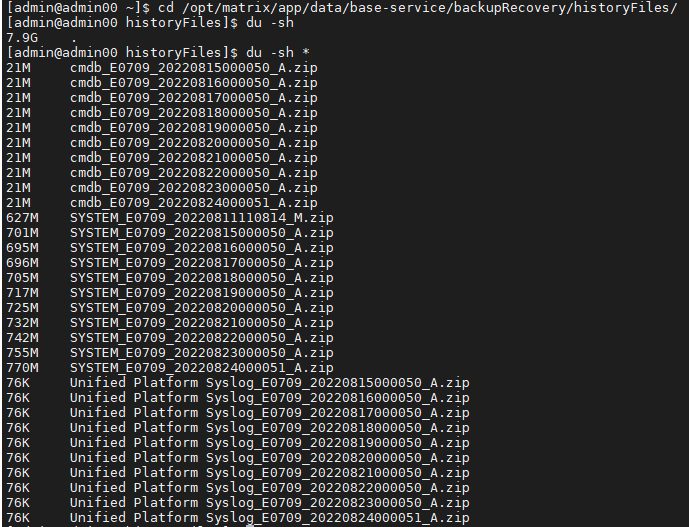
In the above figure, the size of the database backup directory is 7.9 GB, less than 50 GB.
Database backup time
· Check item
Last database backup time
· Targets
Last database backup time.
· Pass criteria
The last database backup is performed early in the morning. If the customer has modified the backup time, then it is the modified backup time.
· Example
Log in to the Web page of Unified Platform, and select System > Backup & Restore to view the backup history. Check whether there exist new backup files.
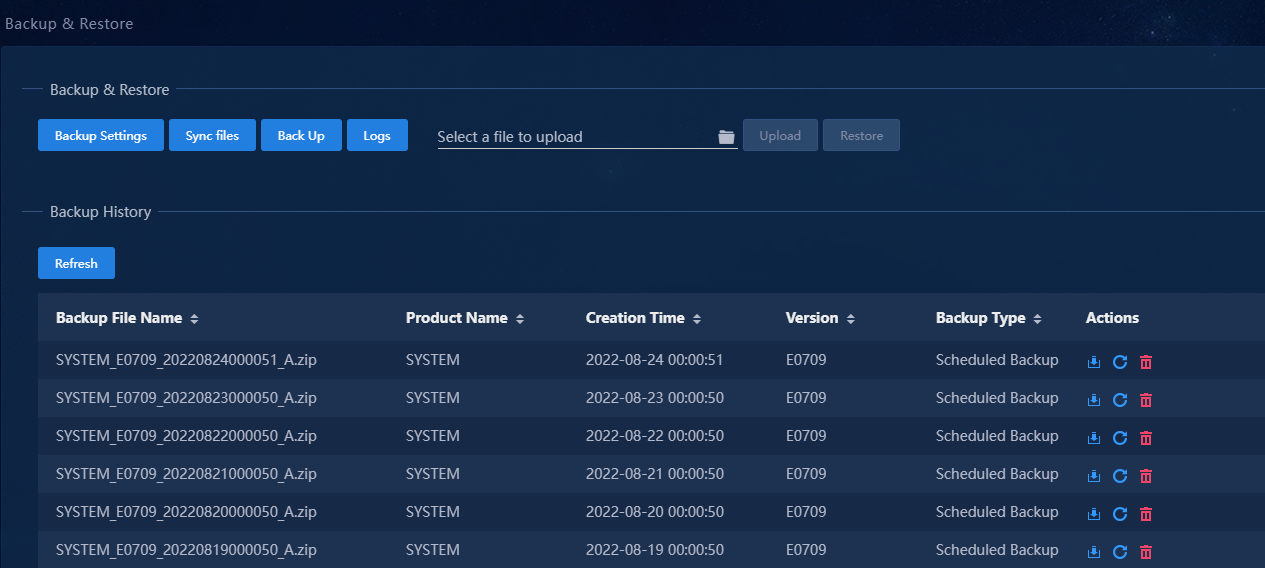
For example, the files in the above figure are backed up at 0 o'clock as scheduled and are the latest.
Time zone and system time
· Check item
Time zone and system time of Unified Platform cluster
· Targets
Time zone and system time of each node in Unified Platform cluster.
· Pass criteria
The time zone and system time are consistent with local situation.
· Example
Execute the date command on each node in the background to check the time zone and system time.
![]()
Cluster state
· Check item
States of the three master nodes in the cluster
· Targets
Cluster state.
· Pass criteria
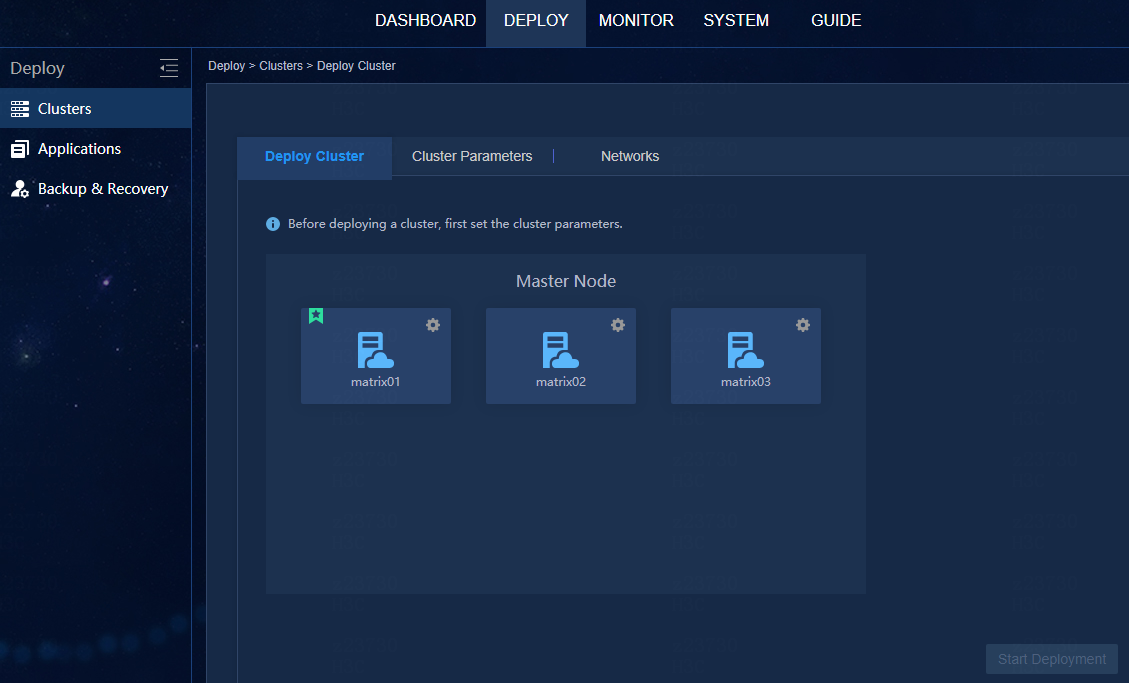
The master nodes in the cluster are in normal states.
· Example
Log in at https://virtual IP address of northbound service:8443/matrix/ui using the username and password admin/Pwd@12345. Select Deploy > Clusters > Deploy Cluster to verify that the nodes are normal.
Cluster resources
· Check item
Usage of cluster resources and state of free resources
· Targets
Cluster resources.
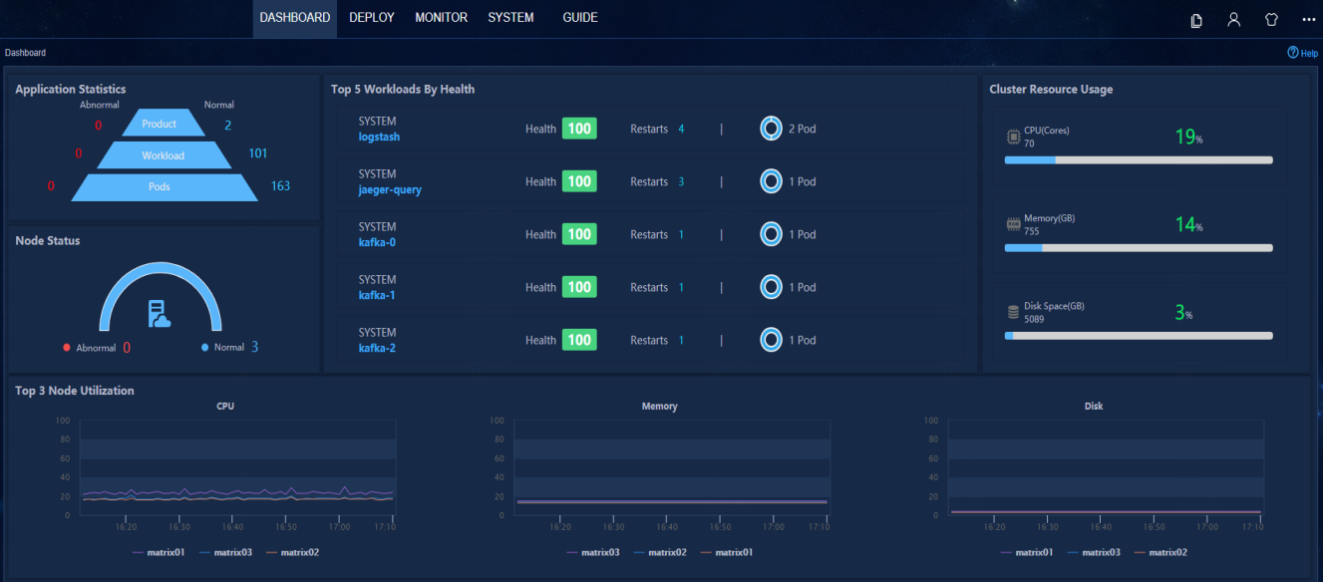
· Pass criteria
The CPU usage and memory usage of the cluster resources do not exceed 70%.
· Example
Log in at https://virtual IP address of northbound service:8443/matrix/ui using the username and password admin/Pwd@12345. Open the dashboard to view resource usage of different nodes. Verify that the CPU usage and memory usage of the cluster resources do not exceed 70%.
Check resource information
Licensing state
· Check item
Software licensing and node registration of Unified Platform is performed correctly.
· Targets
Software licensing and node registration of Unified Platform.
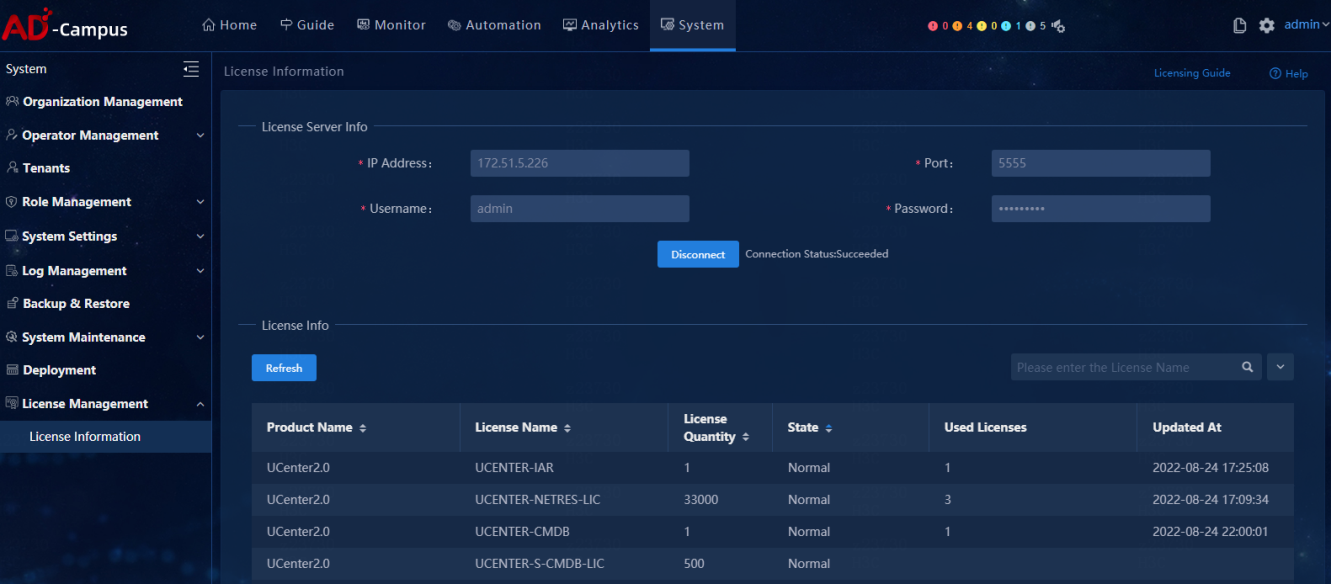
· Pass criteria
Licenses of all nodes are available. Unified Platform is consistent with the license name and license quantity on the license server.
· Example
Log in to Unified Platform, and select System > License Management > License Information to view license information.
Pod running state
· Check item
Running state and reboot count of each pod
· Targets
Running state and reboot count of each pod.
· Pass criteria
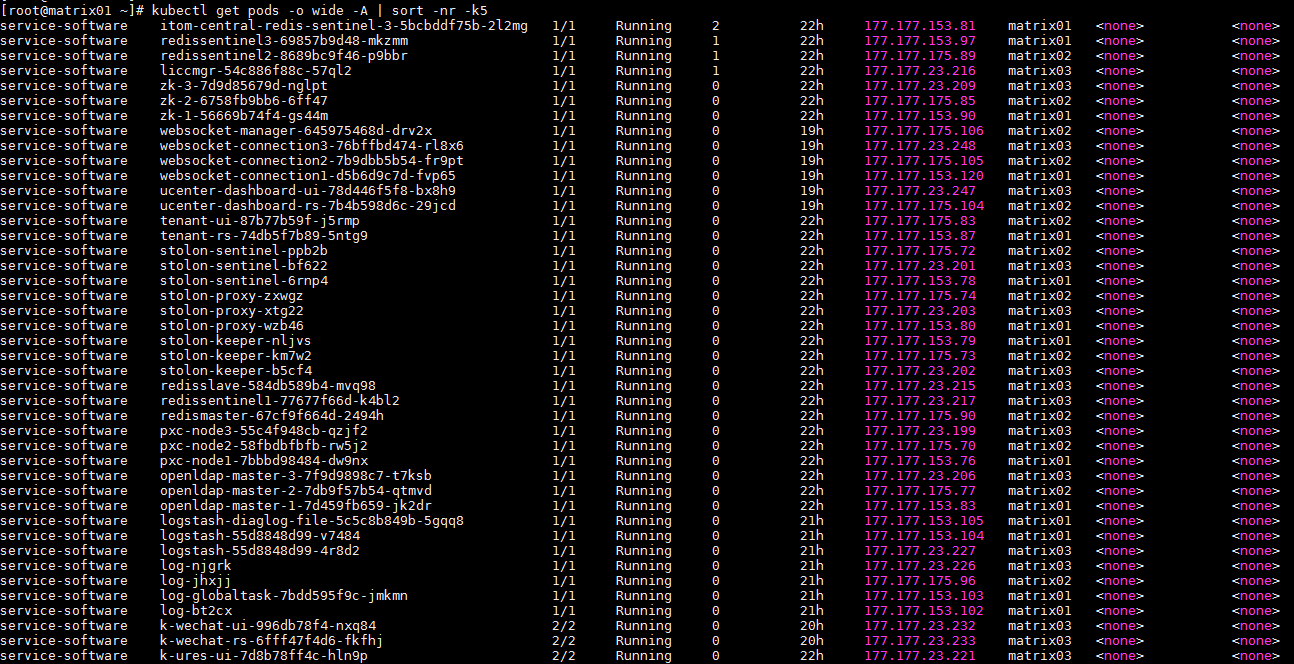
Pod state is Running;
The reboot count for each pod is less than 10.
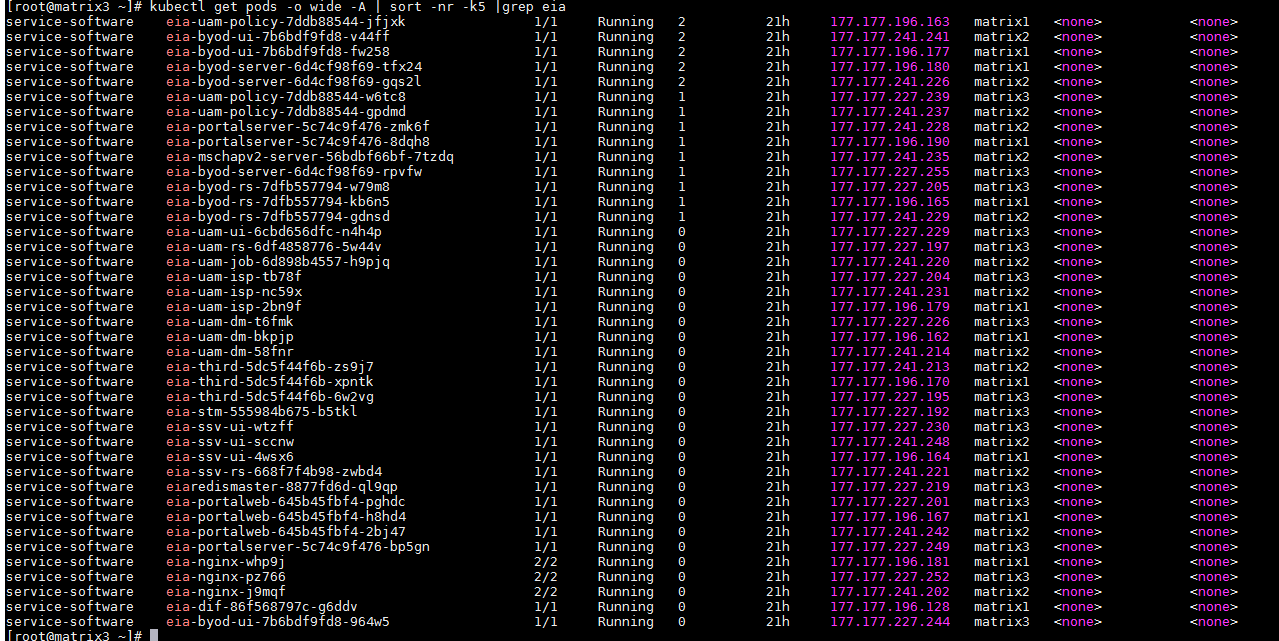
· Example
Execute the kubectl get pods -o wide -A | sort -nr -k5 command to check the running state and reboot count of each pod.
Mark the pods that have rebooted more than 10 times as risks, and list the top 10 pods by reboot count.
For the pods that have rebooted more than 10 times, check whether sufficient resources are available for the pods (For resource usage state, refer to "Cluster resources"). If resources are sufficient, contact the R&D engineers to locate the issues.
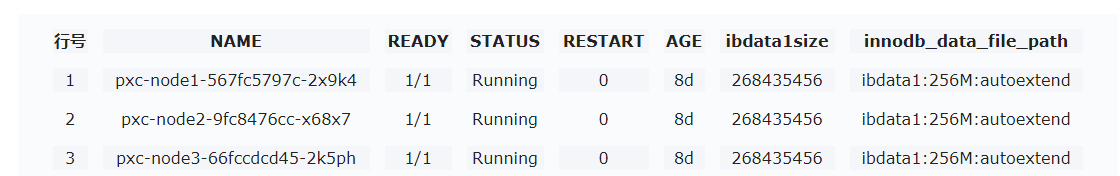
PXC database service
· Check item
PXC database service state
· Targets
Running state of each service node in PXC cluster.
· Pass criteria
In cluster deployment environment: For pods of three PXC nodes, READY state is 1/1, and STATUS state is Running.
In standalone deployment environment: For pods of one PXC node, READY state is 1/1, and STATUS state is Running.
· Example
1. Execute the k8s command to check the database service state:
Log in to any node in the background of Unified Platform, execute the kubectl get pod -n service-software | grep pxc command to view the states of all PXC database services.
In cluster deployment environment:

In standalone deployment environment:
![]()
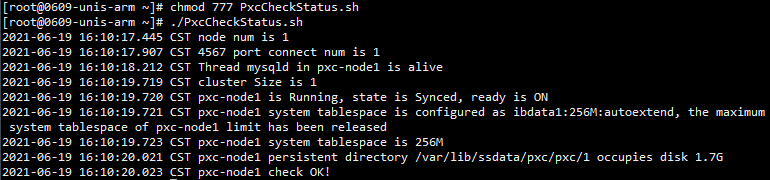
2. Run the script to check the database service state:

Log in to any background of Unified Platform, use the FTP tool to upload the check script to any directory, and execute the chmod 777 PxcCheckStatus.sh command to grant execute permission on files. Then execute the ./PxcCheckStatus.sh command to run the files, as shown in the figure below:
In cluster deployment environment:
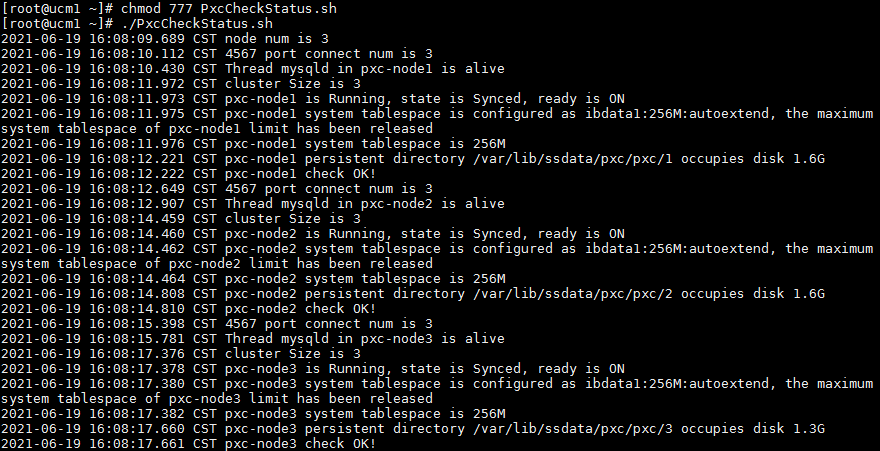
In standalone deployment environment:
Check the license server
License server network quality
· Check item
Quality of the network of the license server and nodes in the cluster
· Targets
Quality of the network of the license server and nodes in the cluster.
· Pass criteria
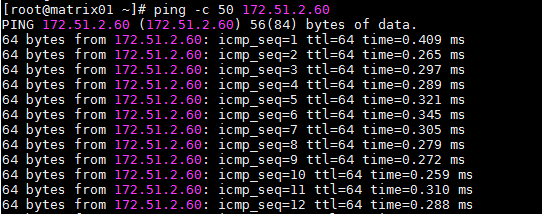
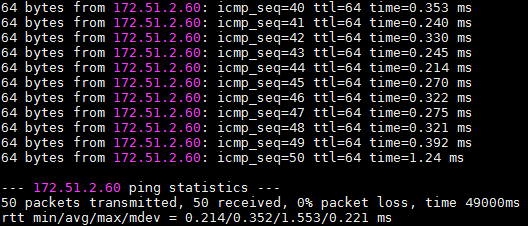
The packet loss ratio is 0%, and the average response time is shorter than 0.25 ms.
· Example
When one cluster node pings the license server 50 times, the packet loss ratio is 0%, and the average response time is shorter than 0.25 ms.
License server state
· Check item
License server state
· Targets
License server state.
· Pass criteria
The license server is accessible and the license state is normal.
· Example
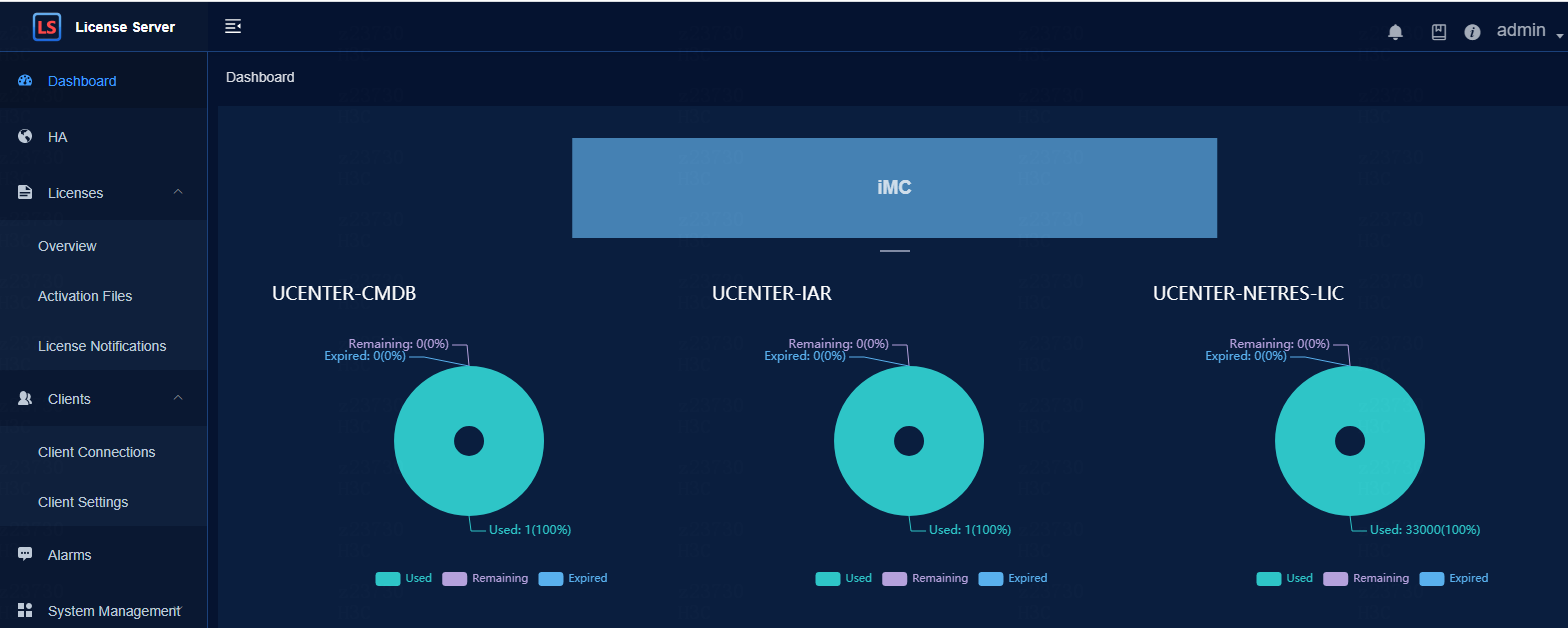
If the license server version is E1204, log in to the license server through https:// licenseserverIP:port numbercsmgr to verify that the license server runs correctly. The default port number is 28443, and the default username and password are admin and admin@123, respectively.
If the license server version is E1153 or E1151, log in to the license server through https://licenseserverIP:port number/licsmanager to verify that the license server runs correctly. The default port number is 28443, and the default username and password are admin and admin@h3c, respectively.
Check whether the license has less than 30 days left. The version E1204 is taken as an example in the figure below
License server HA state
· Check item
License server HA state
· Targets
License server HA state.
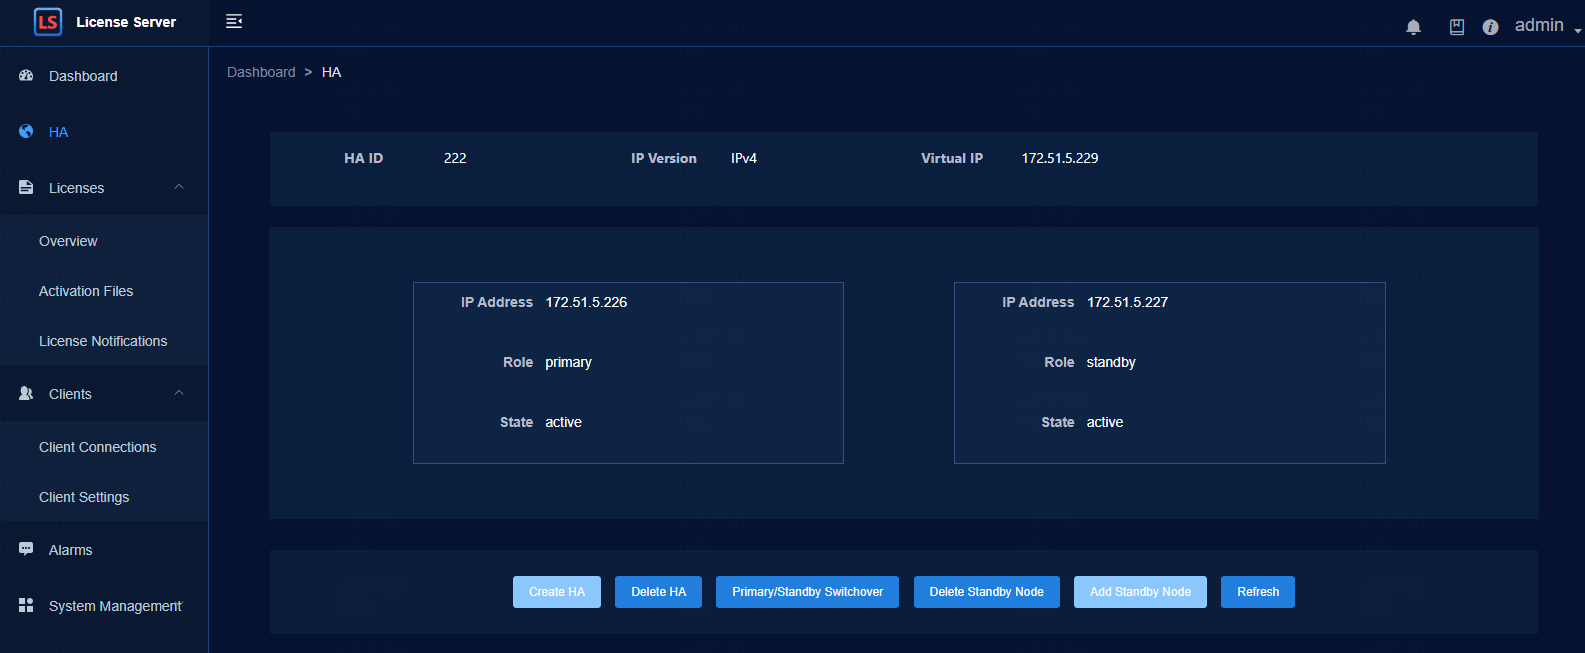
· Pass criteria
If HA is disabled, then the page displays Configure HA.
If HA is enabled, then the page displays HA Configuration and HA status is normal.
· Example
Log in to the Web page and click HA on the left.
When HA is disabled:

When HA is enabled:
License server client state
· Check item
Client configuration and license deployment information
· Targets
Client configuration and license deployment information.
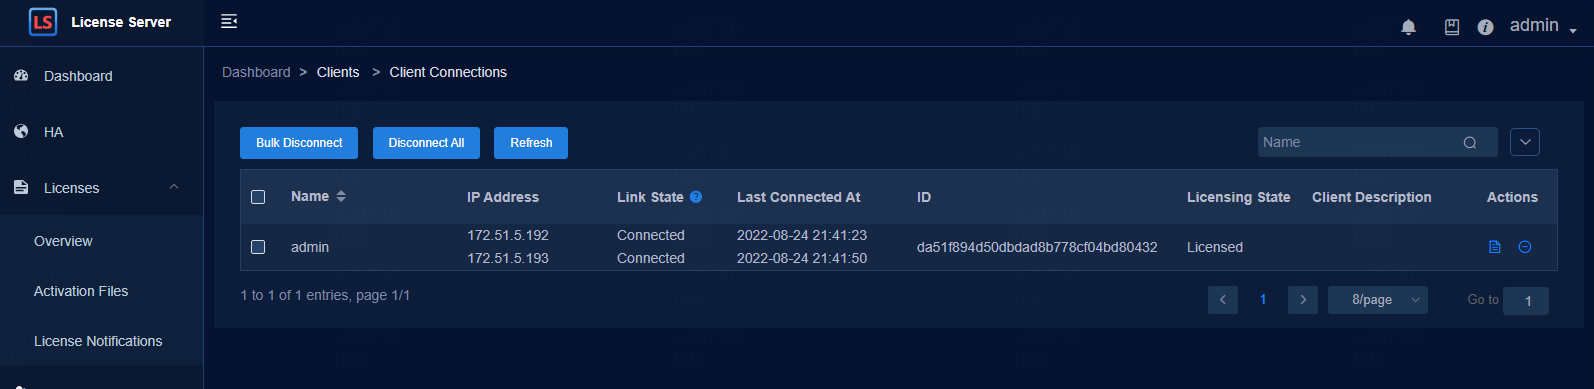
· Pass criteria
The client is connected to the license server.
· Example
If the license server version is E1204, log in to the license server through https://licenseserverIP: port number/licsmgr.
If the license server version is E1153 or E1151, log in to the license server through https://licenseserverIP:port number/licsmanager and select Licenses > Client Connections to check the connection state of the client and the license state. Version E1204 is taken as an example in the figure below.

Check the information
Execute the one-click check script
· Check item
Platform information
· Targets
Each master node executes the ./env_check.sh script in the cd /opt/matrix/tools/ directory to inspect the environment. Please execute ./env_check.sh -h for how to use the script.
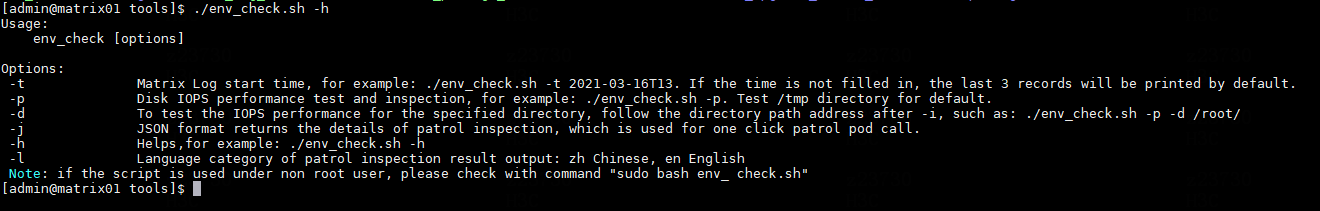
· Pass criteria
Results of all check items are Pass. Otherwise, locate the cause.
· Example
The revised figure is as follows:
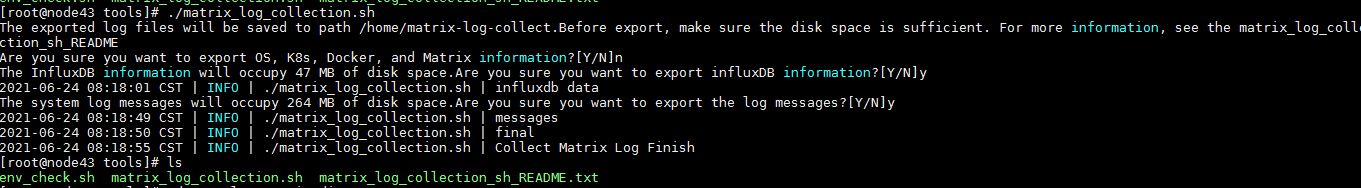
Execute the script to collect supplemental logs
· Check item
Collection of supplemental logs other than system logs, operation logs, and run logs.
· Targets
Each node executes /opt/matrix/tools/matrix_log_collection.sh to start collecting supplemental logs. The supplemental logs that are collected by one click include:
a. Basic OS information, network information, node and pod information of k8s, docker ps -a, and matrix information.
b. Influxdb data of container and node monitoring data.
c. Message information for OS.
These three types of data can be exported separately on demand.
· Pass criteria
The supplementary information is saved in /home/matrix_log_collection by default. To modify the save path, you can edit the script and modify the path="/home/matrix-log-collect" parameter.
· Example
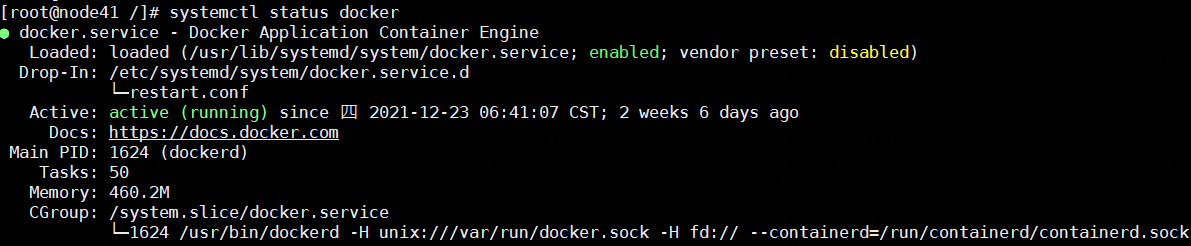
Check whether the service states of the node, pod and host are normal
· Check item
Functionality of platform node, pod, docker, kubelet, etcd, and Matrix services
· Targets
Functionality of node, pod, kubelet, etcd, and Matrix services.
· Pass criteria
The status of each node is Ready.
The status of each pod is Running, and READY state is n/n, such as 1/1.
The service states of kubelet and docker on all the nodes are active (running), where the service state of etcd and Matrix on the master node is active (running).
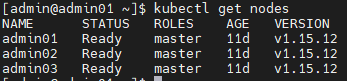
· Example
Log in to the background of the master node and execute the kubectl get nodes command to verify that the state of each node is normal. Normally, the STATUS of each node is Ready.
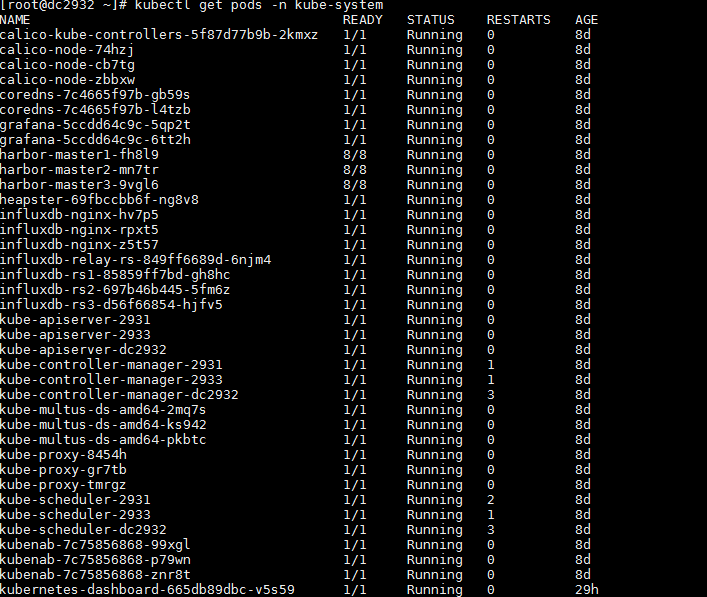
Execute the kubectl get pods -n kube-system command to verify that the state of pod under the kube-system namespace is normal. Normally, the STATUS is Running, and READY state is N/N, such as 1/1.
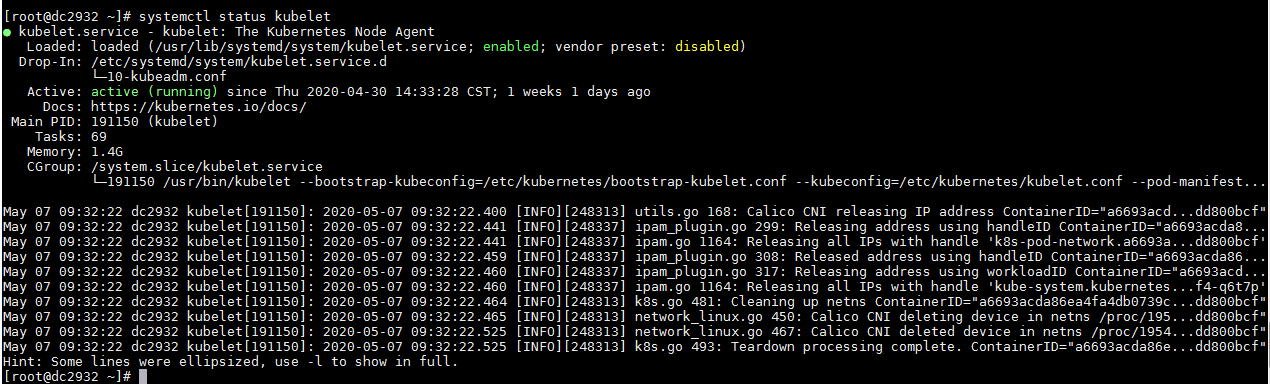
Execute the systemctl status kubelet command to verify that kubelet state is normal. Normally, the state of kubelet is active (running).
Execute the systemctl status etcd command to verify that etcd state is normal. Normally, the state of etcd is active (running).
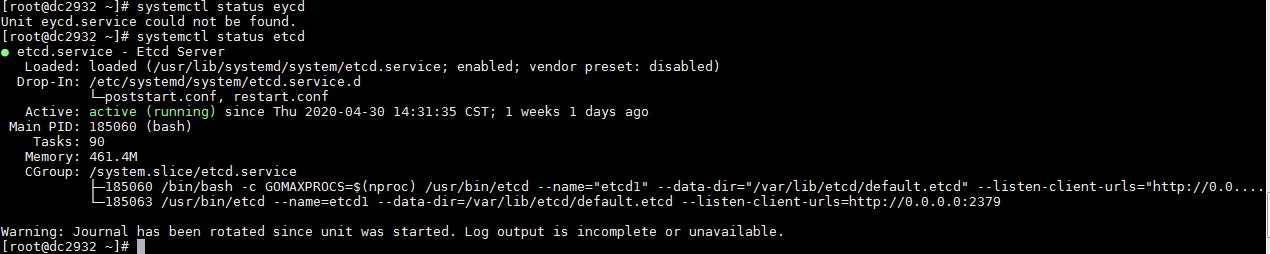
Execute the systemctl status matrix command to verify that matrix state is normal. Normally, the state of matrix is active (running).
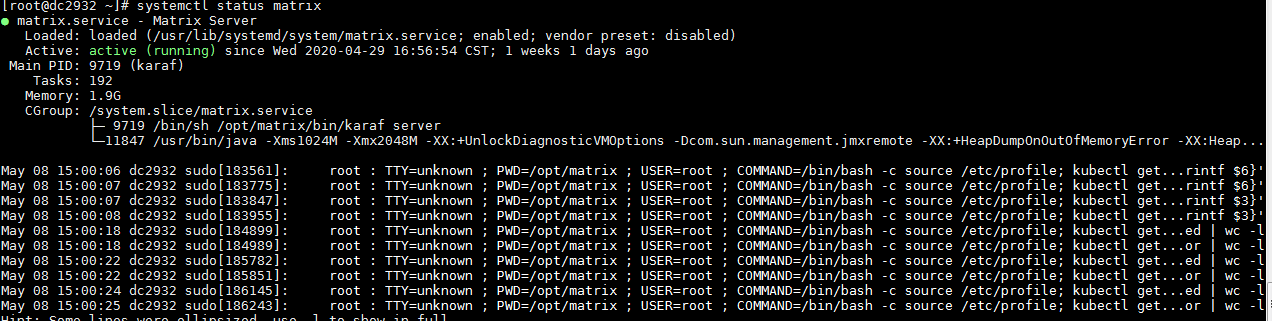
Execute the systemctl status docker command to verify that docker state is normal. Normally, the state of docker is active (running).
Network transmission between cluster node IP and virtual IP
· Check item
Network transmission between cluster node IP and virtual IP
· Targets
Network transmission between cluster node IP and virtual IP.
· Pass criteria
The network transmission between cluster node IP and virtual IP is normal, and no reachability or packet loss issues occur.
· Example
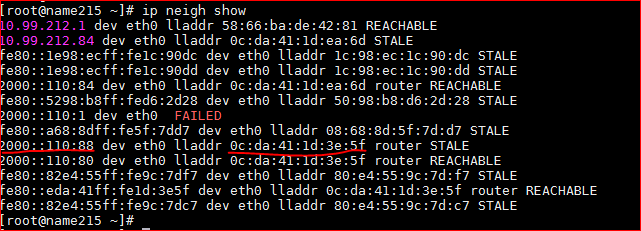
Execute the ping command to test network connectivity to other IPs and verify that no reachability or packet loss issues occur.
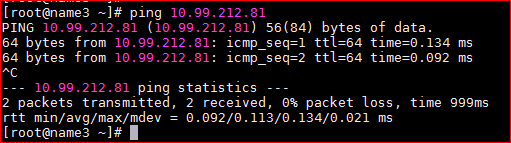
If the virtual IP is inaccessible by a ping command from a slave node, and the virtual IP does exist in the cluster, then check whether the MAC address of the virtual IP of the cluster in the ARP or neighbor table for this slave node is correct.
Figure 1 ARP table for IPv4
![]()
Figure 2 Neighbor table for IPv6
Redundant or decompressed installation packages in the /opt/matrix/app/install/packages directory
· Check item
Redundant or decompressed installation packages in the /opt/matrix/app/install/packages directory for each node
· Targets
/opt/matrix/app/install/packages directory for each node.
· Pass criteria
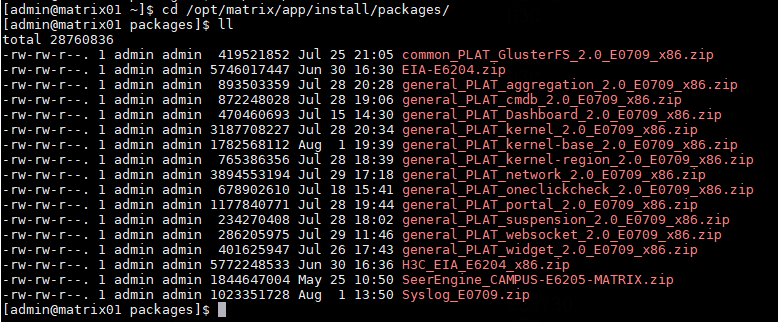
No redundant or decompressed installation packages exist in the /opt/matrix/app/install/packages directory for each node.
· Example
Execute the ll command to verify that no redundant or decompressed installation packages exist in the /opt/matrix/app/install/packages directory. Delete them if any (If the disk usage is high, delete all packages except the currently used packages. If the disk usage is low, ignore this check item).
Grafana and jobservice file and directory permissions
· Check item
Grafana and jobservice file and directory permissions of each node
· Targets
Grafana and jobservice file and directory permissions of each node.
· Pass criteria
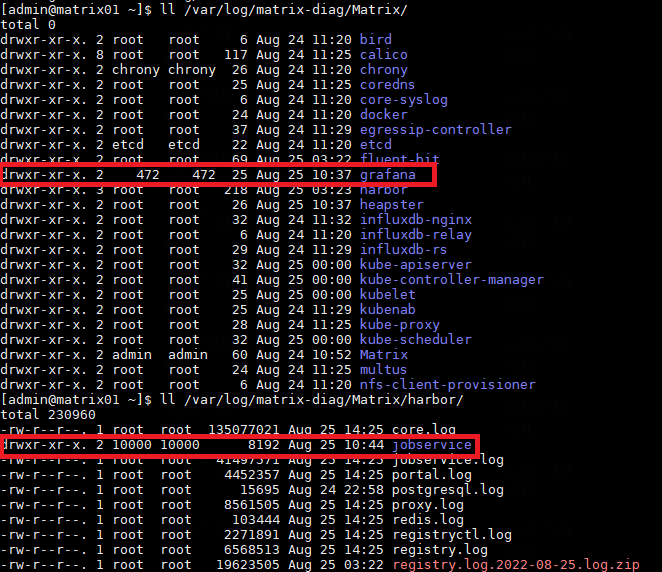
The permission for grafana directory is 472, while the permission for jobservice directory is 10000.
· Example
Execute the ll command to view the permissions of grafana and jobservice directories on each node, as shown in the following figure.
|
|
NOTE: (1) Since there are only two grafana pods, there may be no grafana directory in the /var/log/matrix-diag/Matrix/ directory on some nodes. This case can be ignored. (2) Since there is no harbor pod on the worker node, there is no need to consider the jobservice directory permissions on the worker node. |
Check the automatic inspection items
One-click check for E0706L01 and later versions
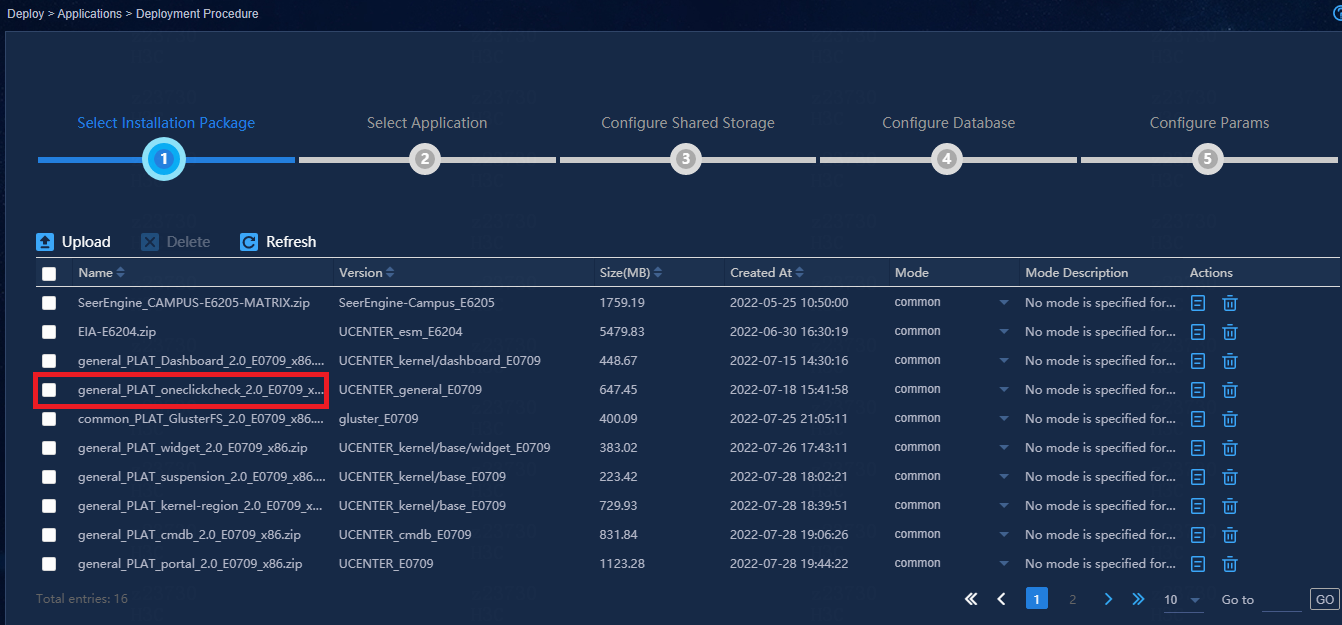
The one-click check (OCC) feature (general_PLAT_oneclickcheck_2.0_<version>.zip) has been added to E0706L01 and later E07 versions. This feature allows users to perform a heath check by selecting System > System Maintenance > Health Check.
Install OCC
Log in to the GUI interface of the Matrix container platform, enter the application deployment page, click Deploy and select OCC. Then click Next. Users don't need to configure parameters for OCC.
After completing the deployment, log in to Unified Platform and perform a heath check on the installed component by selecting System > System Maintenance > Health Check.
Manually run one-click check
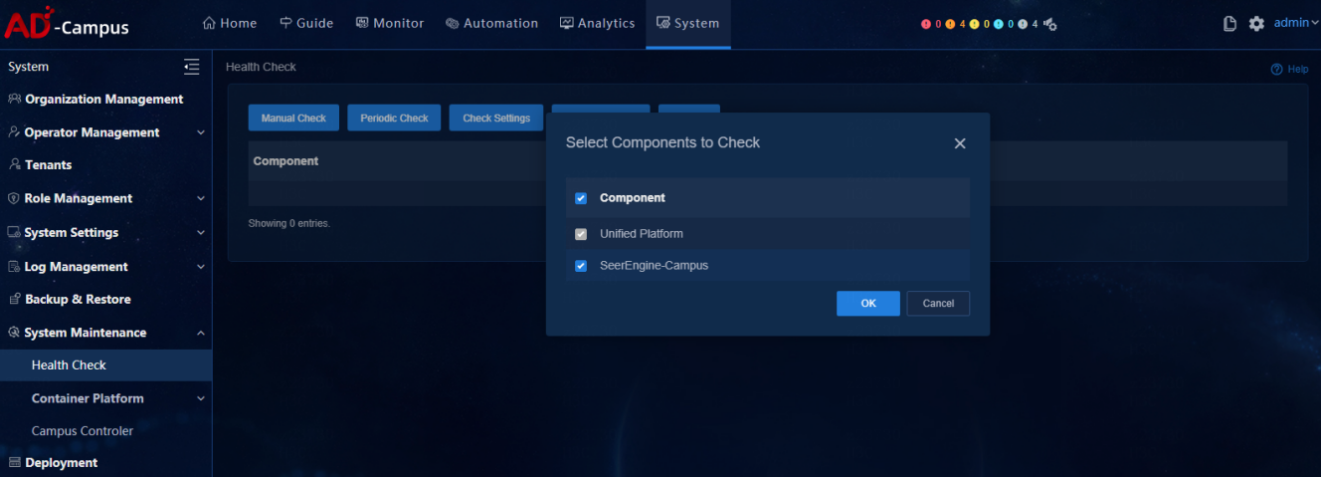
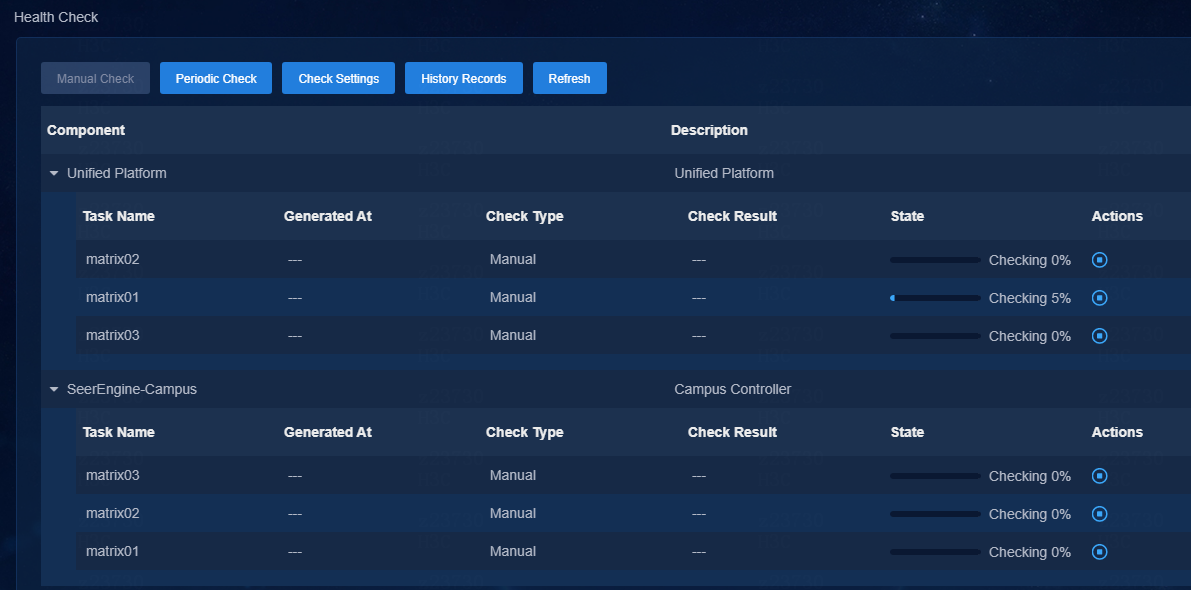
On the Health Check menu, select Manual Check and a component selection box opens. Unified Platform is selected by default and cannot be deselected. Users can select other installed components as required. Click OK to start the health check. The checking progress and check result of selected components can be viewed on the page.
Configure the periodic check (optional)
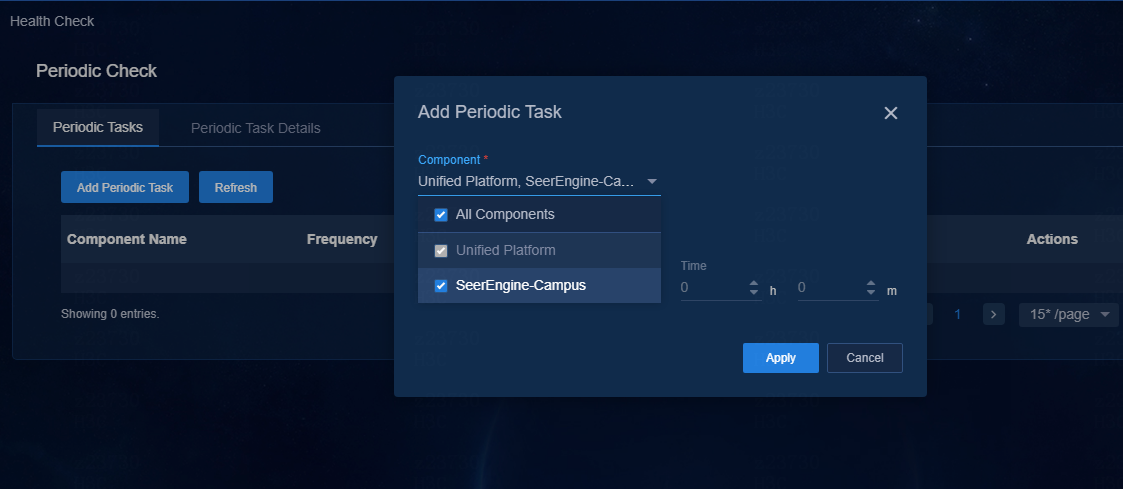
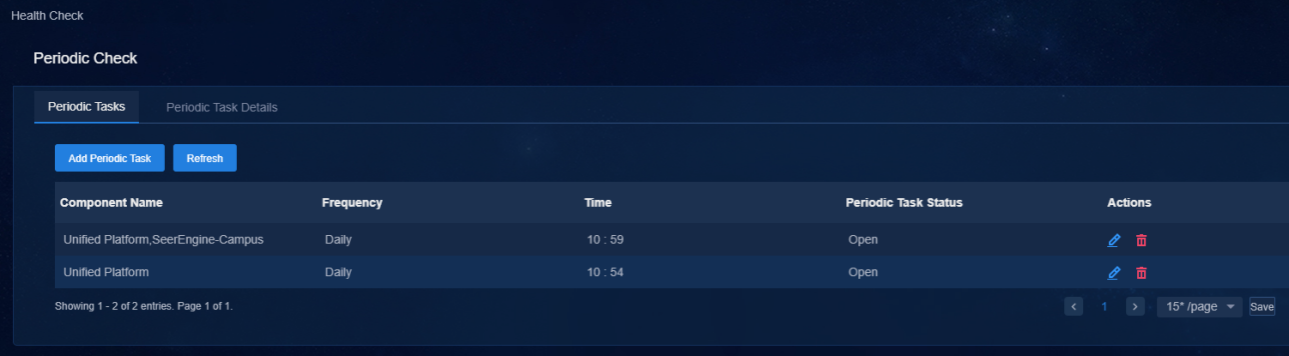
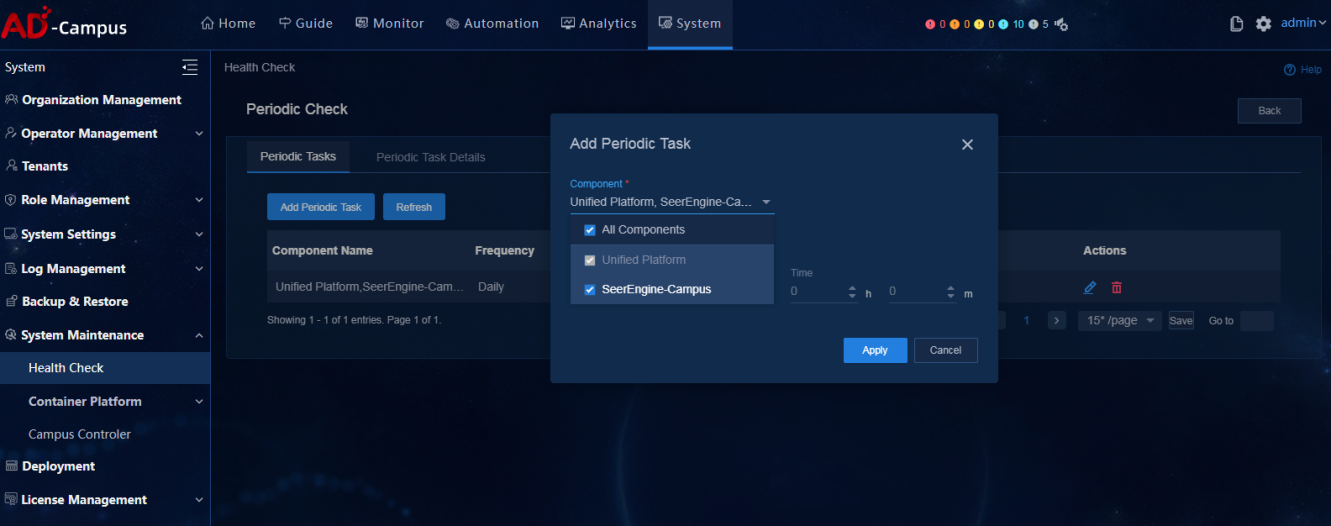
The health check supports configuration of periodic tasks. Click Periodic Check. On the page that opens, click Add Periodic Task and a task configuration box opens. Users can assign tasks to more than one component at a time but cannot assign tasks to components that have been assigned tasks.
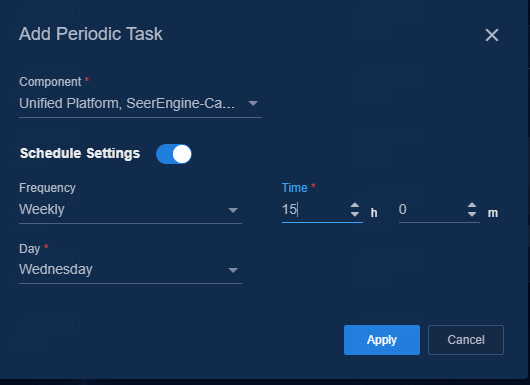
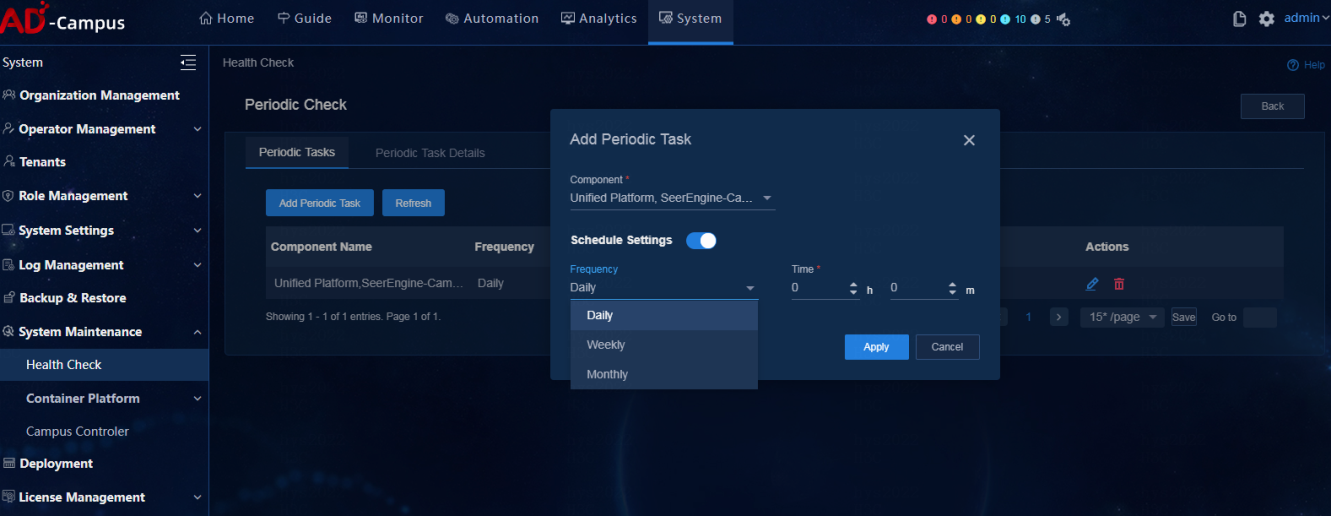
Enable Schedule Settings; otherwise, the added tasks are disabled. Configure the task frequency (daily, weekly, or monthly) and time, and click Apply to save the configuration.
Then the tasks are displayed in the task list. Click icons in the Actions column to modify or delete a task.
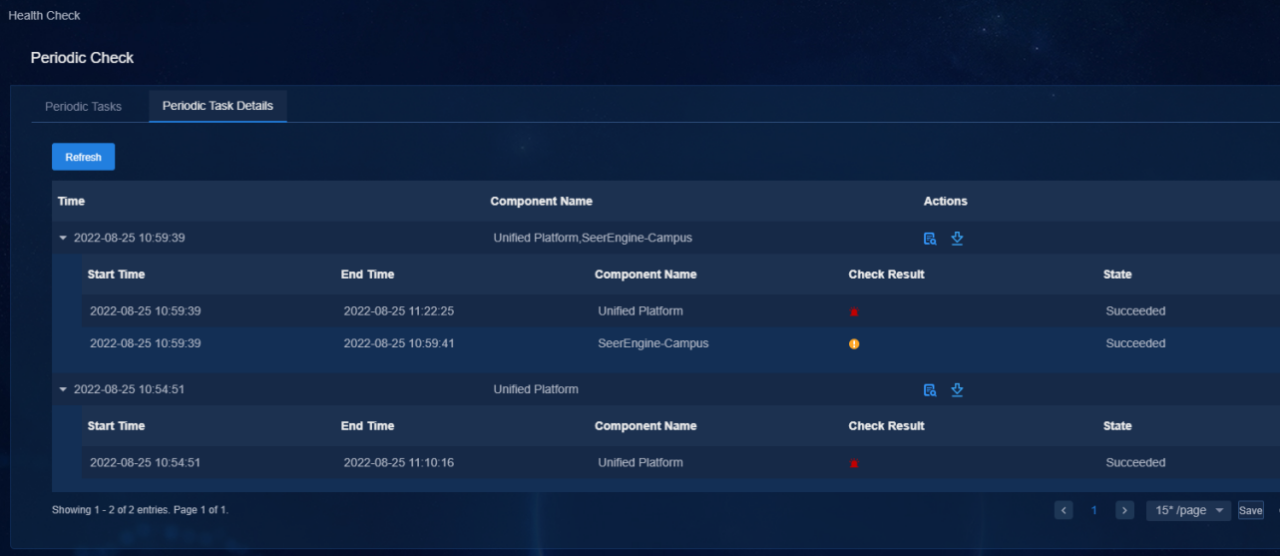
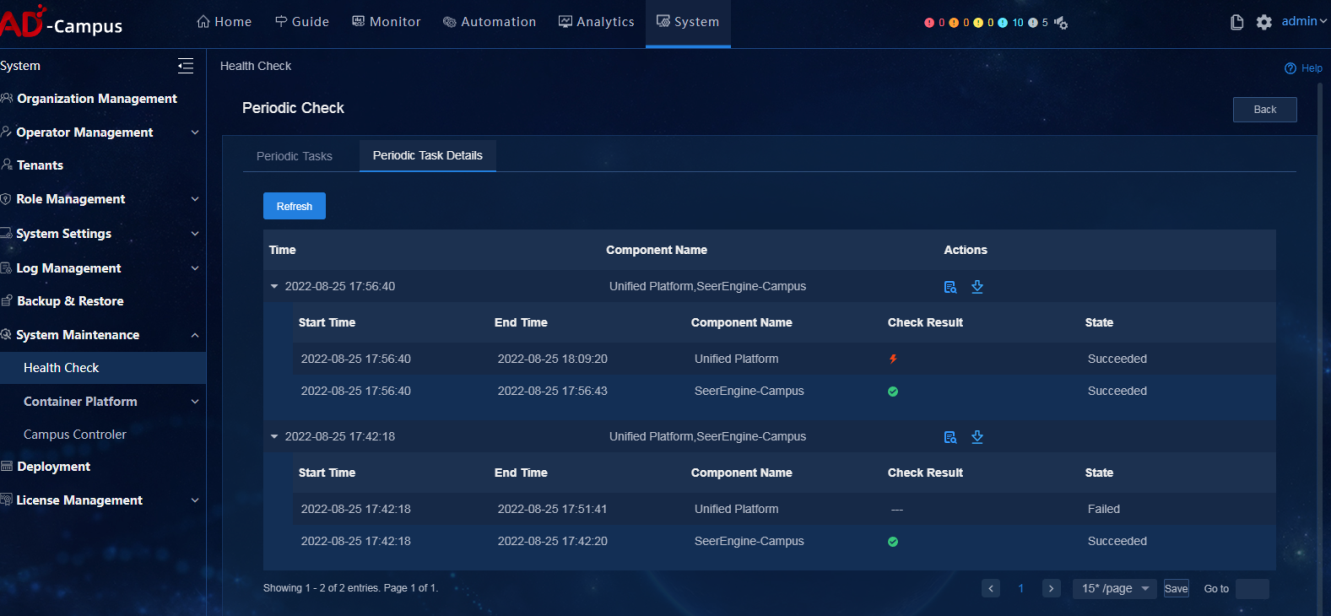
Click Periodic Task Details to view the task status of each component. Click the Details icon in the Actions column to view the check report.
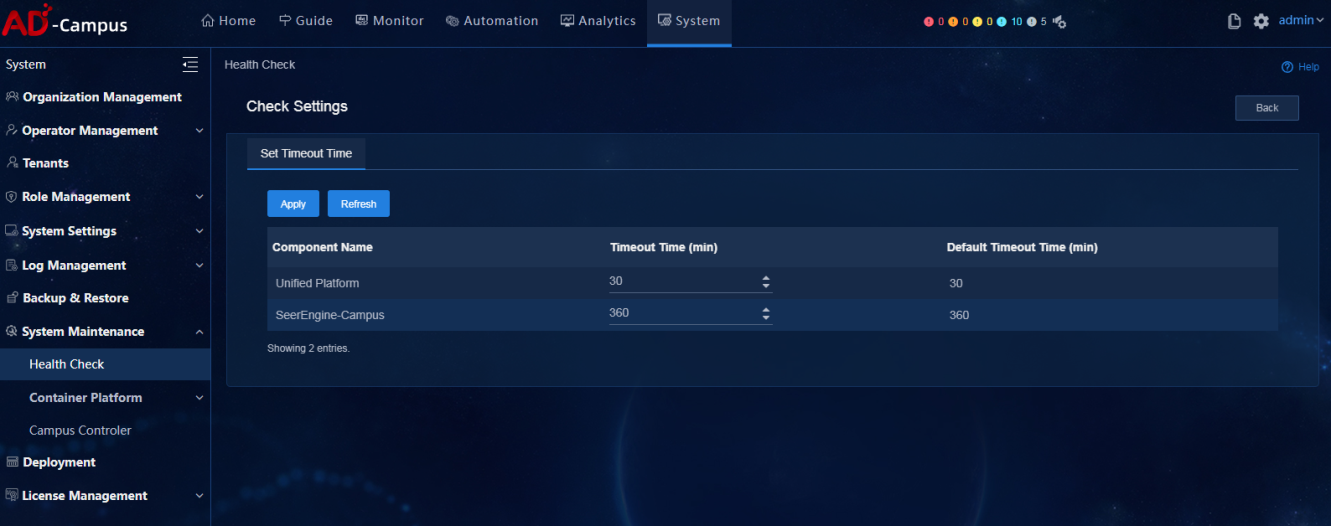
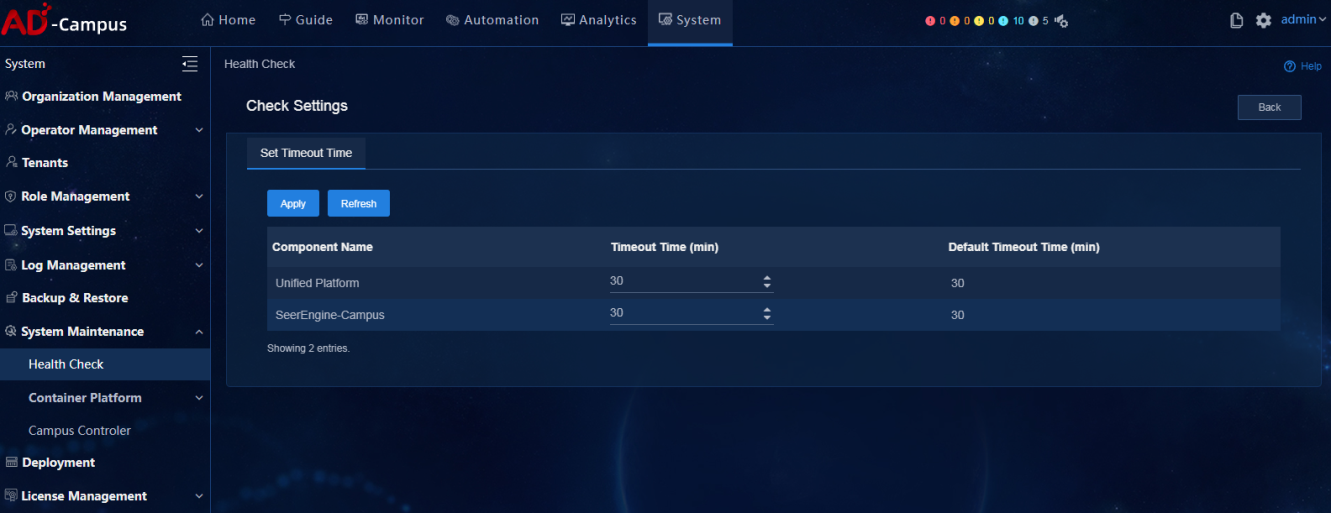
Configure the timeout time of health check (optional)
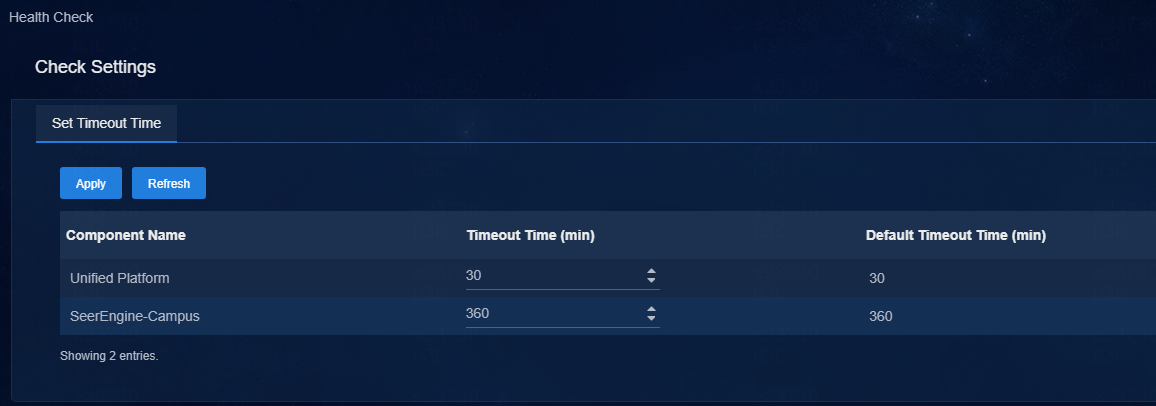
Click Check Settings to access the health check page. You can view or modify the timeout time configuration of installed components. The timeout time can last from 30 minutes to 360 minutes. After you modify the timeout time, click Apply to save the settings. When the check time exceeds the scheduled timeout time, the system automatically marks the check as failed. If multiple components are installed or if the data volume is large, the check process may take longer. In this case, it is recommended to increase the timeout time.
View check result
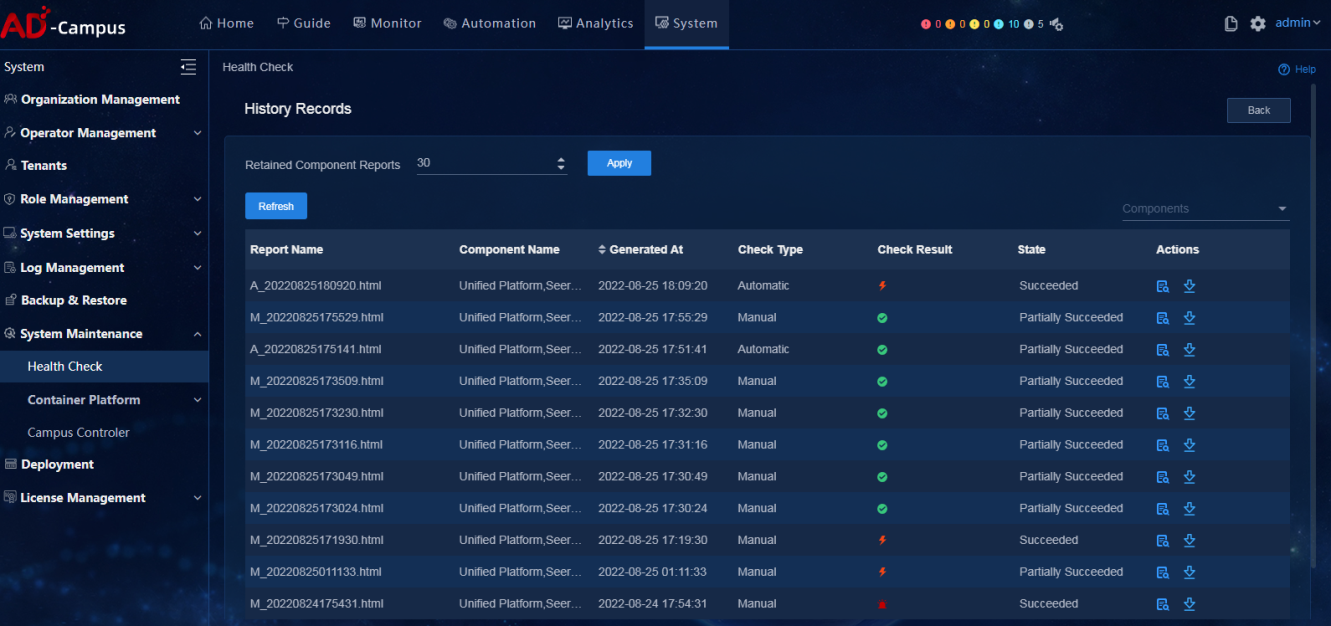
Click History Records to view check records.
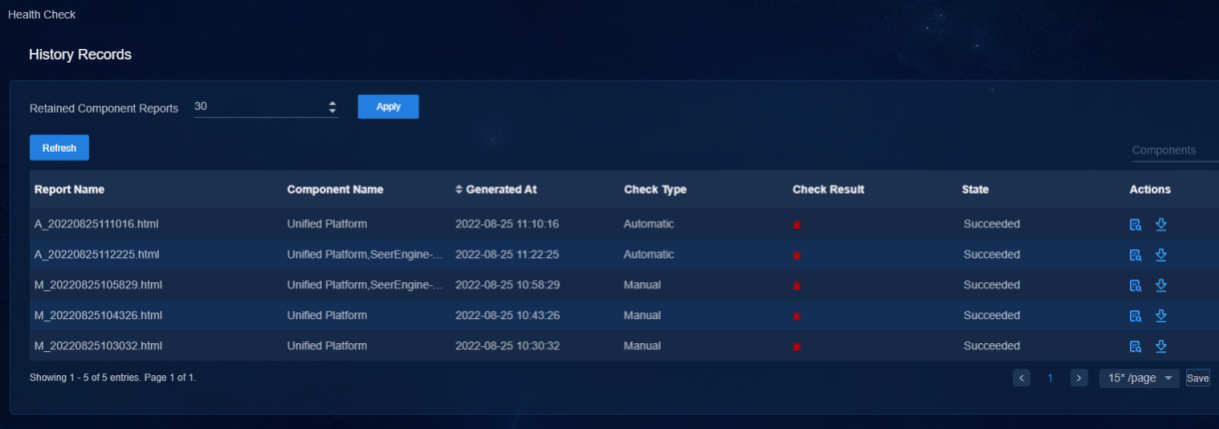
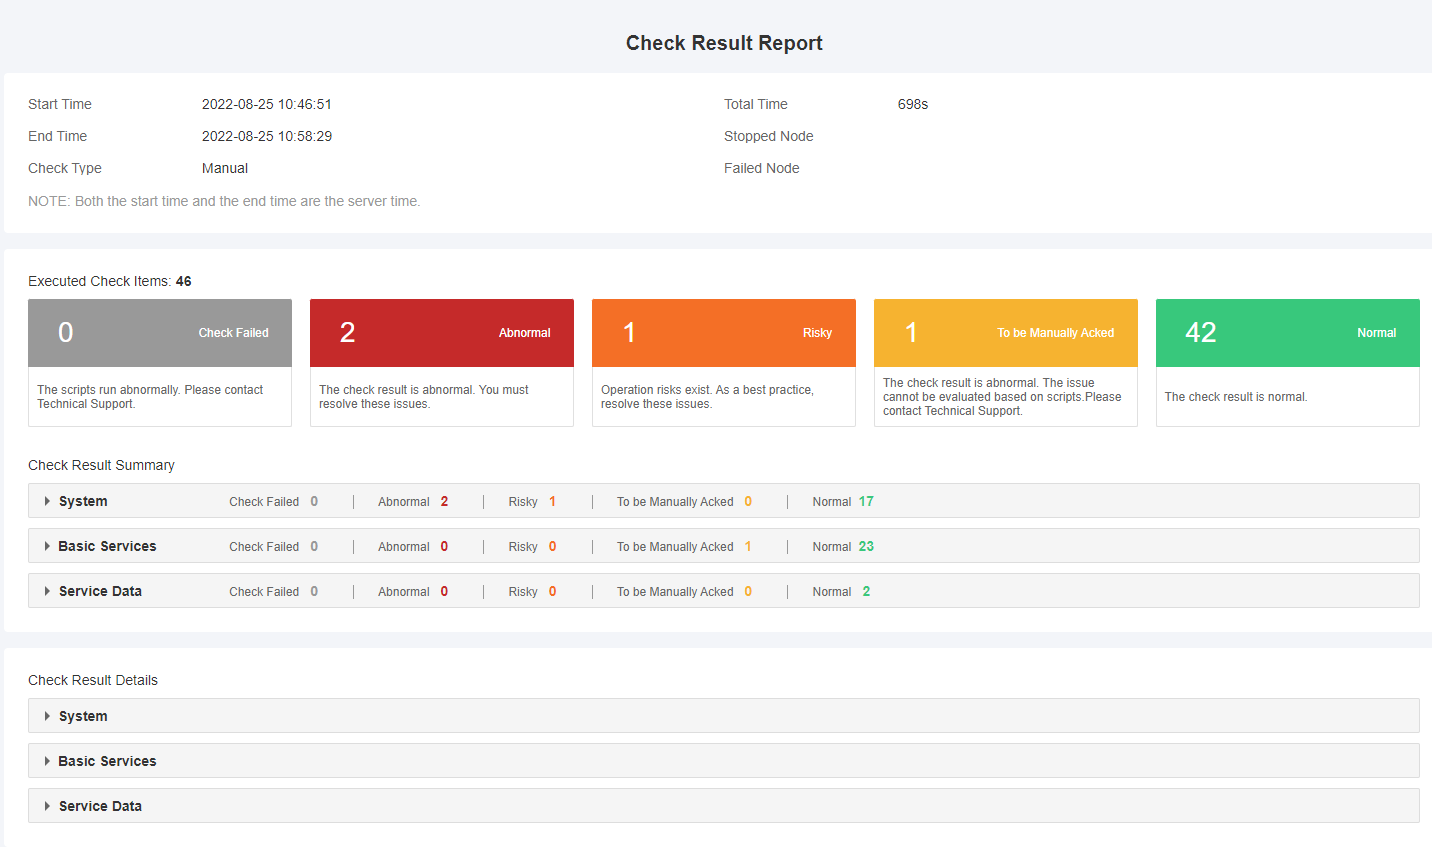
The Check Result Report displays the check time and executed check items in the upper part, and displays check result summary and check result details in the lower part. The check result summary contains the check items and check result of each component. If you click any of the check items, you will go to the corresponding check result details where check result and check principles are contained.
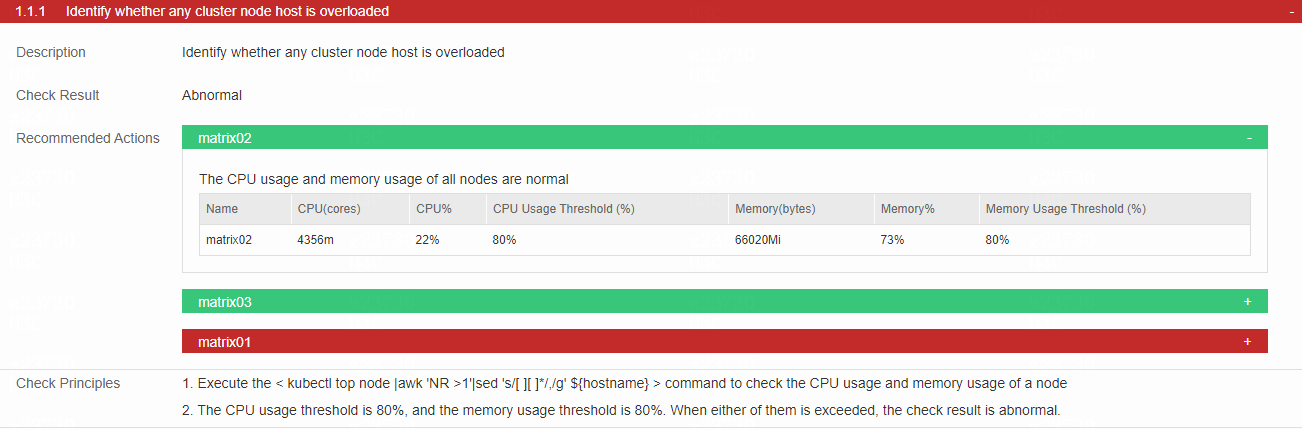
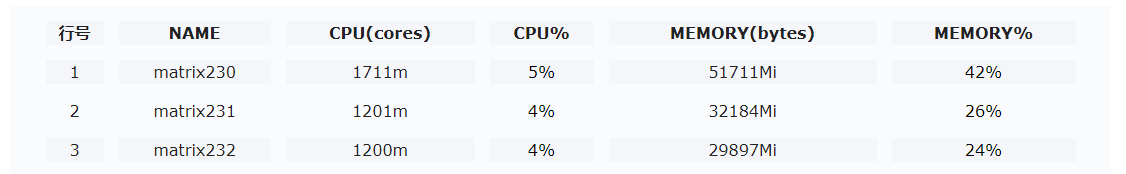
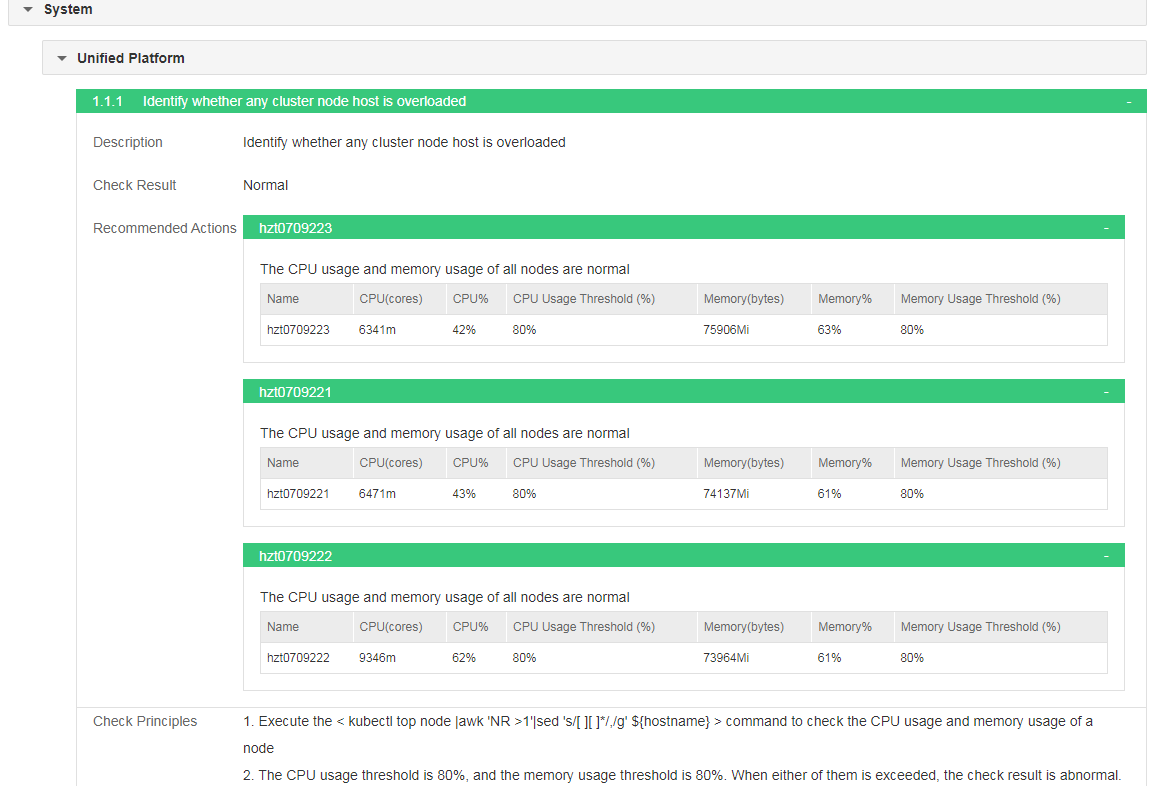
Check the running load of each cluster host node
· Check item
Running load of each cluster host node
· Targets
CPU usage and memory usage of each cluster host node.
· Pass criteria
No items are marked in red in the table, indicating that neither CPU usage nor memory usage exceeds 80%.
· Example
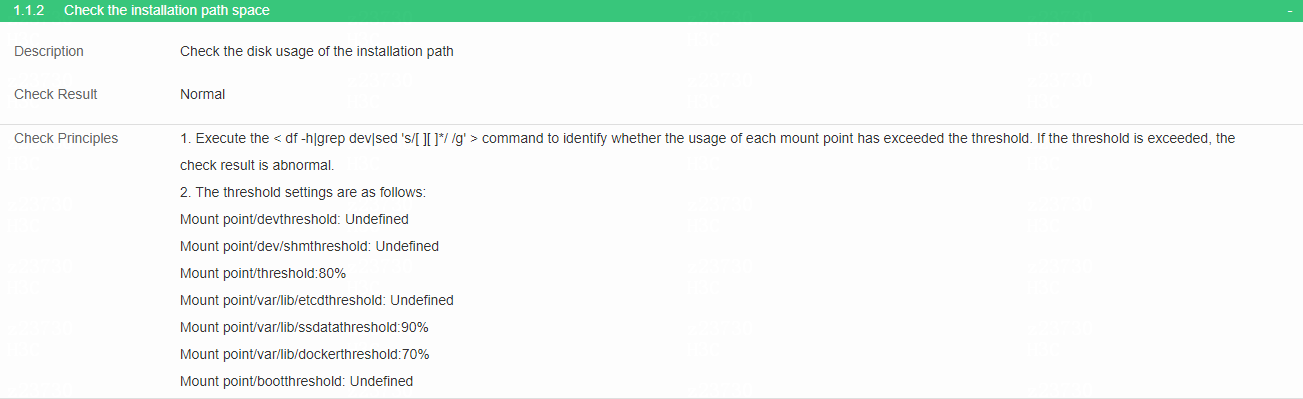
Check the installation path space
· Check item
Disk usage of the installation path
· Targets
Disk usage of the installation path.
· Pass criteria
No items are marked in red in the table, indicating that the disk usage of the installation path on each node in the cluster is smaller than the specified threshold.
· Example
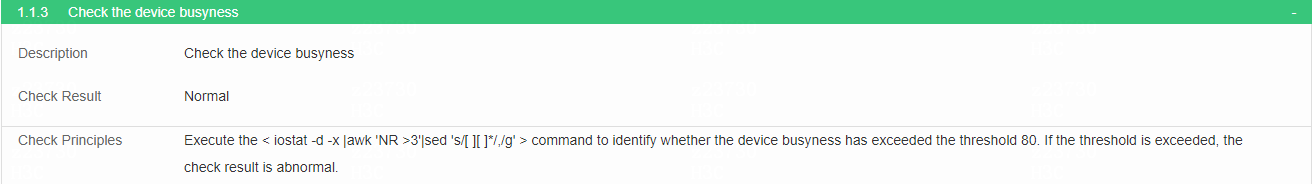
Check the device busyness
· Check item
Device busyness
· Targets
Device busyness.
· Pass criteria
No items are marked in red in the table, indicating that neither disk IO nor CPU usage for each node in the cluster exceeds the specified threshold (if any).
· Example
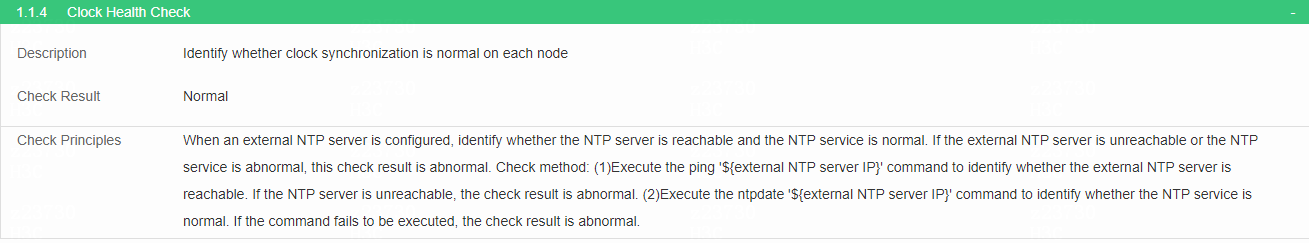
Check clock synchronization
· Check item
Clock synchronization on each node
· Targets
Clock synchronization on each node.
· Pass criteria
When an external NTP server is configured, identify whether the NTP server is reachable. No items are marked in red in the table, indicating that no NTP server is configured or NTP server is reachable.
· Example
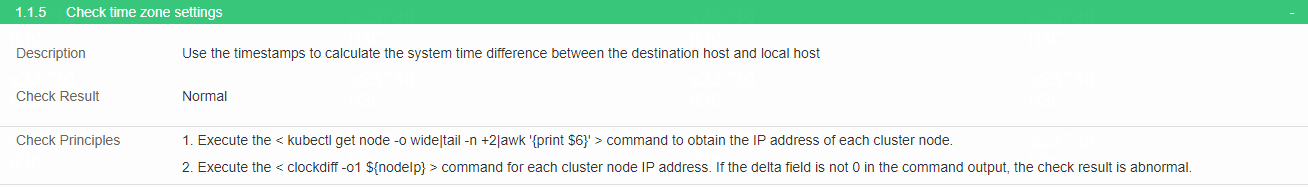
Check the time zone settings
· Check item
Time zone settings on each node
· Targets
Time zone settings on each node.
· Pass criteria
Use the timestamps to calculate the system time difference between the destination host and local host. If the time difference is not 0, the check result is abnormal. No items are marked in red in the table, indicating that nodes share the same time.
· Example
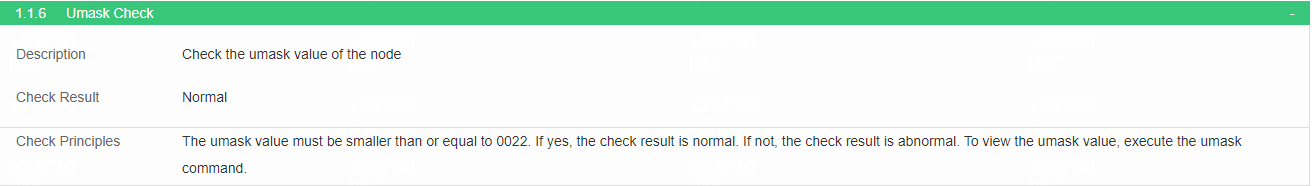
Check the umask value
· Check item
Umask value of each node
· Targets
Umask value of each node.
· Pass criteria
No items are marked in red in the table, indicating that the umask value of each node is smaller than or equal to 0022.
· Example
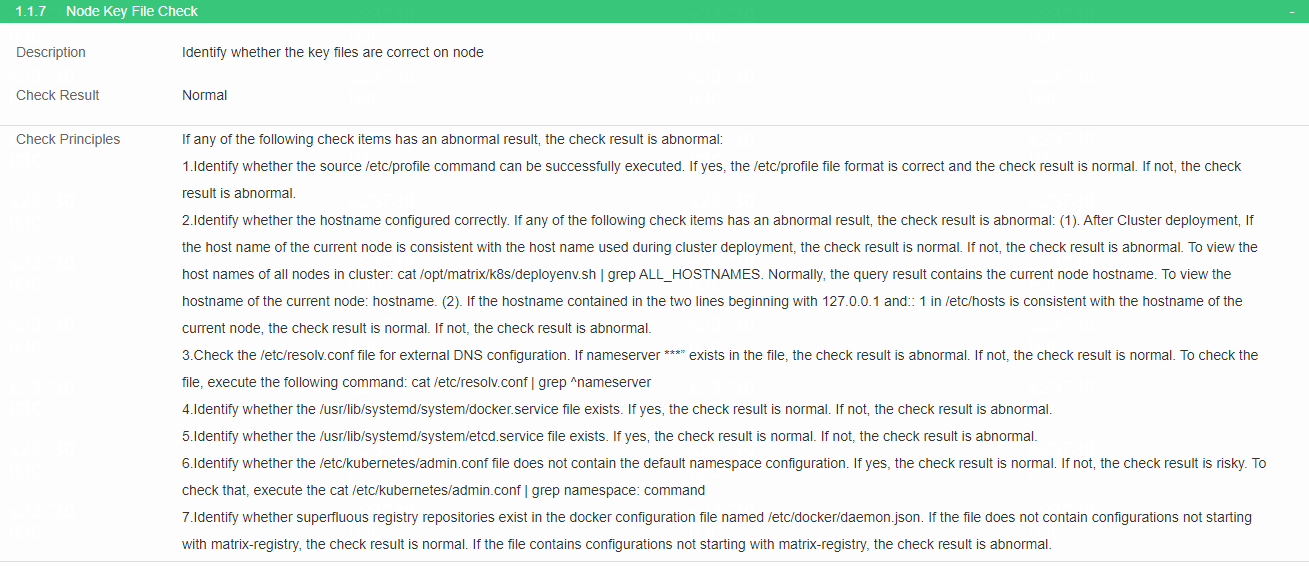
Check the key files of each node
· Check item
Key files of each node
· Targets
Key files of each node and their configurations.
· Pass criteria
No items are marked in red in the table, indicating that the key files of each node and their configurations are correct.
· Example
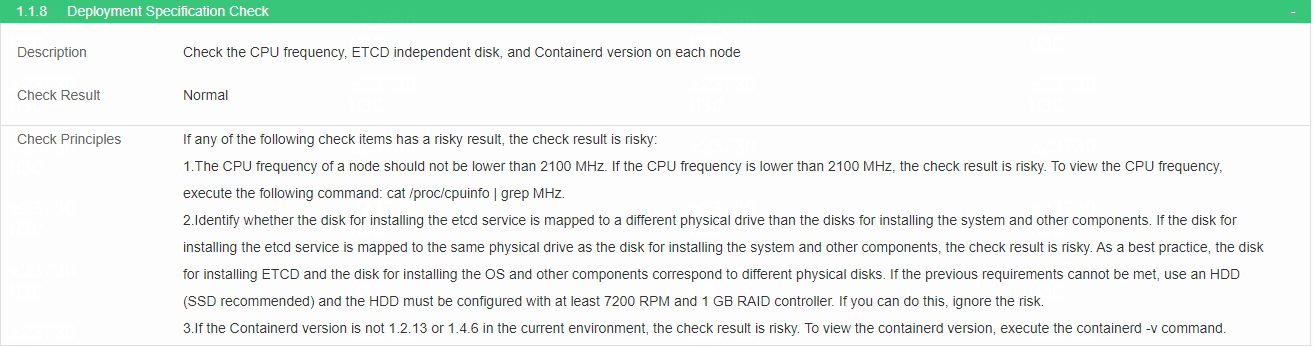
Check deployment specification
· Check item
CPU frequency, ETCD independent disk, and Container version on each node
· Targets
CPU frequency, ETCD independent disk, and Container version on each node.
· Pass criteria
No items are marked in red in the table, indicating that CPU frequency, ETCD independent disk, and Container version meet the requirements. If a non-independent ETCD disk is used, the physical disk must be at least an HDD (SSD is preferable) which is configured with at least 7200 RPM and 1 GB RAID controller.
· Example
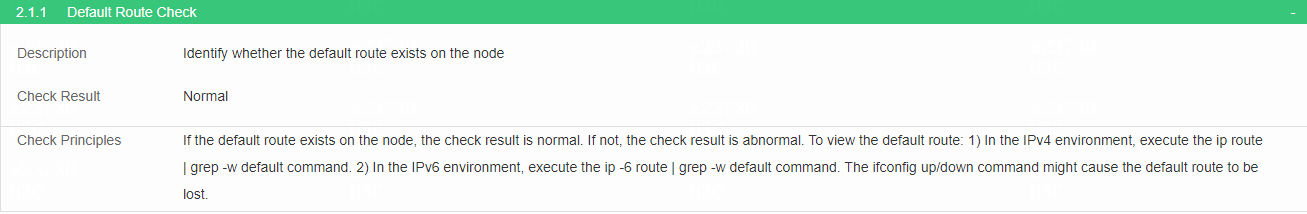
Check the default route
· Check item
Default route on the node
· Targets
Default route on the node.
· Pass criteria
The default route exists on the node.
· Example
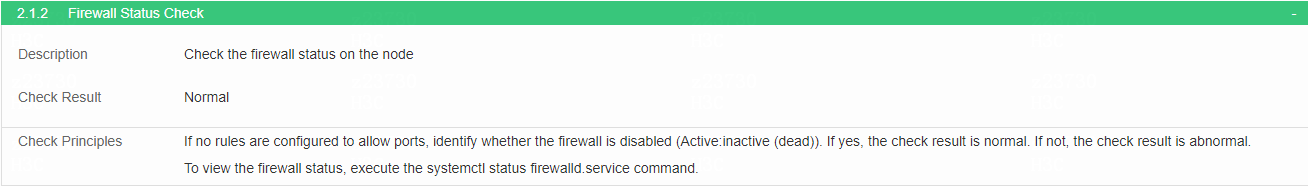
Check the firewall status
· Check item
Firewall status on the node
· Targets
Firewall status on the node.
· Pass criteria
If no rules are configured to allow ports, the firewall is disabled. If the firewall is disabled, it is normal.
· Example
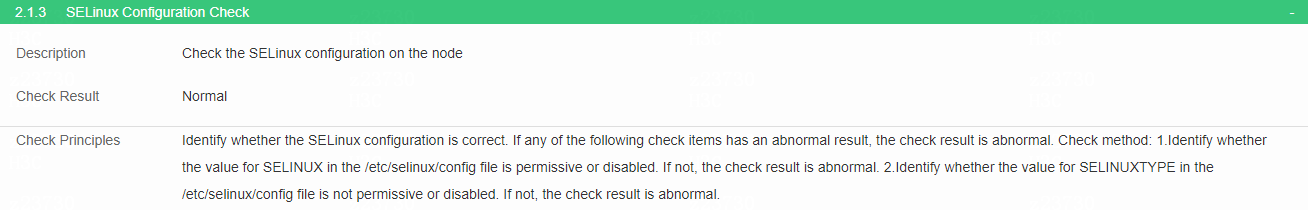
Check SELinux configuration
· Check item
SELinux configuration on the node
· Targets
/etc/selinux/config file.
· Pass criteria
The value for SELINUX in the /etc/selinux/config file is permissive or disabled.
· Example
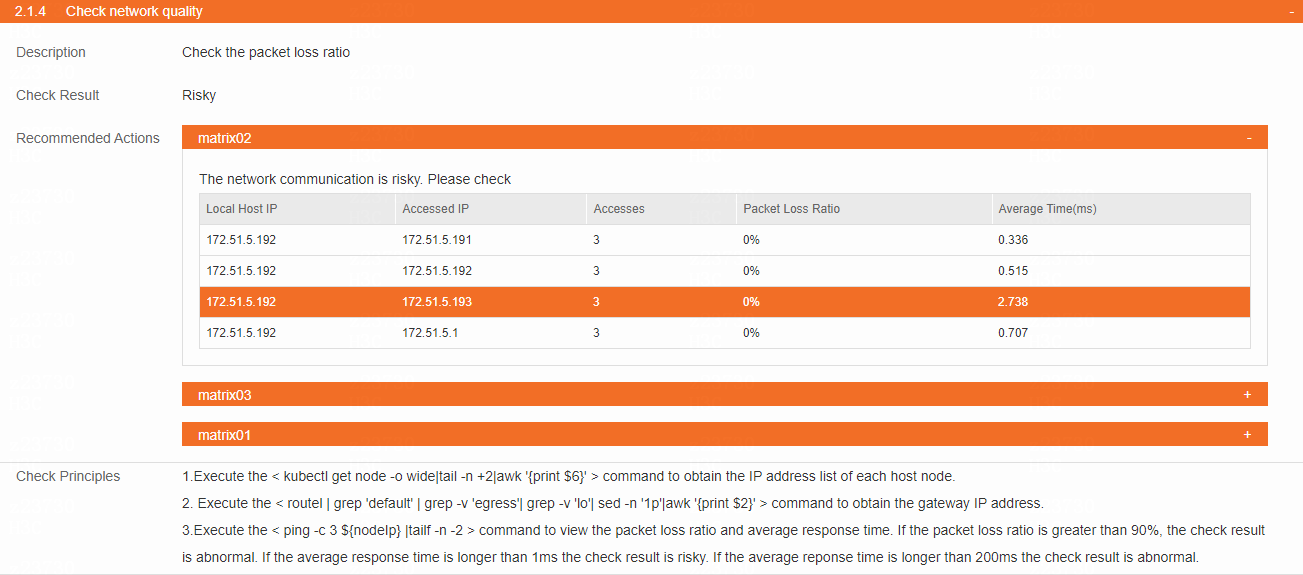
Check network quality
· Check item
Network quality on the node
· Targets
Packet loss ratio and average response time of each node.
· Pass criteria
The packet loss ratio is smaller than 90% and the average response time is smaller than 1 ms. If the packet loss ratio is higher than 90%, the check result is abnormal. If the average response time is longer than 1 ms, the check result is risky. If the average response time is longer than 200 ms, the check result is abnormal.
· Example
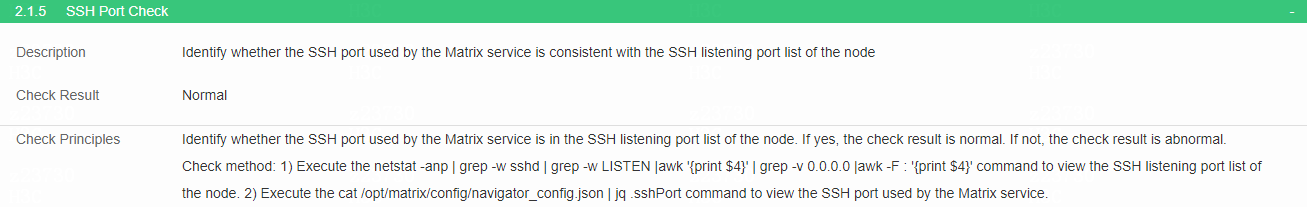
Check SSH port
· Check item
Whether the SSH port used by the Matrix service is in the SSH listening port list of the node
· Targets
Whether the SSH port used by the Matrix service is in the SSH listening port list of the node.
· Pass criteria
The SSH port used by the Matrix service is in the SSH listening port list of the node.
· Example
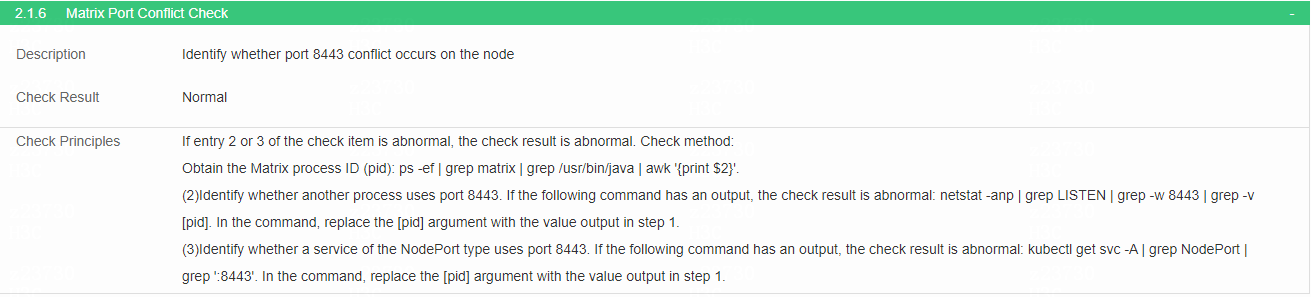
Check Matrix port conflict
· Check item
Port 8443 conflict on the node
· Targets
Port 8443 conflict on the node.
· Pass criteria
No other processes or NodePort services use port 8443.
· Example
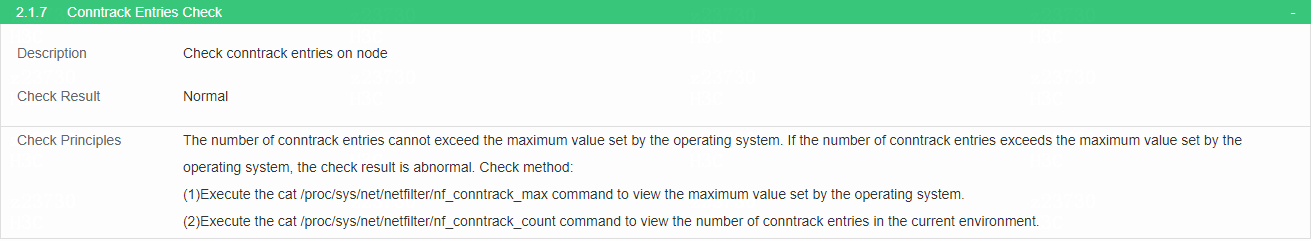
Check conntrack entries
· Check item
Conntrack entries on the node
· Targets
Conntrack entries on the node.
· Pass criteria
The number of conntrack entries does not exceed the maximum value set by the operating system.
· Example
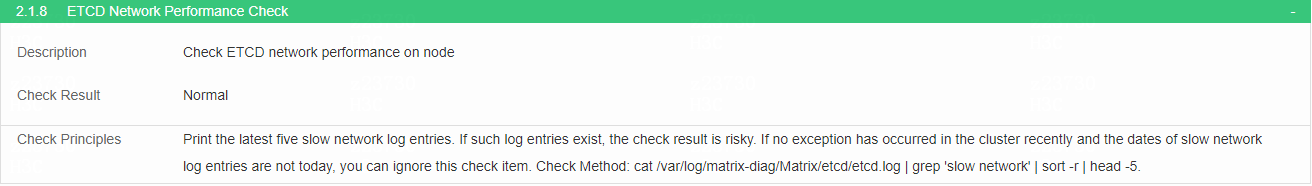
Check ETCD network performance
· Check item
ETCD network performance on the node
· Targets
ETCD network performance on the node.
· Pass criteria
Check whether slow network log is printed in inetcd.log. If yes, the check result is risky. If no exception has occurred in the cluster recently and the dates of logs are not today, you can ignore this check item. If network delay exists, resolve the system network issue first.
· Example
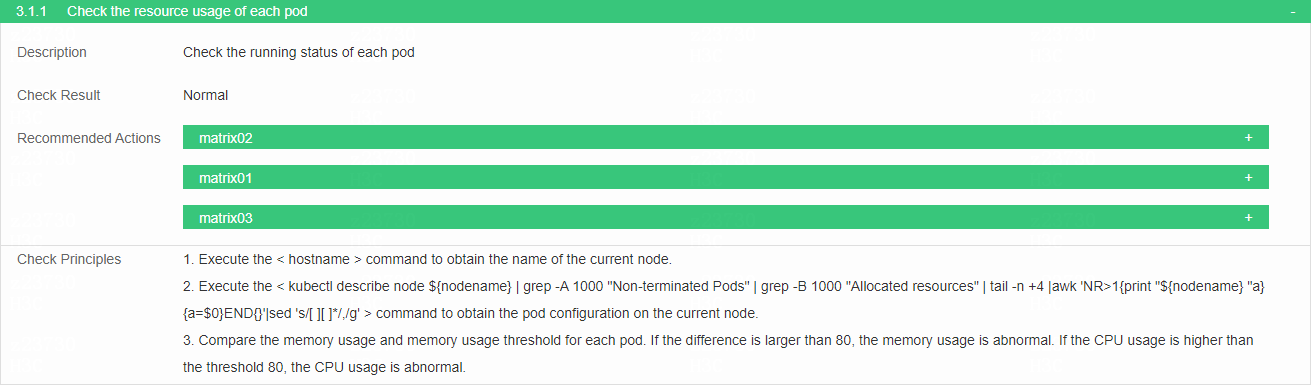
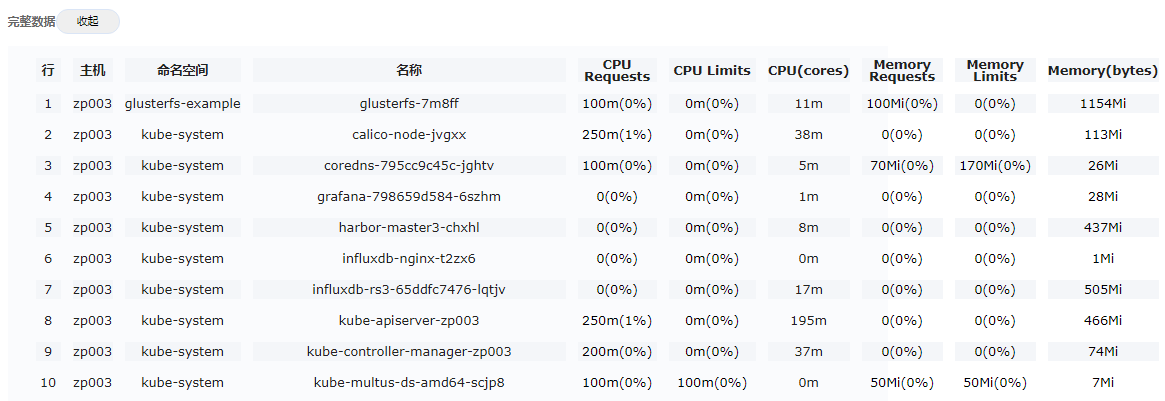
Check the pod resources
· Check item
Running status and resource usage of each pod
· Targets
Pod configuration on the node, CPU and memory usage.
· Pass criteria
No items are marked in red in the table. Compare the memory usage and CPU usage with the threshold for each pod. If the difference is larger than 80, the relevant items are marked in red in the table.
· Example
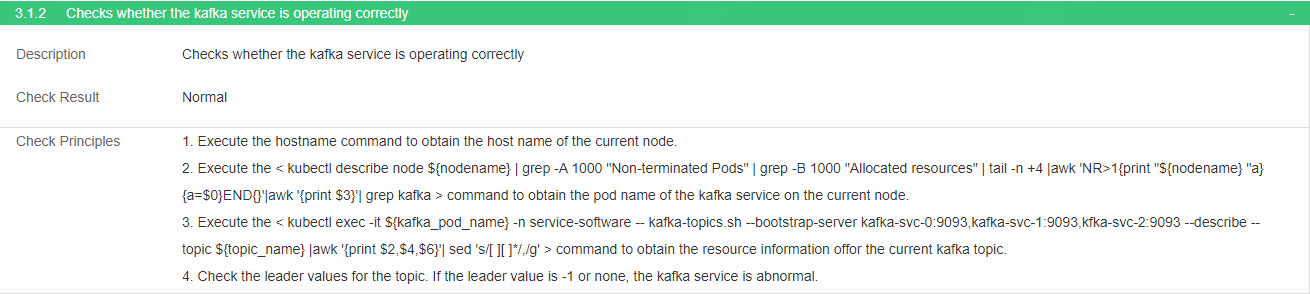
Check kafka service
· Check item
Functionality of kafka service
· Targets
Leader values for the topic.
· Pass criteria
No items are marked in red in the table. If the leader value is -1 or none, the kafka service is abnormal and is marked in red in the table.
· Example
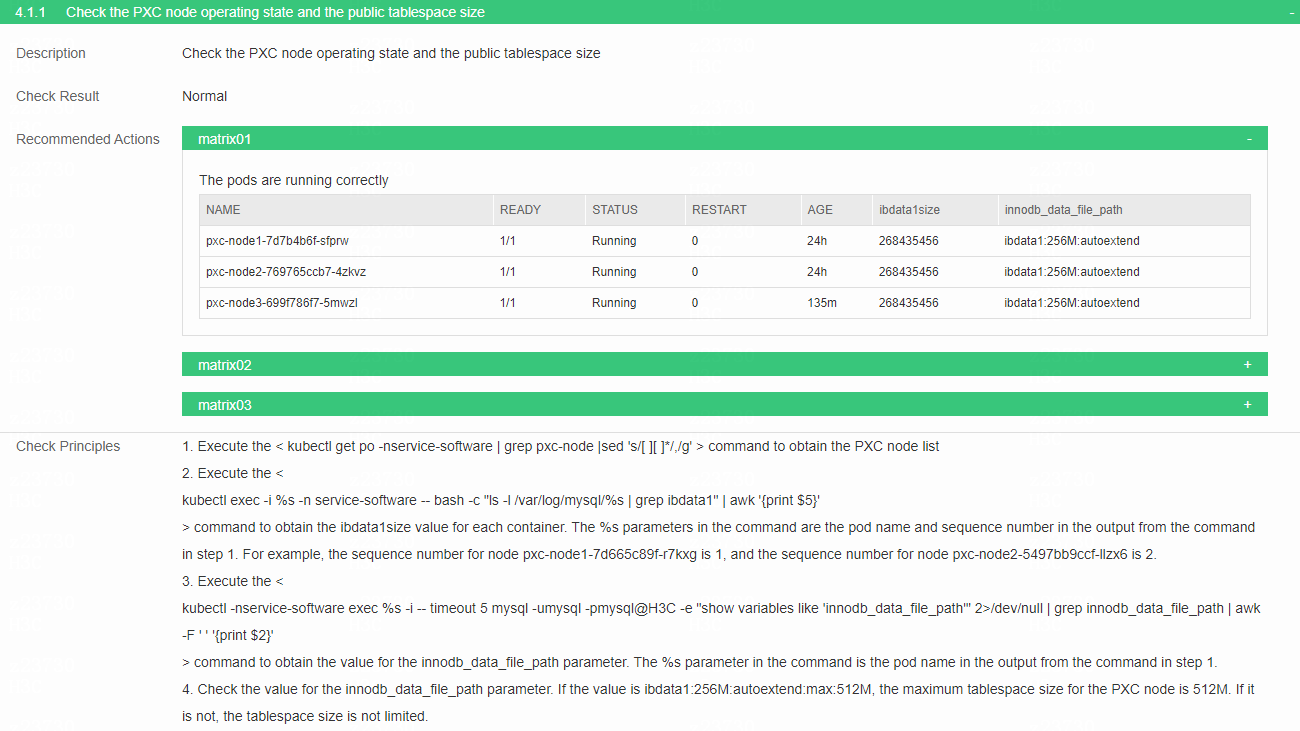
Check the running state of the PXC node and public tablespace size
· Check item
Running state of the PXC node and public tablespace size
· Targets
Running state of the PXC node, public tablespace size, value for innodb_data_file_path parameter and pxc-pod state.
· Pass criteria
No items are marked in red in the table. Check the value for innodb_data_file_path parameter, judge whether the public tablespace size for pxc-node is limited and check the state of pxc-pod. If the state is Running, the check result is normal.
· Example
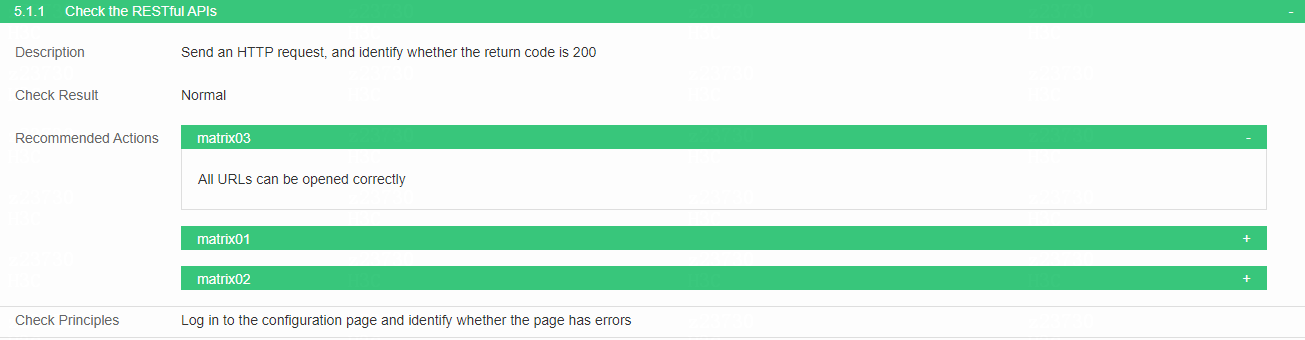
Check the RESTful APIs
· Check item
Whether the return code is 200 when an HTTP request is sent.
· Targets
Whether the return code is 200 when an HTTP request is sent.
· Pass criteria
All URLs can be opened correctly.
· Example
Auto inspection script check for versions E0706L01 and E06
Versions prior to E0706L01 and E06 do not have the one-click check feature, so follow the steps below to perform the check if required.
Install the inspection script
Steps:
1. Obtain the inspection script file check.zip.

2. Upload the file to masterNode1, such as the /root/check directory.
3. Execute the cd /root/check/ command to enter the directory.
4. Execute the unzip check.zip command to decompress the check.zip.
5. Modify the fields in the file job_metrics\conf\config.ini according to the actual environment, including the transport protocol, virtual IP address of northbound service, Web account and password.
As shown in the above figure, parameters to be modified and their descriptions include:
[k_conf_center_rs]
http_url = http:// /*generally no modification required*/
rest_url = 172.31.201.132 /*replace with the actual northbound service VIP address*/
rest_port = 32001 /*generally no modification required*/
api_url = /confcenter /*no modification required*/
username = admin /*generally no modification required*/
password = iMC123 /*generally no modification required*/
http_method = GET /*no modification required*/
[login]
http_url = http:// /*set to http or https according to the northbound transport protocol*/
rest_url = 172.31.201.132 /*replace with the actual northbound service VIP address*/
rest_port = 30000 /*set to the port number for login to Unified Platform*/
api_url = /central/index.html /*no modification required*/
username = admin /*username for login to Unified Platform*/
password = Pwd@12345 /*password for login to Unified Platform*/
6. Repeat the above steps on masterNode2 and masterNode3 (not required for a standalone deployment environment).
7. Give permissions (chmod 777 ./* ) to files in the decompression directory and subdirectories of this directory (job_metrics/shell, job_metrics/module) for three nodes.
8. In the decompression directory of masterNode1, switch to the root user and execute the python master_install.py command.
9. In the decompression directory of masterNode2 and masterNode3, switch to the root user and execute the python node_install.py command (not required for a standalone deployment environment).
Restrictions and guidelines:
· Execute the script as a root user.
· The email function is disabled in config.ini.
· The Rest interface inspection function is disabled in config.ini. This option may cause a false alarm when it is enabled.
· The busyness threshold for iostat in config.ini defaults to 80 and can be modified based on actual needs and customer requirements.
· The alarm triggering thresholds for CPU usage, memory usage, disk usage, and network connectivity can be modified in the config.ini file according to the site conditions or customer requirements. They can also be set based on default values of Matrix, that is, the CPU usage, memory usage and disk usage in the cluster do not exceed 80%.
· For the step 8, the scripts will still be executed on masterNode1 for subsequent manual operations.
· The above steps 1-9 need to be set only when you perform the inspection for the first time. When you do this later, these steps can be skipped.
· To view the command line output, you can go to /root/check/UCcheck/job_linux/data/ to view disk, iostat, and ping data for each node during routine inspection.
Execute the inspection script by one click and generate an inspection report
· Check item
Platform information
· Targets
Targets specified in the script.
· Example
In the job_metrics/module directory of masterNode1 configured during the first routine inspection (even if the current master node is no longer masterNode1), execute the python main.py command to perform inspections.
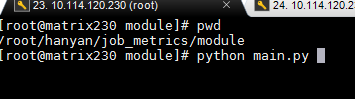
When executing the script, many ERROR items will be generated, which can just be ignored. Please refer to the inspection report.
After the script is executed, an inspection report in HTML will be generated in the job_metrics/final directory. Download it to your PC and open it with the Chrome browser.
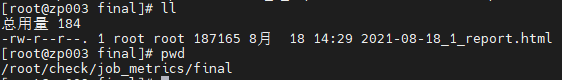

The latest inspection script allows the use of scheduled task function. Specifically, the inspection script automatically runs at 0 o'clock and 12 o'clock every day, generating an inspection report in the job_metrics/final directory. You can directly download and view the report.
To check existing scheduled tasks:
Master node:
![]()
Slave node:
![]()
The above results indicate that the scheduled task is normal.
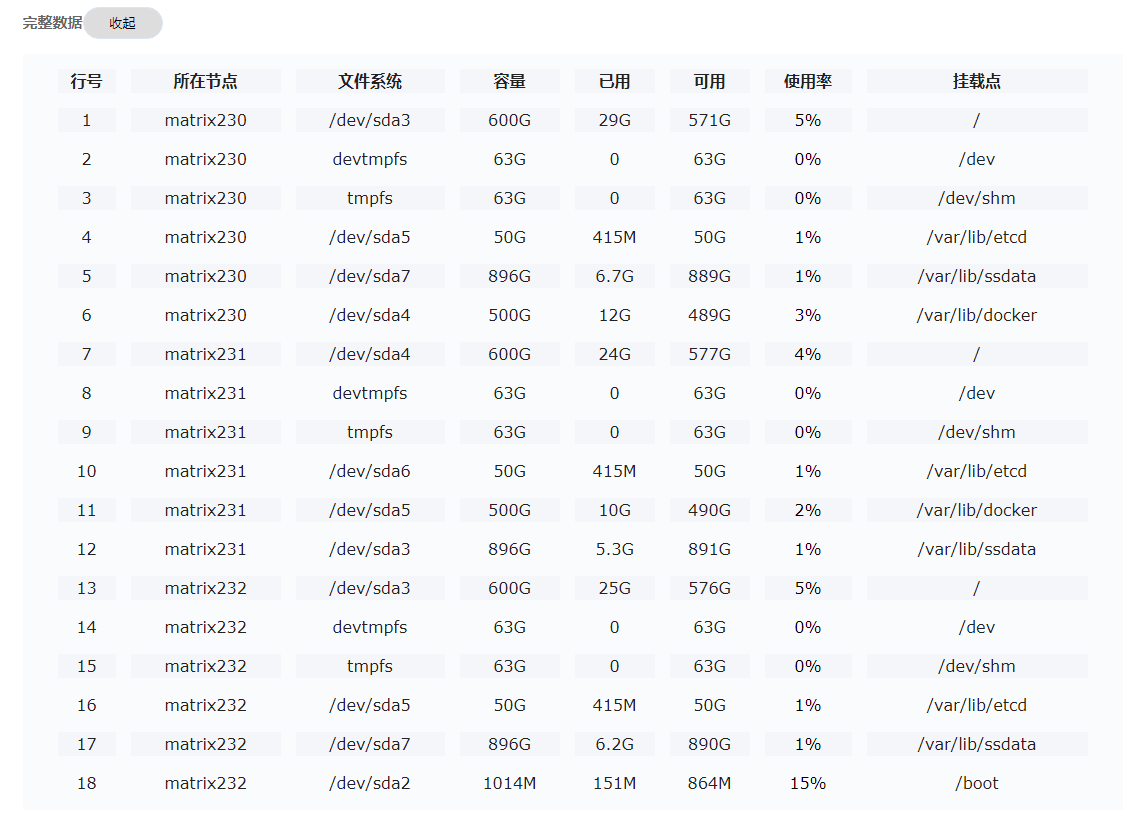
Check the space usage in the installation directory
· Check item
Disk usage on each node of a Linux host
· Targets
Disk usage on a node.
· Pass criteria
No items are marked in red in the table (The storage space does not exceed 80%. The daily growth of the directory size does not exceed 10% of total space of the current disk).
· Example
Check whether the directory size exceeds 80%. If yes, clear unnecessary content in time to free the storage space. When the daily growth of the directory size exceeds 10% of total space of the current disk, mark the item as a risk and locate the cause.
Check the device busyness
· Check item
Busyness of each device on each node of a Linux host
· Targets
Busyness of disks and devices on a node.
· Pass criteria
No items are marked in red in the table.
Check the time zone settings
· Check item
Time of each node of a Linux host
· Targets
Time of each node.
· Pass criteria
The time difference in the table is 0.
Check the pod running state
· Check item
Pods that are not in Running or Completed status
· Targets
Pod running state.
· Pass criteria
No data in the table.
Check the running load of each cluster node
· Check item
CPU usage or memory usage of the nodes (threshold at 80%)
· Targets
CPU usage and memory usage of the nodes.
· Pass criteria
No items are marked in red in the table, indicating that neither CPU usage nor memory usage exceeds 80%. The data is obtained from kubectl top node. These results are for reference only. See Cluster resources.
· Example
Check the running state of the PXC node and public table space
· Check item
The running state of the PXC pod and public table space
· Targets
Pod state and table space.
· Pass criteria
The summary shows that the operation is normal and there are no red items.
· Example
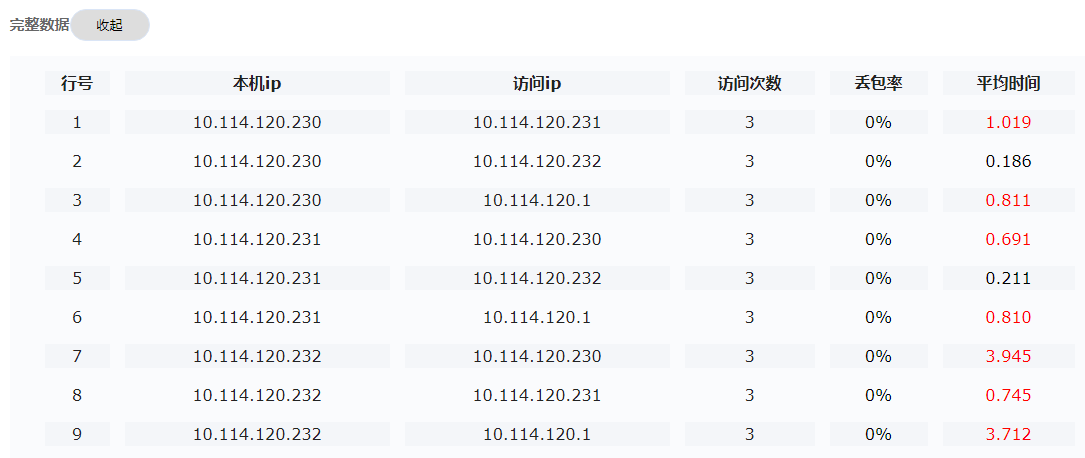
Check the network quality
· Check item
Quality of the network among the nodes of the cluster and the gateways
· Targets
Quality of the network among the nodes and the gateways.
· Pass criteria
No items are marked in red in the table. The packet loss ratio is 0%, and the average response time is shorter than 200 ms.
You can ignore a slightly longer response time if system operations are not affected.
· Example
Check the pod resources
· Check item
Usage of pod resources
· Targets
Usage of pod resources.
· Pass criteria
There are no errors in the summary or red items in the table.
· Example
Inspection reports
Table 1 Service inspection report
|
Targets |
Instruction |
Result |
Remarks |
|
Access to Unified Platform |
Access Unified Platform from a browser to verify that the system can load the dashboard within 10 seconds after login. |
□ Normal □ Abnormal |
|
|
Web page response |
Access the alarm management page and monitoring list page to verify that the system can load the pages within 5 seconds. |
□ Normal □ Abnormal |
|
|
Data collection |
Select Monitor > Monitor List > Network Monitors, and then click the device label of a monitor-enabled device. On the network device detail page that opens, view the monitoring details. Verify that the system collects data at the default interval 5 minutes. |
□ Normal □ Abnormal |
|
|
Alarming |
Select Monitor > Alarm > Active Alarms, and view alarm information. Verify that the system can generate alarms and display the alarms by alarm level. |
□ Normal □ Abnormal |
|
Table 2 Running environment inspection report
|
Targets |
Instruction |
Result |
Remarks |
|
Size of the database backup directory and backup time |
The database backup is performed at 0 o'clock every day. Check the size of the database backup directory. The database backup directory does not exceed 50 GB. Verify that the last database backup is performed as scheduled. |
□ Normal □ Abnormal |
|
|
Time zone and system time |
Execute the date command on each node in the background to check the time zone and system time. |
□ Normal □ Abnormal |
|
|
Cluster state |
Log in at https://virtual IP address of northbound service:8443/matrix/ui using the username and password admin/Pwd@12345. Select Deploy > Clusters > Deploy Cluster to verify that the nodes are normal. |
□ Normal □ Abnormal |
|
|
Cluster resources |
Log in at https://virtual IP address of northbound service:8443/matrix/ui using the username and password admin/Pwd@12345. Open the dashboard to view resource usage of different nodes. Verify that the CPU usage and memory usage of the cluster resources do not exceed 70%. |
□ Normal □ Abnormal |
|
Table 3 Information inspection report
|
Targets |
Instruction |
Result |
Remarks |
|
License and registration |
Log in to Unified Platform, and select System > License Management > License Information to view license information. In normal cases, the software of Unified Platform is licensed and nodes are registered. |
□ Normal □ Abnormal |
|
|
Pod running state |
Execute the kubectl get pods -o wide -A | sort -nr -k5 command to check the running state and reboot count of each pod. Mark the pods that have rebooted more than 10 times as risks, and list the top 10 pods by reboot count. |
□ Normal □ Abnormal |
|
|
PXC database service |
In cluster deployment environment: For pods of three PXC nodes, READY state is 1/1, and STATUS state is Running. In standalone deployment environment: For pods of one PXC node, READY state is 1/1, and STATUS state is Running. |
□ Normal □ Abnormal |
|
Table 4 License server inspection report
|
Targets |
Instruction |
Result |
Remarks |
|
License server network quality |
When one cluster node pings the license server 50 times, in normal cases, the packet loss ratio is 0%, and the average response time is shorter than 0.25 ms. |
□ Normal □ Abnormal |
|
|
License server state |
If the license server version is E1204, log in to the license server through https://licenseserverIP:port number/licsmgr; If the license server version is E1153 or E1151, log in to the license server through https://licenseserverIP:port number/licsmanager to verify that the license server runs correctly. |
□ Normal □ Abnormal |
|
|
License server HA state |
Log in to the Web page and click HA on the left. If HA is disabled, then the page displays Configure HA. If HA is enabled, then the page displays HA Configuration and HA status is normal. |
□ Normal □ Abnormal |
|
|
Client state of license server |
If the license server version is E1204, log in to the license server through https://licenseserverIP:port number/licsmgr; and if the license server version is E1153 or E1151, log in to the license server through https://licenseserverIP:port number/licsmanager and select Licenses > Client Connections to check the connection state of the client and the license state. |
□ Normal □ Abnormal |
|
Table 5 Container platform inspection report
|
Targets |
Instruction |
Result |
Remarks |
|
Execute the one-click check script to view results |
Execute the env_check.sh command to view results. In normal cases, results of all check items are Pass (Items highlighted in yellow must be checked). |
□ Normal □ Abnormal |
|
|
Node/pod/Kubelet/Etcd state |
Normally, the node state is Ready, the pod state is Running, and the Kubelet/Etcd state is Active (Running). |
□ Normal □ Abnormal |
|
|
Network transmission between node IP and virtual IP |
The node IP and the virtual IP in the cluster can ping each other. |
□ Normal □ Abnormal |
|
|
/opt/matrix/app/install/packages directory |
Execute the ll command to view the files in this directory. Normally, there are only installed component packages. |
□ Normal □ Abnormal |
|
|
Grafana and jobservice file and directory permissions |
Execute the ll command to view the permissions of grafana and jobservice directories on each node. In normal cases, the permission for grafana directory is 472, while the permission for jobservice directory is 10000. |
□ Normal □ Abnormal |
|
Table 6 Inspection report for automatic inspection script
|
Targets |
Instruction |
Result |
Remarks |
|
Space usage in the installation directory |
Execute the inspection script by one click, generate an inspection report and view the report. |
□ Normal □ Abnormal |
|
|
Device busyness |
View the inspection report |
□ Normal □ Abnormal |
|
|
Time zone |
View the inspection report |
□ Normal □ Abnormal |
|
|
Pod running state |
View the inspection report |
□ Normal □ Abnormal |
|
|
Running load of each cluster host node |
View the inspection report |
□ Normal □ Abnormal |
|
|
Running state of the PXC node and public tablespace size |
View the inspection report |
□ Normal □ Abnormal |
|
|
Network quality |
View the inspection report |
□ Normal □ Abnormal |
|
|
Pod resources |
View the inspection report |
□ Normal □ Abnormal |
|
Table 7 One-click check report
|
Targets |
Instruction |
Result |
Remarks |
|
Running load of each cluster host node |
Perform the one-click check and view the report in the historical records |
□ Normal □ Abnormal |
|
|
Check the installation path space |
View the inspection report |
□ Normal □ Abnormal |
|
|
Device busyness |
View the inspection report |
□ Normal □ Abnormal |
|
|
Clock health check |
View the inspection report |
□ Normal □ Abnormal |
|
|
Time zone settings |
View the inspection report |
□ Normal □ Abnormal |
|
|
Umask |
View the inspection report |
□ Normal □ Abnormal |
|
|
Key files of each node |
View the inspection report |
□ Normal □ Abnormal |
|
|
Deployment specification |
View the inspection report |
□ Normal □ Abnormal |
|
|
Default route |
View the inspection report |
□ Normal □ Abnormal |
|
|
Firewall state |
View the inspection report |
□ Normal □ Abnormal |
|
|
SELinux configuration |
View the inspection report |
□ Normal □ Abnormal |
|
|
Network quality |
View the inspection report |
□ Normal □ Abnormal |
|
|
SSH port |
View the inspection report |
□ Normal □ Abnormal |
|
|
Matrix port conflict |
View the inspection report |
□ Normal □ Abnormal |
|
|
Conntrack entries |
View the inspection report |
□ Normal □ Abnormal |
|
|
ETCD network performance |
View the inspection report |
□ Normal □ Abnormal |
|
|
Pod resources |
View the inspection report |
□ Normal □ Abnormal |
|
|
Running state of the PXC node and public tablespace size |
View the inspection report |
□ Normal □ Abnormal |
|
|
Rest interface |
View the inspection report |
□ Normal □ Abnormal |
|
Troubleshooting
High memory usage for Kafka pod
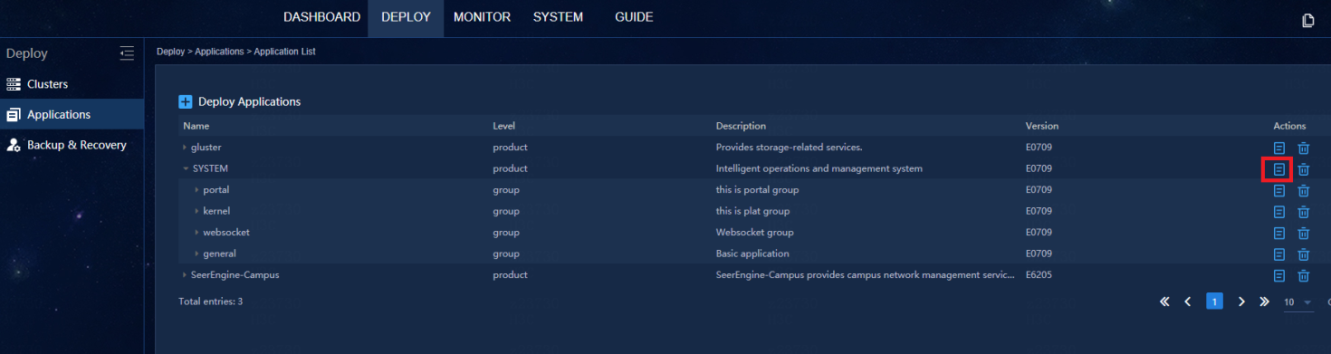
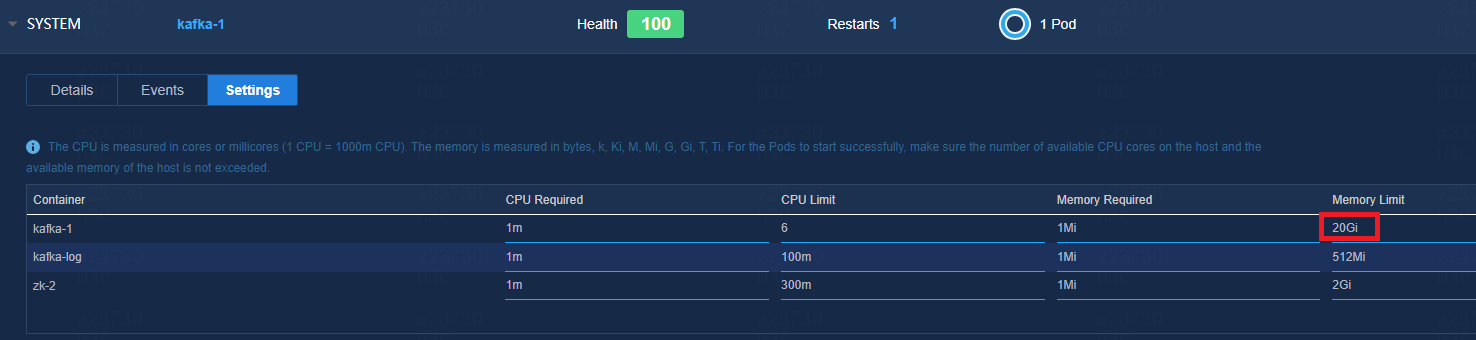
As for the inspection results described in Check the pod resources, modify the memory limit if the memory usage of Kafka pod exceeds 80%. It is advised to modify this limit to 8 GB (not required for E0613H05 and later versions because the Kafka memory has been changed to 20 GB). In cluster deployment environment, you need to modify this limit on three nodes separately. After you have modified one node, verify that the pod state is Running before you move to the next node.
The steps are as follows: Log in at https://northbound IP address:8443/matrix/ui to access the Matrix page (Deploy > Applications > Application List).
High memory usage for Elasticsearch pod
As for the inspection results described in Check the pod resources, if the memory usage of Elasticsearch pod exceeds 80%, please follow the Technical Bulletin on Handling of ES Memory of Unified Platform to resolve the issue.
High memory usage for Syslog pod
As for the inspection results described in Check the pod resources, if the itoa-log-receive-lpvwd container usage of the Syslog component exceeds 80%, only the Syslog function will be affected. In this case, you can upgrade the Syslog from version 5.1.15 to version 5.1.18 (corresponding to Unified Platform E0613) or above. (The version file is contained in the version package of Unified Platform).
Routine inspection guide for SeerEngine-Campus
Inspection methods
One-click check
The controller supports one-click check. Users can manually start one-click check or as scheduled to check the running status of the controller.
E6205 and later versions support one-click check that is compatible with Unified Platform. Users need to install general_PLAT_oneclickcheck_2.0_<version>.zip while deploying Unified Platform. After installation is completed, log in to Unified Platform and select System > System Maintenance > Health Check to perform a heath check. For versions prior to E6205, users need to select System > System Maintenance > Campus Controller and click Data Check in the upper right corner to access one-click check page.
The health check includes manual check, periodic check, check settings and history records. The health check service in an integrated deployment scenario is slightly different from the "data check" function of the versions before E6205 in terms of names or positions of some fields. Specifically, the previous System under Check Result Summary of Data Check is included in Unified Platform. The check result is now accessed by selecting System > Check Result Summary > Health Check. Below the functions under Health Check will be described:
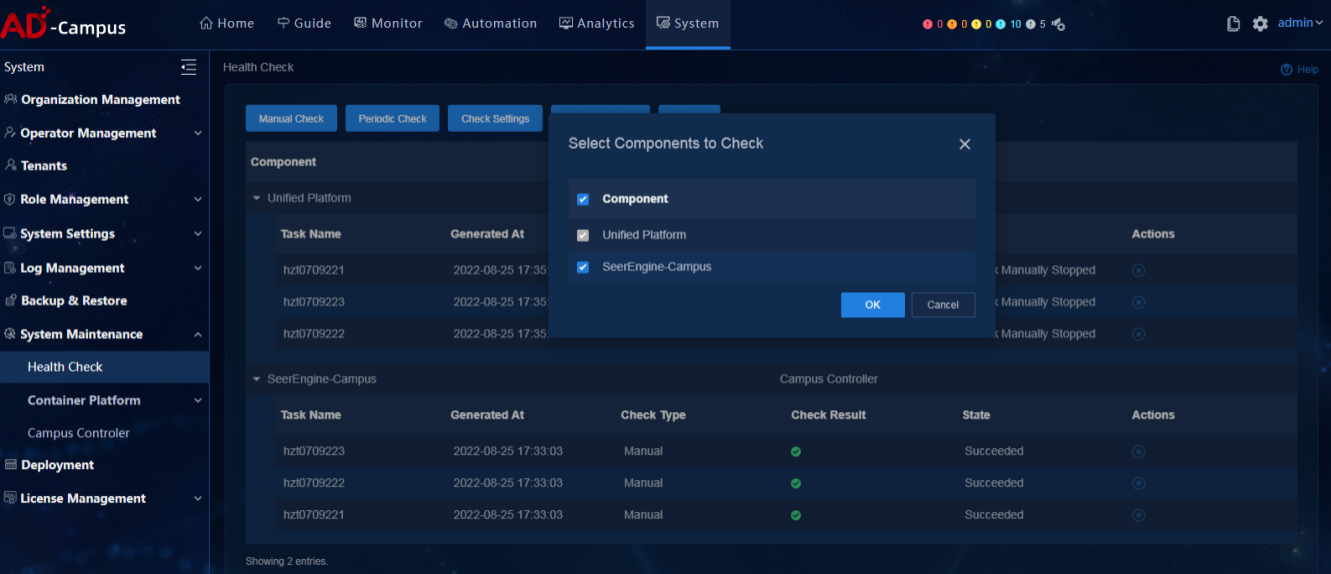
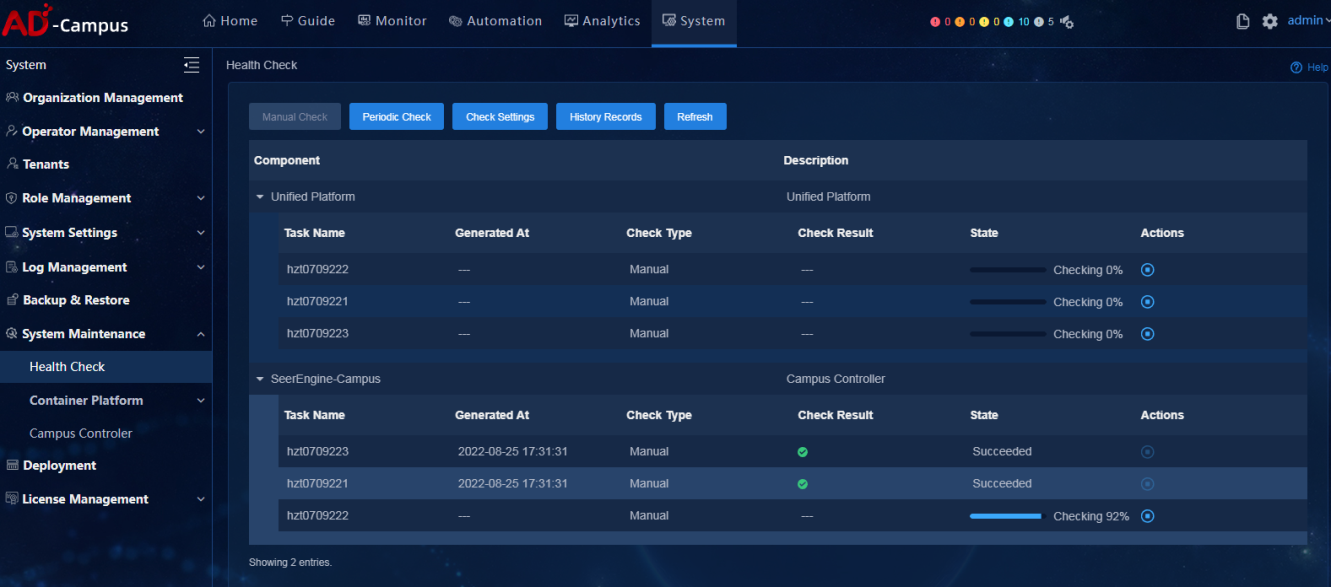
Select Manual Check and a component selection box opens. Unified Platform is selected by default and cannot be deselected. Users can select the installed component SeerEngine-Campus at the same time. Click OK to start the health check. The checking progress and check result of components can be viewed on the page.
Click Periodic Check. On the page that opens, click Add Periodic Task and a task configuration box opens. Unified Platform is selected by default and cannot be deselected. The installed component SeerEngine-Campus is also selected. Enable Schedule Settings, and set frequency and time. Users cannot assign tasks to components that have been assigned tasks. Periodic Task Details displays the periodic check result and inspection reports.
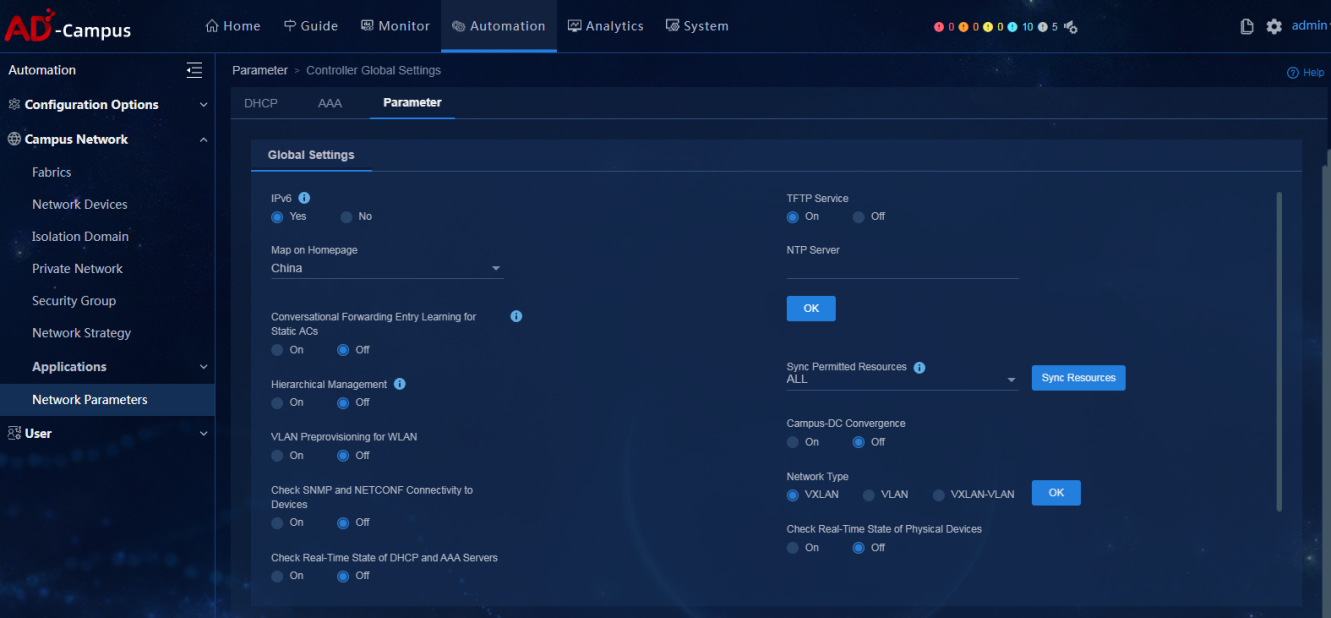
Click Check Settings to access the health check page. You can view or modify the timeout time configuration of installed components. The timeout time can last from 30 minutes to 360 minutes. When the check time exceeds the scheduled timeout time, the system automatically marks the check as failed. When one of Check SNMP and NETCONF Connectivity to Devices, Check Real-Time State of DHCP and AAA Servers, and Check Real-Time State of Physical Devices is enabled under Automation > Network Parameters > Parameter of SeerEngine-Campus, the default timeout period of this component is 360 minutes. If the three switches are disabled at the same time, the default timeout period of this component is 30 minutes. If the three switches are disabled but the data volume is large, the check process may take longer. In this case, it is recommended to increase the timeout time.
Click History Records to view check records and inspection reports.
The Check Result Report displays the basic information of the inspection in the upper part, and displays the executed check items, check result summary and check result details in the lower part. The check result summary contains the check items and check result of each component. If you click any of the check items, you will go to the corresponding check result details where check result and check principles are contained.
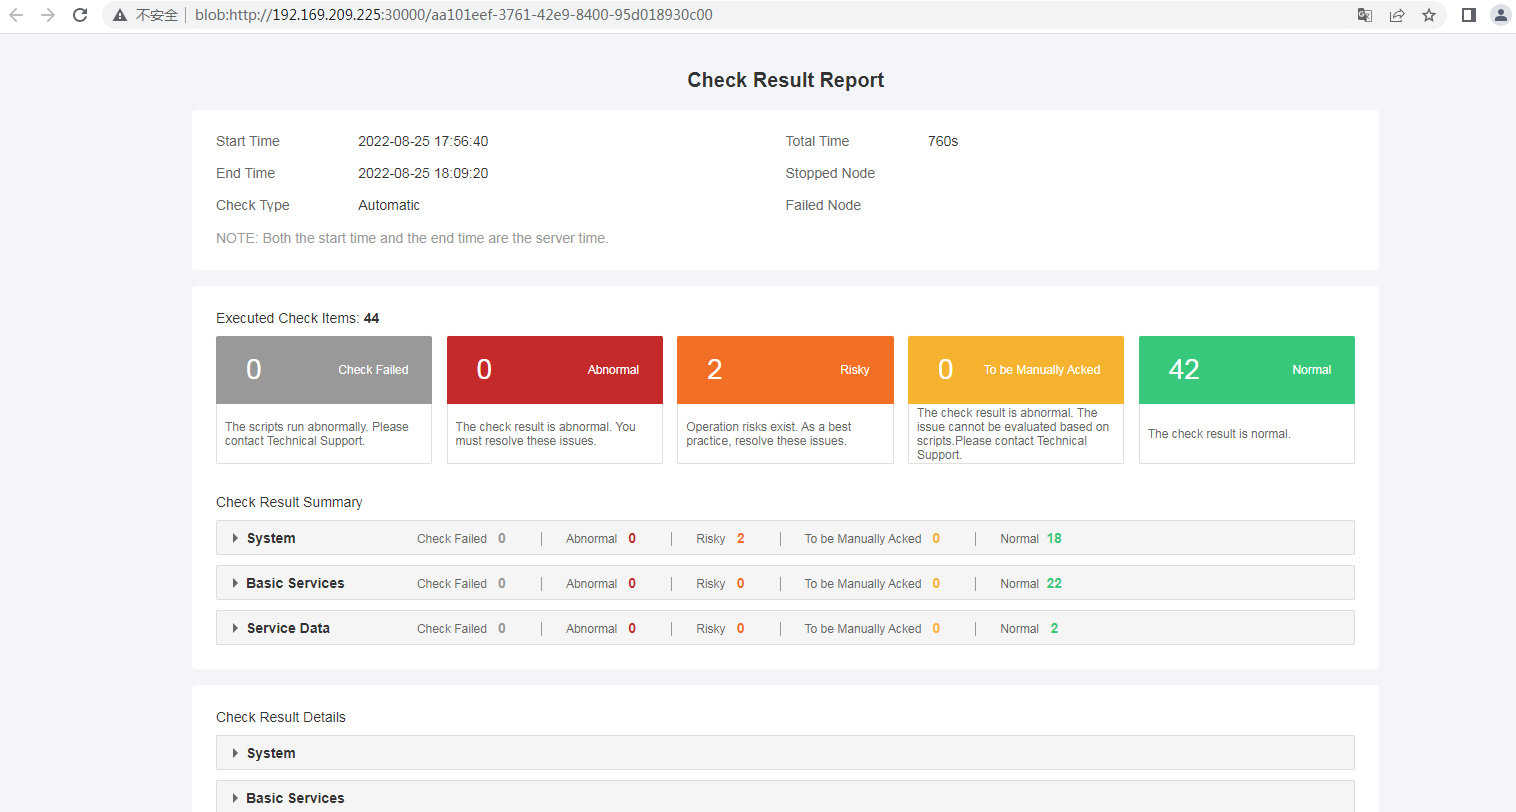
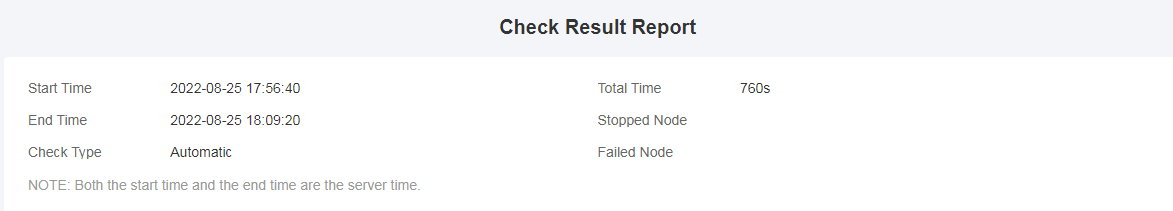
Basic information of the inspection
It contains the start time, end time, total time, check type, and node information.
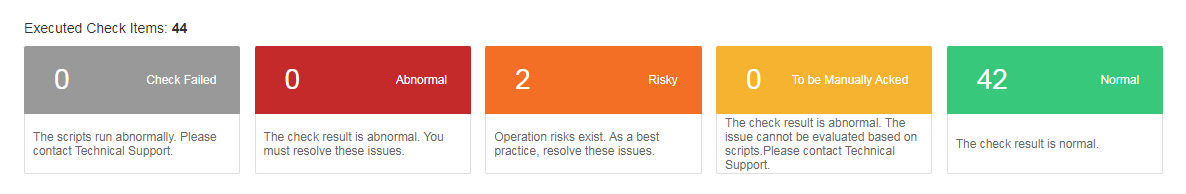
Executed check items
It contains the number of executed check items and check result. The check result can be Check Failed, Abnormal, Risky, To be Manually Acked, and Normal. Check Failed indicates that the check failed, and does not indicate that the check item is abnormal. Abnormal indicates that the check item is abnormal and unserviceable. Risky indicates that operation risks exist. To be Manually Acked indicates that it is impossible to evaluate the issue based on scripts and technical support is required.
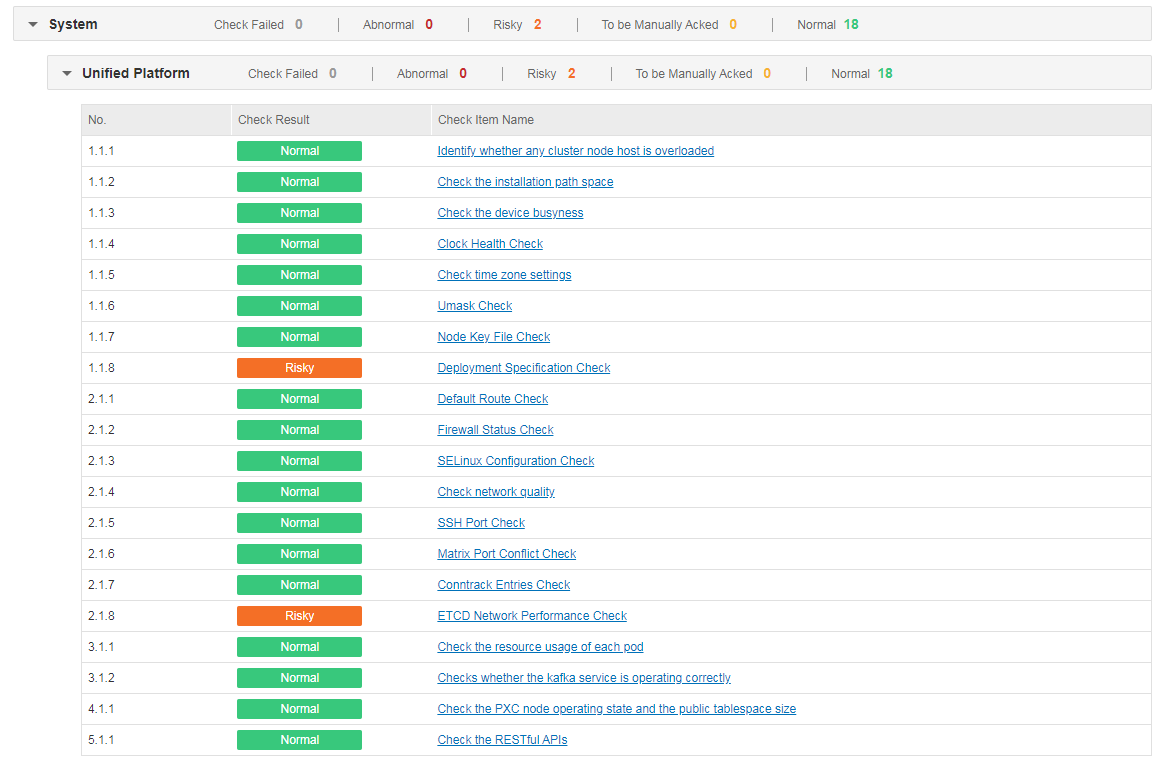
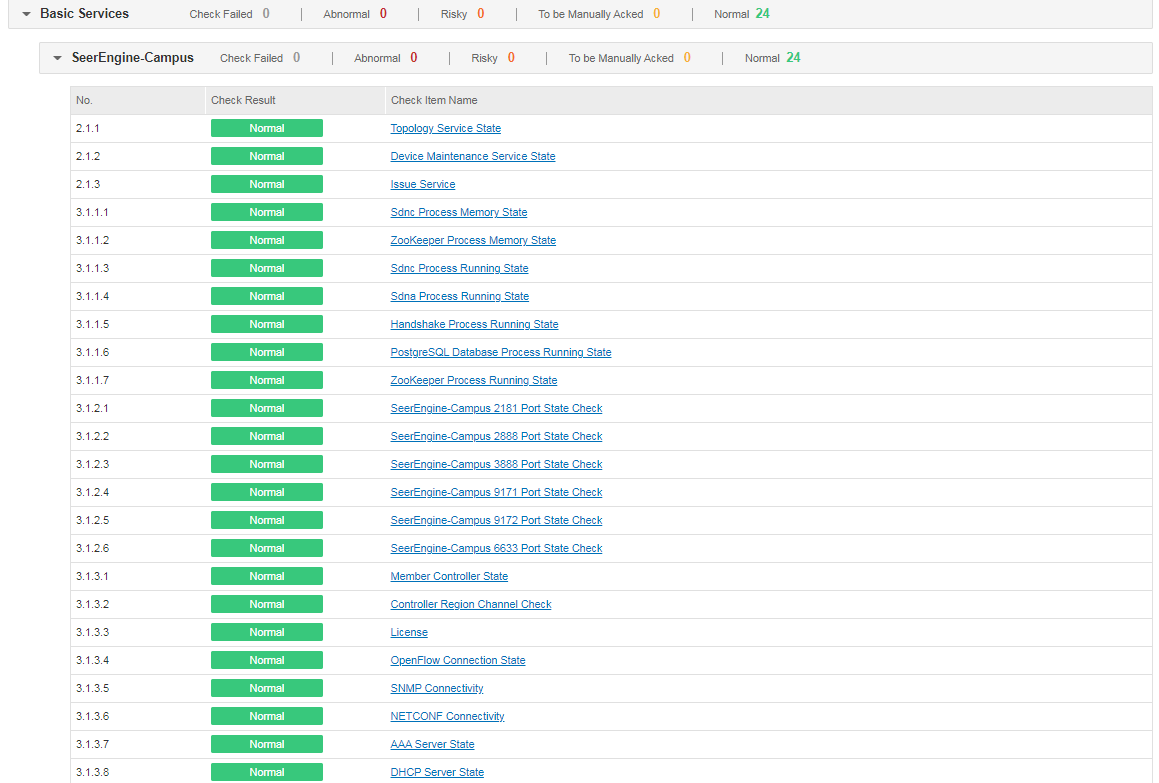
Check result summary
Check result summary can fall into three categories: system, basic services, and service data.
· System-related check results
It is the check result of Unified Platform, which includes information relating to running load of each node, installation path space, device busyness, key files of each node, port check, network performance, pod resources, and critical services. The check items CPU and memory of previous path Data Check > Check Result Summary > System are displayed here.
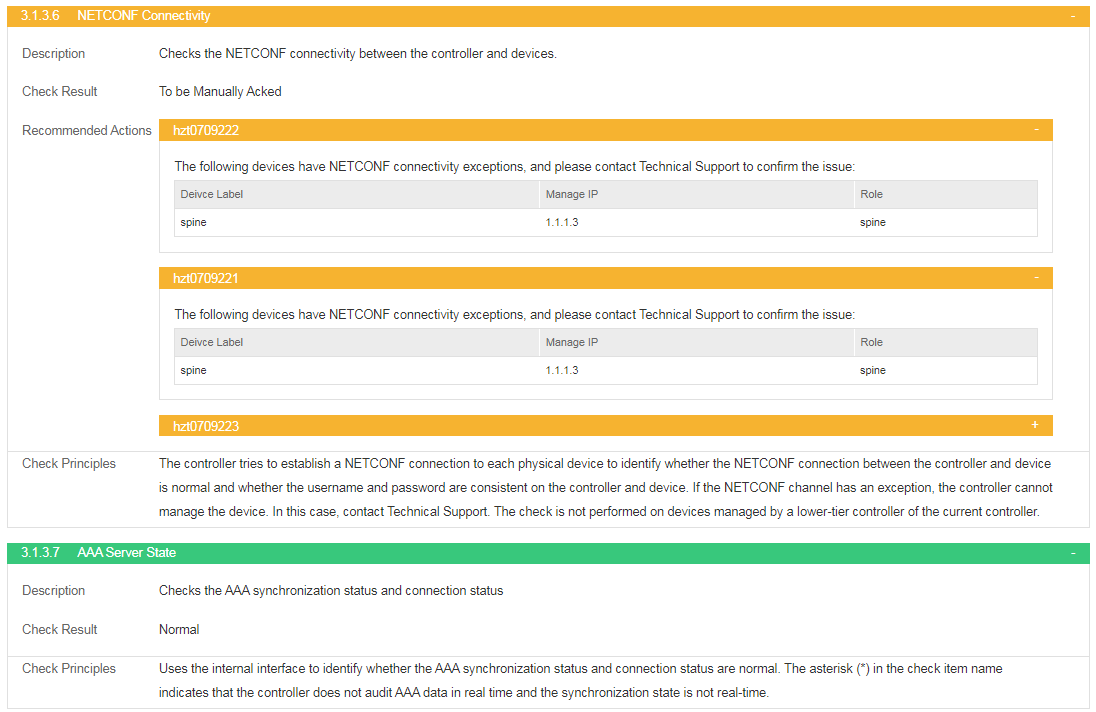
· Basic service-related check results
The check results include the state of SeerEngine-Campus services, state of critical process, port state, license state, AAA server state, DHCP server state, and SNMP and NETCONF connectivity to devices.
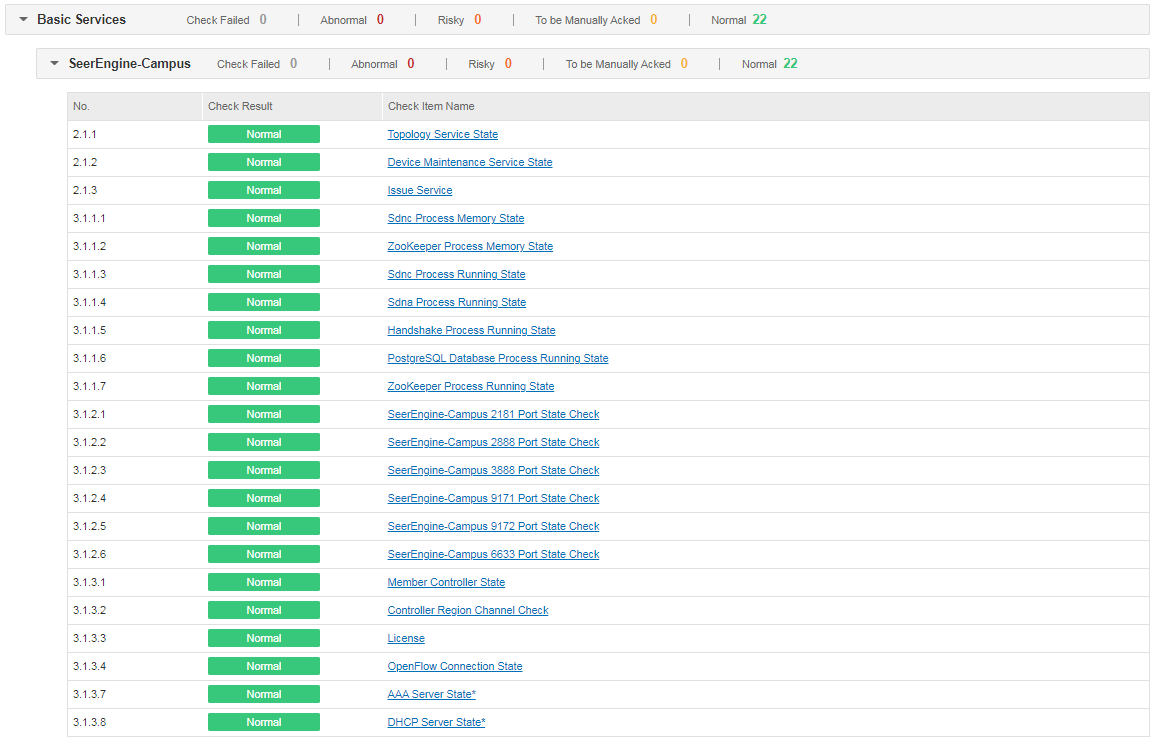
When the switch Check Real-Time State of DHCP and AAA Servers is enabled under Automation > Network Parameters > Parameter of SeerEngine-Campus, the check items of AAA server state and DHCP server state are unmarked (or marked with * when the switch is disabled), indicating that the check is audited or synchronized in real time. If the service volume of DHCP and AAA servers is small, it is advised to enable the switch to monitor the state of servers. If the service volume is large, the check process may take longer. In this case, it is recommended to adjust the timeout time or disable the switch.
When the switch Check SNMP and NETCONF Connectivity to Devices is enabled under Automation > Network Parameters > Parameter, the two items are checked, and the check results are displayed in the report. When this switch is disabled, the two items are not checked, and the check results are not displayed in the report. If the number of devices under the management of the controller is small, it is advised to enable the switch to monitor the connectivity state of devices. If this number is large, the check process may take longer. In this case, it is advised to adjust the timeout time or disable the switch.
Non-real-time state:
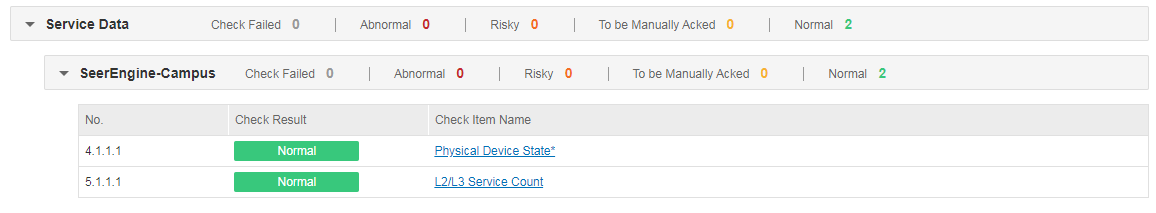
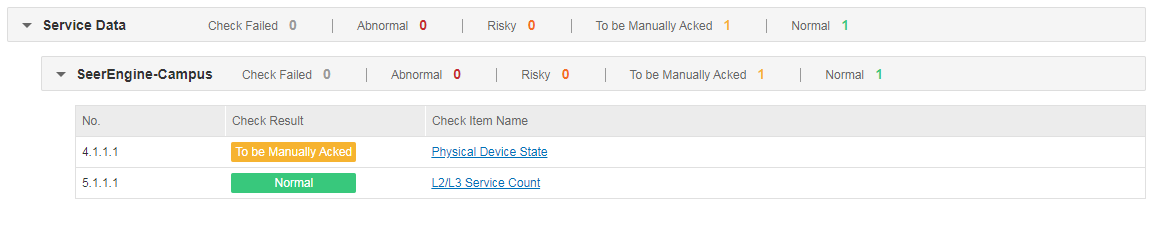
· Service data-related check results
The check results include physical device state and L2/L3 service count of the controller SeerEngine-Campus.
When the switch Check Real-Time State of Physical Devices is enabled under Automation > Network Parameters > Parameter, the check item of physical device state is not marked with the symbol "*", indicating that the check is audited or synchronized in real time. When this switch is disabled, the check item is marked with the symbol "*", indicating that the check is not audited or synchronized in real time. If the number of devices under the management of the controller is small, it is advised to enable the switch to monitor the real-time state of devices. If this number is large, the check process may take longer. In this case, it is advised to adjust the timeout time or disable the switch.
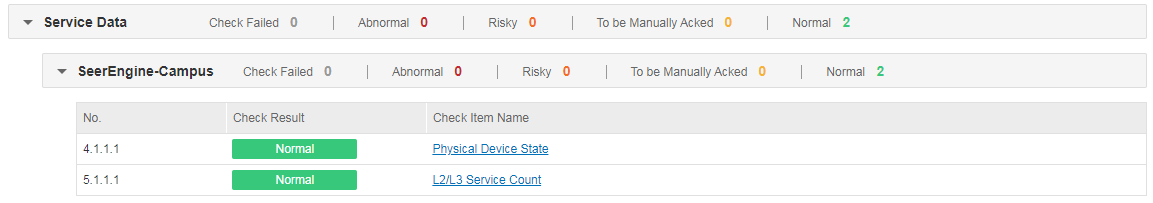
Non-real-time state:
Check result details
The details include description, check result, and check principles. Users can click the link behind each check item in Check Result Summary to go to check result details.
One-click check report example

Foreground service inspection methods
Log in to Unified Platform, select the controller menu, and follow the steps in this Guide to view specified status and information, and then fill in the specified check items in the inspection report.
Background service inspection methods
Log in to the background of Unified Platform through SSH, follow the steps in this Guide to view specified status and information, and then fill in the specified check items in the inspection report.
Check the running state of the host (left to Unified Platform)
Running load of each cluster host node
· Check item
Running load of each cluster host node
· Targets
CPU usage and memory usage of each cluster host node.
· Pass criteria
No items are marked in red in the table, indicating that neither CPU usage nor memory usage exceeds 80%.
· Example
Go to Check Result Summary > System of one-click check report to view the CPU state of the host system. If the check result is normal, it indicates that the CPU usage does not exceed 80%. If the check result is risky, it indicates that the CPU usage exceeds 80%.

Whether ScrollLock for the server where the controller is located is disabled
· Check item
Whether ScrollLock for the server where the controller is located is disabled
· Targets
Whether ScrollLock is disabled for the server where the controller is located.
· Pass criteria
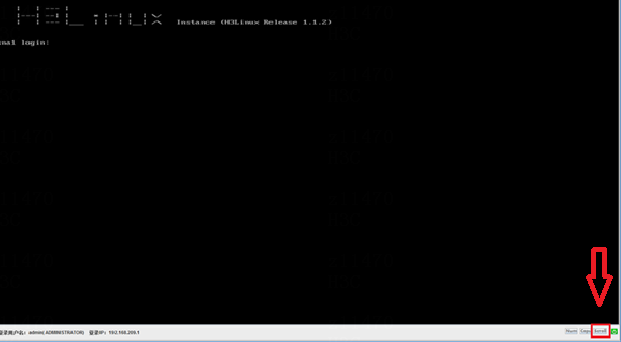
Log in to the server with KVM, and verify that the switch ScrollLock in the lower right corner is disabled (The position of the switch may vary among server vendors. In our case, the switch is usually placed in the lower right corner). If the switch is lit, it is enabled. Otherwise, it is disabled.
In the figure below, the switch ScrollLock is enabled, which means that the Campus container may get stuck when it is restarted.
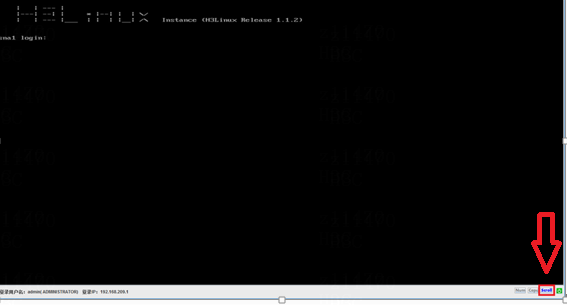
In the figure below, the switch ScrollLock is disabled.
· Example
Log in to the server with KVM, and verify that the switch ScrollLock in the lower right corner is disabled.
Inspect basic functions of the controller
Inspect the system information
Running state of the controller container
· Check item
Running state and reboot count of each pod of the controller
· Targets
Running state and reboot count of each pod.
· Pass criteria
The state of pod is Running (In the three-node cluster, there are 4 campus pods, while in the standalone deployment environment, there are 2).
The reboot count for each pod is less than 10.
· Example
Execute the kubectl get pods -n campus -o wide | grep campus command to check the running state and reboot count of each pod.
Mark the pods that have rebooted more than 10 times as risks.

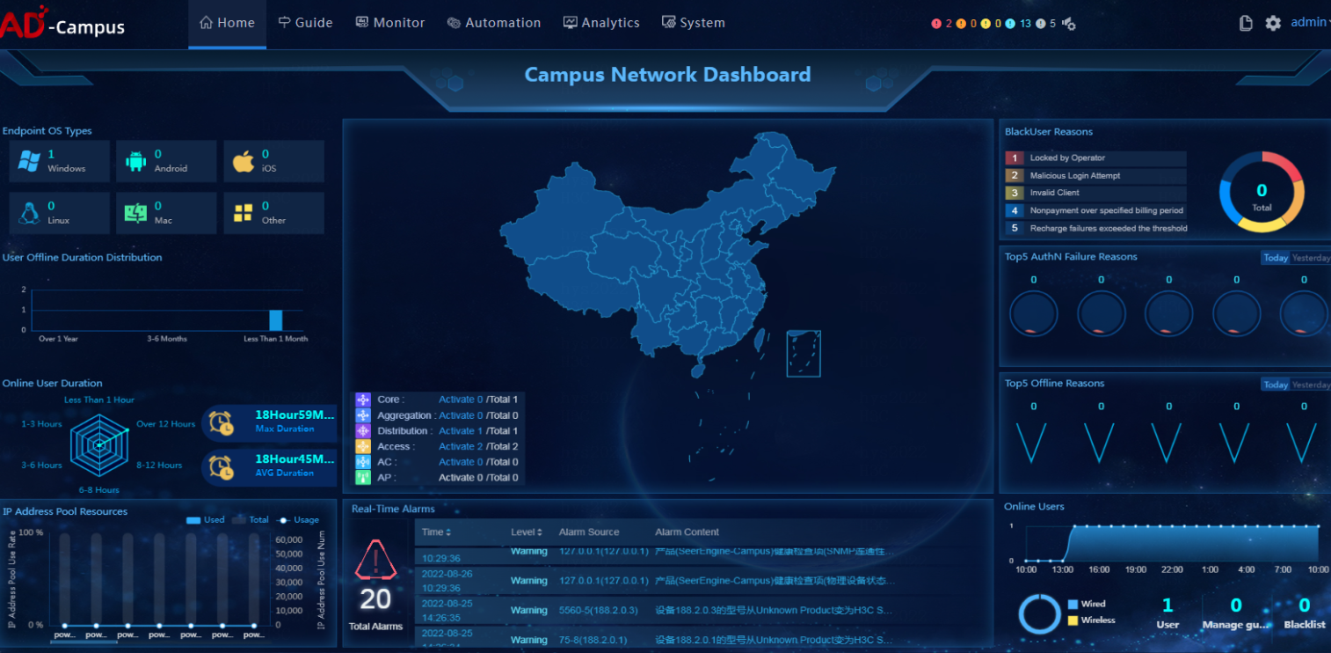
Home information of the controller
· Check item
Home information of the controller
· Targets
Online and offline users, IP address pool, endpoint OS and alarm information on the home page.
· Pass criteria
The number of online and offline users and the number of endpoint OSs meet expectations and no critical alarms occur.
· Example
View the home page of the controller.
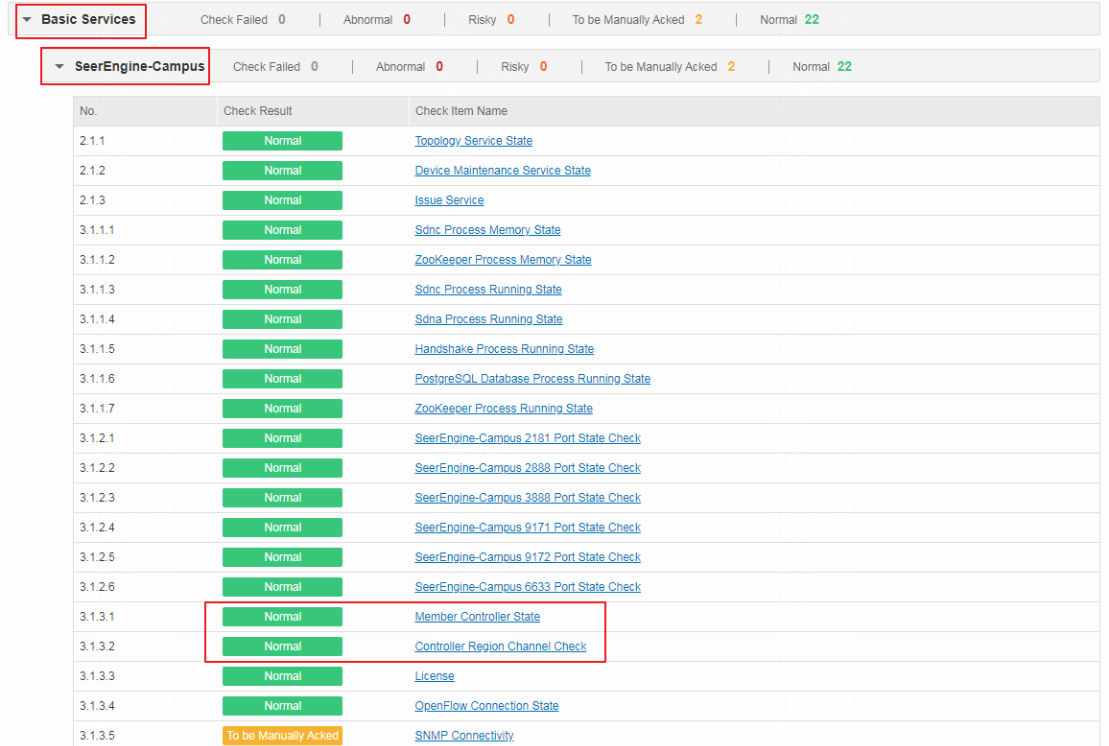
Node information of the controller
· Check item
Node information of the controller
· Targets
Member controller state and controller region channel.
· Pass criteria
The member controller state is normal and the region channel is normal.
· Example
Select Check Result Summary > Basic Services > SeerEngine-Campus and view the results of Member Controller State and Controller Region Channel Check. If the check result is normal, the system state of the controller is normal. If the check result is To be Manually Acked, the system state of the controller is abnormal and needs to be manually checked.
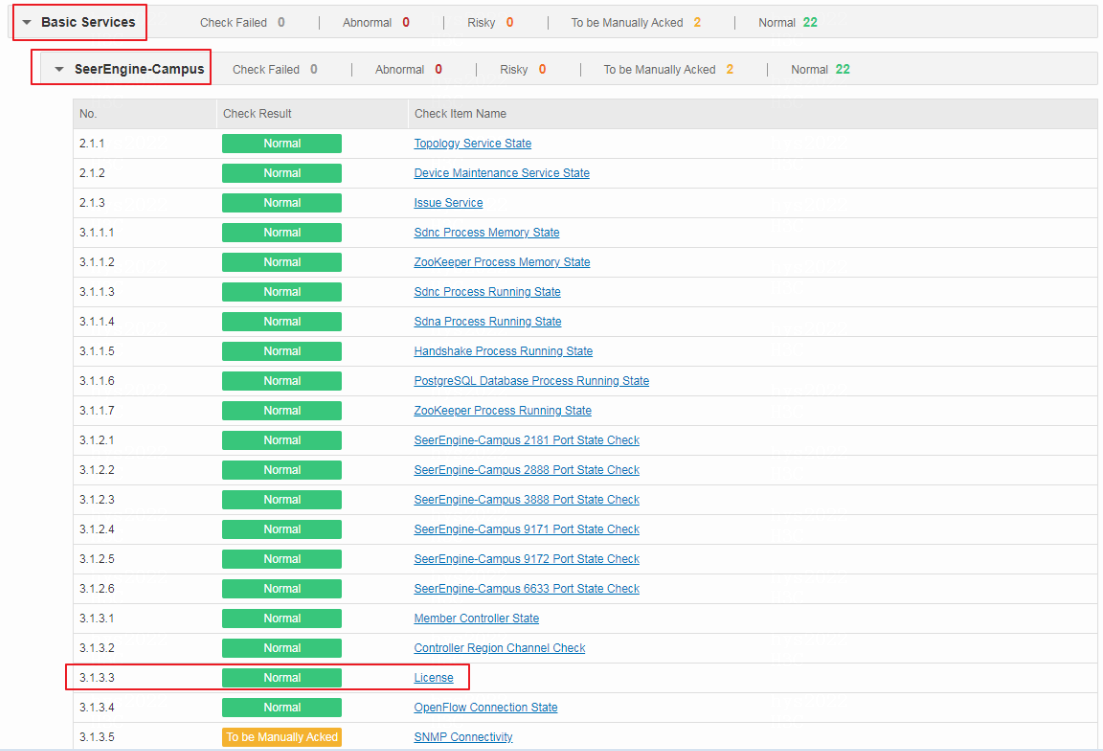
License
· Check item
Functionality of the controller license
· Targets
Functionality of the controller license.
· Pass criteria
The license state is normal.
· Example
Select Check Result Summary > Basic Services > SeerEngine-Campus and view the results of License. If the check result is normal, the license state is normal. If the check result is To be Manually Acked, the number of available pre-authorization days of the license is smaller than or equal to 10 days and needs to be manually checked. If the check result is abnormal, the license state is abnormal and the system has entered the emergency mode.
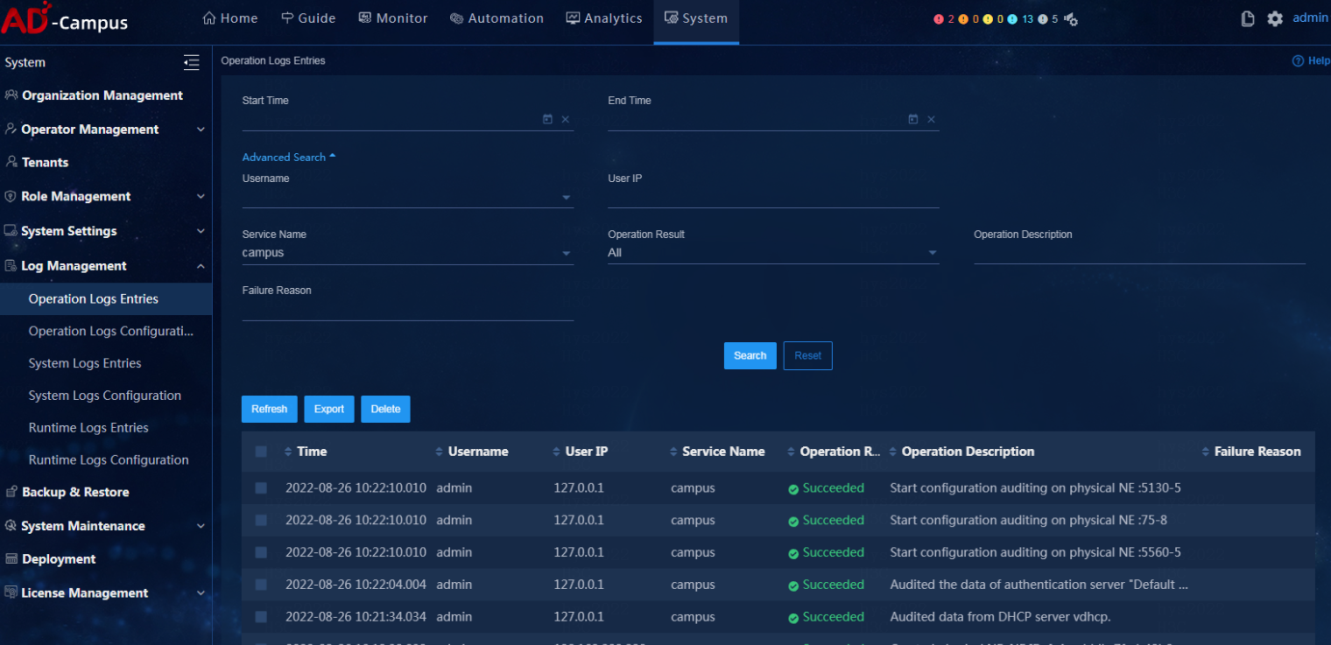
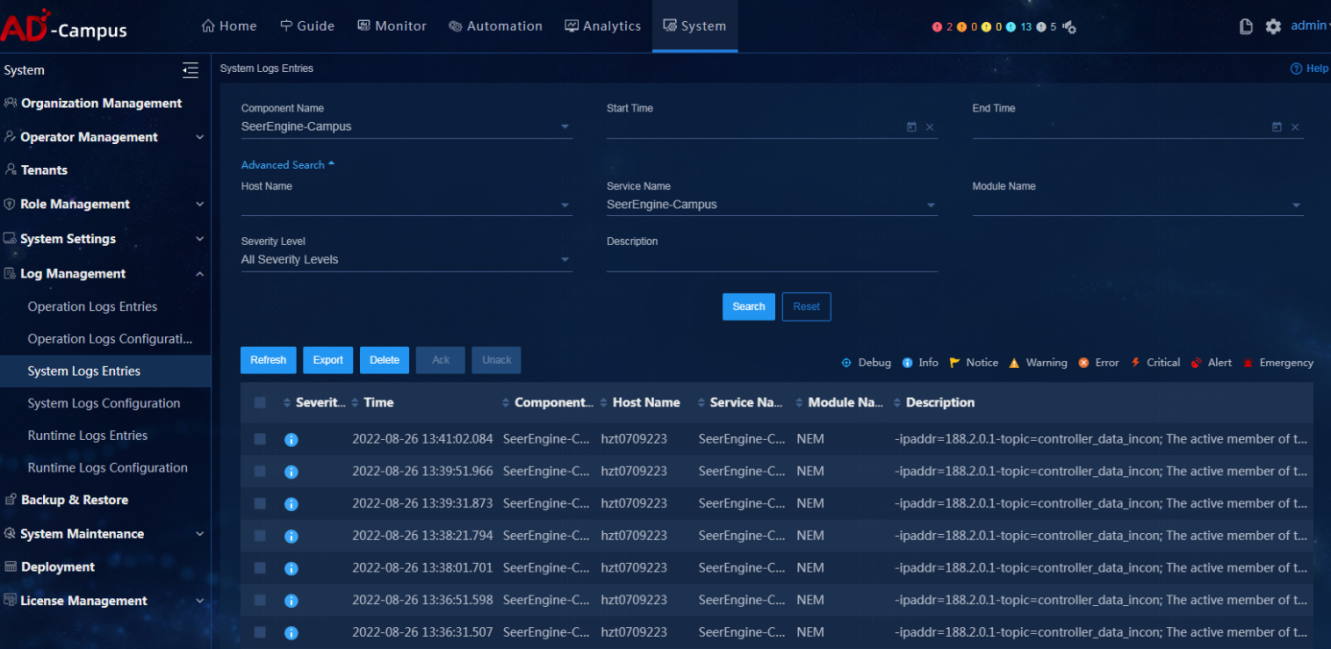
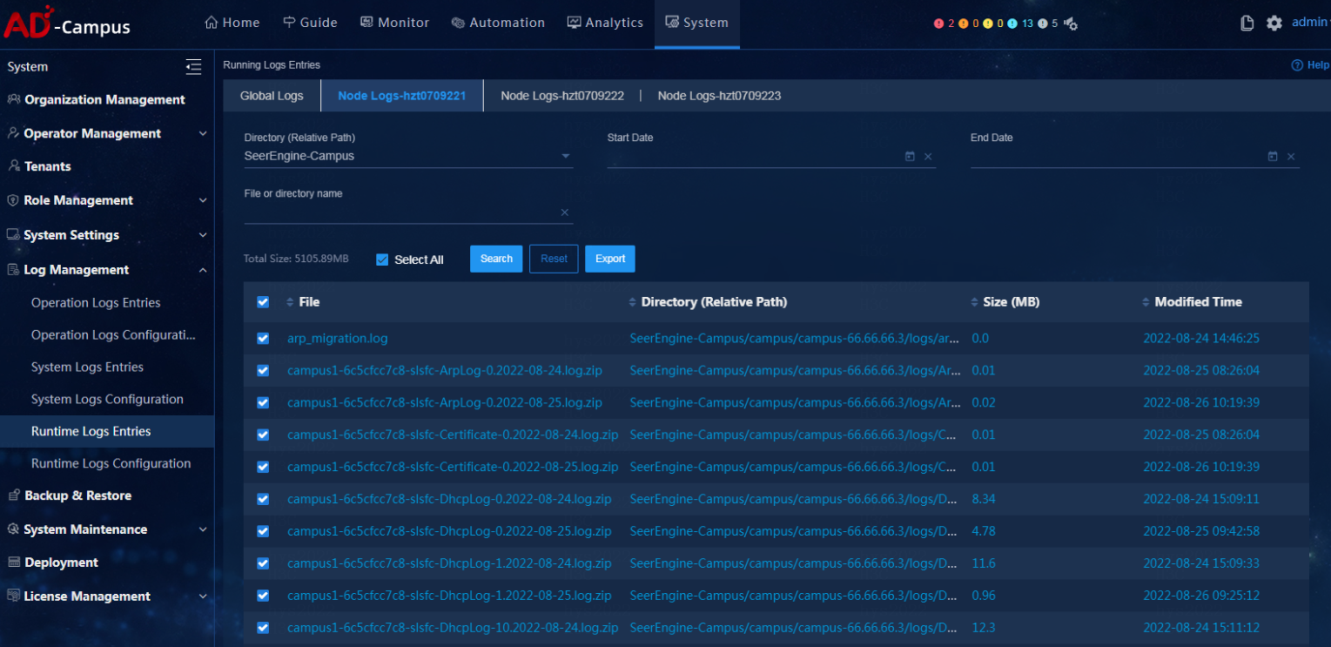
Log
· Check item
Log function of the controller
· Targets
Log function of the controller.
· Pass criteria
The operation logs, system logs, and run logs of the controller can be viewed and exported.
· Example
Select System > Log Management. On the page that opens, users can enter key words campus or SeerEngine-Campus to filter, view and export system logs, operation logs, and run logs of the controller.
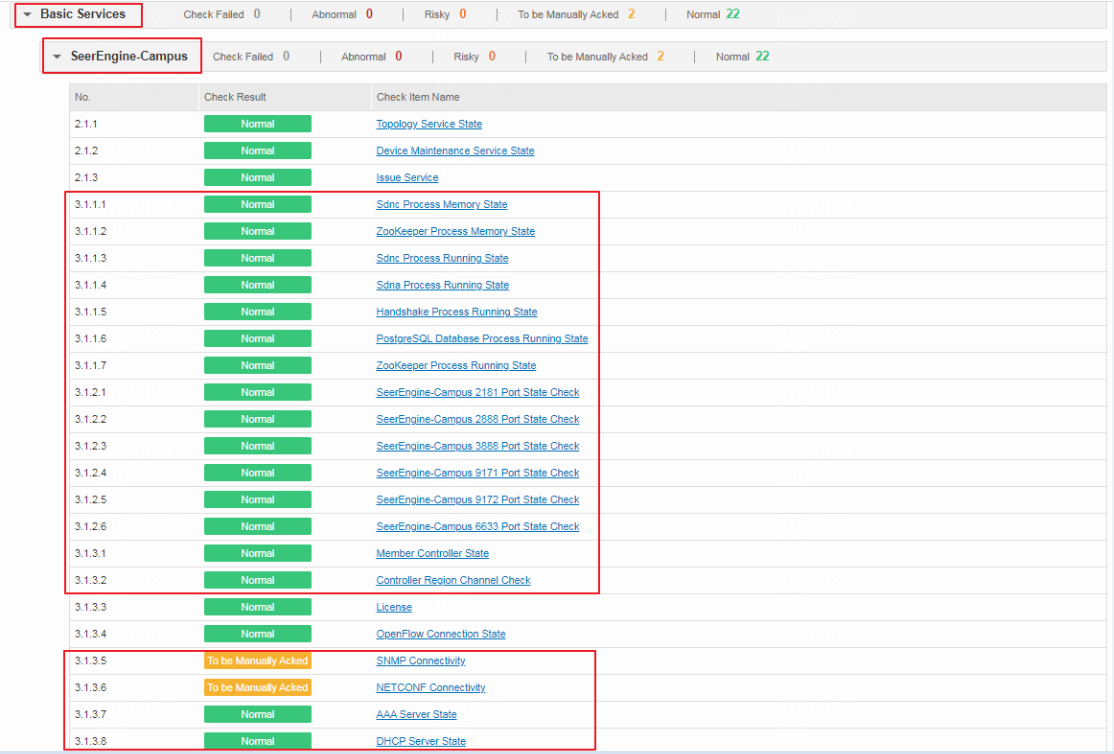
State of basic services
· Check item
State of basic services
· Targets
State of basic services of the controller.
· Pass criteria
The critical processes and service ports are normal.
· Example
In the one-click check report, view the states of critical processes (sdnc, sdna, Handshake, PostgreSQL, Zookeeper) and the states of service ports for each process, including ports for Region channel and controller 2181/9172/6633, OpenFlow connectivity, SNMP connectivity, NETCONF connectivity, AAA server status, and DHCP server status.
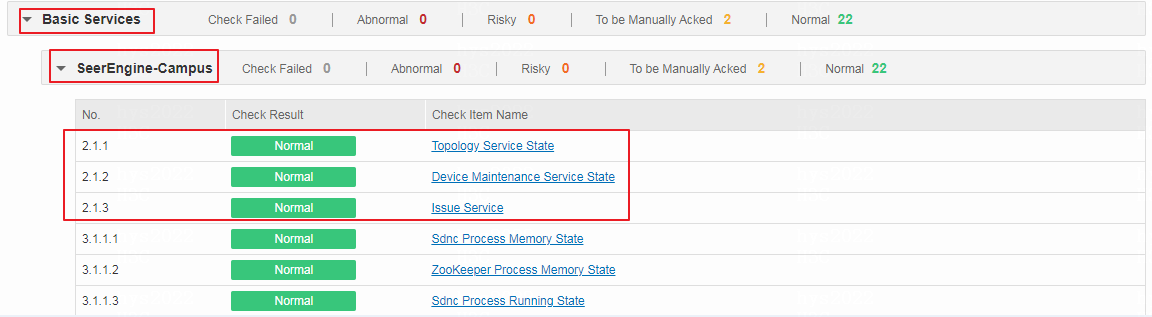
State of supplementary microservice
· Check item
State of supplementary microservice
· Targets
State of supplementary microservice of the controller.
· Pass criteria
The three supplementary microservices of the controller are normal.
· Example
Select Check Result Summary > Basic Services > SeerEngine-Campus, access the check items of Topology Service State, Device Maintenance Service State, and Issue Service to view the state of supplementary microservices. If the check result is normal, the microservice state is normal. If the check result is To be Manually Acked, the microservice state is abnormal and needs to be manually checked.
Inspect external service state and global parameters
Select Automation > Campus Network > Network Parameters to view the information of the DHCP server, AAA server and global parameters.
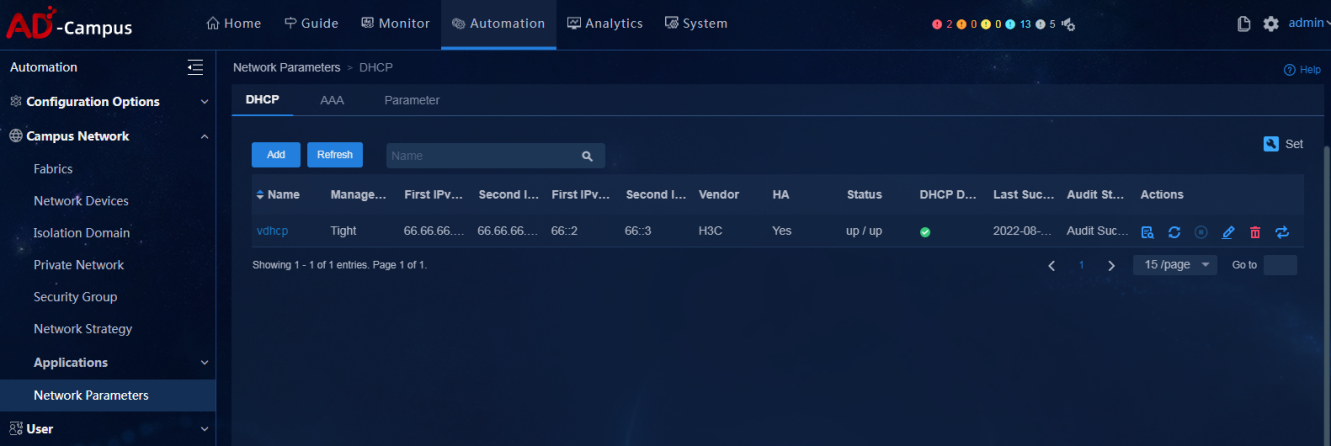
DHCP server status
· Check item
DHCP server status
· Targets
DHCP server status.
· Pass criteria
The DHCP server status is normal and the Audit Status column displays Audit Successful.
· Example
On the DHCP tab, users can verify the information of DHCP servers under management of the system in the figure below.
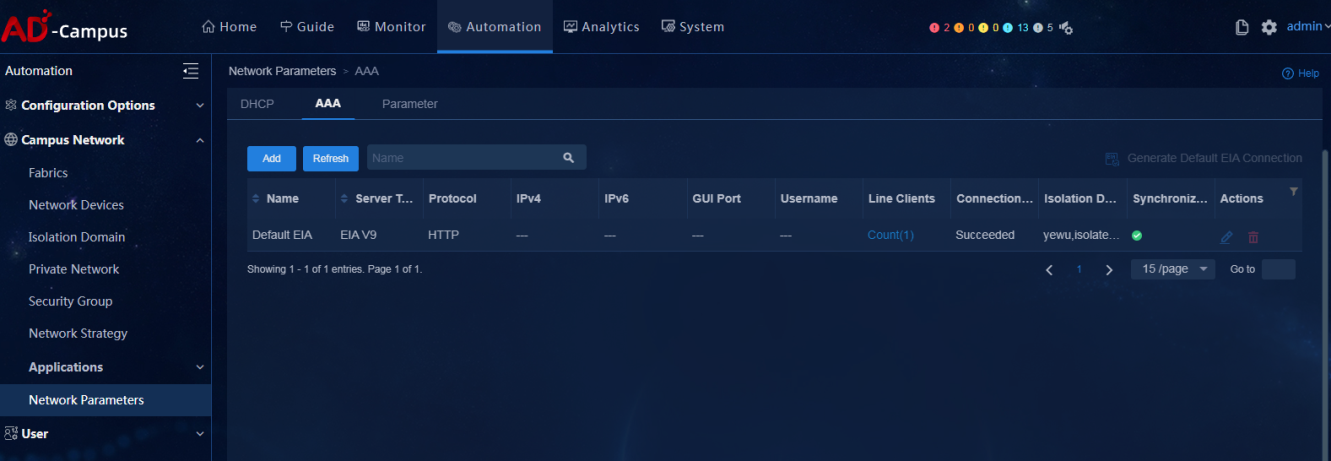
AAA server status
· Check item
AAA server status
· Targets
AAA server status.
· Pass criteria
AAA server connection status is Succeeded, and the synchronization status is green.
· Example
On the AAA tab, users can verify the information of AAA servers under management of the system in the figure below.
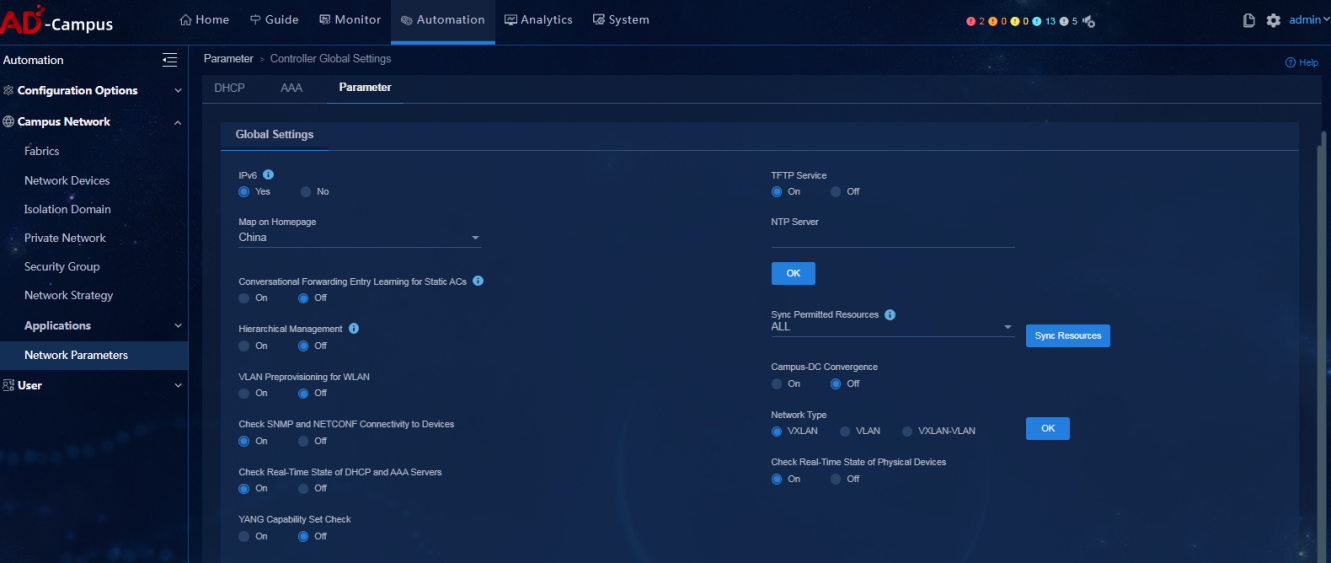
Global parameters
· Check item
Global parameters
· Targets
Whether the global parameters of the controller meet expectations.
· Pass criteria
The states and values of global parameters of the controller meet users' expectations.
· Example
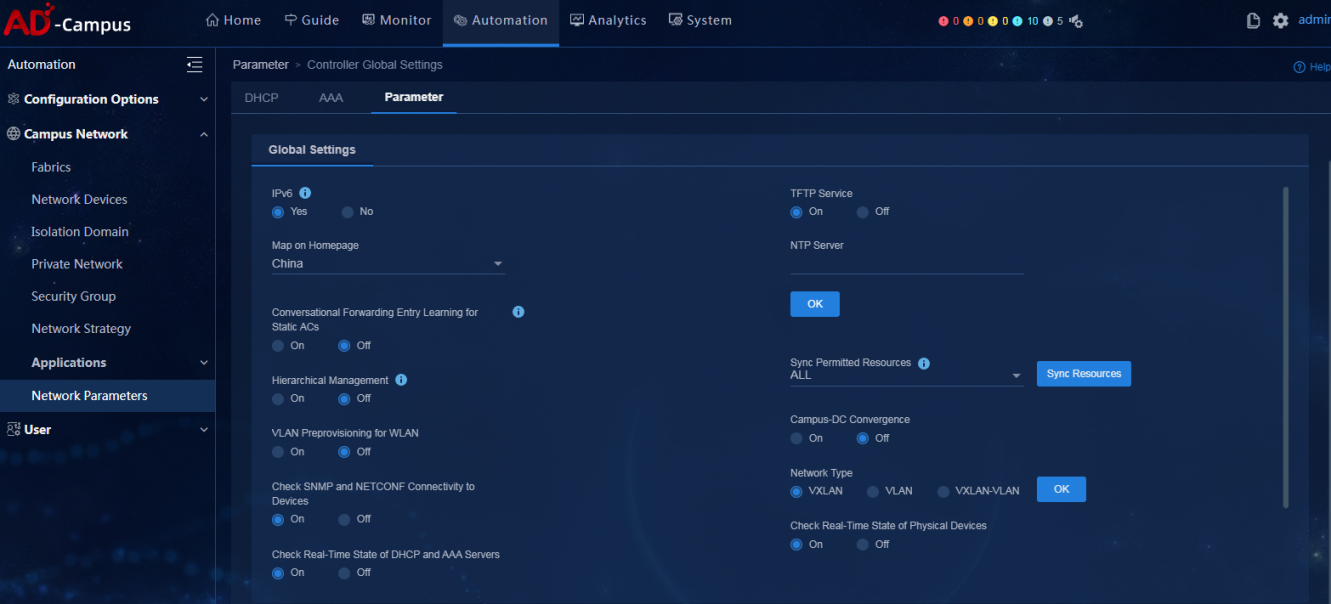
On the Parameter tab, users can check whether the states and values of global parameters of the controller meet expectations, including whether the following switches are enabled: IPv6, TFTP Service, NTP Server, Hierarchical Management, VLAN Preprovisioning for WLAN, and Campus-DC Convergence. Please refer to the figure below:
Inspect the network service state
Physical device state
· Check item
Physical device state
· Targets
States of physical devices under the management of the controller.
· Pass criteria
The states of inspected physical devices are normal.
· Example
Select Check Result Summary > Service Data > SeerEngine-Campus and view the results of Physical Device State. If the check result is normal, the network service state of the controller is normal. If the check result is To be Manually Acked, the system state of the controller is abnormal and needs to be manually checked.

|
|
NOTE: There is no need to inspect the device state and data sync state of devices that communicate with the controller via WebSocket protocol or to inspect the data sync state of those third-party access devices. |
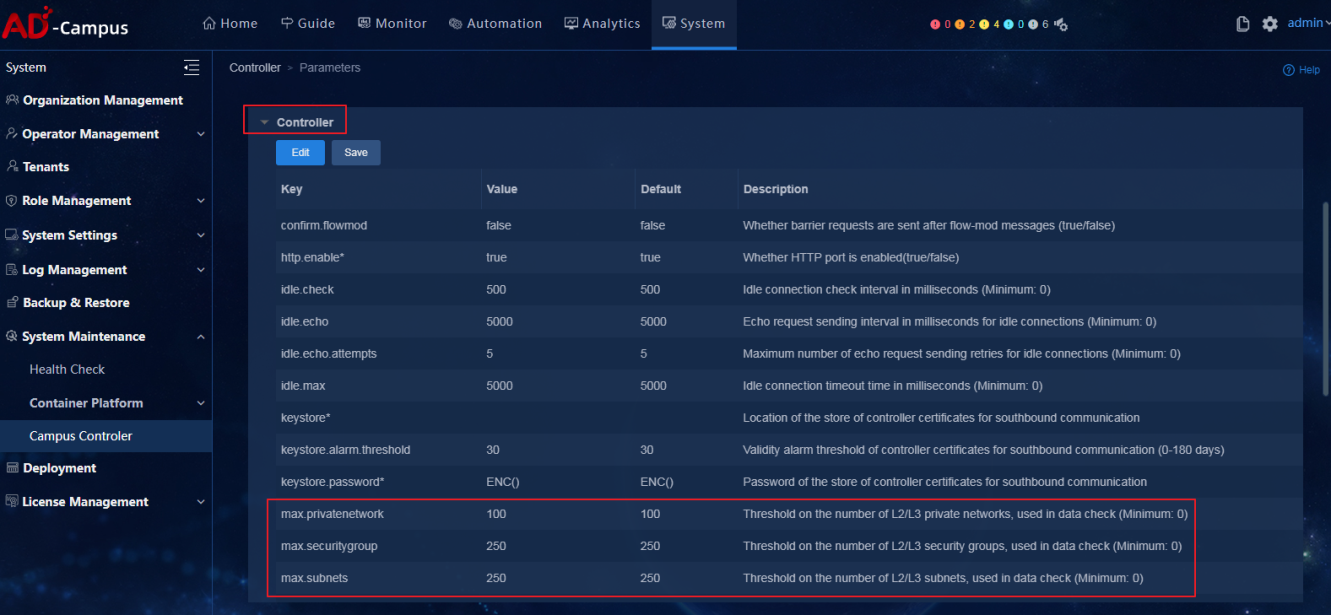
L2/L3 service count
· Check item
· Targets
L2/L3 service count of the controller.
· Pass criteria
The number of security groups, private networks, and subnets is below the maximum.
· Example
Select Check Result Summary > Service Data > SeerEngine-Campus and view the results of L2/L3 Service Count. If the check result is normal, the system state of the controller is normal. If the check result is To be Manually Acked, the system state of the controller is abnormal and needs to be manually checked.
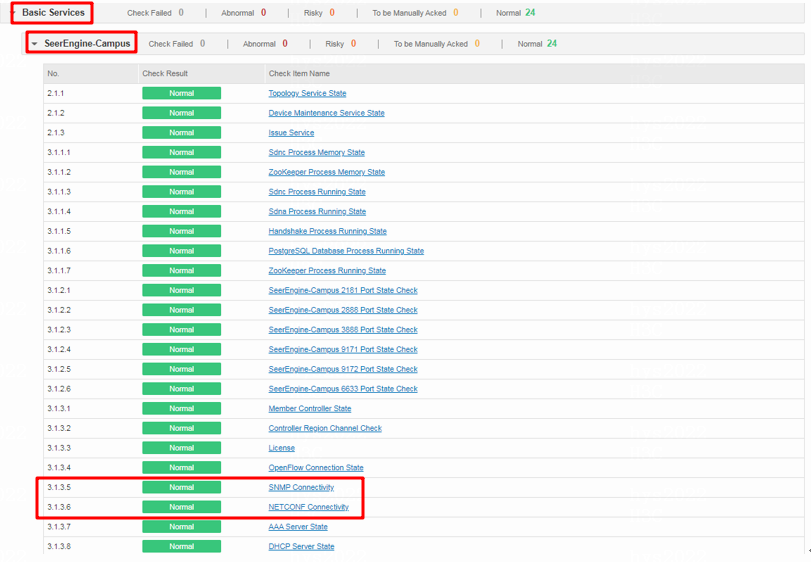
Device connectivity
· Check item
Device connectivity
· Targets
Device connectivity to the controller.
· Pass criteria
The connectivity between the inspected physical device and the controller is normal.
· Example
Select Check Result Summary > Basic Services > SeerEngine-Campus and view the results of NETCONF Connectivity and SNMP Connectivity. If the check result is normal, the system state of the controller is normal. If the check result is To be Manually Acked, the system state of the controller is abnormal and needs to be manually checked.
|
|
NOTE: There is no need to inspect the NETCONF connectivity of third-party access devices or to inspect the connectivity of devices that communicate with the controller via WebSocket protocol. |
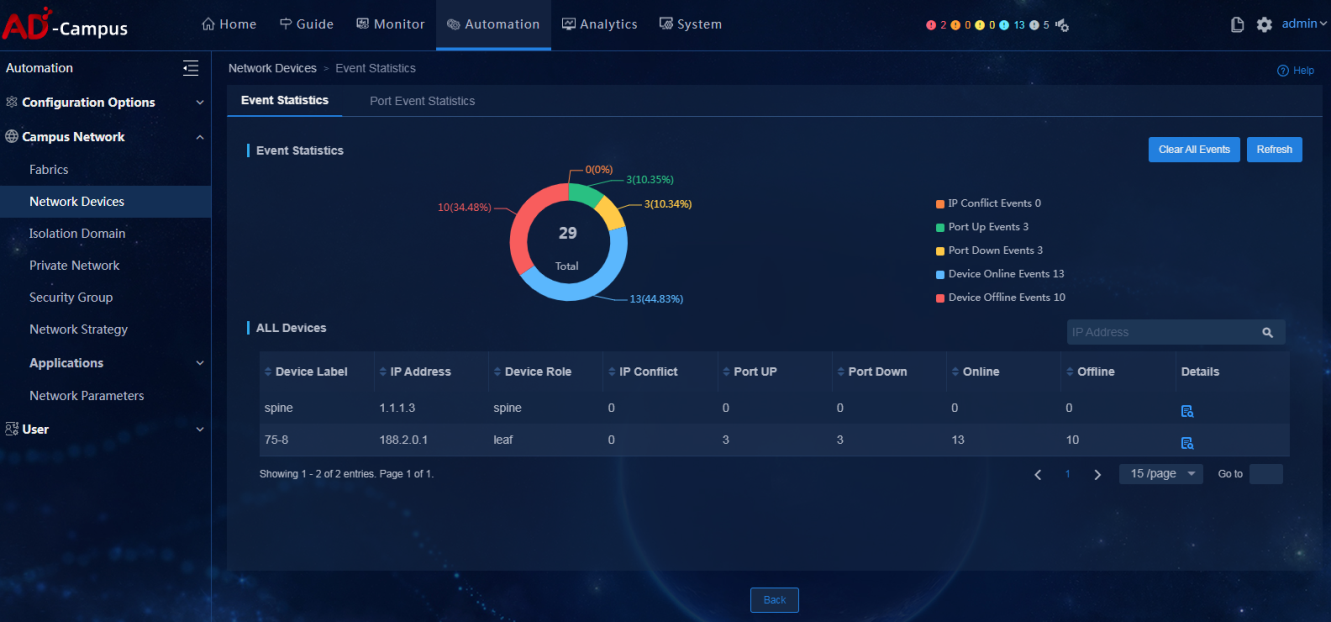
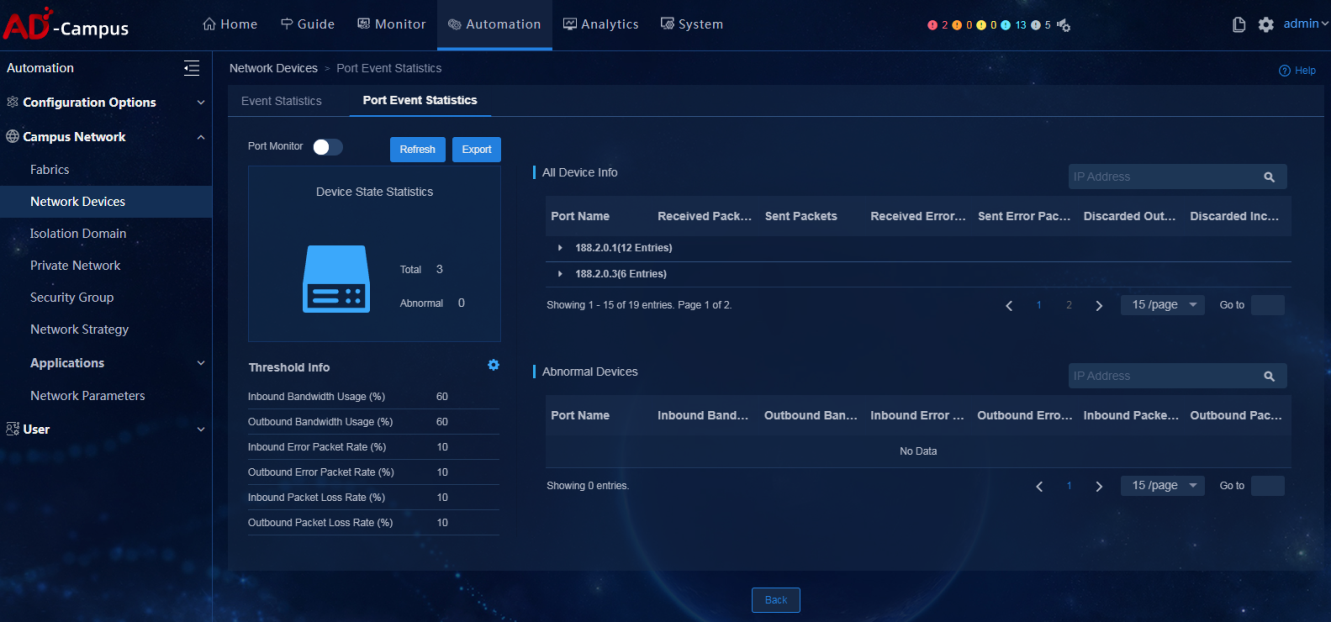
Spine and leaf event statistics
· Check item
Spine and leaf event statistics
· Targets
Statistics of spine and leaf events monitored by the controller.
· Pass criteria
There are no IP conflict events, port up events and port down events in the event statistics.
· Example
Select Automation > Campus Network > Network Devices. On the page that opens, click Monitor > Event Statistics in the upper right corner to view spine and leaf event statistics information of devices under management. Verify that no abnormal events occur.
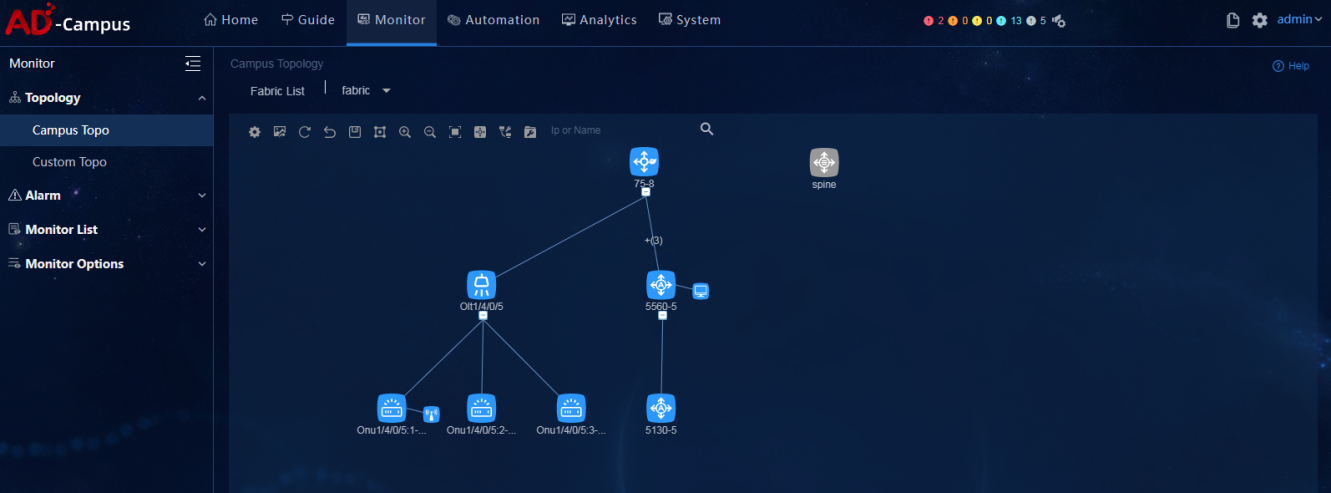
Network topology
· Check item
State of network topology
· Targets
State of network topology.
· Pass criteria
The states of nodes and links in the campus topology meet expectations.
· Example
Select Monitor > Topology > Campus Topo to view the network topology information of each fabric. Verify that there are no abnormal devices and links, as shown below:
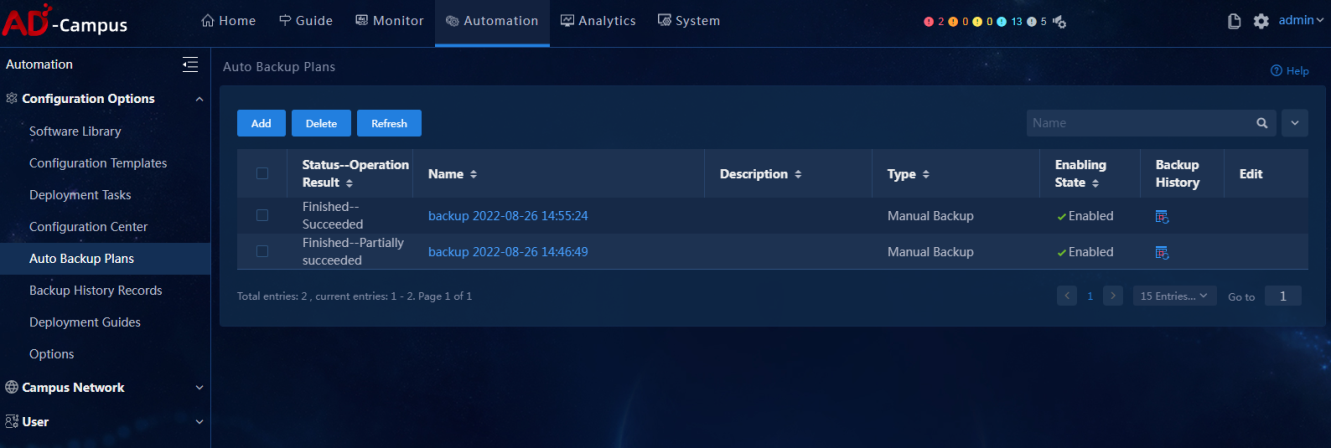
Backup plans of network devices
· Check item
Backup plans of network devices
· Targets
Backup plans of network devices of the controller.
· Pass criteria
The backup plans of network devices of the controller run normally.
· Example
Select Automation > Configuration Options > Auto Backup Plans and select Automation > Configuration Options > Backup History Records to view whether the current backup plans of the controller are running properly.

Inspection report
After inspecting SeerEngine-Campus, create an inspection report according to the table below.
Table 8 Inspection report for system information
|
Targets |
Instruction |
Result |
Remarks |
|
Running state of the controller container |
Check the running state and reboot count of each pod of the controller. |
□ Normal □ Abnormal |
|
|
Home information of the controller |
Access the home page to view home information of the controller. |
□ Normal □ Abnormal |
|
|
Node information of the controller |
Select Check Result Summary > Basic Services and check the member controller state. |
□ Normal □ Abnormal |
|
|
Functionality of the license |
Select Check Result Summary > Basic Services and check the license. |
□ Normal □ Abnormal |
|
|
Log function |
Log in to the system log management page and filter and check whether Campus operation logs, system logs, and run logs are accessible. |
□ Normal □ Abnormal |
|
|
State of basic services |
Select Check Result Summary > Basic Services and check the running state of XXX process and XXX port state of SeerEngine-Campus. |
□ Normal □ Abnormal |
|
|
State of supplementary microservices |
Select Check Result Summary > Basic Services, and access the check items of Topology Microservice State, Device Maintenance Service State, and Issue Service to view the state of supplementary microservices. |
□ Normal □ Abnormal |
|
Table 9 Inspection report for external service state and global parameters
|
Targets |
Instruction |
Result |
Remarks |
|
DHCP server status |
Select Automation > Campus Network > Network Parameters > DHCP page to view the state of the DHCP server. |
□ Normal □ Abnormal |
|
|
AAA server status |
Select Automation > Campus Network > Network Parameters > AAA page to view the state of AAA server. |
□ Normal □ Abnormal |
|
|
Parameter |
Select Automation > Campus Network > Network Parameters > Parameter page to view global parameters of the system. |
□ Normal □ Abnormal |
|
Table 10 Inspection report for network service state
|
Targets |
Instruction |
Result |
Remarks |
|
Physical device state |
Select Check Result Summary > Service Data and view the check item of Physical Device State. |
□ Normal □ Abnormal |
|
|
L2/L3 service count |
Select Check Result Summary > Service Data and view the check item of L2/L3 Service Count. |
□ Normal □ Abnormal |
|
|
Device connectivity |
Select Check Result Summary > Service Data and view the check items of NETCONF Connectivity, SNMP Connectivity, and OpenFlow Connection State. |
□ Normal □ Abnormal |
|
|
Spine and leaf event statistics |
Select Monitor > Topology > Campus Topo to view the network topology information of the system. |
□ Normal □ Abnormal |
|
|
Network topology |
Select Monitor > Topology > Campus Topo to view the network topology information of each fabric. |
□ Normal □ Abnormal |
|
|
Backup plans of network devices |
Select Automation > Configuration Options > Auto Backup Plans to view all the backup plans. |
□ Normal □ Abnormal |
|
EIA inspection guide
User services
· Check item
User services page
· Targets
User services page.
· Pass criteria
The User menu exists, which further contains Access Service, Access User, Guest User, Device User, IP Address Management, and Service Parameters. The data output on the page is normal.
· Example
Click Automation to verify that User menu contains submenus of Access Service, Access User, Guest User, Device User, IP Address Management, and Service Parameters. Click these menus to verify that the data output on the page is normal.

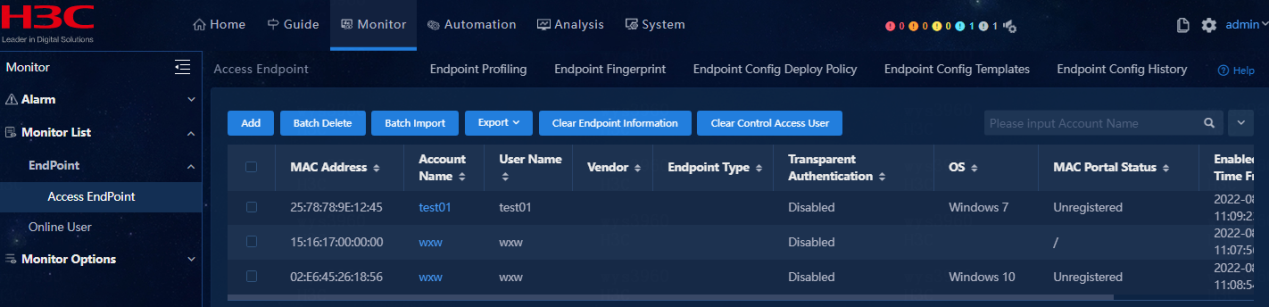
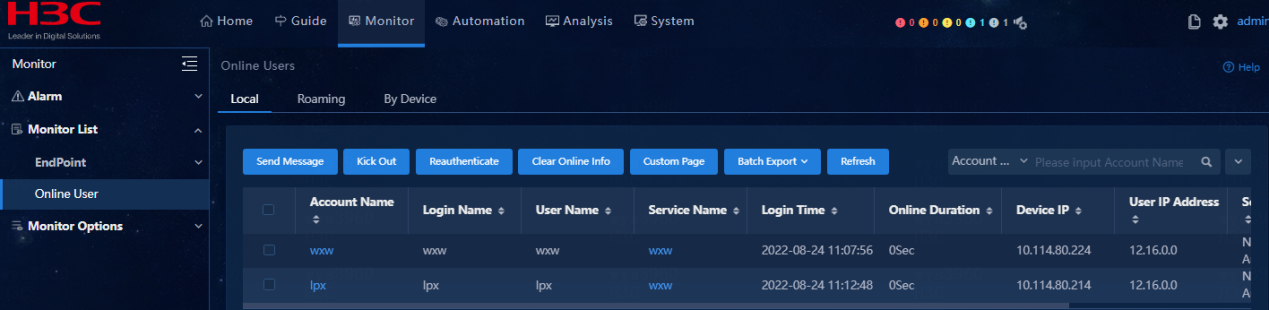
Monitor list
· Check item
EIA product menus and submenus under Monitor List
· Targets
EIA product menus and submenus under Monitor List, and whether the number of online users is different from that of working days.
· Pass criteria
Monitor List exists and contains the following submenus: EndPoint, Access EndPoint, and Online User. The data output on the page is normal. Select Online User > Local and verify that the number of online users is similar to that of working days.
· Example
Click Monitor to verify that Monitor List exists and contains the following submenus: EndPoint, Access EndPoint, and Online User. Verify that the data output on the page is normal. Select Online User > Local and view the number of online users.
User analysis
· Check item
Display of EIA menu and page under Health Analysis
· Targets
Display of EIA menu and page under Health Analysis, and whether certification failed logs are generated due to system failure.
· Pass criteria
The menu Health Analysis exists, which contains User Analysis > Access Analysis. The data output on the page is normal. Select Certification Failed Logs and verify that no certification failed logs are generated due to system failure.
· Example
Click Analysis to verify that the submenu Health Analysis contains User Analysis > Access Analysis. Select Certification Failed Logs and check whether certification failed logs are generated due to system failure.
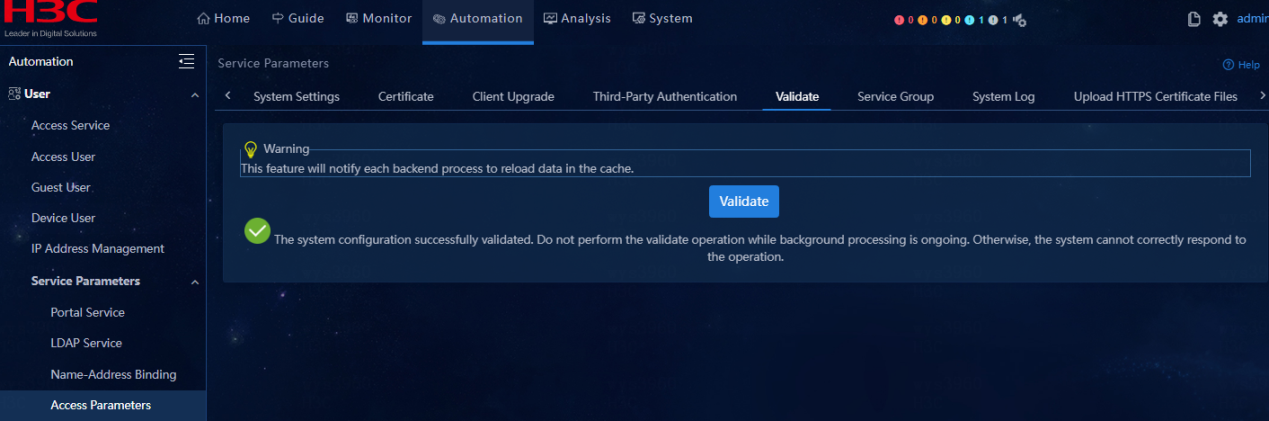
Communication among components
· Check item
Communication among components of EIA
· Targets
Whether the system configuration is validated.
· Pass criteria
Select Automation > User > Service Parameters > Access Parameters > Validate. Once Validate is clicked, the system configuration is successfully validated and no failure notification is issued.
· Example
Select Automation > User > Service Parameters > Access Parameters > Validate. Once Validate is clicked, the system configuration is successfully validated.
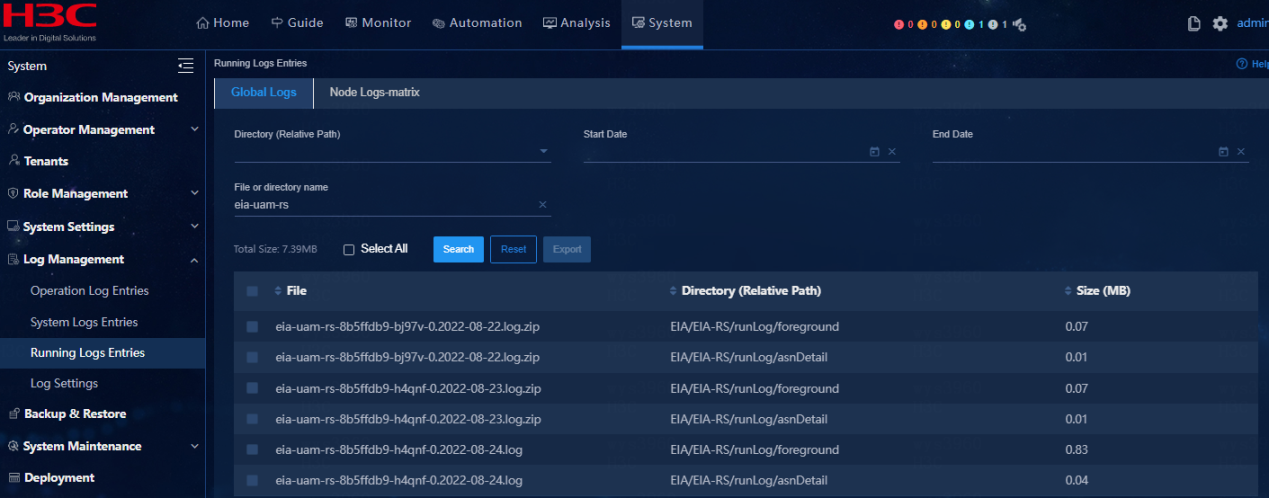
EIA log information
· Check item
Run logs and operation logs of EIA
· Targets
Run logs and operation logs of EIA.
· Pass criteria
Select System > Log Management > Running Logs Entries and verify that operation logs for the current day and for the prior days are available.
· Example
Select System > Log Management > Running Logs Entries and search for logs starting with EIA. verify that operation logs for the current day and for the prior days are available.
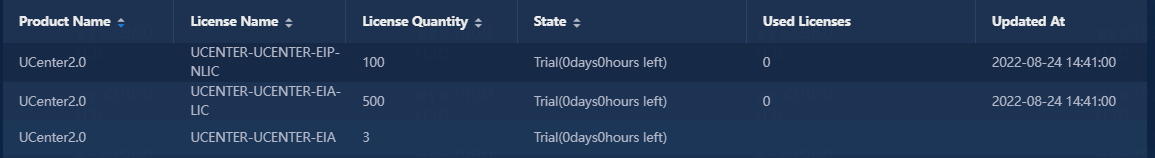
License information of EIA
· Check item
License information of EIA
· Targets
License information of EIA.
· Pass criteria
The license quantity is sufficient and the license state is normal for the three licenses (UCENTER-UCENTER-EIP-NLIC, UCENTER-UCENTER-EIA-LIC, UCENTER-UCENTER-EIA).
· Example
Select System > License Information to verify that the license quantity is sufficient and the license state is normal for the three licenses (UCENTER-UCENTER-EIP-NLIC, UCENTER-UCENTER-EIA-LIC, UCENTER-UCENTER-EIA).
Background deployment of EIA
· Check item
Background deployment of EIA
· Targets
Background node deployment of EIA.
· Pass criteria
All nodes of EIA are available.
First column: pod name; the relationship between Component Name and Pod Name is as follows:
|
Component name |
Pod name |
Remarks |
|
BYOD authentication services |
eia-byod-rs eia-byod-server eia-byod-ui |
Required, BYOD authentication, which is also a core process of MAC Portal authentication, available after EIP server components are deployed |
|
DIF service |
eia-dif |
Required, message forwarding process of endpoint access service |
|
Mschapv2 authentication service |
eia-mschapv2-server |
Required, providing Mschapv2 authentication service |
|
Portal authentication service |
eia-portalserver eia-portalweb |
Required, portal authentication, available after portal server components are deployed |
|
User self-service |
eia-ssv-rs eia-ssv-ui |
Required, providing EIA user self-service |
|
STM service |
eia-stm |
Required, message forwarding process of endpoint access service |
|
Third-party authentication service |
eia-third |
Required, providing the third-party authentication service |
|
DM background service |
eia-uam-dm |
Required, core authentication process of endpoint access service |
|
ISP service |
eia-uam-isp |
Required, providing intelligent agent service |
|
Periodic task of EIA |
eia-uam-job |
Required, periodic task process of endpoint access service |
|
Security policy service |
eia-uam-policy |
Required, providing security policy check |
|
EIA Web service |
eia-uam-rs eia-uam-ui |
Required, providing administrator page configuration service |
|
EIA Redis cache service |
eiaredismaster |
Required, providing Redis cache service and providing support for other services |
|
EIA Nginx service |
eia-nginx |
Required, providing reverse proxy for self-service, BYOD authentication service and portal authentication service |
· Example
Access the EIA component background, and execute the kubectl get pod -n service-software | grep eia command to view the deployment of each EIA component.
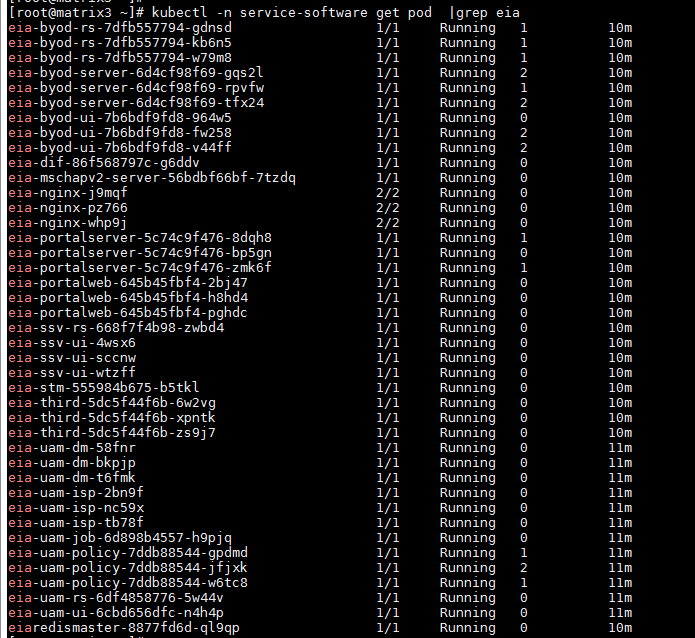
Running state of background of EIA
· Check item
Running state of background nodes of EIA
· Targets
Running state of background nodes of EIA.
· Pass criteria
The background node state of EIA is Running, and no pod is in the state of Waiting, Terminated ImagePullBackOff, and CrashLoopBackOff (the container exited and kubelet is trying to restart the container). The reboot count for each pod is less than 10.
· Example
Access the background of EIA component and execute the kubectl get pods -o wide -A | sort -nr -k5 | grep eia command to verify that the state of EIA node is Running. Mark the pods that have rebooted more than 10 times as risks, and list the top 10 pods by reboot count.
Inspection report
Table 11 EIA inspection report
|
Targets |
Instruction |
Result |
Remarks |
|
User services |
Click Automation to verify that User menu contains submenus of Access Service, Access User, Guest User, Device User, IP Address Management, and Service Parameters. Click these menus to verify that the data output on the page is normal. |
□ Normal □ Abnormal |
|
|
Monitor list |
Click Monitor to verify that Monitor List exists and contains the following submenus: EndPoint, Access EndPoint, and Online User. Verify that the data output on the page is normal. Select Online User > Local and view the number of online users. |
□ Normal □ Abnormal |
|
|
User analysis |
Click Analysis to verify that the submenu Health Analysis contains User Analysis > Access Analysis. Select Certification Failed Logs and check whether certification failed logs are generated due to system failure. |
□ Normal □ Abnormal |
|
|
Communication among components |
Select Automation > Access Parameters > Validate. Once Validate is clicked, the system configuration is successfully validated. |
□ Normal □ Abnormal |
|
|
Communication among components |
Select Automation > Access Parameters > Validate. Once Validate is clicked, the system configuration is successfully validated. |
□ Normal □ Abnormal |
|
|
EIA log information |
Select System > Log Management > Running Logs Entries and search for logs starting with EIA. verify that operation logs for the current day and for the prior days are available. |
□ Normal □ Abnormal |
|
|
License information of EIA |
Select System > License Information to verify that the license quantity is sufficient and the license state is normal for the three licenses (UCENTER-UCENTER-EIP-NLIC, UCENTER-UCENTER-EIA-LIC, UCENTER-UCENTER-EIA). |
□ Normal □ Abnormal |
|
|
Background deployment of EIA |
All nodes of EIA are available. |
□ Normal □ Abnormal |
|
|
Running state of background of EIA |
Access the background of EIA component and execute the kubectl get pods -o wide -A | sort -nr -k5 | grep eia command to verify that the state of EIA node is Running. Mark the pods that have rebooted more than 10 times as risks, and list the top 10 pods by reboot count. |
□ Normal □ Abnormal |
|
EAD inspection guide
Admission security check
Admission page check
· Check item
· EAD menu
· Targets
EAD menu.
· Pass criteria
The EAD menu is complete and responsive when you click it.
· Example
Log in as an administrator.
Verify that the menu Endpoint Security exists under Endpoint Business and the submenus of Endpoint Security are complete.
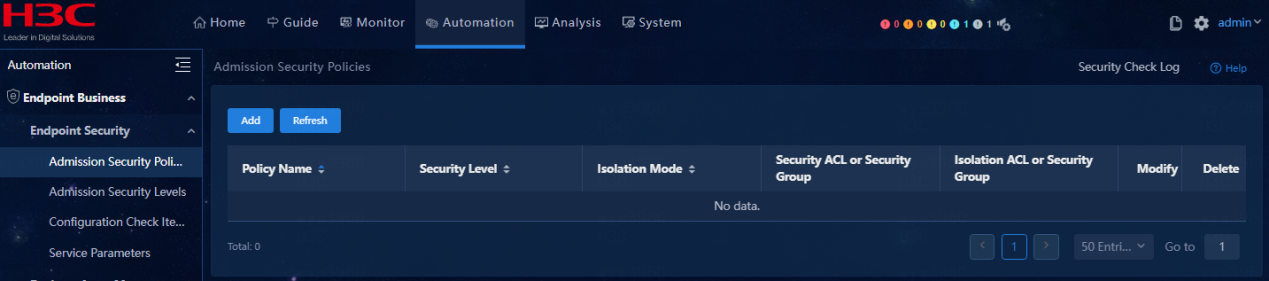
Verify that the menu Desktop Asset Management exists under Endpoint Business and the submenus of Desktop Asset Management are complete.
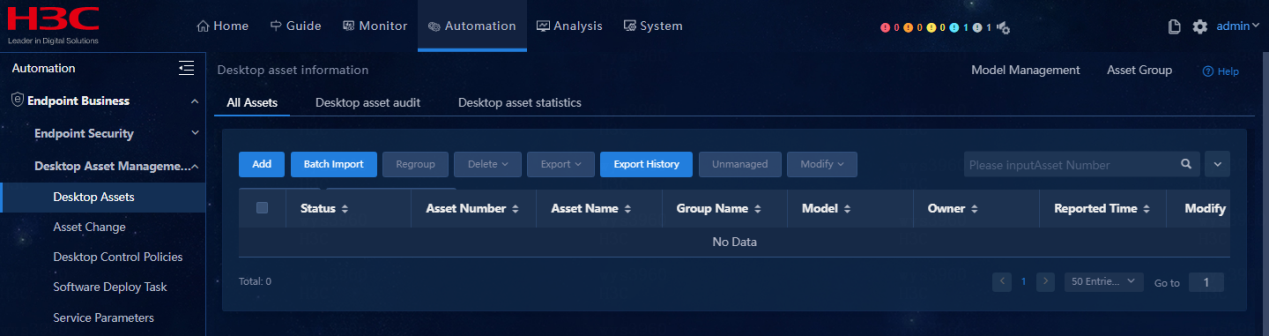
Communication among components
· Check item
Communication and running state of EAD components
· Targets
Communication and running state of EAD components.
· Pass criteria
The communication and running state of EAD components are normal.
· Example
Log in to the system, and select Endpoint Business > Endpoint Security > Service Parameters. On the Service Parameters page, click Validate to view the communication state and running state of EAD components.

Select Endpoint Business > Desktop Asset Management > Service Parameters. On the System Parameters page, click Validate to view the communication state and running state of DAM components.
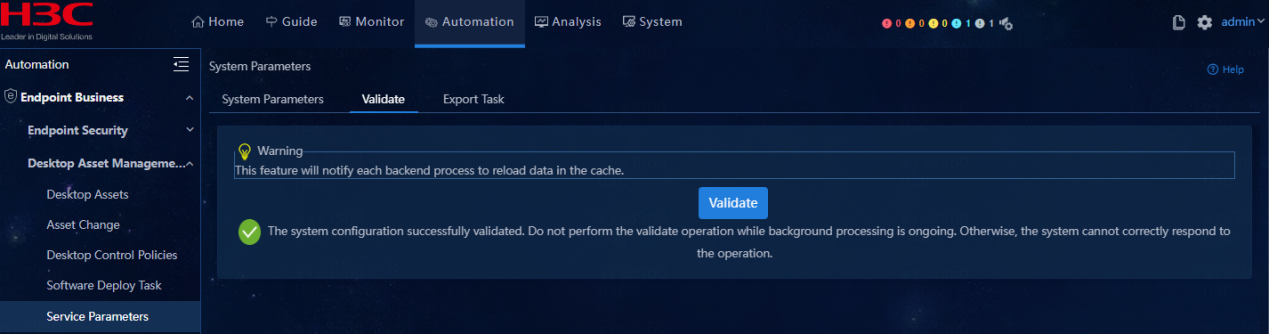
License information of EAD
· Check item
EAD licensing and node license registration
· Targets
Functionality of the EAD license.
· Pass criteria
The EAD license is registered (UCENTER-UCENTER-EAD-LIC, UCENTER-UCENTER-EAD) and the number of used licenses is smaller than the number of registered licenses.
· Example
Select System > License Management > License Information to view license information.
Search for EAD by license name to view license information.
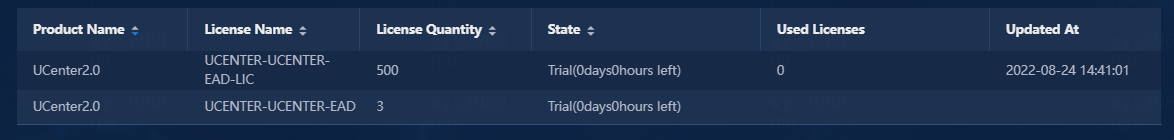
Pod running state
· Check item
Running state and reboot count of each pod
· Targets
Running state and reboot count of each pod.
· Pass criteria
Pod state is Running;
The reboot count for each pod is less than 10.
· Example
Access the background and execute the following command to check the running state and reboot count of each pod:
kubectl get pod -o wide -A|grep -E "ead|dam"
Mark the pods that have rebooted more than 10 times as risks, and list the pods by reboot count.
![]()
For the pods that have rebooted more than 10 times, check whether there are sufficient resources available for the pods (CPU/memory). If resources are sufficient, contact the R&D engineers to locate the issues.
Second column: pod name; the relationship between Component Name and Pod Name is as follows:
|
Component Name |
Pod Name |
Remarks |
|
EAD service |
ead-rs ead-ui |
Required, admission security policy service |
|
DAM service |
dam-rs dam-ui dam-server |
Required, desktop asset management service |
Inspection report
Table 12 EAD inspection report
|
Targets |
Instruction |
Result |
Remarks |
|
Menu display |
Access EAD from a browser to verify that the menus are displayed normally. |
□ Normal □ Abnormal |
|
|
Communication among components |
Log in to the system, and select Automation > Admission Security Check > Admission Check Parameters. On the Admission Check Parameters page, click Validate to view the communication state and running state of EAD components. Select Automation > Desktop Asset Management > System Parameters. On the System Parameters page, click Validate to view the communication state and running state of DAM components. |
□ Normal □ Abnormal |
|
|
License and registration |
Select System > License Management > License Information to view license information. Search for EAD by license name to view license information. |
□ Normal □ Abnormal |
|
|
Pod running state |
Execute the kubectl get pod -o wide -A|grep -E "ead|dam" command to check the running state and reboot count of each pod. Mark the pods that have rebooted more than 10 times as risks, and list the pods by reboot count. |
□ Normal □ Abnormal |
|
EPS inspection guide
This chapter describes the content and procedures of EPS inspection.
Operation recommendations
Please refer to operation recommendations on routine inspection of Unified Platform.
Procedures
This section describes the EPS inspection content and related key information. Log in to the front-end page as an administrator. Follow the steps below to collect and confirm the relevant information, and fill in the EPS inspection report based on the confirmed results. Users can view details of the list information by clicking "details" or "modify" buttons.
Pod running state
· Check item
Running state and reboot count of each pod
· Targets
Running state and reboot count of each pod.
· Pass criteria
Pod state is Running;
The reboot count for each pod is less than 10.
· Example
Execute the kubectl –n service-software get pods -o wide | grep eps command to check the running state and reboot count of each pod.
Mark the pods that have rebooted more than 10 times as risks.
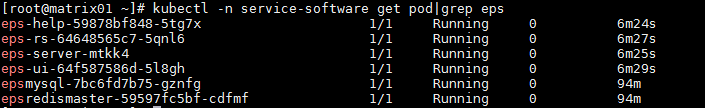
Licensing state
· Check item
EPS software licensing and node registration
· Targets
EPS software licensing and node registration.
· Pass criteria
Licenses of all nodes are accessible.
· Example
Log in to Unified Platform, and select System > License Management > License Information to view license information.

Web page response
· Check item
Response time of the web pages to operations
· Targets
Response time of the web pages to operations.
· Pass criteria
The pages respond to operations within 5 seconds.
· Example
Select Monitor > Monitor List > Endpoint > Scan Endpoints to view the endpoint lists.
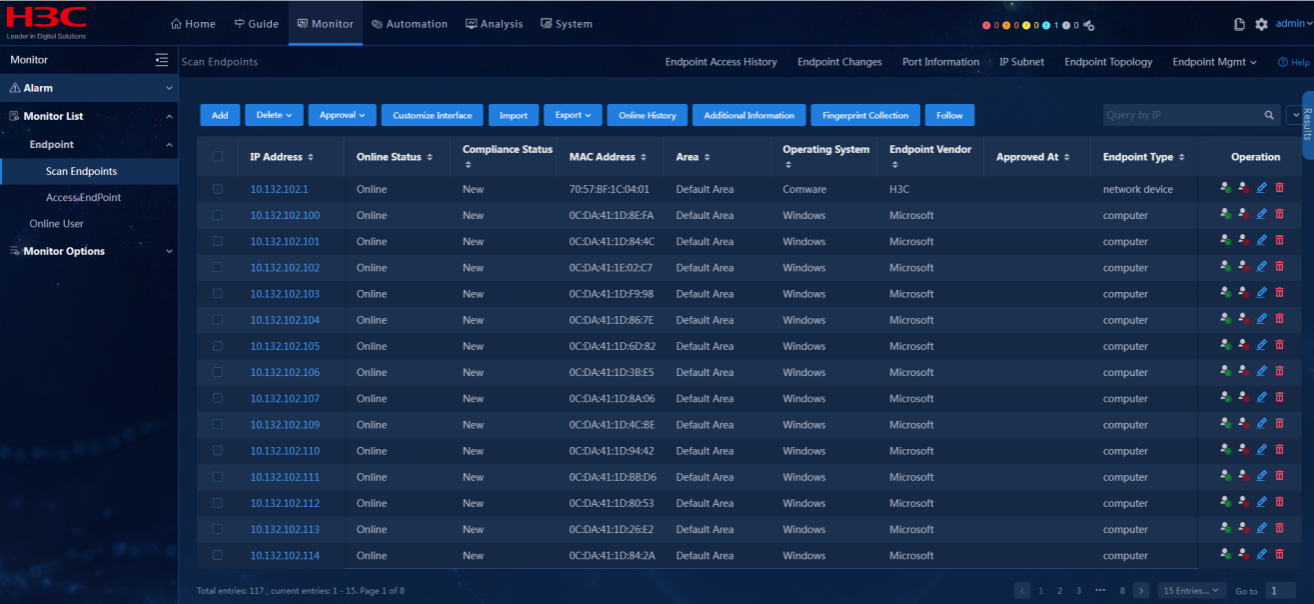
Scanner management
· Check item
State of the scanner
· Targets
State of the scanner.
· Pass criteria
The state of the scanner is Online.
· Example
Select Automation > Endpoint Business > EPS Management > Scan Config and view the state of scanner.
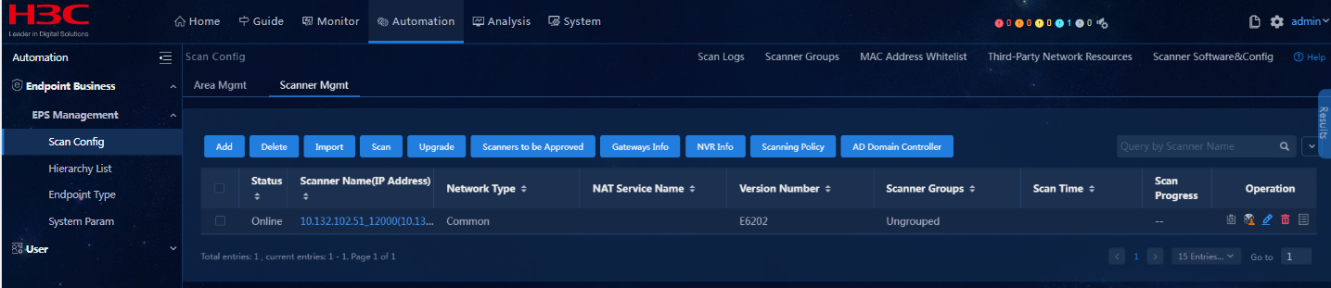
Inspection report
After inspecting EPS, create an inspection report according to the table below.
Table 13 EPS and cluster inspection report
|
Targets |
Instruction |
Result |
Remarks |
|
Pod running state |
Execute the command in the background to view the state of eps pod. Normally, the state is Running. Mark the pods that have rebooted more than 10 times as risks. |
□ Normal □ Abnormal |
|
|
License information |
On the License Management page, confirm the configuration of the license server and required authorization and usage status of EPS. |
□ Normal □ Abnormal |
|
|
Web page response |
Access all the endpoint pages to verify that the system can load the pages within 5 seconds. |
□ Normal □ Abnormal |
|
|
Scanner management |
Access the scanner configuration page to verify that the state of the scanner is Online. |
□ Normal □ Abnormal |
|
WSM inspection guide
Topology
· Check item
Functionality of WSM topology page
· Targets
Functionality of WSM topology page.
· Pass criteria
Select Automation > Campus Network > Wireless Device > View Topology to access the Wireless Topology page. The Wireless Topology menu is available and the data output is normal.
· Example
Click Wireless Topology to verify that the page can open and the data output is normal.
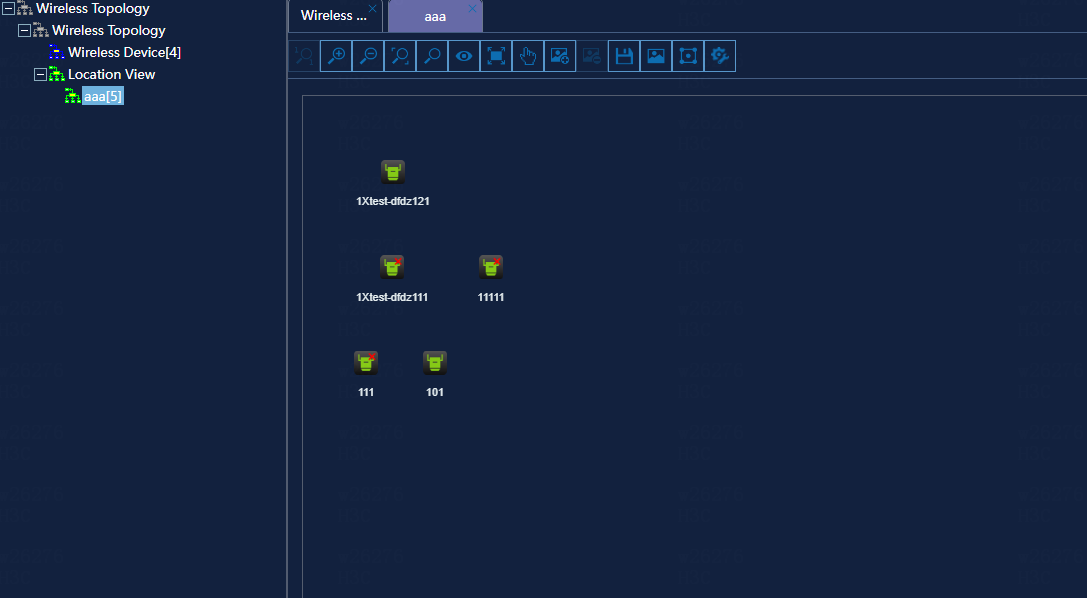
Monitor list
· Check item
WSM product menus and submenus under Monitor List
· Targets
WSM product menus and submenus under Monitor List
· Pass criteria
The Monitor List is available, which contains the Network submenu. The Fit APs tab is available on the Network page and the data output is normal.
· Example
Select Monitor and verify that the Network submenu exists under Monitor List. Verify that the Fit APs tab is available on the Network page and the data output is normal.
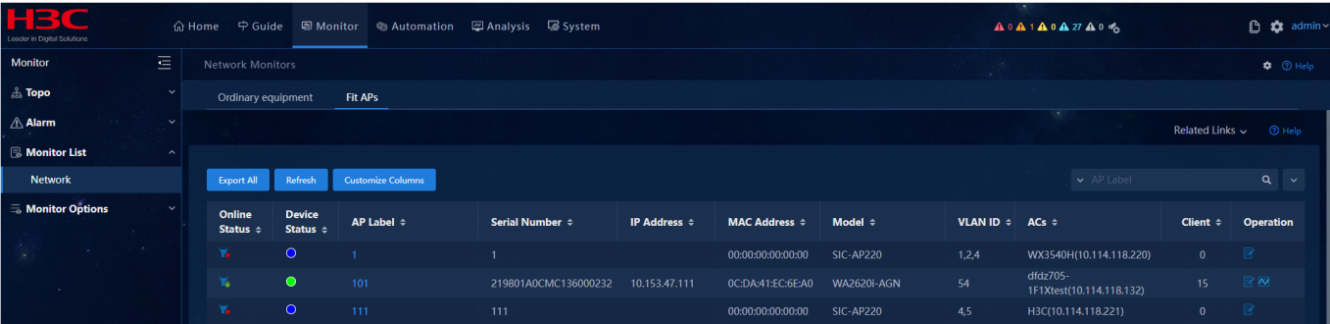
Campus network
· Check item
WSM menus and pages under Automation
· Targets
WSM menus and pages under Automation.
· Pass criteria
Select Automation > Campus Network > Wireless Device, and when you click Related Links, the following submenus are displayed: Fit APs, Fat APs, Clients, Radios, WLAN Services, AP Access Ports, Configuration, Location View, View Topology, GIS View, Spectrum Guard, Strategy, WLAN Security, Cloud AP, and App Analysis.
· Example
Click Related Links to verify that the following submenus are displayed: Fit APs, Fat APs, Clients, Radios, WLAN Services, AP Access Ports, Configuration, Location View, View Topology, GIS View, Spectrum Guard, Strategy, WLAN Security, Cloud AP, and App Analysis. Verify that the data is displayed normally. Then click each link respectively to verify that the page can open and the data can be displayed normally.
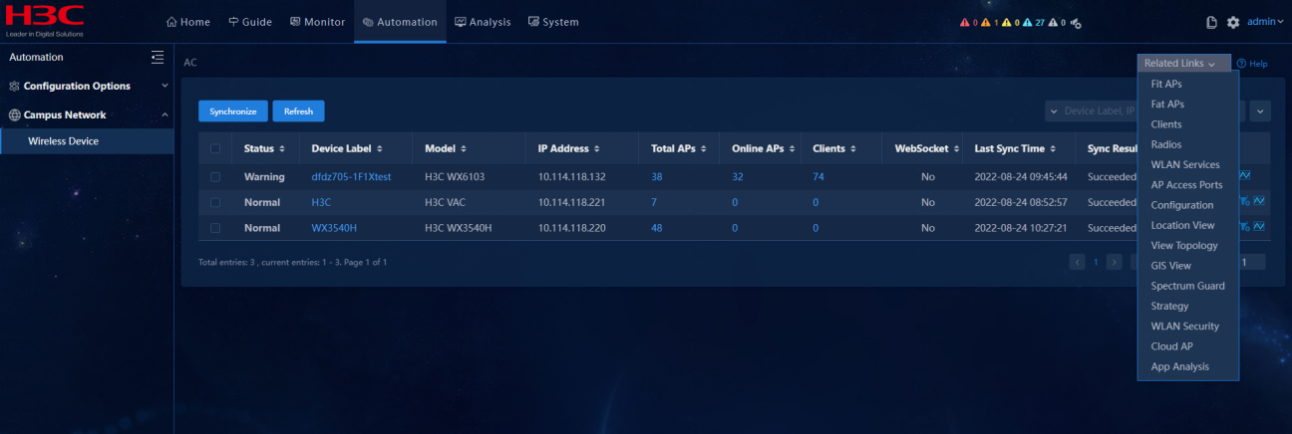
Analysis (analyzer not installed)
· Check item
Display of WSM product menus and page under Health Analysis
· Targets
Display of WSM product menus and page under Health Analysis.
· Pass criteria
The Analysis menu contains the following submenus: Health Analysis, Fault Analysis, and Assurance & Optimization. Among these submenus, Health Analysis further contains Health Overview, Network Analysis, and Clients Analysis. Fault Analysis further contains Problem Center and Wireless Diagnosis; Assurance & Optimization further contains AI Analytics and Wireless Optimization.
· Example
Click Analysis on the left to verify that it contains the following submenus: Health Analysis, Fault Analysis, and Assurance & Optimization. Verify that the relevant submenus can open and the data is displayed normally.
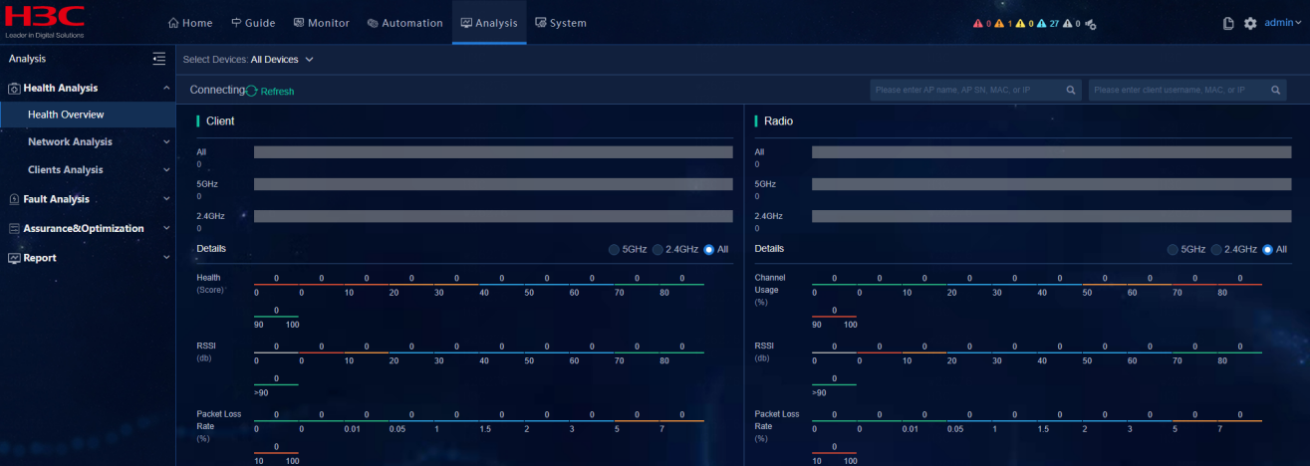
Communication among components
· Check item
Communication between foreground and background of WSM
· Targets
Whether the system configuration is validated.
· Pass criteria
Select Automation > Campus Network > Wireless Device, and click Service Policy Management in the AC list. Select a policy and click Bind Service Policy to bind the service to Radio.
· Example
Select Automation > Campus Network > Wireless Device, and click Service Policy Management in the AC list. Select a policy and click Bind Service Policy to bind the service to Radio.
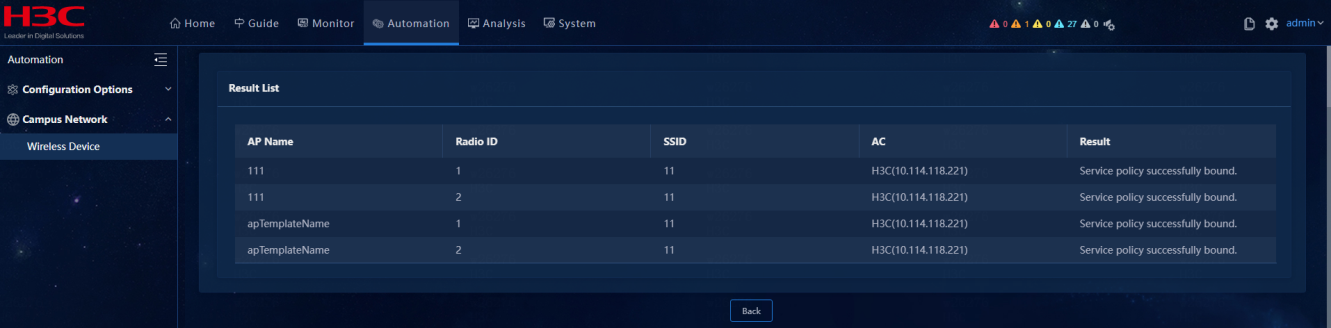
WSM log information
· Check item
Run logs and operation logs of WSM
· Targets
Run logs and operation logs of WSM.
· Pass criteria
Select System > Log Management > Running Logs Entries and verify that operation logs for the current day and for the prior days are available.
· Example
Select System > Log Management > Running Logs Entries and search for WSM logs. Verify that operation logs for the current day and for the prior days are available.
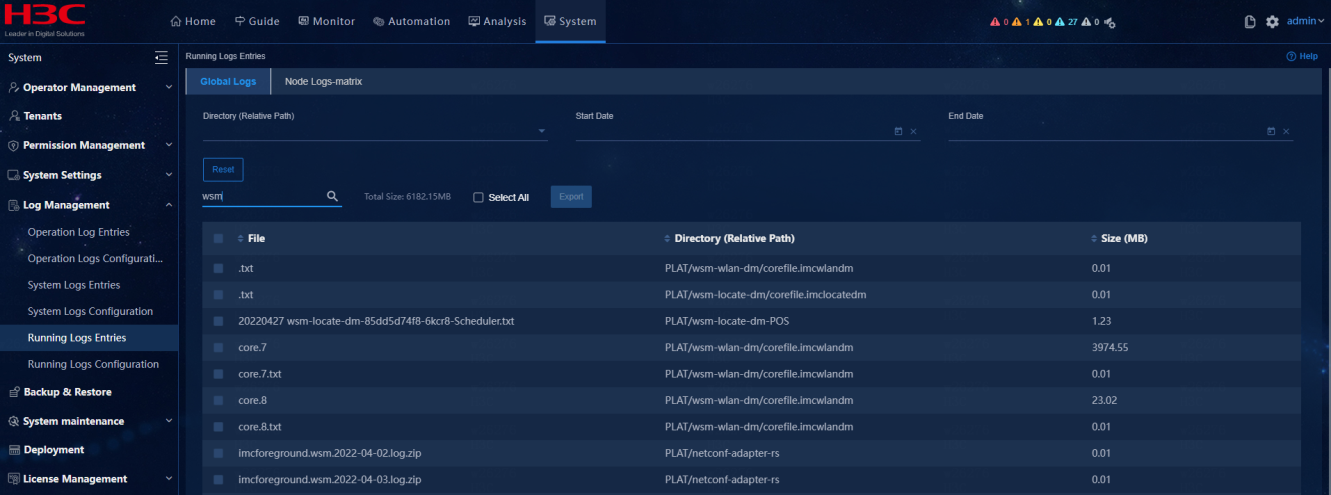
License information of WSM
· Check item
License information of WSM
· Targets
License information of WSM.
· Pass criteria
The license quantity is sufficient and the license state is normal for the three licenses (UCENTER-WLAN, AD-CAMPUS-W-AP-LIC, AD-CAMPUS-W-LOC-LIC).
· Example
Select System > License Information to verify that the license quantity is sufficient and the license state is normal for the three licenses (UCENTER-WLAN, AD-CAMPUS-W-AP-LIC, AD-CAMPUS-W-LOC-LIC).
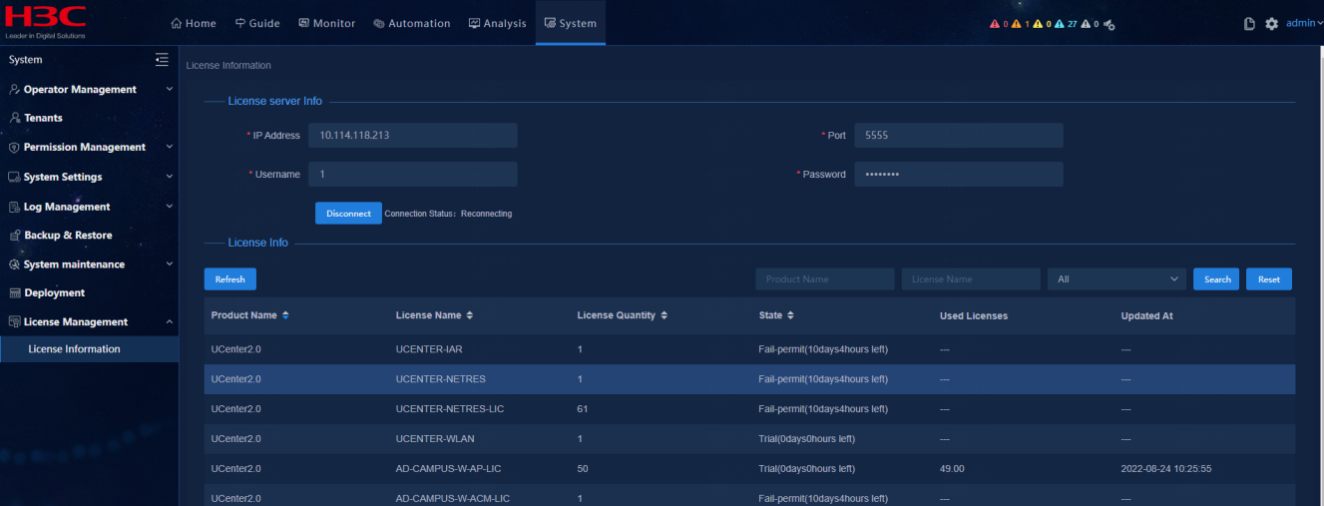
Background deployment of WSM
· Check item
Background deployment of WSM
· Targets
Background node deployment of WSM.
· Pass criteria
All nodes of WSM work properly.
|
Pod Name |
Remarks |
|
wsm-ui wsm-rs |
Wireless foreground service |
|
wsm-influx-node-ss-0 wsm-influx-proxy |
Influx node Database proxy node |
|
wsm-wlan-dm |
Wireless background service |
|
wsm-locate-dm wsm-locatemgr-dm |
Wireless positioning service |
|
netconf-adapter-dm |
Adapter background service |
|
netconf-adapter-rs |
Adapter foreground service |
· Example
Access the WSM component background, and execute the kubectl get pod -n service-software | grep wsm command to view the deployment of each microservice of WSM.
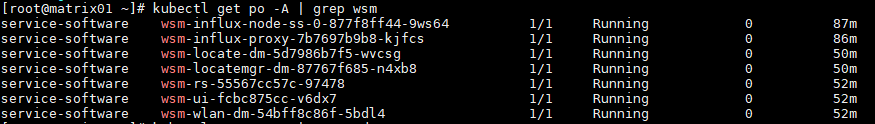
Access the WSM component background, and execute the kubectl get pod -n service-software | grep adapter command to view the deployment of each microservice of Adapter.
![]()
Running state of background of WSM
· Check item
Running state of background nodes of WSM
· Targets
Running state of background nodes of WSM.
· Pass criteria
The state of background node of WSM is Running, and pods in the state of Waiting, Terminated ImagePullBackOff, and CrashLoopBackOff (the container exited and kubelet is trying to restart the container) do not exist. The reboot count for each pod is less than 10.
· Example
Access the background of WSM component and execute the kubectl get pods -o wide -A | sort -nr -k5 |grep wsm command to verify that the state of WSM node is Running. Mark the pods that have rebooted more than 10 times as risks, and list the top 10 pods by reboot count.
![]()
For the pods that have rebooted more than 10 times, check whether there are sufficient resources available for the pods (CPU/memory). If resources are sufficient, contact the R&D engineers to locate the issues.
Inspection report
Table 14 WSM inspection report
|
Targets |
Instruction |
Result |
Remarks |
|
Topology |
Select Automation > Campus Network > Wireless Device > View Topology to access the Wireless Topology page. Click Wireless Topology to verify that the page can open and the data output is normal. |
□ Normal □ Abnormal |
|
|
Monitor list |
Click Monitor to verify that Monitor List exists on the left and contains the Network submenu. Verify that the Fit APs tab is available on the Network page and the data output is normal. |
□ Normal □ Abnormal |
|
|
Campus network |
Select Automation > Campus Network > Wireless Device, and click Related Links to verify that the following submenus are available: AC, SSID, Radio Frequency, Strategy, and AC Configuration. Verify that the data is displayed normally on relevant pages. Click the hyperlink in the upper right corner of AC page. Then click each link respectively to verify that the page can open and the data can be displayed normally. |
□ Normal □ Abnormal |
|
|
Analysis |
Click Analysis on the left to verify that it contains the following submenus: Health Analysis, Fault Analysis, and Assurance & Optimization. Verify that the data can be displayed normally. |
□ Normal □ Abnormal |
|
|
Communication among components |
Select Automation > Campus Network > Wireless Device, and click Service Policy Management in the list. Select a policy and click Bind Service Policy to bind the service to Radio. |
□ Normal □ Abnormal |
|
|
WSM log information |
Select System > Log Management > Running Logs Entries and search for WSM logs. Verify that operation logs for the current day and for the prior days are available. |
□ Normal □ Abnormal |
|
|
License information of WSM |
Select System > License Information to verify that the license quantity is sufficient and the license state is normal for the three licenses (UCENTER-WLAN, UCENTER-WLAN-LIC, AD-CAMPUS-W-AP-LIC). |
□ Normal □ Abnormal |
|
|
Background deployment of WSM |
All nodes of WSM are available. |
□ Normal □ Abnormal |
|
|
Running state of background of WSM |
Access the background of WSM component and execute the kubectl get pods -o wide -A | sort -nr -k5 |grep wsm command to verify that the state of WSM node is Running. Mark the pods that have rebooted more than 10 times as risks, and list the top 10 pods by reboot count. |
□ Normal □ Abnormal |
|
OASIS inspection guide
State of Redis cluster
· Check item
State of Redis database
· Targets
Redis database.
· Pass criteria
The Redis PING command returns PONG.
· Example
When the kubectl exec -it -n oasis redis0-0 -- redis-cli -p 6380 PING command is executed, normally PONG is returned. If there is no response or other results are returned, the check result is abnormal.
![]()
Check the state of Mysql cluster
· Check item
State of Mysql database
· Targets
Mysql database.
· Pass criteria
The value of Mysql cluster state is Primary.
· Example
When the kubectl exec -it -n oasis mariadb-ss-0 -- mysql -umonitor -pmonitor -e"show status like 'wsrep_cluster_status'\G" command is executed, normally the value is Primary.
If there is no response or other results are returned, the check result is abnormal.
![]()
Check the state of Mongo cluster
· Check item
State of Mongo database
· Targets
Mongo database.
· Pass criteria
The check command returns value 1.
· Example
When the kubectl exec -it -n oasis mongos0-0 -- mongo --authenticationDatabase admin -uread -pread --eval "printjson(db.adminCommand('listDatabases'))"|grep ok command is executed, normally the result is "ok": 1.
If there is no response or the result is "ok": 0, the check result is abnormal.
![]()
Check the state of Rabbitmq cluster
· Check item
State of Rabbitmq cluster
· Targets
Rabbitmq cluster.
· Pass criteria
Check the number of running nodes. The number is 1 for a cluster with a single master, and 3 for a cluster with three masters.
· Example
Execute the kubectl exec -it -n oasis rabbitmq-node-1-0 -- rabbitmqctl cluster_status command to check the number of running nodes.
Normally, the number of running nodes is 1 for a Matrix cluster with a single master, and 3 for a Matrix cluster with three masters.
If the number of running nodes is less than the number of masters in a Matrix cluster, the check result is abnormal.
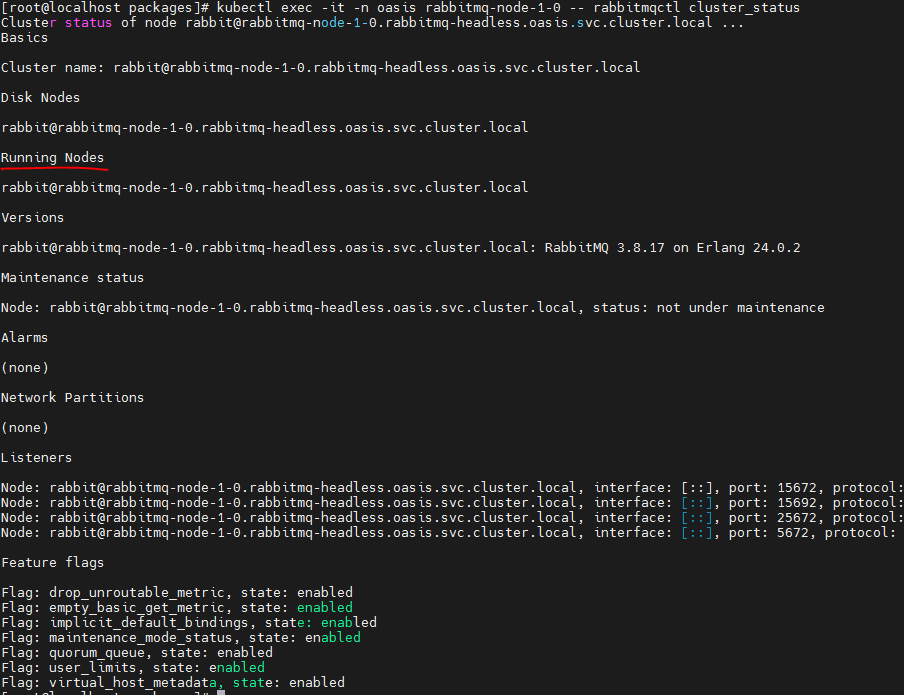
Check the status code returned by the microservice interface
· Check item
Value returned by the microservice interface
· Targets
Microservice websocket/apmonitor/stamonitor/devmonitor.
· Pass criteria
The interface returns the status code 200.
· Example
Execute the following command. Normally, the interface returns the status code 200. If there is no response or other status codes are returned, the check result is abnormal.
curl -sIL -k -w "%{http_code}\n" -o /dev/null https://127.0.0.1:17443/v3/base/userauth?
kubectl exec -it -n oasis mariadb-ss-0 -- curl -sIL -k -w "%{http_code}\n" -o /dev/null http://digest:3012/v3/stamonitor
kubectl exec -it -n oasis mariadb-ss-0 -- curl -sIL -k -w "%{http_code}\n" -o /dev/null http://digest:3012/v3/devmonitor
kubectl exec -it -n oasis mariadb-ss-0 -- curl -sIL -k -w "%{http_code}\n" -o /dev/null http://digest:3012/v3/apmonitor
Inspection report
|
Targets |
Instruction |
Result |
Remarks |
|
Check the state of Redis cluster |
The Redis PING command returns PONG. |
□ Normal □ Abnormal |
|
|
Check the state of Mysql cluster |
The value of Mysql cluster state is Primary. |
□ Normal □ Abnormal |
|
|
Check the state of Mongo cluster |
The check command returns value “ok”:1. |
□ Normal □ Abnormal |
|
|
Check the state of Rabbitmq cluster |
The number of running nodes is 1 for a Matrix cluster with a single master, and 3 for a Matrix cluster with three masters. |
□ Normal □ Abnormal |
|
|
Check the status code returned by the microservice interface |
The interface returns the status code 200. |
|
|
Analyzer inspection guide
Overview
This part will describe the SeerAnalyzer inspection service of AD 6.2 solution. An inspection involves checking the foreground, background and network devices of an analyzer.
Inspection guide for SeerAnalyzer front pages
· Check item
User analysis page
· Targets
User analysis page.
· Pass criteria
Click Analysis on the left to verify that it contains the following submenus: Health Analysis > Health Overview, User Analysis, Application Analysis, and Network Analysis; Diagnosis Analysis > Problem Center, Wireless Diagnosis; Assurance & Optimization > AI Analytics, Wireless Optimization. These submenus further contain User Health, Application Health, Network Health, and Changes Analysis. The data output is normal.
· Example
Click submenus under Analysis one by one to verify that the data output of the page is normal. The Analysis menu contains the following pages: Health Overview, User Health, Application Health, Network Health, and Changes Analysis.
Health overview
In the campus scenario, the Health Overview page displays the campus overview and the campus topology, giving an overall picture of the campus.
The Overview tab displays the health status of the network, users, and apps, and classifies the campus network issues to allow users to keep track of the network health state and its main issues.
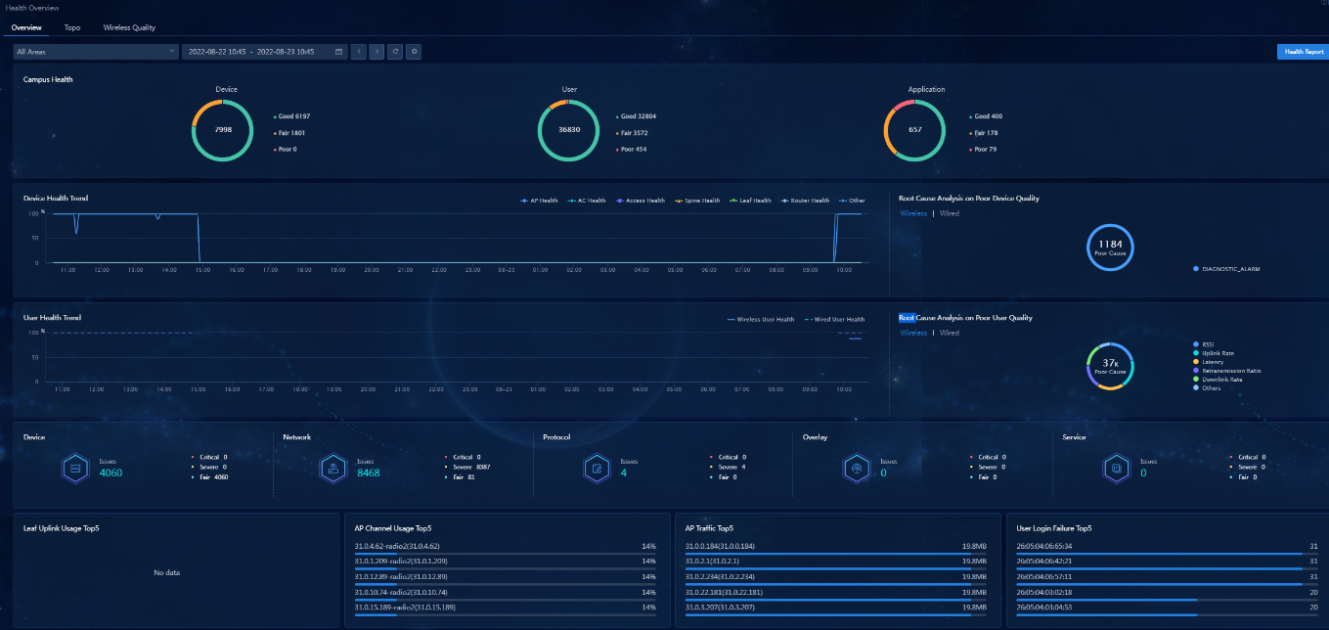
The Topo tab displays the topology of devices in the campus network and area health analysis from the four perspectives below: Physical Topo, Map Topology, Service Topology, and Area Overview.
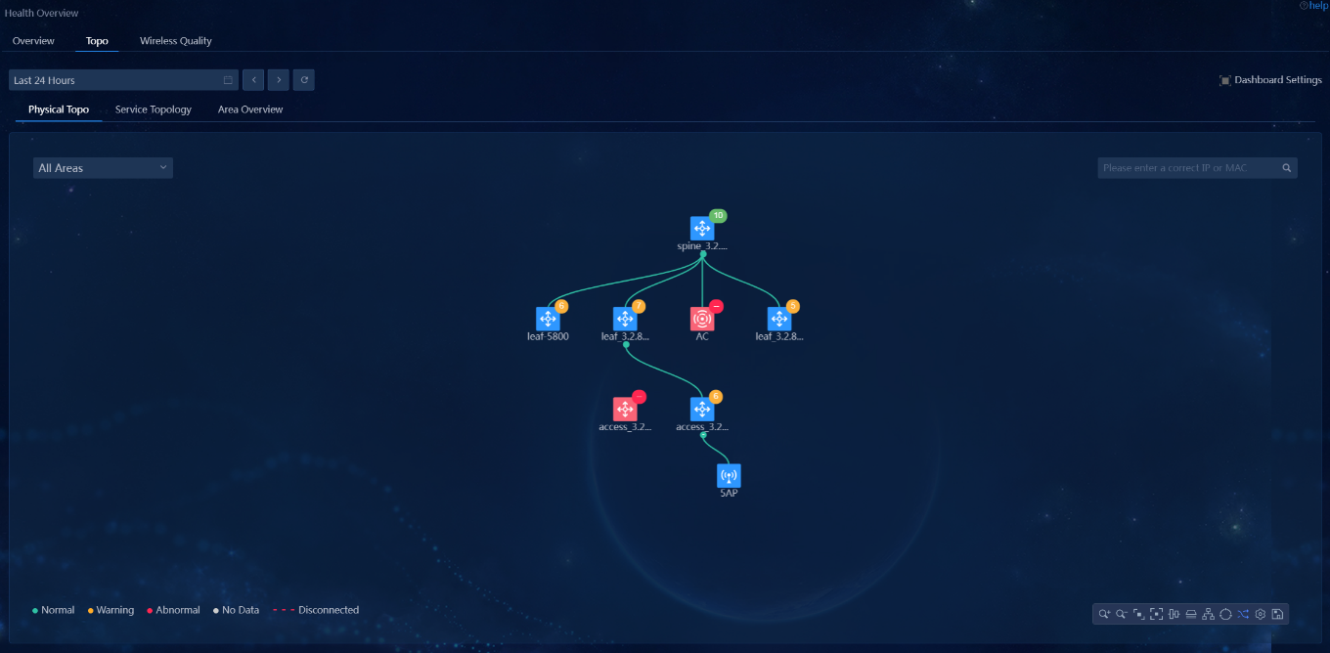
User health
The user health inspection mainly involves checking wireless health, health trend, and online endpoint distribution. Some users are allowed to check user health, user issues, and event state.
Data generation condition: Search "user" tasks in Analysis Options > Task Management: Analysis Task, and start three scheduled tasks Wireless Health analysis, Wired Health analysis, and User Statistics.
User health statistics:
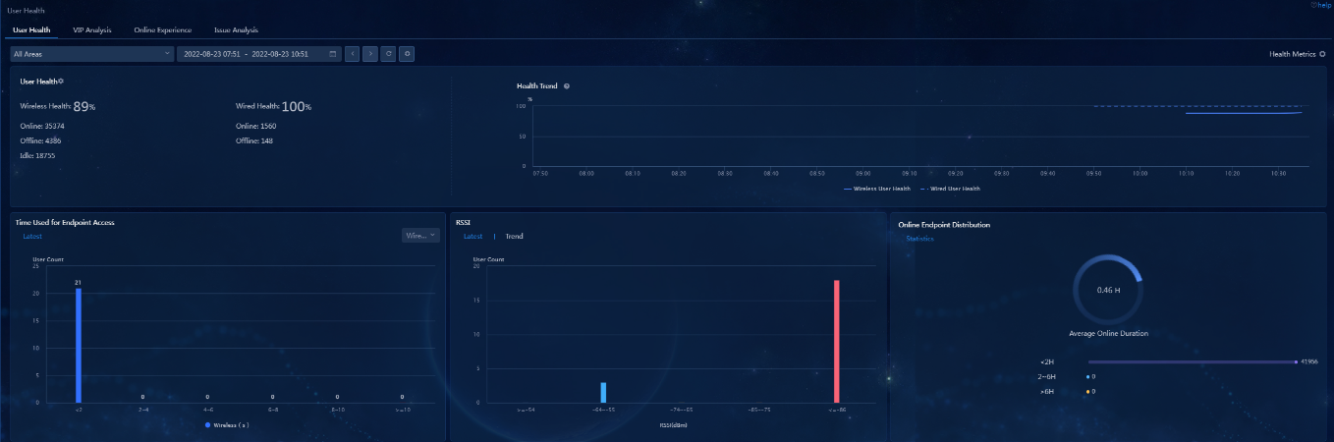
Drill down the user list to view the health details of a user:
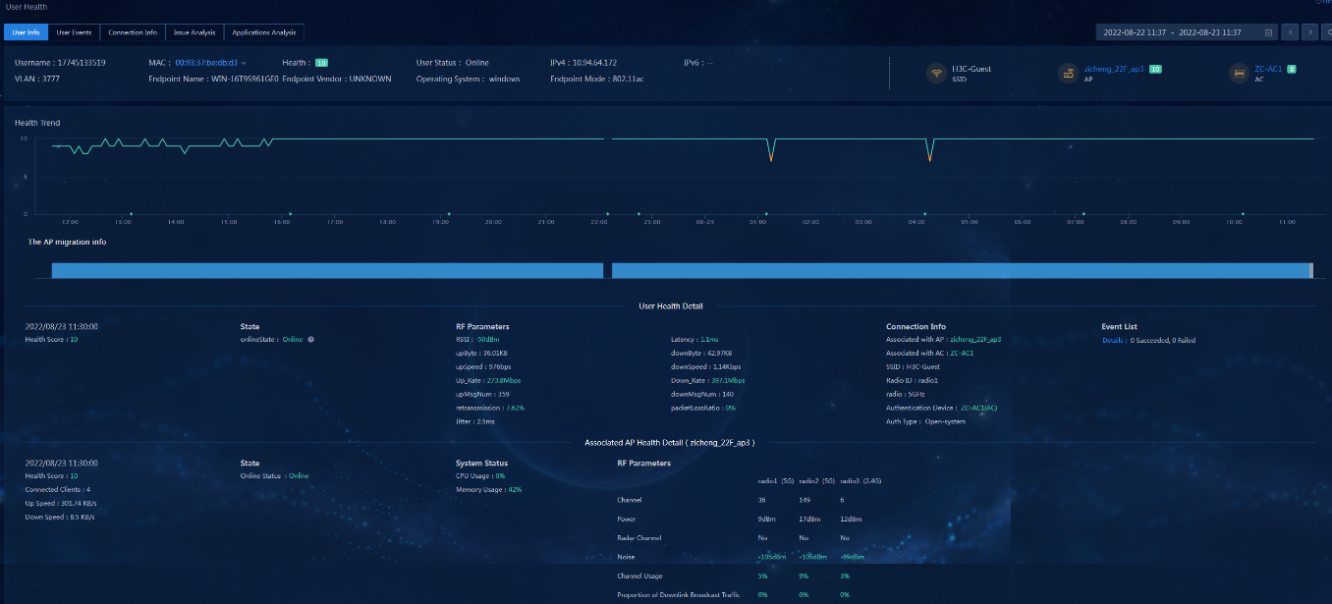
Application health
If the application analysis has been properly configured (such as wireless DPI application identification, SIP audio and video, and inqa quality analysis), and the application session information is provided accordingly, then users can access the application statistics analysis on the Application Health page, including the number of applications, traffic, delay, jitter and packet loss.
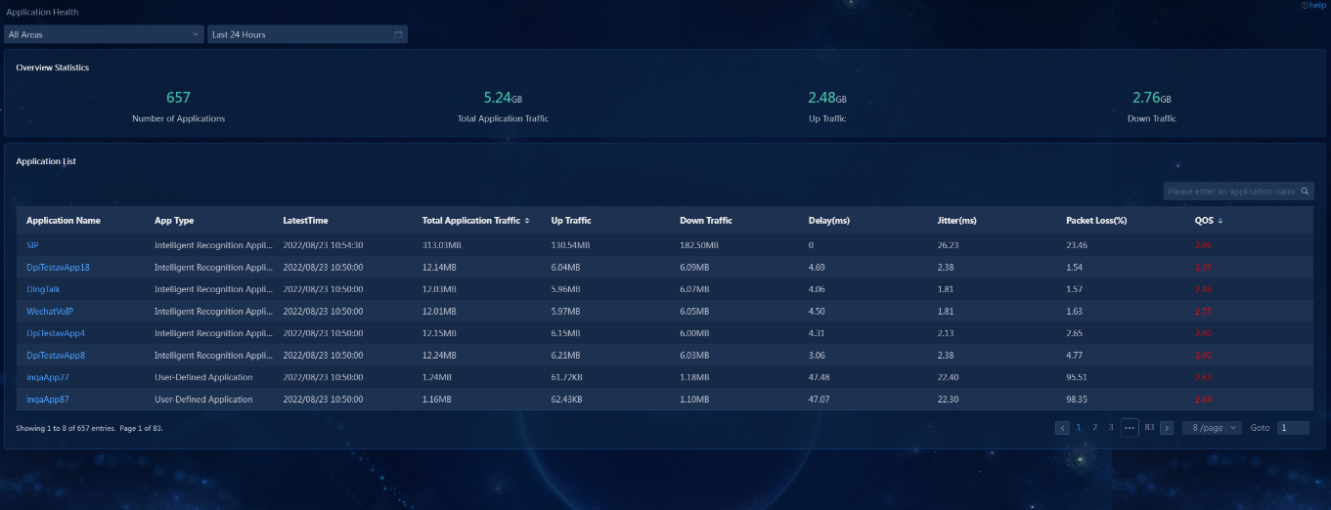
SIP and H323 in the list are audio and video applications based on SIP and H323 protocols. Click to view quality analysis for audio and video applications.
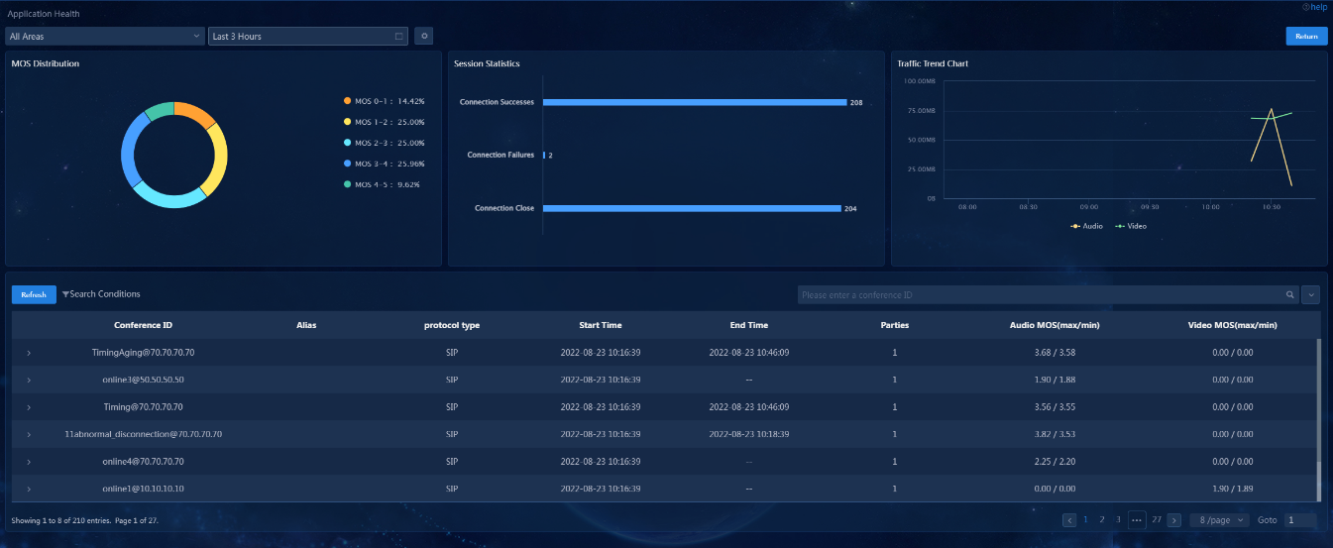
MOS Distribution displays the ratio of distribution range of MOS values over a specific time period. Distribution of MOS values falls into 5 categories, which are Mos0-1, Mos1-2, Mos2-3, Mos3-4, and Mos4-5 respectively. The MOS range is (0 < MOS ≤ 5), and the greater the value, the better the quality.
Session Statistics displays the number of SIP connections, the number of connection failures, and the number of closed connections generated over a specific time period.
Network health
The network health inspection mainly involves checking the output of the health trend curve and whether the number of online devices (good, fair, poor) and the number of offline devices in the network health curve match the network health histogram.
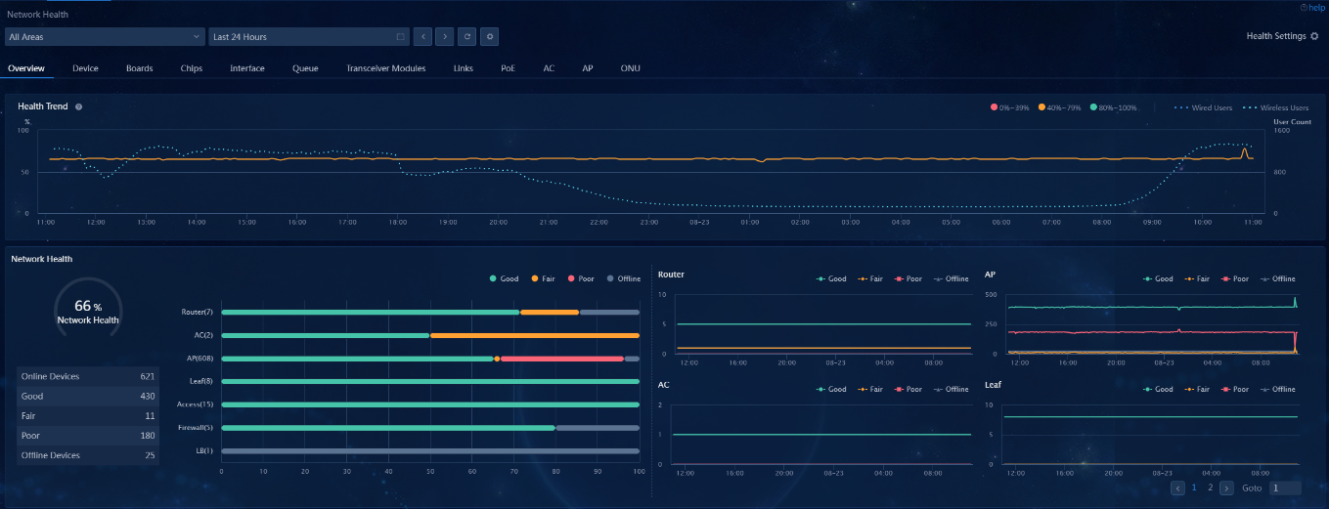
Information of wireless AP: online/offline AP comparison and trend, AP channel usage distribution and trend, top 10 APs with poor health, top 10 APs by uplink/downlink traffic rate, top 10 APs by attached endpoints, and top 50 AP user onboarding failure.
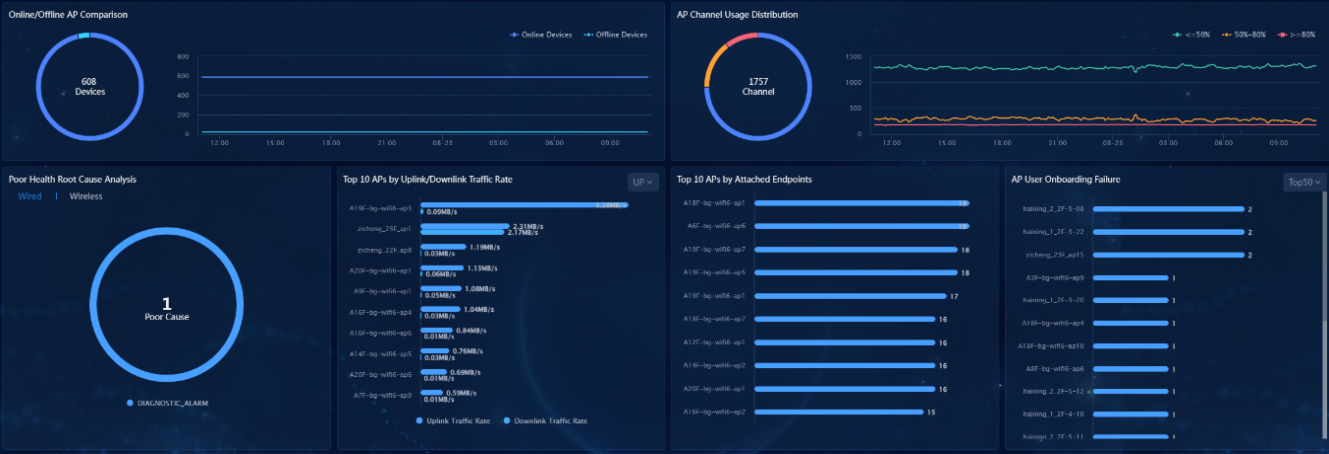
By clicking the device name in the following list, users can view the device details:
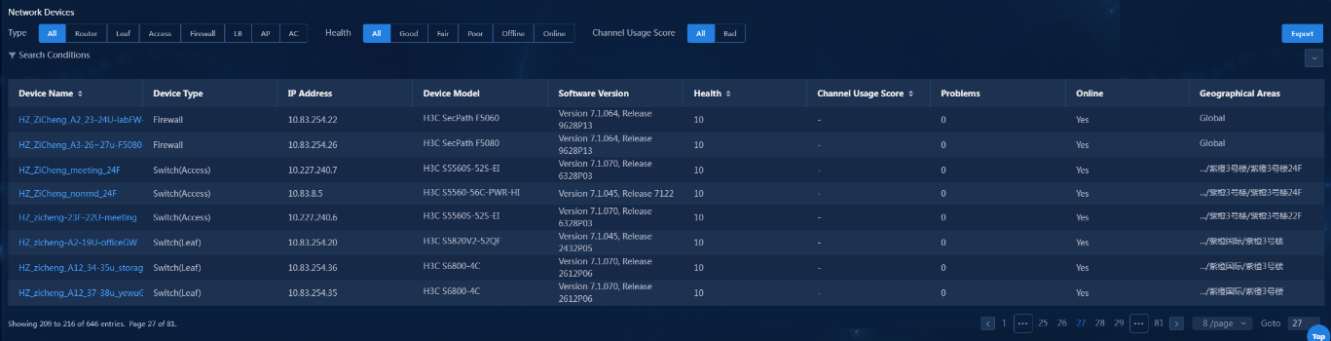
Whether the health trend chart on the details page is normal and the device details are always floating; whether the list of device issues is displayed normally; and whether the topology of the device in the network is displayed correctly.
Changes analysis
The changes analysis inspection mainly involves checking whether relevant information exists in the list of changed devices when the device is configured or when the entry data changes; whether the data displayed in the Venn diagram (overlapping circle chart) matches the change comparison details; clicking Historical Network Change Trend to check whether the list of changed devices is correct; percentage of changed devices, top 10 devices with most changes, and top change items over a specific time period.
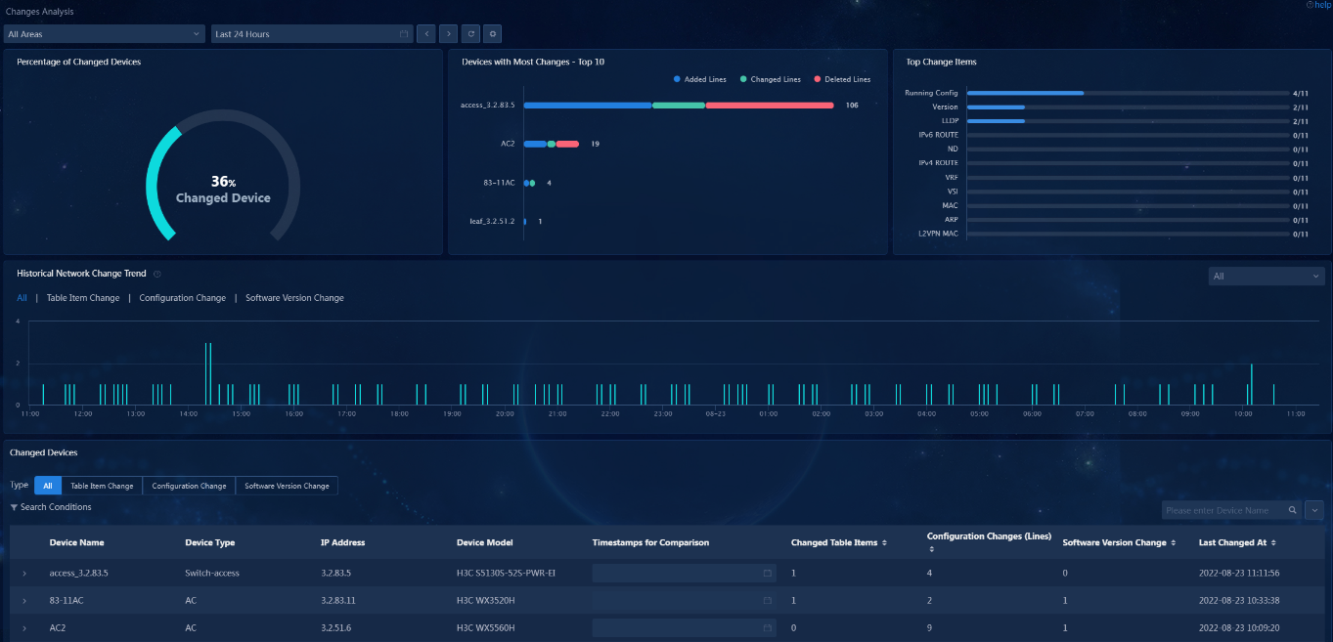
Expand a device in the list of changed devices to view the Venn diagram of data comparison (overlapping circle chart) for the device, in which the number on the left indicates the number of rows deleted, the number on the right indicates the number of rows added, and the number in the middle indicates the number of similar rows. Please note that the modification operation is the sum of delete and add operations:
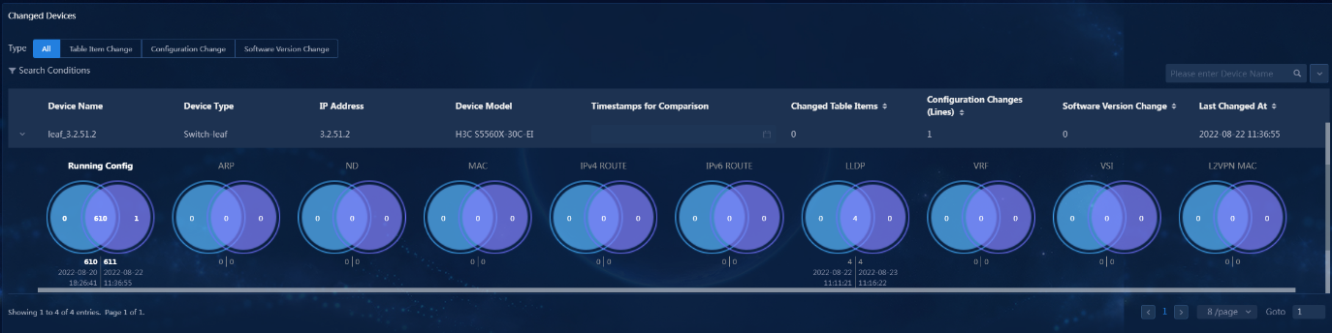
Problem center
· Check item
Functionality of the Problem Center page
· Targets
Functionality of the Problem Center page.
· Pass criteria
The submenus Diagnosis Analysis > Problem Center exist and contain the Overview, Device, Network, Protocol, Overlay, and Service tabs. The data output is normal.
· Example
Select Diagnosis Analysis > Problem Center and click the tabs below to verify that the data output is normal.
On the Problem Center page, faults are classified in terms of Device, Network, Protocol, Overlay, and Service.
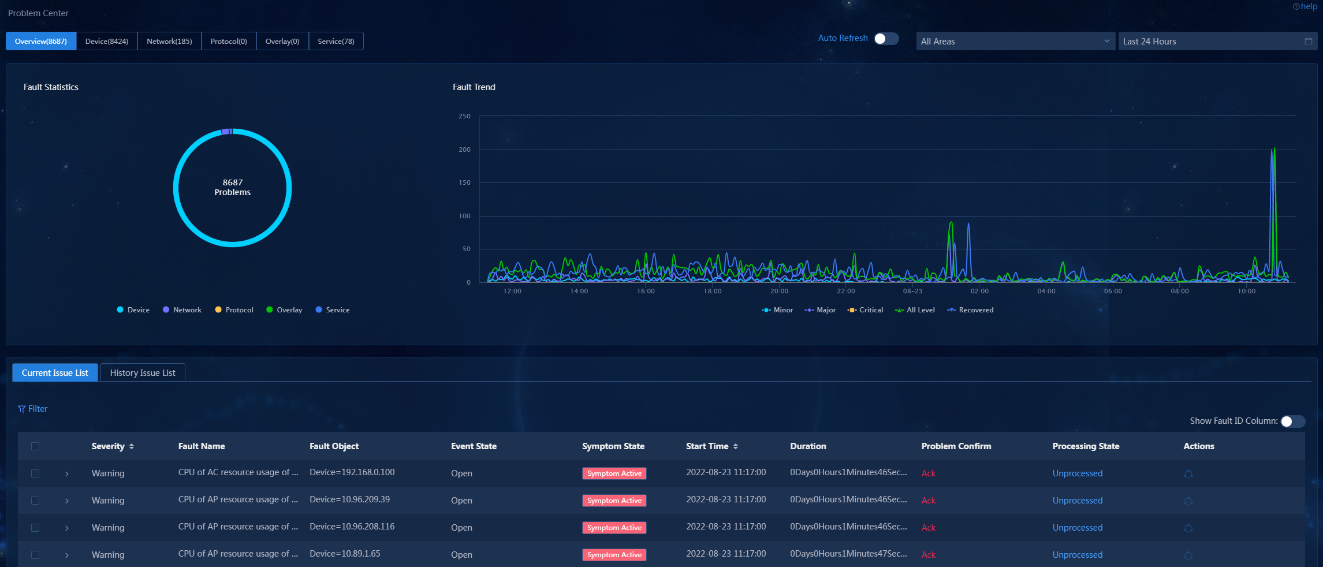
On the Problem Center page, you can view the fault statistics and fault trend (by severity).
Task management
· Check item
Functionality of the Task Management page
· Targets
Functionality of the Task Management page.
· Pass criteria
The Analysis Options > Task Management menus are available and the data output is normal.
· Example
Select Analysis Options > Task Management to verify that the data output is normal.
On the Task Management page, users can view all the analysis tasks and collection tasks.
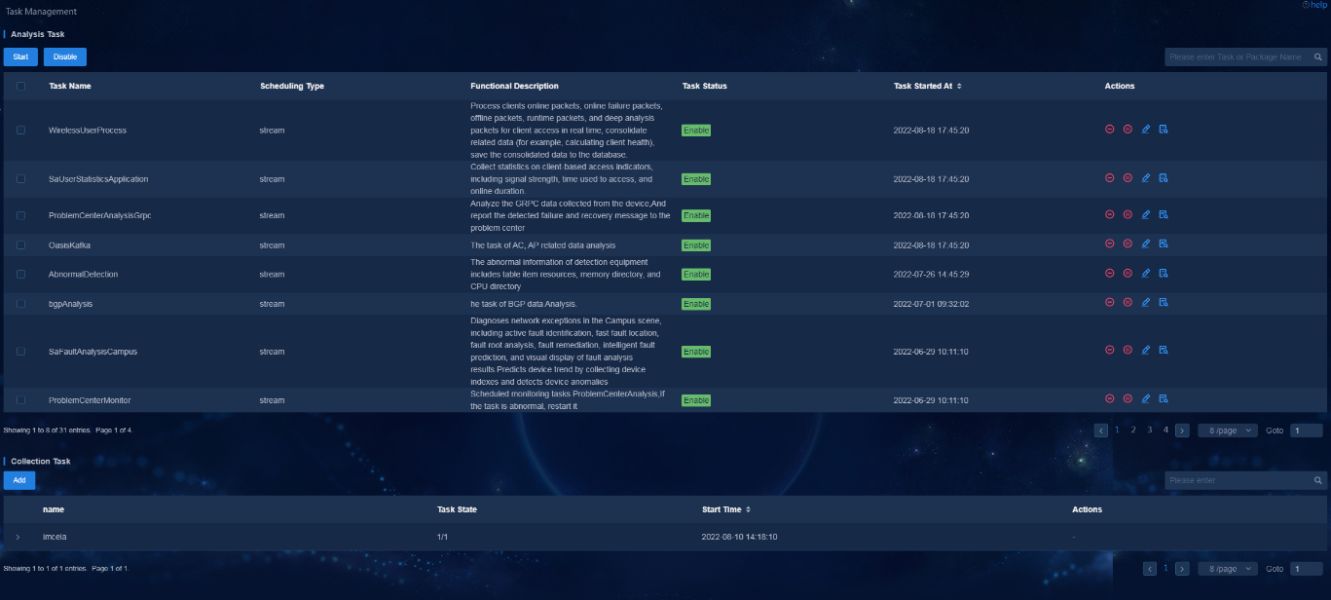
Inspection guide for SeerAnalyzer background
Please note that operations may vary depending on scenarios for some critical processes and services in the background.
Check the system CPU and memory
· Check item
CPU usage and memory usage of the host nodes
· Targets
CPU usage and memory usage of each node.
· Pass criteria
The CPU usage and memory usage of each node do not exceed 80%.
· Example
Check the CPU usage and memory usage of each node.
Log in to the background of each node of the analyzer and execute the free -wh command. Then calculate (total - free)/total*100%, which should not exceed 80%.
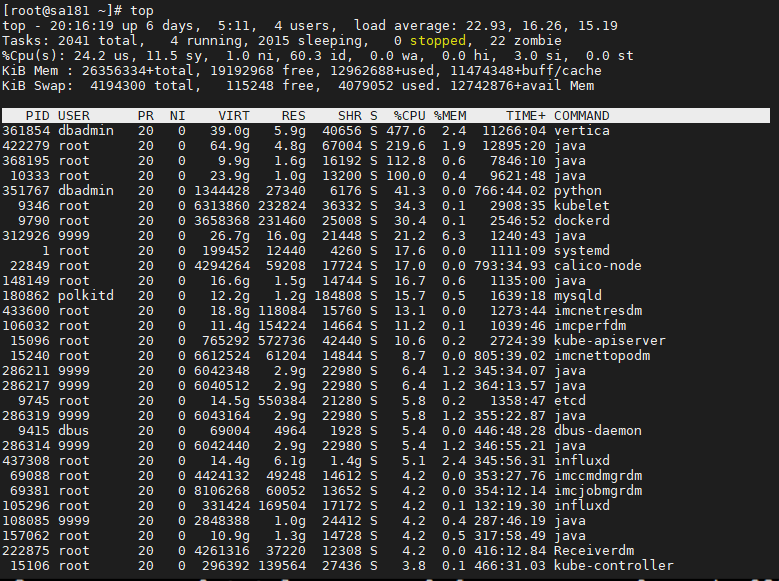
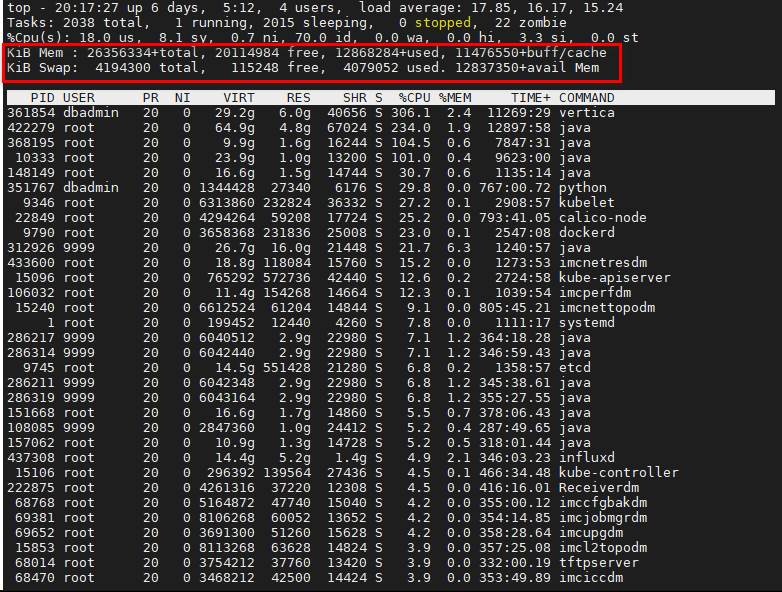
Check the system disk
· Check item
Analyzer installation directories
· Targets
Analyzer installation directories.
· Pass criteria
Execute the df -h | grep /dev command. The directory size does not exceed 80%.
· Example
Execute the df -h | grep /dev command to view the storage volume directories, and check whether the directory size exceeds 80%. If yes, clear unnecessary content in time to free the storage space.
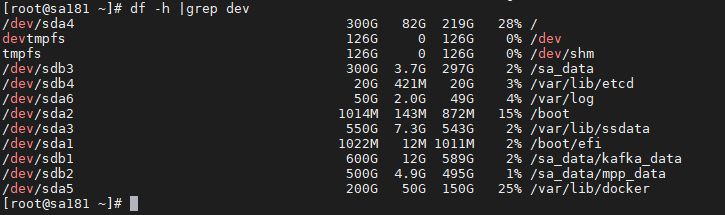
Pay attention to the partition of the three disks where the analyzer is mounted: /sa_data/kafka_data,/sa_data,/sa_data/mpp_data
Check the pod running state
· Check item
Pod running state
· Targets
Pod running state.
· Pass criteria
Execute the df -h | grep /dev command. The directory size does not exceed 80%.
· Example
Execute the kubectl get pod -n sa command and the kubectl get pod -n oasis command to view the state of each pod of the analyzer. Normally, the status (3rd column) is Running or Completed.
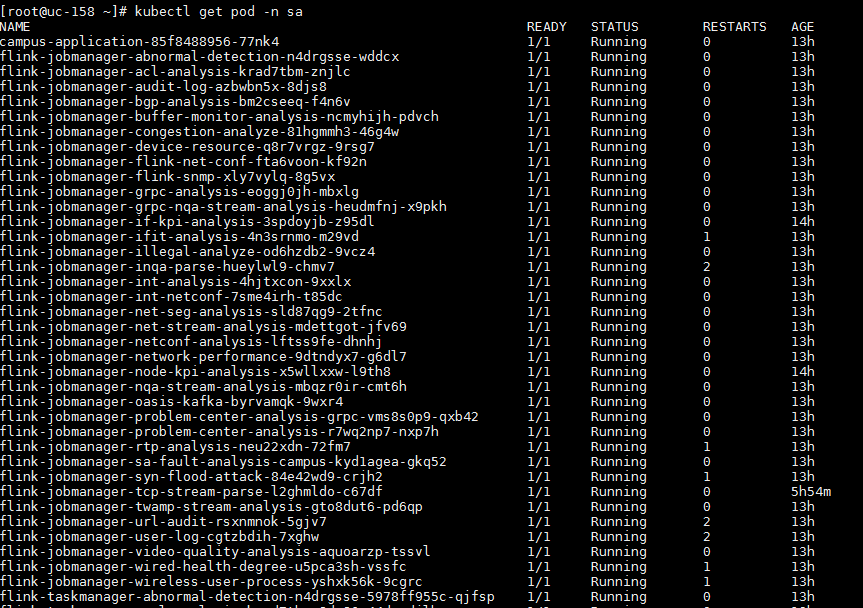
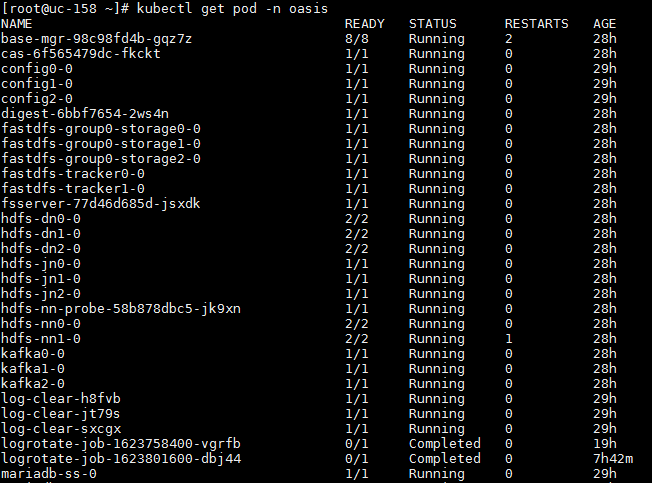
Pay attention to the number of restarts (4th column) and age (5th column).
Attention also goes to the pods like kafka, zookeeper, redis, and vertica. Check kafka status, as shown in the following figure:
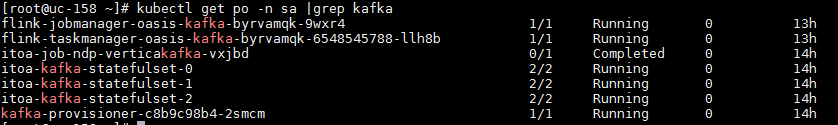
Check if the container platform has abnormal pods.
Select System > System Maintenance > Container Platform to access the Matrix page to view if there are abnormal pods. Pay attention to pods that have rebooted for multiple times.
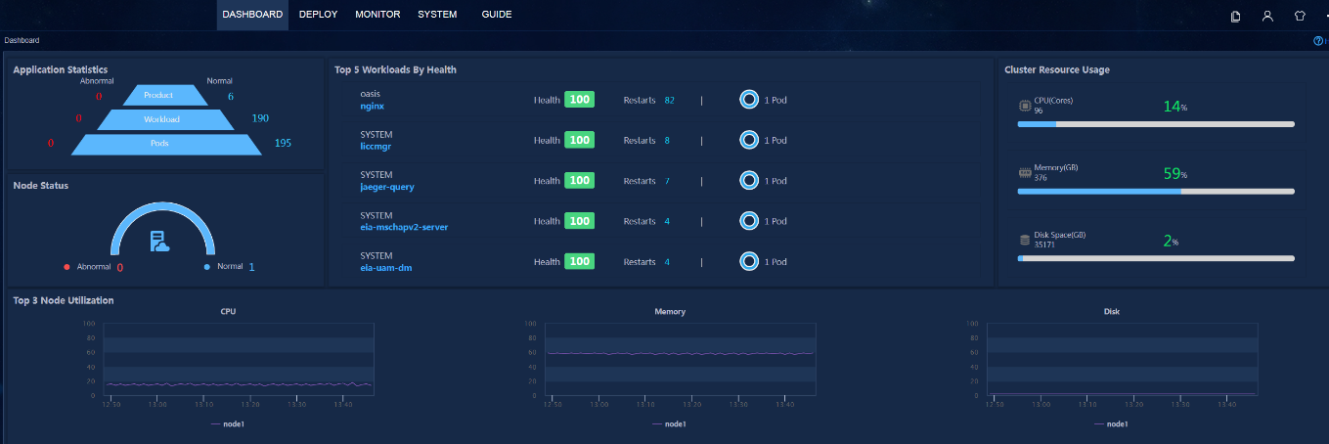
Inspection guide for network devices
Inspection guide for network devices
Check the device configuration
· Check item
Configuration of devices under the management of the analyzer
· Targets
Configuration of devices under the management of the analyzer.
· Pass criteria
The preconditions for data are delivered to devices (enable GRPC, NETCONF, and SNMP).
· Example
Log in to the network devices, and execute the display this command to check whether GRPC, NETCONF, and SNMP are enabled and configured correctly.
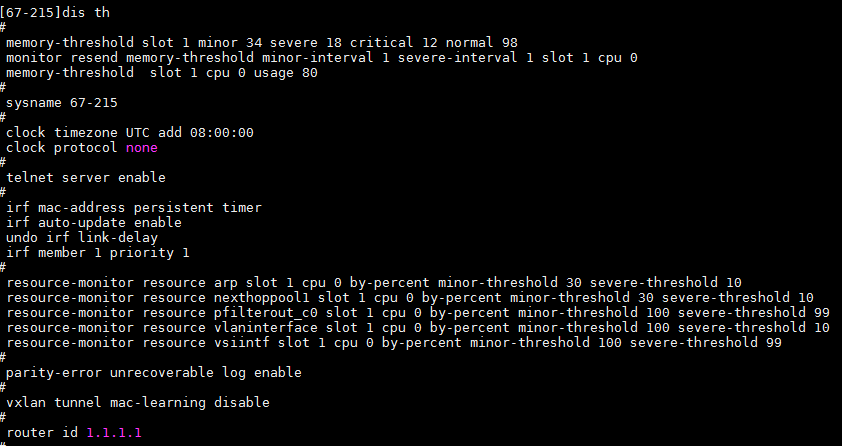
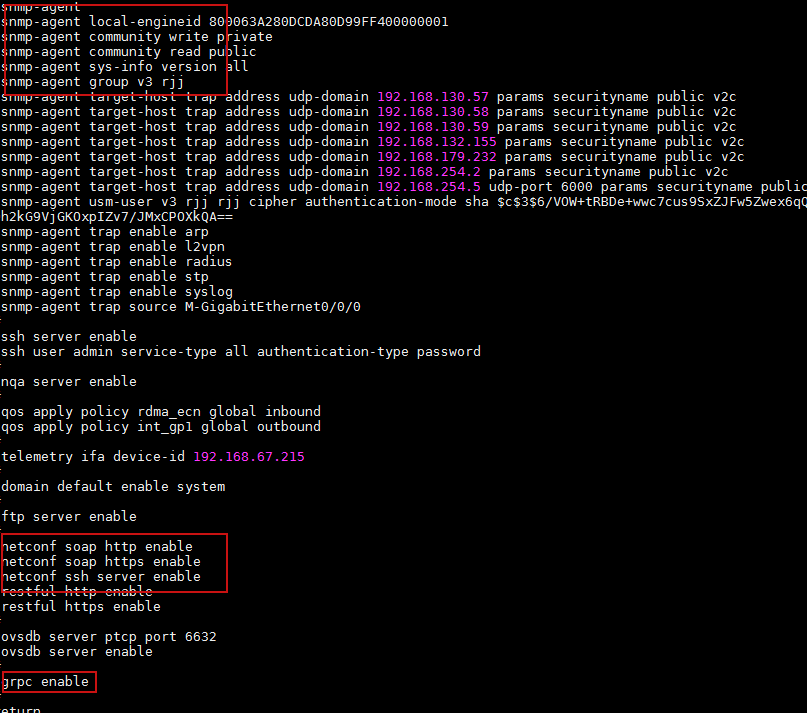
Check the number of connected devices
· Check item
Number of connected devices under the management of the analyzer
· Targets
Number of connected devices under the management of the analyzer.
· Pass criteria
The number of connected devices is normal.
· Example
There is a limit to the number of connected devices. If the number of connected devices is large, the devices may work abnormally, which in turn affects data collection. While performing routine inspection, users can execute the display users and display tcp commands to check the state of device connection.
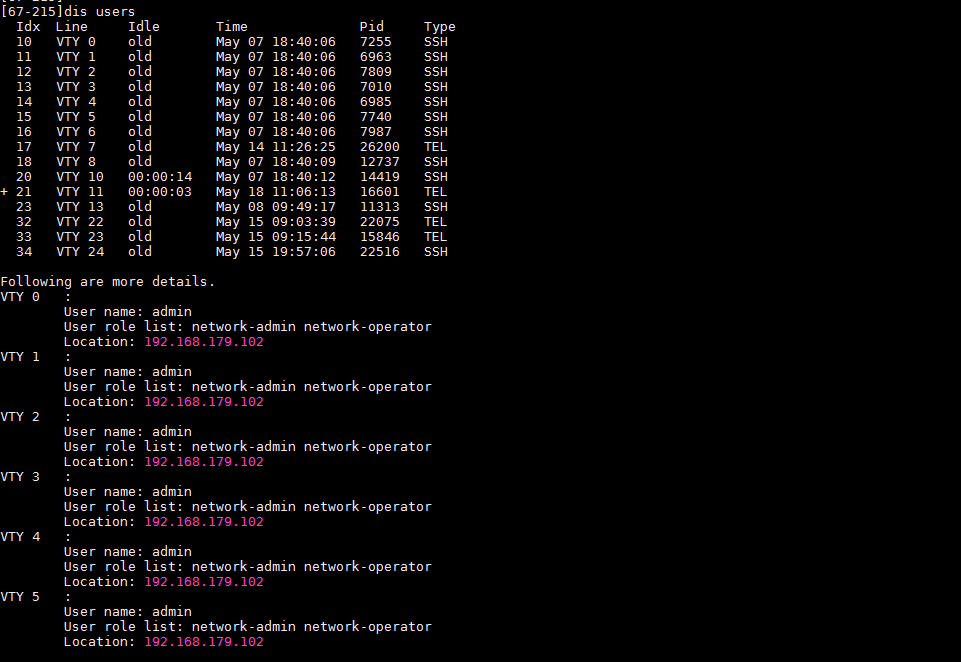
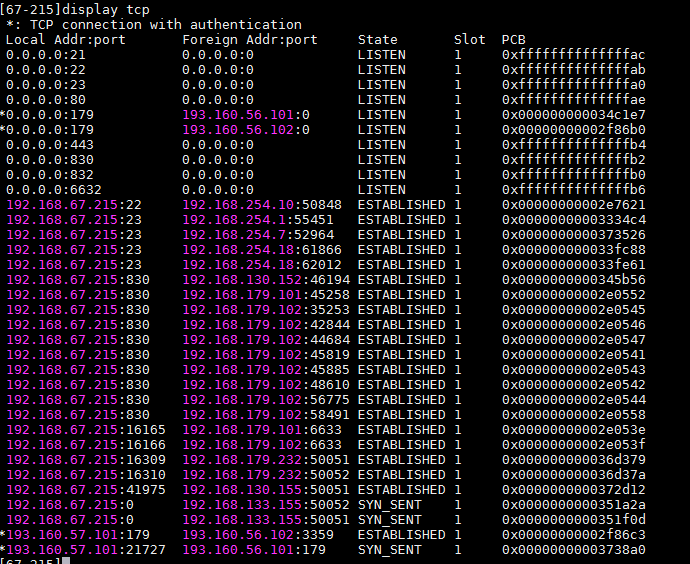
Inspection report
After inspecting the analyzer, create an inspection report according to the table below.
Inspection report for the front pages of the analyzer
Table 15 Inspection report for the front pages of the analyzer
|
Targets |
Instruction |
Result |
Remarks |
|
Campus overview |
Check the global network and topology through the overview function. |
□ Normal □ Abnormal |
|
|
Network analysis |
Check the state of a device through the network analysis function. |
□ Normal □ Abnormal |
|
|
User analysis |
Check the state of a user through the user analysis function. |
□ Normal □ Abnormal |
|
|
Application analysis |
Check the audio and video state through the application analysis function. |
□ Normal □ Abnormal |
|
|
Changes analysis |
Check the faults and trends through the changes analysis function. |
□ Normal □ Abnormal |
|
|
Problem center |
Check the diagnosis tasks through the problem center function. |
□ Normal □ Abnormal |
|
|
Task management |
Check whether the tasks are deployed successfully through the task management function. |
□ Normal □ Abnormal |
|
Inspection report for the background of the analyzer
Table 16 Inspection report for the background of the analyzer
|
Targets |
Instruction |
Result |
Remarks |
|
Host CPU usage |
Log in to the background of the analyzer and check the CPU usage. Normally, the server CPU usage does not exceed 80%. |
□ Normal □ Abnormal |
|
|
Host memory usage |
Log in to the background of the analyzer and check the memory usage. Normally, the memory usage does not exceed 80%. |
□ Normal □ Abnormal |
|
|
Host disk usage |
Log in to the background of the analyzer and check the disk usage. Normally, the disk usage does not exceed 80%. |
□ Normal □ Abnormal |
|
|
Service under the namespace |
Log in to the background of the analyzer and check whether the state of pod under each namespace is normal. |
□ Normal □ Abnormal |
|
Network device inspection report
After inspecting the network devices, create an inspection report according to the table below.
Table 17 Network device inspection report
|
Targets |
Instruction |
Result |
Remarks |
|
Check the device configuration information |
Execute the display this command (see the command manual) to check the configurations of NETCONF, GRPC, and SNMP. |
□ Normal □ Abnormal |
|
|
Number of connected devices |
Execute the display users and display tcp commands (see the command manual) to check whether the number of connected devices is normal. |
□ Normal □ Abnormal |
|
Inspection guide for vDHCP
Inspection guide for vDHCP monitoring
Overview
The U-Center monitoring page displays the pod information in the diagram. On the performance and pods pages, users can get a clear picture of the CPU and memory state of vDHCP pods, as shown below:
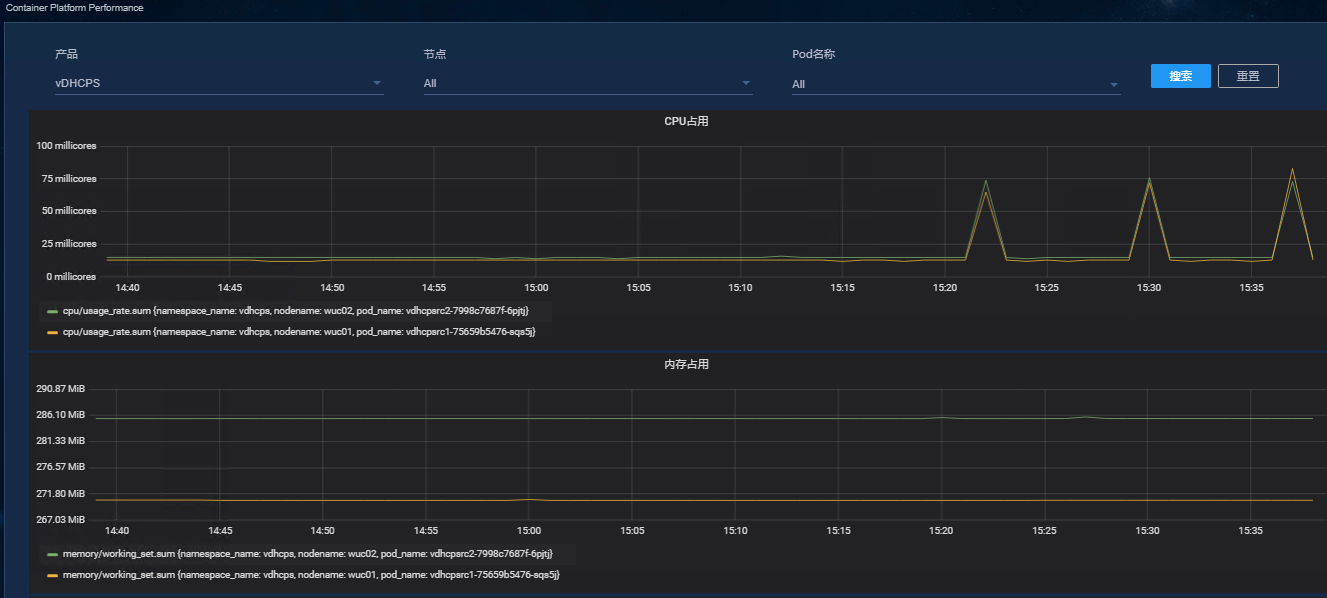
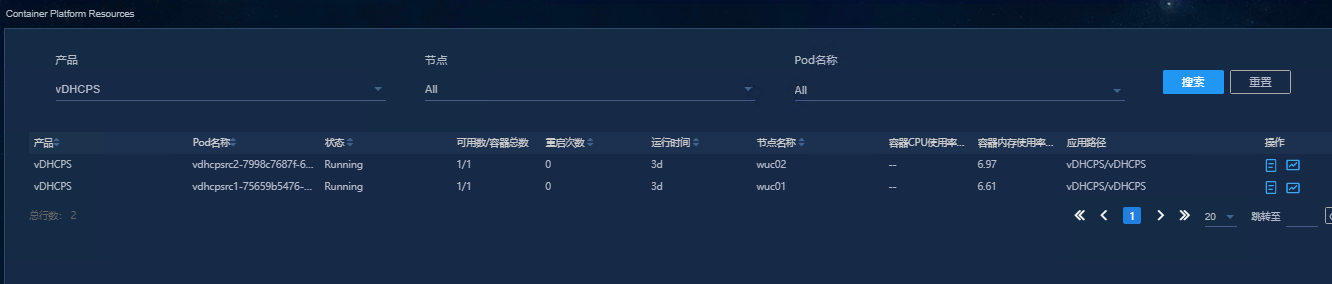
vDHCP version
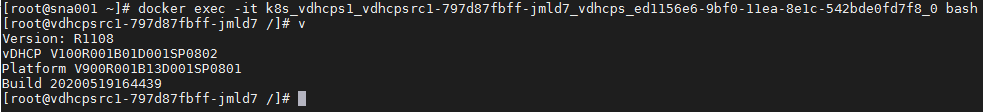
Verify that the vDHCP version matches Unified Platform and SeerEngine-Campus.
Check the system CPU
Log in to the background and check the CPU usage. Normally, the server CPU usage does not exceed 80%.
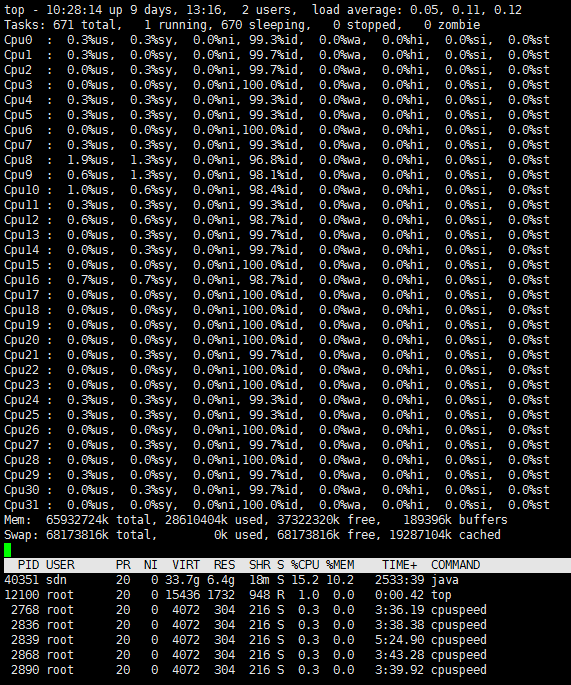
Check the system memory
Log in to the background and check the memory usage. Normally, the memory usage does not exceed 80%.
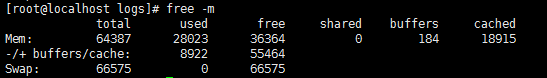
Check the system disk
Log in to the background and check the disk usage. Normally, the disk usage does not exceed 90%.
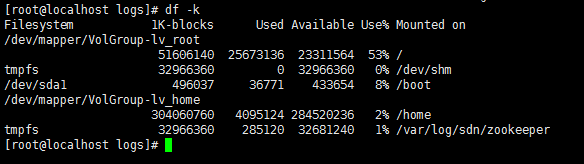
Check the critical processes and port number of vDHCP
State of the OS firewall and SELinux
Log in to the background of the controller and verify that the firewall is disabled:
The iptable process of Ubuntu is off by default:
root@hlw-vcfc01:~# service iptables status
iptables: unrecognized service
Execute the following commands to check iptable rules:
root@hlw-vcfc01:~# iptables --list
Chain INPUT (policy ACCEPT)
target prot opt source destination
ACCEPT udp -- anywhere anywhere udp dpt:domain
ACCEPT tcp -- anywhere anywhere tcp dpt:domain
ACCEPT udp -- anywhere anywhere udp dpt:bootps
ACCEPT tcp -- anywhere anywhere tcp dpt:bootps
For CentOS system, execute the following commands to check the firewall:
[root@localhost ~]# systemctl status firewalld.service
firewalld.service - firewalld - dynamic firewall daemon
Loaded: loaded (/usr/lib/systemd/system/firewalld.service; disabled)
Active: inactive (dead)
Check whether SELinux is disabled as follows:
[root@localhost ~]# cat /etc/selinux/config | grep -v \# | uniq
SELINUX=disabled
SELINUXTYPE=targeted
State of the dhcpd process
The dhcpd process is a key service process. Log in to the vDHCP container and execute the ps -ef | grep "dhcpd" | grep -v "grep" command to check the state of dhcpd process. If there is output and the result contains "dhcpd", the process is normal.
[root@localhost ~]# ps -ef | grep "dhcpd" | grep -v "grep"
root 277062 275924 0 13:56 ? 00:00:18 /sbin/dhcpd --ipv6=1
root 277065 275924 0 13:56 ? 00:00:18 /sbin/dhcpd
State of the vsrpd process
The vsrpd process is a backup process for multiple devices. Log in to the vDHCP container and execute the ps -ef | grep "vsrdp" | grep -v "grep" command to check the state of vsrdp process. If there is output and the result contains "vsrdp", the process is normal.
[root@localhost ~]# ps -ef | grep "vsrpd" | grep -v "grep"
root 284 1 0 13:56 ? 00:00:18 /sbin/vsrpd
State of the vrrpd process
The vrrpd process is a VRRP service process, with one each for V4 and V6. Log in to the vDHCP container and execute the ps -ef | grep "vrrpd" | grep -v "grep" command to check the state of vrrpd process. If there is output and the result contains "vrrpd", the process is normal.
[root@localhost ~]# ps -ef | grep "vrrpd" | grep -v "grep"
root 285 1 0 13:56 ? 00:00:18 /sbin/vrrpd --af=6 –MaxVRN
root 286 1 0 13:56 ? 00:00:18 /sbin/vrrpd --af=4 --MaxVRN
State of the lite-xmlcfgd process
The lite-xmlcfgd process is an XML configuration and management process. Log in to the vDHCP container and execute the ps -ef | grep "lite-xmlcfgd" | grep -v "grep" command to check the state of lite-xmlcfgd process. If there is output and the result contains "lite-xmlcfgd", the process is normal.
[root@localhost ~]# ps -ef | grep "lite-xmlcfgd" | grep -v "grep"
root 284 1 0 13:56 ? 00:00:18 /sbin/lite-xmlcfgd --InitRe
State of the lite-scmd process
The lite-scmd process is a Comware init process. Log in to the vDHCP container and execute the ps -ef | grep "lite-scmd" | grep -v "grep" command to check the state of lite-scmd process. If there is output and the result contains "lite-scmd", the process is normal.
[root@localhost ~]# ps -ef | grep "lite-scmd " | grep -v "grep"
root 1 0 0 13:56 ? 00:00:18 /sbin/lite-scmd
State of the lite-lipcd process
The lite-lipcd process is a transparent inter-process communication (TIPC) process. Log in to the vDHCP container and execute the ps -ef | grep "lite-lipcd" | grep -v "grep" command to check the state of lite-lipcd process. If there is output and the result contains "lite-lipcd", the process is normal.
[root@localhost ~]# ps -ef | grep "lite-lipcd" | grep -v "grep"
root 268 1 0 13:56 ? 00:00:18 /sbin/lite-lipcd
State of the lite-dbmd process
The lite-dbmd process is a binary data management process. Log in to the vDHCP container and execute the ps -ef | grep "lite-dbmd" | grep -v "grep" command to check the state of lite-dbmd process. If there is output and the result contains "lite-dbmd", the process is normal.
[root@localhost ~]# ps -ef | grep "lite-dbmd" | grep -v "grep"
root 269 1 0 13:56 ? 00:00:18 /sbin/lite-dbmd
State of the lite-httpd process
The lite-httpd process is an http web server process. Log in to the vDHCP container and execute the ps -ef | grep "lite-httpd" | grep -v "grep" command to check the state of lite-httpd process. If there is output and the result contains "lite-httpd", the process is normal.
[root@localhost ~]# ps -ef | grep "lite-httpd" | grep -v "grep"
root 271 1 0 13:56 ? 00:00:18 /sbin/lite-httpd -w 2 -c 10
State of the clcpd process
The clcpd process is a Common Licence Client process. Log in to the vDHCP container and execute the ps -ef | grep "clcpd " | grep -v "grep" command to check the state of clcpd process. If there is output and the result contains "clcpd", the process is normal.
[root@localhost ~]# ps -ef | grep "clcpd" | grep -v "grep"
root 277 1 0 13:56 ? 00:00:18 /sbin/clcpd --flag=1 --dir=
State of vDHCP port 80/830
80/830 is the port number of vDHCP controller. Here port 80 is used as an example. Log in to the background of the container and execute the netstat -anp | grep 80 command to check the state of port 80. In the following example, port 80 is in the LISTEN state and the local service port for port 80 is normal, indicating that the state of port 80 is normal.
[root@vdhcpsrc1-797d87fbff-jmld7 /]# netstat -anp | grep 80
tcp 0 0 0.0.0.0:80 0.0.0.0:* LISTEN 331/lite-httpd
tcp 0 0 192.168.3.16:830 192.168.3.12:54804 ESTABLISHED 462/sshd
tcp6 0 0 :::80 :::* LISTEN 331/lite-httpd
State of vDHCP 67/68 port
67/68 is the port number of vDHCP protocol. Here port 67 is used as an example. Log in to the background of the container and execute the netstat -anp | grep 67 command to check the state of port 67. In the following example, port 67 is in the LISTEN state and the local service port for port 67 is normal, indicating that the state of port 67 is normal.
[root@vdhcpsrc1-797d87fbff-jmld7 /]# netstat -anp | grep 67
udp 0 0 0.0.0.0:67 0.0.0.0:* 346/dhcpd
Inspection report
After inspecting vDHCP, create an inspection report according to the table below.
Table 18 Background information inspection report
|
Targets |
Instruction |
Result |
Remarks |
|
Host CPU usage
|
Log in to the background of the controller and check the CPU usage. Normally, the server CPU usage does not exceed 80%. |
□ Normal □ Abnormal |
|
|
Host memory usage
|
Log in to the background of the controller and check the memory usage. Normally, the memory usage does not exceed 80%. |
□ Normal □ Abnormal |
|
|
State of host NIC bonding |
Log in to the background of the controller and check the NIC bonding state. |
□ Normal □ Abnormal |
|
|
Host disk usage |
Log in to the background of the controller and check the disk usage. Normally, the disk usage does not exceed 90%. |
□ Normal □ Abnormal |
|
|
Firewall state |
Verify that the firewall is disabled. |
□ Normal □ Abnormal |
|
|
SElinux state |
Check whether SELinux is disabled as follows: [root@localhost ~]# cat /etc/selinux/config | grep -v \# | uniq SELINUX=disabled SELINUXTYPE=targeted |
□ Normal □ Abnormal |
|
|
State of the vrrpd process |
Log in to the background of the controller and execute the ps -ef | grep "vrrpd" | grep -v "grep" command to check the state of vrrpd process. If there is output and the result contains "vrrpd", the process is normal. |
□ Normal □ Abnormal |
|
|
State of the vsrpd process |
Log in to the background of the controller and execute the ps -ef | grep "vsrpd" | grep -v "grep" command to check the state of vsrpd process. If there is output and the result contains "vsrpd", the process is normal. |
□ Normal □ Abnormal |
|
|
State of the dhcpd process |
Log in to the background of the controller and execute the ps -ef | grep "dhcpd" | grep -v "grep" command to check the state of dhcpd process. If there is output and the result contains "dhcpd", the process is normal. |
□ Normal □ Abnormal |
|
|
State of the lite-xmlcfgd process |
Log in to the background of the controller and execute the ps -ef | grep "lite-xmlcfgd" | grep -v "grep" command to check the state of lite-xmlcfgd process. If there is output and the result contains "lite-xmlcfgd", the process is normal. |
□ Normal □ Abnormal |
|
|
State of the lite-scmd process |
Log in to the background of the controller and execute the ps -ef | grep "lite-scmd" | grep -v "grep" command to check the state of lite-scmd process. If there is output and the result contains "lite-scmd", the process is normal. |
□ Normal □ Abnormal |
|
|
State of the lite-lipcd process |
Log in to the background of the controller and execute the ps -ef | grep "lite-lipcd" | grep -v "grep" command to check the state of lite-lipcd process. If there is output and the result contains "lite-lipcd", the process is normal. |
□ Normal □ Abnormal |
|
|
State of the lite-dbmd process |
Log in to the background of the controller and execute the ps -ef | grep "lite-dbmd" | grep -v "grep" command to check the state of lite-dbmd process. If there is output and the result contains "lite-dbmd", the process is normal. |
□ Normal □ Abnormal |
|
|
State of the lite-httpd process |
Log in to the background of the controller and execute the ps -ef | grep "lite-httpd" | grep -v "grep" command to check the state of lite-httpd process. If there is output and the result contains "lite-httpd", the process is normal. |
□ Normal □ Abnormal |
|
|
State of the clcpd process |
Log in to the background of the controller and execute the ps -ef | grep "clcpd" | grep -v "grep" command to check the state of clcpd process. If there is output and the result contains "clcpd", the process is normal. |
□ Normal □ Abnormal |
|
|
State of vDHCP port 80/830 |
Log in to the background of the controller and execute the netstat -anp | grep 80 command to check the state of port 80. Port 80 is in the LISTEN state and the local service port for port 80 is normal, indicating that the state of port 80 is normal. |
□ Normal □ Abnormal |
|
|
State of vDHCP 67/68 port |
Log in to the background of the controller and execute the netstat -anp | grep 67 command to check the state of port 67. Port 67 is in the LISTEN state and the local service port for port 67 is normal, indicating that the state of port 67 is normal. |
□ Normal □ Abnormal |
|
Inspection guide for Microsoft DHCP
Windows DHCP server
Check the configuration of Windows DHCP server and ensure that DHCP server works properly.
Check OS version
· Check item
OS version
· Targets
OS version of the DHCP server.
· Pass criteria
AD-Campus 6.2 requires the OS version of Windows DHCP server to be Windows Server 2012 R2 or above.
· Example
a. Access the Windows OS and click ![]() .
.
b. Click This PC and right-click and select Properties.
c. OS version of the DHCP server.

Recommendation: If the operating system of the DHCP server does not meet the requirements of the solution, contact H3C Support.
Check patches of Windows Server 2012 R2
· Check item
Check patches of Windows Server 2012 R2
· Targets
Patches KB2919355 and KB3022781 of Windows Server 2012 R2.
· Pass criteria
If patches have been installed, they can be queried when a command is executed. Otherwise, the command returns empty result.
· Example
a. Access the Windows OS and click ![]() .
.
b. Open ![]() Command Prompt as
an administrator.
Command Prompt as
an administrator.
c. Execute the wmic qfe list full | findstr 2919355 command.
d. Execute the wmic qfe list full | findstr 3022781 command.

Recommendation: To install the missing OS patches, please refer to the DHCP Server Configuration Guide to obtain the patch download link. Reboot the server after installing patches. Typically, you need to do so in change window.
Check OS license
OS license registration
· Targets
OS license registration.
· Pass criteria
Windows OS is activated.
· Example
a. Access the Windows OS and click ![]() .
.
b. Click This PC and right-click and select Properties.
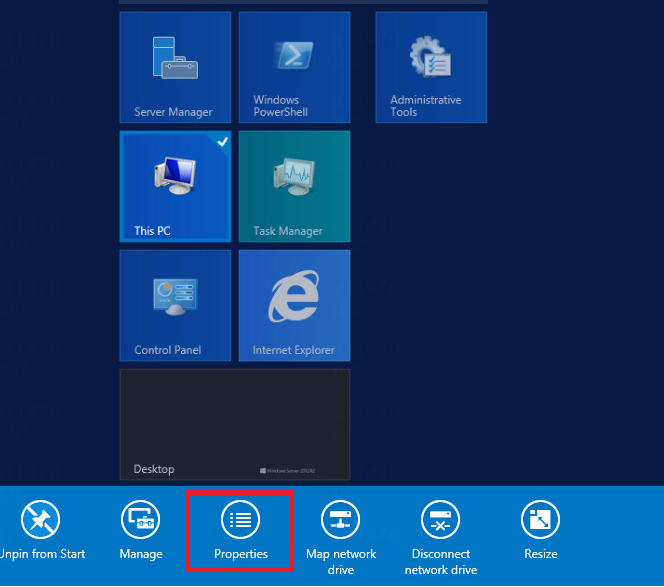
c. Verify that your Windows OS is activated.

Check whether DHCP plugin matches SeerEngine-Campus
· Check item
Whether DHCP plugin matches SeerEngine-Campus
· Targets
DHCP plugin version, SeerEngine-Campus version, and correspondence table.
· Pass criteria
The DHCP plugin version and SeerEngine-Campus version are compatible in accordance with the correspondence table.
· Example
a. Access the master/slave DHCP server and locate the dhcp-plug.exe file under \ dhcp-plug-windows\server\imf\server\bin. Right-click and select Properties to view the product version in Details.
b. Log in to SeerEngine-Campus and click About in the upper right corner to view the SeerEngine-Campus version.
c. Check whether DHCP plugin matches SeerEngine-Campus in accordance with the correspondence table.
Access \ dhcp-plug-windows\server\imf\server\bin under the installation directory and locate the dhcp-plug.exe file. Right-click and select Properties to view the product version in Details and to verify that it matches SeerEngine-Campus.

|
SeerEngine-Campus version |
Version compatible with dhcp-plug.exe |
|
E6502 |
3.7 |
Recommendation: If DHCP plugin does not match SeerEngine-Campus, then update the version of the plugin so that it matches SeerEngine-Campus (Check whether the current plugin version is consistent with the plugin version contained in the installation package of the controller). Please refer to the DHCP Server Configuration Guide. This process may affect the normal service of the DHCP server and the DHCP plug, which may in turn affect the existing network services. Users need to perform this operation in change window. If you are not sure whether the versions match, contact H3C Support.
Check whether the account and password for DHCP plugin are consistent with those for the operating system
· Check item
Consistency between the account and password for DHCP plugin and those for the operating system
· Targets
Account and password for DHCP plugin and those for the operating system.
· Pass criteria
The account and password for DHCP plugin are consistent with those for the operating system.
· Example
a. Access the Windows OS and click ![]() .
.
b. Click Administrative Tools.
c. Click Services.
d. Select and right-click DHCP Plug and click DHCP Plug Properties (Local Computer).
e. Check whether the user is local or administrator.
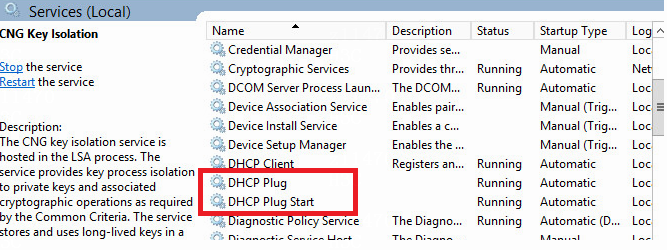
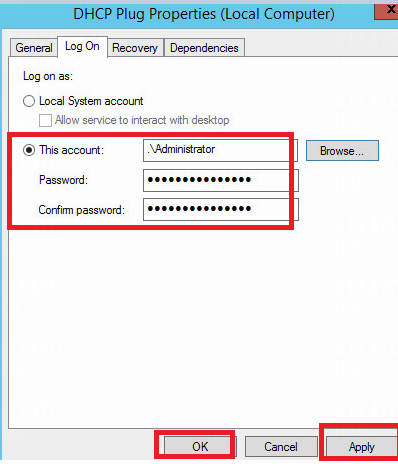
The operating system is connected to the DHCP plugin by using the local account. The operating system account needs permissions to log in to the plugin.
Recommendation: If this condition is not met, you need to change the configuration and reboot the DHCP plugin to validate your changes. This operation requires rebooting the plugin, which may affect the current network services. Therefore, users need to perform this operation in change window.
Check whether the UDP port 67 is occupied by Microsoft's DHCP server NIC
· Check item
Whether the UDP port 67 is occupied by Microsoft's DHCP server NIC
· Targets
Usage of the UDP port 67.
· Pass criteria
The NIC address for the UDP port 67 is the VLAN 4094 overlay NIC address of the server. This NIC needs to occupy the UDP port 67 to process DHCP protocol packets.
· Example
a. Access the Windows OS and click ![]() .
.
b. Open ![]() Command Prompt as
an administrator.
Command Prompt as
an administrator.
c. Execute the netstat –ano | findstr 67 command and check whether the NIC address for which the port is enabled is the VLAN 4094 overlay NIC address of the server.
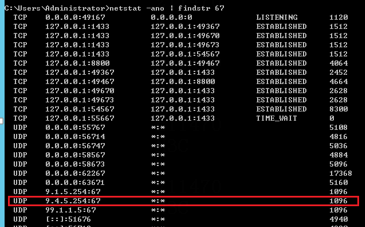
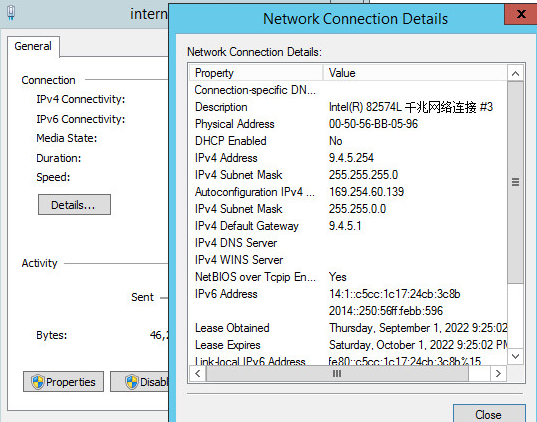
Recommendation:
Verify that the DHCP server uses this port correctly based on the screenshots above. You can reboot DHCP plugin and check the port usage status again. If problems persist, contact H3C Support. This operation requires rebooting the plugin, which may affect the current network services. Therefore, users need to perform this operation in change window.
Check whether the UDP port 8958 is occupied by DHCP plugin
· Check item
Whether the UDP port 8958 is occupied by DHCP plugin
· Targets
Usage of the UDP port 8958.
· Pass criteria
The NIC address for the UDP port 8958 is 0.0.0.0. For DHCP plugin to communicate with the Campus, DHCP plugin needs to occupy the UDP port 8958.
· Example
a. Access the Windows OS and click ![]() .
.
b. Open ![]() Command Prompt as
an administrator.
Command Prompt as
an administrator.
c. Execute the netstat –ano | findstr 8958 command and check whether the NIC address for which the port is enabled is occupied by the address 0.0.0.0.

Recommendation: Check the port usage status. You can reboot the plugin and check the port usage status again. If problems persist, contact H3C Support. This operation requires rebooting the plugin, which may affect the current network services. Therefore, users need to perform this operation in change window.
Check whether time difference between two DHCP servers is within 1 minute
· Check item
Whether time difference between two DHCP servers is within 1 minute
· Targets
Time of two DHCP servers.
· Pass criteria
The system time difference of two DHCP servers must be within 1 minute. Otherwise, the DHCP failover may fail.
· Example
a. Log in to two DHCP servers and view the time on the desktop.
b. Check whether the time difference between two DHCP servers is within 1 minute.
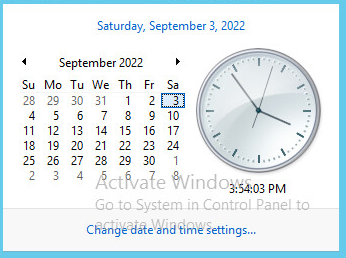
If not, resolve this issue as soon as possible.
Check whether two DHCP servers are put on the domain controller
· Check item
Whether two DHCP servers are put on the domain controller
· Targets
Whether two DHCP servers are put on the domain controller.
· Pass criteria
Two DHCP servers are put on the domain controller.
· Example
a. Access the Windows OS and click ![]() .
.
b. Open Server Manger as an administrator.
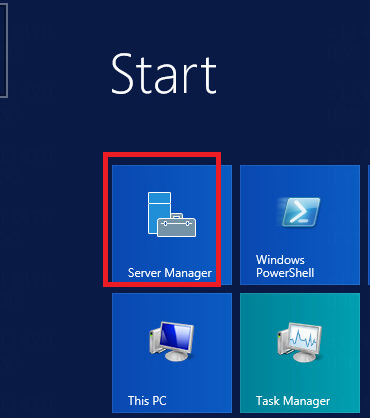
c. Click DHCP Manager.
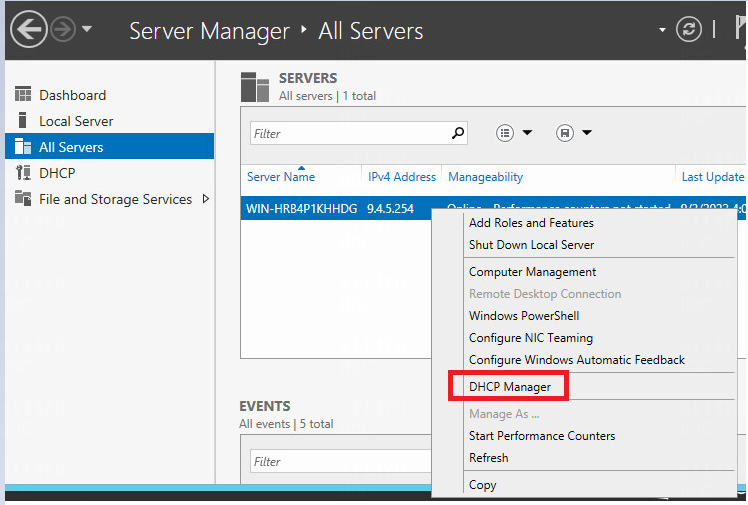
d. On the page that opens, check whether DHCP is put on the domain controller. If yes, it ends with ".com" and contains the full computer name, as shown below.
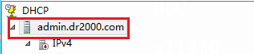
If not, it displays the computer name, as shown below:
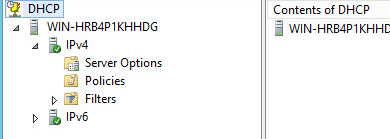
Check whether the DHCP server failover name is adcam
· Check item
Whether the DHCP failover name is adcam
· Targets
DHCP failover name.
· Pass criteria
The DHCP failover name is adcam. If the DHCP failover name is not adcam, exceptions may occur.
· Example
a. Access the Windows OS and click ![]() .
.
b. Open Server Manger as an administrator.
c. Click DHCP Manager.

d. On the page that opens, right-click IPv4 and click Properties.

e. Select Failover and then click Edit. The failover name is adcam.
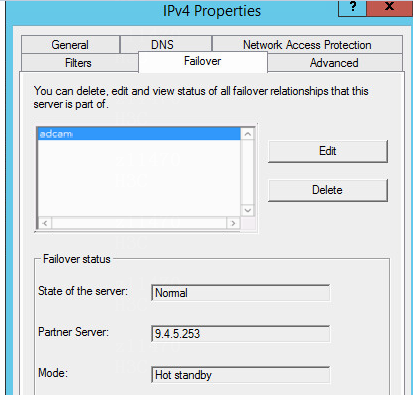
Recommendation: If the failover relationship name is not adcam, which is generated automatically, check the configuration of DHCP plugin files according to the DHCP Server Configuration Guide.
Check the state of the two DHCP servers during failover
· Check item
State of the two DHCP servers during failover
· Targets
State of the two DHCP servers during failover.
· Pass criteria
The state of the two DHCP servers is normal. If the state is not Running, it may cause abnormal DHCP address allocation.
· Example
a. Access the operating systems of two DHCP
servers and click ![]() .
.
b. Open Server Manger as an administrator.
c. Check whether DHCP servers are running normally.
Figure 3 DHCP server
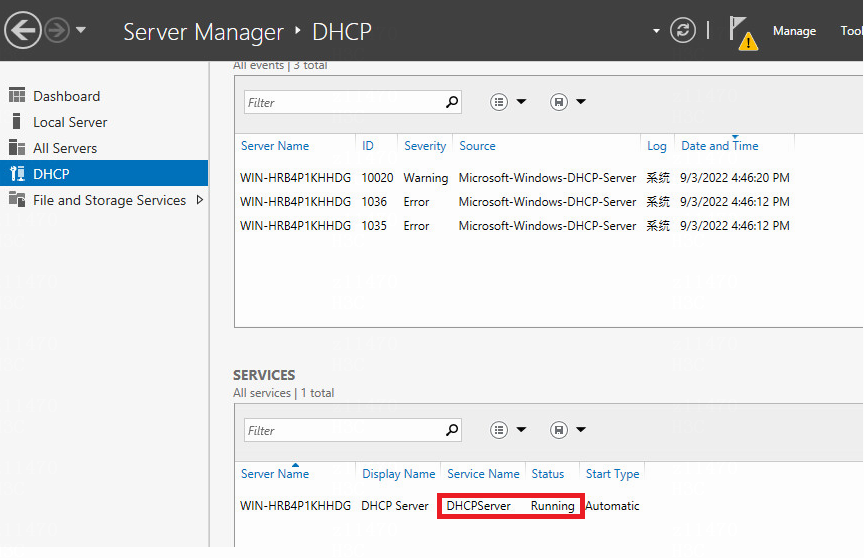
The maximum client lead time of two DHCP servers during failover is 1 hour
· Check item
The maximum client lead time of two DHCP servers during failover is 1 hour.
· Targets
Configuration of the maximum client lead time of two DHCP servers during failover.
· Pass criteria
The maximum client lead time of two DHCP servers during failover is 1 hour. If it is wrongly set, please reset it.
· Example
a. Access the Windows OS and click ![]() .
.
b. Open Server Manger as an administrator.
c. Click DHCP Manager.

d. On the page that opens, right-click IPv4 and click Properties.
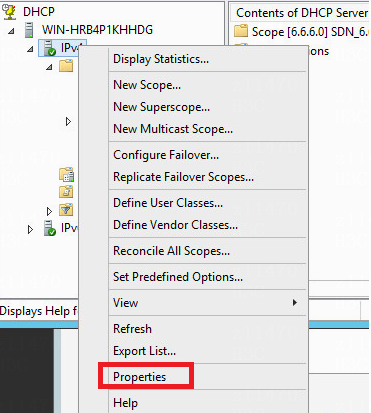
e. Select Failover and then click Edit to verify that the maximum client lead time is 1 hour.
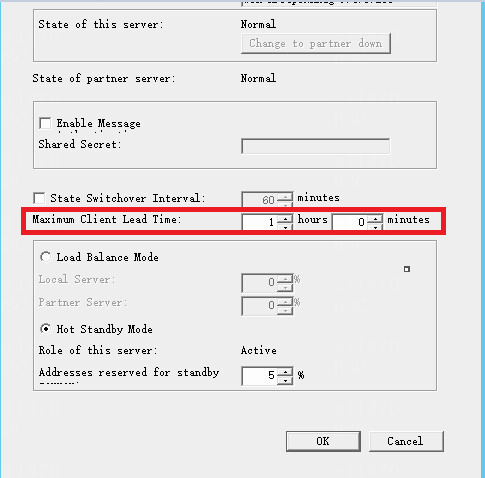
Check the VLAN 4094 scope and its policies on the DHCP server
· Check item
VLAN4094 scope and its policies on the DHCP server
· Targets
VLAN4094 scope and its policies on the DHCP server.
· Pass criteria
VLAN4094 scope is configured on the DHCP server and its policies are *34303934.
· Example
a. Access the Windows OS and click ![]() .
.
b. Click DHCP.

c. Open the VLAN4094 scope and view its properties.

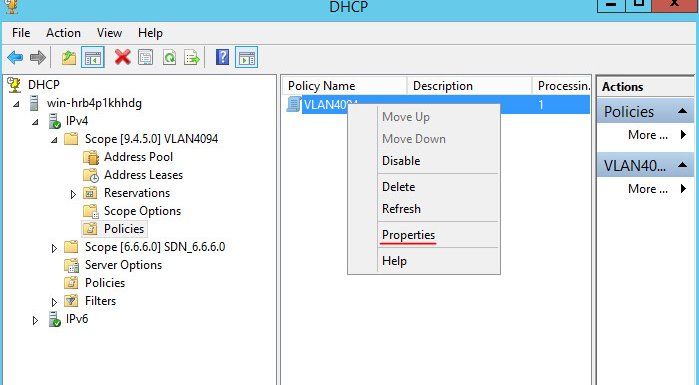
d. Click Conditions to verify that the client identifier is *34303934.
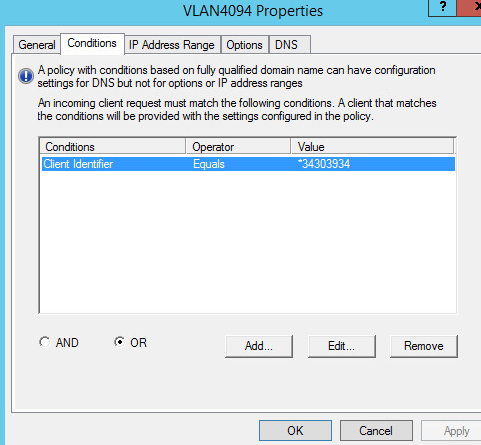
Check the system log size of the DHCP server
· Check item
System log size of the DHCP server
· Targets
System log size of the DHCP server.
· Pass criteria
The system log size of the DHCP server is 100 MB. Set the system log size of the DHCP server to facilitate fault recording. If the item is not set, the check failed.
· Example
a. Launch the Run command window and enter eventvwr to open Event Viewer.
b. Select Applications and Service Logs > Microsoft > Windows > DHCP-Server. Right-click Microsoft-Windows-DHCP Server Events/Admin and select Properties to change the log size to 100 MB; and right-click Microsoft-Windows-DHCP Server Events/FilterNotifications and Microsoft-Windows-DHCP Server Events/Operational and select Properties to change the log size to 100 MB.
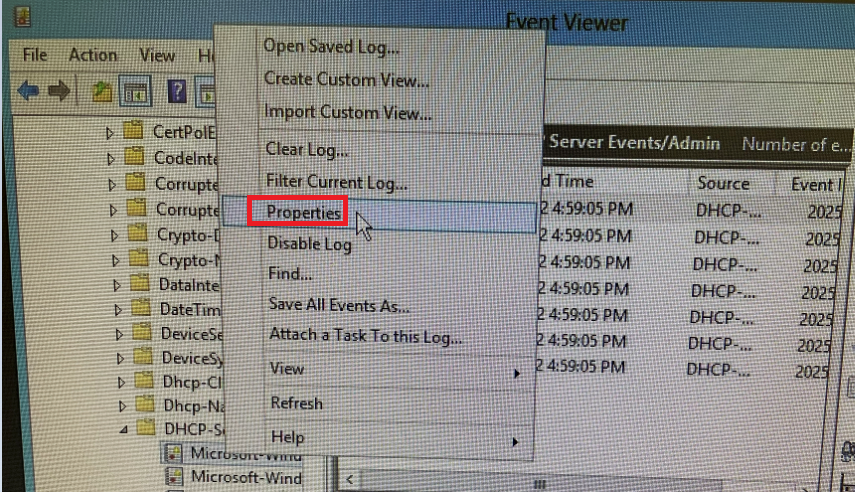
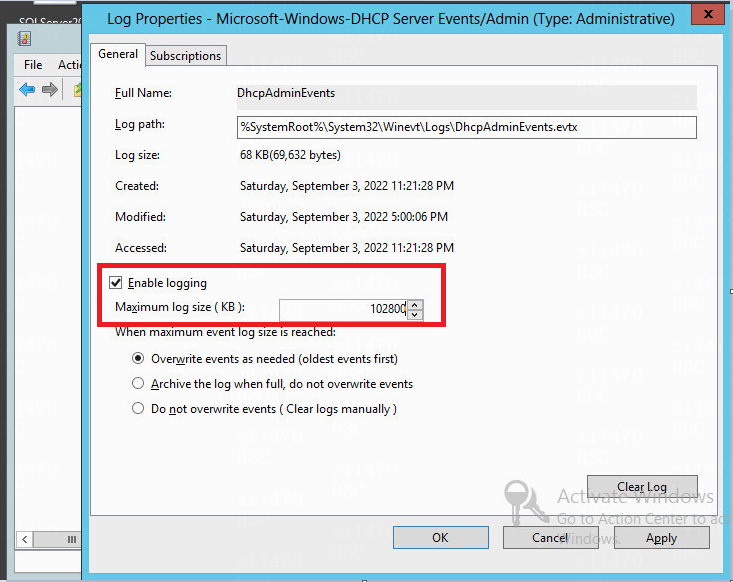
Check the activity log size of the DHCP server
· Check item
Activity log size of the DHCP server
· Targets
Activity log size of the DHCP server.
· Pass criteria
The activity log size of the DHCP server is 2000 MB. Set the activity log size of the DHCP server to facilitate fault recording. If the item is not set, the check failed.
· Example
Launch the Run command window and enter regedit to open Registry Editor. Select HKEY_LOCAL_MACHINE > SYSTEM > ControlSet001 > Services > DHCPServer > Parameters. Locate DhcpLogFilesMaxSize and right-click to set the value data to 2000 MB.
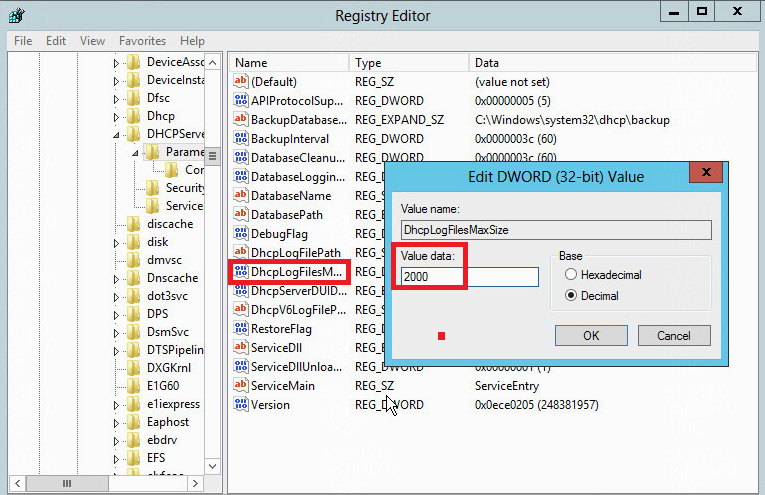
Check the DHCP fail-permit server
Check whether the OS system is a matched version
· Check item
OS version
· Targets
OS version of the DHCP server.
· Pass criteria
For AD Campus 6.2, the OS version of Windows DHCP server is Windows Server 2012 R2 or later. Example
a. Access the Windows OS and click ![]() .
.
b. Click This PC and right-click and select Properties.
c. OS version of the DHCP server.
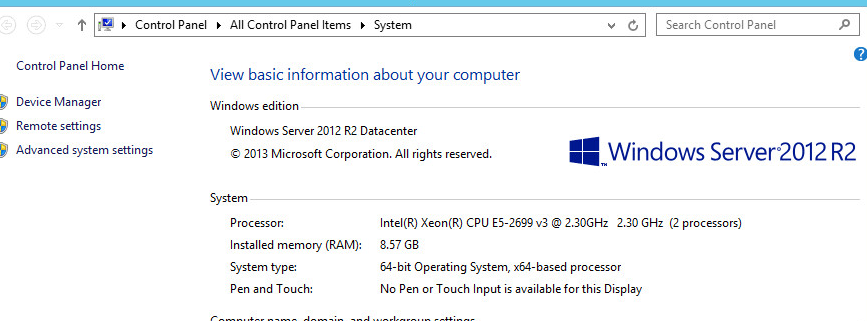
Recommendation: If the operating system of the DHCP server does not meet the requirements of the solution, contact H3C Support.
Check patches of Windows Server 2012 R2
· Check item
Check patches of Windows Server 2012 R2
· Targets
Installation of patches KB2919355 and KB3022781 in Windows Server 2012 R2
· Pass criteria
If patches have been installed, they can be queried when a command is executed. Otherwise, the command returns empty result.
· Example
a. Access the Windows OS and click ![]() .
.
b. Open ![]() Command Prompt as
an administrator.
Command Prompt as
an administrator.
c. Execute the wmic qfe list full | findstr 2919355 command.
d. Execute the wmic qfe list full | findstr 3022781 command.
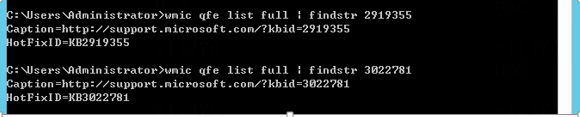
Recommendation: To install the missing OS patches, please refer to the DHCP Server Configuration Guide to obtain the patch download link. Reboot the server after installing patches. Typically, you need to do so in change window.
Check OS license
· Check item
OS license registration
· Targets
OS license registration.
· Pass criteria
Windows OS is activated.
· Example
a. Access the Windows OS and click ![]() .
.
b. Click This PC and right-click and select Properties.

c. Verify that your Windows OS is activated.
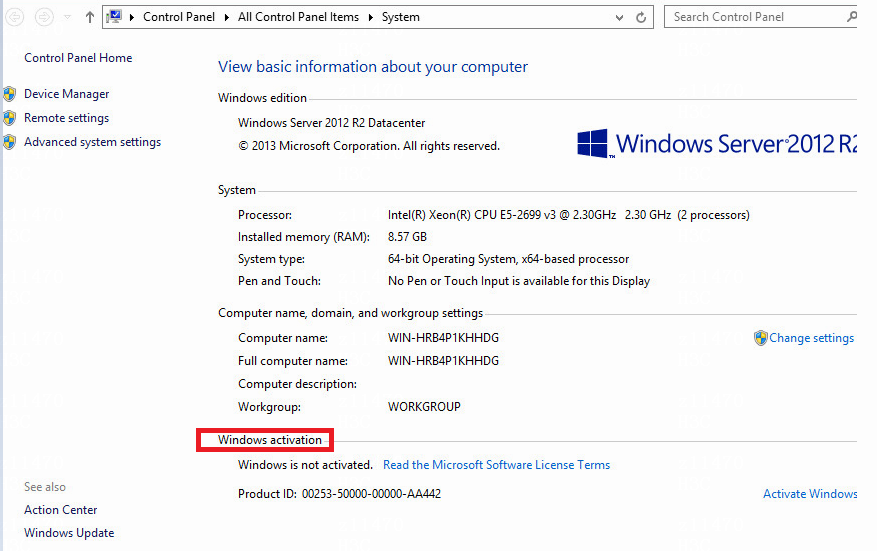
Check the DHCP Plugin version of the DHCP server that matches SeerEngine-Campus
· Check item
Whether DHCP plugin matches SeerEngine-Campus
· Targets
DHCP plugin version, SeerEngine-Campus version, and correspondence table.
· Pass criteria
The DHCP plugin version and SeerEngine-Campus version are compatible in accordance with the correspondence table.
· Example
a. Access the master/slave DHCP server and locate the dhcp-plug.exe file under \ dhcp-plug-windows\server\imf\server\bin. Right-click and select Properties to view the product version in Details.
b. Log in to SeerEngine-Campus and click About in the upper right corner to view the SeerEngine-Campus version.
c. Check whether DHCP plugin matches SeerEngine-Campus in accordance with the correspondence table.
Access \ dhcp-plug-windows\server\imf\server\bin under the installation directory and locate the dhcp-plug.exe file. Right-click and select Properties to view the product version in Details and to verify that it matches SeerEngine-Campus.
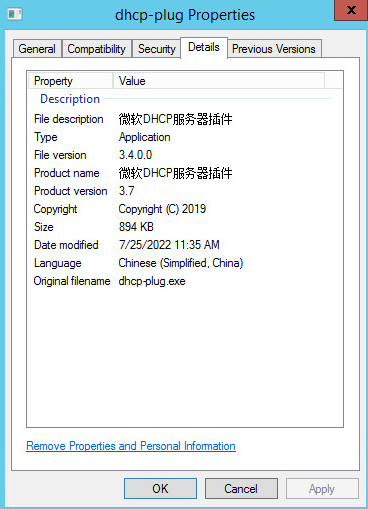
|
SeerEngine-Campus version |
Version compatible with dhcp-plug.exe |
|
E6103 |
3.3 |
Suggestions: If the DHCP Plugin version of the DHCP server does not match that of the SeerEngine-Campus, update the plugin version. Please refer to the DHCP Server Configuration Guide. This process may affect the normal service of the DHCP server and the DHCP plug, which may in turn affect the existing network services. Users need to perform this operation in change window. If you are not sure whether the versions match, contact H3C Support.
Check whether the DHCP fail-permit server is deployed with the DHCP server
· Check item
Deployment positions of the DHCP fail-permit server and DHCP server
· Targets
Deployment positions of the DHCP fail-permit server and DHCP server
· Pass criteria
The DHCP fail-permit server is deployed on a server different from that where the DHCP server is deployed. The DHCP fail-permit server and DHCP server cannot be deployed on the same server. If they are deployed on the same server, the requirements of this check item cannot be met.
· Example
Check whether the communication address of the fail-permit server is consistent with that of the DHCP server. If yes, the fail-permit server and DHCP server are deployed on the same server.
Check whether the UDP port 8958 is occupied by DHCP plugin
· Check item
Whether the UDP port 8958 is occupied by DHCP plugin
· Targets
Usage of the UDP port 8958.
· Pass criteria
The NIC address for the UDP port 8958 is 0.0.0.0. For DHCP plugin to communicate with the Campus, DHCP plugin needs to occupy the UDP port 8958.
· Example
a. Access the Windows OS and click ![]() .
.
b. Open ![]() Command Prompt as
an administrator.
Command Prompt as
an administrator.
c. Execute the netstat –ano | findstr 8958 command and check whether the NIC address for which the port is enabled is occupied by the address 0.0.0.0.
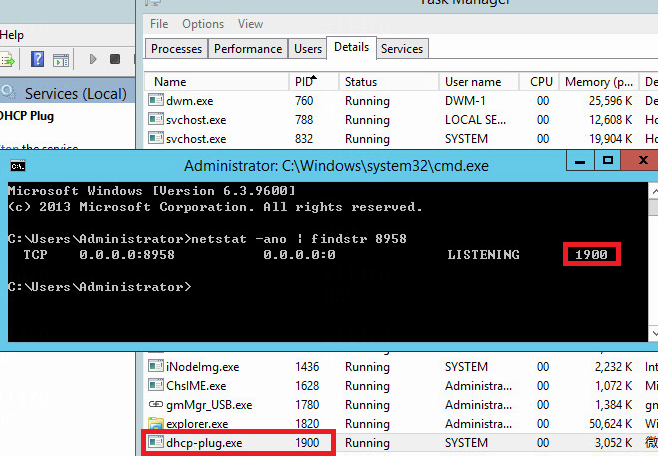
Recommendation: Check the port usage status. You can reboot the plugin and check the port usage status again. If problems persist, contact H3C Support. This operation requires rebooting the plugin, which may affect the current network services. Therefore, users need to perform this operation in change window.
Check whether a vlan4094 superscope is created for the DHCP fail-permit server and excluded from address allocation
· Check item
Creation of a vlan4094 superscope for the DHCP fail-permit server and exclusion from address allocation
· Targets
Creation of a vlan4094 superscope for the DHCP fail-permit server and exclusion from address allocation
· Pass criteria
A vlan4094 superscope is created for the DHCP fail-permit server and excluded from address allocation. Otherwise, this check item is not met and repair setting is needed.
· Example
a. Access the Windows OS and click ![]() .
.
b. Click DHCP.
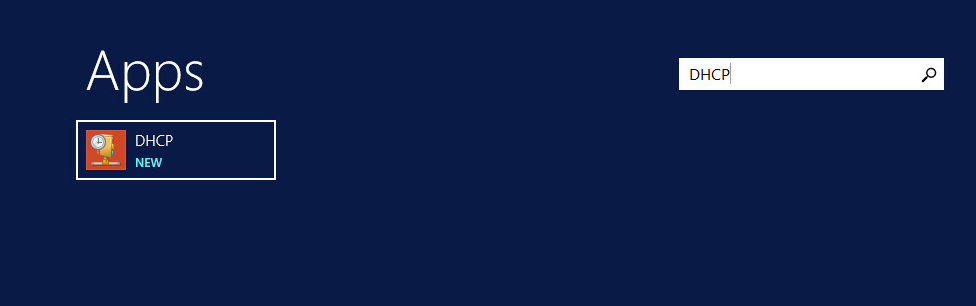
c. Log in to the DHCP fail-permit server and check whether a vlan4094 scope is created in the superscope and all addresses in this scope are excluded from address allocation.
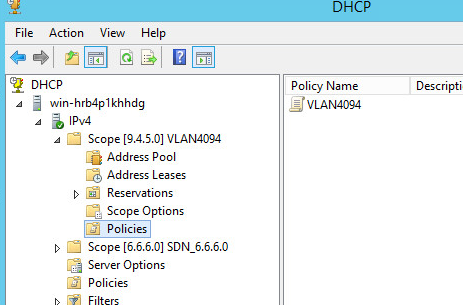
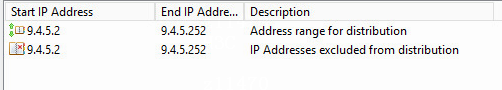
Routine inspection guide for campus core devices
Routine maintenance checklist for software
|
Checked at: |
Checked by: |
||
|
Inspection items |
Criteria |
Check record |
Result |
|
Card running status of devices |
Execute the display device command to verify that all cards are in normal state. Execute the display version command to verify that the card uptime increases correctly and no card restarts. Execute the display fan and display power-supply commands to verify that the fan and power module are in normal state. |
XX device |
□ Normal □ Abnormal |
|
Storage medium status |
The flash memory and CF card on the active and standby MPUs are in normal state. Execute the dir flash:/ and dir cfa0:/ commands to verify that the flash memory and CF card are available and their free space is more than 20%. |
XX device |
□ Normal □ Abnormal |
|
Real-time synchronization status of devices |
Verify that all dual-MPU devices synchronize data between MPUs in real time. Execute the display ha service-group all command to verify that all processes are in Realtime Backup state. |
XX device |
□ Normal □ Abnormal |
|
Memory usage and CPU usage of devices |
Execute the display cpu and display memory commands to verify that the CPU usage is less than 70% and the memory usage is less than 85%. |
XX device |
□ Normal □ Abnormal |
|
VRRP status of devices |
Execute the display vrrp verbose command to verify that the VRRP state is Master on one member device and Backup on the other member device for the same VLAN interface in a VRRP group. |
XX device |
□ Normal □ Abnormal |
|
OSPF neighbor status of devices |
Execute the display ospf peer command to verify that all OSPF neighbors are in full state (in some cases, they are in two-way state) and no neighbors go down. |
XX device |
□ Normal □ Abnormal |
|
Error packets between ports of devices |
Detect whether error packets are detected on the ports. Execute the display interface command to observe whether the number of error packets is increasing. |
XX device |
□ Normal □ Abnormal |
|
Device connectivity |
Select adjacent devices to perform a ping test. No packet loss or connection failure occurs. |
XX device |
□ Normal □ Abnormal |
|
Execute the display info-center command to check whether the log center is disabled. If the following information is returned, nonconformant content is found in the device: Information Center: Disabled After the log center is disabled, devices do not generate logs, which makes troubleshooting difficult in future. If the log center is enabled, the devices pass the check. |
XX device |
□ Normal □ Abnormal |
|
|
Execute the display mad verbose command to check the VLAN ID used by the BFD MAD. If the following information is returned, nonconformant content is found in the device: MAD BFD enabled interface: Vlan-interface1 If the BFD MAD VLAN ID is VLAN 1, related MAD function may be affected. If the BFD MAD VLAN ID is not VLAN 1, the devices pass the check. |
XX device |
□ Normal □ Abnormal |
|
|
Interfaces of stacking devices that are assigned to the BFD MAD VLAN |
Execute the display mad display vlan xxx command to check interfaces that are assigned to the BFD MAD VLAN. Except the interface specially assigned to the BFD MAD VLAN, other trunk interfaces are not assigned to the BFD MAD VLAN. Otherwise, service exceptions may occur in some scenarios. If the following information is returned, nonconformant content is found in the device: VLAN ID: 100 VLAN type: Static Route interface: Configured Description: VLAN 100 Name: VLAN 100 Tagged ports: Bridge-Aggregation2 Bridge-Aggregation9 //Corresponding interface is a service interface. Untagged ports: GigabitEthernet4/3/0/1 GigabitEthernet4/3/0/2 Except for the interface specially assigned to the BFD MAD VLAN, no other trunk interfaces are assigned to the BFD MAD VLAN. If the number of non-aggregate BFD MAD interfaces in each chassis does not exceed one, the devices pass the check. |
XX device |
□ Normal □ Abnormal |
|
Execute the display ip int brief command to check the subinterface ID and VLAN interface ID. If the subinterface ID of the S125G router or routing aggregation subinterface ID is consistent with the VLAN interface ID, related interface functions may become unavailable. If the following information is returned, nonconformant content is found in the device: *down: administratively down (s): spoofing (l): loopback Interface Physical Protocol IP address VPN instance Description RAGG1.10 down down 1.1.1.1 -- -- Vlan10 down down 10.10.10.1 -- -- If the subinterface ID of a router or routing aggregation subinterface ID is inconsistent with the VLAN interface ID, the devices pass the check. |
XX device |
□ Normal □ Abnormal |
|
|
Execute the display vlan XXX command to check interfaces that is assigned to a remote mirrored VLAN. Except the interface that needs to be assigned to a remote mirrored VLAN, as a best practice, do not assign trunk interfaces to the remote mirrored VLAN. Otherwise, the traffic on other service interfaces may be overloaded. If the following information is returned, nonconformant content is found in the device: VLAN ID: 100 VLAN type: Static Route interface: Configured Description: VLAN 100 Name: VLAN 100 Tagged ports: Bridge-Aggregation2 Bridge-Aggregation9 //Corresponding interface does not need to receive mirrored traffic. Untagged ports: GigabitEthernet4/3/0/1 GigabitEthernet4/3/0/2 Except the interface that is assigned to a remote mirrored VLAN, no other trunk interfaces are assigned to the remote mirrored VLAN. For example, if no interface is configured with the port trunk permit vlan all command, the devices pass the check. |
XX device |
□ Normal □ Abnormal |
|
|
Execute the display ip int brief command to check for any VLAN interface unconfigured with an IP address. In normal cases, service VLAN interfaces are configured with IP addresses. If any VLAN interface is not configured with an IP address, check the VLAN function. For example, a VLAN interface is not configured with remote mirrored probe VLAN. Otherwise, remote mirrored traffic may be abnormal. If the following information is returned, nonconformant content is found in the device: Vlan456 down down -- -- -- |
XX device |
□ Normal □ Abnormal |
|
|
Execute the display irf link command. As a best practice, perform cross-board deployment for stacking physical interfaces to implement high reliability. If the condition is met, the devices pass the check. |
XX device |
□ Normal □ Abnormal |
|
|
Execute the display mad command. In stacking, the MAD function must be enabled. If the condition is met, the devices pass the check. |
XX device |
□ Normal □ Abnormal |
|
|
Execute the display current-configuration | include "drni keepalive ip" command. A DRNI network requires keepalive links to be deployed. If the condition is met, the devices pass the check. |
XX device |
□ Normal □ Abnormal |
|
|
Execute the display drni verbose command. As a best practice, perform cross-board deployment for DRNI IPP physical interfaces to implement high reliability. If the condition is met, the devices pass the check. |
XX device |
□ Normal □ Abnormal |
|
|
Execute the display irf configuration command. If the bandwidths on stacking link member interfaces are inconsistent, cross-chassis services may become abnormal. For example, on a 10 G interface and a 40 G interface, when cross-chassis traffic exceeds 20 G, the 10 G interface is easily full, which will affect services. Bandwidths on stacking member interfaces must be consistent. If the condition is met, the devices pass the check. |
XX device |
□ Normal □ Abnormal |
|
|
Cross-board/cross-chassis deployment on an aggregate member interface |
Execute the display link-aggregation verbose command. As a best practice, perform cross-board/cross-chassis deployment for aggregate member interfaces to implement high reliability. If the condition is met, the devices pass the check. |
XX device |
□ Normal □ Abnormal |
|
Hardware fault repair |
Execute the display hardware-failure-detection command to check hardware fault detection and repair information. If the repair action at board/chip/forwarding level is Reset, the devices pass the check. As a best practice, if the repair action is not Reset, check whether cross-board/cross-chassis backup exists on the uplink and downlink devices and whether backup exists between the MPU and network board. If yes, change the action to Reset. [H3C] display hardware-failure-detection Current level: Chip: Reset Board: Reset Forwarding: Reset |
XX device |
□ Normal □ Abnormal |
Routine maintenance checklist for hardware entry resources of campus core switches
|
Checked at: |
Checked by: |
||
|
Inspection items |
Criteria |
Check record |
Result |
|
Download the latest logfile and search for keyword "RESMON". If there is information returned, find out the exceptional module in the logfile. If necessary, submit the information to the Technical Support in the headquarters for analysis. |
%@1193382%May 14 10:40:25:420 2020 B2C-DS01-SNYH_4FB_G05_192.168.119.254 RESMON/2/RESMON_USEDUP:-Chassis=1-Slot=5; -Resource=pfilterin-Total=0-Used=0-Free=0; Resources used up. %Jan 22 08:37:10:088 2019 ZJNBO-CDN-CX-SW01-5F-B02_03-S7606 RESMON/5/RESMON_MINOR_RECOVERY: -Chassis=2-Slot=0; -Resource=pfilterout-Total=256-Used=0-Free=256; Free resource increased above minor threshold 20%. |
XX device |
□ Normal □ Abnormal |
Routine inspection guide for campus access switches
This guide applies to the following campus access switches: S6550XE-HI/S6525XE-HI/S6520X-HI/S6520X-EI/S6520X-SI/S5560X-HI/S5560X-EI/S5130-HI/S5130-EI/S5130S-HI/S5130S-EI/S3100V3-EI.
Routine maintenance checklist
This checklist should be filled by equipment room maintenance personnel to describe the equipment room environment and device running status in work period. Based on local situation and third-party devices, users can remove check items of unwanted functions and modify the checklist. The checklist can be made into duty log manuals.
Table 19 Routine maintenance checklist
|
No. |
Inspection items |
Sub-item |
Instruction |
Result |
Remarks |
|
1 |
Environment and hardware |
Environment |
display environment |
□ Normal □ Exceptional □ Not involved |
Temperature values read by sensors are in the range of low-temperature alarm threshold and minor high-temperature alarm threshold. |
|
Fan |
Execute the display fan command. |
□ Normal □ Exceptional □ Not involved |
Fans are in normal state. |
||
|
Power supply |
Execute the display power command. |
□ Normal □ Exceptional □ Not involved |
Power supplies are in normal state. Assess whether power supplies can be backed up based on the power of the power supplies and power consumption of the entire device. |
||
|
LED status |
Observe all RUN LEDs and alarm LEDs. |
□ Normal □ Exceptional □ Not involved |
The RUN LEDs are flashing slowly, and the alarm LEDs are off. |
||
|
Device and card running state |
display device |
□ Normal □ Exceptional □ Not involved |
All service modules are in normal state, and the MPUs are in master or standby state. |
||
|
3 |
CPU usage |
Whether the CPU usage fluctuates in the range from 10% to 60% or whether it keeps high (whether the CPU usage of the MPU and service module exceeds 60%)) |
Execute the display cpu command. |
□ Normal □ Exceptional □ Not involved |
Execute the debug ip packet command to check CPU packets and analyze the causes of CPU packet issues based on the packets. |
|
4 |
Memory usage |
Whether the memory usage of the MPU and service module is less than 60% |
Execute the display memory command. |
□ Normal □ Exceptional □ Not involved |
If the memory usage exceeds 60%, execute the display memory command to identify the module that consumes excessive memory space. |
|
5 |
Port self-check |
Whether the negotiation result of a port is half duplex |
Execute the display interface brief command. |
□ Normal □ Exceptional □ Not involved |
Example: If the duplex state of a port is half, verify that the configurations on both sides of the port are consistent. |
|
Whether flow control is enabled on a port that does not require flow control |
View configuration to check whether flow control is enabled. |
□ Normal □ Exceptional □ Not involved |
Execute the undo flow control command to disable flow control. |
||
|
Whether a large number of error packets pass through a port in the inbound/outbound direction |
Execute the display interface command to check the data size of errors and observe whether the size increases. |
□ Normal □ Exceptional □ Not involved |
1: Check the link quality and the photoelectric converter. 2: Verify that configurations on both sides of the port are consistent. If the configuration is manually configured on one side and automatically negotiated on the other side, change the two sides to use the same configuration method (manual or automatic). |
||
|
Whether the ports come up and go down frequently |
Execute the display logbuffer command. |
□ Normal □ Exceptional □ Not involved |
1: Check the link and the photoelectric converter. 2: Verify that the optical power on the GE port is below the critical value. 3: Verify that configurations on both sides of the port are consistent. |
||
|
6 |
Fiber port self-check |
Whether configurations on both sides of the fiber port are consistent |
Execute the display current interface command. |
□ Normal □ Exceptional □ Not involved |
As a best practice, set the fiber port rate and duplex mode to the same values for H3C and non-H3C devices if the devices are connected. |
|
Whether CRC error packets exist on the fiber port and whether the error packets increase. |
display interface |
□ Normal □ Exceptional □ Not involved |
Verify that the optical power is below the critical value. If the optical power is at a critical value, resolve the issue by replacing the transceiver module or fiber pigtail or cleaning the connector of the transceiver module. |
||
|
7 |
Trunk port configuration self-check |
Whether the trunk port is configured with the undo port trunk permit vlan 1 command. |
Execute the display current interface command. |
□ Normal □ Exceptional □ Not involved |
If the system is configured with GVRP and the trunk port is configured with undo port trunk permit vlan 1, you need to reconfigure the PVID of the trunk port. The PVID is the ID of a VLAN permitted by the port. |
|
Whether the PVID of the port is consistent with that of the peer port. |
Execute the display current interface command. |
□ Normal □ Exceptional □ Not involved |
The VLAN configurations of the trunk ports connecting two devices and the PVIDs are consistent. |
||
|
Whether the VLAN configuration of the port is consistent with that of the peer port. |
Execute the display current interface command. |
□ Normal □ Exceptional □ Not involved |
The VLAN configurations of the trunk ports connecting two devices are consistent. Avoid enabling all VLANs on one side and not enabling all VLANs on the other side. |
||
|
Whether the ports connecting two devices are configured as a trunk port and an access port, respectively. |
Execute the display current interface command. |
□ Normal □ Exceptional □ Not involved |
Modify the configuration on the both sides to be consistent based on the actual topology. |
||
|
Whether loop exists in VLAN 1. |
Execute the display interface command to verify that the trunk ports of all devices permit VLAN 1. |
□ Normal □ Exceptional □ Not involved |
Deny VLAN 1 on some ports based on the actual topology. |
||
|
8 |
STP self-check |
Setting of the STP time factor. |
Execute the display current-configuration command. |
□ Normal □ Exceptional □ Not involved |
View the configuration to check for stp timer-factor configuration. If it does not exist, set stp timer-factor to a value between 5 and 7 to improve STP stability. |
|
Whether the port connected to a PC is configured as an edge port. |
Execute the display current interface command to check the port configuration. If an edge port is configured, stp edged-port will be included in the configuration. |
□ Normal □ Exceptional □ Not involved |
As a best practice, configure the port connected to a PC as an edge port or disable the STP feature of this port. Disable STP for a port if the port is connected to an STP-incapable device. This operation avoids the port state from affecting STP calculation. |
||
|
Whether an H3C MSTP/STP/RSTP device and a Cisco PVST+ device can be interconnected. |
Verify that the STP state on all devices is correct. |
□ Normal □ Exceptional □ Not involved |
If an H3C MSTP/STP/RSTP device and a Cisco PVST+ device can be interconnected, as a best practice, change the connection mode to L3 connection to avoid connection of MSTP/STP/RSTP with Cisco PVST+. |
||
|
Whether path overlapping exists in the topology of different STP instances. |
Execute the display current interface command to check port configuration. |
□ Normal □ Exceptional □ Not involved |
Divide VLANs and mappings of the VLANs with VLAN instances based on topological requirements to enable traffic to be routed on different paths based on the VLANs. Avoid path overlapping in the topology of different STP instances. |
||
|
Whether there is a TC attack that causes frequent switchover of the port STP state. |
Execute the display stp tc and display stp history commands to check the receiving and transmitting TC packet count and the STP state switchover time. |
□ Normal □ Exceptional □ Not involved |
As a best practice, configure the port connected to a PC as an edge port or disable the STP feature of this port. Disable STP for a port if the port is connected to an STP-incapable device. This operation avoids the port state from affecting STP calculation. |
||
|
9 |
VRRP self-check |
Whether the handshake time is set to 3 seconds and whether the VRRP handshake time on both sides is consistent. |
Execute the display vrrp command. |
□ Normal □ Exceptional □ Not involved |
If the number of VRRP groups is less than 5, set the VRRP handshake time to 3 seconds. If the device has a number of VRRP groups, you can combine 3 or 5 VRRP groups as a group and set the handshake time of the new group to 3 seconds, 5 seconds, or 7 seconds. |
|
10 |
OSPF self-check |
Whether duplicate router IDs exist. |
Execute the display ospf peer command. |
□ Normal □ Exceptional □ Not involved |
If yes, route learning errors will occur. Change the router ID and execute the reset ospf process command to restart the OSPF process. |
|
Whether a great number of errors occur. |
Execute the display ospf statistics error command. |
□ Normal □ Exceptional □ Not involved |
If there are massive OSPF statistics errors and the number of OSPF statistics errors is increasing, capture data for analysis. |
||
|
Whether route flapping occurs. |
Execute the display ip routing-table statistics command to verify that the difference between the route adding or deletion time and system is small. |
□ Normal □ Exceptional □ Not involved |
If yes, figure out the route changed. Based on the route, discover the source device of the route and figure out the cause of route flapping. You can execute the display ospf lsdb command multiple times when an error occurs to check route age and determine the flapping route. |
||
|
OSPF stability |
Execute the display ospf peer command. |
□ Normal □ Exceptional □ Not involved |
Check the uptime of OSPF neighbors. |
||
|
11 |
ARP |
Whether a great number of ARP conflicts exist. |
Execute the display logbuffer command. |
□ Normal □ Exceptional □ Not involved |
Check for the IP addresses that involve the conflicts and figure out the hosts based on the IP addresses. |
|
12 |
Route |
Whether the default route is normal. Whether a route loop exists. |
Execute the tracert 1.1.1.1 (a network that does not exist) command to check for a route loop. Execute the debugging ip packet command to print packets and check for TTL=1 or TTL=0 in the packets. |
□ Normal □ Exceptional □ Not involved |
If a route loop exists, check the configuration of the devices corresponding to the route. Change the route to remove the route loop. If there are TTL expired packets, analyze the route corresponding to the network segment. |
|
14 |
Attack |
Whether enormous CPU attack packets exist. |
Execute the debugging rxtx softcar show command in probe view to check packet rate control information of devices. |
□ Normal □ Exceptional □ Not involved |
If the count of a type of packets increases continuously, an attack occurs. |
|
15 |
Exception records in local log |
Exception records in local log |
In the probe view, execute the local logbuffer display command. |
□ Normal □ Exceptional □ Not involved |
If exceptions are found, consult responsible persons to confirm the exceptions. Execute the local logbuffer clear command to clear historic records after upgrade. |
|
16 |
Log |
Exception records in the log |
Execute the display logbuff command or export the logfile. |
□ Normal □ Exceptional □ Not involved |
Check for alarm records, especially chip alarms, in the log. |
|
17 |
Diagnostic information analysis |
Core information in the diagnostic information |
Collect diagnostic information and use the diagnostic tool for analysis. |
□ Normal □ Exceptional □ Not involved |
For some 125 versions, collecting diagnostic information causes the device to restart. Confirm with the R&D engineer before launching this work. |
Routine inspection guide for high-end M9000
Check the system time
Whether the system time is consistent with local time.
· Targets
<user> display clock
· Pass criteria
The system time is consistent with local time.
· Example
![]()
Check the running information of each card
Whether the running state of each card is normal, and whether card versions are consistent.
· Targets
<user> display device verbose
· Pass criteria
Cards in position are normal and card versions are consistent.
· Example
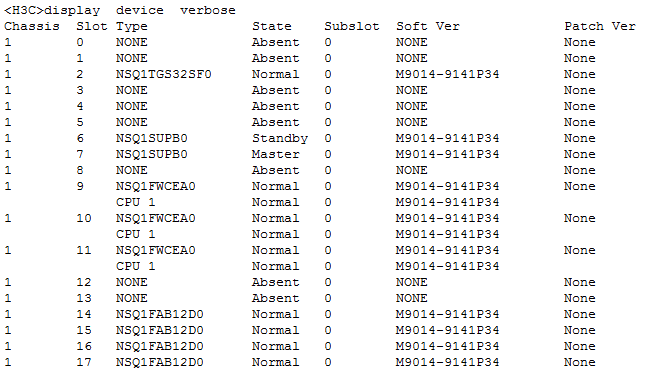
Check stacking interface status
· Check item
IRF link information
· Targets
<user> display irf link
· Pass criteria
Stacking interfaces are up.
· Example
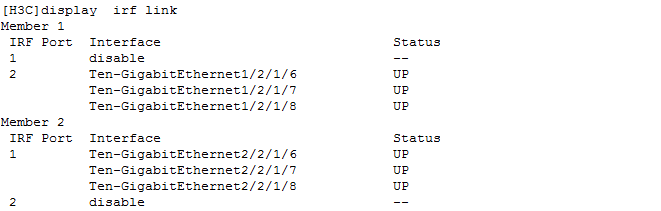
Check running days of devices
Uptime of each card
· Targets
<user> display version | include Up
· Pass criteria
In normal cases, uptime of different cards is consistent and the same as the software restart time.
· Example
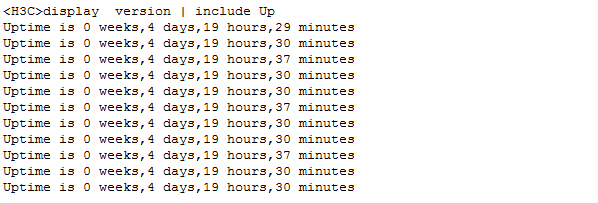
Check CPU usage of each card
CPU usage of each card
· Targets
<user> display cpu-usage
· Pass criteria
The CPU usage of each card is not higher than 70%.
· Example
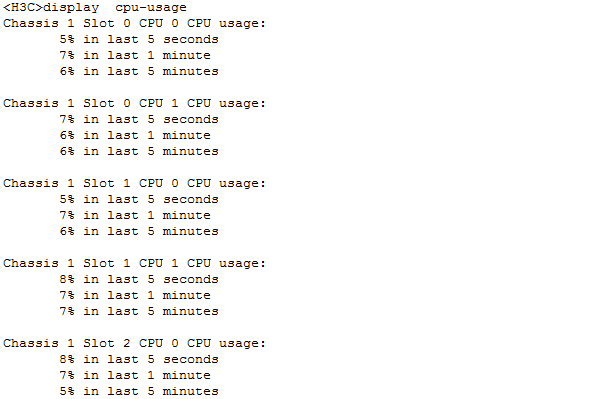
Check memory usage of each card
Memory usage of each card
· Targets
<user> display memory summary
· Pass criteria
The memory usage of all cards is equal to or higher than 30%.
· Example
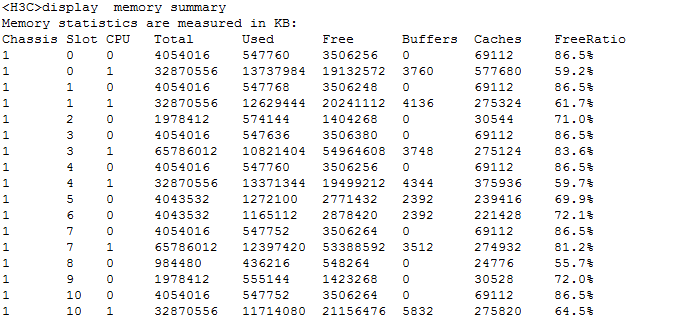
Check CRC error packet statistics of interfaces
· Check item
CRC error packet statistics of all interfaces
· Targets
<user> display interface | include CRC
· Pass criteria
No CRC error packets exist on any interface, or a small number of CRC error packets exist on interfaces but they do not increase.
· Example
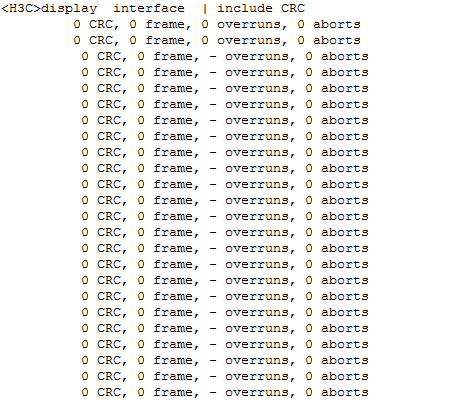
Check optical power statistics of interfaces
· Check item
Receive and transmit power of all optical interfaces
· Targets
<user> display transceiver diagnosis interface
· Pass criteria
The receive and transmit power of all optical interfaces is within the normal range.
· Example
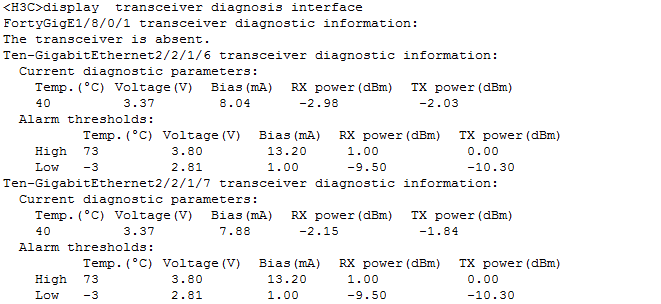
Check inbound packet rate
Interface usage, and rates of unicast packets, broadcast packets, and multicast packets
· Targets
<user> display counters rate inbound interface
· Pass criteria
The interface usage does not exceed 90%. Typically, the sum of the broadcast packet rates of all interfaces is smaller than 100k pps, and the sum of the multicast packet rates of all interfaces is smaller than 100k pps.
· Example
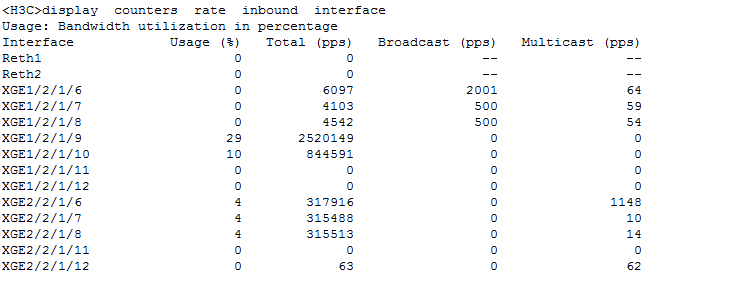
Check session establishment rate and concurrent sessions on service modules
Session establishment rate and concurrent sessions of service modules
· Targets
<user> display session statistics summary
· Pass criteria
The session establishment rate and concurrent sessions of service modules do not exceed the specifications. Performance varies with module model. For more information, see the performance of different modules.
· Example
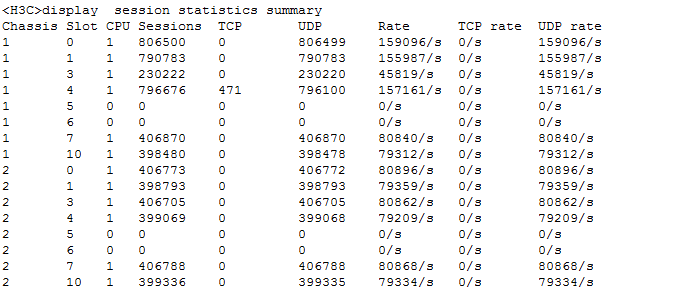
Check the vCPU usage of service modules
· Check item
vCPU usage of service modules
· Targets
<user> display process cpu chassis 1 slot 1 cpu 1 | include kdrvdp
· Pass criteria
Each vCPU usage does not exceed 2.0%. Usage limit varies by service module type. Divide 100% by the total number of vCPUs to get a value. The vCPU usage does not exceed 90% of this value.
· Example
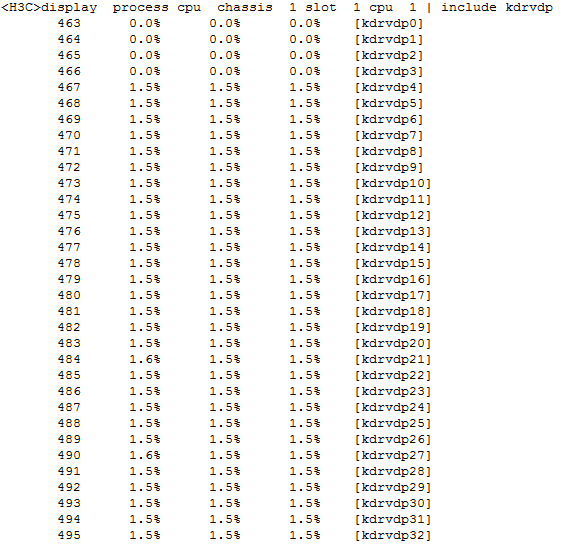
Check the number of sessions on logical banks
The number of sessions on all logical banks (supported only by blade4 and blade5)
· Targets
[user-probe] archer chassis 1 slot 3 cpu 1 0 0 sess-stat
[user-probe] archer chassis 1 slot 3 cpu 1 0 1 sess-stat
· Pass criteria
The DDRs of a logical bank are at the same statistical magnitude, and the total session count of each logical bank is at the same statistical magnitude.
· Example
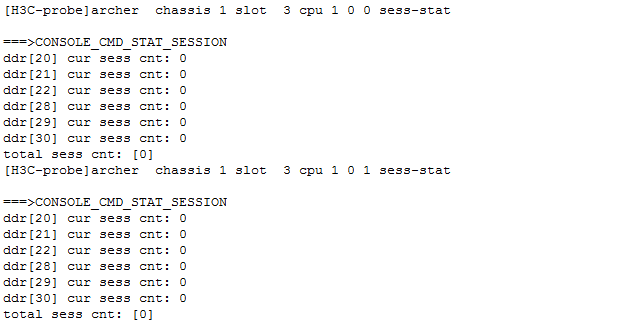
Check dynamic NAT444 resources
· Check item
Remaining dynamic NAT444 port resources
· Targets
<user> display nat statistics summary
· Pass criteria
Remaining dynamic NAT444 port resources are available. DPB represents the total number of dynamic port blocks. ADPB represents the number of allocated dynamic port blocks. The remaining dynamic NAT444 port resources are DPB minus ADPB.
· Example
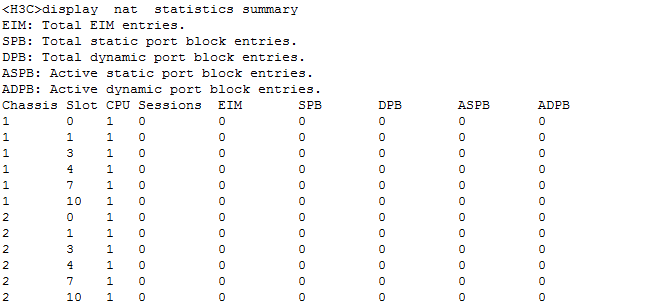
Check NAT statistics
· Check item
NAT statistics
· Targets
[user-probe] display system internal nat statistics chassis 1 slot 3 cpu 1
· Pass criteria
Check NAT statistics multiple times. The number of translation failure times does not increase.
· Example
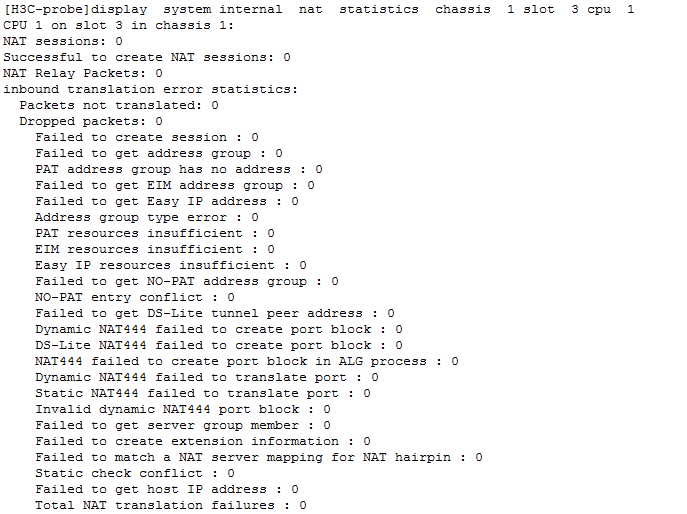
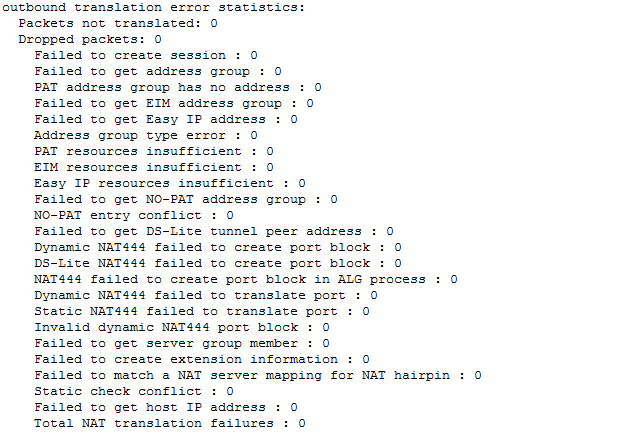
Check for software reset in logic
Whether software reset occurred in logic.
· Targets
Check for a file starting with fpga_0 on the flash memory of the MPU.
· Pass criteria
After software reset occurred in logic, the following files will be generated on the flash memory of the MPU. In this case, collect diagnosis information and contact H3C Support.
· Example
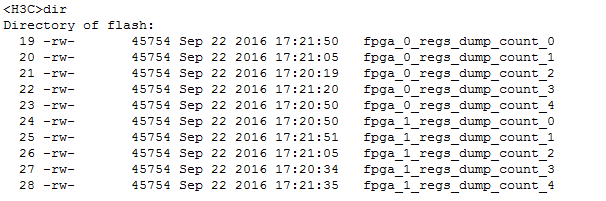
M9000 inspection report
|
Check item |
Check result |
Conclusion |
|
Check the system time. |
|
|
|
Check uptime of each card. |
|
|
|
Check stacking interface status. |
|
|
|
Check running days of devices. |
|
|
|
Check CPU usage of each card. |
|
|
|
Check memory usage of each card. |
|
|
|
Check CRC error packet statistics of interfaces. |
|
|
|
Check receive and transmit power of all optical interfaces. |
|
|
|
Check inbound packet rate. |
|
|
|
Check session establishment rate and concurrent sessions on service modules. |
|
|
|
Check vCPU usage of service modules. |
|
|
|
Check the number of sessions on logical banks. |
|
|
|
Check dynamic NAT444 resources. |
|
|
|
Check NAT statistics. |
|
|
|
Check for software reset in logic. |
|
|
Routine inspection guide for mid-end and low-end products
V9R6B03 (F5030&F5060&F5080)
Manual analysis
Collect the diagnostic information file, logfile,and diagfile, and analyze these files to generate reports.
Collect diagnostic information
Execute the display diagnostic-information command.
Press Y to save the file.
Collect logfile
Execute the display logfile summary command to obtain the path of the logfile.
Access the path to obtain the logfile.
Collect diagfile
Execute the display diagnostic-logfile summary command to obtain the path of the diagfile.
Access the path to obtain the diagfile.
Analysis
After the three files are collected, analyze the file content. If any exception exists, perform analysis on your own or contact the R&D engineers.
Common inspection commands
display device
· Check item
Device information
· Targets
Device information
· Pass criteria
The display device command displays device information. For the service modules, including the firewall interface card, they must be in normal state.
· Example
[user]dis device
Slot.No Cpu.Id Brd Type Brd Status Subslot Sft Ver Patch Ver
1 0 F5080 Normal 0 9660P26 None
1 0 NONE Absent 1 None None
1 0 NONE Absent 2 None None
1 0 NONE Absent 3 None None
1 0 NONE Absent 4 None None
1 0 NONE Absent 5 None None
1 0 NONE Absent 6 None None
1 0 NONE Absent 7 None None
1 0 NONE Absent 8 None None
display version
· Check item
Version information
· Targets
Version information
· Pass criteria
The display version command displays the system version information, mainly device version No. and uptime. The uptime of all modules must be basically equivalent without much difference. Generally, the time difference is no more than 5 minutes If the uptime of a module is much shorter than that of other boards, check whether the former module is restarted by an exception.
· Example
[user]dis version
H3C Comware Software, Version 7.1.064, Release 9660P26
Copyright (c) 2004-2022 New H3C Technologies Co., Ltd. All rights reserved.
H3C SecPath F5080 uptime is 0 weeks, 0 days, 0 hours, 12 minutes
Last reboot reason: User reboot
Boot image: sda0:/F5080FW-CMW710-BOOT-R9660P26.bin
Boot image version: 7.1.064, Release 9660P26
Compiled Jul 08 2022 14:00:00
System image: sda0:/F5080FW-CMW710-SYSTEM-R9660P26.bin
System image version: 7.1.064, Release 9660P26
Compiled Jul 08 2022 14:00:00
Feature image(s) list:
sda0:/F5080FW-CMW710-SECESCAN-R9660P26.bin, version: 7.1.064
Compiled Jul 08 2022 14:00:00
SLOT 1
Uptime is 0 weeks, 0 days, 0 hours, 12 minutes
CPU type: Multi-core CPU
DDR3 SDRAM Memory: 65520M bytes
SD0: 3728M bytes
NSQ1MPBHA PCB Version: Ver.B
NSQ1MPBBHB PCB Version: Ver.A
NSQ1MPHDBHA PCB Version: Ver.A
NSQ1MPGC4BHA PCB Version: Ver.A
NSQ1MPLEDBHA PCB Version: Ver.A
CPLD_A Version: 1.0
CPLD_B Version: 1.0
Release Version:SecPath F5080-9660P26
Basic BootWare Version:1.09
Extend BootWare Version:1.09
[SUBCARD 0] NSQ1MPBHA(Hardware)Ver.B, (Driver)1.0, (Cpld)1.0
Execute the display power command.
· Check item
Power module information
· Targets
Work status of a power module
· Pass criteria
The display power command displays the work status of a power module. A power module in position must be in normal status, and a power module not in position must be in absent status. If a power module in position is in a state other than normal, the power module is abnormal.
· Example
[user]dis power
Slot PowerID State Mode Current(A) Voltage(V) Power(W)
1 0 Normal AC 7.97 12.03 93.62 //Normal
1 1 Absent -- -- -- -- //The power module is absent. If the power module is actually in position, verify that the power module is powered on and operates normally.
Execute the display fan command.
· Check item
Fan information
· Targets
Work status of a fan
· Pass criteria
The display fan command displays the work status of a fan. If a fan is not in normal status, the fan is abnormal.
· Example
[user]dis fan
SLOT 1 Fan 0-0 Status: Normal Speed:5263 //The fan is normal.
SLOT 1 Fan 0-1 Status: Normal Speed:5172
SLOT 1 Fan 1-0 Status: Normal Speed:5172
SLOT 1 Fan 1-1 Status: Normal Speed:5172
display environment
· Check item
Temperature sensor
· Targets
Status of the temperature sensor
· Pass criteria
The display environment command displays the temperature information read by the temperature sensor, including current temperature and temperature alarm threshold. The temperature of all hotspots should not be lower than the lower limit or higher than the warning upper limit. Otherwise, an exception occurs.
· Example
[user]dis environment
System Temperature information (degree centigrade):
--------------------------------------------------------------------------------
---------
Slot Sensor Temperature LowerLimit Warning-UpperLimit Alarm-UpperLimit S
hutdown-UpperLimit
1 inflow 1 25 0 60 70
NA
1 inflow 2 23 0 60 70
NA
1 outflow 1 31 0 60 70
NA
1 hotspot 1 46 0 80 92
NA
display debugging
· Check item
Debugging feature
· Targets
Status of debugging feature
· Pass criteria
The display debugging command displays all enabled debugging features. In non-administrator debugging period, users are forbidden to enable the debugging feature.
· Example
<user> dis debugging /Check whether the debugging feature is enabled. If yes, execute the undo debugging all command to disable the debugging feature.
Execute the display interface brief command.
· Check item
Information of the specified interface
· Targets
Status of the specified interface
· Pass criteria
The display interface command displays current running status and other related information of the specified interface. The physical layer and link layer of all interfaces used by a service are in UP state. Interfaces not in use are all manually shut down. Pay attention to the interfaces that go down exceptionally.
· Example
<user> dis interface brief
Brief information on interfaces in route mode:
Link: ADM - administratively down; Stby - standby
Protocol: (s) - spoofing
Interface Link Protocol Primary IP Description
Dia0 UP UP(s) --
GE1/0/0 UP UP 172.32.51.116
GE1/0/1 DOWN DOWN --
GE1/0/2 DOWN DOWN --
GE1/0/3 DOWN DOWN --
InLoop0 UP UP(s) --
NULL0 UP UP(s) --
REG0 UP -- --
display context
· Check item
Context information of a tenant
· Targets
Context information of a tenant
· Pass criteria
The display context command displays the context information of a tenant. All contexts that are running online must be in the active status. Otherwise, the contexts are exceptional.
· Example
<user>dis context
ID Name Status Description
1 Admin active DefaultContext
2 1 active
Total contexts: 2
display transceiver diagnosis interface
· Check item
Digital diagnostic parameters of a hot swappable transceiver module
· Targets
Current measured values of digital diagnostic parameters of a hot swappable transceiver module
· Pass criteria
The display transceiver diagnosis command displays the current measured values of digital diagnostic parameters of a hot swappable transceiver module. The optical signal strength of the service interfaces must be in the range of the low threshold and high threshold in the TX and RX directions.
· Example
<user>dis transceiver diagnosis interface
GigabitEthernet1/0/0 transceiver diagnostic information:
The transceiver is absent.
GigabitEthernet1/0/1 transceiver diagnostic information:
Current diagnostic parameters:
Temp.(??C) Voltage(V) Bias(mA) RX power(dBm) TX power(dBm)
27 3.32 8.61 -26.78 -2.43
Alarm thresholds:
Temp.(??C) Voltage(V) Bias(mA) RX power(dBm) TX power(dBm)
High 73 3.80 13.20 1.00 0.00
Low -3 2.81 1.00 -9.50 -10.30
GigabitEthernet1/0/2 transceiver diagnostic information:
The transceiver is absent.
GigabitEthernet1/0/3 transceiver diagnostic information:
The transceiver is absent
display ip routing-table statistics
· Check item
General route statistics in a routing table
· Targets
General route statistics in a routing table
· Pass criteria
The display ip routing-table statistics command displays general route statistics in a routing table. The general route statistics include total number of routes, number of active routes, and number of routes added/deleted by routing protocols. There should be no route number changes during normal running of services or after service changes non-related to routes.
· Example
<user> display ip routing-table statistics
Total prefixes: 11 Active prefixes: 11
Proto route active added deleted
DIRECT 10 10 10 0
STATIC 1 1 1 0
RIP 0 0 0 0
OSPF 0 0 0 0
IS-IS 0 0 0 0
LISP 0 0 0 0
EIGRP 0 0 0 0
BGP 0 0 0 0
GUARD 0 0 0 0
Total 11 11 11 0
display cpu-usage
· Check item
CPU usage
· Targets
CPU usage
· Pass criteria
The display cpu-usage command displays the CPU usage. The CPU usage is below 70% (recommended rate for safe usage).
· Example
<user> dis cpu
Slot 1 CPU 0 CPU usage:
2% in last 5 seconds
2% in last 1 minute
2% in last 5 minutes
For slots that consume CPU heavily, execute the display cpu-usage history slot command to collect the CPU usage information for the slots in the past hour.
<user>display cpu-usage history
100%|
95%|
90%|
85%|
80%|
75%|
70%|
65%|
60%|
55%|
50%|
45%|
40%|
35%|
30%|
25%|
20%|
15%|
10%|
5%| # ##
------------------------------------------------------------
10 20 30 40 50 60 (minutes)
cpu-usage (Slot 1 CPU 0) last 60 minutes (SYSTEM)
The firewall performance indexes include creation, concurrency, and throughout. Different index combinations lead to different performance consumption, which is reflected on the CPU usage and memory usage of the system. Therefore, monitoring the CPU usage and memory usage is enough. The CPU usage represents the system's capability of handling throughput and creation, and the memory usage represents the system's capability of concurrent processing.
The CPU usage is below 70% (recommended rate for safe usage).
When a device becomes faulty, all traffic is switched to another device. Therefore, a device might take twice as much work, so the actual CPU usage of a device should not exceed 50% of the safe usage rate. In peak hours, the actual CPU usage should not exceed 35% (70% × 50%) and the actual memory usage should not exceed 40%.
display memory
· Check item
Memory usage
· Targets
Memory usage
· Pass criteria
The display memory command displays the memory usage. The free memory ratio is higher than 30%, or higher than 40% when the device is not busy. As a best practice, observe the memory usage continuously for several days. If the memory usage keeps high, there might be a memory leakage.
· Example
<USER>dis memory
Memory statistics are measured in KB:
Slot 1:
Total Used Free Shared Buffers Cached FreeRatio
Mem: 65786004 7196208 58589796 0 5688 497640 89.1%
-/+ Buffers/Cache: 6692880 59093124
Swap: 0 0 0
display session statistics
· Check item
Unicast session statistics
· Targets
Unicast session statistics
· Pass criteria
The display session statistics command displays the unicast session statistics. The counts for new sessions, concurrent sessions, TCP sessions, and UDP sessions fluctuate with service traffic in normal ranges.
· Example
<USER>display session statistics
Slot 1:
Current sessions: 0 //Total sessions in slot 2
TCP sessions: 0
UDP sessions: 0
ICMP sessions: 0
ICMPv6 sessions: 0
UDP-Lite sessions: 0
SCTP sessions: 0
DCCP sessions: 0
RAWIP sessions: 0
DNS sessions: 0
FTP sessions: 0
GTP sessions: 0
H323 sessions: 0
HTTP sessions: 0
ILS sessions: 0
MGCP sessions: 0
NBT sessions: 0
PPTP sessions: 0
RSH sessions: 0
RTSP sessions: 0
SCCP sessions: 0
SIP sessions: 0
SMTP sessions: 0
SQLNET sessions: 0
SSH sessions: 0
TELNET sessions: 0
TFTP sessions: 0
XDMCP sessions: 0
History average sessions per second:
Past hour: 0
Past 24 hours: 0
Past 30 days: 0
History average session establishment rate:
Past hour: 0/s
Past 24 hours: 0/s
Past 30 days: 0/s
Current relation table entries: 0
Session establishment rate: 0/s //Ratio of new sessions
TCP: 0/s
UDP: 0/s
ICMP: 0/s
ICMPv6: 0/s
UDP-Lite: 0/s
SCTP: 0/s
DCCP: 0/s
RAWIP: 0/s
Received TCP : 0 packets 0 bytes
Received UDP : 0 packets 0 bytes
Received ICMP : 0 packets 0 bytes
Received ICMPv6 : 0 packets 0 bytes
Received UDP-Lite : 0 packets 0 bytes
Received SCTP : 0 packets 0 bytes
Received DCCP : 0 packets 0 bytes
Received RAWIP : 0 packets 0 bytess
display interface GigabitEthernet | include Last
· Check item
Port traffic
· Targets
Port traffic statistics
· Pass criteria
The display interface GigabitEthernet | include Last command displays port traffic statistics. You can view the average input and output rates (packets/s and bytes/s) of the port in the last 300 seconds, and the ratio of the actual rate to the maximum rate.
· Example
<USER>display interface GigabitEthernet | include Last
Last link flapping: 3 hours 6 minutes 32 seconds
Last clearing of counters: Never
Last time when physical state changed to up:2022-07-21 10:52:23
Last time when physical state changed to down:2022-07-21 10:50:49
Last 300 second input: 4 packets/sec 336 bytes/sec 0% //System throughput refers to the total throughput of all ports.
Last 300 second output: 0 packets/sec 0 bytes/sec 0%
Last link flapping: Never
Last clearing of counters: Never
Last time when physical state changed to up:-
Last time when physical state changed to down:2022-07-21 10:50:49
Last 300 second input: 0 packets/sec 0 bytes/sec -%
Last 300 second output: 0 packets/sec 0 bytes/sec -%
Last link flapping: Never
Last clearing of counters: Never
Last time when physical state changed to up:-
Last time when physical state changed to down:2022-07-21 10:50:49
Last 300 second input: 0 packets/sec 0 bytes/sec -%
Last 300 second output: 0 packets/sec 0 bytes/sec -%
Last link flapping: Never
Last clearing of counters: Never
Last time when physical state changed to up:-
Last time when physical state changed to down:2022-07-21 10:50:49
Last 300 second input: 0 packets/sec 0 bytes/sec -%
Last 300 second output: 0 packets/sec 0 bytes/sec -%
display nat port-block dynamic
· Check item
Dynamic port block mapping
· Targets
Dynamic port block mapping
· Pass criteria
The display nat port-block dynamic command displays the dynamic port block mapping.
· Example
<USER>display nat port-block dynamic
Slot 1:
Local VPN Local IP Global IP Port block Connections
--- 101.1.1.12 192.168.135.201 10001-11024 1
Total mappings found: 1
display nat statistics
· Check item
NAT statistics
· Targets
NAT statistics
· Pass criteria
The display nat statistics command displays the NAT statistics.
· Example
<USER>display nat statistics
slot 1:
Total session entries : 390032 //Number of NAT session entries
Session creation rate: 0
Total EIM entries : 0
Total inbound NO-PAT entries : 0
Total outbound NO-PAT entries : 0
Total static port block entries: 0
Total dynamic port block entries: 61440 //Number of dynamic port block entries that can be created, that is, the number of dynamic port blocks that can be allocated, including allocated port blocks and unallocated port blocks
Active static port block entries: 0
Active dynamic port block entries: 8669 //Number of dynamic port block entries that have been created, that is, the number of allocated dynamic port blocks
Security device inspection report
After you inspect the security devices, provide the inspection report as shown in the following table.
Table 20 Device inspection report
|
Targets |
Instruction |
Result |
Remarks |
|
System running status |
See the command reference of the device. |
□ Normal □ Abnormal |
|
|
Alarms |
Identify whether the device has critical and abnormal alarms. See the command reference for more information. |
□ Normal □ Abnormal |
|
|
Device LEDs |
See the command reference of the device. |
□ Normal □ Abnormal |
|
|
CPU and memory status |
See the command reference of the device. |
□ Normal □ Abnormal |
|
|
Fan status |
Observe the rotation of the fans, and listen to the sound of the fans. The fans are operating correctly if you cannot hear any noise and the fans are rotating at a reasonable speed. |
□ Normal □ Abnormal |
|
|
Log query/export |
View logs of the device to identify whether the device has critical and abnormal alarms. See the command reference for more information. |
□ Normal □ Abnormal |
|
|
Telnet or SSH login |
Log in to the device through Telnet and SSL. See the command reference for more information. |
□ Normal □ Abnormal |
As a best practice, enable SSH and disable Telnet. |
|
Port statistics |
Display statistics about received, sent, and abnormal packets on each port of the device. See the command reference for more information. |
□ Normal □ Abnormal |
|
|
Ping |
See the command reference of the device. |
□ Normal □ Abnormal |
|
|
Network service port status |
Disable services (such as FTP server) when they are not in use. See the command reference for more information. |
□ Normal □ Abnormal |
|
|
System clock |
See the command reference of the device. |
□ Normal □ Abnormal |
|
|
Alarm and action |
Verify that the alarm and action function is normal. Verify that an alarm can be triggered and correct actions can be taken after the alarm is triggered. |
□ Normal □ Abnormal |
|
|
Network connectivity |
On the maintenance terminal for the center device, use an IP scanning tool to scan each network segment and verify the connectivity of each node. |
□ Normal □ Abnormal |
|
|
Network device port status |
Log in to a device from a maintenance terminal through the serial interface or Telnet. Execute corresponding commands in user view to display the status of each port. Make sure no CRC error or half duplex mode exists. |
□ Normal □ Abnormal |
|
|
Configuration backup |
Log in to a device from a maintenance terminal through the serial interface or Telnet. Execute the display cur command in user view and then save the displayed configuration. |
□ Normal □ Abnormal |
|
|
Device information |
Execute the display device command to display device information. Service modules and interface modules must be in normal state. Otherwise, this check item fails. |
□ Normal □ Abnormal |
|
|
Version number and uptime |
Execute the display version command to display system version information. The uptime of all modules must be basically equivalent without much difference. Generally, the time difference is no more than 5 minutes If the uptime of a module is much shorter than that of other boards, check whether the former module is restarted by an exception. |
□ Normal □ Abnormal |
|
|
Power module information |
Execute the display power command to display power module information of a device. A power module in position must be in normal status, and a power module not in position must be in absent status. If a power module in position is in a state other than normal, the power module is abnormal. |
□ Normal □ Abnormal |
|
|
Fan status |
Execute the display fan command to display fan status of a device. If a fan is not in normal status, the fan is abnormal. |
□ Normal □ Abnormal |
|
|
Temperature information |
Execute the display environment command to display temperature information read by the temperature sensors of a device, including the current temperature and the temperature thresholds. The temperature of all hotspots should not be lower than the lower limit or higher than the warning upper limit. Otherwise, an exception occurs. |
□ Normal □ Abnormal |
|
|
Status of debugging feature |
Execute the display debugging command to display enabled debugging features. In non-administrator debugging period, users are forbidden to enable the debugging feature. |
□ Normal □ Abnormal |
|
|
Interface running status |
Execute the display interface command to display current running status and other related information of the specified interface. The physical layer and link layer of all interfaces used by a service are in UP state. Interfaces not in use are all manually shut down. Pay attention to interfaces that go down exceptionally. |
□ Normal □ Abnormal |
|
|
Context status |
Execute the display context command to display the context information of a tenant. All contexts that are running online must be in the active status. Otherwise, the contexts are exceptional. |
□ Normal □ Abnormal |
|
|
RX power and TX power of transceiver modules |
Execute the display transceiver diagnosis command to display the current measured values of digital diagnostic parameters of a hot swappable transceiver module. The optical signal strength of the service interfaces must be in the range of the low threshold and high threshold in the TX and RX directions. Otherwise, an exception occurs. |
□ Normal □ Abnormal |
|
|
General route statistics in a routing table |
Execute the display ip routing-table statistics command to display general route statistics in a routing table. The general route statistics include total number of routes, number of active routes, and number of routes added/deleted by routing protocols. There should be no route number changes during normal running of services or after service changes non-related to routes. |
□ Normal □ Abnormal |
|
|
CPU usage |
Execute the display cpu-usage command to display the CPU usage. For slots that consume CPU heavily, execute the display cpu-usage history slot command to collect the CPU usage information for the slots in the past hour. The CPU usage is below 70% (recommended rate for safe usage). |
□ Normal □ Abnormal |
|
|
Memory usage |
Execute the display memory command to display the memory usage. The free memory ratio is higher than 30% or higher than 40% when the device is not busy. |
□ Normal □ Abnormal |
|
V9R3B02 (F5000)
Manual analysis
Collect the diagnostic information file, logfile,and diagfile, and analyze these files to generate reports.
Collect diagnostic information
Execute the display diagnostic-information command.
Press Y to save the file.
Collect logfile
Execute the display logfile summary command to obtain the path of the logfile.
Access the path to obtain the logfile.
Collect diagfile
Execute the display diagnostic-logfile summary command to obtain the path of the diagfile.
Access the path to obtain the diagfile.
Analysis
After the three files are collected, analyze the file content. If any exception exists, perform analysis on your own or contact the R&D engineers.
Common inspection commands
display device
· Check item
Device information
· Targets
Device information
· Pass criteria
The display device command displays device information. For the service modules, including the firewall interface card, they must be in normal state.
· Example
[USER] dis device
Slot.No Cpu.Id Brd Type Brd Status Subslot Sft Ver Patch Ver
1 0 F5040 Normal 0 9330P1705 None
1 0 NONE Absent 1 None None
2 0 F5040 Normal 0 9330P1705 None
2 0 NONE Absent 1 None None
display version
· Check item
Version information
· Targets
Version information
· Pass criteria
The display version command displays the system version information, mainly device version No. and uptime. The uptime of all modules must be basically equivalent without much difference. Generally, the time difference is no more than 5 minutes If the uptime of a module is much shorter than that of other boards, check whether the former module is restarted by an exception.
· Example
[USER]dis version
H3C Comware Software, Version 7.1.064, Release 9330P1705 //Version No.
Copyright (c) 2004-2019 New H3C Technologies Co., Ltd. All rights reserved.
H3C SecPath F5040 uptime is 5 weeks, 5 days, 1 hour, 20 minutes //Uptime
Last reboot reason: User reboot
Boot image: cfa0:/f5000fw-cmw710-boot-R9330P1705.bin
Boot image version: 7.1.064, Release 9330P1705
Compiled Jun 20 2019 16:00:00
System image: cfa0:/f5000fw-cmw710-system-R9330P1705.bin
System image version: 7.1.064, Release 9330P1705
Compiled Jun 20 2019 16:00:00
SLOT 1
CPU type: Multi-core CPU
DDR3 SDRAM Memory 32766M bytes
CF0 Card 4002M bytes
Board PCB Version:Ver.A
CPLD_A Version: 1.0
CPLD_B Version: 2.0
Release Version:SecPath F5040-9330P1705
Basic BootWare Version: 2.06
Extend BootWare Version: 2.06
display power
· Check item
Power module information
· Targets
Work status of a power module
· Pass criteria
The display power command displays the work status of a power module. A power module in position must be in normal status, and a power module not in position must be in absent status. If a power module in position is in a state other than normal, the power module is abnormal.
· Example
[USER]dis power
Slot 1 Power 0 Status: Normal //Normal
Slot 1 Power 1 Status: Absent //The power module is absent. If the power module is actually in position, verify that the power module is powered on and operates normally.
display fan
· Check item
Fan information
· Targets
Work status of a fan
· Pass criteria
The display fan command displays the work status of a fan. If a fan is not in normal status, the fan is abnormal.
· Example
[USER] dis fan
SLOT 1 Fan 0 Status: Normal Speed:2317 //The fan is normal.
SLOT 1 Fan 1 Status: Normal Speed:2441
SLOT 1 Fan 2 Status: Normal Speed:3329
SLOT 1 Fan 3 Status: Normal Speed:3269
display environment
· Check item
Temperature sensor
· Targets
Status of the temperature sensor
· Pass criteria
The display environment command displays the temperature information read by the temperature sensor, including current temperature and temperature alarm threshold. The temperature of all hotspots should not be lower than the lower limit or higher than the warning upper limit. Otherwise, an exception occurs.
· Example
[USER] dis environment
System Temperature information (degree centigrade):
-----------------------------------------------------------------------------------------
Slot Sensor Temperature LowerLimit Warning-UpperLimit Alarm-UpperLimit Shutdown-UpperLimit
1 inflow 1 35 0 60 70 NA
1 outflow 1 53 0 80 92 NA
2 inflow 1 35 0 60 70 NA
2 outflow 1 54 0 80 92 NA
display debugging
· Check item
Debugging feature
· Targets
Status of debugging feature
· Pass criteria
The display debugging command displays all enabled debugging features. In non-administrator debugging period, users are forbidden to enable the debugging feature.
· Example
<USER> dis debugging /Check whether the debugging feature is enabled. If yes, execute the undo debugging all command to disable the debugging feature.
display interface brief
· Check item
Information of the specified interface
· Targets
Status of the specified interface
· Pass criteria
The display interface command displays current running status and other related information of the specified interface. The physical layer and link layer of all interfaces used by a service are in UP state. Interfaces not in use are all manually shut down. Pay attention to the interfaces that go down exceptionally.
· Example
<USER> dis interface brief
Brief information on interfaces in route mode:
Link: ADM - administratively down; Stby - standby
Protocol: (s) - spoofing
Interface Link Protocol Primary IP Description
GE1/0/0 UP UP --
GE1/0/1 ADM DOWN --
GE1/0/2 ADM DOWN --
GE1/0/3 ADM DOWN --
GE1/0/4 ADM DOWN --
GE1/0/5 ADM DOWN --
GE1/0/6 ADM DOWN --
GE1/0/7 ADM DOWN --
GE1/0/8 ADM DOWN --
GE1/0/9 ADM DOWN --
GE1/0/10 ADM DOWN --
GE1/0/11 ADM DOWN --
GE1/0/12 DOWN DOWN --
GE1/0/13 DOWN DOWN --
GE1/0/14 ADM DOWN --
GE1/0/15 ADM DOWN --
GE1/0/16 DOWN DOWN -- TO_GX1_EP_FW_GE2/0/16-IRF
GE1/0/17 DOWN DOWN -- TO_GX1_EP_FW_GE2/0/17-IRF
GE1/0/20 ADM DOWN --
GE1/0/21 ADM DOWN --
GE1/0/22 ADM DOWN --
GE1/0/23 ADM DOWN --
InLoop0 UP UP(s) --
NULL0 UP UP(s) --
REG0 UP -- --
XGE1/0/24 DOWN DOWN --
XGE1/0/25 DOWN DOWN --
Vlan4094 DOWN DOWN 1.1.1.1 FOR_IRF-MAD
Brief information on interfaces in bridge mode:
Link: ADM - administratively down; Stby - standby
Speed: (a) - auto
Duplex: (a)/A - auto; H - half; F - full
Type: A - access; T - trunk; H - hybrid
Interface Link Speed Duplex Type PVID Description
GE1/0/18 DOWN auto A A 4094
GE1/0/19 DOWN auto A A 4094
XGE1/0/26 UP 10G(a) F(a) -- --
XGE1/0/27 UP 10G(a) F(a) -- --
display context
· Check item
Context information of a tenant
· Targets
Context information of a tenant
· Pass criteria
The display context command displays the context information of a tenant. All contexts that are running online must be in the active status. Otherwise, the contexts are exceptional.
· Example
<USER> dis context
ID Name Status Description
1 Admin active DefaultContext
2 hs active
display transceiver diagnosis interface
· Check item
Digital diagnostic parameters of a hot swappable transceiver module
· Targets
Current measured values of digital diagnostic parameters of a hot swappable transceiver module
· Pass criteria
The display transceiver diagnosis command displays the current measured values of digital diagnostic parameters of a hot swappable transceiver module. The optical signal strength of the service interfaces must be in the range of the low threshold and high threshold in the TX and RX directions.
· Example
<USER> dis transceiver diagnosis interface
GigabitEthernet1/0/12 transceiver diagnostic information:
Current diagnostic parameters:
Temp.(¡ãC) Voltage(V) Bias(mA) RX power(dBm) TX power(dBm)
32 3.30 3.60 -31.48 -5.22
Alarm thresholds:
Temp.(¡ãC) Voltage(V) Bias(mA) RX power(dBm) TX power(dBm)
High 81 3.80 44.00 0.00 3.00
Low 0 2.81 1.00 -16.99 -12.50
GigabitEthernet1/0/13 transceiver diagnostic information:
The transceiver is absent.
GigabitEthernet1/0/14 transceiver diagnostic information:
The transceiver is absent.
GigabitEthernet1/0/15 transceiver diagnostic information:
The transceiver is absent.
GigabitEthernet1/0/16 transceiver diagnostic information:
The transceiver is absent.
GigabitEthernet1/0/17 transceiver diagnostic information:
The transceiver is absent.
GigabitEthernet1/0/18 transceiver diagnostic information:
The transceiver is absent.
GigabitEthernet1/0/19 transceiver diagnostic information:
The transceiver is absent.
GigabitEthernet1/0/20 transceiver diagnostic information:
The transceiver is absent.
GigabitEthernet1/0/21 transceiver diagnostic information:
The transceiver is absent.
GigabitEthernet1/0/22 transceiver diagnostic information:
Current diagnostic parameters:
Temp.(¡ãC) Voltage(V) Bias(mA) RX power(dBm) TX power(dBm)
34 3.31 0.00 -27.45 -40.00
Alarm thresholds:
Temp.(¡ãC) Voltage(V) Bias(mA) RX power(dBm) TX power(dBm)
High 88 3.80 17.00 0.00 -2.00
Low -23 2.80 1.00 -16.99 -12.50
display ip routing-table statistics
· Check item
General route statistics in a routing table
· Targets
General route statistics in a routing table
· Pass criteria
The display ip routing-table statistics command displays general route statistics in a routing table. The general route statistics include total number of routes, number of active routes, and number of routes added/deleted by routing protocols. There should be no route number changes during normal running of services or after service changes non-related to routes.
· Example
<USER>display ip routing-table statistics
Proto route active added deleted
DIRECT 55 55 101 46
STATIC 0 0 0 0
RIP 0 0 0 0
OSPF 0 0 0 0
IS-IS 1065 1060 4669 3604
BGP 7222 7148 29456 22234
Total 8342 8263 34226 25884
display cpu-usage
· Check item
CPU usage
· Targets
CPU usage
· Pass criteria
The display cpu-usage command displays the CPU usage. The CPU usage is below 70% (recommended rate for safe usage).
· Example
<USER>dis cpu
Slot 1 CPU 0 CPU usage:
1% in last 5 seconds
1% in last 1 minute
1% in last 5 minutes
For slots that consume CPU heavily, execute the display cpu-usage history slot command to collect the CPU usage information for the slots in the past hour.
<USER>display cpu-usage history
100%|
95%|
90%|
85%|
80%|
75%|
70%|
65%|
60%|
55%|
50%|
45%|
40%|
35%|
30%|
25%|
20%|
15%|############################################################
10%|############################################################
5%|############################################################
------------------------------------------------------------
10 20 30 40 50 60 (minutes)
The firewall performance indexes include creation, concurrency, and throughout. Different index combinations lead to different performance consumption, which is reflected on the CPU usage and memory usage of the system. Therefore, monitoring the CPU usage and memory usage is enough. The CPU usage represents the system's capability of handling throughput and creation, and the memory usage represents the system's capability of concurrent processing.
When a device becomes faulty, all traffic is switched to another device. Therefore, a device might take twice as much work, so the actual CPU usage of a device should not exceed 50% of the safe usage rate. In peak hours, the actual CPU usage should not exceed 35% (70% × 50%) and the actual memory usage should not exceed 40%.
display memory
· Check item
Memory usage
· Targets
Memory usage
· Pass criteria
The display memory command displays the memory usage. The free memory ratio is higher than 30%, or higher than 40% when the device is not busy. As a best practice, observe the memory usage continuously for several days. If the memory usage keeps high, there might be a memory leakage.
· Example
<USER>dis memory
Memory statistics are measured in KB:
Slot 1:
Total Used Free Shared Buffers Cached FreeRatio
Mem: 32870548 5096724 27773824 0 6116 300328 84.6%
-/+ Buffers/Cache: 4790280 28080268
Swap: 0 0 0
display session statistics
· Check item
Unicast session statistics
· Targets
Unicast session statistics
· Pass criteria
The display session statistics command displays the unicast session statistics. The counts for new sessions, concurrent sessions, TCP sessions, and UDP sessions fluctuate with service traffic in normal ranges.
· Example
<USER>display session statistics
slot 1:
Current sessions: 401607 //Total sessions in slot 2
TCP sessions: 172415
UDP sessions: 225813
ICMP sessions: 3361
ICMPv6 sessions: 0
UDP-Lite sessions: 0
SCTP sessions: 0
DCCP sessions: 0
RAWIP sessions: 18
Current relation-table entries: 10
Session establishment rate: 7149/s //Ratio of new sessions
TCP: 3386/s
UDP: 3667/s
ICMP: 96/s
ICMPv6: 0/s
UDP-Lite: 0/s
SCTP: 0/s
DCCP: 0/s
RAWIP: 0/s
Received TCP : 1930950294904 packets 1594088348378867 bytes
Received UDP : 1104412445138 packets 709911282596907 bytes
Received ICMP : 3127546240 packets 181290884291 bytes
Received ICMPv6 : 0 packets 0 bytes
Received UDP-Lite : 0 packets 0 bytes
Received SCTP : 0 packets 0 bytes
Received DCCP : 0 packets 0 bytes
Received RAWIP : 522107805 packets 277323418293 bytes
display interface Ten-GigabitEthernet | include Last
· Check item
Port traffic
· Targets
Port traffic statistics
· Pass criteria
The display interface Ten-GigabitEthernet | include Last command displays port traffic statistics. You can view the average input and output rates (packets/s and bytes/s) of the port in the last 300 seconds, and the ratio of the actual rate to the maximum rate.
· Example
<USER> display interface Ten-GigabitEthernet | include Last
Last clearing of counters: Never
Last 300 seconds input: 352744 packets/sec 270443466 bytes/sec 22% //Sum of throughputs of all ports is the throughput of the entire device.
Last 300 seconds output: 356291 packets/sec 287455734 bytes/sec 23%
Last clearing of counters: Never
Last 300 seconds input: 358131 packets/sec 276824968 bytes/sec 22%
Last 300 seconds output: 340945 packets/sec 267209554 bytes/sec 21%
Last clearing of counters: Never
Last 300 seconds input: 0 packets/sec 0 bytes/sec -%
Last 300 seconds output: 0 packets/sec 0 bytes/sec -%
Last clearing of counters: Never
Last 300 seconds input: 0 packets/sec 0 bytes/sec -%
Last 300 seconds output: 0 packets/sec 0 bytes/sec -%
display nat port-block dynamic
· Check item
Dynamic port block mapping
· Targets
Dynamic port block mapping
· Pass criteria
The display nat port-block dynamic command displays the dynamic port block mapping.
· Example
<USER>display nat port-block dynamic
slot 1:
Dynamic port-block mapping tables:
Local VPN Local IP Global IP Port block Connections
--- 100.96.0.2 117.26.160.2 17536-21535 7
--- 100.96.0.4 220.161.224.4 1536-5535 28
--- 100.96.0.6 117.26.160.6 1536-5535 41
--- 100.96.0.8 220.161.224.8 13536-17535 4
--- 100.96.0.10 117.26.162.10 37536-41535 223
--- 100.96.0.12 117.26.160.12 25536-29535 14
--- 100.96.0.14 117.26.162.14 61536-65535 9
--- 100.96.0.16 117.26.160.16 21536-25535 16
--- 100.96.0.20 117.26.162.20 9536-13535 163
--- 100.96.0.24 117.26.162.24 5536-9535 10
--- 100.96.0.26 117.26.160.26 45536-49535 12
--- 100.96.0.28 220.161.224.28 37536-41535 17
--- 100.96.0.30 117.26.162.30 57536-61535 5
display nat statistics
· Check item
NAT statistics
· Targets
NAT statistics
· Pass criteria
The display nat statistics command displays the NAT statistics.
· Example
<USER>display nat statistics
slot 1:
Total session entries count: 390032 //Number of NAT session entries
Total EIM entries count: 0
Total inbound NO-PAT entries count: 0
Total outbound NO-PAT entries count: 0
Total static port block entries: 0
Total dynamic port block entries: 61440 //Number of dynamic port block entries that can be created, that is, the number of dynamic port blocks that can be allocated, including allocated port blocks and unallocated port blocks
Active static port block entries: 0
Active dynamic port block entries: 8669 //Number of dynamic port block entries that have been created, that is, the number of allocated dynamic port blocks
Security device inspection report
After you inspect the security devices, provide the inspection report as shown in the following table.
|
Targets |
Instruction |
Result |
Remarks |
|
System running status |
See the command reference of the device. |
□ Normal □ Abnormal |
|
|
Alarms |
Identify whether the device has critical and abnormal alarms. See the command reference for more information. |
□ Normal □ Abnormal |
|
|
Device LEDs |
See the command reference of the device. |
□ Normal □ Abnormal |
|
|
CPU and memory status |
See the command reference of the device. |
□ Normal □ Abnormal |
|
|
Fan status |
Observe the rotation of the fans, and listen to the sound of the fans. The fans are operating correctly if you cannot hear any noise and the fans are rotating at a reasonable speed. |
□ Normal □ Abnormal |
|
|
Log query/export |
View logs of the device to identify whether the device has critical and abnormal alarms. See the command reference for more information. |
□ Normal □ Abnormal |
|
|
Telnet or SSH login |
Log in to the device through Telnet and SSL. See the command reference for more information. |
□ Normal □ Abnormal |
As a best practice, enable SSH and disable Telnet. |
|
Port statistics |
Display statistics about received, sent, and abnormal packets on each port of the device. See the command reference for more information. |
□ Normal □ Abnormal |
|
|
Ping |
See the command reference of the device. |
□ Normal □ Abnormal |
|
|
Network service port status |
Disable services (such as FTP server) when they are not in use. See the command reference for more information. |
□ Normal □ Abnormal |
|
|
System clock |
See the command reference of the device. |
□ Normal □ Abnormal |
|
|
Alarm and action |
Verify that the alarm and action function is normal. Verify that an alarm can be triggered and correct actions can be taken after the alarm is triggered. |
□ Normal □ Abnormal |
|
|
Network connectivity |
On the maintenance terminal for the center device, use an IP scanning tool to scan each network segment and verify the connectivity of each node. |
□ Normal □ Abnormal |
|
|
Network device port status |
Log in to a device from a maintenance terminal through the serial interface or Telnet. Execute corresponding commands in user view to display the status of each port. Make sure no CRC error or half duplex mode exists. |
□ Normal □ Abnormal |
|
|
Configuration backup |
Log in to a device from a maintenance terminal through the serial interface or Telnet. Execute the display cur command in user view and then save the displayed configuration. |
□ Normal □ Abnormal |
|
|
Device information |
Execute the display device command to display device information. Service modules and interface modules must be in normal state. Otherwise, this check item fails. |
□ Normal □ Abnormal |
|
|
Version number and uptime |
Execute the display version command to display system version information. The uptime of all modules must be basically equivalent without much difference. Generally, the time difference is no more than 5 minutes If the uptime of a module is much shorter than that of other boards, check whether the former module is restarted by an exception. |
□ Normal □ Abnormal |
|
|
Power module information |
Execute the display power command to display power module information of a device. A power module in position must be in normal status, and a power module not in position must be in absent status. If a power module in position is in a state other than normal, the power module is abnormal. |
□ Normal □ Abnormal |
|
|
Fan status |
Execute the display fan command to display fan status of a device. If a fan is not in normal status, the fan is abnormal. |
□ Normal □ Abnormal |
|
|
Temperature information |
Execute the display environment command to display temperature information read by the temperature sensors of a device, including the current temperature and the temperature thresholds. The temperature of all hotspots should not be lower than the lower limit or higher than the warning upper limit. Otherwise, an exception occurs. |
□ Normal □ Abnormal |
|
|
Status of debugging feature |
Execute the display debugging command to display enabled debugging features. In non-administrator debugging period, users are forbidden to enable the debugging feature. |
□ Normal □ Abnormal |
|
|
Interface running status |
Execute the display interface command to display current running status and other related information of the specified interface. The physical layer and link layer of all interfaces used by a service are in UP state. Interfaces not in use are all manually shut down. Pay attention to interfaces that go down exceptionally. |
□ Normal □ Abnormal |
|
|
Context status |
Execute the display context command to display the context information of a tenant. All contexts that are running online must be in the active status. Otherwise, the contexts are exceptional. |
□ Normal □ Abnormal |
|
|
RX power and TX power of transceiver modules |
Execute the display transceiver diagnosis command displays the current measured values of digital diagnostic parameters of a hot swappable transceiver module. The optical signal strength of the service interfaces must be in the range of the low threshold and high threshold in the TX and RX directions. Otherwise, an exception occurs. |
□ Normal □ Abnormal |
|
|
General route statistics in a routing table |
Execute the display ip routing-table statistics command to display general route statistics in a routing table. The general route statistics include total number of routes, number of active routes, and number of routes added/deleted by routing protocols. There should be no route number changes during normal running of services or after service changes non-related to routes. |
□ Normal □ Abnormal |
|
|
CPU usage |
Execute the display cpu-usage command to display the CPU usage. For slots that consume CPU heavily, execute the display cpu-usage history slot command to collect the CPU usage information for the slots in the past hour. The CPU usage is below 70% (recommended rate for safe usage). |
□ Normal □ Abnormal |
|
|
Memory usage |
Execute the display memory command to display the memory usage. The free memory ratio is higher than 30% or higher than 40% when the device is not busy. |
□ Normal □ Abnormal |
|
V800R005 (S105 SecBlade IV)
Manual analysis
Collect the diagnostic information file, logfile,and diagfile, and analyze these files to generate reports.
Collect diagnostic information
Execute the display diagnostic-information command.
Press Y to save the file.
Collect logfile
Execute the display logfile summary command to obtain the path of the logfile.
Access the path to obtain the logfile.
Collect diagfile
Execute the display diagnostic-logfile summary command to obtain the path of the diagfile.
Access the path to obtain the diagfile.
Analysis
After the three files are collected, analyze the file content. If any exception exists, perform analysis on your own or contact the R&D engineers.
Common inspection commands
display device
· Check item
Device information
· Targets
Device information
· Pass criteria
The display device command displays device information. For the service modules, including the firewall interface card, they must be in normal state.
· Example
<USER>display device
Slot.No Cpu.Id Brd Type Brd Status Subslot Sft Ver Patch Ver
1 0 LSUM1FWDEC0 Normal 0 8560P26 None
display version
· Check item
Version information
· Targets
Version information
· Pass criteria
The display version command displays the system version information, mainly device version No. and uptime. The uptime of all modules must be basically equivalent without much difference. Generally, the time difference is no more than 5 minutes If the uptime of a module is much shorter than that of other boards, check whether the former module is restarted by an exception.
· Example
<USER> display version
H3C Comware Software, Version 7.1.064, Release 8560P26 //Version information
Copyright (c) 2004-2022 New H3C Technologies Co., Ltd. All rights reserved.
H3C SecBlade IV NGFW Module uptime is 0 weeks, 0 days, 0 hours, 21 minutes //Uptime
Last reboot reason: User reboot
Boot image: sda0:/BLADE4FW-CMW710-BOOT-R8560P26.bin
Boot image version: 7.1.064, Release 8560P26
Compiled Jul 08 2022 14:00:00
System image: sda0:/BLADE4FW-CMW710-SYSTEM-R8560P26.bin
System image version: 7.1.064, Release 8560P26
Compiled Jul 08 2022 14:00:00
Feature image(s) list:
sda0:/BLADE4FW-CMW710-SECESCAN-R8560P26.bin, version: 7.1.064
Compiled Jul 08 2022 14:00:00
SLOT 1
Uptime is 0 weeks, 0 days, 0 hours, 21 minutes
CPU type: Multi-core CPU
DDR3 : 32752M bytes
SD0: 7695M bytes
Board PCB Version: Ver.A
CPLD Version: 3.0
Release Version: SecBlade FW Enhanced Module-8560P26
Basic BootWare Version:1.15
Extend BootWare Version:1.15
display environment
· Check item
Temperature sensor
· Targets
Status of the temperature sensor
· Pass criteria
The display environment command displays the temperature information read by the temperature sensor, including current temperature and temperature alarm threshold. The temperature of all hotspots should not be lower than the lower limit or higher than the warning upper limit. Otherwise, an exception occurs.
· Example
<USER> display environment
System Temperature information (degree centigrade):
-----------------------------------------------------------------------------------------
Slot Sensor Temperature LowerLimit Warning-UpperLimit Alarm-UpperLimit Shutdown-UpperLimit
1 inflow 1 34 0 60 70 NA
1 outflow 1 48 0 80 92 NA
display debugging
· Check item
Debugging feature
· Targets
Status of debugging feature
· Pass criteria
The display debugging command displays all enabled debugging features. In non-administrator debugging period, users are forbidden to enable the debugging feature.
· Example
<USER> dis debugging /Check whether the debugging feature is enabled. If yes, execute the undo debugging all command to disable the debugging feature.
|
|
NOTE: In non-administrator debugging period, users are forbidden to enable the debugging feature. |
display interface brief
The display interface command displays current running status and other related information of the specified interface.
<USER> display interface brief
Brief information on interfaces in route mode:
Link: ADM - administratively down; Stby - standby
Protocol: (s) - spoofing
Interface Link Protocol Primary IP Description
FGE1/0/1 UP UP --
FGE1/0/2 DOWN DOWN --
FGE1/0/3 UP UP --
GE1/0/1 UP UP --
InLoop0 UP UP(s) --
Loop0 UP UP(s) 1.1.1.1
Loop999 ADM UP(s) --
NULL0 UP UP(s) --
REG0 UP -- --
Reth1 DOWN DOWN 171.221.250.49 To-DX
Reth2 DOWN DOWN 183.222.63.19 To-YD
Reth3 DOWN DOWN 10.100.0.1 LAN
RAGG1 DOWN DOWN -- M-Device-LINK
RAGG3 DOWN DOWN --
RAGG10 DOWN DOWN --
SSLVPN-AC1 ADM DOWN 172.16.1.1
Tun0 DOWN DOWN --
VT1 DOWN DOWN 172.16.10.1
Vlan1 ADM DOWN --
Vlan2300 DOWN DOWN 192.85.1.1
Vlan2400 DOWN DOWN 192.85.2.1
Vlan4091 DOWN DOWN -- MAD-BFD
Brief information on interfaces in bridge mode:
Link: ADM - administratively down; Stby - standby
Speed: (a) - auto
Duplex: (a)/A - auto; H - half; F - full
Type: A - access; T - trunk; H - hybrid
Interface Link Speed Duplex Type PVID Description
BAGG1 DOWN auto A T 1
display context
· Check item
Context information of a tenant
· Targets
Context information of a tenant
· Pass criteria
The display context command displays the context information of a tenant. All contexts that are running online must be in the active status. Otherwise, the contexts are exceptional.
· Example
<USER> dis context
ID Name Status Description
1 Admin active DefaultContext
2 test active
display ip routing-table statistics
· Check item
General route statistics in a routing table
· Targets
General route statistics in a routing table
· Pass criteria
The display ip routing-table statistics command displays general route statistics in a routing table. The general route statistics include total number of routes, number of active routes, and number of routes added/deleted by routing protocols. There should be no route number changes during normal running of services or after service changes non-related to routes.
· Example
<USER> display ip routing-table statistics
Total prefixes: 13 Active prefixes: 13
Proto route active added deleted
DIRECT 13 13 13 0
STATIC 0 0 0 0
RIP 0 0 0 0
OSPF 1 0 1 0
IS-IS 0 0 0 0
LISP 0 0 0 0
EIGRP 0 0 0 0
BGP 0 0 0 0
GUARD 0 0 0 0
Total 14 13 14 0
display cpu-usage
· Check item
CPU usage
· Targets
CPU usage
· Pass criteria
The display cpu-usage command displays the CPU usage. The CPU usage is below 70% (recommended rate for safe usage).
· Example
<USER>dis cpu
Slot 1 CPU 0 CPU usage:
0% in last 5 seconds
0% in last 1 minute
0% in last 5 minutes
For slots that consume CPU heavily, execute the display cpu-usage history slot command to collect the CPU usage information for the slots in the past hour.
<USER>dis cpu-usage history
100%|
95%|
90%|
85%|
80%|
75%|
70%|
65%|
60%|
55%|
50%|
45%|
40%|
35%|
30%|
25%|
20%|
15%|
10%|
5%|
------------------------------------------------------------
10 20 30 40 50 60 (minutes)
cpu-usage (Slot 1 CPU 0) last 60 minutes (SYSTEM)
The firewall performance indexes include creation, concurrency, and throughout. Different index combinations lead to different performance consumption, which is reflected on the CPU usage and memory usage of the system. Therefore, monitoring the CPU usage and memory usage is enough. The CPU usage represents the system's capability of handling throughput and creation, and the memory usage represents the system's capability of concurrent processing.
When a device becomes faulty, all traffic is switched to another device. Therefore, a device might take twice as much work, so the actual CPU usage of a device should not exceed 50% of the safe usage rate. In peak hours, the actual CPU usage should not exceed 35% (70% × 50%) and the actual memory usage should not exceed 40%.
display memory
· Check item
Memory usage
· Targets
Memory usage
· Pass criteria
The display memory command displays the memory usage. The free memory ratio is higher than 30%, or higher than 40% when the device is not busy. As a best practice, observe the memory usage continuously for several days. If the memory usage keeps high, there might be a memory leakage.
· Example
<USER>display memory
Memory statistics are measured in KB:
Slot 1:
Total Used Free Shared Buffers Cached FreeRatio
Mem: 32870548 7481164 25389384 0 11172 657756 78.0%
-/+ Buffers/Cache: 6812236 26058312
Swap: 0 0 0
display session statistics
· Check item
Unicast session statistics
· Targets
Unicast session statistics
· Pass criteria
The display session statistics command displays the unicast session statistics. The counts for new sessions, concurrent sessions, TCP sessions, and UDP sessions fluctuate with service traffic in normal ranges.
· Example
<USER>display session statistics
Slot 1:
Current sessions: 0 //Total sessions in slot 2
TCP sessions: 0
UDP sessions: 0
ICMP sessions: 0
ICMPv6 sessions: 0
UDP-Lite sessions: 0
SCTP sessions: 0
DCCP sessions: 0
RAWIP sessions: 0
DNS sessions: 0
FTP sessions: 0
GTP sessions: 0
H323 sessions: 0
HTTP sessions: 0
ILS sessions: 0
MGCP sessions: 0
NBT sessions: 0
PPTP sessions: 0
RSH sessions: 0
RTSP sessions: 0
SCCP sessions: 0
SIP sessions: 0
SMTP sessions: 0
SQLNET sessions: 0
SSH sessions: 0
TELNET sessions: 0
TFTP sessions: 0
XDMCP sessions: 0
History average sessions per second:
Past hour: 0
Past 24 hours: 0
Past 30 days: 0
History average session establishment rate:
Past hour: 0/s
Past 24 hours: 0/s
Past 30 days: 0/s
Current relation table entries: 0
Relation table establishment rate: 0/s
Session establishment rate: 0/s //Ratio of new sessions
TCP: 0/s
UDP: 0/s
ICMP: 0/s
ICMPv6: 0/s
UDP-Lite: 0/s
SCTP: 0/s
DCCP: 0/s
RAWIP: 0/s
Received TCP : 0 packets 0 bytes
Received UDP : 42 packets 5554 bytes
Received ICMP : 0 packets 0 bytes
Received ICMPv6 : 0 packets 0 bytes
Received UDP-Lite : 0 packets 0 bytes
Received SCTP : 0 packets 0 bytes
Received DCCP : 0 packets 0 bytes
Received RAWIP : 0 packets 0 bytes
display interface FortyGigE | include Last
· Check item
Port traffic
· Targets
Port traffic statistics
· Pass criteria
The display interface Ten-GigabitEthernet | include Last command displays port traffic statistics. You can view the average input and output rates (packets/s and bytes/s) of the port in the last 300 seconds, and the ratio of the actual rate to the maximum rate.
· Example
<USER> display interface FortyGigE | include Last
Last link flapping: 1 hours 22 minutes 34 seconds
Last clearing of counters: Never
Last time when physical state changed to up:2022-07-21 14:03:56 Beijing+08:00:00
Last time when physical state changed to down:2022-07-21 06:01:53 Beijing+08:00:00
Last 300 second input: 2 packets/sec 118 bytes/sec 0%
Last 300 second output: 0 packets/sec 11 bytes/sec 0%
Last link flapping: Never
Last clearing of counters: Never
Last time when physical state changed to up:-
Last time when physical state changed to down:2022-07-21 06:01:53 Beijing+08:00:00
Last 300 second input: 0 packets/sec 0 bytes/sec -%
Last 300 second output: 0 packets/sec 0 bytes/sec -%
Last link flapping: 1 hours 22 minutes 34 seconds
Last clearing of counters: Never
Last time when physical state changed to up:2022-07-21 14:03:56 Beijing+08:00:00
Last time when physical state changed to down:2022-07-21 06:01:53 Beijing+08:00:00
Last 300 second input: 0 packets/sec 10 bytes/sec 0%
Last 300 second output: 0 packets/sec 11 bytes/sec 0%
display nat port-block dynamic
· Check item
Dynamic port block mapping
· Targets
Dynamic port block mapping
· Pass criteria
The display nat port-block dynamic command displays the dynamic port block mapping.
· Example
<USER> dis nat port-block dynamic
Slot 1:
Local VPN Local IP Global IP Port block Connections
Total mappings found: 0 display nat statistics
· Check item
NAT statistics
· Targets
NAT statistics
· Pass criteria
The display nat statistics command displays the NAT statistics.
· Example
<USER>display nat statistics
Slot 1:
Total session entries: 0 //Number of NAT session entries
Session creation rate: 0
Total EIM entries: 0
Total inbound NO-PAT entries: 0
Total outbound NO-PAT entries: 0
Total static port block entries: 0
Total dynamic port block entries: 0 //Number of dynamic port block entries that can be created, that is, the number of dynamic port blocks that can be allocated, including allocated port blocks and unallocated port blocks
Active static port block entries: 0
Active dynamic port block entries: 0 //Number of dynamic port block entries that have been created, that is, the number of allocated dynamic port blocks
Security device inspection report
After you inspect the security devices, provide the inspection report as shown in the following table.
Table 21 Device inspection report
|
Targets |
Instruction |
Result |
Remarks |
|
System running status |
See the command reference of the device. |
□ Normal □ Abnormal |
|
|
Alarms |
Identify whether the device has critical and abnormal alarms. See the command reference for more information. |
□ Normal □ Abnormal |
|
|
Device LEDs |
See the command reference of the device. |
□ Normal □ Abnormal |
|
|
CPU and memory status |
See the command reference of the device. |
□ Normal □ Abnormal |
|
|
Log query/export |
View logs of the device to identify whether the device has critical and abnormal alarms. See the command reference for more information. |
□ Normal □ Abnormal |
|
|
Telnet or SSH login |
Log in to the device through Telnet and SSL. See the command reference for more information. |
□ Normal □ Abnormal |
As a best practice, enable SSH and disable Telnet. |
|
Port statistics |
Display statistics about received, sent, and abnormal packets on each port of the device. See the command reference for more information. |
□ Normal □ Abnormal |
|
|
Ping |
See the command reference of the device. |
□ Normal □ Abnormal |
|
|
Network service port status |
Disable services (such as FTP server) when they are not in use. See the command reference for more information. |
□ Normal □ Abnormal |
|
|
System clock |
See the command reference of the device. |
□ Normal □ Abnormal |
|
|
Alarm and action |
Verify that the alarm and action function is normal. Verify that an alarm can be triggered and correct actions can be taken after the alarm is triggered. |
□ Normal □ Abnormal |
|
|
Network connectivity |
On the maintenance terminal for the center device, use an IP scanning tool to scan each network segment and verify the connectivity of each node. |
□ Normal □ Abnormal |
|
|
Network device port status |
Log in to a device from a maintenance terminal through the serial interface or Telnet. Execute corresponding commands in user view to display the status of each port. Make sure no CRC error or half duplex mode exists. |
□ Normal □ Abnormal |
|
|
Configuration backup |
Log in to a device from a maintenance terminal through the serial interface or Telnet. Execute the display cur command in user view and then save the displayed configuration. |
□ Normal □ Abnormal |
|
|
Device information |
Execute the display device command to display device information. Service modules and interface modules must be in normal state. Otherwise, this check item fails. |
□ Normal □ Abnormal |
|
|
Version number and uptime |
Execute the display version command to display system version information. The uptime of all modules must be basically equivalent without much difference. Generally, the time difference is no more than 5 minutes If the uptime of a module is much shorter than that of other boards, check whether the former module is restarted by an exception. |
□ Normal □ Abnormal |
|
|
Temperature information |
Execute the display environment command to display temperature information read by the temperature sensors of a device, including the current temperature and the temperature thresholds. The temperature of all hotspots should not be lower than the lower limit or higher than the warning upper limit. Otherwise, an exception occurs. |
□ Normal □ Abnormal |
|
|
Status of debugging feature |
Execute the display debugging command to display enabled debugging features. In non-administrator debugging period, users are forbidden to enable the debugging feature. |
□ Normal □ Abnormal |
|
|
Interface running status |
Execute the display interface command to display current running status and other related information of the specified interface. The physical layer and link layer of all interfaces used by a service are in UP state. Interfaces not in use are all manually shut down. Pay attention to interfaces that go down exceptionally. |
□ Normal □ Abnormal |
|
|
Context status |
Execute the display context command to display the context information of a tenant. All contexts that are running online must be in the active status. Otherwise, the contexts are exceptional. |
□ Normal □ Abnormal |
|
|
RX power and TX power of transceiver modules |
Execute the display transceiver diagnosis command displays the current measured values of digital diagnostic parameters of a hot swappable transceiver module. The optical signal strength of the service interfaces must be in the range of the low threshold and high threshold in the TX and RX directions. Otherwise, an exception occurs. |
□ Normal □ Abnormal |
|
|
General route statistics in a routing table |
Execute the display ip routing-table statistics command to display general route statistics in a routing table. The general route statistics include total number of routes, number of active routes, and number of routes added/deleted by routing protocols. There should be no route number changes during normal running of services or after service changes non-related to routes. |
□ Normal □ Abnormal |
|
|
CPU usage |
Execute the display cpu-usage command to display the CPU usage. For slots that consume CPU heavily, execute the display cpu-usage history slot command to collect the CPU usage information for the slots in the past hour. The CPU usage is below 70% (recommended rate for safe usage). |
□ Normal □ Abnormal |
|
|
Memory usage |
Execute the display memory command to display the memory usage. The free memory ratio is higher than 30% or higher than 40% when the device is not busy. |
□ Normal □ Abnormal |
|
V800R005 (S5560X SecBlade IV)
Manual analysis
Collect the diagnostic information file, logfile,and diagfile, and analyze these files to generate reports.
Collect diagnostic information
Execute the display diagnostic-information command.
Press Y to save the file.
Collect logfile
Execute the display logfile summary command to obtain the path of the logfile.
Access the path to obtain the logfile.
Collect diagfile
Execute the display diagnostic-logfile summary command to obtain the path of the diagfile.
Access the path to obtain the diagfile.
Analysis
After the three files are collected, analyze the file content. If any exception exists, perform analysis on your own or contact the R&D engineers.
Common inspection commands
display device
· Check item
Device information
· Targets
Device information
· Pass criteria
The display device command displays device information. For the service modules, including the firewall interface card, they must be in normal state.
· Example
[USER]display device
Slot.No Cpu.Id Brd Type Brd Status Subslot Sft Ver Patch Ver
1 0 LSPM6FWD Normal 0 8560P26 None
display version
· Check item
Version information
· Targets
Version information
· Pass criteria
The display version command displays the system version information, mainly device version No. and uptime. The uptime of all modules must be basically equivalent without much difference. Generally, the time difference is no more than 5 minutes If the uptime of a module is much shorter than that of other boards, check whether the former module is restarted by an exception.
· Example
[USER] display version
H3C Comware Software, Version 7.1.064, Release 8560P26 //Version No.
Copyright (c) 2004-2022 New H3C Technologies Co., Ltd. All rights reserved.
H3C SecBlade IV NGFW Module uptime is 0 weeks, 0 days, 0 hours, 26 minutes //Uptime
Last reboot reason: User reboot
Boot image: sda0:/BLADE4FW-73-CMW710-BOOT-R8560P26.bin
Boot image version: 7.1.064, Release 8560P26
Compiled Jul 08 2022 14:00:00
System image: sda0:/BLADE4FW-73-CMW710-SYSTEM-R8560P26.bin
System image version: 7.1.064, Release 8560P26
Compiled Jul 08 2022 14:00:00
Feature image(s) list:
sda0:/BLADE4FW-73-CMW710-MANUFACTURE-R8560P26.bin, version: 7.1.064
Compiled Jul 08 2022 14:00:00
sda0:/BLADE4FW-73-CMW710-SECESCAN-R8560P26.bin, version: 7.1.064
Compiled Jul 08 2022 14:00:00
SLOT 1
Uptime is 0 weeks, 0 days, 0 hours, 26 minutes
CPU type: Multi-core CPU
DDR3 : 4080M bytes
SD0: 7487M bytes
Board PCB Version: Ver.A
Board Bottom PCB Version: Ver.B
CPLD Version: 3.0
Release Version: SecBlade IV FW Enhanced Module-8560P26
Basic BootWare Version:1.05
Extend BootWare Version:1.05
display debugging
· Check item
Debugging feature
· Targets
Status of debugging feature
· Pass criteria
The display debugging command displays all enabled debugging features. In non-administrator debugging period, users are forbidden to enable the debugging feature.
· Example
<USER>dis debugging //Check whether the debugging feature is enabled. If yes, execute the undo debugging all command to disable the debugging feature.
display interface brief
· Check item
Information of the specified interface
· Targets
Status of the specified interface
· Pass criteria
The display interface command displays current running status and other related information of the specified interface. The physical layer and link layer of all interfaces used by a service are in UP state. Interfaces not in use are all manually shut down. Pay attention to the interfaces that go down exceptionally.
· Example
<USER> display interface brief
Brief information on interfaces in route mode:
Link: ADM - administratively down; Stby - standby
Protocol: (s) - spoofing
Interface Link Protocol Primary IP Description
GE1/0/1 UP UP 186.5.0.100
InLoop0 UP UP(s) --
NULL0 UP UP(s) --
REG0 UP -- --
XGE1/0/1 UP UP --
XGE1/0/2 UP UP --
display context
· Check item
Context information of a tenant
· Targets
Context information of a tenant
· Pass criteria
The display context command displays the context information of a tenant. All contexts that are running online must be in the active status. Otherwise, the contexts are exceptional.
· Example
<USER> dis context
ID Name Status Description
1 Admin active DefaultContext
2 a1 active
Total contexts:2
display ip routing-table statistics
· Check item
General route statistics in a routing table
· Targets
General route statistics in a routing table
· Pass criteria
The display ip routing-table statistics command displays general route statistics in a routing table. The general route statistics include total number of routes, number of active routes, and number of routes added/deleted by routing protocols. There should be no route number changes during normal running of services or after service changes non-related to routes.
· Example
<USER>display ip routing-table statistics
Total prefixes: 13 Active prefixes: 13
Proto route active added deleted
DIRECT 10 10 10 0
STATIC 3 3 3 0
RIP 0 0 0 0
OSPF 0 0 0 0
IS-IS 0 0 0 0
LISP 0 0 0 0
EIGRP 0 0 0 0
BGP 0 0 0 0
GUARD 0 0 0 0
Total 13 13 13 0
display cpu-usage
· Check item
CPU usage
· Targets
CPU usage
· Pass criteria
The display cpu-usage command displays the CPU usage. The CPU usage is below 70% (recommended rate for safe usage).
· Example
<USER>dis cpu
Slot 1 CPU 0 CPU usage:
1% in last 5 seconds
1% in last 1 minute
1% in last 5 minutes
For slots that consume CPU heavily, execute the display cpu-usage history slot command to collect the CPU usage information for the slots in the past hour.
<USER>display cpu-usage history
100%|
95%|
90%|
85%|
80%|
75%|
70%|
65%|
60%|
55%|
50%|
45%|
40%|
35%|
30%|
25%|
20%|
15%|
10%|
5%| #
------------------------------------------------------------
10 20 30 40 50 60 (minutes)
cpu-usage (Slot 1 CPU 0) last 60 minutes (SYSTEM)
The firewall performance indexes include creation, concurrency, and throughout. Different index combinations lead to different performance consumption, which is reflected on the CPU usage and memory usage of the system. Therefore, monitoring the CPU usage and memory usage is enough. The CPU usage represents the system's capability of handling throughput and creation, and the memory usage represents the system's capability of concurrent processing.
When a device becomes faulty, all traffic is switched to another device. Therefore, a device might take twice as much work, so the actual CPU usage of a device should not exceed 50% of the safe usage rate. The actual CPU usage should not exceed 35% (70% × 50%) in peak hours.
display memory
· Check item
Memory usage
· Targets
Memory usage
· Pass criteria
The display memory command displays the memory usage. The free memory ratio is higher than 30%, or higher than 40% when the device is not busy. As a best practice, observe the memory usage continuously for several days. If the memory usage keeps high, there might be a memory leakage.
· Example
<USER>display memory
Memory statistics are measured in KB:
Slot 1:
Total Used Free Shared Buffers Cached FreeRatio
Mem: 4070644 2203080 1867564 0 3612 399252 46.1%
-/+ Buffers/Cache: 1800216 2270428
Swap: 0 0 0
display session statistics
· Check item
Unicast session statistics
· Targets
Unicast session statistics
· Pass criteria
The display session statistics command displays the unicast session statistics. The counts for new sessions, concurrent sessions, TCP sessions, and UDP sessions fluctuate with service traffic in normal ranges.
· Example
<USER>display session statistics
Slot 1:
Current sessions: 6 //Total sessions in slot 2
TCP sessions: 6
UDP sessions: 0
ICMP sessions: 0
ICMPv6 sessions: 0
UDP-Lite sessions: 0
SCTP sessions: 0
DCCP sessions: 0
RAWIP sessions: 0
DNS sessions: 0
FTP sessions: 0
GTP sessions: 0
H323 sessions: 0
HTTP sessions: 0
ILS sessions: 0
MGCP sessions: 0
NBT sessions: 0
PPTP sessions: 0
RSH sessions: 0
RTSP sessions: 0
SCCP sessions: 0
SIP sessions: 0
SMTP sessions: 0
SQLNET sessions: 0
SSH sessions: 0
TELNET sessions: 0
TFTP sessions: 0
XDMCP sessions: 0
History average sessions per second:
Past hour: 1
Past 24 hours: 0
Past 30 days: 0
History average session establishment rate:
Past hour: 0/s
Past 24 hours: 0/s
Past 30 days: 0/s
Current relation table entries: 0
Relation table establishment rate: 0/s //Ratio of new sessions
Session establishment rate: 0/s
TCP: 0/s
UDP: 0/s
ICMP: 0/s
ICMPv6: 0/s
UDP-Lite: 0/s
SCTP: 0/s
DCCP: 0/s
RAWIP: 0/s
Received TCP : 0 packets 0 bytes
Received UDP : 0 packets 0 bytes
Received ICMP : 0 packets 0 bytes
Received ICMPv6 : 0 packets 0 bytes
Received UDP-Lite : 0 packets 0 bytes
Received SCTP : 0 packets 0 bytes
Received DCCP : 0 packets 0 bytes
Received RAWIP : 0 packets 0 bytes
display interface Ten-GigabitEthernet | include Last
· Check item
Port traffic
· Targets
Port traffic statistics
· Pass criteria
The display interface Ten-GigabitEthernet | include Last command displays port traffic statistics. You can view the average input and output rates (packets/s and bytes/s) of the port in the last 300 seconds, and the ratio of the actual rate to the maximum rate.
· Example
<USER> display interface Ten-GigabitEthernet | include Last
Last link flapping: 0 hours 43 minutes 58 seconds
Last clearing of counters: Never
Last time when physical state changed to up:2011-01-01 00:00:40
Last time when physical state changed to down:2011-01-01 00:00:11
Last 300 second input: 1 packets/sec 119 bytes/sec 0% //System throughput refers to the total throughput of all ports.
Last 300 second output: 0 packets/sec 0 bytes/sec 0%
Last link flapping: 0 hours 43 minutes 58 seconds
Last clearing of counters: Never
Last time when physical state changed to up:2011-01-01 00:00:40
Last time when physical state changed to down:2011-01-01 00:00:11
Last 300 second input: 1 packets/sec 119 bytes/sec 0%
Last 300 second output: 0 packets/sec 0 bytes/sec 0%
display nat port-block dynamic
· Check item
Dynamic port block mapping
· Targets
Dynamic port block mapping
· Pass criteria
The display nat port-block dynamic command displays the dynamic port block mapping.
· Example
<USER>display nat port-block dynamic
Slot 1:
Local VPN Local IP Global IP Port block Connections
--- 100.96.0.2 117.26.160.2 1000-2000 1
Total mappings found: 1
display nat statistics
· Check item
NAT statistics
· Targets
NAT statistics
· Pass criteria
The display nat statistics command displays the NAT statistics.
· Example
<USER>display nat statistics
Slot 1:
Total session entries: 0 //Number of NAT session entries
Session creation rate: 0
Total EIM entries: 0
Total inbound NO-PAT entries: 0
Total outbound NO-PAT entries: 0
Total static port block entries: 0
Total dynamic port block entries: 100 //Number of dynamic port block entries that can be created, that is, the number of dynamic port blocks that can be allocated including allocated port blocks and unallocated port blocks
Active static port block entries: 0
Active dynamic port block entries: 0 //Number of dynamic port block entries that have been created, that is, the number of allocated dynamic port blocks
Security device inspection report
After you inspect the security devices, provide the inspection report as shown in the following table.
Table 22 Device inspection report
|
Targets |
Instruction |
Result |
Remarks |
|
System running status |
See the command reference of the device. |
□ Normal □ Abnormal |
|
|
Alarms |
Identify whether the device has critical and abnormal alarms. See the command reference for more information. |
□ Normal □ Abnormal |
|
|
Device LEDs |
See the command reference of the device. |
□ Normal □ Abnormal |
|
|
CPU and memory status |
See the command reference of the device. |
□ Normal □ Abnormal |
|
|
Log query/export |
View logs of the device to identify whether the device has critical and abnormal alarms. See the command reference for more information. |
□ Normal □ Abnormal |
|
|
Telnet or SSH login |
Log in to the device through Telnet and SSL. See the command reference for more information. |
□ Normal □ Abnormal |
As a best practice, enable SSH and disable Telnet. |
|
Port statistics |
Display statistics about received, sent, and abnormal packets on each port of the device. See the command reference for more information. |
□ Normal □ Abnormal |
|
|
Ping |
See the command reference of the device. |
□ Normal □ Abnormal |
|
|
Network service port status |
Disable services (such as FTP server) when they are not in use. See the command reference for more information. |
□ Normal □ Abnormal |
|
|
System clock |
See the command reference of the device. |
□ Normal □ Abnormal |
|
|
Alarm and action |
Verify that the alarm and action function is normal. Verify that an alarm can be triggered and correct actions can be taken after the alarm is triggered. |
□ Normal □ Abnormal |
|
|
Network connectivity |
On the maintenance terminal for the center device, use an IP scanning tool to scan each network segment and verify the connectivity of each node. |
□ Normal □ Abnormal |
|
|
Network device port status |
Log in to a device from a maintenance terminal through the serial interface or Telnet. Execute corresponding commands in user view to display the status of each port. Make sure no CRC error or half duplex mode exists. |
□ Normal □ Abnormal |
|
|
Configuration backup |
Log in to a device from a maintenance terminal through the serial interface or Telnet. Execute the display cur command in user view and then save the displayed configuration. |
□ Normal □ Abnormal |
|
|
Device information |
Execute the display device command to display device information. Service modules and interface modules must be in normal state. Otherwise, this check item fails. |
□ Normal □ Abnormal |
|
|
Version number and uptime |
Execute the display version command to display system version information. The uptime of all modules must be basically equivalent without much difference. Generally, the time difference is no more than 5 minutes If the uptime of a module is much shorter than that of other boards, check whether the former module is restarted by an exception. |
□ Normal □ Abnormal |
|
|
Status of debugging feature |
Execute the display debugging command to display enabled debugging features. In non-administrator debugging period, users are forbidden to enable the debugging feature. |
□ Normal □ Abnormal |
|
|
Interface running status |
Execute the display interface command to display current running status and other related information of the specified interface. The physical layer and link layer of all interfaces used by a service are in UP state. Interfaces not in use are all manually shut down. Pay attention to interfaces that go down exceptionally. |
□ Normal □ Abnormal |
|
|
Context status |
Execute the display context command to display the context information of a tenant. All contexts that are running online must be in the active status. Otherwise, the contexts are exceptional. |
□ Normal □ Abnormal |
|
|
General route statistics in a routing table |
Execute the display ip routing-table statistics command to display general route statistics in a routing table. The general route statistics include total number of routes, number of active routes, and number of routes added/deleted by routing protocols. There should be no route number changes during normal running of services or after service changes non-related to routes. |
□ Normal □ Abnormal |
|
|
CPU usage |
Execute the display cpu-usage command to display the CPU usage. For slots that consume CPU heavily, execute the display cpu-usage history slot command to collect the CPU usage information for the slots in the past hour. The CPU usage is below 70% (recommended rate for safe usage). |
□ Normal □ Abnormal |
|
|
Memory usage |
Execute the display memory command to display the memory usage. The free memory ratio is higher than 30% or higher than 40% when the device is not busy. |
□ Normal □ Abnormal |
|
V800R008B03 F5000-AI-20&F5000-AI-40)
Manual analysis
Collect the diagnostic information file, logfile,and diagfile, and analyze these files to generate reports.
Collect diagnostic information
Execute the display diagnostic-information command.
Press Y to save the file.
Collect logfile
Execute the display logfile summary command to obtain the path of the logfile.
Access the path to obtain the logfile.
Collect diagfile
Execute the display diagnostic-logfile summary command to obtain the path of the diagfile.
Access the path to obtain the diagfile.
Analysis
After the three files are collected, analyze the file content. If any exception exists, perform analysis on your own or contact the R&D engineers.
Common inspection commands
display device
· Check item
Device information
· Targets
Device information
· Pass criteria
The display device command displays device information. For the service modules, including the firewall interface card, they must be in normal state.
· Example
[user]dis device
Slot.No Cpu.Id Brd Type Brd Status Subslot Sft Ver Patch Ver
1 0 F5000-AI-20 Normal 0 9660P26 None
1 0 NONE Absent 1 None None
1 0 NONE Absent 2 None None
1 0 NONE Absent 3 None None
1 0 NONE Absent 4 None None
1 0 NONE Absent 5 None None
1 0 NONE Absent 6 None None
1 0 NONE Absent 7 None None
1 0 NONE Absent 8 None None
display version
· Check item
Version information
· Targets
Version information
· Pass criteria
The display version command displays the system version information, mainly device version No. and uptime. The uptime of all modules must be basically equivalent without much difference. Generally, the time difference is no more than 5 minutes If the uptime of a module is much shorter than that of other boards, check whether the former module is restarted by an exception.
· Example
[user]dis version
H3C Comware Software, Version 7.1.064, Release 9660P26
Copyright (c) 2004-2022 New H3C Technologies Co., Ltd. All rights reserved.
H3C SecPath F5000-AI-20 uptime is 0 weeks, 0 days, 0 hours, 12 minutes
Last reboot reason: User reboot
Boot image: sda0:/F5080FW-CMW710-BOOT-R9660P26.bin
Boot image version: 7.1.064, Release 9660P26
Compiled Jul 08 2022 14:00:00
System image: sda0:/F5080FW-CMW710-SYSTEM-R9660P26.bin
System image version: 7.1.064, Release 9660P26
Compiled Jul 08 2022 14:00:00
Feature image(s) list:
sda0:/F5080FW-CMW710-SECESCAN-R9660P26.bin, version: 7.1.064
Compiled Jul 08 2022 14:00:00
SLOT 1
Uptime is 0 weeks, 0 days, 0 hours, 12 minutes
CPU type: Multi-core CPU
DDR3 SDRAM Memory: 16368M bytes
SD0: 3728M bytes
NSQ1MPBHA PCB Version: Ver.B
NSQ1MPBBHB PCB Version: Ver.A
NSQ1MPHDBHA PCB Version: Ver.A
NSQ1MPGC4BHA PCB Version: Ver.A
NSQ1MPLEDBHA PCB Version: Ver.A
CPLD_A Version: 2.0
CPLD_B Version: 2.0
Release Version:SecPath F5000-AI-20-9660P26
Basic BootWare Version:1.09
Extend BootWare Version:1.09
[SUBCARD 0] NSQ1MPBHA(Hardware)Ver.B, (Driver)1.0, (Cpld)2.0
display power
· Check item
Power module information
· Targets
Work status of a power module
· Pass criteria
The display power command displays the work status of a power module. A power module in position must be in normal status, and a power module not in position must be in absent status. If a power module in position is in a state other than normal, the power module is abnormal.
· Example
[user]dis power
Slot PowerID State Mode Current(A) Voltage(V) Power(W)
1 0 Normal AC 7.63 12.03 91.87 //Normal
1 1 Absent -- -- -- -- //The power module is absent. If the power module is actually in position, verify that the power module is powered on and operates normally.
display fan
· Check item
Fan information
· Targets
Work status of a fan
· Pass criteria
The display fan command displays the work status of a fan. If a fan is not in normal status, the fan is abnormal.
· Example
[user]dis fan
SLOT 1 Fan 0-0 Status: Normal Speed:6122 //The fan is normal.
SLOT 1 Fan 0-1 Status: Normal Speed:6250
SLOT 1 Fan 1-0 Status: Normal Speed:6250
SLOT 1 Fan 1-1 Status: Normal Speed:6250
display environment
· Check item
Temperature sensor
· Targets
Status of the temperature sensor
· Pass criteria
The display environment command displays the temperature information read by the temperature sensor, including current temperature and temperature alarm threshold. The temperature of all hotspots should not be lower than the lower limit or higher than the warning upper limit. Otherwise, an exception occurs.
· Example
[user]dis environment
System Temperature information (degree centigrade):
--------------------------------------------------------------------------------
---------
Slot Sensor Temperature LowerLimit Warning-UpperLimit Alarm-UpperLimit S
hutdown-UpperLimit
1 inflow 1 29 0 60 70
NA
1 inflow 2 26 0 60 70
NA
1 outflow 1 34 0 60 70
NA
1 hotspot 1 50 0 80 92
NA
display debugging
· Check item
Debugging feature
· Targets
Status of debugging feature
· Pass criteria
The display debugging command displays all enabled debugging features. In non-administrator debugging period, users are forbidden to enable the debugging feature.
· Example
<user> dis debugging /Check whether the debugging feature is enabled. If yes, execute the undo debugging all command to disable the debugging feature.
display interface brief
· Check item
Information of the specified interface
· Targets
Status of the specified interface
· Pass criteria
The display interface command displays current running status and other related information of the specified interface. The physical layer and link layer of all interfaces used by a service are in UP state. Interfaces not in use are all manually shut down. Pay attention to the interfaces that go down exceptionally.
· Example
<user> dis interface brief
Brief information on interfaces in route mode:
Link: ADM - administratively down; Stby - standby
Protocol: (s) - spoofing
Interface Link Protocol Primary IP Description
GE1/0/0 UP UP 172.32.51.116
GE1/0/1 DOWN DOWN --
GE1/0/2 DOWN DOWN --
GE1/0/3 DOWN DOWN --
InLoop0 UP UP(s) --
NULL0 UP UP(s) --
REG0 UP -- --
display context
· Check item
Context information of a tenant
· Targets
Context information of a tenant
· Pass criteria
The display context command displays the context information of a tenant. All contexts that are running online must be in the active status. Otherwise, the contexts are exceptional.
· Example
<user>dis context
ID Name Status Description
1 Admin active DefaultContext
2 1 active
Total contexts: 2
display transceiver diagnosis interface
· Check item
Digital diagnostic parameters of a hot swappable transceiver module
· Targets
Current measured values of digital diagnostic parameters of a hot swappable transceiver module
· Pass criteria
The display transceiver diagnosis command displays the current measured values of digital diagnostic parameters of a hot swappable transceiver module. The optical signal strength of the service interfaces must be in the range of the low threshold and high threshold in the TX and RX directions.
· Example
<user>dis transceiver diagnosis interface
GigabitEthernet1/0/0 transceiver diagnostic information:
The transceiver is absent.
GigabitEthernet1/0/1 transceiver diagnostic information:
Current diagnostic parameters:
Temp.(??C) Voltage(V) Bias(mA) RX power(dBm) TX power(dBm)
27 3.32 8.61 -26.78 -2.43
Alarm thresholds:
Temp.(??C) Voltage(V) Bias(mA) RX power(dBm) TX power(dBm)
High 73 3.80 13.20 1.00 0.00
Low -3 2.81 1.00 -9.50 -10.30
GigabitEthernet1/0/2 transceiver diagnostic information:
The transceiver is absent.
GigabitEthernet1/0/3 transceiver diagnostic information:
The transceiver is absent
display ip routing-table statistics
· Check item
General route statistics in a routing table
· Targets
General route statistics in a routing table
· Pass criteria
The display ip routing-table statistics command displays general route statistics in a routing table. The general route statistics include total number of routes, number of active routes, and number of routes added/deleted by routing protocols. There should be no route number changes during normal running of services or after service changes non-related to routes.
· Example
<user> display ip routing-table statistics
Total prefixes: 11 Active prefixes: 11
Proto route active added deleted
DIRECT 10 10 10 0
STATIC 1 1 1 0
RIP 0 0 0 0
OSPF 0 0 0 0
IS-IS 0 0 0 0
LISP 0 0 0 0
EIGRP 0 0 0 0
BGP 0 0 0 0
GUARD 0 0 0 0
Total 11 11 11 0
display cpu-usage
· Check item
CPU usage
· Targets
CPU usage
· Pass criteria
The display cpu-usage command displays the CPU usage. The CPU usage is below 70% (recommended rate for safe usage).
· Example
<user> dis cpu
Slot 1 CPU 0 CPU usage:
2% in last 5 seconds
2% in last 1 minute
2% in last 5 minutes
For slots that consume CPU heavily, execute the display cpu-usage history slot command to collect the CPU usage information for the slots in the past hour.
<user>display cpu-usage history
100%|
95%|
90%|
85%|
80%|
75%|
70%|
65%|
60%|
55%|
50%|
45%|
40%|
35%|
30%|
25%|
20%|
15%|
10%|
5%| # ##
------------------------------------------------------------
10 20 30 40 50 60 (minutes)
cpu-usage (Slot 1 CPU 0) last 60 minutes (SYSTEM)
The firewall performance indexes include creation, concurrency, and throughout. Different index combinations lead to different performance consumption, which is reflected on the CPU usage and memory usage of the system. Therefore, monitoring the CPU usage and memory usage is enough. The CPU usage represents the system's capability of handling throughput and creation, and the memory usage represents the system's capability of concurrent processing.
The CPU usage is below 70% (recommended rate for safe usage).
When a device becomes faulty, all traffic is switched to another device. Therefore, a device might take twice as much work, so the actual CPU usage of a device should not exceed 50% of the safe usage rate. The actual CPU usage should not exceed 35% (70% × 50%) in peak hours.
display memory
· Check item
Memory usage
· Targets
Memory usage
· Pass criteria
The display memory command displays the memory usage. The free memory ratio is higher than 30%, or higher than 40% when the device is not busy. As a best practice, observe the memory usage continuously for several days. If the memory usage keeps high, there might be a memory leakage.
· Example
<USER>dis memory
Memory statistics are measured in KB:
Slot 1:
Total Used Free Shared Buffers Cached FreeRatio
Mem: 16412820 5343788 11069032 0 4432 4932156 67.5%
-/+ Buffers/Cache: 4907200 11505620
Swap: 0 0 0
display session statistics
· Check item
Unicast session statistics
· Targets
Unicast session statistics
· Pass criteria
The display session statistics command displays the unicast session statistics. The counts for new sessions, concurrent sessions, TCP sessions, and UDP sessions fluctuate with service traffic in normal ranges.
· Example
<USER>display session statistics
Slot 1:
Current sessions: 0 //Total sessions in slot 2
TCP sessions: 0
UDP sessions: 0
ICMP sessions: 0
ICMPv6 sessions: 0
UDP-Lite sessions: 0
SCTP sessions: 0
DCCP sessions: 0
RAWIP sessions: 0
DNS sessions: 0
FTP sessions: 0
GTP sessions: 0
H323 sessions: 0
HTTP sessions: 0
ILS sessions: 0
MGCP sessions: 0
NBT sessions: 0
PPTP sessions: 0
RSH sessions: 0
RTSP sessions: 0
SCCP sessions: 0
SIP sessions: 0
SMTP sessions: 0
SQLNET sessions: 0
SSH sessions: 0
TELNET sessions: 0
TFTP sessions: 0
XDMCP sessions: 0
History average sessions per second:
Past hour: 1
Past 24 hours: 0
Past 30 days: 0
History average session establishment rate:
Past hour: 0/s
Past 24 hours: 0/s
Past 30 days: 0/s
Current relation table entries: 0
Session establishment rate: 0/s //Ratio of new sessions
TCP: 0/s
UDP: 0/s
ICMP: 0/s
ICMPv6: 0/s
UDP-Lite: 0/s
SCTP: 0/s
DCCP: 0/s
RAWIP: 0/s
Received TCP : 1844 packets 1072121 bytes
Received UDP : 193 packets 19280 bytes
Received ICMP : 0 packets 0 bytes
Received ICMPv6 : 0 packets 0 bytes
Received UDP-Lite : 0 packets 0 bytes
Received SCTP : 0 packets 0 bytes
Received DCCP : 0 packets 0 bytes
Received RAWIP : 0 packets 0 bytess
display interface GigabitEthernet | include Last
· Check item
Port traffic
· Targets
Port traffic statistics
· Pass criteria
The display interface GigabitEthernet | include Last command displays port traffic statistics. You can view the average input and output rates (packets/s and bytes/s) of the port in the last 300 seconds, and the ratio of the actual rate to the maximum rate.
· Example
<USER>display interface GigabitEthernet | include Last
Last link flapping: 3 hours 6 minutes 32 seconds
Last clearing of counters: Never
Last time when physical state changed to up:2022-07-21 10:52:23
Last time when physical state changed to down:2022-07-21 10:50:49
Last 300 second input: 4 packets/sec 336 bytes/sec 0% //System throughput refers to the total throughput of all ports.
Last 300 second output: 0 packets/sec 0 bytes/sec 0%
Last link flapping: Never
Last clearing of counters: Never
Last time when physical state changed to up:-
Last time when physical state changed to down:2022-07-21 10:50:49
Last 300 second input: 0 packets/sec 0 bytes/sec -%
Last 300 second output: 0 packets/sec 0 bytes/sec -%
Last link flapping: Never
Last clearing of counters: Never
Last time when physical state changed to up:-
Last time when physical state changed to down:2022-07-21 10:50:49
Last 300 second input: 0 packets/sec 0 bytes/sec -%
Last 300 second output: 0 packets/sec 0 bytes/sec -%
Last link flapping: Never
Last clearing of counters: Never
Last time when physical state changed to up:-
Last time when physical state changed to down:2022-07-21 10:50:49
Last 300 second input: 0 packets/sec 0 bytes/sec -%
Last 300 second output: 0 packets/sec 0 bytes/sec -%
display nat port-block dynamic
· Check item
Dynamic port block mapping
· Targets
Dynamic port block mapping
· Pass criteria
The display nat port-block dynamic command displays the dynamic port block mapping.
· Example
<USER>display nat port-block dynamic
Slot 1:
Local VPN Local IP Global IP Port block Connections
--- 101.1.1.12 192.168.135.201 10001-11024 1
Total mappings found: 1
display nat statistics
· Check item
NAT statistics
· Targets
NAT statistics
· Pass criteria
The display nat statistics command displays the NAT statistics.
· Example
<USER>display nat statistics
slot 1:
Total session entries : 0 //Number of NAT session entries
Session creation rate: 0
Total EIM entries : 0
Total inbound NO-PAT entries : 0
Total outbound NO-PAT entries : 0
Total static port block entries: 0
Total dynamic port block entries: 0 //Number of dynamic port block entries that can be created, that is, the number of dynamic port blocks that can be allocated, including allocated port blocks and unallocated port blocks
Active static port block entries: 0
Active dynamic port block entries: 0 //Number of dynamic port block entries that have been created, that is, the number of allocated dynamic port blocks
Security device inspection report
After you inspect the security devices, provide the inspection report as shown in the following table.
Table 23 Device inspection report
|
Instruction |
Result |
Remarks |
|
|
System running status |
See the command reference of the device. |
□ Normal □ Abnormal |
|
|
Alarms |
Identify whether the device has critical and abnormal alarms. See the command reference for more information. |
□ Normal □ Abnormal |
|
|
Device LEDs |
See the command reference of the device. |
□ Normal □ Abnormal |
|
|
CPU and memory status |
See the command reference of the device. |
□ Normal □ Abnormal |
|
|
Fan status |
Observe the rotation of the fans, and listen to the sound of the fans. The fans are operating correctly if you cannot hear any noise and the fans are rotating at a reasonable speed. |
□ Normal □ Abnormal |
|
|
Log query/export |
View logs of the device to identify whether the device has critical and abnormal alarms. See the command reference for more information. |
□ Normal □ Abnormal |
|
|
Telnet or SSH login |
Log in to the device through Telnet and SSL. See the command reference for more information. |
□ Normal □ Abnormal |
As a best practice, enable SSH and disable Telnet. |
|
Port statistics |
Display statistics about received, sent, and abnormal packets on each port of the device. See the command reference for more information. |
□ Normal □ Abnormal |
|
|
Ping |
See the command reference of the device. |
□ Normal □ Abnormal |
|
|
Network service port status |
Disable services (such as FTP server) when they are not in use. See the command reference for more information. |
□ Normal □ Abnormal |
|
|
System clock |
See the command reference of the device. |
□ Normal □ Abnormal |
|
|
Alarm and action |
Verify that the alarm and action function is normal. Verify that an alarm can be triggered and correct actions can be taken after the alarm is triggered. |
□ Normal □ Abnormal |
|
|
Network connectivity |
On the maintenance terminal for the center device, use an IP scanning tool to scan each network segment and verify the connectivity of each node. |
□ Normal □ Abnormal |
|
|
Network device port status |
Log in to a device from a maintenance terminal through the serial interface or Telnet. Execute corresponding commands in user view to display the status of each port. Make sure no CRC error or half duplex mode exists. |
□ Normal □ Abnormal |
|
|
Configuration backup |
Log in to a device from a maintenance terminal through the serial interface or Telnet. Execute the display cur command in user view and then save the displayed configuration. |
□ Normal □ Abnormal |
|
|
Device information |
Execute the display device command to display device information. Service modules and interface modules must be in normal state. Otherwise, this check item fails. |
□ Normal □ Abnormal |
|
|
Version number and uptime |
Execute the display version command to display system version information. The uptime of all modules must be basically equivalent without much difference. Generally, the time difference is no more than 5 minutes If the uptime of a module is much shorter than that of other boards, check whether the former module is restarted by an exception. |
□ Normal □ Abnormal |
|
|
Power module information |
Execute the display power command to display power module information of a device. A power module in position must be in normal status, and a power module not in position must be in absent status. If a power module in position is in a state other than normal, the power module is abnormal. |
□ Normal □ Abnormal |
|
|
Fan status |
Execute the display fan command to display fan status of a device. If a fan is not in normal status, the fan is abnormal. |
□ Normal □ Abnormal |
|
|
Temperature information |
Execute the display environment command to display temperature information read by the temperature sensors of a device, including the current temperature and the temperature thresholds. The temperature of all hotspots should not be lower than the lower limit or higher than the warning upper limit. Otherwise, an exception occurs. |
□ Normal □ Abnormal |
|
|
Status of debugging feature |
Execute the display debugging command to display enabled debugging features. In non-administrator debugging period, users are forbidden to enable the debugging feature. |
□ Normal □ Abnormal |
|
|
Interface running status |
Execute the display interface command to display current running status and other related information of the specified interface. The physical layer and link layer of all interfaces used by a service are in UP state. Interfaces not in use are all manually shut down. Pay attention to interfaces that go down exceptionally. |
□ Normal □ Abnormal |
|
|
Context status |
Execute the display context command to display the context information of a tenant. All contexts that are running online must be in the active status. Otherwise, the contexts are exceptional. |
□ Normal □ Abnormal |
|
|
RX power and TX power of transceiver modules |
Execute the display transceiver diagnosis command displays the current measured values of digital diagnostic parameters of a hot swappable transceiver module. The optical signal strength of the service interfaces must be in the range of the low threshold and high threshold in the TX and RX directions. Otherwise, an exception occurs. |
□ Normal □ Abnormal |
|
|
General route statistics in a routing table |
Execute the display ip routing-table statistics command to display general route statistics in a routing table. The general route statistics include total number of routes, number of active routes, and number of routes added/deleted by routing protocols. There should be no route number changes during normal running of services or after service changes non-related to routes. |
□ Normal □ Abnormal |
|
|
CPU usage |
Execute the display cpu-usage command to display the CPU usage. For slots that consume CPU heavily, execute the display cpu-usage history slot command to collect the CPU usage information for the slots in the past hour. The CPU usage is below 70% (recommended rate for safe usage). |
□ Normal □ Abnormal |
|
|
Memory usage |
Execute the display memory command to display the memory usage. The free memory ratio is higher than 30% or higher than 40% when the device is not busy. |
□ Normal □ Abnormal |
|
Routine inspection guide for Wireless AC
iService platform analysis
Collect AC diagnostic information
Execute the <H3C>display diagnostic-information command and select Y.
< H3C >display diagnostic-information
Save or display diagnostic information (Y=save, N=display)? [Y/N]:y
Please input the file name(*.tar.gz)[flash:/diag_AC_2020330-113544.tar.gz]:
Diagnostic information is outputting to flash:/diag_ AC _2020330-113544.tar.gz.
Please wait..
Save successfully.
Compress the AC diagnostic information as a diagxxxxxxx.zip file
Make sure the zip package name and the file names in the zip package do not contain Chinese characters or special characters.
Upload the diagnostic information to the iService platform
Log in to the iService platform (http://iservice.h3c.com). The report will be displayed on the general inspection page on the console.
Routine inspection guide for SR88
Routine inspection tool
Collect the diagnostic file, logfile,and diagfile using an inspection tool, upload these files to a local PC, and analyze these files to generate reports.
Collect diagnostic information
Execute the display diagnostic-information command.
Press Y to save the file.
Collect logfile
Execute the display logfile summary command to obtain the path of the logfile.
Access the path to obtain the logfile.
Collect diagfile
Execute the display diagnostic-logfile summary command to obtain the path of the diagfile.
Access the path to obtain the diagfile.
Analysis
After the three files are collected, copy the files by FTP (URL: https://www.h3c.com/cn/Service/Document_Software/Software_Download/Other_Product/H3C_Software/BG/BG/?CHID=190669&v=612). Perform inspection, and then analyze the file content. If any alarm or exception exists, perform analysis on your own or contact the R&D engineers.
Guidelines
The figures in this document are for references only. Actual product prevails.
Handle failure risks
Inspection personnel should get approval from H3C Technical Support before they can handle fault risks.
H3C Technical Support can be obtained in the following ways:
E-mail: [email protected]
Telephone: 400-810-0504, 800-810-0504
Website: http://www.h3c.com
