| Title | Size | Downloads |
|---|---|---|
| H3C SR8800-X Routers Troubleshooting Guide-R7951P01-6W100-book.pdf | 428.02 KB |
- Table of Contents
- Related Documents
-
|
|
|
H3C SR8800-X |
|
Troubleshooting Guide |
|
|
Copyright © 2019 New H3C Technologies Co., Ltd. All rights reserved.
No part of this manual may be reproduced or transmitted in any form or by any means without prior written consent of New H3C Technologies Co., Ltd.
Except for the trademarks of New H3C Technologies Co., Ltd., any trademarks that may be mentioned in this document are the property of their respective owners.
The information in this document is subject to change without notice.
Contents
Collecting log and operating information
Collecting common log messages
Collecting diagnostic log messages
Collecting operating statistics
Collecting card startup information·
Dealing with console login password loss·
Telnetting to the device to change the console login password
Using BootWare menus to change the console login password
Dealing with Telnet password loss
Troubleshooting configuration loss
Startup configuration file unavailable
No display on the configuration terminal
Garbled display on the configuration terminal
Troubleshooting system management
Failure to establish an LDP peer relationship
Failure to establish an LDP LSP
Troubleshooting MPLS L3VPN failure
No route to a destination VPN address
FIB entry anomaly in a VPN instance
Troubleshooting MPLS L2VPN and VPLS failure
Failure to establish an LDP peer relationship
Failure to establish an LDP LSP
Troubleshooting packet forwarding failure
Failure to ping or trace route to a device
IPoE user failures to come online
WAN interface protocol fails to come up
Troubleshooting hardware forwarding·
Introduction
This document provides information about troubleshooting common software and hardware issues with SR8800-X routers.
This document applies to Release SR8800-CMW710-R7951P01 and Release SR8800FS-CMW710-R7951P01.
General guidelines
|
|
IMPORTANT: To prevent an issue from causing loss of configuration, save the configuration each time you finish configuring a feature. For configuration recovery, regularly back up the configuration to a remote server. |
When you troubleshoot the router, follow these general guidelines:
· To help identify the cause of the issue, collect system and configuration information, including:
¡ Symptom, time of failure, and configuration.
¡ Network topology information, including the network diagram, port connections, and points of failure.
¡ Log messages and diagnostic information. For more information about collecting this information, see "Collecting log and operating information."
¡ Physical evidence of failure:
- Photos of the hardware.
- Status of the card, power, and fan status LEDs.
¡ Steps you have taken, such as reconfiguration, cable swapping, and reboot.
¡ Output from the commands executed during the troubleshooting process.
· To ensure safety, wear an ESD wrist strap when you replace or maintain a hardware component.
· If hardware replacement is required, use the release notes to verify hardware and software compatibility.
Collecting log and operating information
|
|
IMPORTANT: By default, the information center is enabled. If the feature is disabled, you must use the info-center enable command to enable the feature for collecting log messages. |
Table 1 shows the types of files that the system uses to store operating log and status information. You can export these files by using FTP, TFTP, or USB.
These files are stored on the active MPU (in standalone mode) or global active MPU (in IRF mode). Multiple MPUs will have log files if active/standby or master/subordinate switchovers have occurred. You must collect log files from all these MPUs. To more easily locate log information, use a consistent rule to categorize and name files. For example, save log information files to a separate folder for each MPU, and include their chassis and slot numbers in the folder names.
Table 1 Log and operating information
|
Category |
File name format |
Content |
|
Common log |
logfileX.log |
Command execution and operational log messages. |
|
Diagnostic log |
diagfileX.log |
Diagnostic log messages about device operation, including the following items: · Parameter settings in effect when an error occurs. · Information about a card startup error. · Handshaking information between the MPU and interface card when a communication error occurs. |
|
Operating statistics |
file-basename.gz |
Current operating statistics for feature modules, including the following items: · Device status. · CPU status. · Memory status. · Configuration status. · Software entries. · Hardware entries. |
|
|
NOTE: For common and diagnostic log files, the system automatically compresses them into .gz files when they are full. |
Collecting common log messages
1. Save common log messages from the log buffer to a log file.
By default, log files are saved in the logfile directory of the default file system on the active MPU (in standalone mode) or global active MPU (in IRF mode).
<Sysname> logfile save
The contents in the log file buffer have been saved to the file cfa0:/logfile/logfile1.log
2. Identify the log files on each MPU:
# Display the log files on the active MPU (in standalone mode) or global active MPU (in IRF mode).
<Sysname> dir cfa0:/logfile/
Directory of cfa0:/logfile
0 -rw- 21863 Jul 11 2013 16:00:37 logfile1.log
1021104 KB total (421552 KB free)
# Display the log files on each standby MPU:
¡ In standalone mode, display the log files on the standby MPU.
<Sysname> dir slot1#cfa0:/logfile/
Directory of slot1#cfa0:/logfile
0 -rw- 21863 Jul 11 2013 16:00:37 logfile1.log
1021104 KB total (421552 KB free)
¡ In IRF mode, display the log files on each standby MPU.
<Sysname> dir chassis2#slot0#cfa0:/logfile/
Directory of chassis2#slot0#cfa0:/logfile
0 -rw- 21863 Jul 11 2013 16:00:37 logfile1.log
1021104 KB total (421552 KB free)
|
|
NOTE: If a subordinate chassis has two MPUs, make sure you identify and export the log files on both MPUs. |
3. Transfer the files to the desired destination by using FTP, TFTP, or USB. (Details not shown.)
Collecting diagnostic log messages
1. Save diagnostic log messages from the diagnostic log file buffer to a diagnostic log file.
By default, diagnostic log files are saved in the diagfile directory of the default file system on the active MPU (in standalone mode) or global active MPU (in IRF mode).
<Sysname> diagnostic-logfile save
The contents in the diagnostic log file buffer have been saved to the file cfa0:/diagfile/diagfile1.log
2. Identify the diagnostic log files on each MPU:
# Display the diagnostic log files on the active MPU (in standalone mode) or global active MPU (in IRF mode).
<Sysname> dir cfa0:/diagfile/
Directory of cfa0:/diagfile
0 -rw- 161321 Jul 11 2013 16:16:00 diagfile1.log
1021104 KB total (421416 KB free)
# Display the diagnostic log files on each standby MPU:
¡ In standalone mode, display the diagnostic log files on the standby MPU.
<Sysname> dir slot1#cfa0:/diagfile/
Directory of slot1#cfa0:/diagfile
0 -rw- 161321 Jul 11 2013 16:16:00 diagfile1.log
1021104 KB total (421416 KB free)
¡ In IRF mode, display the diagnostic log files on each standby MPU.
<Sysname> dir chassis2#slot0#cfa0:/diagfile/
Directory of chassis2#slot0#cfa0:/diagfile
0 -rw- 161321 Jul 11 2013 16:16:00 diagfile1.log
1021104 KB total (421416 KB free)
|
|
NOTE: If a subordinate chassis has two MPUs, make sure you identify and export the diagnostic log files on both MPUs. |
3. Transfer the files to the desired destination by using FTP, TFTP, or USB. (Details not shown.)
Collecting operating statistics
You can collect operating statistics by saving the statistics to a file or displaying the statistics on the screen.
When you collect operating statistics, follow these guidelines:
· Log in to the device through a network port or management port instead of the console port, if possible. Network and management ports are faster than the console port.
· Do not execute commands while operating statistics are being collected.
· As a best practice, save operating statistics to a file to retain the information.
To collect operating statistics:
1. Disable pausing between screens of output if you want to display operating statistics on the screen. Skip this step if you are saving statistics to a file.
<Sysname> screen-length disable
2. Collect operating statistics for multiple feature modules.
<Sysname> display diagnostic-information
Save or display diagnostic information (Y=save, N=display)? [Y/N] :
3. At the prompt, choose to save or display operating statistics:
# To save operating statistics, enter y at the prompt and then specify the destination file path.
Save or display diagnostic information (Y=save, N=display)? [Y/N] :y
Please input the file name(*.tar.gz)[flash:/diag.tar.gz] :cfa0:/diag.tar.gz
Diagnostic information is outputting to cfa0:/diag.tar.gz.
Please wait...
Save successfully.
<Sysname> dir cfa0:/
Directory of cfa0:
……
6 -rw- 898180 Jun 26 2013 09:23:51 diag.tar.gz
……
1021808 KB total (259072 KB free)
# To display operating statistics on the monitor terminal, enter n at the prompt.
Save or display diagnostic information (Y=save, N=display)? [Y/N] :N
===========================================================
===============display alarm===============
No alarm information.
=========================================================
===============display boot-loader===============
Software images on slot 0:
Current software images:
cfa0:/BOOT-R7951P01.bin
cfa0:/SYSTEM-R7951P01.bin
Main startup software images:
cfa0:/BOOT-R7951P01.bin
cfa0:/SYSTEM-R7951P01.bin
Backup startup software images:
None
=========================================================
===============display counters inbound interface===============
Interface Total (pkts) Broadcast (pkts) Multicast (pkts) Err (pkts)
BAGG1 0 0 0 0
GE4/0/1 0 0 0 0
GE4/0/2 2 2 0 0
GE4/0/3 0 0 0 0
GE4/0/4 0 0 0 0
GE4/0/5 0 0 0 0
GE4/0/6 0 0 0 0
GE4/0/7 0 0 0 0
GE4/0/8 0 0 0 0
GE4/0/9 0 0 0 0
GE4/0/10 0 0 0 0
Collecting card startup information
If a card starts up and enters normal state, the system saves the most recent 32 startup information records during the most recent startup for the card. The records are saved in memory regardless of whether the card is then operating correctly or powered off. You can use the display hardware internal boot information current command in probe view to display the records.
If a card cannot start up but reboots unexpectedly, the system saves information about the previous startup process during the reboot. The system uses a maximum of two files in the info directory of the CF card to save the information. If a card reboots again and again, only the earlies information is retained. To display the retained startup information, perform the following tasks:
1. Display the files saved in the info directory of the CF card.
<Sysname>cd cfa0:/info/
<Sysname>dir
Directory of cfa0:/info
0 -rw- 6952 Jul 07 2016 10:19:24 info_3_0.bin
In the info_3_0.bin file name, 3 indicates that the file belongs to the LPU in slot 3, and 0 indicates that the file is the first file for the LPU.
2. Display the card startup information saved in a file.
<Sysname> system-view
System View: return to User View with Ctrl+Z.
[Sysname] probe
[Sysname-probe] display drvplat boot-info-record file cfa0:/info/info_3_0.bin
Slot 0, CPU 0
Total number of boot info in reserved memory: 32
--------------------------------------------------------------
2016/07/07, 09:19:07. NAT GMAC init end [OK]
2016/07/07, 09:18:48. IBC phase2 init end [OK]
2016/07/07, 09:18:48. Contorl channel count record init [OK]
2016/07/07, 09:18:45. BFD global data init [OK]
2016/07/07, 09:18:45. FWD phase2 init end [OK]
2016/07/07, 09:18:45. FWD init phase2 pe traffic enable pass, init phase2 end.
2016/07/07, 09:18:44. Get clock global config succeed. [OK]
2016/07/07, 09:18:44. BRAS task init [OK]
2016/07/07, 09:18:44. Mpls phase2 init [OK]
Contacting technical support
· Information described in "General guidelines."
· Product serial numbers.
This information will help the support engineer assist you as quickly as possible.
You can contact H3C Support at mailto:[email protected].
Dealing with password loss
Dealing with console login password loss
Use either of the following methods:
· (Preferred.) Telnetting to the device to change the console login password
· Using BootWare menus to change the console login password
Telnetting to the device to change the console login password
Before you Telnet to the device, make sure the following requirements are met:
· You can log in to the device by using Telnet.
· After login, you are assigned the user role network-admin or level-15.
To Telnet to the device to change the console login password:
1. Telnet to the device. (Details not shown.)
2. Determine the user line you are using.
To Telnet to the device to change the console login password:
3. Telnet to the device. (Details not shown.)
4. Determine the user line you are using.
<Sysname> display users
Idx Line Idle Time Pid Type
0 CON 0 00:01:13 Feb 19 17:34:43 543
+ 28 VTY 0 00:00:00 Nov 11 11:38:55 1865 TEL
Following are more details.
VTY 0 :
Location: 192.168.33.13
+ : Current operation user.
F : Current operation user works in async mode.
The output shows that two users are online. You are using VTY 0. Your IP address is 192.168.33.13. The other user is using Console 0.
5. Display the user roles assigned to the user line you are using.
[Sysname] line vty 0
[Sysname-line-vty0] display this
#
line aux 0
user-role network-operator
#
line con 0
user-role network-admin
#
line vty 0
authentication-mode none
user-role level-15
user-role network-admin
user-role network-operator
#
return
The output shows that VTY 0 has the level-15 user role. You have the right to change the console login password.
6. Configure password authentication for console login and set the password. You can also configure a different login authentication mode.
<Sysname> system-view
[Sysname] line console 0
[Sysname-line-console0] user-role level-15
[Sysname-line-console0] user-role network-admin
[Sysname-line-console0] authentication-mode password
[Sysname-line-console0] set authentication password simple 12345678
[Sysname-line-console0] return
7. Save the running configuration to use the configuration at the next reboot.
<Sysname> save
The current configuration will be written to the device. Are you sure? [Y/N] :y
Please input the file name(*.cfg)[flash:/default.cfg]
(To leave the existing filename unchanged, press the enter key):default.cfg
Validating file. Please wait....
Saved the current configuration to mainboard device successfully.
Using BootWare menus to change the console login password
|
|
CAUTION: · Use this method only if you cannot access the CLI. A reboot is required to access BootWare menus. · Do not power off the device while you are using this method. |
The procedure for using BootWare menus to change the console login password depends on whether password recovery capability is enabled.
· If password recovery capability is enabled, you can use the Skip Authentication for Console Login option to skip console login authentication and configure a new password.
· If password recovery capability is disabled, you can use the Restore to Factory Default Configuration option to restore the factory-default configuration and configure a new password.
To determine whether password recovery capability is enabled, use either of the following methods:
· View the bootstrap information displayed when you access the extended BootWare menu. If the message "Password recovery capability is enabled." is displayed, password recovery capability is enabled.
· Telnet to the device and display the running configuration. If the password-recovery enable command is configured, password recovery capability is enabled.
<Sysname> display current-configuration
#
version 7.1.075, Release 7951P01
#
mdc Admin id 1
#
sysname Sysname
#
command-alias enable
command-alias mapping undo no
command-alias mapping quit exit
command-alias mapping return end
#
system-working-mode bridgee
password-recovery enable
#
Changing the console login password when password recovery capability is enabled
1. Connect a configuration terminal to the console port of the device.
2. Power on the device.
The following information is displayed:
System is starting...
Press Ctrl+D to access BASIC-BOOTWARE MENU...
Press Ctrl+T to start memory test
Booting Normal Extended BootWare
The Extended BootWare is self-decompressing.........Done.
****************************************************************************
* *
* H3C BootWare, Version 1.13 *
* *
****************************************************************************
Compiled Date : Mar 10 2014
CPU Type : XLP316
CPU Clock Speed : 1200MHz
Memory Type : DDR3 SDRAM
Memory Size : 8192MB
Memory Speed : 667MHz
BootWare Size : 1536KB
Flash Size : 500MB
BASIC CPLD Version : 1.0
EXTENDED CPLD Version : 1.0
PCB Version : Ver.A
BootWare Validating...
Press Ctrl+B to access EXTENDED-BOOTWARE MENU...
3. Press Ctrl + B within three seconds after the "Press Ctrl+B to access EXTENDED-BOOTWARE MENU..." prompt message appears.
The extended BootWare menu is displayed:
Password recovery capability is enabled.
Note: The current operating device is flash
Enter < Storage Device Operation > to select device.
==========================<EXTENDED-BOOTWARE MENU>==========================
|<1> Boot System |
|<2> Enter Serial SubMenu |
|<3> Enter Ethernet SubMenu |
|<4> File Control |
|<5> Restore to Factory Default Configuration |
|<6> Skip Current System Configuration |
|<7> BootWare Operation Menu |
|<8> Skip Authentication for Console Login |
|<9> Storage Device Operation |
|<0> Reboot |
============================================================================
Ctrl+Z: Access EXTENDED ASSISTANT MENU
Ctrl+F: Format File System
Enter your choice(0-9):
4. Enter 8 to skip console login authentication.
Enter your choice(0-9): 8
Clear Image Password Success!
The extended BootWare menu is displayed again:
==========================<EXTENDED-BOOTWARE MENU>==========================
|<1> Boot System |
|<2> Enter Serial SubMenu |
|<3> Enter Ethernet SubMenu |
|<4> File Control |
|<5> Restore to Factory Default Configuration |
|<6> Skip Current System Configuration |
|<7> BootWare Operation Menu |
|<8> Skip Authentication for Console Login |
|<9> Storage Device Operation |
|<0> Reboot |
============================================================================
Ctrl+Z: Access EXTENDED ASSISTANT MENU
Ctrl+F: Format File System
Enter your choice(0-9):
5. Enter 0 to reboot the device. The device will ignore the console login password to access the CLI and load the next-startup configuration file.
Enter your choice(0-9): 0
System is starting...
Booting Normal Extend BootWare
The Extend BootWare is self-decompressing.................................
Done.
6. After the device starts up, configure a new console login password. You can also configure a different login authentication mode.
<Sysname> system-view
[Sysname] line console 0
[Sysname-line-console0] authentication-mode password
[Sysname-line-console0] set authentication password simple 12345678
[Sysname-line-console0] return
7. Save the running configuration to use the configuration at the next reboot.
<Sysname> save
The current configuration will be written to the device. Are you sure? [Y/N] :y
Please input the file name(*.cfg)[flash:/default.cfg]
(To leave the existing filename unchanged, press the enter key):default.cfg
Validating file. Please wait....
Saved the current configuration to mainboard device successfully.
Changing the console login password when password recovery capability is disabled
|
|
CAUTION: Restoring the factory-default configuration deletes the next-startup configuration files. |
To change the console login password when password recovery capability is disabled:
1. Connect a configuration terminal to the console port of the device.
2. Power on the device.
The following information is displayed:
System is starting...
Press Ctrl+D to access BASIC-BOOTWARE MENU...
Press Ctrl+T to start memory test
Booting Normal Extended BootWare
The Extended BootWare is self-decompressing.........Done.
****************************************************************************
* *
* H3C BootWare, Version 1.13 *
* *
****************************************************************************
Compiled Date : Mar 10 2014
CPU Type : XLP316
CPU Clock Speed : 1200MHz
Memory Type : DDR3 SDRAM
Memory Size : 8192MB
Memory Speed : 667MHz
BootWare Size : 1536KB
Flash Size : 500MB
BASIC CPLD Version : 1.0
EXTENDED CPLD Version : 1.0
PCB Version : Ver.A
BootWare Validating...
Press Ctrl+B to access EXTENDED-BOOTWARE MENU...
3. Press Ctrl + B within three seconds after the "Press Ctrl+B to access EXTENDED-BOOTWARE MENU..." prompt message appears.
The extended BootWare menu is displayed:
Password recovery capability is disabled.
Note: The current operating device is flash
Enter < Storage Device Operation > to select device.
==========================<EXTENDED-BOOTWARE MENU>==========================
|<1> Boot System |
|<2> Enter Serial SubMenu |
|<3> Enter Ethernet SubMenu |
|<4> File Control |
|<5> Restore to Factory Default Configuration |
|<6> Skip Current System Configuration |
|<7> BootWare Operation Menu |
|<8> Skip Authentication for Console Login |
|<9> Storage Device Operation |
|<0> Reboot |
============================================================================
Ctrl+Z: Access EXTENDED ASSISTANT MENU
Ctrl+F: Format File System
Enter your choice(0-9): 0
4. Enter 5 and press Y to delete the next-startup configuration files.
Enter your choice(0-9): 5
Because the password recovery capability is disabled, this operation can
cause the configuration files to be deleted, and the system will start up
with factory defaults. Are you sure to continue?[Y/N]Y
Setting...Done.
The extended BootWare menu is displayed again:
==========================<EXTENDED-BOOTWARE MENU>==========================
|<1> Boot System |
|<2> Enter Serial SubMenu |
|<3> Enter Ethernet SubMenu |
|<4> File Control |
|<5> Restore to Factory Default Configuration |
|<6> Skip Current System Configuration |
|<7> BootWare Operation Menu |
|<8> Skip Authentication for Console Login |
|<9> Storage Device Operation |
|<0> Reboot |
============================================================================
Ctrl+Z: Access EXTENDED ASSISTANT MENU
Ctrl+F: Format File System
Enter your choice(0-9): 0
5. Enter 0 to reboot the device. The device will reboot with the factory defaults.
Enter your choice(0-9): 0
System is starting...
Booting Normal Extend BootWare
The Extend BootWare is self-decompressing.................................
Done.
6. After the device starts up, configure a new console login password. You can also configure a different login authentication mode.
<Sysname> system-view
[Sysname] line console 0
[Sysname-line-console0] authentication-mode password
[Sysname-line-console0] set authentication password simple 12345678
[Sysname-line-console0] return
7. Save the running configuration to use the configuration at the next reboot.
<Sysname> save
The current configuration will be written to the device. Are you sure? [Y/N] :y
Please input the file name(*.cfg)[flash:/default.cfg]
(To leave the existing filename unchanged, press the enter key):default.cfg
Validating file. Please wait....
Saved the current configuration to mainboard device successfully.
Dealing with Telnet password loss
1. Log in to the device through the console port.
2. Configure password authentication and a new password for VTY lines. You can also configure a different login authentication mode.
<Sysname> system-view
[Sysname] line vty 0 63
[Sysname-line-vty0-63] authentication-mode password
[Sysname-line-vty0-63] set authentication password simple 123456
[Sysname-line-vty0-63] return
3. Save the running configuration so the configuration can survive a reboot.
<Sysname> save
The current configuration will be written to the device. Are you sure? [Y/N] :y
Please input the file name(*.cfg)[flash:/default.cfg]
(To leave the existing filename unchanged, press the enter key):default.cfg
Validating file. Please wait....
Saved the current configuration to mainboard device successfully
Troubleshooting configuration loss
This section provides troubleshooting information for common configuration management issues.
Startup configuration file unavailable
Symptom
The device starts up with the factory defaults because the specified startup configuration files are not available.
Solution
|
|
CAUTION: Do not execute the save command to save the running configuration to the startup configuration before you complete the tasks in this section. The save operation overwrites the restored startup configuration file with the running configuration. |
To resolve the issue:
1. Transfer a backup copy of the main startup configuration file to the root directory of a storage medium on each MPU:
|
|
IMPORTANT: · Make sure the file is saved to the same type of storage medium on all MPUs. In this section, the CF card is the default storage medium and is used to save the file. · If a partitioned storage medium is used, make sure the configuration file is transferred to the root directory of the first partition on the storage medium. |
a. Download config.cfg from the FTP server to the root directory of the CF card on the active MPU.
<Sysname> ftp 192.168.33.13
Press CTRL+C to abort.
Connected to 192.168.33.13 (192.168.33.13).
220 WFTPD 2.0 service (by Texas Imperial Software) ready for new user
User (192.168.33.13:(none)): 1
331 Give me your password, please
Password:
230 Logged in successfully
Remote system type is MSDOS.
ftp> binary
200 Type is Image (Binary)
ftp> get config.cfg
227 Entering Passive Mode (192,168,33,13,209,24)
150 "F:\config.cfg" file ready to send (18494 bytes) in IMAGE / Binary mode
226 Transfer finished successfully.
18494 bytes received in 0.0383 seconds (471.1 kbyte/s)
ftp> quit
221 Windows FTP Server (WFTPD, by Texas Imperial Software) says goodbye
b. Copy the configuration file to the root directory of the CF card on the standby MPU.
<Sysname> copy config.cfg slot1#cfa0:/config.cfg
Copy cfa0:/config.cfg to slot1#cfa0:/config.cfg?[Y/N] :y
.
%Copy file cfa0:/config.cfg to slot1#cfa0:/config.cfg...Done.
2. Specify the configuration file as the main startup configuration file. Skip this step if the configuration file is saved to the same path as the corrupt main startup configuration file with the same file name.
<Sysname> startup saved-configuration config.cfg
3. Reboot the device.
4. If the issue persists, contact H3C Support.
Related commands
This section lists the commands that you might use for troubleshooting configuration loss.
|
Command |
Description |
|
binary |
Sets the file transfer mode to binary. |
|
copy |
Copies a file and saves the file to the destination directory. |
|
ftp |
Logs in to an FTP server and enters FTP client view. |
|
get |
Downloads a file from the FTP server and saves the file. |
|
startup saved-configuration |
Specifies a file as a startup configuration file. |
Troubleshooting hardware
This section provides troubleshooting information for common hardware issues.
|
|
NOTE: For more information about LEDs, see H3C SR8800-X Routers Installation Guide and H3C SR8800-X-S Router Installation Guide. |
|
|
NOTE: If the router outputs log message "Forwarding fault", "Board fault: chassis X slot Y", or "please check it", see "Troubleshooting hardware forwarding." |
No display on the configuration terminal
Symptom
The configuration terminal does not have a display when the router is powered on.
Solution
To resolve the issue:
1. Verify that the power system is operating correctly.
2. Verify that the MPU is operating correctly.
3. Verify that the console cable is correctly connected to the console port or the USB console port on the MPU and the specified serial port on the configuration terminal.
4. Verify that the following settings are configured for the terminals:
¡ Baud rate—9600.
¡ Data bits—8.
¡ Parity—None.
¡ Stop bits—1.
¡ Flow control—None.
5. Verify that the console cable is in good quality and is operating correctly.
6. If the issue persists, contact H3C Support.
Garbled display on the configuration terminal
Symptom
The configuration terminal has garbled display when the router is powered on.
Solution
To resolve the issue:
1. Verify that the following settings are configured for the terminal:
¡ Baud rate—9600.
¡ Data bits—8.
¡ Parity—None.
¡ Stop bits—1.
¡ Flow control—None.
¡ Emulation—VT100.
2. If the issue persists, contact H3C Support.
Card state abnormality
Symptom
The card LEDs indicate a failure:
· SR05SRP1L1/SR05SRP1L3/SR07SRPUB1/SR07SRPUC1/SR07SRPUD3/SR05SRP1P3 MPU—The RUN and ALM LEDs on the MPU are flashing or steady on.
· SR07SRPUA1 MPU—The RUN/ALM LED on the MPU is steady red or flashing red.
· SR07MPUA1/SR07MPUA3 MPU—The RUN LED on the MPU is off, and the RUN and ALM LEDs on the service module are on.
· SFC-08E1/SFC-16E switching fabric module—The RUN LED is off.
· Type B/Type D switching fabric module—The RUN LED is off or flashing, and the ALM LED is steady on.
The output from the display device command shows that the card is in Absent, Fault, Off, Offline, or Illegal state.
· SR8800-X:
<Sysname> display device
Slot No. Brd Type Brd Status Software Version
0 SR05SRP1L3 Master SR8800-CMW710-R7951P01
1 SR05SRP1L3 Standby NONE
2 SPC-XP8LB Normal SR8800-CMW710-R7951P01
3 MPE-1104 Normal SR8800-CMW710-R7951P01
Sub1 MIC-SP4L Normal
Sub2 MIC-SP4L Normal
Sub3 MIC-CLP2L Normal
Sub4 MIC-GP4L Normal
4 SPC-XP8LB Normal SR8800-CMW710-R7951P01
5 NONE Absent NONE
6 SFC-04D Normal SR8800-CMW710-R7951P01
7 NONE Absent NONE
8 NONE Absent NONE
9 NONE Absent NONE
<Sysname> display device
Slot No. Brd Type Brd Status Software Version
0 SR07SRPUA1 Standby SR8800FS-CMW710-R7951P01
1 SR07SRPUA1 Master SR8800FS-CMW710-R7951P01
2 SPC-XP8LB Normal SR8800FS-CMW710-R7951P01
3 NONE Absent NONE
4 NONE Absent NONE
5 NONE Absent NONE
6 NONE Absent NONE
7 MPE-1104 Normal SR8800FS-CMW710-R7951P01
Sub1 MIC-GP8L Normal
Sub2 MIC-SP4L Normal
Sub3 NONE Absent
Sub4 MIC-GP4L Normal
Solution
In Absent state
To resolve the issue:
1. Verify that the card is installed securely. Reinstall the card to ensure that the card is installed securely.
2. Verify that the card is not faulty:
a. Install this card into another slot.
b. Install another card that is operating correctly on the chassis into this slot.
3. Verify that the LEDs on the card do not indicate any faults.
4. Verify that the output power of the power modules is as required by the device.
5. Verify that the card is supported in the current software version.
a. Execute the display version command to display the system software version.
b. Contact H3C Support to verify that the card is supported in the current software version.
c. If the current software version does not support the card, upgrade the card to a compatible version.
6. Perform the following tasks as needed:
¡ If the card is an MPU, press the Reset button on the MPU to reset the MPU and wait for the MPU to finish rebooting. Then connect the MPU to a terminal through a console cable to verify that it operates correctly.
¡ If the card is a service module, verify that the MPU is operating correctly.
¡ If the card is an MPU or a switching fabric module with a console port, connect the card to a terminal through a console cable to verify that it boots correctly.
7. If the card is faulty, replace the card and contact H3C Support.
8. If the issue persists, contact H3C Support.
In Off state
To resolve the issue:
1. Determine whether a user powered off the card by using the debug sysm power-down command.
¡ If the user did power off the card, power on the card by using the debug sysm power-up command.
¡ If the user did not power off the card, the power module of the card is faulty. Replace the card and contact H3C Support.
2. If the issue persists, contact H3C Support.
In Fault state
To resolve the issue:
1. Wait approximately 10 minutes, and then check the card status:
¡ If the card remains in Fault state, go to the next step.
¡ If the card state changes to Normal, and then reboots, contact H3C Support.
2. For an MPU or a switching fabric module with a console port, connect the card to a terminal through a console cable to verify that the card boots correctly. For example, if the following output is displayed, verify that the DRAM is installed securely.
readed value is 55555555 , expected value is aaaaaaaa
DRAM test fails at: 080ffff8
DRAM test fails at: 080ffff8
Fatal error! Please reboot the board.
3. Install the card into another slot to determine whether the card is faulty.
4. If the card is faulty, replace the card and contact H3C Support.
5. If the issue persists, contact H3C Support.
Card reboot
Symptom
A card rebooted unexpectedly or repeatedly.
Solution
To resolve the issue:
1. View the log messages, or execute the display version command to determine the period during which the card rebooted.
The following is a sample output from the display version command:
<Sysname> display version
H3C Comware Software, Version 7.1.075, Release 7951P01
Copyright (c) 2004-2017 New H3C Technologies Co. Ltd. All rights reserved.
H3C SR8804-X uptime is 0 weeks, 0 days, 4 hours, 24 minutes
Last reboot reason : Cold reboot……
2. Determine whether a user rebooted the card by using the reboot command or by powering off and then powering on the card during the period.
The reason for last reboot is displayed in the display version command output. You can check the Last reboot reason field for the event that caused the last reboot. As shown in the preceding sample command output, Cold reboot indicates that the reason for the last reboot is that the card was powered on.
3. If all cards rebooted simultaneously, verify the following information:
¡ The power modules are operating correctly.
¡ The router has not been disconnected from the power source.
¡ The power cables are connected securely.
4. Verify that log message "Warning: Standby board on slot 1 is not compatible with master board." or "Warning: The LPU board on slot 1 is not compatible with MPU board." did not appear during the cold reboot. If the message was displayed, replace the card and contact H3C Support.
5. If the issue persists, contact H3C Support.
Power module failure
Symptom
On an SR8800-X, the AC LED is off or the DC LED is steady red on an AC power module. On a DC power module, the INP OK LED is off or the DC/FLT LED is steady red.
On an SR8800-X-S, a power module LED is not steady green.
Solution
To resolve the issue:
1. Verify that the power module is securely installed. Reinstall the power module to make sure the module is installed securely.
2. Verify that the power module is not faulty by exchanging it with another one that operates correctly.
3. Verify that the power cord is connected correctly. You can reinstall or replace the power cord.
4. Verify that the power source is supplying power as required.
5. Verify that problems, such as short-circuit output, over-current output, over-voltage output, under-voltage input, and overtemperature, do not occur on the power module.
6. Execute the display power command to display the power module information.
An issue has occurred if the power module is installed securely but the power module state field is empty or displays Absent. The following is a sample output from the display power command:
<Sysname> display power
Power 0 State: Normal
Power 1 State: Absent
Power 2 State: Absent
Power 3 State: Absent
¡ SR8800-X-S
<Sysname> display power
Power 0 State: Normal
Power 1 State: Absent
7. If the power module is faulty, replace the module.
8. If the issue persists, contact H3C Support.
Fan tray failure
Symptom
The OK LED of a fan tray is off and the FAIL LED is steady on.
Solution
To resolve the issue:
1. Put your hand at the air outlet to verify that air is exhausted from the air outlet. If no air is exhausted from the outlet, the fan trays are faulty.
2. Verify that the airflow is not blocked at the air inlet and outlet.
3. Verify that the fan tray is securely installed. You can reinstall the fan tray to make sure the fan tray is securely installed.
4. Verify that the status of each fan is normal and the speed difference between the fans does not exceed 50%. If an abnormality has occurred, verify that the fan tray is not faulty by exchanging it with another one that runs correctly.
<Sysname> display fan
Fan Frame 0 State: Normal
<Sysname> system-view
[Sysname] probe
[Sysname-probe] debug sysm fan 0 get-speed
Frame 0 fan 1 speed is 2854 (R.P.M)
Frame 0 fan 2 speed is 2841 (R.P.M)
Frame 0 fan 3 speed is 3348 (R.P.M)
Frame 0 fan 4 speed is 3412 (R.P.M)
Frame 0 fan 5 speed is 3343 (R.P.M)
Frame 0 fan 6 speed is 3345 (R.P.M)
Frame 0 fan 7 speed is 3379 (R.P.M)
Frame 0 fan 8 speed is 3376 (R.P.M)
5. If the issue persists, replace the fan tray. If no new fan tray is available, power off the router to avoid damage caused by high temperature. The router can be used temporarily if there are cooling measures to maintain the router operating temperature below 50°C (122°F).
6. If the issue persists, contact H3C Support.
Temperature alarm
Symptom
A temperature over-low or over-high alarm is generated on the router, as shown in the following example:
%Jun 26 10:13:46:233 2013 H3C DRVPLAT/4/DrvDebug: Temperature of the board is too high!
Solution
To resolve the issue:
1. Verify that the ambient temperature is in the acceptable range.
2. If the ambient temperature is out of the acceptable range, check for ventilation or air conditioning issues.
3. Use the display environment command to verify that the current temperature of the router does not exceed the upper and lower warning and alarm thresholds.
4. If the temperature is too high, see "Fan tray failure" to check for fan tray failure. The card might be damaged when it operates continuously at a high temperature.
5. If the Temperature field displays error or an erroneous value, verify that the router can access the card temperature sensor:
a. Execute the display transceiver manuinfo interface command to verify that the transceiver module information is correctly displayed.
The router accesses the card temperature sensor and transceiver module information through the same I2C bus. The router can access the sensor if transceiver module information is correctly displayed.
b. Perform one of the following tasks depending on the check result:
- If transceiver module information is correctly displayed, use the temperature-limit command to reconfigure the temperature thresholds. Then use the display environment command to verify that the setting has taken effect.
- If transceiver module information is not correctly displayed, replace the transceiver module and perform the previous step again. If the information still cannot be displayed correctly, contact H3C Support to replace the card. The I2C bus on the card might have failed.
[Sysname] temperature-limit slot 1 hotspot 1 -5 85 100
[Sysname] display environment
System temperature information (degree centigrade):
----------------------------------------------------------------------
Slot Sensor Temperature Lower Warning Alarm Shutdown
3 hotspot 1 39 0 80 97 NA
3 hotspot 2 50 0 80 97 NA
7 inflow 1 31 0 71 90 NA
7 outflow 1 45 0 80 99 NA
7 hotspot 1 53 0 88 107 NA
6. If the issue persists, contact H3C Support.
Related commands
This section lists the commands that you might use for troubleshooting hardware.
|
Command |
Description |
|
display device |
Displays device information, including card states. |
|
display environment |
Displays the temperature statistics on the device, including the current temperature and temperature thresholds. |
|
display fan |
Displays the operating states of fans. |
|
display power |
Displays power module information. |
|
display version |
Displays system version information, card running time, and cause of the last reboot. |
|
save |
Saves the running configuration to a specific configuration file. |
|
temperature-limit |
Sets the temperature alarm thresholds for the device. |
Troubleshooting IRF
This section provides troubleshooting information for common IRF issues.
IRF fabric setup failure
Symptom
Two routers cannot form an IRF fabric.
Solution
Solution for the SR8800-X routers
To resolve the issue:
1. Verify that the routers are IRF capable and can form an IRF fabric with each other.
Any two of SR8804-X, SR8808-X, and SR8812-X routers can form an IRF fabric. Two SR8808H-X routers can form an IRF fabric. Two SR8816-X routers can form an IRF fabric.
2. Execute the display device command on the two routers. Verify that they are the same software version, MPU type, and switching fabric module type.
<Sysname-1> display device
Chassis Slot No. Brd Type Brd Status Software Version
1 0 NONE Absent NONE
1 1 SR05SRP1L3 Master SR8800-CMW710-R7951P01
1 2 NONE Absent NONE
1 3 NONE Absent NONE
1 4 SPC-XP8LB Normal SR8800-CMW710-R7951P01
1 5 SPC-XP8LB Normal SR8800-CMW710-R7951P01
1 6 SFC-04D Normal SR8800-CMW710-R7951P01
1 7 NONE Absent NONE
1 8 NONE Absent NONE
1 9 NONE Absent NONE
<Sysname-2> display device
Chassis Slot No. Brd Type Brd Status Software Version
2 0 NONE Absent NONE
2 1 SPC-CP1LCX Normal SR8800-CMW710-R7951P01
2 2 NONE Absent NONE
2 3 NONE Absent NONE
2 4 SR05SRP1L3 Standby SR8800-CMW710-R7951P01
2 5 SR05SRP1L3 Standby SR8800-CMW710-R7951P01
2 6 NONE Absent NONE
2 7 SPC-XP8LB Normal SR8800-CMW710-R7951P01
2 8 NONE Absent NONE
2 9 NONE Absent NONE
2 10 SFC-08B Normal SR8800-CMW710-R7951P01
2 11 NONE Absent NONE
2 12 NONE Absent NONE
2 13 NONE Absent NONE
3. Execute the display interface command to verify that the IRF physical interfaces are up. If an IRF physical interface is not up, troubleshoot the physical interfaces as described in "Interface fails to come up."
<Sysname> display interface ten-gigabitethernet 2/7/0/1
Ten-GigabitEthernet2/7/0/1
Current state: UP
IP Packet Frame Type: PKTFMT_ETHNT_2, Hardware Address: 80f6-5665-4302
Description: Ten-GigabitEthernet2/7/0/1 Interface
Bandwidth: 10000000kbps
Loopback is not set
Media type is optical fiber,Port hardware type is 10G_BASE_SR_SFP
…
4. Execute the display irf configuration command to verify that IRF physical interfaces have been bound to IRF-port 1 on one member and to IRF-port 2 on the other member. Make sure the IRF port bindings meet the binding requirements in the virtual technologies configuration guide for the router.
<Sysname> display irf configuration
MemberID NewID IRF-Port1 IRF-Port2
1 1 Ten-GigabitEthernet1/5/0/1 disable
Ten-GigabitEthernet1/5/0/2
Ten-GigabitEthernet1/5/0/5
2 2 disable Ten-GigabitEthernet2/7/0/1
5. If the SR8800-X router has only one switching fabric module, verify that the switching fabric module is not installed in the second switching fabric module slot.
6. Verify that the IRF physical interfaces are correctly connected.
Connect the physical interfaces of IRF-port 1 on one member device to the physical interfaces of IRF-port 2 on the other member device.
Do not connect IRF physical interfaces to non-IRF physical interfaces.
7. Execute the irf-port-configuration active command to activate IRF ports. Make sure you have saved the configuration before executing this command.
8. Execute the display device command to verify that each router has a unique IRF member ID. If two routers have the same member ID, use the irf member renumber command to modify the IRF member ID of one router. The modification takes effect after a reboot.
9. Execute the display install active command on each router to verify that the routers have the same active patches.
<Sysname> display install active
Active packages on slot 0:
cfa0:/BOOT-R7951P01.bin
cfa0:/SYSTEM-R7951P01.bin
cfa0:/DEVKIT-R7951P01.bin
cfa0:/SYSTEM-R7951P01H01.bin
Active packages on slot 4:
cfa0:/BOOT-R7951P01.bin
cfa0:/SYSTEM-R7951P01.bin
cfa0:/DEVKIT-R7951P01.bin
cfa0:/SYSTEM-R7951P01H01.bin
10. Execute the display system-vlan-mode command to verify that the routers are operating in the same VLAN mode. If they are not operating in the same VLAN mode, use the system-vlan-mode command to set the VLAN mode to the same one and reboot the routers for the command to take effect.
<Sysname> display system-vlan-mode
The current system vlan mode: standard.
The system vlan mode for next startup: standard.
11. If the issue persists, contact H3C Support.
Solution for the SR8800-X-S routers
To resolve the issue:
1. Verify that the routers are IRF capable and can form an IRF fabric.
The SR8802-X-S router is IRF incapable. An SR8800-X-S IRF fabric can contain only the SR8803-X-S, SR8806-X-S, or SR8810-X-S routers.
Only the MCC 10-GE ports on MPUs can be used as IRF physical interfaces.
2. Execute the display device command on each router to verify that the routers use the same software version and MPU type.
<Sysname> display device
Chassis Slot No. Brd Type Brd Status Software Version
1 0 NONE Absent NONE
1 1 NONE Absent NONE
1 2 NONE Absent NONE
1 3 NONE Absent NONE
1 4 NONE Absent NONE
1 5 NONE Absent NONE
1 6 SR07SRPUD3 Master SR8800-CMW710-R7951P01
1 7 NONE Absent NONE
1 8 NONE Absent NONE
1 9 NONE Absent NONE
1 10 NONE Absent NONE
1 11 NONE Absent NONE
3. Execute the display interface command to verify that the IRF physical interfaces are up. If an IRF physical interface is not up, troubleshoot the physical interfaces as described in "Interface fails to come up."
<Sysname> display interface ten-gigabitethernet 1/6/0/1
Ten-GigabitEthernet1/6/0/1
Current state: UP
IP Packet Frame Type: PKTFMT_ETHNT_2, Hardware Address: 0000-5c55-4446
Description: Ten-GigabitEthernet1/6/0/1 Interface
Bandwidth: 10000000kbps
Loopback is not set
Media type is stack wire,Port hardware type is STACK_SFP_PLUS
10Gbps-speed mode, full-duplex mode
Link speed type is force link, link duplex type is force link
The Maximum Frame Length is 9216
Mdi type: automdix
Last clearing of counters: Never
Peak value of input: 14546 bytes/sec, at 2015-05-23 16:18:47
Peak value of output: 71180 bytes/sec, at 2015-05-23 16:18:47
Last 5 seconds input: 45 packets/sec 14546 bytes/sec 0%
Last 5 seconds output: 128 packets/sec 71180 bytes/sec 0%
Input (total): 15526 packets, 4977413 bytes
11165 unicasts, 0 broadcasts, 4311 multicasts, 0 pauses
Input (normal): 15476 packets, - bytes
11165 unicasts, 0 broadcasts, 4311 multicasts, 0 pauses
Input: 0 input errors, 0 runts, 0 giants, 0 throttles
0 CRC, 0 frame, - overruns, 0 aborts
- ignored, - parity errors
Output (total): 40620 packets, 21921069 bytes
23654 unicasts, 0 broadcasts, 16916 multicasts, 0 pauses
Output (normal): 40570 packets, - bytes
23654 unicasts, 0 broadcasts, 16916 multicasts, 0 pauses
Output: 0 output errors, - underruns, - buffer failures
0 aborts, 0 deferred, 0 collisions, 0 late collisions
0 lost carrier, - no carrier
4. Execute the display irf configuration command to verify that IRF physical interfaces have been bound to IRF-port 1 on one member and to IRF-port 2 on the other member. Make sure the IRF port bindings meet the binding requirements in the virtual technologies configuration guide for the router.
<Sysname> display irf configuration
MemberID NewID IRF-Port1 IRF-Port2
1 1 disable Ten-GigabitEthernet1/5/0/1
Ten-GigabitEthernet1/5/0/2
Ten-GigabitEthernet1/6/0/1
Ten-GigabitEthernet1/6/0/2
4 4 Ten-GigabitEthernet4/0/0/1 disable
Ten-GigabitEthernet4/0/0/2
Ten-GigabitEthernet4/1/0/1
Ten-GigabitEthernet4/1/0/2
5. Execute the irf-port-configuration active command to activate IRF ports. Make sure you have saved the configuration before executing this command.
6. Execute the display device command to verify that each router has a unique IRF member ID. If two routers have the same member ID, use the irf member renumber command to modify the IRF member ID of one router. The modification takes effect after a reboot.
7. Execute the display install active command on each router to verify that the routers have the same active patches.
<Sysname> display install active
Active packages on slot 0:
cfa0:/BOOT-R7951P01.bin
cfa0:/SYSTEM-R7951P01.bin
cfa0:/DEVKIT-R7951P01.bin
cfa0:/SYSTEM-R7951P01H01.bin
Active packages on slot 4:
cfa0:/BOOT-R7951P01.bin
cfa0:/SYSTEM-R7951P01.bin
cfa0:/DEVKIT-R7951P01.bin
cfa0:/SYSTEM-R7951P01H01.bin
8. Execute the display system-vlan-mode command to verify that the routers are operating in the same VLAN mode. If they are not operating in the same VLAN mode, use the system-vlan-mode command to set the VLAN mode to the same one and reboot the routers for the command to take effect.
<Sysname> display system-vlan-mode
The current system vlan mode: standard.
The system vlan mode for next startup: standard.
9. If the issue persists, contact H3C Support.
IRF split
Symptom
An IRF fabric splits.
Solution
Solution for the SR8800-X routers
To resolve the issue:
1. Check the log message generated when the IRF split to determine the IRF split time.
%Jun 26 10:13:46:233 2014 H3C STM/2/STM_LINK_STATUS_TIMEOUT: IRF port 1 is down because heartbeat timed out.
%Jun 26 10:13:46:436 2014 H3C STM/3/STM_LINK_STATUS_DOWN: -MDC=1; IRF port 2 is down.
2. Verify that the interface modules that provide IRF physical interfaces operate correctly. If an interface module does not operate correctly, troubleshoot the interface modules as described in "Card state abnormality" and "Card reboot."
3. Execute the display interface command to verify that the IRF physical interfaces are up. If an IRF physical interface is not up, troubleshoot the physical interfaces.
<Sysname> display interface ten-gigabitethernet 2/7/0/1
Ten-GigabitEthernet2/7/0/1
Current state: UP
IP Packet Frame Type: PKTFMT_ETHNT_2, Hardware Address: 80f6-5665-4302
Description: Ten-GigabitEthernet2/7/0/1 Interface
Bandwidth: 10000000kbps
Loopback is not set
Media type is optical fiber,Port hardware type is 10G_BASE_SR_SFP
…
4. Execute the display version command to verify that the routers or the interface modules that provide IRF physical interfaces do not reboot abnormally. If a router or an interface module reboots abnormally, troubleshoot the power module as described in "Power module failure."
<Sysname> display version
H3C Comware Software, Version 7.1.075, Release 7951P01
Copyright (c) 2004-2017 New H3C Technologies Co., Ltd. All rights reserved.
H3C SR8804-X uptime is 0 weeks, 0 days, 4 hours, 49 minutes
Last reboot reason : USER reboot
Boot image: cfa0:/BOOT-R7951P01.bin
Boot image version: 7.1.075, Release 7951P01
Compiled Nov 11 2014 08:49:26
System image: cfa0:/SYSTEM-R7951P01.bin
System image version: 7.1.075, Release 7951P01
Compiled Nov 11 2014 08:49:26
Feature image(s) list:
MPU(M) Chassis 1 Slot 1:
Uptime is 0 weeks,0 days,5 hours,2 minutes
BOARD TYPE: SR05SRP1L3
DRAM: 8192M bytes
CFCARD: 4002M bytes
FLASH: 500M bytes
NVRAM: 1M bytes
PCB 1 Version: VER.A
Bootrom Version: 116
CPLD 1 Version: 001
CPLD 2 Version: 001
CPLD 3 Version: 001
Release Version: H3C SR8804-X-7951P01
Patch Version : None
Reboot Cause : UserReboot
Clock card:
Type : SR07CK3C
PCB : Ver.A
FPGA version: 100
LPU Chassis 1 Slot 4:
Uptime is 0 weeks,0 days,2 hours,32 minutes
BOARD TYPE: SPC-GP44XP4LCX
DRAM: 4096M bytes
PCB 1 Version: VER.A
Bootrom Version: 116
CPLD 1 Version: 002
Release Version: H3C SR8804-X-7951P01
Patch Version : None
Reboot Cause : ColdReboot
Number of Exist Subcards: 0
LPU Chassis 1 Slot 5:
Uptime is 0 weeks,0 days,4 hours,56 minutes
BOARD TYPE: SPC-XP12LAX
DRAM: 4096M bytes
PCB 1 Version: VER.A
Bootrom Version: 116
CPLD 1 Version: 001
Release Version: H3C SR8804-X-7951P01
Patch Version : None
Reboot Cause : UserReboot
Number of Exist Subcards: 0
NPU Chassis 1 Slot 6:
Uptime is 0 weeks,0 days,4 hours,56 minutes
BOARD TYPE: SFC-04D
DRAM: 1024M bytes
PCB 1 Version: VER.B
Bootrom Version: 512
CPLD 1 Version: 002
Release Version: H3C SR8804-X-7951P01
Patch Version : None
Reboot Cause : UserReboot
LPU Chassis 2 Slot 1:
Uptime is 0 weeks,0 days,4 hours,38 minutes
BOARD TYPE: SPC-CP1LCX
DRAM: 4096M bytes
PCB 1 Version: VER.A
Bootrom Version: 116
CPLD 1 Version: 001
Release Version: H3C SR8804-X-7951P01
Patch Version : None
Reboot Cause : UserReboot
Number of Exist Subcards: 0
MPU(S) Chassis 2 Slot 4:
Uptime is 0 weeks,0 days,3 hours,56 minutes
BOARD TYPE: SR05SRP1L3
DRAM: 8192M bytes
CFCARD: 4002M bytes
FLASH: 500M bytes
NVRAM: 1M bytes
PCB 1 Version: VER.A
Bootrom Version: 116
CPLD 1 Version: 001
CPLD 2 Version: 001
CPLD 3 Version: 001
Release Version: H3C SR8808-X-7951P01
Patch Version : None
Reboot Cause : UserReboot
Clock card:
Type : SR07CK3C
PCB : Ver.A
FPGA version: 100
MPU(S) Chassis 2 Slot 5:
Uptime is 0 weeks,0 days,5 hours,2 minutes
BOARD TYPE: SR05SRP1L3
DRAM: 8192M bytes
CFCARD: 4002M bytes
FLASH: 500M bytes
NVRAM: 1M bytes
PCB 1 Version: VER.A
Bootrom Version: 116
CPLD 1 Version: 001
CPLD 2 Version: 001
CPLD 3 Version: 001
Release Version: H3C SR8808-X-7951P01
Patch Version : None
Reboot Cause : UserReboot
Clock card:
Type : SR07CK3C
PCB : Ver.A
FPGA version: 100
LPU Chassis 2 Slot 7:
Uptime is 0 weeks,0 days,4 hours,55 minutes
BOARD TYPE: SPC-XP24LCX
DRAM: 4096M bytes
PCB 1 Version: VER.A
Bootrom Version: 116
CPLD 1 Version: 001
Release Version: H3C SR8804-X-7951P01
Patch Version : None
Reboot Cause : UserReboot
Number of Exist Subcards: 0
NPU Chassis 2 Slot 10:
Uptime is 0 weeks,0 days,4 hours,56 minutes
BOARD TYPE: SFC-08B
DRAM: 1024M bytes
PCB 1 Version: VER.B
Bootrom Version: 514
CPLD 1 Version: 005
Release Version: H3C SR8804-X-7951P01
Patch Version : None
Reboot Cause : UserReboot
5. If the issue persists, contact H3C Support.
Solution for the SR8800-X-S routers
To resolve the issue for the SR8800-X-S routers:
1. Check the log message generated when the IRF split to determine the IRF split time.
%Jun 26 10:13:46:233 2014 H3C STM/2/STM_LINK_STATUS_TIMEOUT: IRF port 1 is down because heartbeat timed out.
%Jun 26 10:13:46:436 2014 H3C STM/3/STM_LINK_STATUS_DOWN: -MDC=1; IRF port 2 is down.
2. Verify that the MPUs that provide IRF physical interfaces operate correctly. If an MPU does not operate correctly, troubleshoot the MPUs as described in "Card state abnormality" and "Card reboot."
3. Execute the display interface command to verify that the IRF physical interfaces are up. If an IRF physical interface is not up, troubleshoot the physical interfaces as described in "Interface fails to come up."
<Sysname> display interface ten-gigabitethernet 1/6/0/1
Ten-GigabitEthernet1/6/0/1
Current state: UP
IP Packet Frame Type: PKTFMT_ETHNT_2, Hardware Address: 0000-5c55-4446
Description: Ten-GigabitEthernet1/6/0/1 Interface
Bandwidth: 10000000kbps
Loopback is not set
Media type is stack wire,Port hardware type is STACK_SFP_PLUS
10Gbps-speed mode, full-duplex mode
Link speed type is force link, link duplex type is force link
The Maximum Frame Length is 9216
Mdi type: automdix
Last clearing of counters: Never
Peak value of input: 21374 bytes/sec, at 2015-05-23 16:19:10
Peak value of output: 77798 bytes/sec, at 2015-05-23 16:19:10
Last 5 seconds input: 39 packets/sec 12420 bytes/sec 0%
Last 5 seconds output: 85 packets/sec 43207 bytes/sec 0%
Input (total): 24470 packets, 7974732 bytes
17950 unicasts, 0 broadcasts, 6445 multicasts, 0 pauses
Input (normal): 24395 packets, - bytes
17950 unicasts, 0 broadcasts, 6445 multicasts, 0 pauses
Input: 0 input errors, 0 runts, 0 giants, 0 throttles
0 CRC, 0 frame, - overruns, 0 aborts
- ignored, - parity errors
Output (total): 54633 packets, 30848497 bytes
30440 unicasts, 0 broadcasts, 24118 multicasts, 0 pauses
Output (normal): 54558 packets, - bytes
30440 unicasts, 0 broadcasts, 24118 multicasts, 0 pauses
Output: 0 output errors, - underruns, - buffer failures
0 aborts, 0 deferred, 0 collisions, 0 late collisions
0 lost carrier, - no carrier
4. Execute the display version command to verify that the devices or the MPUs that provide IRF physical interfaces do not reboot abnormally. If a device or an MPU reboots abnormally, troubleshoot the power module as described in "Power module failure."
<Sysname> display version
H3C Comware Software, Version 7.1.075, Release 7951P01
Copyright (c) 2004-2017 New H3C Technologies Co., Ltd. All rights reserved.
H3C SR8810-X-S uptime is 0 weeks, 2 days, 2 hours, 42 minutes
Last reboot reason : Cold reboot
Boot image: cfa0:/BOOT-R7951P01.bin
Boot image version: 7.1.075, Release 7951P01
Compiled May 13 2015 19:22:53
System image: cfa0:/SYSTEM-R7951P01.bin
System image version: 7.1.075, Release 7951P01
Compiled May 13 2015 19:22:53
Feature image(s) list:
MPU(M) Chassis 1 Slot 6:
Uptime is 0 weeks,2 days,2 hours,46 minutes
BOARD TYPE: SR07SRPUD3
DRAM: 8192M bytes
CFCARD: 4002M bytes
FLASH: 500M bytes
NVRAM: 1M bytes
PCB 1 Version: VER.A
Bootrom Version: 135
CPLD 1 Version: 001
CPLD 2 Version: 003
Release Version: H3C SR8810-X-S-7951P01
Patch Version : None
Reboot Cause : ColdReboot
Clock card:
Type : SR07CK3C
PCB : Ver.A
FPGA version: 100
Number of Exist Subcards: 0
MPU(S) Chassis 4 Slot 0:
Uptime is 0 weeks,1 day,0 hours,10 minutes
BOARD TYPE: SR07SRPUD3
DRAM: 8192M bytes
CFCARD: 4002M bytes
FLASH: 500M bytes
NVRAM: 1M bytes
PCB 1 Version: VER.A
Bootrom Version: 135
CPLD 1 Version: 001
CPLD 2 Version: 002
Release Version: H3C SR8806-X-S-7951P01
Patch Version : None
Reboot Cause : UserReboot
Clock card:
Type : SR07CK3C
PCB : Ver.A
FPGA version: 100
Number of Exist Subcards: 0
MPU(S) Chassis 4 Slot 1:
Uptime is 0 weeks,2 days,2 hours,45 minutes
BOARD TYPE: SR07SRPUD3
DRAM: 8192M bytes
CFCARD: 4002M bytes
FLASH: 500M bytes
NVRAM: 1M bytes
PCB 1 Version: VER.A
Bootrom Version: 135
CPLD 1 Version: 001
CPLD 2 Version: 003
Release Version: H3C SR8806-X-S-7951P01
Patch Version : None
Reboot Cause : UserReboot
Clock card:
Type : SR07CK3C
PCB : Ver.A
FPGA version: 100
Number of Exist Subcards: 0
LPU Chassis 4 Slot 2:
Uptime is 0 weeks,2 days,2 hours,28 minutes
BOARD TYPE: SPC-GP44XP4LA
DRAM: 4096M bytes
PCB 1 Version: VER.A
Bootrom Version: 120
CPLD 1 Version: 001
Release Version: H3C SR8810-X-S-7951P01
Patch Version : None
Reboot Cause : UserReboot
Number of Exist Subcards: 0
LPU Chassis 4 Slot 3:
Uptime is 0 weeks,2 days,2 hours,28 minutes
BOARD TYPE: SPC-XP12LC
DRAM: 4096M bytes
PCB 1 Version: VER.A
Bootrom Version: 120
CPLD 1 Version: 001
Release Version: H3C SR8810-X-S-7951P01
Patch Version : None
Reboot Cause : UserReboot
Number of Exist Subcards: 0
LPU Chassis 4 Slot 4:
Uptime is 0 weeks,2 days,2 hours,28 minutes
BOARD TYPE: SPC-GP44XP4LC
DRAM: 4096M bytes
PCB 1 Version: VER.A
Bootrom Version: 120
CPLD 1 Version: 001
Release Version: H3C SR8810-X-S-7951P01
Patch Version : None
Reboot Cause : UserReboot
Number of Exist Subcards: 0
5. If the issue persists, contact H3C Support.
Related commands
This section lists the commands that you might use for troubleshooting IRF.
|
Command |
Description |
|
debug ipv4-drv show config |
Displays IPv4 configuration information. |
|
display device |
Displays device information |
|
display install active |
Displays active software images. |
|
display interface |
Displays information for an interface. |
|
display irf configuration |
Displays basic IRF settings for each member device |
|
display system-vlan-mode |
Displays the system current VLAN mode and the next startup VLAN mode. |
|
display version |
Displays system version information. |
Troubleshooting system management
This section provides troubleshooting information for common system management issues.
High CPU usage
Symptom
The device responds to commands slowly. The sustained CPU usage is over 60% on a card.
<Sysname> display cpu-usage
Slot 2 CPU 0 CPU usage:
60% in last 5 seconds
60% in last 1 minute
60% in last 5 minutes
Slot 4 CPU 0 CPU usage:
3% in last 5 seconds
3% in last 1 minute
3% in last 5 minutes
Slot 5 CPU 0 CPU usage:
2% in last 5 seconds
2% in last 1 minute
2% in last 5 minutes
Slot 6 CPU 0 CPU usage:
3% in last 5 seconds
3% in last 1 minute
3% in last 5 minutes
<Sysname> display cpu-usage history slot 2
100%|
95%|
90%|
85%|
80%|
75%|
70%|
65%|
60%|
55%|
50%|
45%|
40%|
35%|
30%|
25%| # #
20%|############################################################
15%|############################################################
10%|############################################################
5%|############################################################
------------------------------------------------------------
10 20 30 40 50 60 (minutes)
cpu-usage (CPU 0) last 60 minutes (SYSTEM)
The output shows the CPU usage of the card in the recent 60 minutes.
Solution
Possible reasons for high CPU usage issues include:
· Route flapping is taking place.
· Too many routing policies are configured.
· The device is being attacked.
· A link loop exists. When an Ethernet interface operates in Layer 2 mode, a link loop might cause broadcast storm and network flapping issues. If such an issue occurs, a large number of protocol packets are sent to the CPU. Many interfaces on the device receive heavy traffic. The interface usage might reach 90% or be even higher.
To resolve the issue, perform the following tasks:
1. Verifying that the route flapping issue is not taking place
2. Verifying that the number of routing policies is not causing the issue
3. Verifying that the device is not being attacked
4. Verifying that no link loops exist
5. Collecting job stack information. Perform this task if the issue persists.
Verifying that the route flapping issue is not taking place
1. Display routing information multiple times.
[Sysname] display ip routing-table
Destinations : 13 Routes : 13
Destination/Mask Proto Pre Cost NextHop Interface
0.0.0.0/0 Static 60 0 192.168.2.1 MGE1/0/0/0
0.0.0.0/32 Direct 0 0 127.0.0.1 InLoop0
127.0.0.0/8 Direct 0 0 127.0.0.1 InLoop0
127.0.0.0/32 Direct 0 0 127.0.0.1 InLoop0
127.0.0.1/32 Direct 0 0 127.0.0.1 InLoop0
127.255.255.255/32 Direct 0 0 127.0.0.1 InLoop0
192.168.2.0/24 Direct 0 0 192.168.2.88 MGE1/0/0/0
192.168.2.0/32 Direct 0 0 192.168.2.88 MGE1/0/0/0
192.168.2.88/32 Direct 0 0 127.0.0.1 InLoop0
192.168.2.255/32 Direct 0 0 192.168.2.88 MGE1/0/0/0
224.0.0.0/4 Direct 0 0 0.0.0.0 NULL0
224.0.0.0/24 Direct 0 0 0.0.0.0 NULL0
255.255.255.255/32 Direct 0 0 127.0.0.1
10.1.1.0/24 OSPF 150 1 11.2.1.1 GE2/0/1
[Sysname] display ip routing-table
Destinations : 13 Routes : 13
Destination/Mask Proto Pre Cost NextHop Interface
0.0.0.0/0 Static 60 0 192.168.2.1 MGE1/0/0/0
0.0.0.0/32 Direct 0 0 127.0.0.1 InLoop0
127.0.0.0/8 Direct 0 0 127.0.0.1 InLoop0
127.0.0.0/32 Direct 0 0 127.0.0.1 InLoop0
127.0.0.1/32 Direct 0 0 127.0.0.1 InLoop0
127.255.255.255/32 Direct 0 0 127.0.0.1 InLoop0
192.168.2.0/24 Direct 0 0 192.168.2.88 MGE1/0/0/0
192.168.2.0/32 Direct 0 0 192.168.2.88 MGE1/0/0/0
192.168.2.88/32 Direct 0 0 127.0.0.1 InLoop0
192.168.2.255/32 Direct 0 0 192.168.2.88 MGE1/0/0/0
224.0.0.0/4 Direct 0 0 0.0.0.0 NULL0
224.0.0.0/24 Direct 0 0 0.0.0.0 NULL0
255.255.255.255/32 Direct 0 0 127.0.0.1
2. If the route flapping issue is taking place, save the routing table information and contact H3C Support.
Verifying that the number of routing policies is not causing the issue
1. Display routing policy information to identify whether too many routing policies are configured.
<Sysname> display route-policy
Route-policy: policy1
permit : 1
if-match cost 10
continue: next node 11
apply comm-list a delete
2. If too many routing policies are configured, use the undo mac-list command to remove some routing policies as required.
Verifying that the device is not being attacked
1. Use a packet capture tool to capture packets on interfaces of the device. For example, you can use Sniffer, Wireshark, or WinNetCap.
2. Analyze packet characteristics to identify the attack sources.
3. Configure attack prevention against the attack sources.
Verifying that no link loops exist
1. Display interface information to view the inbound packet statistics for interfaces on the device.
<Sysname> display interface gigabitethernet2/0/1
GigabitEthernet2/0/1
Current state: UP
Line protocol current state: UP
IP Packet Frame Type: PKTFMT_ETHNT_2, Hardware Address: 0000-e80d-c000
Description: GigabitEthernet2/0/1 Interface
Bandwidth: 1000000kbps
Loopback is not set
Media type is twisted pair
Port hardware type is 1000_BASE_T
Unknown-speed mode, unknown-duplex mode
Link speed type is autonegotiation, link duplex type is autonegotiation
……
Last clearing of counters: Never
Peak value of input: 123241940 bytes/sec, at 2014-02-27 14:33:15
Peak value of output: 80 bytes/sec, at 2014-02-27 14:13:00
Last 300 seconds input: 26560 packets/sec 123241940 bytes/sec 99%
Last 300 seconds output: 0 packets/sec 80 bytes/sec 0%
……
If the usage of an interface is 90% or higher, a link loop exists.
2. If a link loop exists, perform the following tasks:
¡ Verify that relevant links are correctly connected.
¡ Verity that relevant interfaces are correctly configured.
¡ Verify that STP is enabled and correctly configured.
¡ Verify that STP is operating correctly on neighboring devices.
3. If the issue persists, an STP protocol calculation error might have occurred or interfaces are not blocked at the driver level as expected. Perform the following tasks:
a. Shut down the uplink interface of the loop or disconnect the cable and then connect the cable again to trigger STP recalculation to recover services.
b. Send the symptom information to H3C Support for analysis.
Collecting job stack information
1. Identify the job that has a high CPU usage.
<Sysname> display process cpu slot 2
CPU utilization in 5 secs: 6.2%; 1 min: 6.1%; 5 mins: 6.1%
JID 5Sec 1Min 5Min Name
1 0.0% 0.0% 0.0% scmd
2 0.0% 0.0% 0.0% [kthreadd]
3 0.0% 0.0% 0.0% [migration/0]
4 0.0% 0.0% 0.0% [ksoftirqd/0]
5 0.0% 0.0% 0.0% [watchdog/0]
……
The output shows that the average CPU usage values of jobs for the last 5 seconds, 1 minute, and 5 minutes. Typically, the average CPU usage of a job is less than 30%.
2. Display the job's stack. Perform this step for a minimum of five times, save the output, and send the output to H3C Support for analysis.
<Sysname> system-view
[Sysname] probe
[Sysname-probe] follow process 28 slot 2
Attaching to process 28 ([ksoftirqd/8])
Iteration 1 of 5
------------------------------
Kernel stack:
[<ffffffff8045aaa8>] schedule+0x6b8/0xff0
[<ffffffff8024a9f0>] ksoftirqd+0x120/0x170
[<ffffffff8025e4d0>] kthread+0x130/0x140
[<ffffffff80218b50>] kernel_thread_helper+0x10/0x20
Iteration 2 of 5
------------------------------
Kernel stack:
[<ffffffff8045aaa8>] schedule+0x6b8/0xff0
[<ffffffff8024a9f0>] ksoftirqd+0x120/0x170
[<ffffffff8025e4d0>] kthread+0x130/0x140
[<ffffffff80218b50>] kernel_thread_helper+0x10/0x20
Iteration 3 of 5
------------------------------
Kernel stack:
[<ffffffff8045aaa8>] schedule+0x6b8/0xff0
[<ffffffff8024a9f0>] ksoftirqd+0x120/0x170
[<ffffffff8025e4d0>] kthread+0x130/0x140
[<ffffffff80218b50>] kernel_thread_helper+0x10/0x20
Iteration 4 of 5
------------------------------
Kernel stack:
[<ffffffff8045aaa8>] schedule+0x6b8/0xff0
[<ffffffff8024a9f0>] ksoftirqd+0x120/0x170
[<ffffffff8025e4d0>] kthread+0x130/0x140
[<ffffffff80218b50>] kernel_thread_helper+0x10/0x20
Iteration 5 of 5
------------------------------
Kernel stack:
[<ffffffff8045aaa8>] schedule+0x6b8/0xff0
[<ffffffff8024a9f0>] ksoftirqd+0x120/0x170
[<ffffffff8025e4d0>] kthread+0x130/0x140
[<ffffffff80218b50>] kernel_thread_helper+0x10/0x20
High memory usage
Symptom
The memory usage on a card is over 70% for more than 30 minutes.
<Sysname> display memory slot 2
The statistics about memory is measured in KB:
Slot 2:
Total Used Free Shared Buffers Cached FreeRatio
Mem: 774280 591932 182348 0 0 6548 23.6%
-/+ Buffers/Cache: 175800 598480
Swap: 0 0 0
The output shows that the free memory on the card in slot 2 is less than 30%. The memory usage on the card is over 70%.
Solution
|
|
IMPORTANT: H3C recommends not rebooting the device before you contact H3C Support. You might lose critical diagnostic information if you reboot the device. |
Typically reasons for this type of issues include:
· A memory leakage occurs.
· Too many routes exist.
To resolve the issue, perform the following tasks:
· Identifying the process that might have a memory leakage issue
· Collecting heap memory usage for the process
Identifying the process that might have a memory leakage issue
1. Display memory usage multiple times for all user processes on the card that has the high memory usage issue.
<Sysname> display process memory slot 2
JID Text Data Stack Dynamic Name
1 116 8808 32 92 scmd
2 0 0 0 0 [kthreadd]
3 0 0 0 0 [migration/0]
4 0 0 0 0 [ksoftirqd/0]
5 0 0 0 0 [watchdog/0]
6 0 0 0 0 [migration/1]
7 0 0 0 0 [ksoftirqd/1]
8 0 0 0 0 [watchdog/1]
……
2. Compare the values of the Dynamic field for each process in the command output. This field indicates the amount of memory space that a process has dynamically obtained. If the value of a process continuously increases, the process might have a memory leakage issue.
Collecting heap memory usage for the process
1. Display heap memory usage for the process multiple times, and save the command output.
<Sysname> display process memory heap job 1 verbose
Heap usage:
Size Free Used Total Free Ratio
32 1 340 341 0.3%
48 1 97 98 1.0%
64 0 108 108 0.0%
80 1 15 16 6.3%
96 0 53 53 0.0%
112 0 4 4 0.0%
144 0 3 3 0.0%
160 0 1 1 0.0%
176 0 50 50 0.0%
208 1 53 54 1.9%
224 0 5 5 0.0%
256 23 1 24 95.8%
288 2 1 3 66.7%
304 0 2 2 0.0%
320 1 0 1 100.0%
336 0 2 2 0.0%
512 7 0 7 100.0%
528 0 3 3 0.0%
704 0 152 152 0.0%
768 5 0 5 100.0%
896 0 9 9 0.0%
1056 0 2 2 0.0%
1248 1 0 1 100.0%
2080 0 1 1 0.0%
4112 0 1 1 0.0%
4208 1 0 1 100.0%
7264 1 0 1 100.0%
Summary:
Total virtual memory heap space(in bytes) : 204800
Total physical memory heap space(in bytes) : 204800
Total allocated memory(in bytes) : 177504
2. Compare the values of the Free Ratio field for each heap size in the command output. This field indicates the ratio of the free heap space to the total heap size. If the value of a heap size continuously increases, a memory block of the heap size might have a memory leakage issue.
3. Send the saved command output to H3C Support for analysis.
Resource shortage
Symptom
A resource shortage message appears.
Message examples:
The resources are insufficient.
No enough resource!
Not enough resources are available to complete the operation.
Solution
The following are the typical system resources:
· ACL
· FIB
· MAC
· MPLS LSP
· Multicast
· ARP
Troubleshooting ACL resource shortage
The following features might use ACL resources:
· QoS policies
· Packet filter
· Policy-based routing
· IPoE
· Portal
· URPF
· DHCP snooping
· LLDP
To resolve the issue:
1. Display QoS and ACL resource usage for cards.
<Sysname> display qos-acl resource slot 3
Interfaces: GE3/3/1 to GE3/3/8, Pos3/4/1 to Pos3/4/4
---------------------------------------------------------------------
Type Total Reserved Configured Remaining Usage
---------------------------------------------------------------------
IPv4Acl 65536 0 2 65534 0%
IPv6Acl 16384 0 0 16384 0%
Car&Cnt 32768 0 1 32767 0%
InBRASCar 65536 0 0 65536 0%
OutBRASCar 65536 0 0 65536 0%
TCPCar 16384 0 0 16384 0%
CarProf 220 0 2 218 0%
Sampler 32768 0 0 32768 0%
2. If the usage of an ACL resource type is higher than 95%, optimize the configuration as required. For example, you can delete or combine ACL rules. If you do not know how to optimize the configuration, collect and send the command output to H3C Support for analysis.
Troubleshooting FIB resource shortage
1. Display FIB resource usage.
For MPE-1104 and SPC cards:
[Sysname-probe] debug ipv4-drv show statistics slot 2
**********************************************************
- IPv4 Statistics Slot 2
**********************************************************
- ROUTE TOTAL COUNT: 40
- ECMP COUNT: 0
- ARP NH COUNT: 8
- IPV4 NH CHANGE NUM: 16
- ARP Prefix ADD NUM: 12
- ARP Prefix MODIFY NUM: 2
- ARP Prefix DEL NUM: 0
- ARP Prefix AddSuccessed NUM: 0
- ARP Prefix ModSuccessed NUM: 0
- ARP Prefix DelSuccessed NUM: 0
- IPV6 NH CHANGE NUM: 0
- IPV4 Plat ARP Demand NUM: 16
- IPV4 ARP Successed NUM: 16
- IPV4 Plat Route Demand NUM: 47
- IPV4 Route Successed NUM: 47
-----------------------------------------------
- IPv4Uc_Sm Owner: -1
- IPv4Uc_Sm Count: 0
- L3UcPbr_Sm Owner: -1
- L3UcPbr_Sm Count: 0
……
[Sysname-probe] debug ipv4-drv show config slot 2
**********************************************************
- IPv4 Config Slot 2
**********************************************************
- ARP SIZE: 16384
- ArpCanNotSetToHW: NO
- IPV4 ROUTE SIZE: 65536
- ECMP SIZE: 8
- ND SIZE: 8192
- IPV6 ROUTE SIZE: 8192
- IPV6 LongPrefRT: 128
- VLAN INTF MODE: 2
- NH SIZE: 16384
- ECMPGP SIZE: 256
- L3INTF SIZE: 4096
- VLAN INTF SIZE: 4096
- SUBVLAN SIZE: 3072
- MC INTF SIZE: 4005
- MPLS INTF SIZE: 4000
- TUNNEL INTF SIZE: 511
- VMAC SIZE: 256
- VMAC PER INTF SIZE: 16
- VLAN MAPPING SIZE: 4094
- ARP SET TO DEFIP: 1
- HG PROXY FLAG: 0
- BOARD TYPE: 0
- Is Set CPUPktPri: 1
- L3uc Opt: NO
- NetMFw FLAG: Fw_Hw
- RESERVED EGRESS:
- CPU EGRESS: 100001
- BLACKHOLE EGRESS: 100002
- HG PROXY EGRESS:
- UINT:0
0: Egress:100003 Mod:63 port:27
1: Egress:100004 Mod:63 port:27
- L3VPN SPECS:
- GLOBAL VRF NUM: 2048
- UPRF SPECS:
- URPF GLOBAL SUPPORT: YES
- URPF INTF SUPPORT: NO
- DEFAULT ROUTE DENY: NO
- IPv4 MaxRoute: 65536
- IPv6 MaxRoute: 4096
- CHIP SUPPORT TYPE: TRIUMPHV4EXT
……
The ROUTE TOTAL COUNT field indicates the used IPv4 entry resources. The IPv4 MaxRoute field indicates the total number of IPv4 entry resources.
For CSPC-GE16XP4L-E, CSPC-GE24L-E, CSPC-GP24GE8XP2L-E, CSPEX-1104-E, and SPEX-1204 cards:
[Sysname-probe] display hardware internal pe table all slot 3
=============================Table Instruction =================================
============
PID: PES Table ID
PTY: PES Table type
KAL: PES Key Align len
RAL: PES Result Align Len
SID: SDK TABLE ID
TableName: SDK Table name
STY: SDK Table type
LOCA: SDK Location
MaxEntry: SDK Max Entries
ES: SDK Entry_size
MID: SDK Moudle ID
CID: SDK DDR CTRL ID
CNAME: SDK DDR CTRL NAME
KSZ: SDK Key Size
RSZ: SDK Result Size
================================================================================
============
PID PTY KAL RAL SID TABLENAME STY LOCA MAXENTRY ES MID CID
CNAME KSZ RSZ
0 TAB 4 16 1 ipct TBL REG 256 16 0 255
NULL 0 16
1 TAB 4 16 2 remote-ipct TBL DDR 131072 16 72 18
DDR7 0 16
2 TAB 4 4 3 v4_vrrp BMP BRAM 32768 1 0 255
NULL 0 1
3 TAB 4 4 4 v6_vrrp BMP BRAM 32768 1 0 255
NULL 0 1
4 TAB 4 4 5 ipv4-vrrp-e BMP BRAM 524288 1 0 255
NULL 0 1
5 TAB 4 4 6 ipv6-vrrp-e BMP BRAM 524288 1 0 255
NULL 0 1
6 HAS 8 32 144 rpr-mac-hash DLH DDR 147456 32 99 30
DDR2 6 32
8 rpr-mac(Dhash Res) TBL DDR 131072 32 100 30
DDR2 0 32
7 HAS 8 8 145 rpr-node-mac-hash DSH DDR 131072 16 80 24
DDR6_0 8 16
9 rpr-node-mac(Dhash Res) TBL DDR 65536 16 81 24
DDR6_0 0 16
8 TAB 4 32 10 inlif TBL DDR 1048576 32 88 27
NULL 0 32
9 HAS 4 32 132 remote-inlif-hash SHA DDR 163840 32 66 16
DDR0_0 4 3
10 CSD 8 32 129 Ve-QinQ-inlif-hash SHA DDR 294912 32 72 18
DDR7 6 3
11 TAB 4 32 12 Ve-QinQ-inlif(CSD Res) TBL DDR 262144 32 88 27
NULL 0 32
12 LPM 8 8 118 ipv4-lpm LP4 CPU 0 8 0 255
NULL 0 8
13 TAB 4 16 119 ftn TBL DDR 4194304 16 64 16
DDR0_0 0 16
The total number of IPv4 entry resources is 3000000 entries. The output shows that the value of the PID field for the ftn row is 13.
# Display the number of used entries.
[Sysname-probe] display hardware internal pe table 13 entrycount slot 3
There are 16 entries!
For CEPC and CSPEX (except the CSPEX-1104-E)CSPEX (except the CSPEX-1204 and CSPEX-1104-E) cards:
¡ In TCAM mode:
[Sysname-probe] display hardware internal exttcam nfs db-info ipv4 slot 5 chip 0
Database name: IPV4
Database capacity: 4194304
Current entry count: 148052
Start index: 0x0
End index: 0x5fffff
Key width Type: 0
Key real size in bytes: 6
Key size defined by NPS: 8
Res size defined by NPS: 32
The Current entry count field indicates the number of used IPv4 entry resources in the TCAM. The Database capacity field indicates the total number of IPv4 entry resources.
¡ In Fast IP mode:
[System-probe] display hardware internal np table all slot 4 chip 0
TblID Name StruNum StruID Type KeyLen ResLen MaxEntry
0 IPCT 255 0 PORT 1 16 192
1 REMOTE_IPCT 66 48 TABLE 2 16 65536
2 VRRP_MAC 86 63 HASH 7 8 32768
7 RPR_MAC 89 65 HASH 6 20 131072
8 RPR_NODE_MAC 69 51 HASH 8 8 1024
9 INLIF 28 16 TABLE 3 32 1048576
10 REMOTE_INLIF 67 49 HASH 4 32 65536
12 QINQ_INLIF 65 47 HASH 6 32 65536
14 VE_INLIF 42 28 HASH 5 32 16384
18 TUNNEL_INLIF 116 85 HASH 3 16 32768
19 ILM 27 15 TABLE 3 32 1048576
20 ILM_ALIAS 88 15 TABLE 3 32 1048576
21 TUNNEL_ILM 71 53 HASH 6 24 65536
22 MAC 4 0 HASH 8 16 1048576
23 MAC_SMAC 45 0 HASH 8 16 1048576
24 MAC_SMAC_INNER 46 0 HASH 8 16 1048576
26 MINM_TUNNEL_END 48 31 HASH 13 8 65536
27 PROTOCOL_MAC 62 44 HASH 12 8 65536
28 RRPP_FILTER 93 69 TREE 12 4 65536
29 RRPP_FILTER_RESULT 95 70 TABLE 3 8 65536
30 PPPOE_USER 61 43 HASH 15 32 65536
31 V4IPOE_USER 34 22 HASH 11 32 65536
32 V4IPOE_SEGMENT_USER 36 24 TREE 7 4 4096
33 V4IPOE_SEGMENT_USER_RES 40 26 TABLE 2 32 8192
34 V6IPOE_USER 35 23 HASH 23 32 65536
35 V6IPOE_SEGMENT_USER 38 25 TREE 18 4 4096
36 V6IPOE_SEGMENT_USER_RES 40 26 TABLE 2 32 8192
37 L2TP_USER 41 27 HASH 16 32 131072
38 PPPOE_FILTER 60 42 HASH 5 8 262144
39 TCP_STREAM 70 52 HASH 39 32 917504
40 MLL 49 32 TABLE 3 16 16777216
41 OUTLIF 6 2 TABLE 3 32 2097152
42 OUTLIF_NOACL 44 2 TABLE 3 32 2097152
43 OUTLIF_TUNNEL 96 2 TABLE 3 32 2097152
44 OUTLIF_MLOG 98 2 TABLE 3 32 2097152
45 UDP_TUNNEL_START 13 7 TABLE 3 32 131072
46 IPV6_TUNNEL_START 80 59 TABLE 3 32 131072
47 USER 73 55 TABLE 2 16 65536
48 ARP 7 3 TABLE 3 32 1048576
49 RPR_ARP 90 66 TABLE 2 32 8192
50 NS_ARP 51 34 TABLE 3 32 1048576
51 FTN 255 0 EXTCAM_LPM 8 32 4194304
…
The total number of IPv4 entry resources in the DDR is 3000000 entries. The output shows that the value of the TblID field for the FTN row is 51.
2. Display the number of used entries in the DDR.
[System-probe] display hardware internal np table 103 entrycount slot 4
There are 160 entries
3. If the FIB resource usage is higher than 95%, collect and send the related information to H3C Support for analysis.
Troubleshooting MAC resource shortage
The MAC resource shortage issue typically occurs on large Layer 2 networks. This issue occurs when a number of MAC address entries are maintained and new entries need to be learned.
To resolve the issue:
1. Display the number of MAC address entries.
<Sysname> display mac-address count
49 mac address(es) found
2. Specify a smaller aging timer for dynamic MAC address entries so dynamic MAC address entries age faster.
3. Optimize the network topology by deploying VLANs. Configure the VLANs to communicate at Layer 3.
Troubleshooting MPLS LSP resource shortage
1. Display LSP statistics.
<Sysname> display mpls lsp statistics
LSP Type Ingress/Transit/Egress Active
Static LSP 0/0/0 0/0/0
Static CRLSP 0/0/0 0/0/0
LDP LSP 0/0/1 0/0/1
RSVP CRLSP 0/0/0 0/0/0
BGP LSP 0/0/0 0/0/0
Local LSP 0/0/0 0/0/0
-----------------------------------------------------
Total 0/0/1 0/0/1
2. If MPLS LSP resources are heavily used, collect the relevant information and contact H3C Support.
Troubleshooting shortage of other types of resources
Contact H3C Support.
Troubleshooting LDP failure
This section provides troubleshooting information for common LDP failure issues.
Failure to establish an LDP peer relationship
Symptom
The device failed to establish an LDP peer relationship with the peer device.
Execute the display mpls ldp peer command. If the peer state is not Operational, the peer relationship is not established successfully.
<Sysname> display mpls ldp peer 2.2.2.9
Total number of peers: 1
Peer LDP ID State Role GR MD5 KA Sent/Rcvd
2.2.2.9:0 Operational Passive Off Off 39/39
Solution
To resolve the issue:
1. Verify that a correct LSR ID has been configured, and the LDP session has been reset after the LSR ID is configured.
Execute the display mpls ldp parameter command to view the LSR ID.
<Sysname> display mpls ldp parameter
……
Instance Parameters:
Instance ID : 0
LSR ID : 0.0.0.0
Loop Detection : Off
……
2. Verify that the route to the peer is available.
Execute the display ip routing-table command to view the routing table information and ensure that a route is available to the peer device.
3. Verify that MPLS and LDP are enabled on interfaces.
a. Execute the following command to view the interfaces enabled with MPLS:
<Sysname> display mpls interface
Interface Status MPLS MTU
GE1/0/1 Up 1500
b. Execute the following command to view the interfaces enabled with LDP:
<Sysname> display mpls ldp interface
Interface MPLS LDP Auto-config
GE1/0/1 Enabled Configured -
Failure to establish an LDP LSP
Symptom
The display mpls ldp lsp command output shows that the specified LSP is not established successfully.
<Sysname> display mpls ldp lsp 112.1.1.1 32
Status Flags: * - stale, L - liberal, B - backup
FECs: 1 Ingress: 1 Transit: 1 Egress: 0
FEC In/Out Label Nexthop OutInterface
112.1.1.1/32 -/1150 200.100.12.2 RAGG1
6107/1150 200.100.12.2 RAGG1
Solution
Verify that the loopback interface on the device where the LSP failed to be established has a 32-bit IP address configured.
To view the loopback interface configuration, execute the display current-configuration interface loopback command.
<Sysname> display current-configuration interface loopback
interface LoopBack0
ip address 1.1.1.1 255.255.255.255
Troubleshooting MPLS L3VPN failure
This section provides troubleshooting information for common MPLS L3VPN failure issues.
No route to a destination VPN address
Symptom
The display ip routing-table vpn-instance command output shows that there is no route to the destination VPN address.
<Sysname> display ip routing-table vpn-instance vpn1
Destinations : 13 Routes : 13
Destination/Mask Proto Pre Cost NextHop Interface
0.0.0.0/32 Direct 0 0 127.0.0.1 InLoop0
10.1.1.0/24 Direct 0 0 10.1.1.2 GE1/0/1
10.1.1.0/32 Direct 0 0 10.1.1.2 GE1/0/1
10.1.1.2/32 Direct 0 0 127.0.0.1 InLoop0
10.1.1.255/32 Direct 0 0 10.1.1.2 GE1/0/1
10.3.1.0/24 BGP 255 0 3.3.3.9 GE1/0/4
127.0.0.0/8 Direct 0 0 127.0.0.1 InLoop0
……
Solution
1. Verify that the BGP configuration is correct.
Execute the display bgp peer vpnv4 command to view BGP VPNv4 peer information. Make sure a BGP neighbor relationship is established with the destination device.
<Sysname> display bgp peer vpnv4
BGP local router ID: 111.1.1.1
Local AS number: 100
Total number of peers: 1 Peers in established state: 1
* - Dynamically created peer
Peer AS MsgRcvd MsgSent OutQ PrefRcv Up/Down State
113.1.1.1 100 3 4 0 0 00:00:52 Established
2. Verify that the route targets are correctly configured.
Execute the display current-configuration vpn-instance command on the local and remote devices to display the route target configuration. Make sure the import targets on a device are the same as the export targets on the other device.
<PE1> display current-configuration vpn-instance
#
ip vpn-instance vpn1
route-distinguisher 100:1
vpn-target 111:1 import-extcommunity
vpn-target 111:1 export-extcommunity
#
3. Verify that route target filtering is disabled on the route reflector.
Make sure the following command has been executed:
bgp 100
#
address-family vpnv4
undo policy vpn-target
#
4. Verify that the route advertiser and receiver have been correctly configured.
# Verify that the route has been advertised.
<Sysname> display bgp routing-table vpnv4 3.3.3.3 32 advertise-info
……
BGP routing table information of 3.3.3.3/32(TxPathID:0):
Advertised to VPN peers (1 in total):
113.1.1.1
Inlabel : 1151
# Verify that the route has been received.
<Sysname> display bgp routing-table vpnv4 3.3.3.3 32
……
BGP routing table information of 3.3.3.3/32:
From : 111.1.1.1 (111.1.1.1)
……
FIB entry anomaly in a VPN instance
Symptom
The display fib vpn-instance command output shows that a FIB entry does not exist or indicates a black hole route.
<Sysname> display fib
Destination count: 5 FIB entry count: 5
Flag:
U:Usable G:Gateway H:Host B:Blackhole D:Dynamic S:Static
R:Relay F:FRR
Destination/Mask Nexthop Flag OutInterface/Token Label
0.0.0.0/32 127.0.0.1 UH InLoop0 Null
1.1.1.0/24 192.168.126.1 USGF M-GE0/0/0 Null
127.0.0.0/8 127.0.0.1 U InLoop0 Null
20.20.20.0/32 20.20.20.25 UBH M-GE0/0/0 Null
……
Solution
1. Verify that the route exists in the routing table of the VPN instance.
Execute the display ip routing-table vpn-instance command to display the routing table of the VPN instance. Verify that the route configuration is correct.
2. Verify that the public tunnel exists.
If a black hole route exists and the display mpls ldp lsp command shows that the LSP is not established successfully, make sure the following:
¡ The public tunnel configuration is correct.
¡ The peer connect-interface command is executed for the BGP instance.
Troubleshooting MPLS L2VPN and VPLS failure
This section provides troubleshooting information for common MPLS L2VPN and VPLS failure issues.
The MPLS L2VPN and VPLS protocol negotiation processes are the same. This section uses VPLS to illustrate the troubleshooting procedures.
Failure to establish an LDP peer relationship
See Failure to establish an LDP peer relationship.
Failure to establish an LDP LSP
See Failure to establish an LDP LSP.
AC or PW down
Symptom
The display l2vpn vsi verbose command output shows that AC or PW state is Down.
<Sysname> display l2vpn vsi name 1 verbose
……
LDP PWs:
Peer PW ID Link ID State
192.3.3.3 1 8 Up
ACs:
AC Link ID State
GE1/0/1 1 Up
Solution
1. If the AC is down, execute the display interface brief command to display information about the interface. Make sure the interface is up.
2. If the PW is down, execute the display l2vpn ldp verbose command to check the protocol configuration on the local and remote devices. Make sure the settings (especially the PW data encapsulation type and MTU) are the same on the devices.
<Sysname> display l2vpn ldp vsi 1 verbose
Peer: 2.2.2.2 PW ID: 1000
Xconnect-group: vpn1
Connection : ldp
PW State : Up
PW Status Communication: Notification method
PW ID FEC (Local/Remote):
PW Type : VLAN/VLAN
Group ID : 0/0
Label : 1151/1279
Control Word: Disabled/Disabled
VCCV CC Type: -/-
VCCV CV Type: -/-
MTU : 1500/1500
PW Status : PW forwarding/PW forwarding
3. Verify that the peer of the PW is configured correctly.
Execute the display current-configuration vsi command on the devices. Make sure the peer command specifies the LSR ID of the remote PE, and the PW ID is the same on local and remote PEs of the PW.
PW forwarding entry anomaly
Symptom
The display l2vpn forwarding pw command output shows that a PW is not established.
<Sysname> display l2vpn forwarding pw vsi aaa
Total number of VSIs: 1
Total number of PWs: 2, 2 up, 0 blocked, 0 down
VSI Name In/Out Label NID Link ID State
aaa 1272/1275 1034 8 Up
aaa 1271/1273 1035 9 Up
Solution
1. Verify that the PW exists.
Execute the display l2vpn vsi verbose command to display the detailed information of the specified VSI. Make sure the PW configuration is correct.
<Sysname> display l2vpn vsi name 1 verbose
……
LDP PWs:
Peer PW ID Link ID State
192.3.3.3 1 8 Up
192.3.3.3 1001 8 Blocked
……
2. Verify that the public tunnel exists.
Make sure the public tunnel configuration is correct.
Troubleshooting packet forwarding failure
This section provides troubleshooting information for common packet forwarding failure issues.
Failure to ping or trace route to a device
Symptom
The device fails to ping or trace route to a destination.
For example, all ICMP echo requests sent by device 192.168.20.14 to ping device 10.0.0.5 time out and no replies are received.
<Sysname> ping 10.0.0.5
PING 10.0.0.5 (10.0.0.5): 56 data bytes, press CTRL_C to break
Request time out
Request time out
Request time out
Request time out
Request time out
--- 10.0.0.5 ping statistics ---
5 packet(s) transmitted, 0 packet(s) received, 100.0% packet loss
Solution
To resolve the issue:
1. Determine if the destination device has correctly received the ICMP echo requests and sent out ICMP echo replies:
a. Enable ICMP debugging on the ping destination device.
<Sysname> debugging ip icmp
b. Check the debug output to verify that the device has received the ICMP echo requests sourced from 192.168.20.14 and destined for 10.0.0.5.
*Feb 8 18:28:47:417 2011 Sysname SOCKET/7/ICMP:
ICMP Input:
ICMP Packet: src = 192.168.20.14, dst = 10.0.0.5
type = 8, code = 0 (echo)
c. Check the debug output to verify that the device has sent out ICMP echo replies sourced from 10.0.0.5 and destined for 192.168.20.14.
*Feb 8 18:28:47:451 2011 Sysname SOCKET/7/ICMP:
ICMP Output:
ICMP Packet: src = 10.0.0.5, dst = 192.168.20.14
type = 0, code = 0 (echo-reply)
If the destination device has received the ICMP echo requests but failed to send ICMP echo replies, further troubleshoot the destination device as described in "L3 forwarding failure" and "MPLS forwarding failure."
If the destination device failed to receive the ICMP echo requests, the requests must be lost on the forwarding path. Proceed to step 2.
2. Find the packet forwarding path and locate where the ICMP packets are lost on the path.
To locate the node where the ICMP packets are lost, configure mirroring or QoS on the intermediate devices. Compare the numbers of inbound and outbound ICMP packets transmitted by the devices on the path. Steps a through f show how to use ACL and QoS to obtain the number of inbound ICMP packets on an interface of a device.
[Sysname] acl number 3000
[Sysname-acl-adv-3000] rule 1 permit ip destination 10.0.0.5 0
b. Create traffic class statistic_1 and specify ACL 3000 for it.
[Sysname] traffic classifier statistic_1
[Sysname-classifier-static] if-match acl 3000
c. Create traffic behavior statistic_1 and configure a traffic accounting action for it.
[Sysname] traffic behavior statistic_1
[Sysname-classifier-static] accounting packet
d. Associate traffic behavior statistic_1 with traffic class statistic_1 in QoS policy statistic_1.
[Sysname] qos policy statistic_1
[Sysname-classifier-static] classifier statistic_1 behavior statistic_1
e. Apply the QoS policy to the inbound direction of the interface which is an ingress interface of the ICMP echo packets.
[Sysname] interface gigabitethernet 8/0/1
[Sysname-GigabitEthernet8/0/1] qos apply policy statistic_1 inbound
f. Display the inbound packet statistics on the interface.
<Sysname> display qos policy interface gigabitethernet8/0/1
Interface: GigabitEthernet8/0/1
Direction: Inbound
Policy: statistic_1
Classifier: statistic_1
Operator: AND
Rule(s) : If-match acl 3000
Behavior: statistic_1
Accounting Enable:
1000 (Packets)
g. Use the method as described in steps a through f to obtain the outbound packet accounting statistics for an egress interface of the ICMP packets.
h. Compare the packet accounting statistics of the ingress and egress interfaces of the ICMP packets.
- If no ICMP packets are received on the ingress interface of a device, check the neighboring upstream device for faults.
- If the number of ingress ICMP packets matches the number of egress ICMP packets on a device, check the neighboring downstream device for faults.
- If the number of ingress ICMP packets does not match the number of egress ICMP packets on a device, further troubleshoot the device as described in "L3 forwarding failure" and "MPLS forwarding failure."
3. If the issue persists, contact H3C Support.
L3 forwarding failure
Symptom
The Layer 3 services malfunction. The ping operation fails and packet loss occurs for the tracert operation.
Solution
To resolve the issue, perform the following tasks:
1. Verifying that the destination MAC address is correct
2. Verifying that a route to the destination network exists
3. Verifying that a FIB entry for the destination network exists
4. Verifying that the ARP table is correct
Verifying that the destination MAC address is correct
When the destination MAC address of a received frame is the MAC address of the router, the router decapsulates the frame. You can use the mirroring feature or capture the packet to verify that the packet destination MAC address is the MAC address of the router. For information about mirroring, see Network Management and Monitoring Configuration Guide.
For example, Figure 1 and the command output shows that the destination MAC address in the Ethernet frame header is correct.
Figure 1 Packet destination MAC address
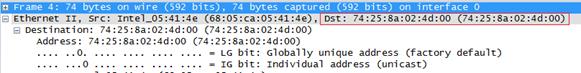
<Sysname> display interface GigabitEthernet 3/2/2
GigabitEthernet3/2/2
Current state: UP
Line protocol state: UP
Description: GigabitEthernet3/2/2 Interface
Bandwidth: 1000000kbps
Maximum Transmit Unit: 1500
Internet Address is 10.0.0.1/24 Primary
IP Packet Frame Type:PKTFMT_ETHNT_2, Hardware Address: 7425-8a02-4d00
IPv6 Packet Frame Type:PKTFMT_ETHNT_2, Hardware Address: 7425-8a02-4d00
Media type is not sure, Port hardware type is 10G_BASE_SR_SFP
Port priority: 0
Last clearing of counters: Never
Last 300 seconds input: 20 packets/sec 2565 bytes/sec 0%
Last 300 seconds output: 0 packets/sec 30 bytes/sec 0%
Input (total): 219479 packets, 28092544 bytes
219476 broadcasts, 0 multicasts, - pauses
Input (normal): 219479 packets, 28092544 bytes
- broadcasts, - multicasts, 0 pauses
Input: 0 input errors, 0 runts, 0 giants, 0 throttles
0 CRC, 0 frame, 0 overruns, - aborts
0 ignored, - parity errors
Output (total): 4608 packets, 316764 bytes
3378 broadcasts, 1154 multicasts, - pauses
Verifying that a route to the destination network exists
Verify that a route to the destination network exists. If the route does not exist, please verify that the routing protocol configuration and the routing protocol status are correct.
<Sysname> display ip routing-table 1.1.1.0
Summary Count : 1
Destination/Mask Proto Pre Cost NextHop Interface
1.1.1.0/24 Static 60 0 10.0.0.2 GE3/2/2
If a host route and an ARP entry have different output interfaces, the output interface in the host route is the actual output interface.
Verifying that a FIB entry for the destination network exists
If the route to the destination network exists, verify that a FIB entry for the destination network exists. If no FIB entry exists, please send the error information to technical support.
<Sysname> display fib 1.1.1.0
Destination count: 1 FIB entry count: 1
Flag:
U:Useable G:Gateway H:Host B:Blackhole D:Dynamic S:Static
R:Relay F:FRR
Destination/Mask Nexthop Flag OutInterface/Token Label
1.1.1.0/24 10.0.0.2 USG GE3/2/2 Null
Verifying that the ARP table is correct
1. Check if the device learns the correct ARP entry for the destination IP address. If the output interface in the ARP entry is not correct, execute the reset arp command to clear existing ARP entries. The device learns ARP again.
2. If necessary, you can use the arp static command to configure a static ARP entry for the destination IP address.
3. If the output interface in the learned ARP entry is always incorrect, please collect the error information and contact the technical support.
<Sysname> display arp 10.0.0.2
Type: S-Static D-Dynamic M-Multiport I-Invalid
IP address MAC address VLAN Interface Aging Type
10.0.0.2 0000-0000-0001 N/A GE3/2/2 N/A S
MPLS forwarding failure
Symptom
As shown in Figure 2, CE 1 and CE 2 cannot forward packets to each other over the LSPs on the MPLS network devices (PE 1, P, and PE 2).
Figure 2 MPLS network diagram
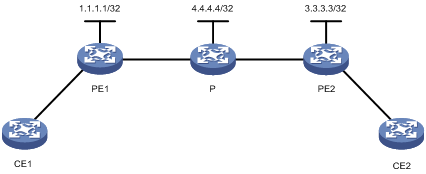
Solution
To resolve the issue:
1. Verify that MPLS LSPs exist.
[PE1] display mpls lsp
FEC Proto In/Out Label Interface/Out NHLFE
100.100.100.100/32 LDP 3/- -
4.4.4.4/32 LDP NULL/3 GE3/0/1
90.0.0.0/24 LDP NULL/3 GE3/0/1
1.1.1.1/32 LDP 3/NULL InLoop0
50.0.0.0/24 LDP NULL/3 GE3/0/1
70.0.0.0/24 LDP NULL/3 GE3/0/1
3.3.3.3/32 LDP NULL/1025 GE3/0/1
If the LSPs do not exist, verify the MPLS LSP configuration.
2. Verify that the MPLS LDP session state is Operational.
[PE1] display mpls ldp peer
Total number of peers: 1
Peer LDP ID State Role GR MD5 KA Sent/Rcvd
4.4.4.4:0 Operational Passive Off Off 39/39
If the MPLS LDP session state is not Operational, perform the following operations:
a. Execute the display mpls ldp interface command to view the LDP interface information.
[PE1] display mpls ldp interface
Interface MPLS LDP Auto-config
Vlan103 Enabled Configured -
GE3/0/2 Enabled Configured -
XGE2/0/6 Enabled Configured -
If the information is incorrect, verify the MPLS LDP configuration.
b. Verify that the interface is enabled with MPLS and MPLS LDP.
[PE1] interface gigabitethernet 3/0/1
[PE1-GigabitEthernet3/0/1] display this
#
interface GigabitEthernet3/0/1
ip address 1.1.1.2 255.255.255.0
mpls enable
mpls ldp enable
#
return
To establish LSPs on an interface, you must enable MPLS and MPLS LDP on the interface.
3. Verify that the LSR ID specified by the mpls lsr-id command is the IP address of a loopback interface.
<PE1> display current-configuration | include lsr-id
mpls lsr-id 2.2.2.2
<PE1> display ip interface brief
*down: administratively down
(s): spoofing
Interface Physical Protocol IP Address Description
Loop0 up up(s) 100.100.100.100 LoopBack0..
Loop2 up up(s) 100.100.100.102 LoopBack2..
M-E0/0/0 up up 192.168.147.7 M-Etherne..
<PE1> system-view
[PE1] mpls lsr-id 100.100.100.100
4. Verify that the routing table contains routes to the loopback interfaces on PE 1, P, and PE 2 and routes to the remote VLAN interfaces.
[PE1] display ip routing-table
Destinations : 10 Routes : 10
Destination/Mask Proto Pre Cost NextHop Interface
1.1.1.1/32 Direct 0 0 127.0.0.1 InLoop0
3.3.3.3/32 O_INTER 10 2 103.0.0.4 GE3/0/1
4.4.4.4/32 O_INTER 10 1 103.0.0.4 GE3/0/1
50.0.0.0/24 O_INTER 10 2 103.0.0.4 GE3/0/1
70.0.0.0/24 O_INTER 10 2 103.0.0.4 GE3/0/1
90.0.0.0/24 O_INTER 10 2 103.0.0.4 GE3/0/1
103.0.0.0/24 Direct 0 0 103.0.0.1 GE3/0/1
103.0.0.1/32 Direct 0 0 127.0.0.1 InLoop0
127.0.0.0/8 Direct 0 0 127.0.0.1 InLoop0
127.0.0.1/32 Direct 0 0 127.0.0.1 InLoop0
If the routes do not exist, verify the routing protocol configuration.
5. Verify that the routing protocol state is correct. This example uses OSPF.
[PE1] display ospf peer
OSPF Process 1 with Router ID 1.1.1.1
Neighbor Brief Information
Area: 0.0.0.0
Router ID Address Pri Dead-Time Interface State
4.4.4.4 103.0.0.4 1 37 Vlan103 Full/BDR
If the routing protocol state is incorrect, verify the routing protocol configuration.
6. Verify that the networks of the loopback interface and the VLAN interface have been advertised.
[PE1-ospf-1] display this
#
ospf 1
area 0.0.0.0
network 103.0.0.0 0.0.0.255
network 1.1.1.1 0.0.0.0
#
return
7. Verify that the routing protocol configurations on the local and remote devices are correct.
8. If the issue persists, contact H3C Support.
VXLAN forwarding failure
Symptom
The device cannot forward traffic for a VXLAN.
Solution
To resolve the issue:
1. Verify that the VXLAN tunnels of the VXLAN are up.
<Sysname> display interface tunnel 1
Tunnel1
Current state: UP
Line protocol state: UP
Description: Tunnel1 Interface
Bandwidth: 64 kbps
Maximum transmission unit: 1500
Internet protocol processing: Disabled
Last clearing of counters: Never
Tunnel source 10.10.1.2, destination 10.10.1.1
Tunnel protocol/transport UDP_VXLAN/IP
Last 300 seconds input rate: 0 bytes/sec, 0 bits/sec, 0 packets/sec
Last 300 seconds output rate: 0 bytes/sec, 0 bits/sec, 0 packets/sec
Input: 0 packets, 0 bytes, 0 drops
Output: 0 packets, 0 bytes, 0 drops
<Sysname> display l2vpn vsi name 1 verbose
VSI Name: 1
VSI Index : 2
VSI State : Up
MTU : 1500
Bandwidth : Unlimited
Broadcast Restrain : 5120 kbps
Multicast Restrain : 5120 kbps
Unknown Unicast Restrain: 5120 kbps
MAC Learning : Enabled
MAC Table Limit : Unlimited
MAC Learning rate : -
Drop Unknown : -
Flooding : Enabled
VXLAN ID : 1
Tunnels:
Tunnel Name Link ID State Type Flood proxy
Tunnel1 0x5000001 UP Manual Disabled
ACs:
AC Link ID State
GE3/1/3 0 Up
2. If a VXLAN tunnel is down, verify the following items:
¡ If the VXLAN tunnel uses the IP address of a non-loopback interface, verify that the physical link of the interface is up, and both ends of the VXLAN tunnel use consistent IP addresses.
¡ If the VXLAN tunnel uses the IP address of a loopback interface, make sure the ends of the VXLAN tunnel have Layer 3 connectivity.
3. Execute the display current-configuration command to verify that the device and remote VTEPs use the same UDP port number for VXLAN packets. The default UDP port number is 4789, which is not displayed in the output from the display current-configuration command. If configuration inconsistency exists, use the vxlan udp-port command to modify the UDP port number.
4. Verify that the device and remote VTEPs use the same VXLAN ID. If configuration inconsistency exists, reconfigure the VXLAN.
<Sysname> system-view
[Sysname] vsi 1
[Sysname-vsi-1] display this
#
vsi 1
vxlan 1
tunnel 1
#
return
5. Verify that the flooding disable all command is not executed on the VSI of the VXLAN. If the command has been executed, remove the configuration.
<Sysname> system-view
[Sysname] vsi 1
[Sysname-vsi-1] display this
#
vsi 1
flooding disable all
vxlan 1
tunnel 1
#
return
6. If the issue persists, contact H3C Support.
BFD forwarding failure
Symptom
· BFD peers cannot establish a BFD session.
· BFD sessions are always in down state.
· BFD sessions flap.
Solution
To resolve the issue:
1. Verify that the BFD peers can ping each other's interfaces.
<Sysname> ping 50.1.1.2
Ping 50.1.1.2 (50.1.1.2): 56 data bytes, press CTRL_C to break
56 bytes from 50.1.1.2: icmp_seq=0 ttl=255 time=1.722 ms
56 bytes from 50.1.1.2: icmp_seq=1 ttl=255 time=5.531 ms
56 bytes from 50.1.1.2: icmp_seq=2 ttl=255 time=1.553 ms
56 bytes from 50.1.1.2: icmp_seq=3 ttl=255 time=1.646 ms
56 bytes from 50.1.1.2: icmp_seq=4 ttl=255 time=1.561 ms
--- Ping statistics for 50.1.1.2 ---
5 packet(s) transmitted, 5 packet(s) received, 0.0% packet loss
round-trip min/avg/max/std-dev = 1.553/2.403/5.531/1.565 ms
If the peers cannot ping each other, check for incorrect interface configuration and physical connection issues.
2. Verify that the upper-layer protocol for BFD is up.
If the upper-layer protocol is OSPF, execute the display ospf peer command to identify the protocol state. If the protocol state is not up, check the protocol-related settings.
<Sysname> display ospf peer
OSPF Process 1 with Router ID 43.43.43.43
Neighbor Brief Information
Area: 0.0.0.0
Router ID Address Pri Dead-Time State Interface
15.15.15.22 50.1.1.2 1 36 Full/BDR GE3/1/4
If the upper-layer protocol is a tunneling protocol, execute the display interface tunnel brief command to identify the protocol state. If the protocol state is not up, check the protocol-related settings.
<Sysname> display interface tunnel brief
Brief information on interfaces in route mode:
Link: ADM - administratively down; Stby - standby
Protocol: (s) - spoofing
Interface Link Protocol Primary IP Description
Tun22 UP UP --
3. Verify that BFD is enabled.
[Sysname] mpls bfd enable
[Sysname] interface tunnel 22 mode mpls-te
[Sysname-Tunnel22] mpls bfd
|
|
NOTE: The commands and views for enabling BFD vary by the upper layer protocol for BFD. This example enables BFD for MPLS. |
4. Verify that uRPF is not configured if the source IP address of echo packets is not an IP address on the local device.
5. Verify that easy IP is not configured on the interface configured with BFD.
6. Verify that QinQ termination is not configured if the interface configured with BFD is a Layer 3 Ethernet subinterface or a Layer 3 aggregate subinterface.
7. Verify that the qos lr command is not configured on the interface configured with BFD on the following cards:
¡ CSPC cards.
¡ CSPEX-1812X and CSPEX-1104-E cards.
¡ CEPC cards.
¡ CSPEX-1602X, CSPEX-1404S, CSPEX-1404X, CSPEX-1504S, CSPEX-1504X, and SPEX1204 cards.
If the qos lr command is configured, the peer interface receives delayed packets, which causes BFD flappings.
8. For a VLAN interface configured with BFD, verify that STP settings do not cause a BFD forwarding failure.
If none of the member ports of the VLAN can forward packets, a BFD forwarding failure occurs on the VLAN interface.
9. Verify that the qos trust command has been used to configure the priority trust mode on one end if the other end uses the echo packet mode to establish a BFD session.
When an interface is congested, it might discard echo packets if they have low priority.
PPPoE forwarding failures
Symptom
The following are the typical PPPoE forwarding failure symptoms:
· The upstream traffic from clients to the public network cannot be forwarded.
· The downstream traffic from the public network to clients cannot be forwarded.
Solution
To resolve the issue:
1. Display the PPPoE session information to verify that sessions are working correctly and MAC addresses are correct.
<Sysname> display pppoe-server session summary slot 3
Total PPPoE sessions on slot 3: 1
Local PPPoE sessions on slot 3: 1
Ethernet interface: GE3/1/1 Session ID: 1
PPP index: 0x140002380 State: OPEN
Remote MAC: 0010-9400-0001 Local MAC: 5866-baf1-c4f4
Service VLAN: N/A Customer VLAN: N/A
2. Display the IP addresses and VPN instances allocated to PPPoE users to verify that they are configured correctly.
<Sysname> display ppp access-user user-type pppoe
Interface MAC address IP address Username
S/C-VLAN IPv6 PDPrefix IPv6 address
BAS0 0010-9400-0042 170.0.0.3 pppoe
-/- - 130::B520:4E93:2:A834
<Sysname> display ppp access-user ip-address 170.0.0.3 verbose
Basic:
Interface: BAS0
PPP index: 0x140000105
User ID: 0x28000002
Username: pppoe
Domain: hrss
Access interface: RAGG2
Service-VLAN/Customer-VLAN: -/-
VXLAN ID: -
MAC address: 0010-9400-0042
IP address: 170.0.0.3
Primary DNS server: 8.8.8.8
Secondary DNS server: 9.9.9.9
IPv6 address: 130::B520:4E93:2:A834
Primary IPv6 DNS server: 123::1
Secondary IPv6 DNS server: 123::2
IPv6 PD prefix: -
IPv6 ND prefix: -
User address type: N/A
VPN instance: 123
Access type: PPPoE
Authentication type: CHAP
PPPoE:
Session ID: 1
AAA:
Authentication state: Authenticated
Authorization state: Authorized
Realtime accounting switch: Open
Realtime accounting interval: 60s
Login time: 2013-1-19 2:42:3:358
Accounting start time: 2013-1-19 2:42:3:382
Online time(hh:mm:ss): 00:07:34
Accounting state: Accounting
Acct start-fail action: Online
Acct update-fail action: Online
Acct quota-out action: Offline
Dual-stack accounting mode: Merge
Idle cut: 0 sec 0 byte, direction: Both
Session timeout: 12000s
Time remained: 8000s
Traffic quota: 20971520 bytes
Traffic remained: 20970974 bytes
Redirect WebURL: http://6.6.6.6
ITA policy name: -
MRU: 1100 bytes
IPv4 MTU: 1000 bytes
IPv6 MTU: 1100 bytes
ACL&QoS:
User profile: profile123 (active)
Session group profile: -
User group acl: -
Inbound CAR: CIR 64000kbps PIR 640000kbps CBS - (active)
Outbound CAR: CIR 64000kbps PIR 640000kbps CBS - (active)
User inbound priority: -
User outbound priority: -
Flow Statistic:
IPv4 uplink packets/bytes: 7/546
IPv4 downlink packets/bytes: 0/0
IPv6 uplink packets/bytes: 0/0
IPv6 downlink packets/bytes: 0/0
3. Display the BAS interface IP addresses and next hop IP addresses for PPPoE users to verify that BAS interface IP addresses and next hop IP addresses are in the same FIB table. To display the FIB entries for VPN users, specify a VPN instance name in the display fib command.
<Sysname> display fib
Destination count: 34 FIB entry count: 34
Flag:
U:Usable G:Gateway H:Host B:Blackhole D:Dynamic S:Static
R:Relay F:FRR
Destination/Mask Nexthop Flag OutInterface/Token Label
0.0.0.0/32 127.0.0.1 UH InLoop0 Null
90.1.1.0/24 90.1.1.1 U GE3/1/1 Null
90.1.1.0/32 90.1.1.1 UBH GE3/1/1 Null
90.1.1.1/32 127.0.0.1 UH InLoop0 Null
90.1.1.255/32 90.1.1.1 UBH GE3/1/1 Null
127.0.0.0/8 127.0.0.1 U InLoop0 Null
127.0.0.0/32 127.0.0.1 UH InLoop0 Null
127.0.0.1/32 127.0.0.1 UH InLoop0 Null
127.255.255.255/32 127.0.0.1 UH InLoop0 Null
170.0.0.1/32 127.0.0.1 UH InLoop0 Null
170.0.0.3/32 170.0.0.3 UH BAS1 Null
192.167.21.0/24 192.167.21.33 U M-E0/0/0 Null
L2TP forwarding failures
Symptom
The following are the typical L2TP forwarding failure symptoms:
· The upstream traffic from clients to the LNS private network cannot be forwarded.
· The downstream traffic from the LNS private network to clients cannot be forwarded.
Solution
To resolve the issue:
1. Establish a connection between the client and the LNS private network. Display the traffic statistics for the PPPoE access interface and the L2TP tunnel interface on the LAC side, and the traffic statistics for the L2TP tunnel interface and private network destination interface on the LNS side. Determine whether packet loss occurs on the LAC side or on the LNS side.
<Sysname> display counters inbound interface GigabitEthernet 2/2/1
Interface Total (pkts) Broadcast (pkts) Multicast (pkts) Err (pkts)
GE2/2/1 0 0 0 0
Overflow: More than 14 digits (7 digits for column "Err").
--: Not supported.
<Sysname> display counters outbound interface GigabitEthernet 2/2/1
Interface Total (pkts) Broadcast (pkts) Multicast (pkts) Err (pkts)
GE2/2/1 9 4 5 0
2. If packet loss occurs on the LAC side, display the PPPoE session information and L2TP tunnel session information.
<Sysname> display pppoe-server session summary slot 3
Total PPPoE sessions on slot 3: 1
Local PPPoE sessions on slot 3: 1
Ethernet interface: GE3/1/1 Session ID: 1
PPP index: 0x140002380 State: OPEN
Remote MAC: 0010-9400-0001 Local MAC: 5866-baf1-c4f4
Service VLAN: N/A Customer VLAN: N/A
<Sysname> display l2tp tunnel
LocalTID RemoteTID State Sessions RemoteAddress RemotePort RemoteName
29827 232 Established 1 6.1.1.1 1701 rzyflns
<Sysname> display l2tp session
LocalSID RemoteSID LocalTID State Username
3912 11517 29827 Established user1@d1
3. If packet loss occurs on the LNS side, display the L2TP tunnel session information and information about IP addresses and VPN instances allocated to PPPoE users, and verify that BAS interface IP addresses and next hop IP addresses for PPPoE users are in the same FIB table. To display the FIB entries for VPN users, specify a VPN instance name in the display fib command.
<Sysname> display l2tp tunnel
LocalTID RemoteTID State Sessions RemoteAddress RemotePort RemoteName
232 29827 Established 1 6.1.1.2 1701 rzyflac
<Sysname> display l2tp session
LocalSID RemoteSID LocalTID State Username
11517 3912 232 Established user1@d1
<Sysname> display ppp access-user user-type lns
Interface MAC address IP address Username
S/C-VLAN IPv6 PDPrefix IPv6 address
BAS0 - 170.0.0.3 pppoe
-/- - 130::B520:4E93:2:A834
<Sysname> display ppp access-user ip-address 170.0.0.3 verbose
Basic:
Interface: BAS0
PPP index: 0xa770100480000105
User ID: 0x28000002
Username: pppoe
Domain: hrss
IP address: 170.0.0.3
Primary DNS server: 8.8.8.8
Secondary DNS server: 9.9.9.9
IPv6 address: 130::B520:4E93:2:A834
Primary IPv6 DNS server: 123::1
Secondary IPv6 DNS server: 123::2
IPv6 PD prefix: -
IPv6 ND prefix: -
User address type: N/A
VPN instance: 123
Access type: L2TP
Authentication type: CHAP
L2TP LNS:
Group ID: 2
Local tunnel ID: 35186
Remote tunnel ID: 30295
Local session ID: 46676
Remote session ID: 33720
Local IP: 10.1.1.54
Remote IP: 10.1.1.42
Local port: 1701
Remote port: 1701
Vrf index: 0
Calling station: -
AAA:
Authentication state: Authenticated
Authorization state: Authorized
Realtime accounting switch: Open
Realtime accounting interval: 60s
Login time: 2013-1-19 2:42:3:358
Accounting start time: 2013-1-19 2:42:3:382
Online time(hh:mm:ss): 00:07:34
Accounting state: Accounting
Acct start-fail action: Online
Acct update-fail action: Online
Acct quota-out action: Offline
Dual-stack accounting mode: Merge
Idle cut: 0 sec 0 bytes, direction: Both
Session timeout: 12000s
Time remained: 8000s
Traffic quota: 20971520 bytes
Traffic remained: 20970974 bytes
Redirect WebURL: http://6.6.6.6
ITA policy name: -
MRU: 1100 bytes
IPv4 MTU: 1000 bytes
IPv6 MTU: 1100 bytes
ACL&QoS:
User profile: profile123 (active)
Session group profile: -
User group acl: -
Inbound CAR: CIR 64000kbps PIR 640000kbps CBS - (active)
Outbound CAR: CIR 64000kbps PIR 640000kbps CBS - (active)
User inbound priority: -
User outbound priority: -
Flow Statistic:
IPv4 uplink packets/bytes: 7/546
IPv4 downlink packets/bytes: 0/0
IPv6 uplink packets/bytes: 0/0
IPv6 downlink packets/bytes: 0/0
<Sysname> display fib
Destination count: 33 FIB entry count: 33
Flag:
U:Usable G:Gateway H:Host B:Blackhole D:Dynamic S:Static
R:Relay F:FRR
Destination/Mask Nexthop Flag OutInterface/Token Label
0.0.0.0/32 127.0.0.1 UH InLoop0 Null
90.1.1.0/24 90.1.1.1 U GE3/1/1 Null
90.1.1.0/32 90.1.1.1 UBH GE3/1/1 Null
90.1.1.1/32 127.0.0.1 UH InLoop0 Null
90.1.1.255/32 90.1.1.1 UBH GE3/1/1 Null
127.0.0.0/8 127.0.0.1 U InLoop0 Null
127.0.0.0/32 127.0.0.1 UH InLoop0 Null
127.0.0.1/32 127.0.0.1 UH InLoop0 Null
127.255.255.255/32 127.0.0.1 UH InLoop0 Null
170.0.0.1/32 127.0.0.1 UH InLoop0 Null
170.0.0.3/32 170.0.0.3 UH BAS1 Null
192.167.21.0/24 192.167.21.33 U M-E0/0/0 Null
IPoE user failures to come online
Symptom
Typical IPoE user failures to come online include:
· An IPoE user cannot come online.
· When an IPoE user comes online, the system prompts that resources are insufficient.
Solution
To resolve this issue:
1. Verify that no abnormal statistics exist in the IPoE packet statistics.
<Sysname> display ip subscriber session statistics
Total sessions : 0
Bind:
Init : 0
Authenticating : 0
Authenticate fail : 0
Authenticate pass : 0
Assigned IP : 0
Online : 0
Backup : 0
Web pre-auth:
Init : 0
Authenticating : 0
Authenticate fail : 0
Authenticate pass : 0
Assigned IP : 0
Online : 0
Backup : 0
Web:
Init : 0
Authenticating : 0
Authenticate fail : 0
Authenticate pass : 0
Assigned IP : 0
Online : 0
Backup : 0
2. Check the IPoE-related resource statistics, the resource usage, and the number of available resources.
<Sysname> display qos-acl resource slot 2
Interfaces: XGE2/1/1 to XGE2/1/12 (slot 2)
---------------------------------------------------------------------
Type Total Reserved Configured Remaining Usage
---------------------------------------------------------------------
IPv4Acl 61440 0 21 61419 0%
IPv6Acl 16384 0 9 16375 0%
CAR&Cnt 131072 0 2 131070 0%
InBRAS Stat 65536 0 0 65536 0%
InL2TP Stat 65536 0 0 65536 0%
EgBRAS Stat 131072 0 0 131072 0%
EgL2TP Stat 131072 0 0 131072 0%
IngSubIf Stat 65536 0 0 65536 0%
EgSubIf Stat 65536 0 0 65536 0%
CAR Prof 510 0 0 510 0%
BRAS Prof 400 0 0 400 0%
Sampler 131072 0 0 131072 0%
INQPPB 16384 0 0 16384 0%
Interfaces: XGE2/1/13 to XGE2/1/24 (slot 2)
---------------------------------------------------------------------
Type Total Reserved Configured Remaining Usage
---------------------------------------------------------------------
IPv4Acl 61440 0 13 61427 0%
IPv6Acl 16384 0 9 16375 0%
CAR&Cnt 131072 0 1 131071 0%
InBRAS Stat 65536 0 0 65536 0%
InL2TP Stat 65536 0 0 65536 0%
EgBRAS Stat 131072 0 0 131072 0%
EgL2TP Stat 131072 0 0 131072 0%
IngSubIf Stat 65536 0 0 65536 0%
EgSubIf Stat 65536 0 0 65536 0%
CAR Prof 510 0 0 510 0%
BRAS Prof 400 0 0 400 0%
Sampler 131072 0 0 131072 0%
INQPPB 16384 0 0 16384 0%
IPoE forwarding failures
Symptom
Typically IPoE forwarding failures include:
· Traffic from the user side to the network side cannot be forwarded.
· Traffic from the network side to the user side cannot be forwarded.
Solution
To resolve the issue:
1. Verify that the basic IPoE user information contains statistics.
<Sysname> display ip subscriber session verbose
Basic:
Username : 1.1.1.2
Domain : ipoe
VPN instance : N/A
IP address : 1.1.1.2
User address type : N/A
MAC address : 0010-9400-0002
Service-VLAN/Customer-VLAN : 3/1
Access interface : XGE5/1/13.2
User ID : 0x3000639c
VPI/VCI(for ATM) : -/-
VSI Index : -
VSI link ID : -
VxLAN ID : -
DHCP lease : N/A
DHCP remain lease : N/A
Access time : Apr 30 18:29:19 2013
Online time(hh:mm:ss) : 00:04:06
Service node : Slot 5 CPU 0
Authentication type : Bind
Type : Unclassified-IP
State : Online
AAA:
ITA policyname : N/A
IP pool : N/A
Session idle cut : N/A
Session duration : N/A, remaining: N/A
Traffic quota : N/A
Acct start-fail action : Online
Acct update-fail action : Online
Acct quota-out action : Offline
Max multicast addresses : 4
Multicast address list : N/A
Accounting start time : Apr 30 18:29:19 2013
QoS:
User profile : N/A
Session group profile : N/A
User group acl : N/A
Inbound CAR : N/A
Outbound CAR : N/A
Inbound user priority : N/A
Outbound user priority : N/A
Flow statistic:
Uplink packets/bytes : 0/0
Downlink packets/bytes : 0/0
2. Verify that the IPoE ARP entries are correct.
<Sysname> display arp
Type: S-Static D-Dynamic O-Openflow R-Rule I-Invalid
IP address MAC address SVLAN/VSI Interface/Link ID Aging Type
192.168.0.4 6805-ca0c-3490 -- MGE0/0/0 1345 D
192.168.0.13 001b-21a8-080f -- MGE0/0/0 1362 D
192.168.0.14 1060-4b83-3d54 -- MGE0/0/0 1438 D
192.168.0.22 000a-eb75-69cb -- MGE0/0/0 1438 D
192.168.0.25 e839-3559-60cb -- MGE0/0/0 1440 D
192.168.0.28 a08c-fdd7-fbd3 -- MGE0/0/0 1410 D
192.168.0.34 dc4a-3e8e-e905 -- MGE0/0/0 1434 D
192.168.0.42 6805-ca06-54ac -- MGE0/0/0 1345 D
192.168.0.45 a036-9f5b-a1e1 -- MGE0/0/0 1356 D
192.168.0.48 6805-ca12-3296 -- MGE0/0/0 1440 D
192.168.0.50 705a-0f39-56a2 -- MGE0/0/0 1345 D
192.168.0.59 dc4a-3e7d-90cd -- MGE0/0/0 1440 D
192.168.0.61 600b-036f-3b7a -- MGE0/0/0 841 D
IPoE rate-limiting failures
Symptom
Typically IPoE rate-limiting failures include:
· The inbound or outbound CAR for IPoE users does not take effect.
· The IPoE ITA CAR does not take effect.
Solution
To resolve the issue:
1. Verify that the basic IPoE user information contains the CAR information.
<Sysname> display ip subscriber session verbose
Basic:
Username : H3C
Domain : private
VPN instance : N/A
IP address : 61.0.2.80
User address type : N/A
MAC address : 0010-947a-ce51
Service-VLAN/Customer-VLAN : 1/1592
Access interface : XGE5/1/13.1
User ID : 0x30000637
VPI/VCI(for ATM) : -/-
VSI Index : -
VSI link ID : -
VxLAN ID : -
DHCP lease : 86400 sec
DHCP remain lease : 85161 sec
Access time : May 9 19:34:43 2013
Online time(hh:mm:ss) : 00:20:38
Service node : Slot 5 CPU 0
Authentication type : Bind
Type : DHCP
State : Online
AAA:
ITA policyname : ita
IP pool : bas
Primary DNS server : N/A
Secondary DNS server : N/A
Session idle cut : N/A
Session duration : N/A, remaining: N/A
Traffic quota : N/A
Acct start-fail action : Online
Acct update-fail action : Online
Acct quota-out action : Offline
Max multicast addresses : 4
Multicast address list : N/A
Accounting start time : May 9 19:34:43 2013
QoS:
User profile : cbq (active)
Session group profile : car (active)
User group acl : N/A
Inbound CAR : N/A
Outbound CAR : N/A
Inbound user priority : N/A
Outbound user priority : N/A
Flow statistic:
Uplink packets/bytes : 0/0
Downlink packets/bytes : 0/0
ITA:
Acct merge : Disabled
Traffic separate : Disabled
Acct quota-out action : Offline
Denied level : N/A
Level-1 Inbound CAR : CIR 5000kbps PIR 5000kbps (active)
Outbound CAR : CIR 10000kbps PIR 10000kbps (active)
Uplink packets/bytes: 0/0
Downlink packets/bytes: 0/0
Session duration : N/A, remaining: N/A
Traffic quota : N/A
Level-3 Inbound CAR : CIR 1000kbps PIR 1000kbps (active)
Outbound CAR : CIR 2000kbps PIR 2000kbps (active)
Uplink packets/bytes: 0/0
Downlink packets/bytes: 0/0
Session duration : N/A, remaining: N/A
Traffic quota : N/A
NAT/NS failures
Symptom
NAT module: NAT packets cannot be forwarded correctly.
NetStream module: NS packet statistics cannot be collected.
Solution
To resolve the issue, perform the following tasks:
· Verifying that the NAT/NS packets can be delivered to the CPU
· Verifying that the packets are forwarded correctly
· Checking the service driver processing flow
Verifying that the NAT/NS packets can be delivered to the CPU
Check the number of packets delivered to the CPU to determine if the delivery path to the CPU is correct.
· If the number of input or output packet count is 0, no packets are delivered to the CPU. This might be caused by delivery error.
· If both the input or output packet count and the error count are not 0, the packets are failed to deliver to the CPU. Enable the debugging for further troubleshooting. For more information, see "Checking the service driver processing flow."
· If the input or output packet count is not 0 but no error exists, the packets are forwarded without NAT translation. This might be caused by configuration error.
For example:
[Sysname-probe] display hardware internal nat service slot 2
**********************************************************
- NAT SERVICE CALCULATION Slot 2
**********************************************************
input packet of each VCPU:
0 0 0 0
0 0 0 0
0 1 0 3723834
0 0 0 1730064
output packet of each VCPU:
0 0 0 0
0 0 0 0
0 0 0 3723833
0 0 0 1730064
Input packet count: total 5453899 error 1
Output packet count: total 5453897 error 0
**********************************************************
[Sysname-probe] display hardware internal netstream service slot 2
**********************************************************
- Netstream SERVICE CALCULATION Slot 2
**********************************************************
NS input packet of each VCPU:
0 0 0 0
0 0 0 0
0 0 0 0
0 0 0 0
input packet count: total 0 error 0
**********************************************************
Verifying that the packets are forwarded correctly
If the packets are not delivered to the CPU, or the packets are processed by the NAT or NS module and no error occurred to the CPU, verify that the packets are forwarded correctly:
· For the MPE-1104 and SPC cards, check if the SP interface, input interface and output interface sees packet forwarding and packet dropping.
· For the SPEX, CSPEX, and CEPC cards, check if the chip has packet dropping.
For example:
For the MPE-1104 and SPC cards, check if the packets are dropped by the SP interface. If the interface drops packets, the RDBG3.ge36 or RDBG6.ge36 field will be displayed and have a non-zero value.
[Sysname-probe] bcm 2 0 show/counter/ge36
RIPC4.ge36 : 5,837,338 +5,837,338 378/s
RUC.ge36 : 5,837,338 +5,837,338 378/s
ING_NIV_RX_FRAMES_VLAN_TAGGED.ge5,837,339: 5,837,339 +5,837,339 378/s
R255.ge36 : 5,837,341 +5,837,341 379/s
RPKT.ge36 : 5,837,341 +5,837,341 379/s
RUCA.ge36 : 5,837,341 +5,837,341 379/s
RPRM.ge36 : 5,837,341 +5,837,341 379/s
RVLN.ge36 : 5,837,341 +5,837,341 379/s
RPOK.ge36 : 5,837,341 +5,837,341 379/s
RBYT.ge36 : 1,263,402,252 +1,263,402,252 94,642/s
T511.ge36 : 1,824,924,761 +1,824,924,761 445/s
TPOK.ge36 : 1,824,924,761 +1,824,924,761 445/s
TPKT.ge36 : 1,824,924,761 +1,824,924,761 445/s
TUCA.ge36 : 1,824,924,761 +1,824,924,761 445/s
TVLN.ge36 : 1,824,924,761 +1,824,924,761 445/s
TBYT.ge36 : 478,747,107,094 +478,747,107,094 172,806/s
PERQ_PKT(2).ge36 : 1,824,914,112 +1,824,914,112 6,909/s
PERQ_BYTE(2).ge36 : 453,194,156,416 +453,194,156,416 2,590,192/s
PERQ_DROP_PKT(2).ge36: 3,691 +3,691
PERQ_DROP_BYTE(2).ge36: 841,548 +841,548
For the SPEX, CSPEX, and CEPC cards, check if the packet drop statistics exist.
[Sysname-probe] display hardware internal np pktcnt drop slot 10
Current Mcode Type: NP5_METRO
The NP 0 is Both NP
Drop packet statistics
3244 0 parsing engine all discarded pkts
3246 0 parsing engine all multicast pkts
3483 1530299 resolving engine all discarded pkts
3485 0 resolving engine all multicast pkts
3981 0 modifing engine all discarded pkts
3983 0 modifing engine all multicast pkts
600 1530291 total drop packets in TOPresolve
64A 36429 in egress multicast, BROADCAST table no match
65C 1493858 in bras, outbound ARP table no match
Checking the service driver processing flow
If the CPU has the number of errors, enable the debugging to check the service driver processing flow.
For example, enable debugging for the SPEX, CSPEX, and CEPC cards.
[H3C-probe] debugging hardware internal ic ddp dpfunc slot 10 cpu 0
For example, enable debugging for the MPE-1104 and SPC cards.
[H3C-probe] debugging hardware internal ic dpnat dpnatdebug slot 2 cpu 0
[H3C-probe] debugging hardware internal ic dpnat dpnat slot 2 cpu 0
[H3C-probe] debugging hardware internal dp 2
CGN failures
Symptom
Typical CGN failures include:
· CGN users cannot come online.
· CGN hardware session entries are not deployed or hardware sessions remain.
· CGN port blocks remain.
Solution
To resolve this issue, perform the following tasks:
2. Identifying whether the session entries or EIM entries are generated according to the service mode
3. Identifying whether hardware driver sessions are generated
4. Identifying whether the processing flow has errors or abnormal counters
5. Identifying whether port blocks remain
Identifying whether port blocks are allocated and users come online successfully (collaboration with IPoE or PPPoE)
1. Identify whether port blocks are allocated.
[Sysname]display nat port-block dynamic
Slot 1 in chassis 1:
Local VPN Local IP Global IP Port block Connections Extend
Total mappings found: 0
Slot 3 in chassis 1:
Local VPN Local IP Global IP Port block Connections Extend
Total mappings found: 0
Slot 5 in chassis 1:
Local VPN Local IP Global IP Port block Connections Extend
--- 100.0.0.2 3.3.3.39 20000-23999 1 ---
Total mappings found: 1
2. If port blocks are not allocated or fail to be allocated, identify whether IPoE or PPPoE users come online.
In this example, identify whether IPoE users come online. To identify whether PPPoE users come online, use the display pppoe-server session summary command.
[Sysname]display ip subscriber session
Type: D-DHCP S-Static U-Unclassified-IP N-NDRS
Interface IP address MAC address Type State
IPv6 address SVLAN/CVLAN VXLAN
Username
GE1/3/2/17 100.0.0.2 0010-9400-0002 U/- Online
- -/- -
100.0.0.2
3. Identify whether the port blocks are allocated by the driver software.
[Sysname-probe]display hardware internal intecgn table ipv4user slot 5
---------------------[ IPv4BrasUserTable ]---------------------
TableName : CGN BrasUser Mdc1
IPv4UserCapcity : 262144
IPv4UserCuritem : 1
IPv4UserHashDepth: 32767
Identifying whether the session entries or EIM entries are generated according to the service mode
1. Identify whether the system mode is triple (Endpoint-Independent Mapping mode).
[H3C]display current-configuration | in nat
nat mapping-behavior endpoint-independent tcp
--- The command output shows that the TCP sessions are in triple mode (Endpoint-Independent Mapping mode). For more information, see the related command reference.
2. If the system mode is quintuple (Address and Port-Dependent Mapping mode), execute the following command to display summary session statistics.
<Sysname> display session statistics summary
Chassis Slot Sessions TCP UDP Rate TCP rate UDP rate
1 1 0 0 0 0/s 0/s 0/s
1 3 0 0 0 0/s 0/s 0/s
1 5 1 0 1 0/s 0/s 0/s
3. If the system mode is triple (Endpoint-Independent Mapping mode), execute the following command to display NAT EIM entry statistics.
<Sysname>display nat eim statistics
EIM: Total EIM entries.
TCP: Total EIM entries for TCP.
UDP: Total EIM entries for UDP.
Rate: Creating rate of EIM entries.
TCP rate: Creating rate of EIM entries for TCP.
UDP rate: Creating rate of EIM entries for UDP.
Slot CPU EIM TCP UDP Rate TCP rate UDP rate
(entries/s) (entries/s) (entries/s)
0 0 0 0 0 0 0 0
3 0 0 0 0 0 0 0
6 0 0 0 0 0 0 0
Identifying whether hardware driver sessions are generated
[Sysname-probe]display hardware internal intecgn statis session slot 5
Session is resetting: FALSE
Eim is resetting: FALSE
------<Session state statistics>--------------------------------------
Init: 39999999
Waiting: 0
Creating: 0
Created: 1
Role changing: 0
Role changed: 0
Deleting: 0
Deleted: 0
------<Session type statistics>--------------------------------------
Nat444: 1
Aft: 0
DsLite: 0
FullCone: 0
Identifying whether the processing flow has errors or abnormal counters
[Sysname-probe]display hardware internal intecgn statis process summary slot 5
------<Session processing statistics>--------------------------------------
g_bDrvCgnCntProtected: Disable
g_auiDrvCGNAddEIMNum:
Total 0
g_auiDrvCGNAddEIMNotSupportNum:
Total 0
g_auiDrvCGNAddEIMNoResourceNum:
Total 0
g_auiDrvCGNAddEIMExistNum:
Total 0
g_auiDrvCGNAddEIMSuccessNum:
Total 0
g_auiDrvCGNRefreshEIMNum:
Total 0
g_auiDrvCGNRefreshEIMSuccessNum:
Total 0
g_auiDrvCGNDelEIMNum:
Total 0
g_auiDrvCGNDelEIMSuccessNum:
Total 0
g_auiDrvCGNInPktDTPerVCPU:
Total 2
g_auiDrvCGNInPktAckPerVCPU:
Total 4
g_auiDrvCGNInPktAgePerVCPU:
Total 0
g_auiDrvCGNInErrPktNum:
Total 0
g_auiDrvCGNOutPktPerVCPU:
Total 2
g_auiDrvCGNOutErrPktNum:
Total 0
g_auiDrvCGNOutV6PktPerVCPU:
Total 0
g_auiDrvCGNOutV6ErrPktNum:
Total 0
g_auiDrvCGNFDBIPChgNotSupportNum:
Total 0
g_auiDrvCGNFDBIP6ChgNotSupportNum:
Total 0
g_auiDrvCGNFDBDelDrvErrNum:
Total 0
g_auiDrvCGNFDBV6DelDrvErrNum:
Total 0
g_auiDrvCGNFDBDelNotSupportNum:
Total 0
g_auiDrvCGNFDBDelV6NotSupportNum:
Total 0
g_auiDrvCGNFDBIPChgErrNum:
Total 0
g_auiDrvCGNFDBIP6ChgErrNum:
Total 0
g_auiDrvCGNAddNATNum:
Total 2
g_auiDrvCGNDelNATNum:
Total 2
g_auiDrvCGNAddNAT64Num:
Total 0
g_auiDrvCGNDelNAT64Num:
Total 0
g_auiDrvCGNAddNAT46Num:
Total 0
g_auiDrvCGNDelNAT46Num:
Total 0
g_auiDrvCGNAddDsLiteNum:
Total 0
g_auiDrvCGNDelDsLiteNum:
Total 0
g_auiDrvCGNUpdateStateErr:
Total 0
g_auiDrvCGNFDBIPChgDrvcontextErr:
Total 0
g_auiDrvCGNFDBIP6ChgDrvcontextErr:
Total 0
g_auiDrvCGNFDBIPChgNoResouce:
Total 0
g_auiDrvCGNFDBIP6ChgNoResouce:
Total 0
g_auiDrvCGNFDBIPChgSuccessNum:
Total 2
g_auiDrvCGNFDBDelNumByPlat:
Total 0
g_auiDrvCGNFDBDelNumBySessionEvent:
Total 2
g_auiDrvCGNFDBIP6ChgSuccessNum:
Total 0
g_auiDrvCGNFDBIP6DelNumByPlat:
Total 0
g_auiDrvCGNFDBIP6DelNumBySessionEvent:
Total 0
Identifying whether port blocks remain
In the following command out, if the ASPB and ADPB fields are displayed as 0 and No HardWare Entry is displayed, no port blocks remain.
1. Identify whether port blocks remain in the platform software.
<Sysname>display nat statistics summary
EIM: Total EIM entries.
SPB: Total static port block entries.
DPB: Total dynamic port block entries.
ASPB: Active static port block entries.
ADPB: Active dynamic port block entries.
Chassis Slot Sessions EIM SPB DPB ASPB ADPB
1 1 0 0 0 2530 0 0
1 3 0 0 0 0 0 0
1 5 0 0 0 2530 0 0
2. Identify whether port blocks remain in the driver.
[Sysname-probe]display hardware internal intecgn ipv4user 1 all slot 5
=================================================
RefCnt : 0 LocalSrcAddr : 100.0.0.2
SwStatus : 1 GlobalSrcAddr : 3.3.3.39
GlobalPortStart : 24000 GlobalPortEnd : 27999
LocalVpn : 0 GlobalVpn : 0
FreePb : 0 FreePbAgain : 0
IfIndex : 330
No HardWare Entry.
L2MC forwarding failure
Symptom
Layer 2 multicast forwarding entries cannot be created or created Layer 2 multicast forwarding entries do not have downstream outgoing interfaces.
Solution
To resolve the issue:
1. Execute the display igmp-snooping group command to verify that Layer 2 multicast forwarding entries are created.
<Sysname> display igmp-snooping group
Total 1 entries.
VLAN 10: Total 1 entries.
(0.0.0.0, 226.1.1.1)
Host ports (1 in total):
GE3/0/1 (00:04:00)
2. Execute the display this command in VLAN view to verify that Layer 2 multicast is correctly configured for the VLAN.
[Sysname-vlan10] display this
#
vlan 10
igmp-snooping enable
igmp-snooping drop-unknown
#
3. Execute the display igmp-snooping group command to verify that the Layer 2 multicast forwarding entries have downstream outgoing interfaces.
<Sysname> display igmp-snooping group
Total 1 entries.
VLAN 10: Total 1 entries.
(0.0.0.0, 226.1.1.1)
Host ports (1 in total):
GE3/0/1 (00:04:00)
4. Execute the debugging igmp report command to verify that the outgoing interfaces have received IGMP report packets.
<Sysname> terminal monitor
<Sysname> terminal debugging
<Sysname> debugging igmp report
<Sysname>*Feb 19 14:01:59:422 2013 Sysname MCS/7/PACKET: -MDC=1-Slot=3; Receive IGMPv2 report packet from port GE3/0/1 on VLAN 10.
*Feb 19 14:01:59:436 2013 Sysname MCS/7/PACKET: -MDC=1; Receive IGMPv2 report packet from another slot, the packet receive from port
GE3/0/1 on VLAN 10.
*Feb 19 14:01:59:437 2013 Sysname MCS/7/PACKET: -MDC=1; Forward the IGMP packet locally.
*Feb 19 14:01:59:437 2013 Sysname MCS/7/PACKET: -MDC=1; Forward the IGMP membership packet which destination IP address is 226.1.1.1
and source IP address is 192.85.1.3 on VLAN 10.
*Feb 19 14:01:59:449 2013 Sysname MCS/7/PACKET: -MDC=1; Send the IGMP packet up to IP.
*Feb 19 14:01:59:453 2013 Sysname MCS/7/PACKET: -MDC=1-Slot=5; Forward the IGMP membership packet which destination IP address is 22
6.1.1.1 and source IP address is 192.85.1.3 on VLAN 10.
*Feb 19 14:01:59:457 2013 Sysname MCS/7/PACKET: -MDC=1-Slot=3; Forward the IGMP membership packet which destination IP address is 22
6.1.1.1 and source IP address is 192.85.1.3 on VLAN 10.
5. If the issue persists, contact H3C Support.
L3MC forwarding failure
Symptom
Layer 3 multicast forwarding entries cannot be created or created Layer 3 multicast forwarding entries do not have downstream outgoing interfaces.
Solution
Solution for Layer 3 multicast forwarding entry creation failure
To resolve the issue:
1. Execute the display multicast forwarding-table command to verify that Layer 3 multicast forwarding entries are created.
<Sysname> display multicast forwarding-table
Total 1 entries, 1 matched
00001. (11.1.1.2, 226.1.1.1)
Flags: 0x0
Uptime: 00:35:00, Timeout in: 00:03:21
Incoming interface: GigabitEthernet3/0/2
Matched 193 packets(5970 bytes), Wrong If 0 packets
Forwarded 140 packets(140 bytes)
2. Execute the display this command to verify that PIM is configured on the interface.
[Sysname-GigabitEthernet3/0/2] display this
#
interface GigabitEthernet3/0/2
port link-mode route
ip address 11.1.1.1 255.255.255.0
pim sm
#
3. Execute the display pim bsr-info command to verify that the BSR information on the device is correct.
<Sysname> display pim bsr-info
Scope: non-scoped
State: Elected
Bootstrap timer: 00:00:18
Elected BSR address: 11.1.1.1
Priority: 64
Hash mask length: 30
Uptime: 00:23:52
Candidate BSR address: 11.1.1.1
Priority: 64
Hash mask length: 30
4. Execute the display pim rp command to verify that the RP information on the device is correct.
<Sysname> display pim rp-info
BSR RP information:
Scope: non-scoped
Group/MaskLen: 224.0.0.0/4
RP address Priority HoldTime Uptime Expires
11.1.1.1 (local) 192 180 00:24:22 00:02:38
5. If the incoming interface of the created multicast entry is incorrect, execute the display multicast rpf-info command to verify that the RPF information about the multicast source is correct.
<Sysname> display multicast rpf-info 11.1.1.2
RPF information about source 11.1.1.2:
RPF interface: GigabitEthernet3/0/2
Referenced route/mask: 11.1.1.0/24
Referenced route type: unicast (direct)
Route selection rule: preference-preferred
Load splitting rule: disable
Source AS: 0
C-multicast route target: 0x0000000000000000
6. If the issue persists, contact H3C Support.
Solution for no outgoing interfaces contained in Layer 3 multicast forwarding entries
To resolve the issue:
1. Execute the display multicast forwarding-table command to verify that Layer 3 multicast forwarding entries have downstream outgoing interfaces.
<Sysname> display multicast forwarding-table
Total 1 entries, 1 matched
00001. (11.1.1.2, 226.1.1.1)
Flags: 0x0
Uptime: 00:36:10, Timeout in: 00:03:26
Incoming interface: GigabitEthernet3/0/2
List of 1 outgoing interfaces:
1: GigabitEthernet3/0/1
Matched 198 packets(5975 bytes), Wrong If 0 packets
Forwarded 145 packets(145 bytes)
2. Verify that IGMP or PIM-SM is enabled on the downstream outgoing interfaces.
¡ Execute the display this command on the interfaces directly connected to receiver hosts to verify that IGMP is enabled on the interfaces:
[Sysname-GigabitEthernet3/0/1] display this
#
interface GigabitEthernet3/0/1
port link-mode route
ip address 12.1.1.1 255.255.255.0
igmp enable
#
¡ Execute the display this command on the interfaces connected to downstream routers to verify that PIM-SM is enabled on the interfaces:
[Sysname-GigabitEthernet3/0/1] display this
#
interface GigabitEthernet3/0/1
port link-mode route
ip address 12.1.1.1 255.255.255.0
pim sm
#
3. Verify that the downstream outgoing interfaces have received IGMP report packets or PIM join packets.
¡ Execute the debugging igmp report command on the interfaces directly connected to receiver hosts to verify that the interfaces have received IGMP report packets.
<Sysname> terminal monitor
<Sysname> terminal debugging
<Sysname> debugging igmp report
<Sysname>*Feb 19 13:26:11:796 2013 Sysname IGMP/7/REPORT: -MDC=1; Received IGMPv2 report for group 226.1.1.1 on interface GigabitEthernet3/0/1(12.1.1.1) (G161021)
*Feb 19 13:26:11:797 2013 Sysname IGMP/7/REPORT: -MDC=1; Process IS_EX packet for INCLUDE group(226.1.1.1) on interface GigabitEthernet3/0/1(12.1.1.1) (G116517)
¡ Execute the debugging pim join-prune command on the interfaces connected to downstream routers to verify that the interfaces have received PIM join packets.
<Sysname> terminal monitor
<Sysname> terminal debugging
<Sysname> debugging pim join-prune
<Sysname>*Feb 19 13:35:55:780 2013 Sysname PIM/7/JP: -MDC=1; PIM ver 2 JP received 12.1.1.2 -> 224.0.0.13 on interface GigabitEthernet3/0/1 (SM141304)
*Feb 19 13:35:55:781 2013 Sysname PIM/7/JP: -MDC=1; Upstream: 12.1.1.1, Number of groups: 2, Holdtime: 210 (SM141306)
*Feb 19 13:35:55:781 2013 Sysname PIM/7/JP: -MDC=1; Group: 226.1.1.1 --- 1 joins 0 prunes (SM141312)
*Feb 19 13:35:55:782 2013 Sysname PIM/7/JP: -MDC=1; Join: 11.1.1.1 --- Flags: SWR (SM141316)
*Feb 19 13:35:55:783 2013 Sysname PIM/7/JP: -MDC=1; Group: 239.1.1.1 --- 1 joins 0 prunes (SM141312)
*Feb 19 13:35:55:784 2013 Sysname PIM/7/JP: -MDC=1; Join: 11.1.1.1 --- Flags: SWR (SM141316)
4. If the issue persists, contact H3C Support.
QACL service failure
QACL services in this section refer to services that filter packets matching predefined match criteria. These services include packet filtering, policy-based routing (PBR), QoS policies, DHCP snooping, and portal authentication.
Symptom
A QACL service failed to achieve desired results.
Solution
To resolve the issue:
1. Verify that the packets are not matched by a higher-priority QACL service.
The switch supports applying different types of QACL services to the same object. The following QACL service types are in descending order of priority:
¡ uRPF.
¡ Packet filtering configured globally.
¡ Packet filtering configured at the interface level.
¡ Packet filtering configured at the VLAN level.
¡ DHCP snooping.
¡ Portal-free rule.
¡ PBR configured at the interface level.
¡ PBR configured at the VLAN level.
¡ Globally applied QoS policy.
¡ QoS policy applied at the interface level.
¡ QoS policy applied at the VLAN level.
¡ Portal authentication.
When packets match different types of QACL services, the highest-priority QACL service takes effect.
If the packets match another higher-priority QACL service, modify that QACL service.
2. (For QoS policies only.) Verify that the QoS policy is correctly applied.
Configure the terminal debugging or terminal monitor command, remove the applied QoS policy, and reapply the QoS policy.
If the QoS policy contains unsupported or conflicting settings, the switch displays error messages indicating that the QoS policy is not correctly applied.
These error messages include the following types:
¡ Match criteria for a class with the AND operator conflict.
<Sysname> terminal debugging
<Sysname> terminal monitor
[Sysname] system-view
[Sysname] undo qos apply policy p1 global inbound
[Sysname] qos apply policy p1 global inbound
[Sysname] %Mar 19 15:44:53:648 2014 Sysname QOS/4/QOS_POLICY_APPLYGLOBAL_CBFAIL:-MDC=1-Slot=6; Failed to apply classifier-behavior c1 in policy p1 to the inbound direction globally. In a classifier with AND operator, you cannot configure multiple ACL match rules.
You can also use the display qos policy global command to display the applied QoS policy.
[Sysname] display qos policy global slot 3 inbound
Direction: Inbound
Policy: p1
Classifier: c1 (Failed)
Operator: AND
Rule(s) :
If-match acl 3000
If-match acl 3001
Behavior: b1
Filter enable: Deny
To resolve the conflict, redefine the class and specify the OR operator.
¡ A class does not support a match criterion.
<Sysname> terminal debugging
<Sysname> terminal monitor
[Sysname] system-view
[Sysname] undo qos apply policy p1 global inbound
[Sysname] qos apply policy p1 global inbound
[Sysname] %Aug 3 18:53:41:817 2024 Sysname QOS/4/QOS_POLICY_APPLYGLOBAL_CBFAIL: -MDC=1-Slot=3; Failed to apply classifier-behavior c1 in policy p1 to the inbound direction globally. Customer-VLAN match rule is not supported.
You can also use the display qos policy global command to display the applied QoS policy.
[Sysname] display qos policy global slot 3
Direction: Inbound
Policy: p1
Classifier: c1 (Failed)
Operator: AND
Rule(s) :
If-match customer-vlan-id 100
If-match acl 3000
Behavior: b1
Marking:
Remark service-vlan-id 201
To resolve the issue, delete the unsupported match criterion from the class.
¡ A behavior has conflicting actions.
<Sysname> terminal debugging
<Sysname> terminal monitor
[Sysname] system-view
[Sysname] interface gigabitethernet6/0/12
[Sysname-GigabitEthernet6/0/12] undo qos apply policy p1 inbound
[Sysname-GigabitEthernet6/0/12] qos apply policy p1 inbound
[Sysname-GigabitEthernet6/0/12] %Mar 19 16:58:41:624 2014 Sysname QOS/4/QOS_POLICY_APPLYIF_CBFAIL: -MDC=1-Slot=6; Failed to apply classifier-behavior c1 in policy p1 to the inbound direction of interface GigabitEthernet6/0/12.Filter deny conflicts with redirect to CPU.
You can also use the display qos policy interface command to display the applied QoS policy.
[Sysname] display qos policy interface inbound
Interface: GigabitEthernet6/0/12
Direction: Inbound
Policy: p1
Classifier: c1 (Failed)
Operator: AND
Rule(s) :
If-match acl 3000
Behavior: b1
Filter enable: Deny
Redirecting:
Redirect to the CPU
To resolve the conflict, delete one of the conflicting actions.
3. Verify that the time range, if configured, is correct.
[Sysname] display time-range t1
Current time is 09:59:37 8/14/2013 Wednesday
Time-range: t1 (Inactive)
09:25 to 09:30 working-day
If the time range is incorrect, modify the time range by using the time-range command.
4. View ACL and QoS resources usage.
[Sysname] display qos-acl resource slot 3
Interfaces: GE3/3/1 to GE3/3/8, Pos3/4/1 to Pos3/4/4
---------------------------------------------------------------------
Type Total Reserved Configured Remaining Usage
---------------------------------------------------------------------
IPv4Acl 65536 0 2 65534 0%
IPv6Acl 16384 0 0 16384 0%
Car&Cnt 32768 0 1 32767 0%
InBRASCar 65536 0 0 65536 0%
OutBRASCar 65536 0 0 65536 0%
TCPCar 16384 0 0 16384 0%
CarProf 220 0 2 218 0%
Sampler 32768 0 0 32768 0%
When the Remaining field is 0 or the Usage field is 100%, the resources are insufficient.
If the resources are insufficient, contact H3C Support.
5. If the issue persists, save the fault information and contact H3C Support.
Troubleshooting interfaces
Error packets on an interface
Symptom
The output from the display interface command shows that error packets exist on an interface.
<Sysname> display interface gigabitethernet3/1/1
GigabitEthernet3/1/1
Current state: UP
Line protocol state: UP
Description: GigabitEthernet3/1/1 Interface
Bandwidth: 1000000kbps
Maximum Transmit Unit: 1500
Internet protocol processing: disabled
IP Packet Frame Type:PKTFMT_ETHNT_2, Hardware Address: 0cda-41b1-d1c3
IPv6 Packet Frame Type:PKTFMT_ETHNT_2, Hardware Address: 0cda-41b1-d1c3
Media type is not sure,Port hardware type is No connector
Port priority: 0
Last clearing of counters: Never
Peak value of input: 70 bytes/sec, at 2013-03-19 13:04:15
Peak value of output: 210 bytes/sec, at 2013-03-19 13:04:15
Last 300 seconds input: 0 packets/sec 70 bytes/sec 0%
Last 300 seconds output: 0 packets/sec 210 bytes/sec 0%
Input (total): 693897 packets, 72834962 bytes
22196 unicasts, 584504 broadcasts, 87197 multicasts, - pauses
Input (normal): 693897 packets, 72834962 bytes
22196 unicasts, 584504 broadcasts, 87197 multicasts, 152536 pauses
Input: 0 input errors, 0 runts, 0 giants, 0 throttles
0 CRC, 0 frame, 0 overruns, - aborts
- ignored, - parity errors
Output (total): 7515164 packets, 14001669469 bytes
20811 unicasts, 6228300 broadcasts, 1266053 multicasts, - pauses
Output (normal): 7515164 packets, 14001669469 bytes
20811 unicasts, 6228300 broadcasts, 1266053 multicasts, 0 pauses
Output: 0 output errors, - underruns, - buffer failures
0 aborts, 0 deferred, 0 collisions, 0 late collisions
- lost carrier, - no carrier
Fields for incoming error packets
· input errors—Total number of incoming error packets.
· runts—Number of incoming frames that meet the following conditions:
¡ Shorter than 64 bytes.
¡ In correct format.
¡ Containing valid CRCs.
· giants—Number of incoming giants. Giants refer to frames larger than the maximum frame length supported on the interface.
· CRC—Total number of incoming frames that had a normal length but contained CRC errors.
· frame—Total number of incoming frames that contained CRC errors and a non-integer number of bytes.
· throttles—Number of incoming CRC error frames shorter than 64 bytes.
Fields for outgoing error packets
· output errors—Total number of outgoing packets with errors.
· aborts—Number of packets that failed to be transmitted.
· deferred—Total number of frames that were delayed from transmitting for a minimum of two transmission delay intervals because of busy medium.
· collisions—Number of frames that the interface stopped transmitting because of Ethernet collisions.
· late collisions—Total number of frames that were delayed from transmitting after their first 512 bits were transmitted because of detected collisions.
Solution
To resolve the issue, choose one of the following solutions depending on the symptom:
· Solution for increasing CRC, frame, and throttles errors in the inbound direction
· Solution for increasing overruns in the inbound direction
· Solution for increasing giants in the inbound direction
· Solution for increasing error packets in the outbound direction
Solution for increasing CRC, frame, and throttles errors in the inbound direction
1. Test the link performance. If the link is of poor quality or optical signals are attenuated greatly, replace the cable or optical fiber.
2. If the interface is installed with a transceiver module, identify whether the issue is caused by a transceiver module failure as described in "Transceiver module failure."
3. Swap the cable, optical fiber, or transceiver module with that of an interface that is operating correctly, and then swap it over.
¡ If the issue remains the same on the original interface but does not occur on the new interface, the original interface might be the failure cause. Use an interface that can operate correctly to provide services, and send the failure information to H3C Support for analysis.
¡ If the issue does not occur on the original interface but occurs on the new interface, verify that the peer device and the intermediate devices and links are operating correctly.
4. If the issue persists, contact H3C Support.
Solution for increasing overruns in the inbound direction
1. If the following conditions are met, execute the display interface command multiple times for the interface that has the overrun issue:
¡ The interface is the only interface that cannot receive or send packets correctly.
¡ Only devices attached to the interface cannot provide services.
¡ The other interfaces on the same card are operating correctly.
If input errors increase by the same number as overruns increase, the internal channels of the card might be congested. Contact H3C Support.
[Sysname] display interface ten-gigabitEthernet9/0/2
Ten-GigabitEthernet9/0/2
Current state: UP
Line protocol state: UP
Description: Ten-GigabitEthernet9/0/2 Interface
Bandwidth: 10000000kbps
Maximum Transmit Unit: 1500
Internet protocol processing: disabled
IP Packet Frame Type:PKTFMT_ETHNT_2, Hardware Address: 3822-d686-f104
IPv6 Packet Frame Type:PKTFMT_ETHNT_2, Hardware Address: 3822-d686-f104
Media type is optical fiber, Port hardware type is 10G_BASE_SR_SFP
Port priority: 2
Loopback is not set
10Gbps-speed mode, full-duplex mode
Last clearing of counters: Never
Ethernet port mode: LAN
Peak value of input: 841808630 bytes/sec, at 2014-05-27 15:52:42
Peak value of output: 554625950 bytes/sec, at 2014-05-28 03:38:38
Last 300 seconds input: 48680 packets/sec 21092930 bytes/sec 2%
Last 300 seconds output: 52080 packets/sec 33332610 bytes/sec 3%
Input (total): 97729359314 packets, 63655956072038 bytes
97726935204 unicasts, 2 broadcasts, 2424089 multicasts, - pauses
Input (normal): 97729359295 packets, 63655956063178 bytes
97726935204 unicasts, 2 broadcasts, 2424089 multicasts, 0 pauses
Input: 310725 input errors, 0 runts, 0 giants, 0 throttles
19 CRC, 0 frame, 310706 overruns, - aborts
- ignored, - parity errors
Output (total): 71345708434 packets, 44140292463570 bytes
71343294485 unicasts, 6 broadcasts, 2413943 multicasts, - pauses
Output (normal): 71345708434 packets, 44140292463570 bytes
71343294485 unicasts, 6 broadcasts, 2413943 multicasts, 0 pauses
Output: 0 output errors, - underruns, - buffer failures
0 aborts, 0 deferred, 0 collisions, 0 late collisions
- lost carrier, - no carrier
[Sysname] display interface ten-gigabitEthernet9/0/2
Ten-GigabitEthernet9/0/2
Current state: UP
Line protocol state: UP
Description: Ten-GigabitEthernet9/0/2 Interface
Bandwidth: 10000000kbps
Maximum Transmit Unit: 1500
Internet protocol processing: disabled
IP Packet Frame Type:PKTFMT_ETHNT_2, Hardware Address: 3822-d686-f104
IPv6 Packet Frame Type:PKTFMT_ETHNT_2, Hardware Address: 3822-d686-f104
Media type is optical fiber, Port hardware type is 10G_BASE_SR_SFP
Port priority: 2
Loopback is not set
10Gbps-speed mode, full-duplex mode
Last clearing of counters: Never
Ethernet port mode: LAN
Peak value of input: 841808630 bytes/sec, at 2014-05-27 15:52:42
Peak value of output: 554625950 bytes/sec, at 2014-05-28 03:38:38
Last 300 seconds input: 70770 packets/sec 33576640 bytes/sec 3%
Last 300 seconds output: 72470 packets/sec 55305930 bytes/sec 5%
Input (total): 98328093731 packets, 63907821689032 bytes
98325667167 unicasts, 2 broadcasts, 2426543 multicasts, - pauses
Input (normal): 98328093712 packets, 63907821680172 bytes
98325667167 unicasts, 2 broadcasts, 2426543 multicasts, 0 pauses
Input: 321168 input errors, 0 runts, 0 giants, 0 throttles
19 CRC, 0 frame, 321149 overruns, - aborts
- ignored, - parity errors
Output (total): 71970434250 packets, 44556530752723 bytes
71968017860 unicasts, 6 broadcasts, 2416384 multicasts, - pauses
Output (normal): 71970434250 packets, 44556530752723 bytes
71968017860 unicasts, 6 broadcasts, 2416384 multicasts, 0 pauses
Output: 0 output errors, - underruns, - buffer failures
0 aborts, 0 deferred, 0 collisions, 0 late collisions
- lost carrier, - no carrier
2. If the issue persists, contact H3C Support.
Solution for increasing giants in the inbound direction
1. Examine the following settings of the jumboframe enable command for the interfaces on two ends:
¡ Verify that the jumbo feature is enabled on both interfaces.
¡ Verify that the default settings for the command are the same.
¡ Verify that the current settings for the command are the same.
2. If the issue persists, contact H3C Support.
Solution for increasing error packets in the outbound direction
1. Verify that the interface is operating in full duplex mode.
2. If the issue persists, contact H3C Support.
Interface fails to come up
Symptom
An interface fails to come up.
Solution
To resolve the issue:
1. Verify that the cables or optical fibers connected to the interface and its peer interface are connected correctly and securely.
2. If the issue persists, swap the cables or optical fibers for cables or optical fibers that can correctly operate to verify that the intermediate link is operating correctly.
3. Use the display interface command to verify that the interfaces are in up state. If not, use the undo shutdown command to bring up the interfaces.
4. Examine the settings of the interfaces, including the autonegotiation mode of duplex mode and speed, and MDI. Verify that the interfaces are configured correctly.
[Sysname] display current-configuration interface Ten-gigabitethernet 6/0/1
#
interface Ten-GigabitEthernet6/0/1
port link-mode bridge
port link-type trunk
port trunk permit vlan 1 3102
port link-aggregation group 1
#
return
The following restrictions and guidelines apply:
¡ Copper ports on the interface subcards of the SPEX and CSPEX, CEPC cards and optical fiber ports do not support the duplex half command.
¡ An interface on the MIC interface subcard of the SPEX-1204 card can only operate at 1000 Mbps or negotiate a speed with its peer.
¡ If one port operates at 1000 Mbps, set the other port to negotiate the speed with the peer when the following conditions are met:
- One port is an optical fiber port on the PIC-GP10L subcard.
- The other port is an optical fiber port on the MIC interface subcard or GE SPC card (for example, SPC-GP48LB).
- The two ports are directly connected.
5. If the interfaces are installed with transceiver modules, verify that the transceiver modules are the same type (including the speed, wavelength, single-mode, and multiple-mode).
6. If the issue persists, swap the suspected transceiver module for a transceiver module that can operate correctly. Identify whether the issue is caused by a transceiver module failure as described in "Transceiver module failure."
[Sysname] display transceiver interface Ten-gigabitethernet 2/9/0/1
Ten-GigabitEthernet2/9/0/1 transceiver information:
Transceiver Type : 10G_BASE_SR_SFP
Connector Type : LC
Wavelength(nm) : 850
Transfer Distance(km) : 80(50um),20(62.5um),300(om3)
Digital Diagnostic Monitoring : YES
Vendor Name : H3C
Ordering Name : SFP-XG-SX-MM850-A
7. If the interface is a WAN interface, identify whether the speed of the WAN interface matches the speed of the transceiver module. If not, use another WAN interface.
8. If a transceiver module failed, replace the transceiver module and contact H3C Support.
An interface goes down
Symptom
An interface goes down.
Solution
To resolve the issue:
1. Read the log messages for the local and peer devices. Identify whether the interfaces were manually shut down.
2. Display interface status information. Identify whether an interface has protocol issues or was shut down by the diagnostic module because of errors. If yes, contact H3C Support.
For example, if you execute the hardware-failure-detection command with the isolate keyword and then an error is detected on an interface, the device shuts down the interface. The status of the interface becomes Protect DOWN. The traffic on the interface will be switched to the backup link.
[Sysname] display interface gigabitethernet2/6/0/1
GigabitEthernet2/6/0/1
current state: Protect DOWN
Line protocol current state: DOWN
IP Packet Frame Type: PKTFMT_ETHNT_2, Hardware Address: 0000-e80d-c000
Description: GigabitEthernet2/6/0/1 Interface
Loopback is not set
Media type is optical fiber, Port hardware type is 1000_BASE_SX_SFP
Unknown-speed mode, unknown-duplex mode
Link speed type is autonegotiation, link duplex type is autonegotiation
Flow-control is not enabled
The Maximum Frame Length is 9216
……
3. As described in Interface fails to come up, verify that the interfaces are correctly configured, the cable, transceiver module, and optical fiber are operating correctly.
4. If the issue persists, contact H3C Support.
Interface state flapping
Symptom
An interface flaps between the up and down states.
Solution
To resolve the issue:
1. If the interface is a fiber port, verify that the transceiver modules at the two ends are operating correctly as described in "Transceiver module failure."
2. If the interface is a copper port, set the speed and duplex mode. The state flapping issue typically occurs in autonegotiation mode. Disable the autonegotiation mode, and configure the same speed and duplex mode for both of the interfaces on two ends.
3. If the interface is a WAN interface, verify that the clock mode is set as follows:
¡ Set to master on the interface that has a clock daughter card installed on the MPU.
¡ Set to slave on the interface on the other end.
4. If the issue persists, check the link, peer device, and intermediate devices are operating correctly.
5. If the issue still persists, contact H3C Support.
Transceiver module failure
Symptom
A fiber port installed with a transceiver module cannot operate correctly.
Solution
To resolve the issue:
1. Execute the display transceiver alarm interface command to examine the alarms present on the transceiver module.
¡ If input errors occurred, verify that the peer port, fiber, and intermediate device are operating correctly.
¡ If output errors, current errors, or voltage errors occurred, verify that the local port is operating correctly.
<Sysname> display transceiver alarm interface GigabitEthernet 2/0/1
GigabitEthernet2/0/1 transceiver current alarm information:
TX fault
RX power high
Table 2 Transceiver module alarms
|
Field |
Description |
|
SFP/SFP+/CFP/QSFP+ |
|
|
RX loss of signal |
Incoming (Rx) signal is lost. |
|
RX power high |
Incoming (Rx) power is high. |
|
RX power low |
Incoming (Rx) power is low. |
|
TX fault |
Transmit fault. |
|
TX bias high |
Tx bias current is high. |
|
TX bias low |
Tx bias current is low. |
|
TX power high |
Tx power is high. |
|
TX power low |
Tx power is low. |
|
Temp high |
Temperature is high. |
|
Temp low |
Temperature is low. |
|
Voltage high |
Voltage is high. |
|
Voltage low |
Voltage is low. |
|
Transceiver info I/O error |
Transceiver information read and write error. |
|
Transceiver info checksum error |
Transceiver information checksum error. |
|
Transceiver type and port configuration mismatch |
The transceiver type does not the match port configuration. |
|
Transceiver type not supported by port hardware |
The port does not support the transceiver type. |
|
XFP |
|
|
RX loss of signal |
Incoming (Rx) signal is lost. |
|
RX not ready |
The receiver is not ready. |
|
RX CDR loss of lock |
Rx clock cannot be recovered. |
|
RX power high |
Rx power is high. |
|
RX power low |
Rx power is low. |
|
TX not ready |
Tx is not ready. |
|
TX fault |
Tx fault. |
|
TX CDR loss of lock |
Tx clock cannot be recovered. |
|
TX bias high |
Tx bias current is high. |
|
TX bias low |
Tx bias current is low. |
|
TX power high |
Tx power is high. |
|
TX power low |
Tx power is low. |
|
Module not ready |
Module is not ready. |
|
APD supply fault |
APD supply fault. |
|
TEC fault |
TEC fault. |
|
Wavelength unlocked |
Wavelength of optical signal exceeds the manufacturer's tolerance. |
|
Temp high |
Temperature is high. |
|
Temp low |
Temperature is low. |
|
Voltage high |
Voltage is high. |
|
Voltage low |
Voltage is low. |
|
Transceiver info I/O error |
Transceiver information read and write error. |
|
Transceiver info checksum error |
Transceiver information checksum error. |
|
Transceiver type and port configuration mismatch |
The transceiver type does not match the port configuration. |
|
Transceiver type not supported by port hardware |
The transceiver type is not supported on the port. |
2. Verify that the incoming power and outgoing power of the transceiver module are within the correct range.
a. Display the electronic label information for the transceiver module. The Vendor Name field displays H3C for an H3C transceiver module. As a best practice, use only H3C transceiver modules. The following commands for transceiver modules apply to H3C transceiver modules and might not be able to display information about non-H3C transceiver modules.
<Sysname> display transceiver manuinfo interface Ten-gigabitethernet 1/2/0/15
Ten-GigabitEthernet1/2/0/15 transceiver manufacture information:
Manu. Serial Number : 213410A0000054000251
Manufacturing Date : 2012-10-26
Vendor Name : H3C
b. Identify whether the transceiver module supports the diagnostics feature. If the Digital Diagnostic Monitoring field displays YES, the feature is supported.
<Sysname> display transceiver interface
Ten-GigabitEthernet1/2/0/15 transceiver information:
Transceiver Type : 10G_BASE_LR_XFP
Connector Type : LC
Wavelength(nm) : 1310
Transfer Distance(km) : 10(SMF)
Digital Diagnostic Monitoring : YES
Vendor Name : H3C.
c. Display the incoming power and outgoing power of the transceiver module.
<Sysname> display transceiver diagnosis interface
Ten-GigabitEthernet1/2/0/15 transceiver diagnostic information:
Current diagnostic parameters:
Temp.(°C) Voltage(V) Bias(mA) RX power(dBM) TX power(dBM)
41 3.26 42.43 -40.00 -2.20
d. From the output of display transceiver interface and display transceiver diagnosis interface, identify the value ranges for the incoming power and outgoing power of the transceiver module.
If the value ranges displayed by the two commands are inconsistent, the smaller range takes effect.
You can also use the display transceiver diagnosis interface command to display the current temperature, voltage, bias current, and the value ranges for these parameters.
<Sysname> display transceiver interface Ten-GigabitEthernet 1/2/0/15
Ten-GigabitEthernet1/2/0/15 transceiver information:
Transceiver Type : 10G_BASE_SR_SFP
Connector Type : LC
Wavelength(nm) : 850
Transfer Distance(km) : 80(50um),20(62.5um),300(om3)
Digital Diagnostic Monitoring : YES
Vendor Name : H3C
Ordering Name : SFP-XG-SX-MM850-A
<Sysname> display transceiver diagnosis interface Ten-GigabitEthernet 1/2/0/15
Ten-GigabitEthernet1/2/0/15 transceiver diagnostic information:
Current diagnostic parameters:
Temp.(°C) Voltage(V) Bias(mA) RX power(dBM) TX power(dBM
43 3.35 46.33 -3.60 -2.38
Alarm thresholds:
Temp.(°C) Voltage(V) Bias(mA) RX power(dBM) TX power(dBM
High 73 3.80 92.40 2.50 3.50
Low -3 2.81 1.00 -16.40 -11.20
Parameters when first used on N/A:
Temp.(°C) Voltage(V) Bias(mA) RX power(dBm) TX power(dBm)
N/A N/A N/A N/A N/A
Total account of alarms: 0
Latest occurrence of different alarms:
Type Date Description
Temp. N/A N/A
Voltage N/A N/A
Bias N/A N/A
RX power N/A N/A
TX power N/A N/A
TX N/A N/A
RX N/A N/A
Others N/A N/A
Latest three alarms:
Date Description
N/A N/A
N/A N/A
N/A N/A
3. Swap the suspected transceiver module and a transceiver module that can correctly operate, and swap the interfaces.
4. If you cannot locate the failure source and the issue persists, contact H3C Support.
Invisible interface
Symptom
An interface is not displayed in the output from the display device command.
Solution
To resolve the issue:
1. Display device information. Identify the status of the card or subcard where the interface resides. The card or subcard might be still in startup process. The card or subcard is operating correctly if it is in NORMAL state.
For the SR8800-X router:
<Sysname> display device
Slot No. Brd Type Brd Status Software Version
0 SR05SRP1L3 Master SR8800-CMW710-R7951P01
1 SR05SRP1L3 Standby NONE
2 SPC-XP8LB Normal SR8800-CMW710-R7951P01
3 MPE-1104 Normal SR8800-CMW710-R7951P01
Sub1 MIC-SP4L Normal
Sub2 MIC-SP4L Normal
Sub3 MIC-CLP2L Normal
Sub4 MIC-GP4L Normal
4 SPC-XP8LB Normal SR8800-CMW710-R7951P01
5 NONE Absent NONE
6 SFC-04D Normal SR8800-CMW710-R7951P01
7 NONE Absent NONE
8 NONE Absent NONE
9 NONE Absent NONE
For the R8800-X-S router:
<Sysname> display device
Slot No. Brd Type Brd Status Software Version
0 SR07SRPUA1 Standby SR8800FS-CMW710-R7951P01
1 SR07SRPUA1 Master SR8800FS-CMW710-R7951P01
2 SPC-XP8LB Normal SR8800FS-CMW710-R7951P01
3 NONE Absent NONE
4 NONE Absent NONE
5 NONE Absent NONE
6 NONE Absent NONE
7 MPE-1104 Normal SR8800FS-CMW710-R7951P01
Sub1 MIC-GP8L Normal
Sub2 MIC-SP4L Normal
Sub3 NONE Absent
Sub4 MIC-GP4L Normal
2. If the card or subcard has started up, display brief information about all interfaces. Identify whether the interface is displayed.
<Sysname> display interface brief
Brief information on interface(s) under route mode:
Link: ADM - administratively down; Stby - standby
Protocol: (s) - spoofing
Interface Link Protocol Main IP Description
GE5/1/1 DOWN DOWN --
GE5/1/1.1 DOWN DOWN 110.0.1.1
GE5/1/1.2 DOWN DOWN 110.0.2.1
GE5/1/1.3 DOWN DOWN 110.0.3.1
GE5/1/1.4 DOWN DOWN 110.0.4.1
GE5/1/1.5 DOWN DOWN 110.0.5.1
GE5/1/1.6 DOWN DOWN 110.0.6.1
GE5/1/1.7 DOWN DOWN 110.0.7.1
GE5/1/1.8 DOWN DOWN 110.0.8.1
GE5/1/1.9 DOWN DOWN 110.0.9.1
GE5/1/1.10 DOWN DOWN 110.0.10.1
GE5/1/1.11 DOWN DOWN 110.0.11.1
GE5/1/1.12 DOWN DOWN 110.0.12.1
GE5/1/1.13 DOWN DOWN 110.0.13.1
3. If the interface is still not displayed, the interface might have not stated up. Wait for a while.
4. If the issue persists after a long time, contact H3C Support.
WAN interface protocol fails to come up
Symptom
The physical state of a WAN interface can come up, but the data link layer state cannot come up.
Solution
To resolve the issue:
1. Identify whether the WAN interfaces at the two ends are configured with the same data link layer protocol. If not, configure the same data link layer protocol for the interfaces.
2. Execute the display interface command to identify whether error packets are detected on the WAN interfaces and whether the settings on the two interfaces are the same.
¡ If error packets occur, verify that the transceiver module and the interface are compatible, and the optical fiber and transceiver modules are operating correctly.
¡ If the settings on the two interfaces are different, modify the settings.
3. If the issue persists, contact H3C Support.
WAN interface alarm
Symptom
A WAN interface alarm is generated.
Alarm examples:
H3C WAN/4/ALARM: -MDC=1-Slot=5;
Cpos5/1/1 : Path 1 Alarm AIS report! Start Time : 2014-04-04 11:40:53:533!
H3C WAN/4/ALARM: -MDC=1-Slot=5;
Cpos5/1/1 : Path 1 Alarm AIS recover! Start Time : 2014-04-04 11:41:09:769!
Solution
To resolve the issue:
1. Verify that the transceiver module and the interface are compatible, the transceiver modules are operating correctly, and the settings on the interfaces at the two ends are the same.
a. For information about transceiver module troubleshooting, see Transceiver module failure.
b. See the message manual and take the recommended actions.
2. Verify that the optical fiber is in normal state.
Verify that the optical fiber and the transceiver module are compatible. If not, replace the optical fiber. For more information about optical fibers, see the installation guide.
3. If the issue persists, collect device diagnostic information and contact H3C Support.
<H3C> display diagnostic-information
Save or display diagnostic information (Y=save, N=display)? [Y/N]:Y
Related commands
This section lists the commands that you might use for troubleshooting interfaces.
|
Command |
Description |
|
display current-configuration |
Displays the running configuration. You can display the running configuration for a specific interface. |
|
display interface |
Displays interface information, including the interface status and the incoming and outgoing traffic statistics. |
|
Displays transceiver alarms. |
|
|
display transceiver diagnosis |
Displays the current values of the digital diagnosis parameters on transceiver modules, including the temperature, voltage, bias current, incoming power, and outgoing power. |
|
display transceiver interface |
Displays the key parameters of transceiver modules. |
|
display transceiver manuinfo |
Displays electronic label information for transceiver modules to identify the vendors of the transceiver modules. |
Troubleshooting hardware forwarding
Packet loss
Symptom
Severe packet loss was detected on a card or all packets forwarded by a card were lost.
Solution
While the device is operating correctly, the internal forwarding channels between cards do not drop packets. If severe packet loss is detected on a card or all packets forwarded by a card are lost, some internal forwarding channels might not be operating correctly. By default, the internal-forwarding channel inspection feature is enabled and the feature regularly inspects the channels.
To resolve the issue, perform the following tasks:
1. Identifying the faulty internal forwarding channels
2. Continuing with the troubleshooting depending on the specific situation
Identifying the faulty internal forwarding channels
· For a CEPC, MPE-1104, or SPC card, display internal forwarding channel information for all chips. If a channel on a chip is down, the Link field displays down. If the packet loss issue was detected at or after the time displayed by the Clock field, the channel is faulty. For example:
[Sysname-probe] display hardware internal hgmonitor info 4 0
Link status change notice event:
Unit Port Link Clock Number
0 hg0 up 08:08:03:755732 11/12/2014 1
0 hg0 down 09:22:23:977918 11/12/2014 2
0 hg1 up 08:12:19:398227 11/12/2014 1
0 hg2 up 08:08:05:465720 11/12/2014 1
0 hg3 up 08:12:21:391922 11/12/2014 1
· For a SPEX-1204 card, display its forwarding channel information. If the HG section displays that one or more HG ports are in DOWN state, the corresponding internal forwarding channels are faulty. For example:
[Sysname-probe] display hardware internal forward fpga counter slot 3
……
5 HG
--------------------------------------------------------------------------------
-------------------------
Value(HEX) Value(DEC) | Address | Description
--------------------------------------------------------------------------------
-------------------------
0x0 0 | 0x005D0003 | SEND: HG_0 (DOWN)
OUT
0x0 0 | 0x00610003 | SEND: HG_1 (UP)
OUT
0x0 0 | 0x00650003 | SEND: HG_2 (DOWN)
OUT
0x0 0 | 0x00690003 | SEND: HG_3 (UP)
OUT
--------------------------------------------------------------------------------
-------------------------
0x0 0 | 0x005D0005 | RECV: HG_0 (DOWN)
IN
0x0 0 | 0x00610005 | RECV: HG_1 (UP)
IN
0x0 0 | 0x00650005 | RECV: HG_2 (DOWN)
IN
0xA27 2599 | 0x00690005 | RECV: HG_3 (UP)
IN
--------------------------------------------------------------------------------
-------------------------
……
· For a CSPEX or CEPC card, display forwarding channel information on all chips. If the HG section displays that one or more HG ports are in DOWN state, the corresponding internal forwarding channels have issues. For example:
[Sysname-probe] display hardware internal np serdes fabric status slot 18 chip 0
SERDES STATUS NP_PORT IF_NUM PEER_SLOT IF_TYPE
20 UP 106 10 23 40GE(UP)
21 UP 106 10 23 40GE(UP)
22 UP 106 10 23 40GE(UP)
23 UP 106 10 23 40GE(UP)
8 DOWN 104 8 23 40GE(DOWN)
9 DOWN 104 8 23 40GE(DOWN)
10 DOWN 104 8 23 40GE(DOWN)
11 DOWN 104 8 23 40GE(DOWN)
Hg port tuning Record:
Port Event Clock
10 Tuning_start 09:41:03:039327
10 Tuning_end(S) 09:41:04:118066
10 Switch_Route 09:41:24:705325
8 Tuning_start 09:41:04:118068
8 Tuning_end(S) 09:41:05:195958
8 Switch_Route 09:41:24:705327
Continuing with the troubleshooting depending on the specific situation
· For SR8800-X-S routers, contact H3C Support.
· For an SR8804-X router that uses the SFC-04-1, SFC-04-2, SFC-04-3, or SFC-04-4 switching fabric modules, contact H3C Support.
· If the inbound and outbound ports of the traffic reside on the same SPC or MPE-1104 card, contact H3C Support.
· If the inbound and outbound ports of the traffic reside on different cards or on the same SPEX, CSPEX, or CEPCcard, perform the following tasks:
a. Identify whether there are faulty switching modules.
b. If a switching module is faulty, replace the switching module.
c. If all switching modules are not faulty, replace the LPU.
d. If the issue persists, contact H3C Support.
The switching fabric modules operate in load-balancing mode to forward traffic. To identify faulty modules, use the switch-fabric isolate command to isolate switching fabric modules one by one. Make sure the router always has one or more switching fabric modules. Do not leave only one switching fabric module in the second switching fabric module slot.
For example, on an SR8808-X router that has switching fabric modules in slots 10 through 13, follow these steps to isolate switching fabric modules:
a. Isolate the switching fabric module in slot 10. After about 1 minute, observe whether the symptom disappears.
b. If the symptom does not disappear, use the undo switch-fabric isolate command to remove the isolation.
c. After the module in slot 10 starts up and enters normal state, wait a minimum of 3 minutes and then isolate the module in slot 11.
d. Observe whether the symptom disappears. If the symptom does not disappear, remove the isolation and use the previously described method to isolate the modules in slots 12 and 13 one by one.
If the symptom disappears after a switching fabric module is isolated, the module is faulty.
