- Released At: 20-04-2021
- Page Views:
- Downloads:
- Table of Contents
- Related Documents
-
|
|
|
H3C S6820 Switch Series |
|
Troubleshooting Guide |
|
|
|
|
Copyright © 2021 New H3C Technologies Co., Ltd. All rights reserved.
No part of this manual may be reproduced or transmitted in any form or by any means without prior written consent of New H3C Technologies Co., Ltd.
Except for the trademarks of New H3C Technologies Co., Ltd., any trademarks that may be mentioned in this document are the property of their respective owners.
The information in this document is subject to change without notice.
Contents
Collecting log and operating information
Collecting common log messages
Collecting diagnostic log messages
Collecting operating statistics
Operating power module failure
Newly installed power module failure
ACL application failure with an error message
ACL application failure without an error message
Troubleshooting Ethernet link aggregation
A 1-GE SFP, 10-GE SFP+, 40-GE QSFP+, or 100-GE QSFP28 fiber port fails to come up
A 25-GE SFP28 fiber port fails to come up
A 10/100/1000Base-T GE copper port or 1/10GBase-T 10-GE copper port fails to come up
Non-H3C transceiver module error message
Transceiver module does not support digital diagnosis
Error frames (for example, CRC errors) on a port
EBGP or IBGP neighbor relationship setup failure
Troubleshooting system management
Introduction
This document provides information about troubleshooting common software and hardware issues with the S6820 switch series.
This document is not restricted to specific software or hardware versions.
General guidelines
|
|
IMPORTANT: To prevent an issue from causing loss of configuration, save the configuration each time you finish configuring a feature. For configuration recovery, regularly back up the configuration to a remote server. |
When you troubleshoot the switch, follow these general guidelines:
· To help identify the cause of the issue, collect system and configuration information, including:
¡ Symptom, time of failure, and configuration.
¡ Network topology information, including the network diagram, port connections, and points of failure.
¡ Log messages and diagnostic information. For more information about collecting this information, see "Collecting log and operating information."
¡ Physical evidence of failure:
- Photos of the hardware.
- Status of the LEDs.
¡ Steps you have taken, such as reconfiguration, cable swapping, and reboot.
¡ Output from the commands executed during the troubleshooting process.
· To ensure safety, wear an ESD wrist strap when you replace or maintain a hardware component.
· If hardware replacement is required, use the release notes to verify the hardware and software compatibility.
Collecting log and operating information
|
|
IMPORTANT: By default, the information center is enabled. If the feature is disabled, you must use the info-center enable command to enable the feature for collecting log messages. |
Table 1 shows the types of files that the system uses to store operating log and status information. You can export these files by using FTP, TFTP, or USB.
In an IRF system, these files are stored on the master device. Multiple devices will have log files if master/subordinate switchovers have occurred. You must collect log files from all these devices. To more easily locate log information, use a consistent rule to categorize and name files. For example, save log files to a separate folder for each member device, and include their slot numbers in the folder names.
Table 1 Log and operating information
|
Category |
File name format |
Content |
|
Common log |
logfile.log |
Command execution and operational log messages. |
|
Diagnostic log |
diagfile.log |
Diagnostic log messages about device operation, including the following items: · Parameter settings in effect when an error occurs. · Information about a card startup error. · Handshaking information between member devices when a communication error occurs. |
|
Operating statistics |
file-basename.gz |
Current operating statistics for feature modules, including the following items: · Device status. · CPU status. · Memory status. · Configuration status. · Software entries. · Hardware entries. |
Collecting common log messages
1. Save common log messages from the log buffer to a log file.
By default, the log file is saved in the logfile directory of the Flash memory on each member device.
<Sysname> logfile save
The contents in the log file buffer have been saved to the file flash:/logfile/logfile.log
2. Identify the log file on each member device:
# Display the log file on the master device.
<Sysname> dir flash:/logfile/
Directory of flash:/logfile
0 -rw- 21863 Jul 11 2013 16:00:37 logfile.log
1048576 KB total (38812 KB free)
# Display the log file on each subordinate device:
<Sysname> dir slot2#flash:/logfile/
Directory of slot2#flash:/logfile
0 -rw- 21863 Jul 11 2013 16:00:37 logfile.log
1048576 KB total (38812 KB free)
3. Transfer the files to the desired destination by using FTP, TFTP, or USB. (Details not shown.)
Collecting diagnostic log messages
1. Save diagnostic log messages from the diagnostic log file buffer to a diagnostic log file.
By default, the diagnostic log file is saved in the diagfile directory of the Flash memory on each member device.
<Sysname> diagnostic-logfile save
The contents in the diagnostic log file buffer have been saved to the file flash:/diagfile/diagfile.log
2. Identify the diagnostic log file on each member device:
# Display the diagnostic log file on the master device.
<Sysname> dir flash:/diagfile/
Directory of flash:/diagfile
0 -rw- 161321 Jul 11 2013 16:16:00 diagfile.log
1048576 KB total (38812 KB free)
# Display the diagnostic log file on each subordinate device:
<Sysname> dir slot2#flash:/diagfile/
Directory of slot2#flash:/diagfile
0 -rw- 161321 Jul 11 2013 16:16:00 diagfile.log
1048576 KB total (38812 KB free)
3. Transfer the files to the desired destination by using FTP, TFTP, or USB. (Details not shown.)
Collecting operating statistics
You can collect operating statistics by saving the statistics to a file or displaying the statistics on the screen.
When you collect operating statistics, follow these guidelines:
· Log in to the device through a network or management port instead of the console port, if possible. Network and management ports are faster than the console port.
· Do not execute commands while operating statistics are being collected.
· As a best practice, save operating statistics to a file to retain the information.
|
|
NOTE: The amount of time to collect statistics increases along with the number of IRF member devices. |
To collect operating statistics:
1. Collect operating statistics for multiple feature modules.
<Sysname> display diagnostic-information
Save or display diagnostic information (Y=save, N=display)? [Y/N] :
2. At the prompt, choose to save or display operating statistics:
# To save operating statistics, enter y at the prompt and then specify the destination file path.
Save or display diagnostic information (Y=save, N=display)? [Y/N] :y
Please input the file name(*.tar.gz)[flash:/diag_Sysname_20160101-000704.tar.gz] :
Diagnostic information is outputting to flash:/diag_Sysname_20160101-000704.tar.gz.
Please wait...
Save successfully.
<Sysname> dir flash:/
Directory of flash:
…
6 -rw- 898180 Jun 26 2013 09:23:51 diag.tar.gz
1048576 KB total (38812 KB free)
# To display operating statistics on the monitor terminal, enter n at the prompt. (The output from this command varies by software version.)
Save or display diagnostic information (Y=save, N=display)? [Y/N] :N
===============================================
===============display clock===============
23:49:53 UTC Tue 01/01/2016
=================================================
……
3. View diagnostic information:
a. Extract the file that contains diagnostic information.
<Sysname> tar extract archive-file diag_Sysname_20160101-000704.tar.gz
Extracting archive flash:/diag_Sysname_20160101-000704.tar.gz Done.
<Sysname> gunzip diag_Sysname_20160101-000704.gz
Decompressing file flash:/diag_Sysname_20160101-000704.gz.... Done.
b. View diagnostic information in the file.
<Sysname> more diag_Sysname_20160101-000704
===============================================
===============display clock===============
23:49:53 UTC Tue 01/01/2016
=================================================
---- More ----
Contacting technical support
· Information described in "General guidelines."
· Product serial numbers.
This information will help the support engineer assist you as quickly as possible.
The following is the contact information for H3C Support:
· Telephone number—400-810-0504.
· mailto:E-mail—[email protected].
Troubleshooting hardware
This section provides troubleshooting information for common hardware issues.
|
|
NOTE: This section describes how to troubleshoot unexpected switch reboot, power module failure, and fan tray failure. To troubleshoot ports, see "Troubleshooting ports." |
Unexpected switch reboot
Symptom
The switch reboots unexpectedly when it is operating.
Troubleshooting flowchart
Figure 1 Troubleshooting unexpected switch reboot
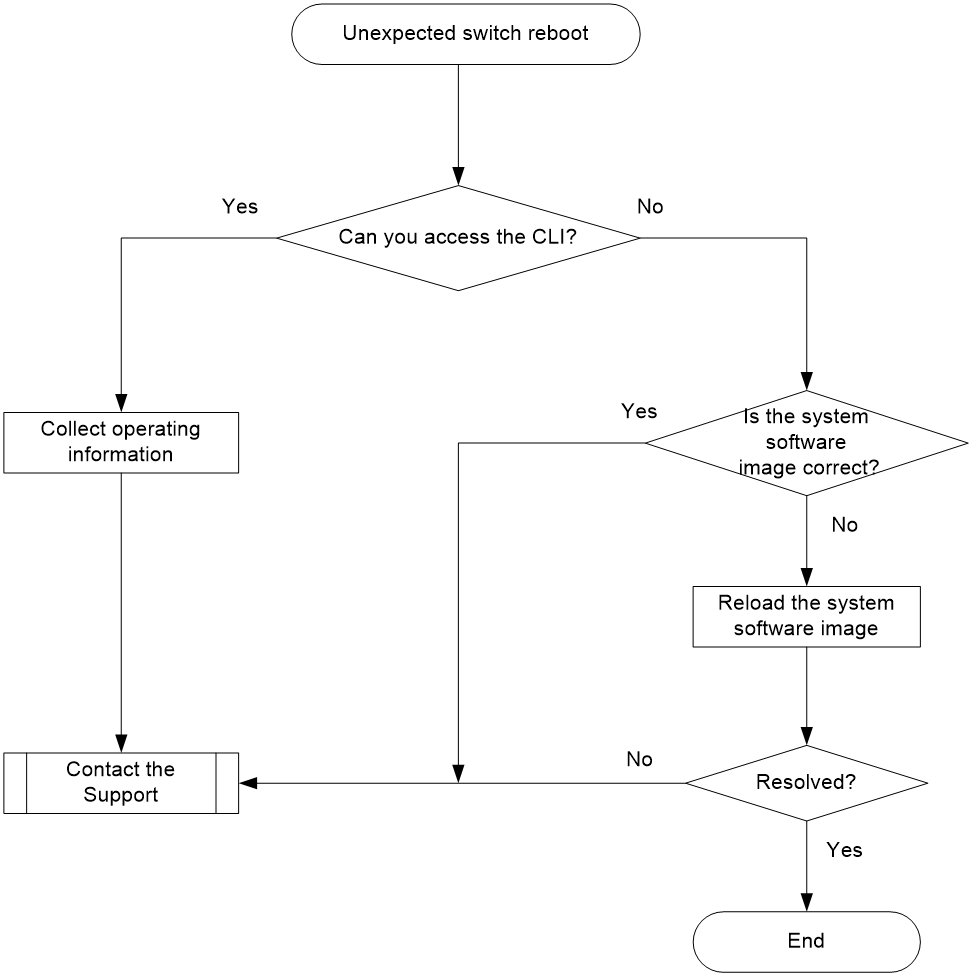
Solution
To resolve the issue:
1. Verify that you can access the CLI after the switch reboots.
¡ If you can access the CLI, execute the display diagnostic-information command to collect operating information.
¡ If you cannot access the CLI, go to step 2.
2. Verify that the system software image on the switch is correct.
Connect to the switch through the console port and restart the switch. If BootWare reports that a CRC error has occurred or that no system software image is available, perform the following steps:
a. Use the BootWare menu to reload the system software image.
b. Configure it as the current system software image.
3. If the issue persists, contact H3C Support.
Operating power module failure
Symptom
A trap or log is generated indicating that an operating power module is faulty.
Solution
To resolve the issue:
1. Execute the display power command to display power module information.
<Sysname> display power
Slot 1
Input Power: 266(W)
PowerID State Mode Current(A) Voltage(V) Power(W)
1 Absent -- -- -- --
2 Normal AC -- -- --
If the power module is in Absent state, go to step 2. If the power module is in Fault state, go to step 3.
2. Remove and reinstall the power module to make sure the power module is installed securely. Then, execute the display power command to verify that the power module has changed to Normal state. If the power module remains in Absent state, replace the power module.
3. When the power module is in Fault state, do the following:
a. Verify that the power module is connected to the power source securely. If it has been disconnected from the power source, connect the power source to it.
b. Determine whether the power module is in high temperature. If dust accumulation on the power module causes the high temperature, remove the dust. Then remove and reinstall the power module. Execute the display power command to verify that the power module has changed to Normal state. If the power module remains in Fault state, go to step c.
c. Install the power module into an empty power module slot. Then execute the display power command to verify that the power module has changed to Normal state in the new slot. If the power module remains in Fault state, replace the power module.
4. If the issue persists, contact H3C Support.
Newly installed power module failure
Symptom
A trap or log is generated indicating that a newly installed power module is faulty.
Solution
To resolve the issue:
1. Execute the display power command to display power module information.
<Sysname> display power
Slot 1
Input Power: 266(W)
PowerID State Mode Current(A) Voltage(V) Power(W)
1 Absent -- -- -- --
2 Normal AC -- -- --
If the power module is in Absent state, go to step 2. If the power module is in Fault state, go to step 3.
2. When the power module is in Absent state, do the following:
a. Remove and reinstall the power module to make sure the power module is installed securely. Then execute the display power command to verify that the power module has changed to Normal state. If the power module remains in Absent state, go to step b.
b. Remove and install the power module into an empty power module slot. Then execute the display power command to verify that the power module has changed to Normal state in the new slot. If the power module remains in Absent state, go to step 4.
3. Remove and install the power module into an idle power module slot. Then execute the display power command to verify that the power module has changed to Normal state in the new slot. If the power module remains in Fault state, go to step 4.
4. If the issue persists, contact H3C Support.
Fan tray failure
Symptom
A trap or log indicates that a fan tray is faulty, or the display fan command shows that a fan tray is not in Normal state.
Solution
To resolve the issue:
1. Execute the display fan command to display the operating states of the fan tray.
<Sysname> display fan
Slot 1:
Fan 1:
State : FanDirectionFault
Airflow Direction: Port-to-power
Prefer Airflow Direction: Power-to-port
Fan 2:
State : FanDirectionFault
Airflow Direction: Port-to-power
Prefer Airflow Direction: Power-to-port
¡ If the fan tray is in FanDirectionFault state, the airflow direction of the fan tray is not as configured. Replace the fan tray with a fan tray that has the same airflow direction as the equipment room, or use the fan prefer-direction command to change the preferred airflow direction.
¡ If the fan tray is in Absent state, go to step 2.
¡ If the fan tray is in Fault state, go to step 3.
2. Remove and reinstall the fan tray to make sure the fan tray is installed securely. Then execute the display fan command to verify that the fan tray has changed to Normal state. If the fan tray remains in Absent state, replace the fan tray.
3. Execute the display environment command to display temperature information. If the temperature continues to rise, put your hand at the air outlet to feel if air is being expelled out of the air outlet. If no air is being expelled out of the air outlet, remove and reinstall the fan tray. Then execute the display fan command to verify that the fan tray has changed to Normal state. If the fan tray remains in Fault state, replace the fan tray.
You must make sure the switch operating temperature is below 60°C (140°F) while you replace the fan tray. If a new fan tray is not readily available, power off the switch to avoid damage caused by high temperature.
4. If the issue persists, contact H3C Support.
Related commands
This section lists the commands that you might use for troubleshooting the hardware.
|
Command |
Description |
|
dir |
Displays information about files and directories. |
|
display boot-loader |
Displays current configuration files and system software images. |
|
display environment |
Displays temperature information. |
|
display fan |
Displays the operating states of the fan tray. |
|
display logbuffer |
Displays the state of the log buffer and the log information in the log buffer. |
|
display power |
Displays power module information. |
|
fan prefer-direction slot slot-number { power-to-port | port-to-power } |
Specifies the preferred airflow direction. |
Troubleshooting ACL
This section provides troubleshooting information for common issues with ACLs.
ACL application failure with an error message
Symptom
The system fails to apply a packet filter or an ACL-based QoS policy to the hardware. It also displays the "Reason: Not enough hardware resource" message.
Solution
To resolve the issue:
1. Execute the display qos-acl resource command, and then check the Remaining field for ACL resources insufficiency.
If this field displays 0, the ACL hardware resources are exhausted.
2. To free hardware resources, delete unnecessary ACLs.
3. If the issue persists, contact H3C Support.
ACL application failure without an error message
Symptom
The system applies a packet filter or an ACL-based QoS policy to the hardware. However, the ACL does not take effect.
Troubleshooting flowchart
Figure 2 Troubleshooting ACL application failure
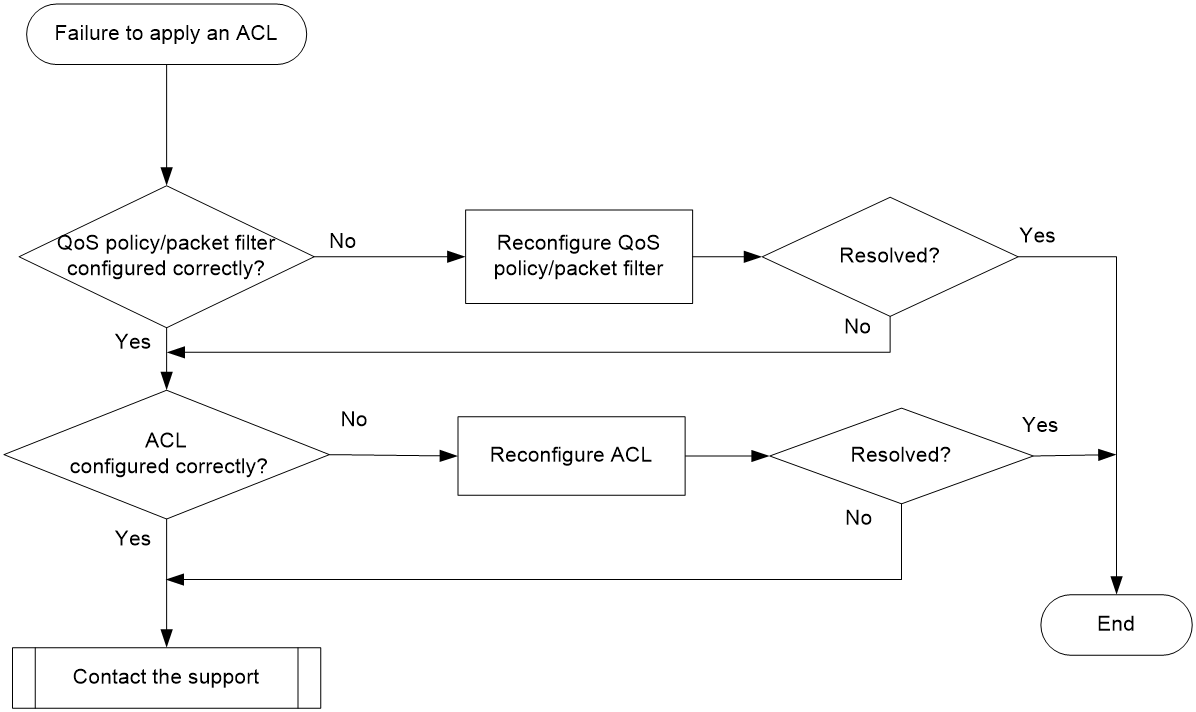
Solution
Choose a solution depending on the module that uses the ACL.
ACL used in a QoS policy
To resolve the issue when the ACL is used in a QoS policy:
1. Verify that the QoS policy is configured correctly:
a. Use one of the following commands to check the QoS policy for configuration errors, depending on the policy application destination:
|
Destination |
Command |
|
Interface |
display qos policy interface |
|
VLAN |
display qos vlan-policy |
|
Global |
display qos policy global |
|
Control plane |
display qos policy control-plane slot slot-number |
b. If the QoS policy does not contain a class-behavior association, associate the traffic behavior with the traffic class.
c. If the QoS policy contains a class-behavior association, execute the display traffic classifier user-defined command and the display traffic behavior user-defined command to check for traffic class and behavior configuration errors, respectively.
- If they are configured incorrectly, reconfigure them.
- If they are configured correctly, go to step 2.
2. Verify that the ACL is configured correctly.
Execute the display acl command to check whether the ACL is configured correctly.
¡ If the ACL is configured incorrectly, reconfigure it.
¡ If the ACL is configured correctly, go to step 3.
3. If the issue persists, contact H3C Support.
ACL used in a packet filter
To resolve the issue when the ACL is used in a packet filter:
1. Verify that the packet filter is configured correctly.
Execute the display packet-filter command to check whether the packet filter is configured correctly.
¡ If there are any configuration errors, reconfigure the packet filter.
¡ If there is no configuration error, go to step 2.
2. Verify that the ACL is configured correctly.
Execute the display acl command to check whether the ACL is configured correctly.
¡ If the ACL is configured incorrectly, reconfigure it.
¡ If the ACL is configured correctly, go to step 3.
3. If the issue persists, contact H3C Support.
Related commands
This section lists the commands that you might use for troubleshooting ACLs.
|
Command |
Description |
|
display acl |
Displays configuration and match statistics for ACLs. |
|
display diagnostic-information |
Displays operating statistics for multiple feature modules in the system. |
|
display packet-filter |
Displays whether an ACL has been successfully applied to an interface for packet filtering. |
|
display qos-acl resource |
Displays QoS and ACL resource usage. |
|
display qos policy control-plane |
Displays information about the QoS policies applied to control planes. |
|
display qos policy global |
Displays information about global QoS policies. |
|
display qos policy interface |
Displays information about the QoS policies applied to an interface or to all interfaces. |
|
display qos policy user-defined |
Displays user-defined QoS policies. |
|
display qos vlan-policy |
Displays information about QoS policies applied to VLANs. |
|
display traffic classifier user-defined |
Displays traffic class configuration. |
|
display traffic behavior user-defined |
Displays traffic behavior configuration. |
Troubleshooting IRF
This section provides troubleshooting information for common issues with IRF.
IRF fabric setup failure
Symptom
An IRF fabric cannot be set up.
Troubleshooting flowchart
Figure 3 Troubleshooting IRF fabric setup failure
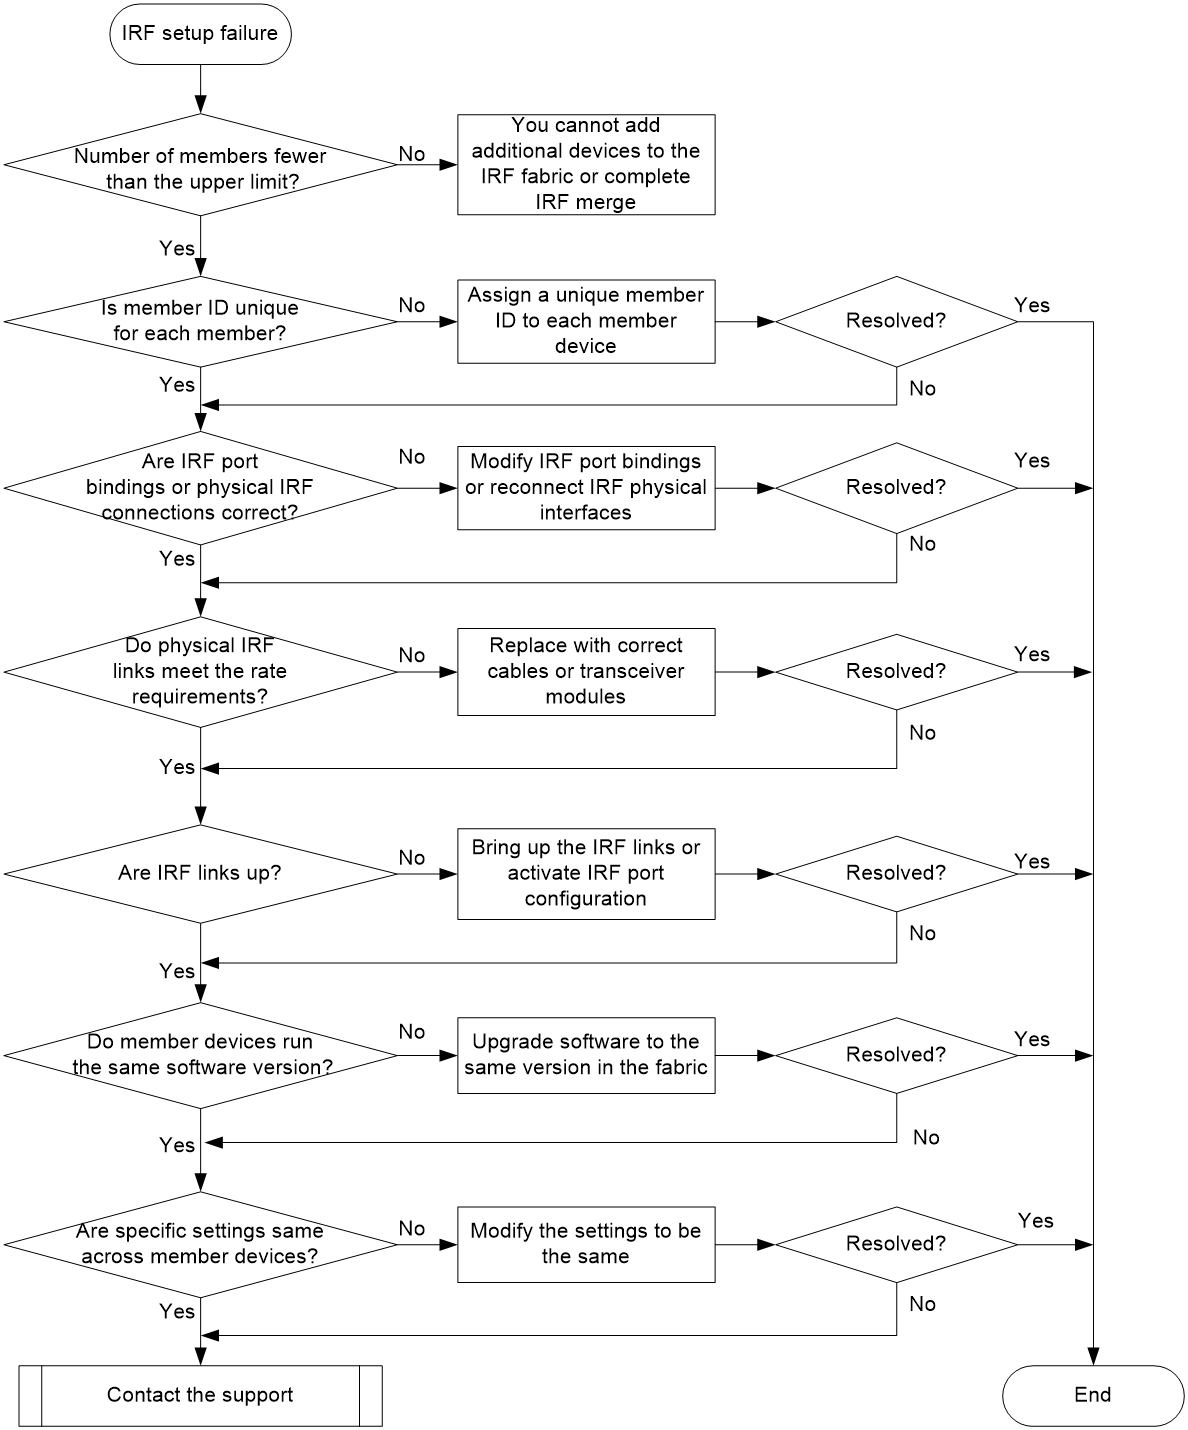
Solution
To resolve the issue:
1. Verify that the number of member devices does not exceed the upper limit.
An S6820 IRF fabric can contain a maximum of 10 member devices.
When you are adding a new member device to an existing IRF fabric or merging IRF fabrics, use the display irf command to identify the number of member devices in the IRF fabrics. If the total number of member devices exceeds the upper limit, the IRF setup will fail.
2. Verify that the member ID of each member device is unique:
a. Execute the display irf command to view the member ID of each member device.
b. Use the irf member renumber command to assign a unique member ID to each member.
- If you are adding a new member device to an existing IRF fabric, assign the member device a member ID that is not being used in the IRF fabric.
- If you are merging IRF fabrics, make sure each member device in these IRF fabrics has a unique member ID.
3. Verify that the IRF port bindings and physical IRF link connections are correct:
a. Execute the display irf configuration command, and check the IRF-Port1 and IRF-Port2 fields for IRF port bindings.
b. Verify that the physical interfaces bound to IRF ports are IRF capable. If there are binding errors, reconfigure the IRF port bindings. You can use the following ports as IRF physical interfaces:
- SFP28 ports operating at 25 Gbps.
- QSFP+ ports operating at 40 Gbps.
- QSFP28 ports operating at 100 Gbps.
- SFP28 breakout interfaces of a QSFP28 ports. The breakout interfaces operate at 25 Gbps.
c. Verify that the IRF physical interfaces are correct connected. When you connect two neighboring IRF members, you must connect the physical interfaces of IRF-port 1 on one member to the physical interfaces of IRF-port 2 on the other.
4. Verify that the physical IRF links meet the rate requirements:
a. Verify that the correct transceiver modules or cables are used:
- Use SFP28 DAC cables to connect SFP28 ports in a short distance.
- Use SFP28 transceiver modules and fibers to connect SFP28 ports in a long distance.
- Use QSFP+ cables to connect QSFP+ ports in a short distance.
- Use QSFP+ transceiver modules and fibers to connect QSFP+ ports in a long distance.
- Use QSFP28 cables to connect QSFP28 ports in a short distance.
- Use QSFP28 transceiver modules and fibers to connect QSFP28 ports in a long distance.
- Use QSFP28 to SFP28 DAC cables to connect the breakout interfaces of a QSFP28 port to SFP28 ports.
b. Verify that transceiver modules at the two ends of an IRF link are the same type. If the transceiver modules are not the same type, replace them to be the same type. Perform this step if transceiver modules are used for IRF connection. Skip this step if you do not use transceiver modules for IRF connection.
5. Verify that all IRF links are up:
a. Execute the display irf topology command, and then check the Link field.
- If the Link field for each IRF port does not display DOWN, go to step 6.
- If the Link field for an IRF port displays DOWN, go to step b.
b. Execute the display irf link command, and then check the Status field of the physical interfaces bound to the IRF port.
- If the field displays DOWN or ADM (administratively down) for all the physical interfaces, remove the link failures or use the undo shutdown command to bring up the administratively down physical interfaces.
- If the field displays UP for at least one of the physical interfaces, go to step c.
c. Save the configuration, and then execute the irf-port-configuration active command in system view to activate the IRF port configuration.
|
|
IMPORTANT: Activating IRF port configuration requires a reboot. To prevent configuration loss, you must save the configuration before you execute the irf-port-configuration active command. |
6. Verify that all member devices use the same software version:
a. Execute the display version command to identify the software version of each member device.
b. Upgrade the software of all member devices to the same version.
|
|
NOTE: Typically, the irf auto-update enable command can automatically synchronize a member device with the software version of the master device. However, the synchronization might fail when the gap between the software versions is too large. For more information, see the release notes. |
7. Execute display commands to verify that all member devices use the same settings for the following features:
¡ System operating mode.
The mode is set by using the system-working-mode command.
¡ Table capacity mode.
The mode is set by using the hardware-resource switch-mode command.
¡ Maximum number of ECMP routes.
The number is set by using the max-ecmp-num command.
¡ Enhanced ECMP mode.
The mode is set by using the ecmp mode command.
¡ Support for IPv6 routes with prefixes longer than 64 bits.
The feature is configured by using the hardware-resource routing-mode command.
¡ VXLAN hardware resource mode.
The mode is set by using the hardware-resource vxlan command.
8. If the issue persists, contact H3C Support.
Related commands
This section lists the commands that you might use for troubleshooting IRF.
|
Command |
Description |
|
display ecmp mode |
Displays IPv4 ECMP mode. |
|
display hardware-resource routing-mode |
Displays support for IPv6 routes with prefixes longer than 64 bits. |
|
display hardware-resource switch-mode |
Displays table capacity mode information. |
|
display hardware-resource vxlan |
Displays VXLAN hardware resource allocation mode information. |
|
display irf |
Displays IRF fabric information, including the member ID, role, priority, bridge MAC address, and description of each IRF member. |
|
display irf configuration |
Displays basic IRF settings, including the current member ID, new member ID, and physical interfaces bound to the IRF ports on each IRF member device. The new member IDs take effect at reboot. |
|
display irf link |
Displays IRF link information. Use this command to verify that each IRF port has a minimum of one physical interface in up state. |
|
display irf topology |
Displays the IRF fabric topology, including the member IDs, IRF port state, and adjacencies of IRF ports. |
|
display max-ecmp-num |
Displays the maximum number of ECMP routes. |
|
display system-working-mode |
Displays system operating mode information. |
|
display version |
Displays system version information. |
Troubleshooting Ethernet link aggregation
This section provides troubleshooting information for common issues with Ethernet link aggregation.
Link aggregation failure
Symptom
Some member ports fail to be placed in Selected state, and link aggregation does not operate correctly.
Troubleshooting flowchart
Figure 4 Troubleshooting link aggregation failure
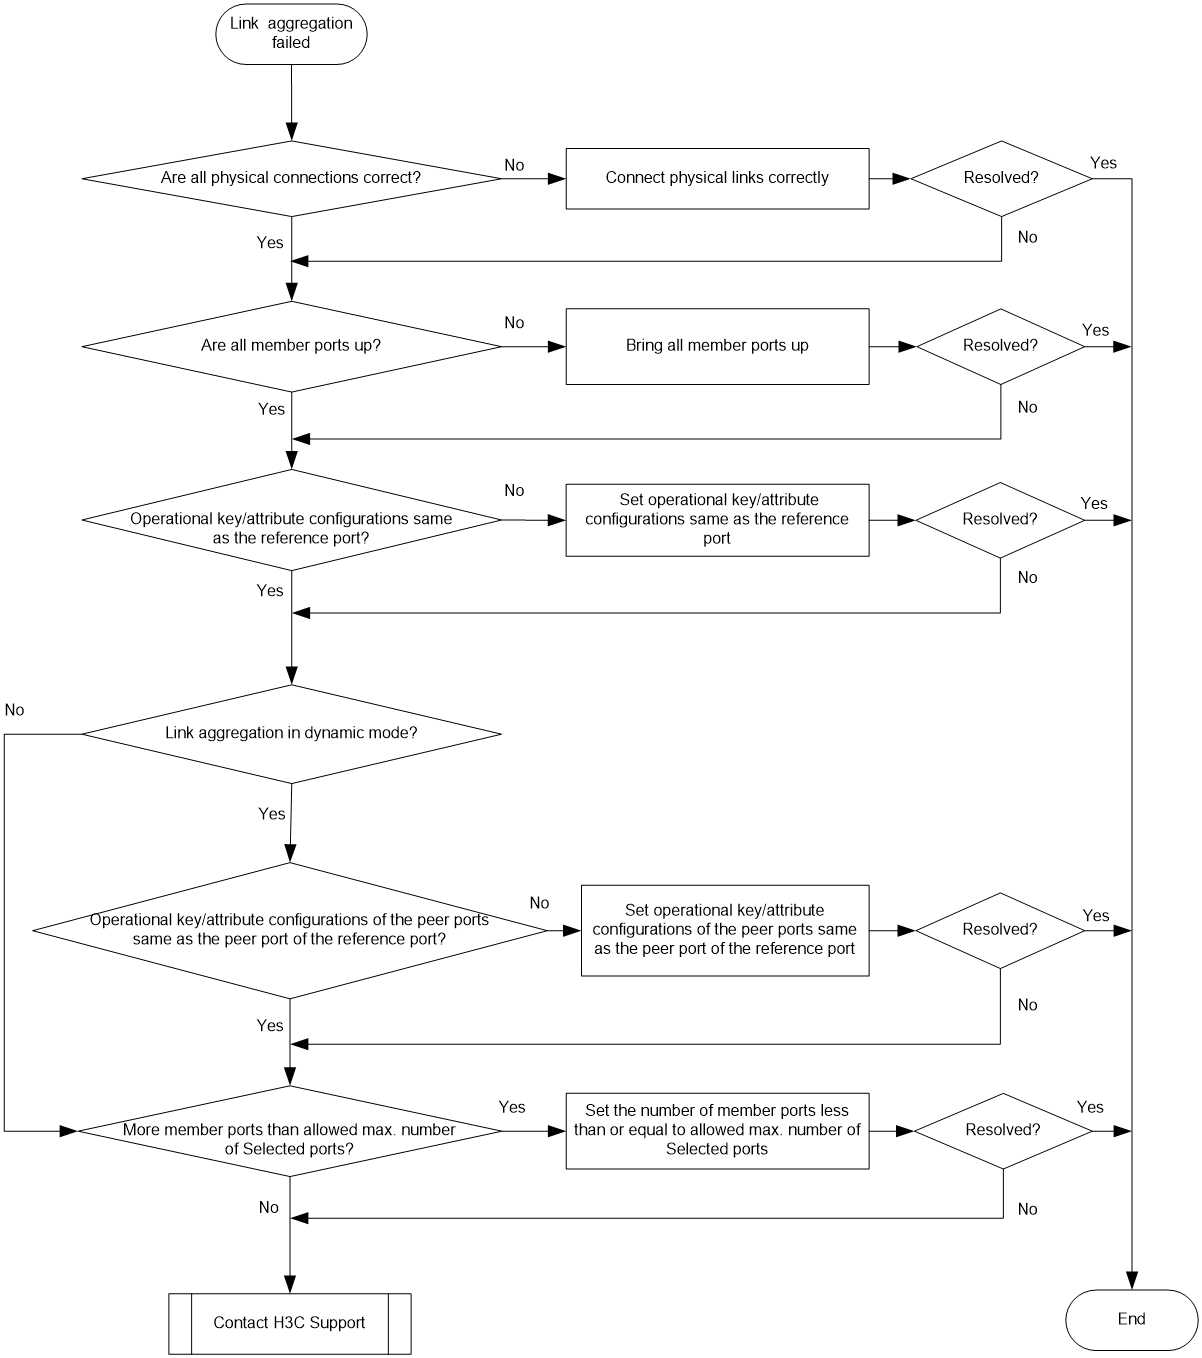
Solution
To resolve the issue:
1. Verify that all physical connections are correct.
You can verify the physical connections against your network plan.
2. Verify that all member ports are up:
a. Execute the display interface command to display the status of the member ports.
b. If the member ports are down, follow the solution in "Troubleshooting ports" to troubleshoot the issue.
3. Verify that the member ports have the same operational key and attribute configurations as the reference port:
a. Execute the display link-aggregation verbose command to display the Selected state of the member ports.
b. Execute the display current-configuration interface command to display the configurations of the aggregate interface and the Unselected ports.
c. Configure the Unselected ports to make sure they have the same operational key and attribute configurations as the reference port.
4. Identify the aggregation mode of the aggregation group.
¡ If the aggregation mode is static, proceed to step 6.
¡ If the aggregation mode is dynamic, proceed to step 5.
5. Verify that the peer member ports have the same operational key and attribute configurations as the peer port of the reference port:
a. Execute the display current-configuration interface command on the peer device to display the configurations of the peer member ports.
b. Configure the peer member ports to make sure the peer ports have the same operational key and attribute configurations as the peer port of the reference port.
6. Verify that the number of member ports in the aggregation group does not exceed the configured maximum number of Selected ports.
a. Execute the link-aggregation selected-port maximum command to set the maximum number of Selected ports allowed in the aggregation group. The value range is 1 to 16.
b. Execute the display link-aggregation verbose command to verify that the number of member ports does not exceed the configured maximum number of Selected ports.
If the number of member ports exceeds the maximum number of Selected ports, the ports with higher port numbers are in Unselected state.
c. Use the undo port link-aggregation group command to remove undesired member ports from the aggregation group.
This makes sure all member ports you assign to the aggregation group can become Selected ports.
7. If the issue persists, contact H3C Support.
Related commands
This section lists the commands that you might use for troubleshooting Ethernet link aggregation.
|
Commands |
Description |
|
display current-configuration interface |
Displays interface configuration. |
|
display interface |
Displays Ethernet interface information. |
|
display link-aggregation verbose |
Display detailed information about the aggregation groups that correspond to the existing aggregate interfaces. |
|
link-aggregation selected-port maximum |
Configure the maximum number of Selected ports allowed in an aggregation group. |
Troubleshooting ports
This section provides troubleshooting information for common port issues.
A 1-GE SFP, 10-GE SFP+, 40-GE QSFP+, or 100-GE QSFP28 fiber port fails to come up
Symptom
A 1-GE SFP, 10-GE SFP+, 40-GE QSFP+, or 100-GE QSFP28 fiber port fails to come up.
Troubleshooting flowchart
Figure 5 Troubleshooting link up failure on a fiber port
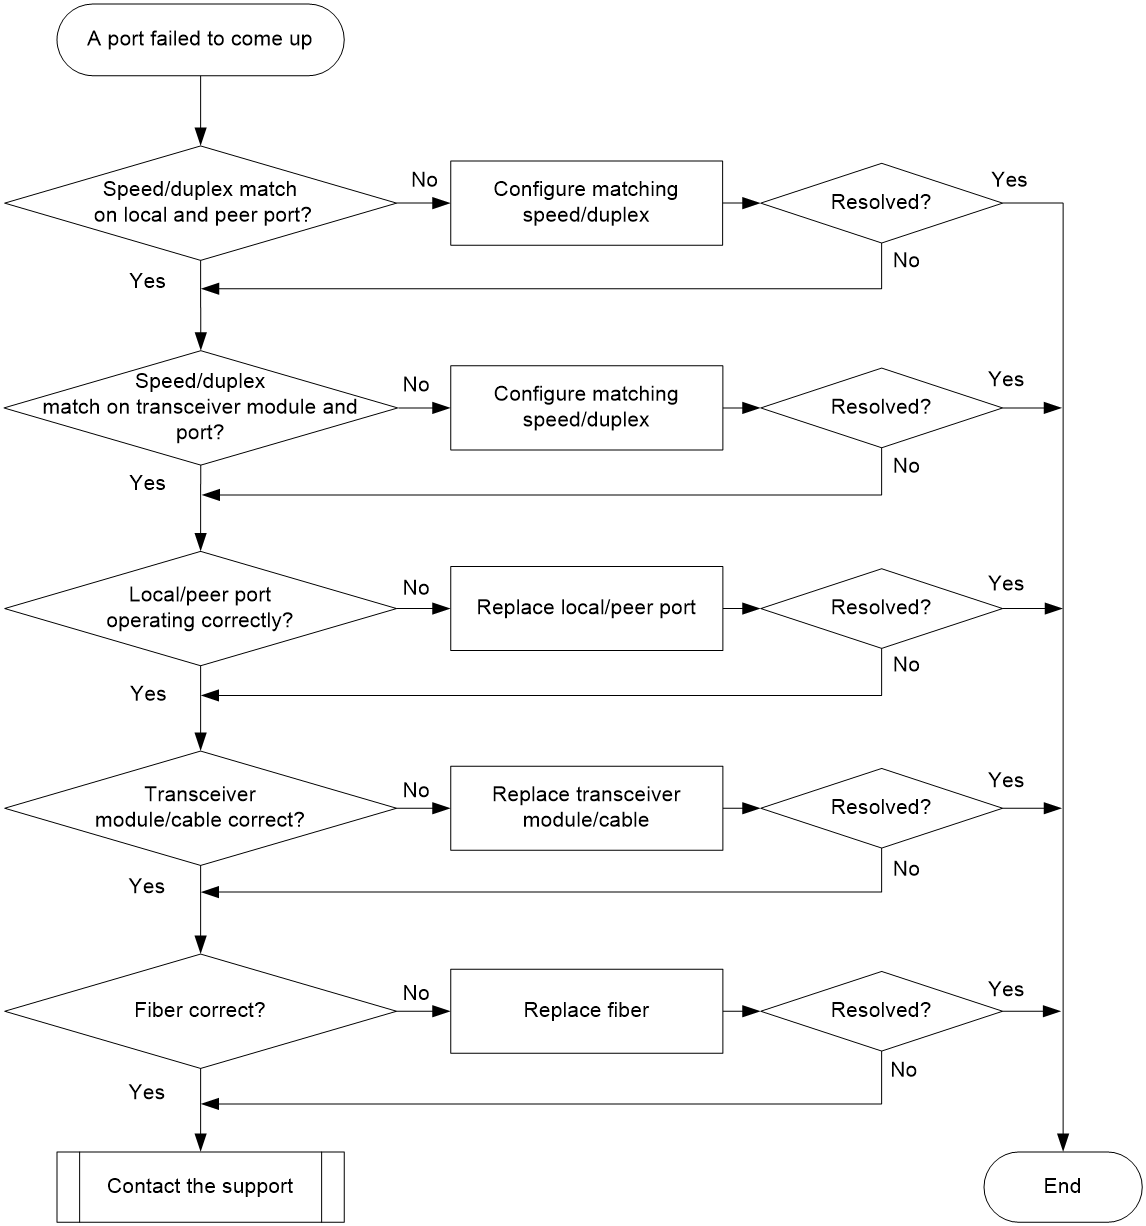
Solution
To resolve the issue:
1. Verify that the speed and duplex mode of the local port match the speed and duplex mode of the peer port:
a. Execute the display interface brief command to examine whether the speed and duplex mode of the port match the speed and duplex mode of the peer port.
b. If they do not match, use the speed command and the duplex command to set the rate and duplex mode for the port.
2. Verify that the speed and duplex mode of the local port match the speed and duplex mode of the transceiver module:
a. Execute the display interface brief command to examine whether the speed and duplex mode of the port match the speed and duplex mode of the transceiver module.
b. If they do not match, use the speed command and the duplex command to set the rate and duplex mode for the port.
3. Verify that the ports at both ends are operating correctly:
a. For a SFP+/QSFP+/QSFP28 fiber port, use an SFP+/QSFP+/QSFP28 cable to directly connect it to another port of the same type on the local end.
b. Identify whether the port can come up:
- If the port can come up, you can determine that the peer port fails. Replace the peer port with a new port operating correctly.
- If the port cannot come up, you can determine that the local port fails. Replace the local port with a new port operating correctly.
4. Verify that the transceiver module and cable are operating correctly:
a. Use the display transceiver alarm interface command to check for alarms on the transceiver module:
- The device displays None if no error has occurred.
- The device displays alarms if the transceiver module has failed or if the type of the transceiver module does not match the port type.
b. Use an optical power meter to verify that the Tx power and Rx power of the transceiver module are stable and are within the correct range.
c. Execute the display transceiver interface command to verify that the local transceiver module has the same wavelength and transmission distance as the peer transceiver module.
d. If the transceiver module is not operating correctly, replace it with a H3C transceiver module that matches the fiber port.
For more information about transceiver modules and cables, see the installation guide for the switch.
|
|
NOTE: When you use a QSFP+ to SFP+ cable to connect a 40-GE QSFP+ fiber port, you must use an optical attenuator because the Tx optical power of the QSFP+ transceiver module exceeds the upper Rx optical power limit of the SFP+ transceiver module. |
5. Verify that the fiber matches the transceiver module. If they do not match, replace the fiber with a new one that matches the transceiver module.
For more information about fibers, see the installation guide for the switch.
6. If the issue persists, contact H3C Support.
A 25-GE SFP28 fiber port fails to come up
Symptom
A 25-GE SFP28 fiber port fails to come up
Troubleshooting flowchart
Figure 6 Troubleshooting link up failure on a copper port
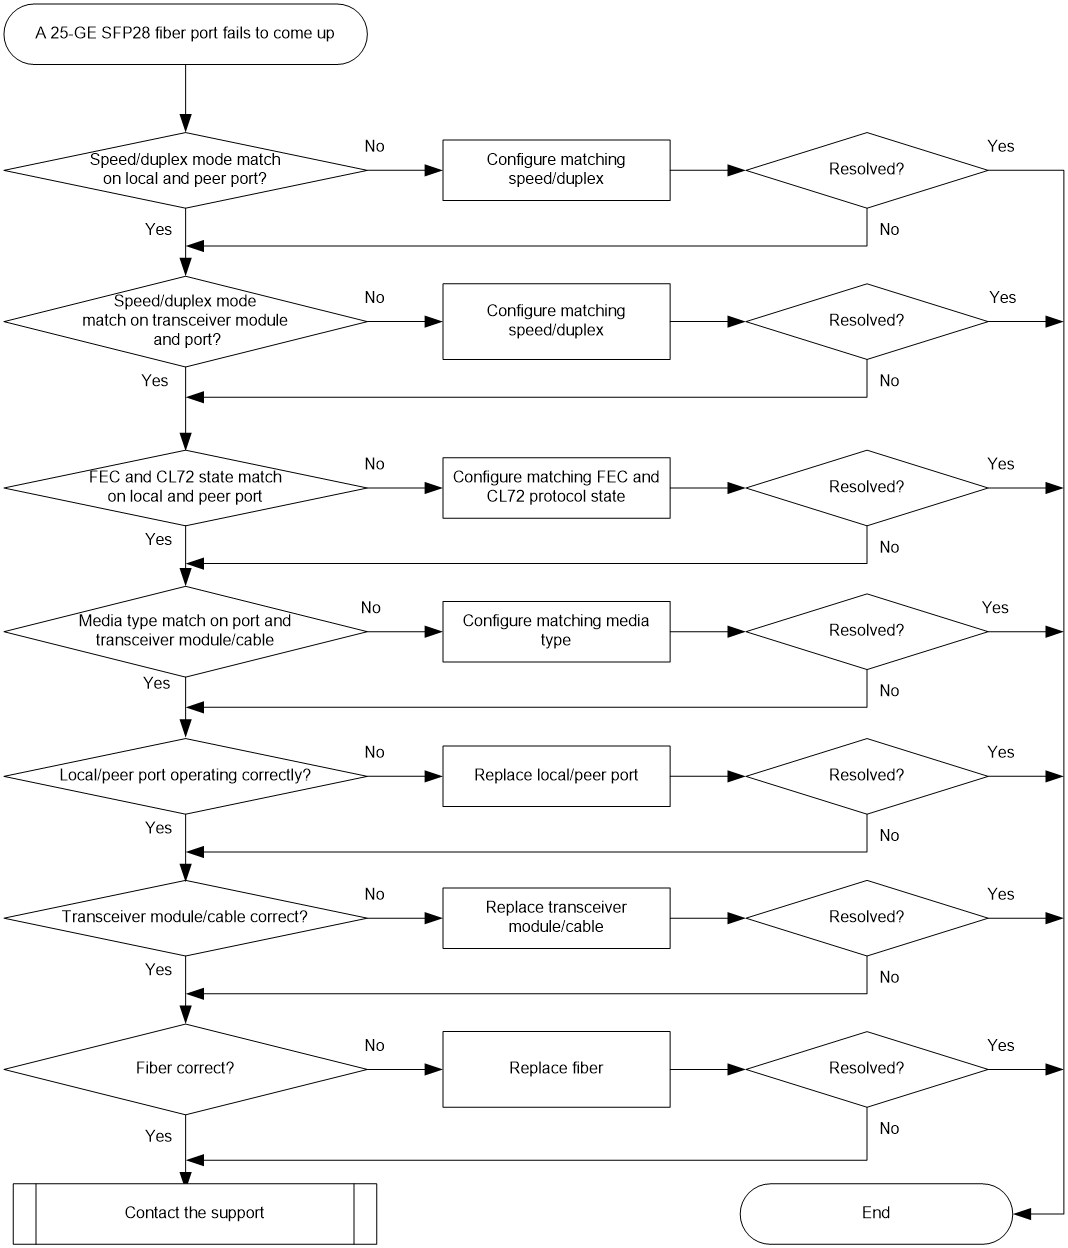
Solution
To resolve the issue:
1. Verify that the speed and duplex mode of the local port match the speed and duplex mode of the peer port:
a. Execute the display interface brief command to examine whether the speed and duplex mode of the port match the speed and duplex mode of the peer port.
b. If they do not match, use the speed command and the duplex command to set the rate and duplex mode for the port.
2. Verify that the speed and duplex mode of the local port match the speed and duplex mode of the transceiver module:
a. Execute the display interface brief command to examine whether the speed and duplex mode of the port match the speed and duplex mode of the transceiver module.
b. If they do not match, use the speed command and the duplex command to set the rate and duplex mode for the port.
A 25-GE port can operate either at 25 Gbps or 10 Gbps, but does not support speed or duplex mode autonegotiation. You must manually use the speed command and the duplex command to set the speed and duplex mode for the port. A port can come up only when its speed matches the speed of its transceiver module or cable. Ports in the same group must be configured with the same speed.
25-GE ports on the S6820 switches are grouped as follows:
¡ For ports 1 through 24 and 33 through 56 on an S6820-56HF switch, four continuous ports starting from 1 or 33 are organized into one group.
¡ For ports on an LSWM124TG2H port module, four continuous ports starting from 1 are organized into one group.
¡ When you use the using twenty-fivegige command to split a 100-GE port into four 25-GE breakout ports, the four breakout ports are organized into one group.
3. Verify that the Cl72 and FEC state are the same on both ends
The CL72 and FEC protocols supported by 25-GE ports on the switch are still drafts. These protocols are not completely compatible for devices from different vendors. You can use the port cl72 enable and port fec enable commands on 25-GE ports of the switch to control the status of the two hardware protocols. Then, the switch can interoperate with devices from different vendors.
¡ For two ports of a link to come up, make sure they have the same CL72 negotiation configuration.
¡ If the peer port supports Base-R FEC, make sure the FEC negotiation status is the same on both ends.
¡ If the peer port supports RS-FEC, you must disable FEC negotiation on both ends. If the local port and the peer port are connected through a copper cable, you must also disable CL72 negotiation on both ends.
4. Verify that the media type of the port matches that of the transceiver module or cable
For 25-GE ports Twenty-FiveGigE 1/0/1 through Twenty-FiveGigE 1/0/8 and Twenty-FiveGigE 1/0/49 through Twenty-FiveGigE 1/0/56 of an S6820-56HF switch and 25-GE ports on an LSWM124TG2H port module, you must use the port media-type { copper | fiber } command to set the media type. Set the media type to fiber for a port that uses a transceiver module or fiber cable. Set the media type to copper for a port that uses a copper cable. The media type of ports in the same group is the same. When you set the media type for any port in a group, the setting is synchronized to the other ports in the group.
5. Verify that the ports at both ends are operating correctly:
a. If the port operates at 25 Gbps, use an SFP28 cable (used for short-haul connection) to directly connect it to another 25-GE port on the local end. If the port operates at 10 Gbps, use an SFP+ cable (used for short-haul connection) to directly connect it to another 10-GE port on the local end.
b. Identify whether the port can come up:
- If the port can come up, you can determine that the peer port fails. Replace the peer port with a new port operating correctly.
- If the port cannot come up, you can determine that the local port fails. Replace the local port with a new port operating correctly.
6. Verify that the transceiver module and cable are operating correctly:
a. Use the display transceiver alarm interface command to check for alarms on the transceiver module:
- The device displays None if no error has occurred.
- The device displays alarms if the transceiver module has failed or if the type of the transceiver module does not match the port type.
b. Use an optical power meter to verify that the Tx power and Rx power of the transceiver module are stable and are within the correct range.
c. Execute the display transceiver interface command to verify that the local transceiver module has the same wavelength and transmission distance as the peer transceiver module.
d. If the transceiver module is not operating correctly, replace it with a H3C transceiver module that matches the fiber port.
For more information about transceiver modules and cables, see the installation guide for the switch.
7. Verify that the fiber matches the transceiver module. If they do not match, replace the fiber with a new one that matches the transceiver module.
For more information about fibers, see the installation guide for the switch.
8. If the issue persists, contact H3C Support.
A 10/100/1000Base-T GE copper port or 1/10GBase-T 10-GE copper port fails to come up
Symptom
A 10/100/1000Base-T GE copper port or 1/10GBase-T 10-GE copper port fails to come up.
Troubleshooting flowchart
Figure 7 Troubleshooting link up failure on a copper port
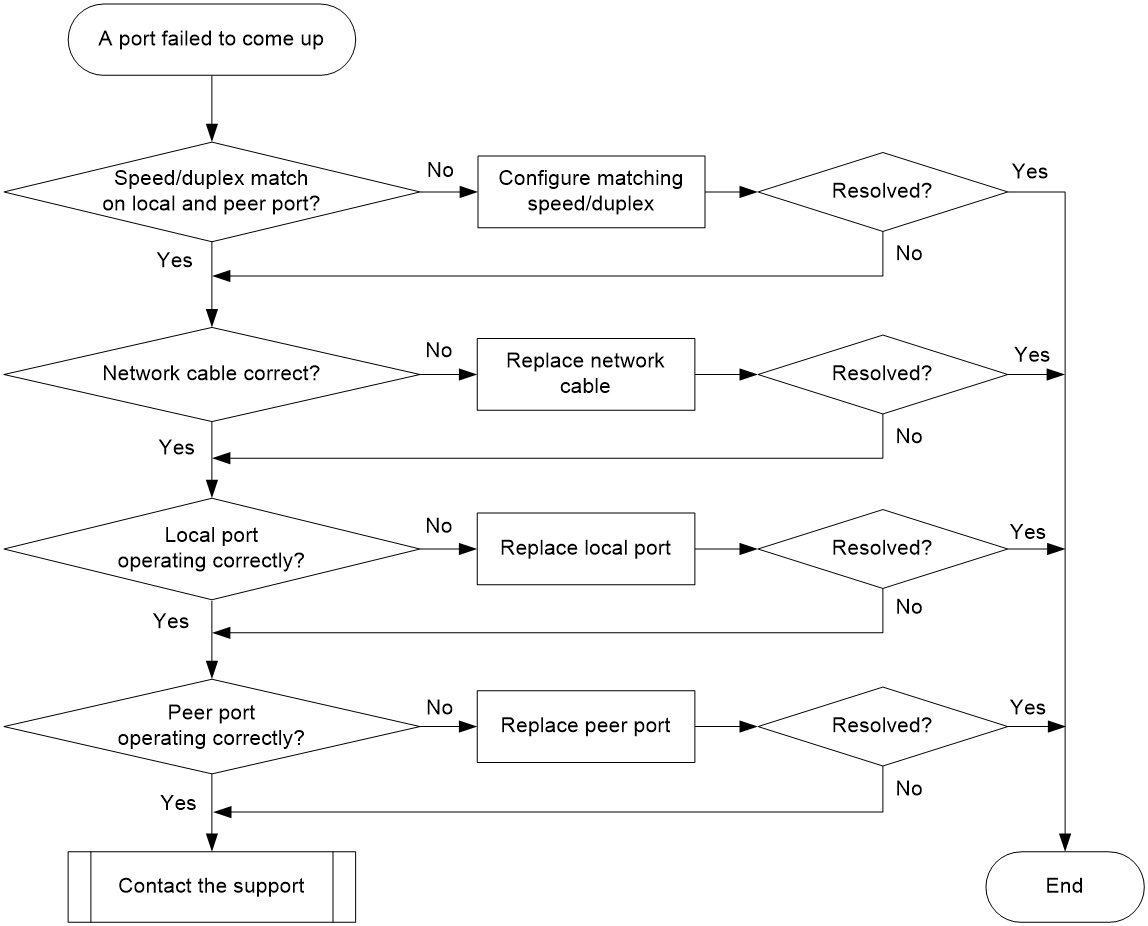
Solution
To resolve the issue:
1. Verify that the speed and duplex mode of the local port match the speed and duplex mode of the peer port:
a. Execute the display interface brief command to examine whether the speed and duplex mode of the port match the speed and duplex mode of the peer port.
b. If they do not match, use the speed command and the duplex command to set the rate and duplex mode for the port.
2. Replace the network cable with a new one to verify that the network cable is in good condition.
3. Replace the local port with a new one to verify that the local port is operating correctly.
4. Replace the peer port with a new one to verify that the peer port is operating correctly.
5. If the issue persists, contact H3C Support.
Non-H3C transceiver module error message
Symptom
The output from the display logbuffer command shows that the transceiver module is not an H3C transceiver module.
<Sysname> display logbuffer
FortyGigE1/0/5: This transceiver is NOT sold by H3C. H3C therefore shall NOT guarantee the normal function of the device or assume the maintenance responsibility thereof!
Troubleshooting flowchart
Figure 8 Troubleshooting non-H3C transceiver module error message

Solution
To resolve the issue:
1. Verify that the transceiver module is an H3C transceiver module:
Execute the display transceiver interface command to view the vendor name of the transceiver module.
[Sysname] display transceiver interface fortygige 1/0/1
FortyGigE 1/0/1 transceiver information:
Transceiver Type : 40G_BASE_LR4_QSFP_PLUS
Connector Type : LC
Wavelength(nm) : 1301
Transfer Distance(km) : 10(SMF)
Digital Diagnostic Monitoring : YES
Vendor Name : H3C
Ordering Name : QSFP-40G-LR4-WDM1300
¡ If the vendor name field does not display H3C, replace the transceiver module with an H3C transceiver module.
¡ If the vendor name field displays H3C, perform the following tasks:
- Execute the display hardware internal transceiver register interface command in probe view to save the transceiver module information.
- Provide the information to H3C Support to verify that the transceiver module is an H3C transceiver module. If it is not, replace it with an H3C transceiver module.
2. If the issue persists, contact H3C Support.
Transceiver module does not support digital diagnosis
Symptom
The output from the display transceiver diagnosis interface command shows that the transceiver module does not support the digital diagnosis function.
<Sysname> display transceiver diagnosis interface fortygige 1/0/1
The transceiver does not support this function.
Troubleshooting flowchart
Figure 9 Troubleshooting digital diagnosis failure on a transceiver module
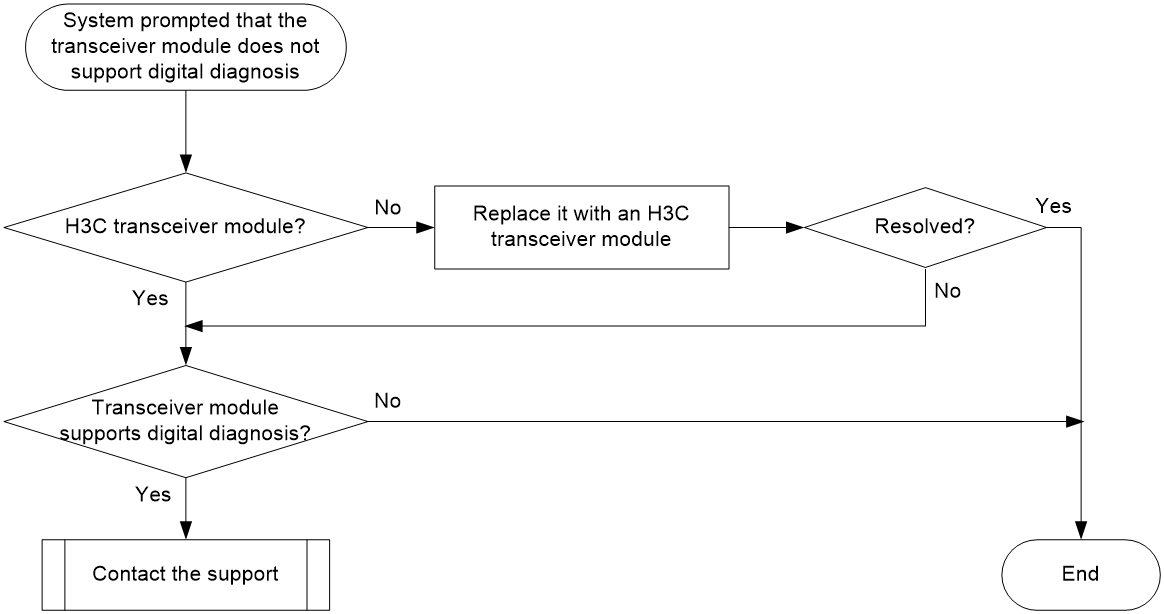
Solution
To resolve the issue:
1. Verify that the transceiver module is an H3C transceiver module:
Execute the display transceiver interface command to view the vendor name of the transceiver module.
¡ If the vendor name field does not display H3C, replace the transceiver module with an H3C transceiver module.
¡ If the vendor name field displays H3C, perform the following tasks:
- Execute the display transceiver manuinfo interface command to save the transceiver module information.
- Provide the information to H3C Support to verify that the transceiver module is an H3C transceiver module. If the module is not from H3C, replace it with an H3C transceiver module.
2. Execute the display transceiver interface command to save the transceiver module information, and contact H3C Support to verify that the transceiver module supports the digital diagnosis function.
<Sysname> display transceiver interface fortygige 1/0/1
FortyGigE 1/0/1 transceiver information:
Transceiver Type : 40G_BASE_LR4_QSFP_PLUS
Connector Type : LC
Wavelength(nm) : 1301
Transfer Distance(km) : 10(SMF)
Digital Diagnostic Monitoring : YES
Vendor Name : H3C
Ordering Name : QSFP-40G-LR4-WDM1300
3. If the issue persists, contact H3C Support.
Error frames (for example, CRC errors) on a port
Symptom
The output from the display interface command shows that error frames exist (for example, CRC error frames) on a port.
Troubleshooting flowchart
Figure 10 Troubleshooting error frames (for example, CRC errors) on a port
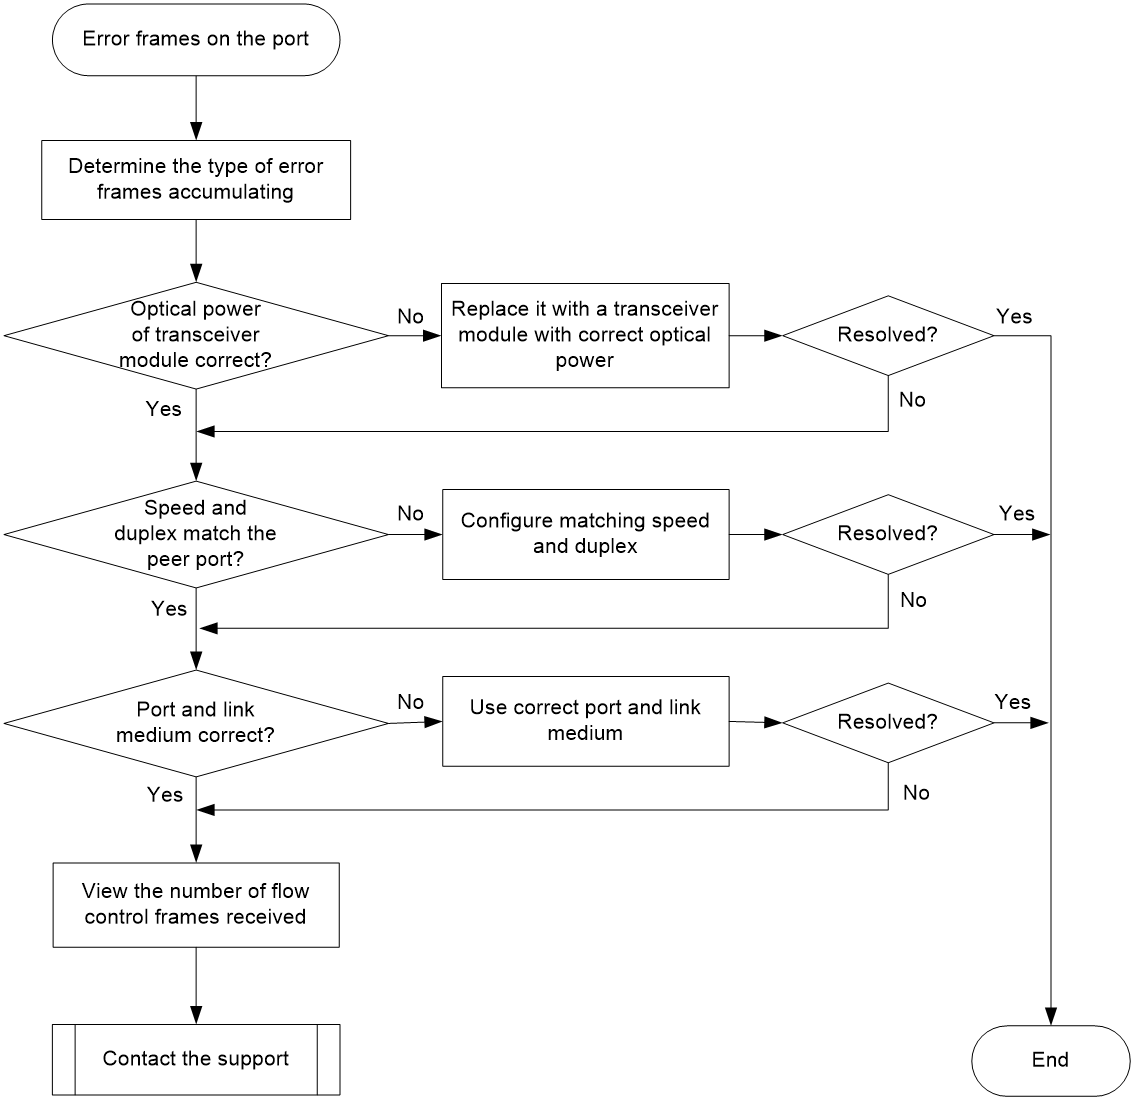
Solution
To resolve the issue:
1. Examine the error frame statistics and identify the error frame type:
a. (Optional.) Use the reset counter interface command in user view to clear the packet statistics of the port.
This command resets all packet counters to 0, so that you can view the statistics changes more clearly.
b. Use the display interface command to display the incoming packet statistics and outgoing packet statistics of the port.
c. Determine the type of error frames that are accumulating.
2. If the port is a fiber port, verify that the optical power of the transceiver module is operating correctly:
a. Use the display transceiver diagnosis interface command to view the present measured values of the digital diagnosis parameters for the transceiver module.
[Sysname] display transceiver diagnosis interface fortygige 1/0/1
FortyGigE1/0/1 transceiver diagnostic information:
Current diagnostic parameters:
Temp.(°C) Voltage(V) Bias(mA) RX power(dBm) TX power(dBm)
43 3.31 6.23 -6.50 -2.15
Alarm thresholds:
Temp(°C) Voltage(V) Bias(mA) RX power(dBM) TX power(dBM)
High 75 -63 10.50 2.00 1.50
Low -5 2.97 2.00 -13.90 -11
b. If the optical power of the transceiver module is not within the correct range, replace the transceiver module with a transceiver module of the same model that is operating correctly.
3. Verify that the port configurations are correct:
a. Execute the display interface brief command.
b. Determine whether the speed and duplex mode of the port match the speed and duplex mode of the peer port.
c. If they do not match, use the speed command and the duplex command to set the speed and duplex mode for the port.
4. Verify that the link medium connected to the port is operating correctly.
Plug the link medium into a new port that is operating correctly. If error frames still exist, replace the link medium.
5. Verify that the port is operating correctly:
¡ If the port is a copper port, connect the port directly to a PC.
¡ If the port is a fiber port, replace the transceiver module in the port.
If error frames do not exist, troubleshoot the remaining possible points of failure on the transmission path. The troubleshooting process is beyond the scope of this document.
6. Determine whether the port has received a large amount of flow control frames:
a. Use the display interface command to view the number of pause frames.
If the number of pause frames is accumulating, you can determine that the port has sent or received a large amount of flow control frames.
b. Verify that the incoming traffic and outgoing traffic have not exceeded the maximum traffic processing capability of the local device and the peer device.
7. If the issue persists, contact H3C Support.
Failure to receive packets
Symptom
A port is up, but it cannot receive packets.
Troubleshooting flowchart
Figure 11 Troubleshooting failure to receive packets
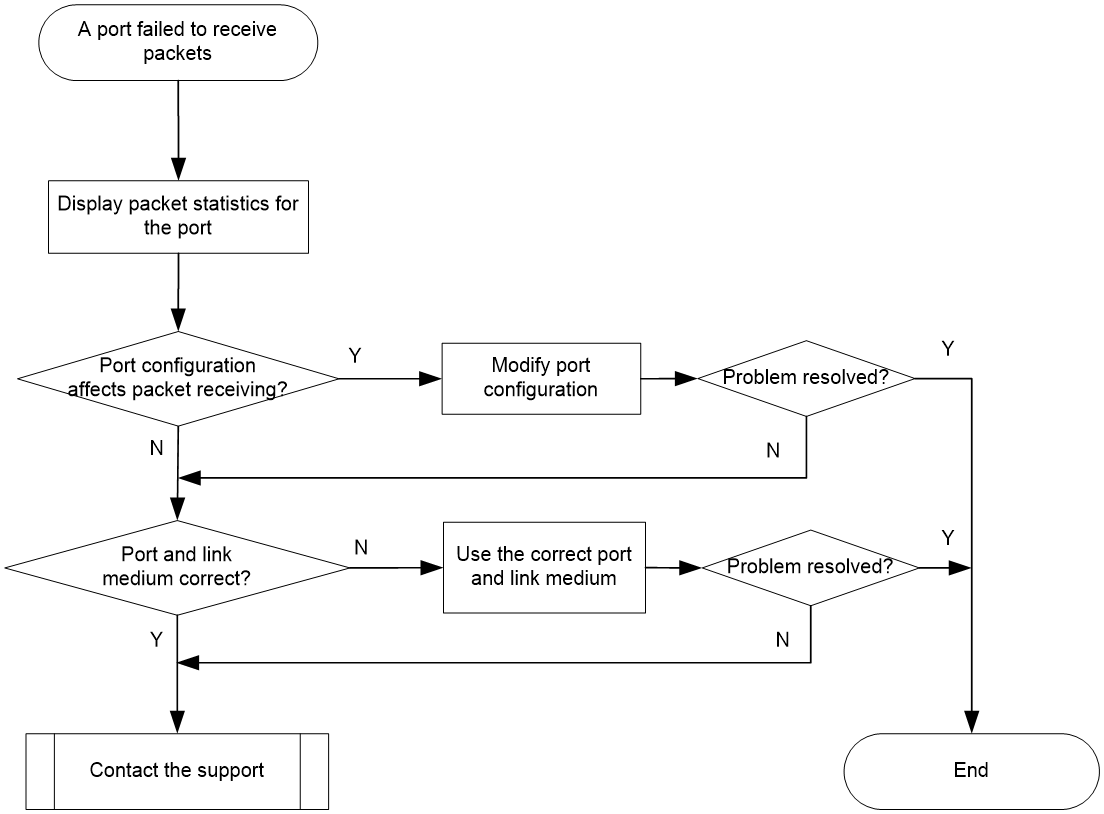
Solution
To resolve the issue:
1. Verify that the ports at both ends are up.
2. Examine the packet statistics of the port:
a. (Optional.) Use the reset counter interface command to clear the packet statistics of the port.
This command resets all packet counters to 0, so that you can view the statistics changes more clearly.
b. Use the display interface command to verify that the number of incoming packets is accumulating.
c. Verify that the number of error frames is not accumulating.
If the number of error frames is accumulating, remove the errors. For more information, see "Error frames (for example, CRC errors) on a port."
3. Verify that the port configurations do not affect packet receiving:
a. Use the display interface brief command to verify that the port configurations are correct.
The port configurations include the duplex mode, speed, port type, and VLAN configurations of the ports at both ends of the link. If configuration errors exist, modify the port configurations. If the port fails to receive packets, use the shutdown command and then the undo shutdown command to re-enable the port.
b. If the port is configured with the spanning tree feature, use the display stp brief command to verify that the port is not in the discarding state.
If the port is set to the discarding state by the spanning tree feature, examine and modify the spanning tree feature configurations to resolve the issue.
As a best practice, configure the port as an edge port or disable the spanning tree feature on the port if it is directly connected to a terminal.
c. If the port is in an aggregation group, use the display link-aggregation summary command to verify that the status of the port is Selected.
If the status of the port is Unselected, the port cannot send or receive data packets. Determine the reasons why the port becomes Unselected, for example, the attribute configurations of the port are different from the reference port. Modify the attribute configurations of the port to make the port become Selected.
4. Verify that the link medium connected to the port is operating correctly.
Plug the link medium into a new port that is operating correctly. If the new port cannot receive packets, replace the link medium.
5. Verify that the port is operating correctly:
¡ If the port is a copper port, connect the port directly to a PC.
¡ If the port is a fiber port, replace the transceiver module in the port.
If the port can receive packets, troubleshoot the remaining possible points of failure on the transmission path. The troubleshooting process is beyond the scope of this document.
6. If the issue persists, contact H3C Support.
Failure to send packets
Symptom
A port is up, but it cannot send packets.
Troubleshooting flowchart
Figure 12 Troubleshooting failure to send packets

Solution
To resolve the issue:
1. Verify that the ports at both ends are up.
2. Examine the packet statistics of the port:
a. (Optional.) Use the reset counter interface command to clear the packet statistics of the port.
This command resets all packet counters to 0, so that you can view the statistics changes more clearly.
b. Use the display interface command to verify that the number of outgoing packets is accumulating.
c. Verify that the number of error frames is not accumulating.
If the number of error frames is accumulating, remove the errors. For more information, see "Error frames (for example, CRC errors) on a port."
3. Verify that the port configurations do not affect packet sending:
a. Use the display interface brief command to verify that the port configurations are correct.
The port configurations include the duplex mode, speed, port type, and VLAN configurations of the ports at both ends of the link. If configuration errors exist, modify the port configurations. If the port fails to send packets, use the shutdown command and then the undo shutdown command to re-enable the port.
b. If the port is configured with the spanning tree feature, use the display stp brief command to verify that the port is not in the discarding state.
If the port is set to the discarding state by the spanning tree feature, examine and modify the spanning tree feature configurations to resolve the issue.
As a best practice, configure the port as an edge port or disable the spanning tree feature on the port if it is directly connected to a terminal.
c. If the port is in an aggregation group, use the display link-aggregation summary command to verify that the status of the port is Selected.
If the status of the port is Unselected, the port cannot send or receive data packets. Determine the reasons why the port becomes Unselected, for example, the attribute configurations of the port are different from the reference port. Modify the attribute configurations of the port to make the port become Selected.
4. Verify that the link medium connected to the port is operating correctly.
Plug the link medium into a new port that is operating correctly. If the new port cannot send packets, replace the link medium.
5. Verify that the port is operating correctly:
¡ If the port is a copper port, connect the port directly to a PC.
¡ If the port is a fiber port, replace the transceiver module in the port.
If the port can send packets, troubleshoot the remaining possible points of failure on the transmission path. The troubleshooting process is beyond the scope of this document.
6. If the issue persists, contact H3C Support.
Related commands
This section lists the commands that you might use for troubleshooting ports.
|
Command |
Description |
|
display current-configuration |
Displays current configuration. |
|
display diagnostic-information |
Displays or saves running status data for multiple feature modules. |
|
display interface |
Displays Ethernet interface information. |
|
display interface brief |
Displays brief interface information. |
|
display link-aggregation summary |
Displays the summary information for all aggregation groups. |
|
display logbuffer |
Displays the state of the log buffer and the log information in the log buffer. |
|
display stp brief |
Displays brief spanning tree status and statistics. |
|
display transceiver alarm interface |
Displays the current transceiver module alarms. |
|
display transceiver diagnosis |
Displays the present measured values of the digital diagnosis parameters for transceiver modules. |
|
display transceiver interface |
Displays the key parameters of transceiver modules. |
|
display transceiver manuinfo interface |
Displays electronic label information for the transceiver module in an interface. |
Troubleshooting EVPN
This section provides troubleshooting information for common issues with EVPN.
EBGP or IBGP neighbor relationship setup failure
Symptom
Two devices cannot set up an EBGP or IBGP neighbor relationship.
Troubleshooting flowchart
Figure 13 Troubleshooting EBGP or IBGP neighbor relationship setup failure
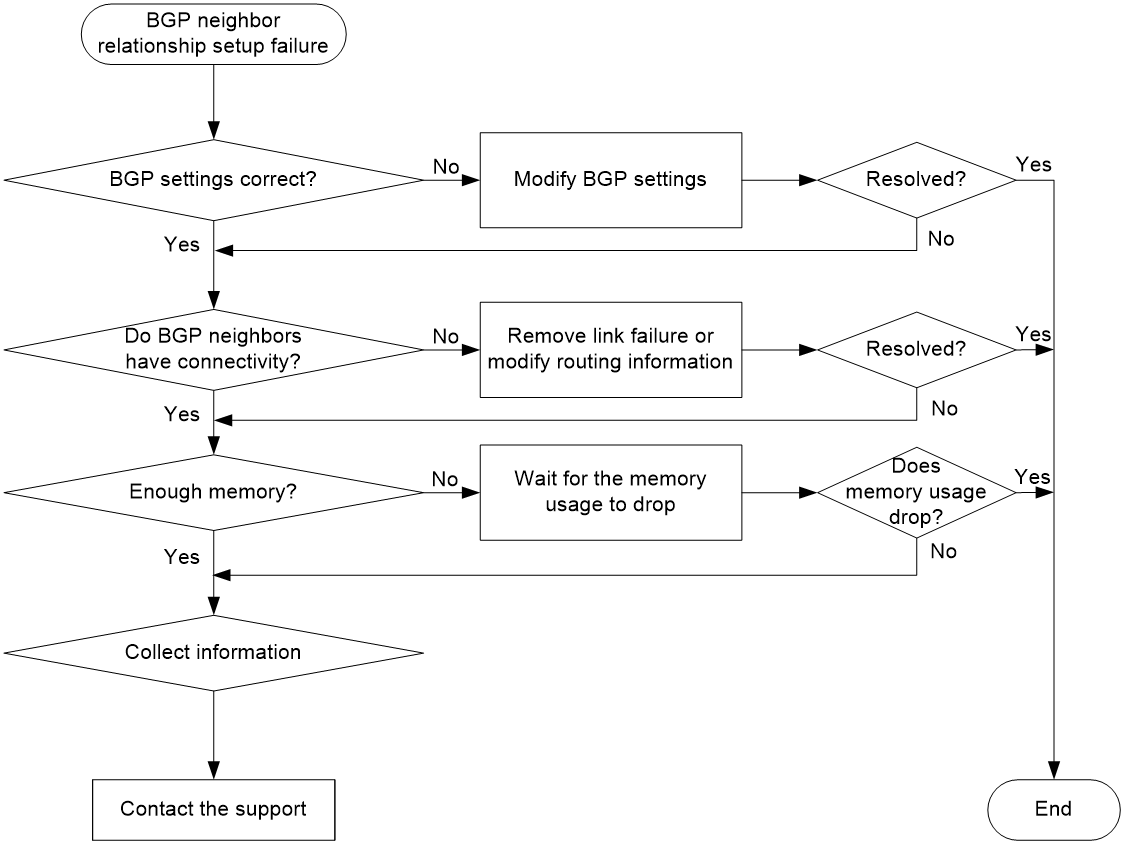
Solution
To resolve the issue:
1. Verify that BGP is correctly configured:
a. Execute the display bgp peer l2vpn evpn command on the devices to view their BGP settings.
b. Verify that the EBGP or IBGP peers on the devices have matching AS numbers. If the AS numbers do not match, use the peer as-number command to modify the AS numbers.
c. Verify that the devices use different router IDs. If the devices use the same router ID, use the router-id command to modify the router ID of one device.
2. Verify that the devices have connectivity:
a. Verify that one device can ping the other device.
b. If the ping fails, check for link failure and verify that the devices have routes to each other.
3. Verify that the memory usage of each device is below the critical alarm threshold:
a. Execute the display memory-threshold command on each device to view its memory usage.
b. Verify that the memory usage is below the critical alarm threshold in the last 10 minutes.
c. If the memory usage stays above the critical alarm threshold, contact H3C Support.
4. Perform the following tasks to collect information and contact H3C Support:
a. Execute the debugging bgp event command to view possible causes for neighbor relationship setup failure, such as connection setup errors and connection conflicts.
b. Execute the debugging bgp open command to view errors in OPEN message transmission and receipt.
c. Execute the debugging tcp packet command to view TCP packet exchange failure.
d. Execute the display bgp peer l2vpn evpn verbose command to view neighbor address family negotiation information and packet transmission and receipt history.
e. Execute the display bgp peer l2vpn evpn log-info command to view neighbor status changes and neighbor down reasons.
f. Execute the display system internal bgp peer l2vpn evpn session statistics command to view session status details.
ECMP forwarding failure
Symptom
In an EVPN network, the device cannot forward packets through ECMP routes.
Troubleshooting flowchart
Figure 14 Troubleshooting ECMP forwarding failure
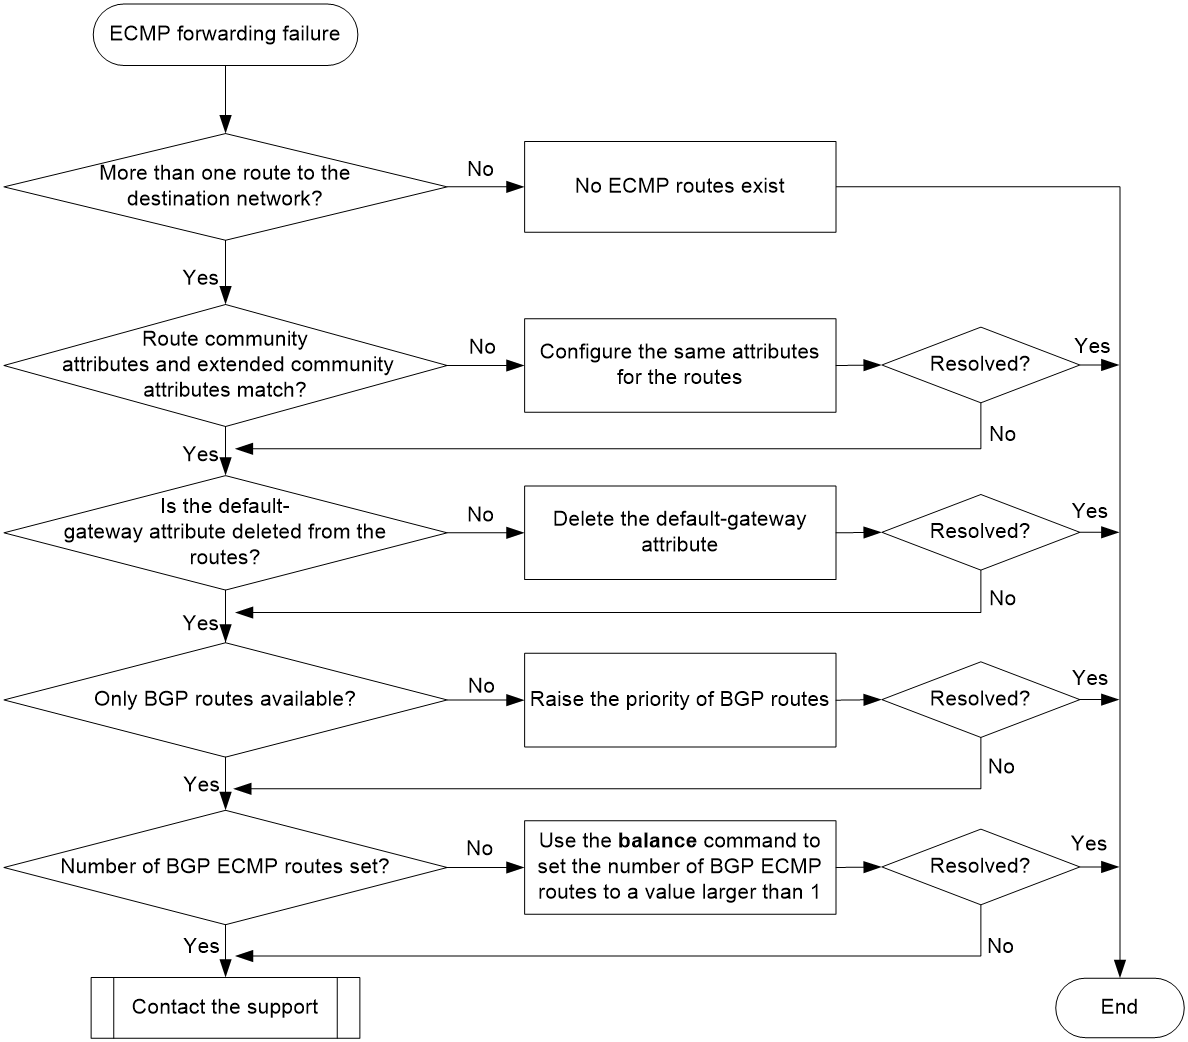
Solution
To resolve the issue:
1. Verify that the device has routes to the destination network:
a. Execute the display bgp l2vpn evpn route-distinguisher route-type ip-prefix command.
b. Verify that the device has routes to the destination network.
The routes must have the same RD and different next hops. If only one route exists, ECMP forwarding cannot be performed.
2. Verify that the routes have the same community attributes and extended community attributes:
a. Execute the display bgp l2vpn evpn route-distinguisher route-distinguisher evpn-route route-length command.
b. Verify that the routes have the same BGP community attributes and extended community attributes.
c. If the routes have different BGP community attributes and extended community attributes, modify the attributes.
3. Verify that the routes do not have the default-gateway attribute:
a. Execute the display bgp l2vpn evpn route-distinguisher route-distinguisher evpn-route route-length command.
b. Verify that the routes do not have the default-gateway attribute. Routes with this attribute cannot act as ECMP routes.
c. If the routes have the default-gateway attribute, delete the attribute.
4. Verify that the routes are all BGP routes:
a. Execute the display ip routing-table vpn-instance command.
b. Verify that the routes are all BGP routes.
c. If some of the routes are from other protocols, raise the priority of BGP routes by using the preference command.
5. Verify that the number of BGP ECMP routes is larger than one:
a. Execute the display bgp routing-table ipv4 vpn-instance command to verify that multiple routes have the same prefix.
b. If one of the routes that have the same prefix has the optimal sign (>), execute the display current-configuration configuration bgp command to verify that the balance command has been executed in BGP-VPN IPv4 unicast address family view.
c. If the balance command is not executed, use it to set the number of BGP ECMP routes to a value larger than 1.
6. If the issue persists, contact H3C Support.
Related commands
This section lists the commands that you might use for troubleshooting EVPN.
|
Command |
Description |
|
display bgp peer l2vpn evpn |
Displays BGP peer or peer group information for EVPN. |
|
display bgp l2vpn evpn |
Displays BGP EVPN routes. |
|
display ip routing-table vpn-instance |
Displays routing table information for VPN instances. |
|
display bgp routing-table ipv4 vpn-instance |
Displays BGP IPv4 unicast routing information for VPN instances. |
|
display evpn auto-discovery |
Displays information about peers that are automatically discovered through BGP. |
|
debugging bgp event |
Enables BGP event debugging. |
|
debugging bgp open |
Enables BGP OPEN message debugging. |
|
debugging tcp packet |
Enables TCP packet debugging. |
Troubleshooting system management
This section provides troubleshooting information for common system management issues.
High CPU utilization
Symptom
The sustained CPU utilization of the device is over 80%.
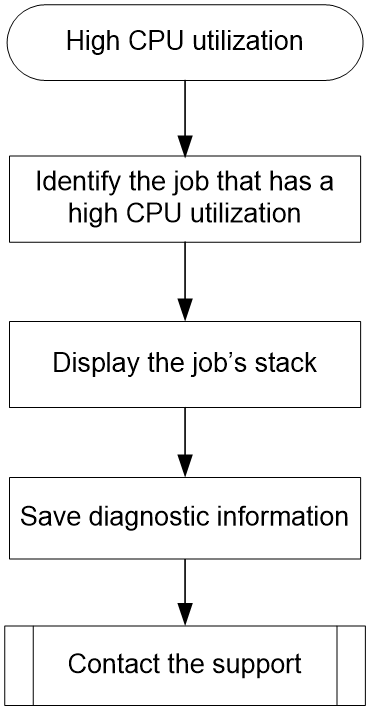
Troubleshooting flowchart
Figure 15 Troubleshooting high CPU utilization
Solution
To resolve the issue:
1. Identify the job that has a high CPU utilization.
<Sysname> system-view
[Sysname] probe
[Sysname-probe] display process cpu slot 1
CPU utilization in 5 secs: 3.7%; 1 min: 3.1%; 5 mins: 3.8%
JID 5Sec 1Min 5Min Name
1 0.0% 0.0% 0.0% scmd
2 0.0% 0.0% 0.0% [kthreadd]
3 0.0% 0.0% 0.0% [migration/0]
4 0.0% 0.0% 0.0% [ksoftirqd/0]
5 0.0% 0.0% 0.0% [watchdog/0]
6 0.0% 0.0% 0.0% [migration/1]
7 0.0% 0.0% 0.0% [ksoftirqd/1]
8 0.0% 0.0% 0.0% [watchdog/1]
9 0.0% 0.0% 0.0% [migration/2]
10 0.0% 0.0% 0.0% [ksoftirqd/2]
11 0.0% 0.0% 0.0% [watchdog/2]
12 0.0% 0.0% 0.0% [migration/3]
13 0.0% 0.0% 0.0% [ksoftirqd/3]
14 0.0% 0.0% 0.0% [watchdog/3]
15 0.0% 0.0% 0.0% [migration/4]
16 0.0% 0.0% 0.0% [ksoftirqd/4]
17 0.0% 0.0% 0.0% [watchdog/4]
18 0.0% 0.0% 0.0% [migration/5]
19 0.0% 0.0% 0.0% [ksoftirqd/5]
20 0.0% 0.0% 0.0% [watchdog/5]
21 0.0% 0.0% 0.0% [migration/6]
---- More ----
The output shows the average CPU usage values of jobs for the last 5 seconds, 1 minute, and 5 minutes. Typically, the average CPU usage of a job is less than 5%.
2. Display the job's stack. In this example, the job uses the ID of 14.
[Sysname-probe] follow job 14
Attaching to process 14 ([watchdog/3])
Iteration 1 of 5
------------------------------
Kernel stack:
[<80480754>] schedule+0x954/0x1250
[<8028f720>] watchdog+0xb0/0x410
[<802656d0>] kthread+0x130/0x140
[<8021d730>] kernel_thread_helper+0x10/0x20
Iteration 2 of 5
------------------------------
Kernel stack:
[<80480754>] schedule+0x954/0x1250
[<8028f720>] watchdog+0xb0/0x410
[<802656d0>] kthread+0x130/0x140
[<8021d730>] kernel_thread_helper+0x10/0x20
Iteration 3 of 5
------------------------------
Kernel stack:
[<80480754>] schedule+0x954/0x1250
[<8028f720>] watchdog+0xb0/0x410
[<802656d0>] kthread+0x130/0x140
[<8021d730>] kernel_thread_helper+0x10/0x20
Iteration 4 of 5
------------------------------
Kernel stack:
[<80480754>] schedule+0x954/0x1250
[<8028f720>] watchdog+0xb0/0x410
[<802656d0>] kthread+0x130/0x140
[<8021d730>] kernel_thread_helper+0x10/0x20
Iteration 5 of 5
------------------------------
Kernel stack:
[<80480754>] schedule+0x954/0x1250
[<8028f720>] watchdog+0xb0/0x410
[<802656d0>] kthread+0x130/0x140
[<8021d730>] kernel_thread_helper+0x10/0x20
3. Save the information displayed in the previous steps.
4. Contact H3C Support.
High memory utilization
Symptom
The memory utilization is over 60% for more than 30 minutes.
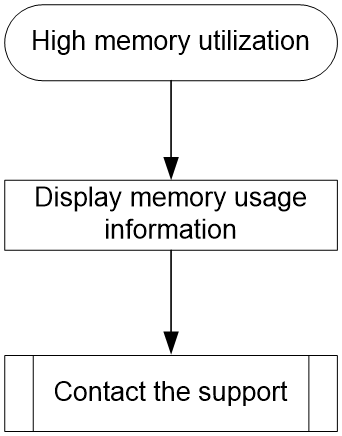
Troubleshooting flowchart
Figure 16 Troubleshooting high memory utilization
Solution
To resolve the issue:
1. Execute the display system internal kernel memory pool command multiple times to display memory usage information.
<Sysname> system-view
[Sysname] probe
[Sysname-probe] display system internal kernel memory pool slot 1
Active Number Size Align Slab Pg/Slab ASlabs NSlabs Name
2 10 3072 0 10 8 1 1 sgpool-128
0 0 900 0 34 8 0 0 LFIB_IlmEntryCache
0 0 656 0 23 4 0 0 MFW_FsCache
2 39 768 0 39 8 1 1 biovec-64
0 0 96 8 30 1 0 0 cfq_io_context
0 0 52 0 42 1 0 0 ARP_Static_Entry_Cachep
0 0 432 0 34 4 0 0 LFIB_IlmEntryCache
0 0 80 0 34 1 0 0 LFIB_NhlfeCacheCache
0 0 536 0 28 4 0 0 jffs2_i
11 92 52 4 46 1 2 2 pktpcb
1 26 576 0 26 4 1 1 shmem_inode_cache
515 650 256 8 25 2 24 26 kmalloc-256
0 0 1936 0 16 8 0 0 MFW_FsCache
0 42 4096 0 7 8 0 6 names_cache
0 0 1104 0 28 8 0 0 MFW_FsCache
0 0 336 4 21 2 0 0 ripcb
0 0 8 0 85 1 0 0 L2VFIB_Ac_Ctr_Cache
599 680 440 4 34 4 20 20 socket
0 0 104 0 28 1 0 0 memDSLITE
0 0 68 0 39 1 0 0 mfib_l2m_source_cache
16 26 108 0 26 1 1 1 ADJ4_Ext_Cachep
0 0 48 0 46 1 0 0 L2VFIB_LpwEntryCacheName(1)
---- More ----
Each value line shows the memory information for a slab. The Number field shows the number of objects (memory blocks) allocated to the module. The Active field shows the number of objects used. If the percentage of the used objects keeps increasing, the slab might have memory leakage issues.
2. Save the information displayed in the previous step.
3. Contact H3C Support.
|
|
IMPORTANT: As a best practice, do not reboot the device before you contact H3C Support. You might lose critical diagnostic information if you reboot the device. |
Related commands
This section lists the commands that you might use for troubleshooting system management.
|
Command |
Description |
|
display cpu-usage |
Displays the current CPU usage statistics. |
|
display memory |
Displays memory usage statistics. |
|
display process cpu |
Displays the CPU usage statistics for jobs. |
|
display system internal kernel memory pool |
Displays memory block usage statistics. |
|
follow job job-id |
Displays the stack of a job. |
Troubleshooting other issues
Layer 2 forwarding failure
Symptom
Layer 2 packet loss occurs when the switch forwards packets to a peer on the same network segment and in the same VLAN.
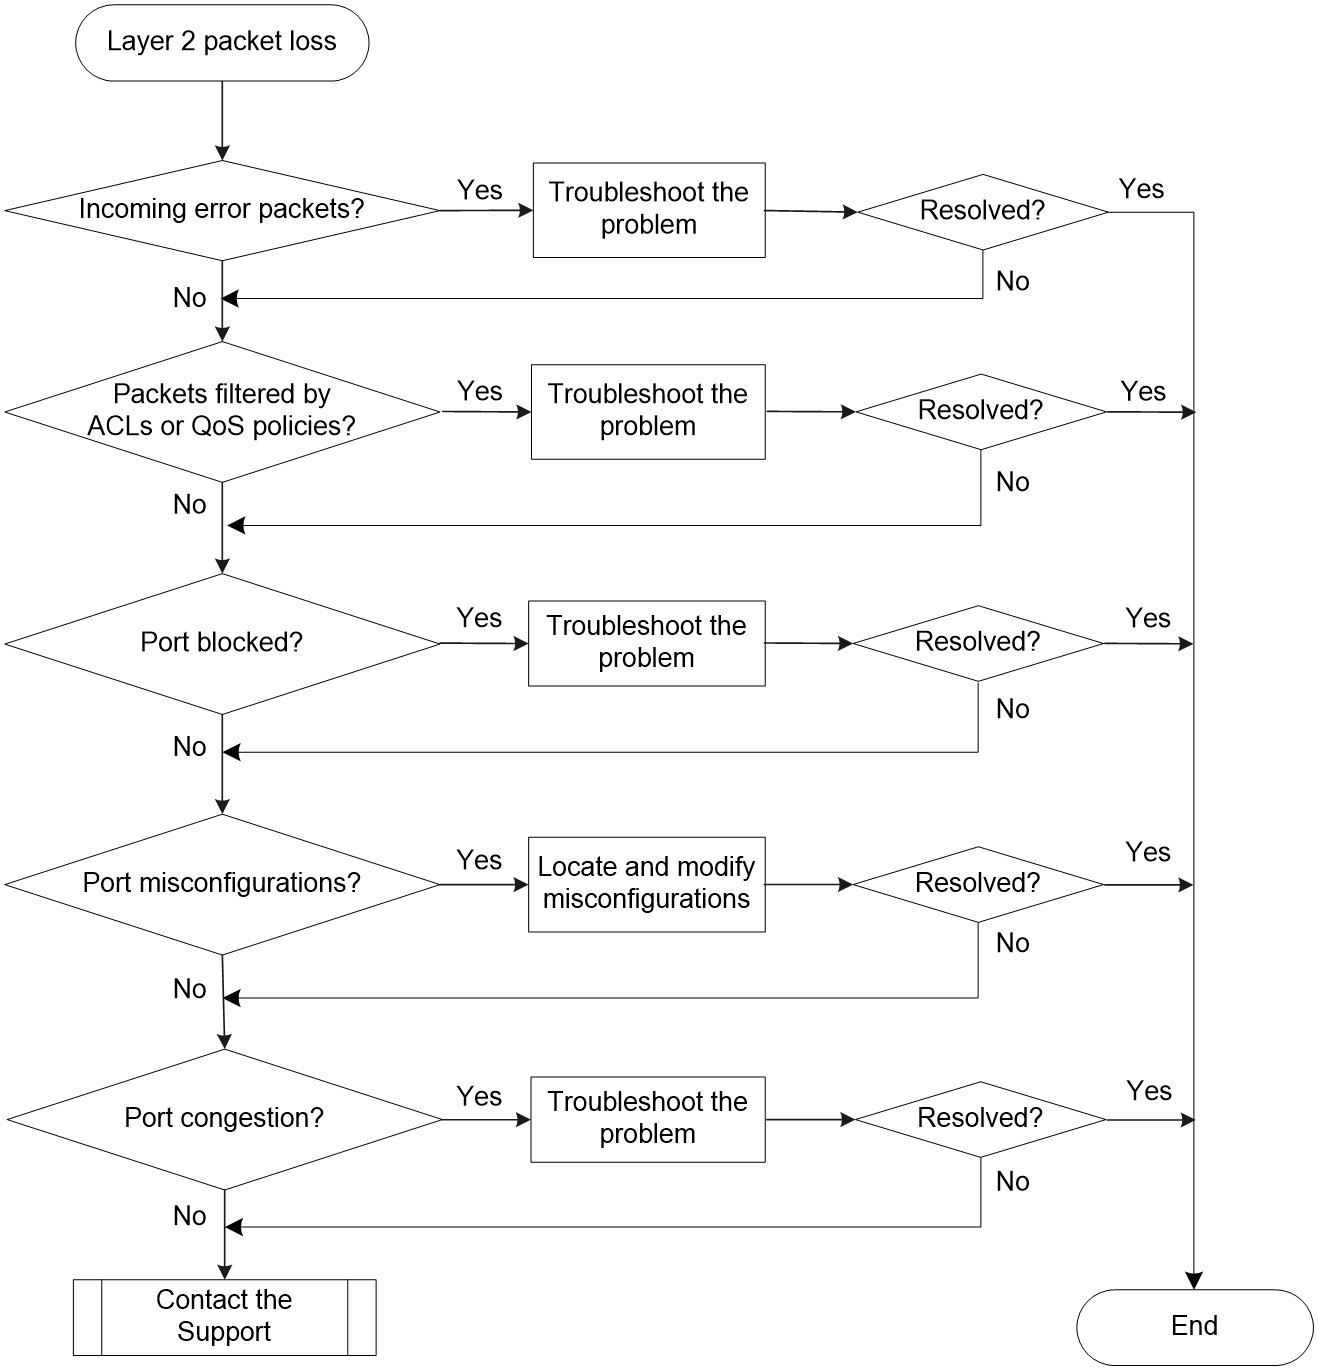
Troubleshooting flowchart
Figure 17 Troubleshooting Layer 2 packet loss failure
Solution
To resolve the issue:
1. Verify that no error packets have been received on the local port:
a. Execute the display interface command and check for error packets.
<Sysname>display interface hundredgige 1/0/32
HundredGigE1/0/32 current state: UP
Line protocol state: UP
IP Packet Frame Type: PKTFMT_ETHNT_2, Hardware Address: 000f-e200-002b
……
Last 300 seconds input: 0 packets/sec 10 bytes/sec 0%
Last 300 seconds output: 0 packets/sec 10 bytes/sec 0%
Input (total): 1438 packets, 480292 bytes
0 unicasts, 0 broadcasts, 1438 multicasts, 0 pauses
Input (normal): 1438 packets, - bytes
0 unicasts, 0 broadcasts, 1438 multicasts, 0 pauses
Input: 0 input errors, 0 runts, 0 giants, 0 throttles
0 CRC, 0 frame, - overruns, 0 aborts
- ignored, - parity errors
Output (total): 1440 packets, 475200 bytes
0 unicasts, 0 broadcasts, 1440 multicasts, 0 pauses
Output (normal): 1440 packets, - bytes
0 unicasts, 0 broadcasts, 1440 multicasts, 0 pauses
Output: 0 output errors, - underruns, - buffer failures
0 aborts, 0 deferred, 0 collisions, 0 late collisions
0 lost carrier, - no carrier
b. If the statistics are not zero, the following failures might occur:
- Interface hardware failure—To test such a failure, connect the cable that is connected to the local port to a correctly operating port (for example, Port A) with the same configurations as the local port. If Port A forwards traffic correctly, you can determine that the hardware of the local port fails. In this event, you must replace the local port with a correctly operating port.
- Transceiver module, fiber, or twisted pair failure—To test and resolve such a failure, replace the transceiver module, fiber, or twisted pair with a good one.
- Inconsistent configurations—Verify that the configurations (including speed and duplex mode) of the peer are consistent with the local port. If they are inconsistent, modify the configurations of the local port.
c. If the issue persists, contact H3C Support. Before contacting H3C Support, first collect information as follows:
# Execute the probe command to enter probe view, and execute the debug port map command to determine the chip port corresponding to the port on the panel.
[Sysname-probe] debug port map slot 1
[Interface] [Unit] [Port] [Name] [Combo?] [Active?] [IfIndex] [MID] [Link] [Pipe
Num] [PhyAddr]
================================================================================
==============
HGE1/0/1 0 38 ce8 no no 0x1 64 down 1
161
HGE1/0/2 0 34 ce7 no no 0x6 64 down 1
160
WGE1/0/3:1 0 42 xe31 no no 0xc 64 down 1
162
WGE1/0/3:2 0 43 xe32 no no 0xd 64 down 1
162
WGE1/0/3:3 0 44 xe33 no no 0xe 64 down 1
162
WGE1/0/3:4 0 45 xe34 no no 0xf 64 down 1
162
HGE1/0/4 0 46 ce9 no no 0x10 64 down 1
163
HGE1/0/5 0 54 ce11 no no 0x15 64 down 1
21
HGE1/0/6 0 50 ce10 no no 0x1a 64 down 1
20
HGE1/0/7 0 58 ce12 no no 0x1f 64 down 1
22
HGE1/0/8 0 62 ce13 no no 0x24 64 down 1
23
HGE1/0/9 0 72 ce15 no no 0x29 64 down 2
1
HGE1/0/10 0 68 ce14 no no 0x2e 64 down 2
0
HGE1/0/11 0 76 ce16 no no 0x33 64 down 2
2
HGE1/0/12 0 80 ce17 no no 0x38 64 down 2
3
HGE1/0/13 0 88 ce19 no no 0x3d 64 down 2
121
HGE1/0/14 0 84 ce18 no no 0x42 64 down 2
120
HGE1/0/15 0 92 ce20 no no 0x47 64 down 2
122
HGE1/0/16 0 96 ce21 no no 0x4c 64 down 2
123
HGE1/0/17 0 106 ce23 no no 0x51 64 down 3
101
HGE1/0/18 0 102 ce22 no no 0x56 64 down 3
100
HGE1/0/19 0 110 ce24 no no 0x5b 64 down 3
102
HGE1/0/20 0 114 ce25 no no 0x60 64 down 3
103
HGE1/0/21 0 122 ce27 no no 0x65 64 down 3
61
HGE1/0/22 0 118 ce26 no no 0x6a 64 down 3
60
HGE1/0/23 0 126 ce28 no no 0x6f 64 down 3
62
HGE1/0/24 0 130 ce29 no no 0x74 64 down 3
63
HGE1/0/25 0 5 ce1 no no 0x79 64 down 0
85
HGE1/0/26 0 1 ce0 no no 0x7e 64 down 0
81
HGE1/0/27 0 9 ce2 no no 0x83 64 down 0
148
HGE1/0/28 0 13 ce3 no no 0x88 64 down 0
149
HGE1/0/29 0 21 ce5 no no 0x8d 64 down 0
41
HGE1/0/30 0 17 ce4 no no 0x92 64 down 0
40
XGE1/0/31:1 0 25 xe18 no no 0x98 64 down 0
42
XGE1/0/31:2 0 26 xe19 no no 0x99 64 down 0
42
XGE1/0/31:3 0 27 xe20 no no 0x9a 64 down 0
42
XGE1/0/31:4 0 28 xe21 no no 0x9b 64 down 0
42
HGE1/0/32 0 29 ce6 no no 0x9c 64 down 0
43
XGE1/0/33 0 66 xe50 no no 0xa1 64 up 1
5c
XGE1/0/34 0 100 xe75 no no 0xa2 64 down 2
58
# The output above shows that the chip port corresponding to HundredGigE 1/0/1 is ce8. Then, execute the following commands for two or more times. Identify whether the RDBGC (received dropped packet counter) and TDBGC (transmitted dropped packet counter) counters have values. If yes, send the information to Technical Support.
[Sysname-probe] bcm slot 1 chip 0 show/c/ce8
RDBGC2.xe0 : 8,118 +8,118
R511.xe0 : 8,118 +8,118
RPKT.xe0 : 8,118 +8,118
RMCA.xe0 : 8,118 +8,118
RPOK.xe0 : 8,118 +8,118
RBYT.xe0 : 2,726,553 +2,726,553
T511.xe0 : 8,208 +8,208
TPOK.xe0 : 8,208 +8,208
TPKT.xe0 : 8,208 +8,208
TMCA.xe0 : 8,208 +8,208
TBYT.xe0 : 2,741,472 +2,741,472
PERQ_PKT(3).xe0 : 8,208 +8,208
PERQ_BYTE(3).xe0 : 2,741,472 +2,741,472 330/s
2. Verify that packets are not mistakenly filtered out by ACLs:
a. Examine the ACL and QoS policy configurations for packet filtering on the port, on the VLAN of the port, or globally. If packets are mistakenly filtered out, modify the ACL or QoS policy configuration.
- To display the ACL configuration on the port for packet filtering, execute the display packet-filter command.
- To display the QoS policy configuration on the port, execute the display qos policy command.
- To display the QoS policy configuration on the VLAN of the port, execute the display qos vlan-policy command.
- To display the global QoS policy configuration, execute the display qos policy global command.
b. Verify that packets are not filtered out by ACLs automatically created by some features.
- Execute the display this command in Ethernet interface view to verify that the ip source binding or ip verify source command is configured on the port. To display source guard binding entries, execute the display ip source binding or display ipv6 source binding command. If IP source guard is configured but the packets match no entry, further troubleshoot the issue based on the way the binding entries are created.
- Determine whether the port is configured with the portal authentication. Packets of users that fail to pass the portal authentication will be dropped by the port. Use the display portal interface command to display the portal configuration information of the specified VLAN interface. Determine whether the portal authentication can be disabled based on the network conditions. To disable the portal authentication at Layer 3, use the undo portal server server-name command in VLAN interface view of the VLAN to which the port belongs.
3. Verify that the port is not blocked:
¡ Execute the display stp brief command to verify that STP does not set the state of the port to discarding. When the port is in discarding state, it cannot forward traffic. As a best practice, disable STP on the port or configure the port as an edge port if the port is connected to a terminal device.
¡ If the port belongs to an aggregation group, execute the display link-aggregation verbose command to identify the port status. When the port is an Unselected port, it cannot forward traffic. Locate the reasons why the port is in Unselected state. For example, the attribute configurations of the port are different from the configurations of the reference port.
¡ Identify whether the port is blocked by smart link. Use the display smart-link group command to view the port status. If the state of the port is STANDBY or DOWN, the port cannot forward traffic.
- If the state of the port is DOWN, locate the reason for the port to be down. The possible reasons include: its uplink device is configured with monitor link, the link of the port fails, or the port is shut down. Further troubleshoot the issue based on the reason for the port to be down.
- If the state of the port is STANDBY, perform an active/standby switchover in the smart link group.
4. Examine the following configurations that might cause packet loss:
¡ VLAN configuration—Execute the display this command in Ethernet interface view to verify that the port is in the VLAN of the packets. If it is not, add the port to the VLAN.
¡ Blackhole MAC address entries—Execute the display mac-address blackhole command to display blackhole MAC address entries. If the packets are discarded because they match a blackhole MAC address entry, delete the entry. To delete the blackhole MAC address entry, execute the undo mac-address blackhole mac-address vlan vlan-id command.
¡ Rate limit—Execute the display qos lr interface command to display the rate limit configuration on the port. If rate limit is configured on the port, make sure the committed information rate (CIR) and the committed burst size (CBS) are appropriate. To adjust the CIR and CBS values, execute the qos lr { inbound | outbound } cir committed-information-rate [ cbs committed-burst-size ] command.
¡ Storm suppression—Execute the display this command in Ethernet interface view to display the configuration of storm suppression. Storm suppression includes broadcast suppression, multicast suppression, and unknown unicast suppression. To adjust the suppression thresholds, execute the broadcast-suppression, multicast-suppression, and unicast-suppression commands, respectively.
5. Verify that no congestion occurs by using the display qos queue-statistics interface command.
If congestion occurs, locate and resolve the issue by referencing related congestion management documents.
6. If the issue persists, contact H3C Support.
Related commands
This section lists the commands that you might use for troubleshooting Layer 2 packet loss failure.
|
Command |
Description |
|
display interface |
Displays Ethernet interface information. |
|
display ip source binding/display ipv6 source binding |
Displays source guard binding entries. |
|
display link-aggregation verbose |
Displays detailed information about the aggregation groups that correspond to the aggregate interfaces. |
|
display mac-address blackhole |
Displays blackhole MAC address entries. |
|
display packet-filter |
Displays whether an ACL has been successfully applied to an interface for packet filtering. |
|
display portal interface |
Displays portal configuration and portal running state on an interface. |
|
display qos lr interface |
Displays the rate limit configuration and statistics on a specified interface or all the interfaces. |
|
display qos policy |
Displays user-defined QoS policy configuration information. |
|
display qos policy global |
Displays information about global QoS policies. |
|
display qos policy interface |
Displays information about the QoS policies applied to an interface or all interfaces. |
|
display qos queue-statistics interface |
Displays traffic statistics collected for an interface on a per-queue basis. |
|
display qos vlan-policy |
Displays information about QoS policies applied to VLANs. |
|
display smart-link group |
Displays information about the specified or all smart link groups. |
|
display this |
Displays the running configuration in the current view. |
Layer 3 forwarding failure
Symptom
Packet loss occurs when the switch forwards packets to a different network.
Troubleshooting flowchart
Figure 18 Troubleshooting Layer 3 forwarding failure
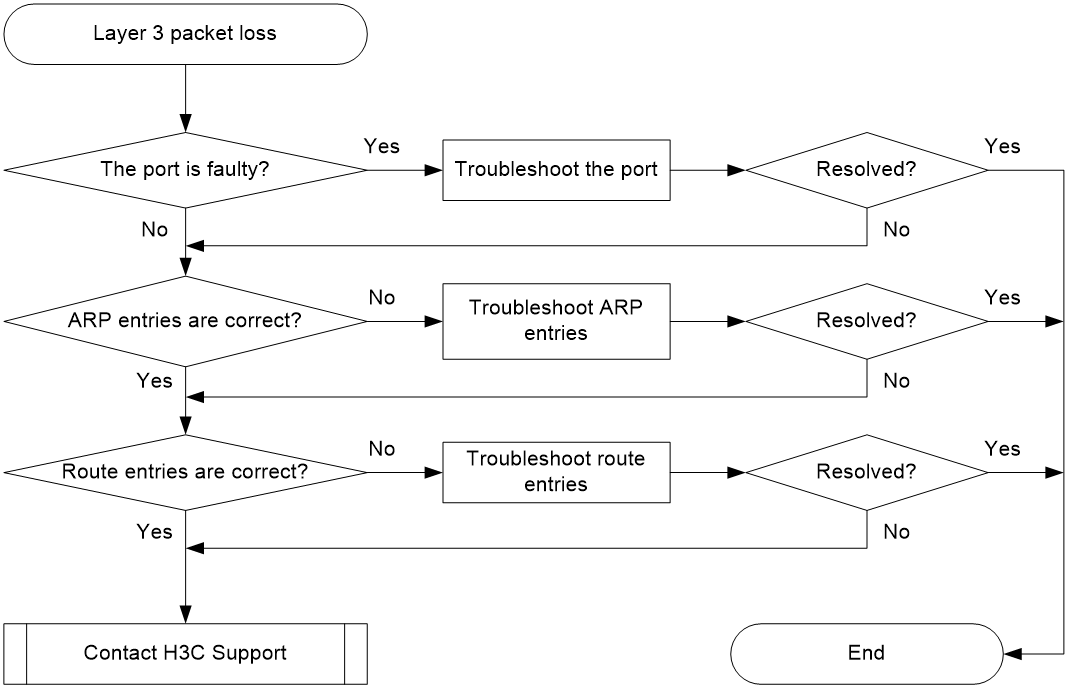
Solution
To resolve the issue:
1. Verify that the port is not faulty (due to hardware or configuration issues).
If the port is faulty, follow the solution in "Layer 2 forwarding failure" to troubleshoot the issue.
2. Verify that ARP entries for gateways are correct:
a. Execute the display arp command to verify that the ARP entries can be learned and the learned ARP entries are correct.
- If the ARP entries cannot be learned or the learned ARP entries are incorrect, execute the debugging arp packet command to locate the issue.
- If some ARP entries are not learned, you can execute the arp static command to configure these static ARP entries.
b. Execute the display mac-address command to verify that the output interfaces in the MAC address entries and ARP entries are the same.
If the output interfaces are different, execute the reset arp command to clear the ARP entries. Then the switch can learn ARP entries again.
3. Verify that route entries are correct:
a. Execute the display ip routing-table command to verify that route entries are correct.
If incorrect route entries exist, troubleshoot the protocol that learns the route entries.
b. Execute the display fib command to verify that the output interfaces in the FIB entries and route entries are the same.
If the output interfaces are different, execute the reset command to clear the route entries. Then the switch can learn route entries again.
4. If the issue persists, contact H3C Support.
Related commands
This section lists the commands that you might use for troubleshooting Layer 3 forwarding failure.
|
Command |
Description |
|
debugging arp packet |
Enables ARP packet debugging. |
|
display arp |
Displays ARP entries. |
|
display ip routing-table |
Displays brief information about active routes in the routing table. |
|
display mac-address |
Display MAC address entries |
|
display fib |
Display FIB entries |
Protocol flapping
Symptom
The switch cannot send or receive protocol packets.
Troubleshooting flowchart
Figure 19 Troubleshooting protocol flapping
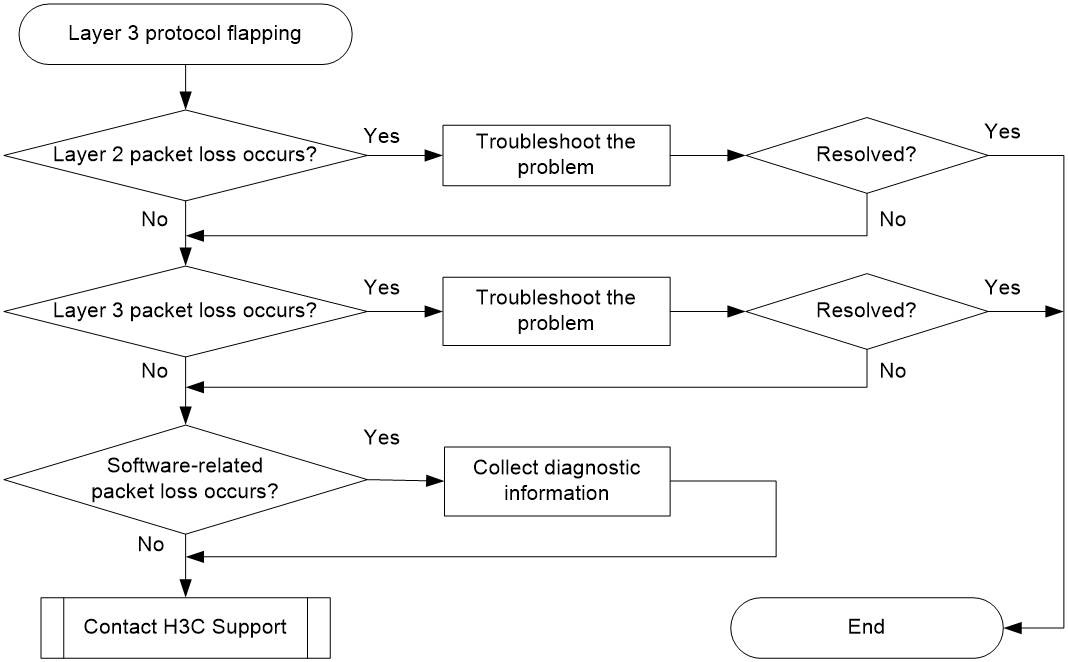
Solution
To resolve the issue:
1. Verify that Layer 2 is operating correctly, as described in "Layer 2 forwarding failure."
2. Verify that Layer 3 is operating correctly, as described in "Layer 3 forwarding failure."
3. Check for software-related packet loss.
[Sysname-probe] debug rxtx softcar show slot 1
ID Type RcvPps Rcv_All DisPkt_All Pps Dyn Swi Hash ACLmax
0 ROOT 0 0 0 300 S On SMAC 0
1 ISIS 0 0 0 200 D On SMAC 8
2 ESIS 0 0 0 100 S On SMAC 8
3 CLNP 0 0 0 100 S On SMAC 8
4 VRRP 0 0 0 1024 S On SMAC 8
5 UNKNOWN_IPV4MC 0 0 0 100 S On SMAC 8
6 UNKNOWN_IPV6MC 0 0 0 100 S On SMAC 8
7 IPV4_MC_RIP 0 0 0 150 D On SMAC 8
8 IPV4_BC_RIP 0 0 0 150 D On SMAC 8
…(omitted)
4. If the issue persists, contact H3C Support.
When you contact H3C Support, provide diagnostic information if software-related packet loss occurred.
