- Released At: 11-03-2025
- Page Views:
- Downloads:
- Table of Contents
- Related Documents
-
H3C U-Center 5.0 Troubleshooting Guide
Document version: 5W100-20250227
Copyright © 2025 New H3C Technologies Co., Ltd. All rights reserved.
No part of this manual may be reproduced or transmitted in any form or by any means without prior written consent of New H3C Technologies Co., Ltd.
Except for the trademarks of New H3C Technologies Co., Ltd., any trademarks that may be mentioned in this document are the property of their respective owners.
The information in this document is subject to change without notice.
Contents
The server and storage menus are not available
Failed to add monitoring resources
Local agent installation failed
Remote agent installation failed
The installation process completed without errors, but the page displays no data
Troubleshooting common Oracle monitoring issues
Troubleshooting common iom log issues
Failed to detect or add monitoring resources for server/storage
Device information collection failed, prompting key unavailability
Device information collection failed, prompting key verification failure
The service score data is incorrect
The top navigation bar does not display the workflows tab
A collection metric is inconsistent with the metric on the resource maintenance page
Automatic generation of resource relationships failed
Failed to display the logical relationships or physical links generated by CMDB
Failed to synchronize CMDB configuration item changes in time
In the global Ops topology, the color of a node is inconsistent with the actual alarm data
No data for the traffic analysis tasks
Introduction
This document provides information about troubleshooting common issues with U-Center 5.0.
Restrictions and guidelines
To help identify the cause of the issue, collect detailed system and network information, including but not limited to the following:
· Record the U-Center 5.0 components and versions, Matrix version, and operating system version.
· Symptom, time of failure, and configuration.
· Network topology information, including the network diagram, port connections, and points of failure.
· Collect the log and diagnostic information (see "Collecting fault information").
· Record the operations that you have performed and their effects.
Applicable component versions
Unless otherwise stipulated, this guide applies to all U-Center 5.0 versions.
Collecting fault information
You can collect the U-Center 5.0 running information as follows:
1. Enter the U-Center 5.0 login address http://ip_address:30000 in a browser and press Enter. Enter the username and password, and then click Log In.
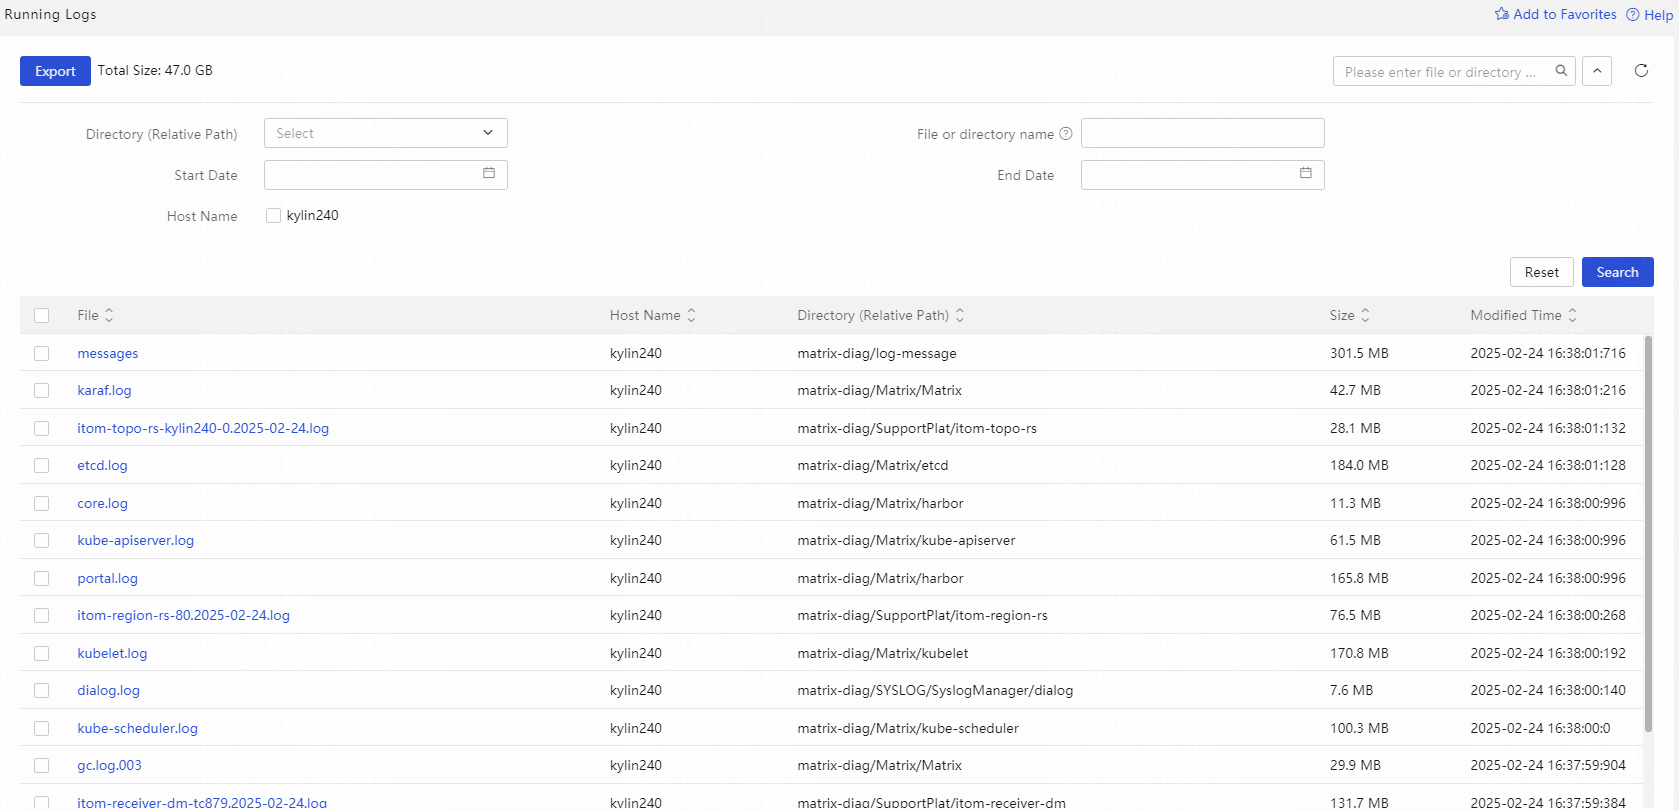
2. On the U-Center 5.0 Web interface, navigate
to the System > Log Management
> Diag Log List page to access the running log
entries page. You can click the ![]() icon at the top right of the page to use the advanced filter tool,
as shown in Figure 1. You can
perform the following tasks:
icon at the top right of the page to use the advanced filter tool,
as shown in Figure 1. You can
perform the following tasks:
¡ Specify the directory (relative path), file or directory name, start time, end time, and node name to view the related log files.
¡ Select the target logs and click Export to export the selected logs to your local host. If you click Export without selecting any logs, all logs will be exported.
Figure 1 Running log entries page
Technical support
If you cannot resolve the fault, collect the device running information and fault information, and contact Technical Support at email address [email protected]
Troubleshooting IOM
The server and storage menus are not available
Symptom
The Web interface does not display server or storage menus.
Troubleshooting procedure
If the Web interface does not display server or storage menus, perform the following tasks:
1. Verify that the following licenses exist on the license server:
¡ H3C U-Center2.0, IOM License (IOM feature license)
¡ H3C U-Center2.0, IOM, XXX License (IOM quantity license)
¡ H3C U-Center2.0, Intelligent Operations Platform Software
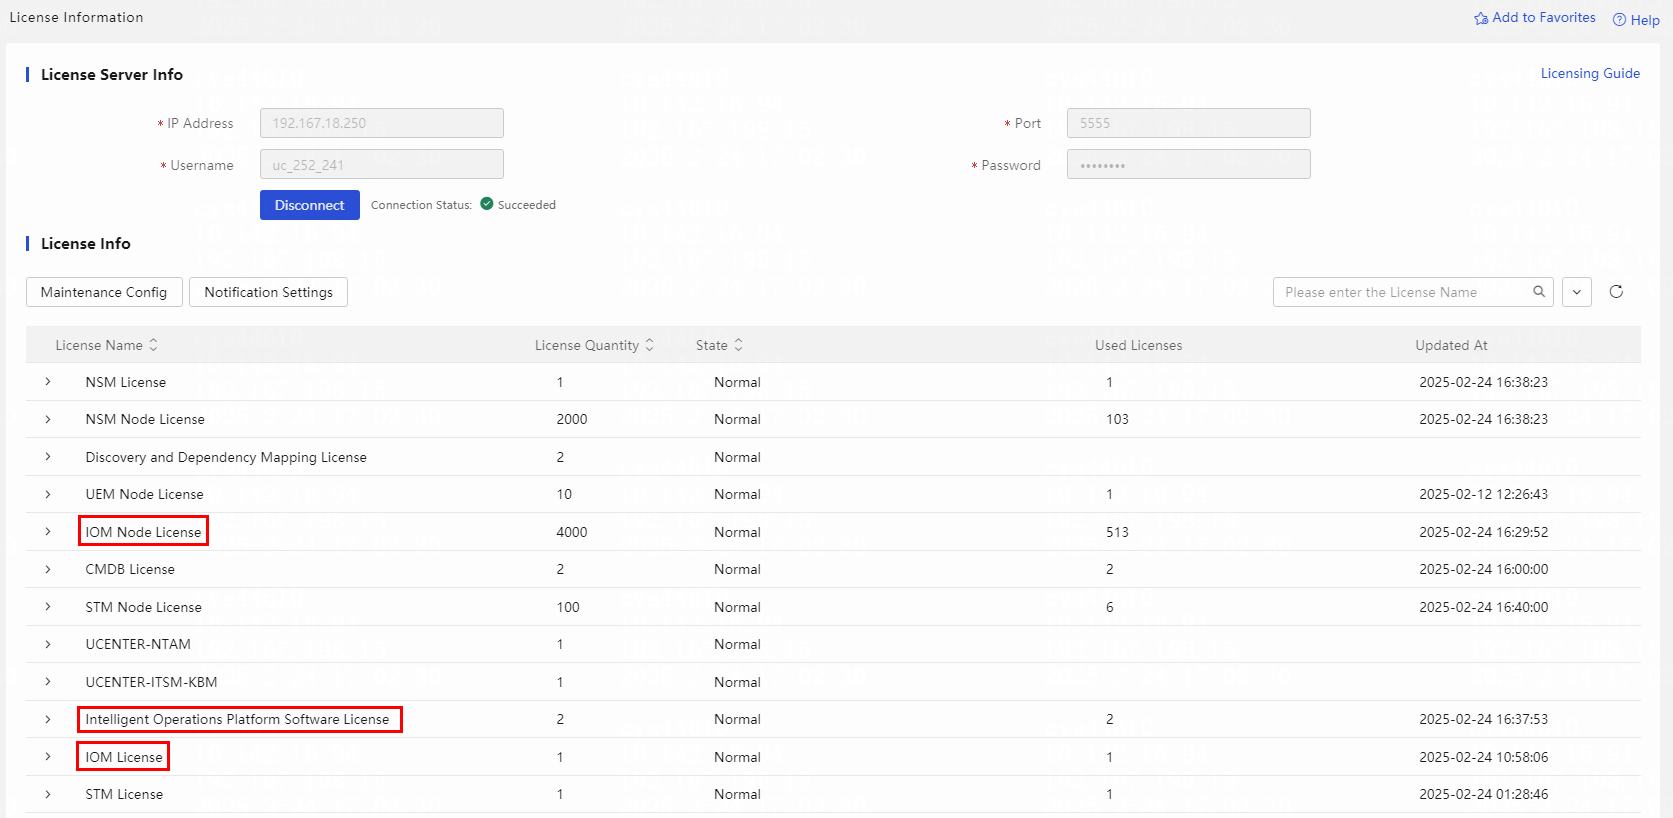
2. Log in to U-Center 5.0, access the System > License Management > License Information page, and identify whether the license list contains the following three licenses:
Figure 3 License information
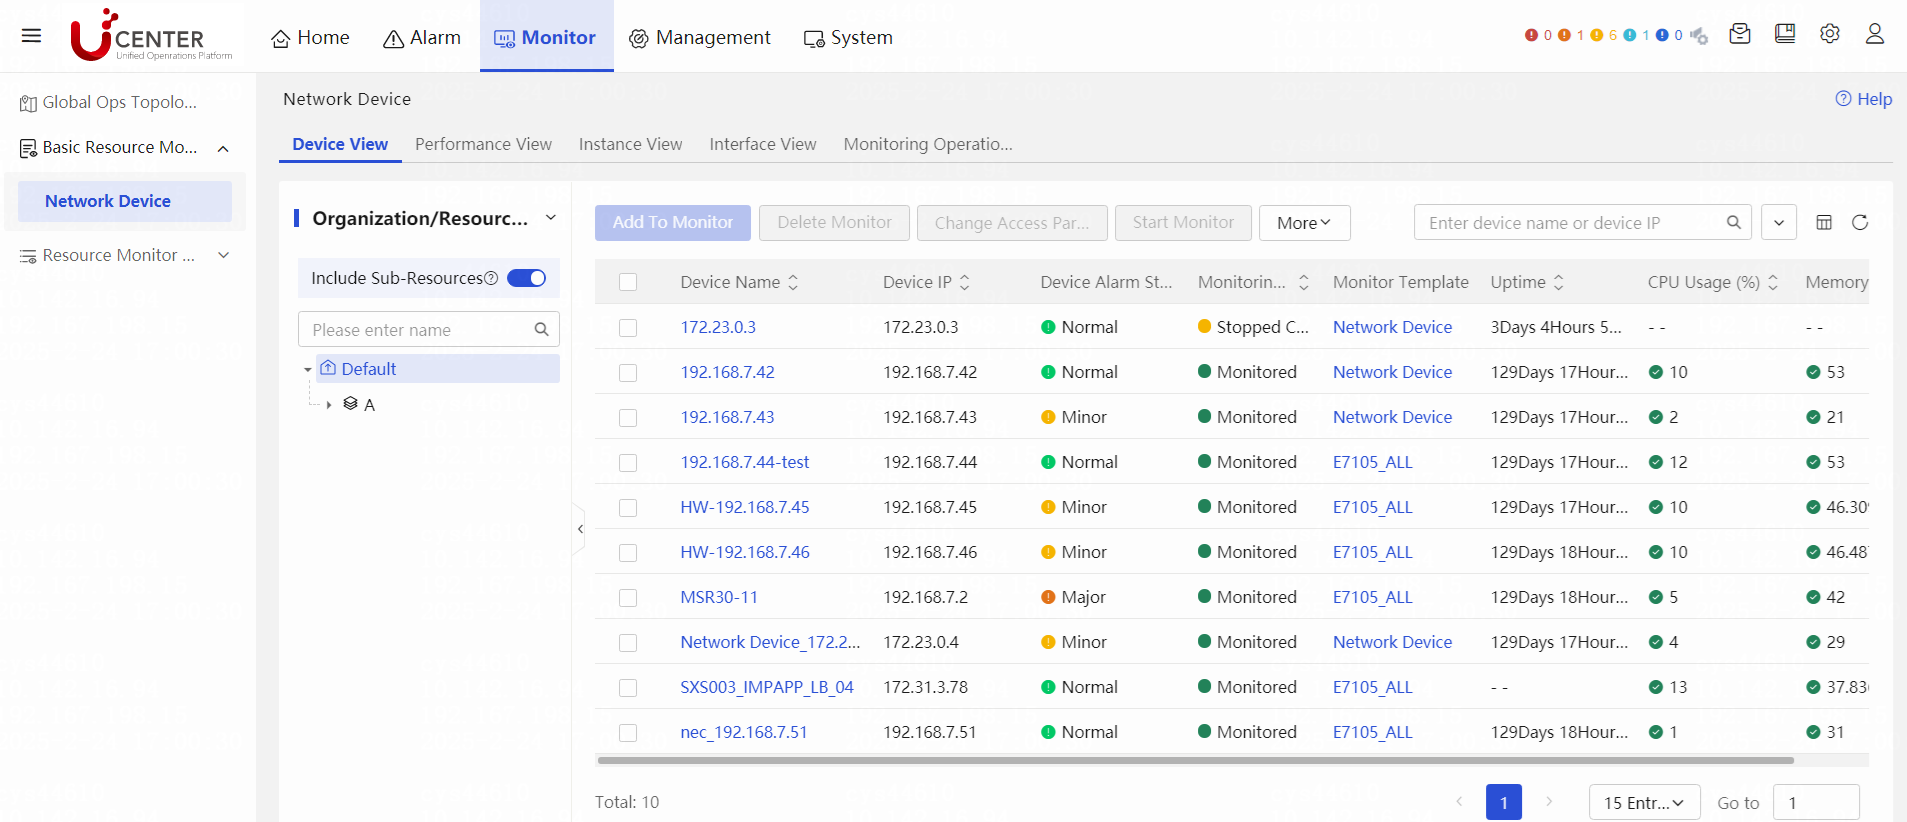
3. Identify whether the IOM package is installed and whether the service is running correctly.
Figure 4 Identify whether IOM is installed
![]()
4. If the issue persists, obtain detailed information including the version, environment, issue description, screenshots, and logs, and then contact Technical Support.
Service not started
Symptom
If the IOM service is not running, the page will display request failure or 404 NOT FOUND messages.
Troubleshooting procedure
If the IOM service is not running, perform the following tasks:
1. Verify that the IOM package is installed with adequate, and the upgrade path is correct.
2. Identify whether the service pod is running correctly. For example:
[root@ucenter1 ~]# kubectl -n service-software get po | grep iom
iom-77576568d-z6hd4 1/1 Pending 0 2d20h
3. If the state is pending, the possible reason is insufficient environment resources. Execute the following command to locate the detailed cause:
kubectl -n service-software describe po pod name
For example:
kubectl -n service-software describe po iom-77576568d-z6hd4
4. The Events content shows the detailed cause for the pod scheduling failure, for example, insufficient CPU or memory resources.
Figure 5 Events content
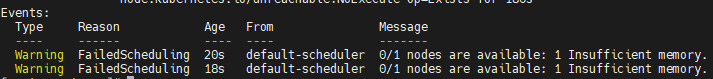
5. If the issue persists, obtain detailed information including the version, environment, issue description, screenshots, and logs, and then contact Technical Support.
No threshold alarms exist
Symptom
The thresholds configured in the monitoring template cannot trigger alarms.
Troubleshooting procedure
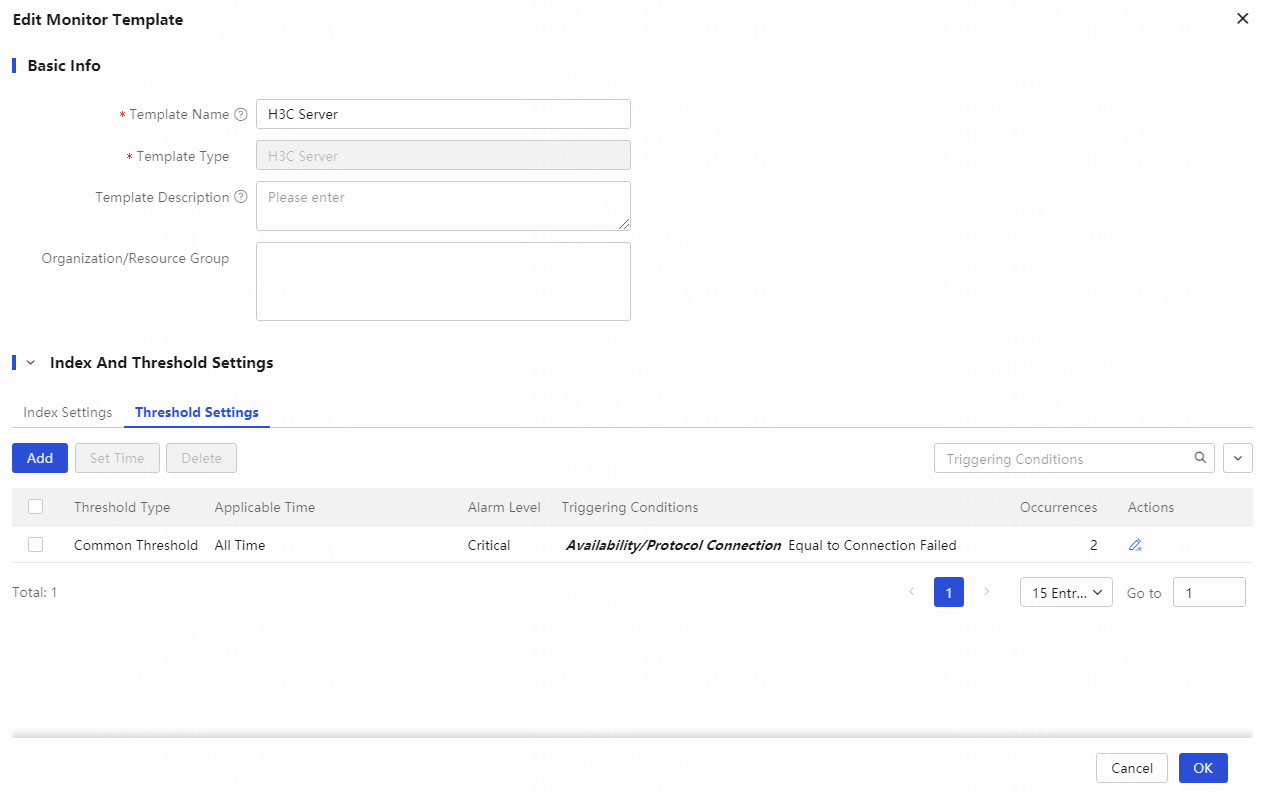
1. Verify that the threshold settings in the monitor template are correct. For example, whether the operators are correct, threshold alarm is enabled, and the number of triggering times is reached.
Figure 6 Threshold configuration
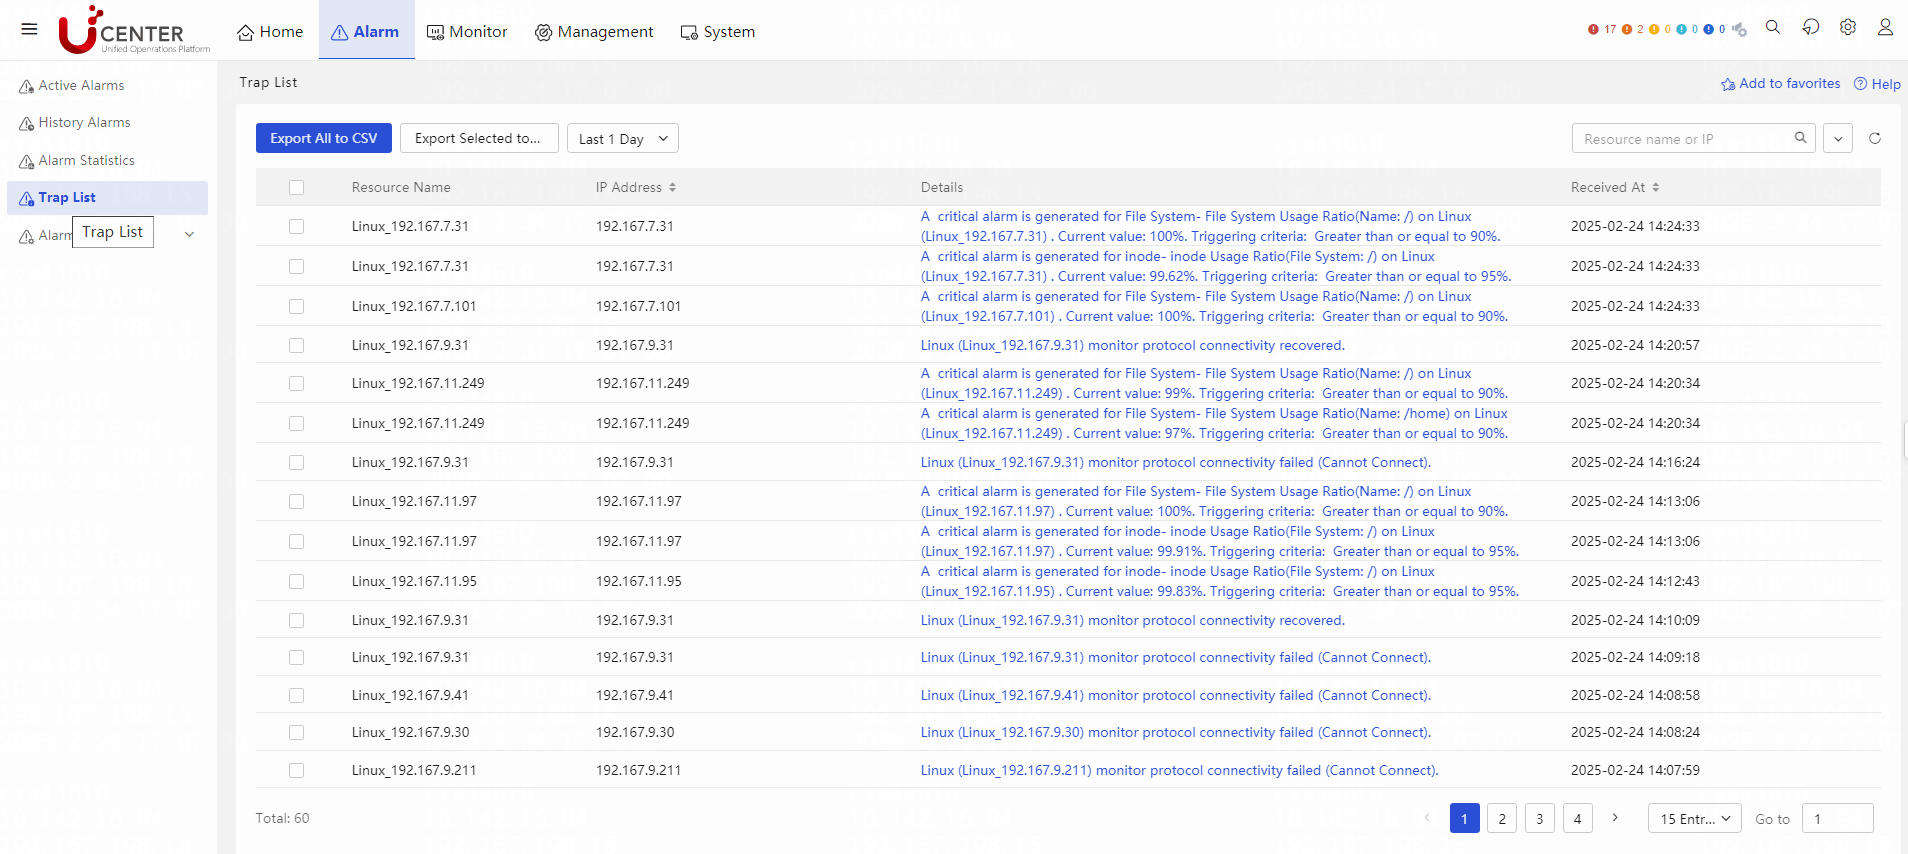
2. Access the Alarm > Trap List page to identify whether the alarm trap has been sent, whether it has been filtered, and whether alarm rules have been configured.
Figure 7 Checking the alarm traps
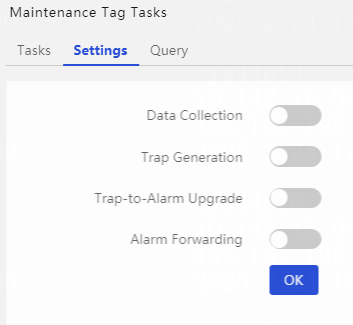
3. Identify whether the monitoring status is listing and whether the related configuration parameter for listing has been disabled.
Figure 8 Listing configuration
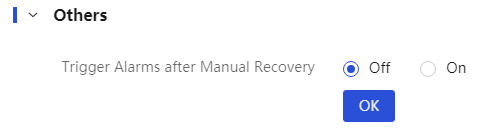
4. Identify whether the alarm has been manually cleared and whether the Continue to trigger after manual alert clearance parameter is disabled on the Monitor > Resource Monitor Settings > Parameter Settings page.
Figure 9 Parameter configuration
5. Identify whether the ucp-collectplat-alarmcalculator and itom-alarm-go-dm services are running correctly.
6. If the issue persists, obtain detailed information including the version, environment, issue description, screenshots, and logs, and then contact Technical Support.
No metric data
Symptom
No data is collected for monitoring metrics.
Troubleshooting procedure
1. Identify whether the monitoring template in use has been configured with the metric group and metrics.
2. (When no data is collected for all metrics) Identify whether the monitoring resource is in listing state and whether data collection is disabled on the Monitor > Resource Monitor Settings > Listing Tasks > Listing Configuration page.
3. Review the log files for the Java collector and C++ collector (for SSH, TELNET, SNMP, WMI, and PING protocols, check the C++ collector logs. For other protocols, check the Java collector logs).
¡ Java collector search keywords: <appType>-<metric group id>-<monitoring resource id>, for example, cas-vmNet-361576116784069.
¡ C++ collector search keywords: uuid=< monitoring resource id>_<collection task id>_<task version number> unitname=< metric group id>, for example, uuid=361576116781881_73_1 unitname=cpuinfo_stat.
4. If the issue persists, obtain detailed information including the version, environment, issue description, screenshots, and logs, and then contact Technical Support.
Connectivity test timed out
Symptom
The connectivity test to the monitoring resource timed out.
Troubleshooting procedure
1. Identify whether the ucp-collectplat-taskdispatcher, iom-collector-java, iom-collector-cpp, itom-nta-receiver, itom-nta-dispenser, and ucp-etcd service pods are running correctly.
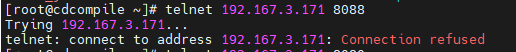
2. Log in to the U-Center 5.0 back-end server and use the telnet command to identify whether the IP and port are allowed.
Figure 10 Checking the IP and port
3. For Oracle and MySQL monitoring resources, use a third-party client tool to identify whether you can connect and access the resources within the same network as U-Center 5.0.
4. Use the tcpdump command to capture and analyze packets, and identify whether the network policies such as firewalls and network gateways are configured correctly.
5. If the issue persists, obtain detailed information including the version, environment, issue description, screenshots, and logs, and then contact Technical Support.
Failed to add monitoring resources
Symptom
Failed to add monitoring resources.
Troubleshooting procedure
1. Check the operation logs for issues such as duplicate names or existing resources.
2. If probe is enabled, verify that the probe is running correctly. For more information, see "No metric data" and "Connectivity test timed out." You can obtain the probe command from the test metric group configuration in the collection file.
3. If probe is disabled, check the iom logs. Identify whether obvious exceptions exist in the log file and whether any dependent component is running incorrectly.
4. If the issue persists, obtain detailed information including the version, environment, issue description, screenshots, and logs, and then contact Technical Support.
Agent installation failed
Local agent installation failed
Symptom
Local agent installation failed.
Troubleshooting procedure
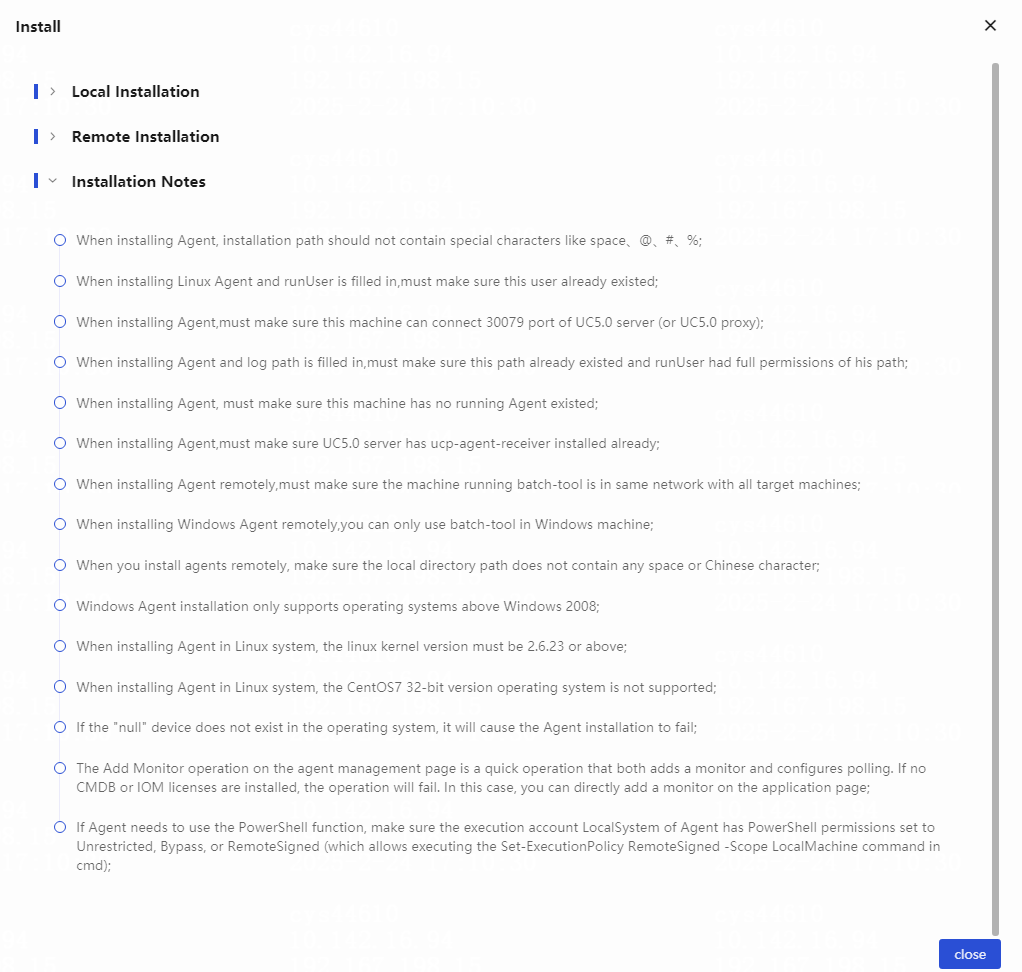
1. Troubleshoot by following the agent installation restrictions and guidelines.
Figure 11 Installation restrictions and guidelines
2. Address potential issues, including but not limited to:
¡ The agent cannot access the server through port 30079.
¡ The agent installation package is incorrect (for example, install a 64-bit package on a 32-bit system).
¡ An agent is already installed.
Figure 12 An agent is already installed
![]()
¡ The agent-daemon service remains after the last agent uninstallation.
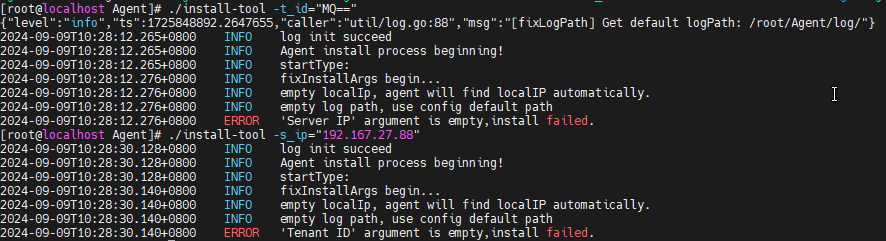
¡ Some required installation parameters are not configured.
Figure 13 Required installation parameters are not configured
Remote agent installation failed
Symptom
Remote agent installation failed. Check the batch-tool logs for any error messages and troubleshoot based on the information.
Troubleshooting procedure
1. Troubleshoot by following the agent installation restrictions and guidelines, as shown in Figure 11.
2. Address potential issues, including but not limited to:
¡ The IP address specified in the excel file is unreachable, the username or password is incorrect, or the specified path does not exist.
¡ An agent is already installed on the target device.
¡ The login account for the Linux device is not root.
¡ The target device does not have sufficient drive space (300MB free drive space is required).
¡ The target device cannot access the server through port 30079.
The installation process completed without errors, but the page displays no data
Symptom
The installation process completed without errors, but the page displays no data.
Troubleshooting procedure
1. Find the cause according to the agent installation restrictions and guidelines, as shown in Figure 11.
2. Identify whether the agent-main and agent-daemon processes are running correctly.
3. If the agent-daemon process is running correctly but the agent-main process is frequently terminated, perform the following tasks:
¡ Identify whether spaces or special characters such as @#% exist in the agent installation path.
¡ Identify whether the server IP and tenant ID are correct.
¡ Identify whether the agent can access the server through port 30079.
4. If both processes are running correctly and the above issues do not exist, identify whether the ucp-agent-manager and ucp-agent-receiver services on the server are running correctly without generating any errors.
5. If the issue persists, obtain detailed information including the version, environment, issue description, screenshots, and logs, and then contact Technical Support.
Troubleshooting common Oracle monitoring issues
Symptom
See Table 1.
Troubleshooting procedure
1. Check the Java collector logs.
Java collector search keywords: oracle-<metric group id>-<monitoring resource id>, for example, oracle-Tablespacestatus-361576116784069.
2. Resolve common Oracle monitoring issues in Table 1.
Table 1 Oracle metric group collection
|
Error log |
Reason |
|
ORA-00942: table or view does not exist |
The user permissions used for monitoring Oracle are insufficient. |
|
ORA-01013: user requested cancel of current operation |
The SQL execution time for data collection is too long, exceeding the specified query timeout, causing the query operation to be aborted. |
|
ORA-12505: TNS:listener does not currently know of SID given in connect descriptor |
Identify whether the Oracle Listener is running, whether the database is started, and whether the instance name is correctly specified. |
|
ORA-12514: TNS:listener does not currently know of service requested in connect descriptor |
Identify whether the Oracle Listener is running, whether the database is started, and whether the service name is correctly specified. |
3. If the issue persists, obtain detailed information including the version, environment, issue description, screenshots, and logs, and then contact Technical Support.
Troubleshooting common iom log issues
Symptom
See Table 2.
Troubleshooting procedure
1. Resolve common iom running log issues in Table 2.
Table 2 iom running logs
|
Error log |
Reason |
|
java.net.SocketTimeoutException: connect timed out |
Interface connection timed out. Identify whether the service is running according to the URL and whether the firewall allows the connection. |
|
java.net.UnknownHostException |
The IP address or k8s service is unreachable, which might be caused by uninstalled components, as indicated by errors such as java.net.UnknownHostException: itom-region-rs-svc. |
|
No token is found or the token has expired. |
Request token verification failed. |
|
java.net.ConnectException: Connection refused |
The connection is refused. Identify whether the port is occupied, whether the connected service is running, and whether the firewall configuration is correct. |
|
Calling the service interface returns 401, 403, and 500 status codes. |
When a 401 or 403 status code is returned, identify whether the current operator has the appropriate operation or resource permissions, such as permission to view the access parameter template. When a 500 status code is returned, identify whether the called service is running correctly and whether any errors exist in the service logs. |
2. If the issue persists, obtain detailed information including the version, environment, issue description, screenshots, and logs, and then contact Technical Support.
Failed to detect or add monitoring resources for server/storage
Symptom
Failed to detect or add monitoring resources for server/storage.
Troubleshooting procedure
1. Identify whether the username and password are correct.
2. Identify whether the port number is blocked by the firewall as follows:
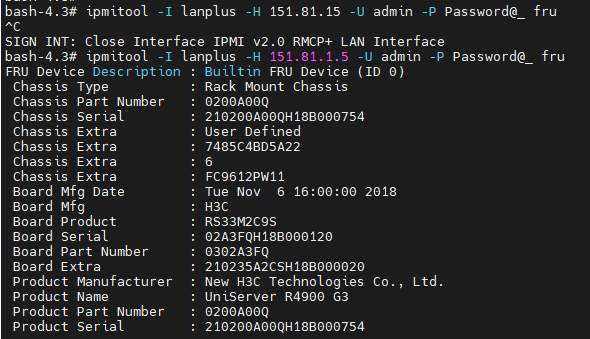
¡ IPMI: Access each pod of iom-collector-java. Execute the ipmitool -I lanplus -H ip -U username -P pwd fru command and check whether any data is returned. If no data is returned, identify whether all parameters are configured correctly. If all parameters are configured correctly, consult Technical Support.
Figure 14 IPMI test
¡ REST: Access each pod of iom-collector-java. Execute the curl --connect-timeout 20 -i -k -X POST scheme://ip:port/json/login_session -H "Content-Type: application/x-www-form-urlencoded" -H "accept: application/json" -d '{"method":"login","user_login":"username","password":"pwd"}' command, and check whether any data is returned. If no data is returned, identify whether all parameters are configured correctly. If all parameters are configured correctly, consult Technical Support.
Figure 15 REST test
![]()
¡ SMI-S: Enter any pod of iom-collector-java. Operate as described in "SMI-S toolkit usage methods," for example, execute the sh testClientSblim.sh 192.168.15.26 5989 /root/tpd 3paradm 3pardata false CIM_PRODUCT command and check whether any data is returned.
eportplat-rs-54b5874997-6759z:/opt/iMCReportPlatRS/log/k-reportplat-rs-54b5874997-6759z.2021-05-25.log.zip /root/k-reportplat-rs-54b5874997-6759z.2021-05-25.log.zip -n service-software
Troubleshooting AOM
Device information collection failed, prompting key unavailability
Symptom
Failed to log in to the device from the operating system through SSH, with an error indicating the key is unavailable.
Figure 16 The key is unavailable
Troubleshooting procedure
1. Analysis: The device SSH key is too short in length.
2. Regenerate an SSH key longer than 2048 on the client.
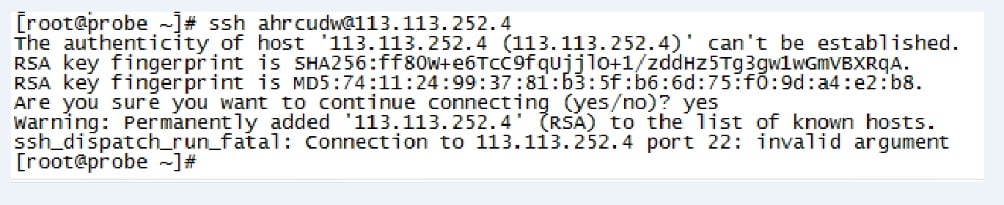
Device information collection failed, prompting key verification failure
Symptom
Failed to log in to the device from the operating system through SSH, with a key verification error prompted.
Figure 17 Key verification failed

Troubleshooting procedure
1. Analysis: The device SSH key has changed.
2. Execute the kubectl get pods -n service-software | grep probe command to view the pod name. Execute the kubectl exec -it podname bash command to access the pod.
3. Execute the rm /root/.SSH/known_hosts command to delete the key file. Replace root with the actual username.
Troubleshooting BSM
No service management menus
Symptom
The BSM component is installed, but the interface does not display the related service management menu.
Troubleshooting procedure
1. Verify that the following licenses exist on the license server:
¡ H3C U-Center2.0, BSM License (BSM feature License)
¡ H3C U-Center2.0, BSM, XXX License (BSM quantity license)
¡ H3C U-Center2.0, BSM, UEM, XXX License (UEM quantity-based license)
¡ H3C U-Center2.0, Intelligent Operations Platform Software
2. Log in to U-Center 5.0, access the System > License Management > License Information page, and identify whether the license list contains the following four licenses:
Figure 18 License information

3. Identify whether the IOM and BSM installation packages are installed, and identify whether the following services are running correctly:
[root@ucenter ~]# kubectl get pod -n service-software | grep bsm
itom-bsm-receiver-65dbf49cc5-rdt7k 2/2 Running 0 28d
itom-bsm-rs-6456759c4f-q25cg 1/1 Running 5 23h
itom-bsm-ui-78487cdc8-hnb85 2/2 Running 0 4d
root@ucenter ~]# kubectl get pod -n service-software | grep seamq
seamq-base-controller-0 3/3 Running 0 30m
[root@ucenter ~]# kubectl get pod -n service-software | grep seasql
seasql-base-0 1/1 Running 3 39d
[root@ucenter ~]# kubectl get pod -n service-software | grep seasqlplus
seasqlplus-uc-shard0-0 1/1 Running 0 28d
[root@ucenter ~]# kubectl get pod -n service-software | grep seasqlcache
seasqlcache-cluster-0 1/1 Running 4 60d
seasqlcache-persistent-master-0 1/1 Running 4 60d
seasqlcache-persistent-sentinel-0 1/1 Running 4 60d
[root@xc wzs]# kubectl get po -A | grep base-rs
service-software base-rs-pod-8fcrn 1/1 Running 0 45d
4. Query the following central interfaces to identify whether the BSM gateway service and gateway routing are running correctly.
/central/gateway/route?name=itom-bsm-rs
/central/gateway/route?name=itom-bsm-ui
/central/gateway/service?name=itom-bsm-rs
5. If the issue persists, obtain detailed information including the version, environment, issue description, screenshots, and logs, and then contact Technical Support.
Service not started
Symptom
The BSM component is installed, but the related services are not running.
Troubleshooting procedure
1. Identify whether the service pod is running correctly. For example:
[root@ucenter ~]# kubectl -n service-software get po | grep itom-bsm-rs
itom-bsm-rs-77576568d-z6hd4 1/1 Pending 0 2d20h
2. If the state is Pending, the possible reason is insufficient environment resources. Execute the following command to locate the detailed cause:
kubectl -n service-software describe po pod name
For example:
kubectl -n service-software describe po itom-bsm-rs-77576568d-z6hd4
3. The Events content shows the detailed cause for the pod scheduling failure, for example, insufficient CPU or memory resources.
4. If the issue persists, obtain detailed information including the version, environment, issue description, screenshots, and logs, and then contact Technical Support.
The service list has no data
Symptom
The service list page has no data.
Troubleshooting procedure
Identify whether the CMDB installation package is installed and whether the service is running correctly. Make sure the CMDB-related licenses are configured and the resource menu is visible.
[root@ucenter ~]# kubectl get pod -n service-software | grep cmdb
itom-cmdb-rs-k-5cc898bbf-tp5rp 1/1 Running 8 60d
itom-cmdb-topo-rs-k-68c6995c68-ncjmp 1/1 Running 0 25d
itom-cmdb-topo-ui-k-6b7c9d56f7-tm8s6 1/1 Running 0 25d
itom-cmdb-ui-k-779976bf58-747xn 1/1 Running 4 60d
The service score data is incorrect
Symptom
The service score data is incorrect.
Troubleshooting procedure
1. Check whether the IOM, UEM, NQA, and Alarm services are running correctly, whether the related licenses are configured, and whether the menus are displayed.
[root@ucenter ~]# kubectl get pod -n service-software | grep uem-rs
itom-uem-rs-7cfc9f69ff-qznfp 2/2 Running 0 28d
[root@ucenter ~]# kubectl get pod -n service-software | grep iom
iom-dd6f5fc5f-28cln 1/1 Running 0 28d
[root@ucenter ~]# kubectl get pod -n service-software | grep itom-stm-rs
itom-stm-rs-54587d48bc-xg6g8 1/1 Running 0 4d21h
[root@ucenter ~]# kubectl get pod -n service-software | grep itom-nqa-rs
itom-nqa-rs-69bf8b795b-9jzgl 1/1 Running 0 3d23h
[root@ucenter ~]# kubectl get pod -n service-software | grep alarm-rs
itom-alarm-rs-674fdffd5b-bx865 2/2 Running 2 11d
2. Identify whether the monitoring template, access experience, service probing, and NQA probing are correctly bound.
No service alarms
Symptom
No service alarms.
Troubleshooting procedure
Identify whether the alarm service is running correctly, whether alarm-related licenses are configured, and whether the alarm menu is displayed.
[root@ucenter ~]# kubectl get pod -n service-software | grep alarm-rs
itom-alarm-rs-674fdffd5b-bx865 2/2 Running 2 11d
Troubleshooting ITSM
The top navigation bar does not display the workflows tab
Symptom
The top navigation bar does not display the workflows tab.
Troubleshooting procedure
1. Verify that the following licenses exist on the license server:
¡ H3C U-Center2.0, ITSM License (ITSM feature license)
¡ H3C U-Center2.0, ITSM, XXX License (ITSM quantity license)
2. Log in to U-Center 5.0, access the System > License Management > License Information page, and identify whether the license list contains the following two licenses:
Figure 19 License information

3. Identify whether the ITSM package is installed and whether the service is running correctly.
root@matrix134 upgrade_tool]# kubectl get pods -n service-software | grep itsm
itom-itsm-kbm-6c7c6d6cb4-rjcvj 1/1 Running 0 163m
itom-itsm-message-75f79774c5-mfv54 1/1 Running 3 29d
itom-itsm-rs-848d4f7d7c-5glsq 1/1 Running 12 163m
itom-itsm-rs-848d4f7d7c-7rmxf 1/1 Running 12 163m
itom-itsm-rs-848d4f7d7c-z4c74 1/1 Running 12 163m
itom-itsm-ssd-ui-5c9f4b74df-252tt 1/1 Running 8 29d
4. If the issue persists, obtain detailed information including the version, environment, issue description, screenshots, and logs, and then contact Technical Support.
The system prompts that the number of users allowed to use the workflow functionality simultaneously has reached the limit when you click the workflows tab
Applicable component versions
Troubleshooting procedures for this issue apply to U-Center 5.0 E0704 and later versions.
Symptom
The system prompts that the number of users allowed to use the workflow functionality simultaneously has reached the limit when you click the workflows tab on U-Center 5.0.
Troubleshooting procedure
1. Check online workflow users: The number of users who use the workflow functionality is limited by the number of workflow licenses, operating on a "first-come, first-served" basis. The total number of counted user licenses is calculated as the maximum total user licenses minus the number of designated user licenses. Access the Workflows > Parameter Configuration > Online Process Users page to identify whether the total counted user licenses equal the current total logged-in counted users.
2. If they are equal, it indicates that the maximum number of counted users is reached. In this case, you can log out some counted user accounts that are not currently needed, and then log in with the counted user account that requires access.
3. If the issue persists, obtain detailed information including the version, environment, issue description, screenshots, and logs, and then contact Technical Support.
Troubleshooting CMDB
There is data in the monitoring list but no corresponding resources exist in the resource maintenance section
Symptom
There is data in the monitoring list but no corresponding resources exist in the resource maintenance section.
Troubleshooting procedure
1. On the resource synchronization configuration page, enable synchronization. Verify that the data source synchronization configuration is correct.
2. Identify whether data monitoring is configured with polling.
|
|
NOTE: · Priority is only applicable in scenarios where multiple synchronization sources are enabled. · A smaller value indicates a higher priority. · If data exists in only one source among the multiple synchronization sources, the data from that source will be used by default. |
A collection metric is inconsistent with the metric on the resource maintenance page
Symptom
The metric data information collected by a monitoring resource is different from the corresponding data information on the resource maintenance page.
Troubleshooting procedure
1. On the resource maintenance page, use the data source comparison feature to check if there are any records. If records exist, save them directly. If no records are found, identify whether the built-in data source synchronization configuration is correct, and identify whether the monitoring interface is correctly returning data.
2. If auto update for resource synchronization configuration is enabled, the resource data will be automatically updated during synchronization after a data source sends changes. If auto update is disabled, the changes will be written to data differences.
The monitoring list displays one resource data entry, while the resource maintenance page displays multiple resource entries
Symptom
The monitoring list displays one resource data entry, while the resource maintenance page displays multiple resource entries.
Troubleshooting procedure
1. On the resource type definition page, verify that the primary key and attribute uniqueness verification succeeded.
2. On the data source synchronization configuration page, verify that the synchronization key is correct.
3. If no synchronization key is configured, the primary key is used by default to compare data.
Automatic generation of resource relationships failed
Symptom
Automatic generation of resource relationships is enabled on the relationship synchronization configuration page, but no relationships are generated automatically.
Troubleshooting procedure
1. On the resource relationship management page, verify that the subrules are configured correctly.
2. On the relationship synchronization configuration page, verify that automatic generation of resource relationships is configured correctly.
Failed to display the logical relationships or physical links generated by CMDB
Symptom
Failed to display the logical relationships or physical links generated by CMDB.
Troubleshooting procedure
1. Verify that CMDB has generated the logical relationships or physical links between the configuration items.
2. For physical links, make sure the left and right node IDs in the link information are not empty.
3. In the resource or service topology where the configuration item is located, move any node and save it, then refresh the view to check if the logical relationship or physical link is displayed correctly.
View import failed
Symptom
Failed to import topology views on the resource topology page.
Troubleshooting procedure
1. Check the failure reason in the import result popup window.
2. If the failure reason is unsupported node type, adapt the resource type in the resource mapping menu.
Failed to synchronize CMDB configuration item changes in time
Symptom
Failed to synchronize CMDB configuration item changes in time.
Troubleshooting procedure
1. Move any other node, and then save and refresh the view.
2. Wait for automatic data sync at midnight and check the next day to see if the data is correct.
3. Delete the node from this view, save the configuration, and then add the configuration item again.
When you add the global Ops topology, a prompt appears indicating that the resource name already exists
Symptom
When you add the global Ops topology, a prompt appears indicating that the resource name already exists.
Troubleshooting procedure
1. Identify whether there is a resource topology or service topology with the same name in the CMDB TOPO.
2. If there is, import the service topology or resource topology from the hover menu of the directory under the root node of the resource or service topology.
In the global Ops topology, the color of a node is inconsistent with the actual alarm data
Symptom
In the global Ops topology, the color of a node is inconsistent with the actual alarm data.
Troubleshooting procedure
1. Verify that the alarm configuration data is correct.
2. After an automatic data synchronization in the early morning, observe the next day to identify whether the data is correct.
3. For versions later than CMDB E7106, you can call the GET /cmdbtopors/cmdb/topo/fault/init?viewId=0 API to reinitialize the alarm data for the global Ops topology. Access ip:port/cmdbtopors/cmdb/topo/fault/init?viewId=0 in a browser. If a unified prefix is used, include the prefix as well.
Troubleshooting NTA
No traffic monitoring menus
Symptom
The U-Center 5.0 Web interface does not display the NTA traffic monitoring menu.
Troubleshooting procedure
1. Verify that the following licenses exist on the license server:
¡ H3C U-Center2.0, IOM, Network Traffic Analyzer License (NTA feature license)
¡ H3C U-Center2.0, IOM, Network Traffic Analyzer XXX License (NTA quantity-based license)
¡ H3C U-Center2.0, Intelligent Operations Platform Software
2. Log in to U-Center 5.0, access the System > License Management > License Information page, and identify whether the license list contains the following four licenses:
Figure 20 License information

3. Identify whether the IOM package is installed and whether the service is running correctly.
[root@ucenter01 k-framework-rs]# kubectl get po -A|grep itom-nta
service-software itom-nta-86899447f5-ssqt7 2/2 Running 0 7d20h
service-software itom-nta-dispenser-rc5km 1/1 Running 0 7d20h
service-software itom-nta-receiver-84896b5d44-4m5sw 1/1 Running 0 7d20h
service-software itom-nta-receiver-84896b5d44-7x2bh 1/1 Running 0 7d20h
service-software itom-nta-receiver-84896b5d44-wk8rj 1/1 Running 0 7d20h
service-software itom-nta-server-94759d74b-d9x6t 1/1 Running 0 7d20h
4. If the issue persists, obtain detailed information including the version, environment, issue description, screenshots, and logs, and then contact Technical Support.
Service not started
Symptom
The NTA-related services are not running.
Troubleshooting procedure
1. Identify whether the pod service runs correctly, including:
¡ itom-nta-dispenser
¡ itom-nta-receiver
¡ itom-nta
¡ itom-nta-server
2. If the state is Pending, the possible reason is insufficient environment resources. Execute the following command to locate the detailed cause:
kubectl -n service-software describe po <pod name>
For example:
kubectl -n service-software describe po itom-nta-77576568d-z6hd4
3. The Events content shows the detailed cause for the pod scheduling failure, for example, insufficient CPU or memory resources.
4. If the issue persists, obtain detailed information including the version, environment, issue description, screenshots, and logs, and then contact Technical Support.
No data for the traffic analysis tasks
Symptom
After you add a traffic analysis task, there is no traffic data in the task result details.
Troubleshooting procedure
1. Identify whether the device is configured with NetStream or sFlow for traffic reporting.
2. If NetStream or sFlow is configured, identify whether any packets have been sent to U-Center 5.0. Capture packets in the U-Center 5.0 back end to see if the system has received packets from the device.
3. If all the above operations succeeded, collect the dispenser-dm\itom-nta-receiver logs.
Other operations
SMI-S toolkit usage methods
Obtain the data command template: testClientSblim.sh <ipAddress> <port> <namespace> <userName> <password> <namespacePrefix> <class>.
Parameters:
· ipAddress: Address of the host where SMI-S Provider resides.
· port: Enter 5988. The default port number for the SMI-S provider is 5988, which runs over HTTP, with SSL disabled. To use port 5989 over HTTPS, enable SSL.
· namespace: Namespace of SMI-S Provider.
· userName and password: SMI-S Provider username and password. If the username or password contains special characters, enclose them in double quotes.
· namespacePrefix: Enter false.
Example:
Access the /opt/itom/smistool/ path inside any java-collector pod and execute the above command.
Figure 21 Tool path
![]()
