- Released At: 30-05-2023
- Page Views:
- Downloads:
- Table of Contents
- Related Documents
-
|
|
|
Intelligent Management Center |
|
WSM Spectrum Guard Configuration Examples |
|
|
Document version: 5W100-20230529
Software version: IMC WSM 7.3 (E0505)
|
Copyright © 2023 New H3C Technologies Co., Ltd. All rights reserved. No part of this manual may be reproduced or transmitted in any form or by any means without prior written consent of New H3C Technologies Co., Ltd. The information in this document is subject to change without notice. |
|
Contents
Configuration restrictions and guidelines
Example: Using spectrum guard to monitor a WLAN
Setting the operating mode for the monitor AP
Enabling spectrum analysis globally
Enabling spectrum analysis for a radio
Configuring channels to be monitored
Viewing the spectrum guard result
Viewing spectrum analysis monitoring data
Recording spectrum analysis monitoring data
Viewing spectrum analysis monitoring history
Viewing the current interference list
Viewing the AP channel quality list
Introduction
This document provides examples for using spectrum guard to monitor WLANs.
Spectrum guard monitors frequency bands to detect interference and evaluate channel quality. Administrators can obtain the wireless spectrum performance and WLAN security status by viewing realtime spectrum data and history monitoring files.
Prerequisites
Before you use the spectrum guard module to monitor a WLAN, complete the following tasks:
· Create a WLAN to be monitored. Make sure the routes are reachable.
· Add wireless devices to WSM.
· Register the spectrum analysis license on the AC.
· Enable spectrum analysis on the monitor AP.
· Register the spectrum guard license on the WSM server.
Configuration restrictions and guidelines
When you use spectrum guard, follow these restrictions and guidelines:
· For better realtime spectrum analysis performance, configure the monitor AP to operate in monitor mode. In normal mode, the AP detects only the working channel. In hybrid mode, the AP detects all channels and provides wireless services at the same time.
· Spectrum guard supports only Comware-based devices.
Example: Using spectrum guard to monitor a WLAN
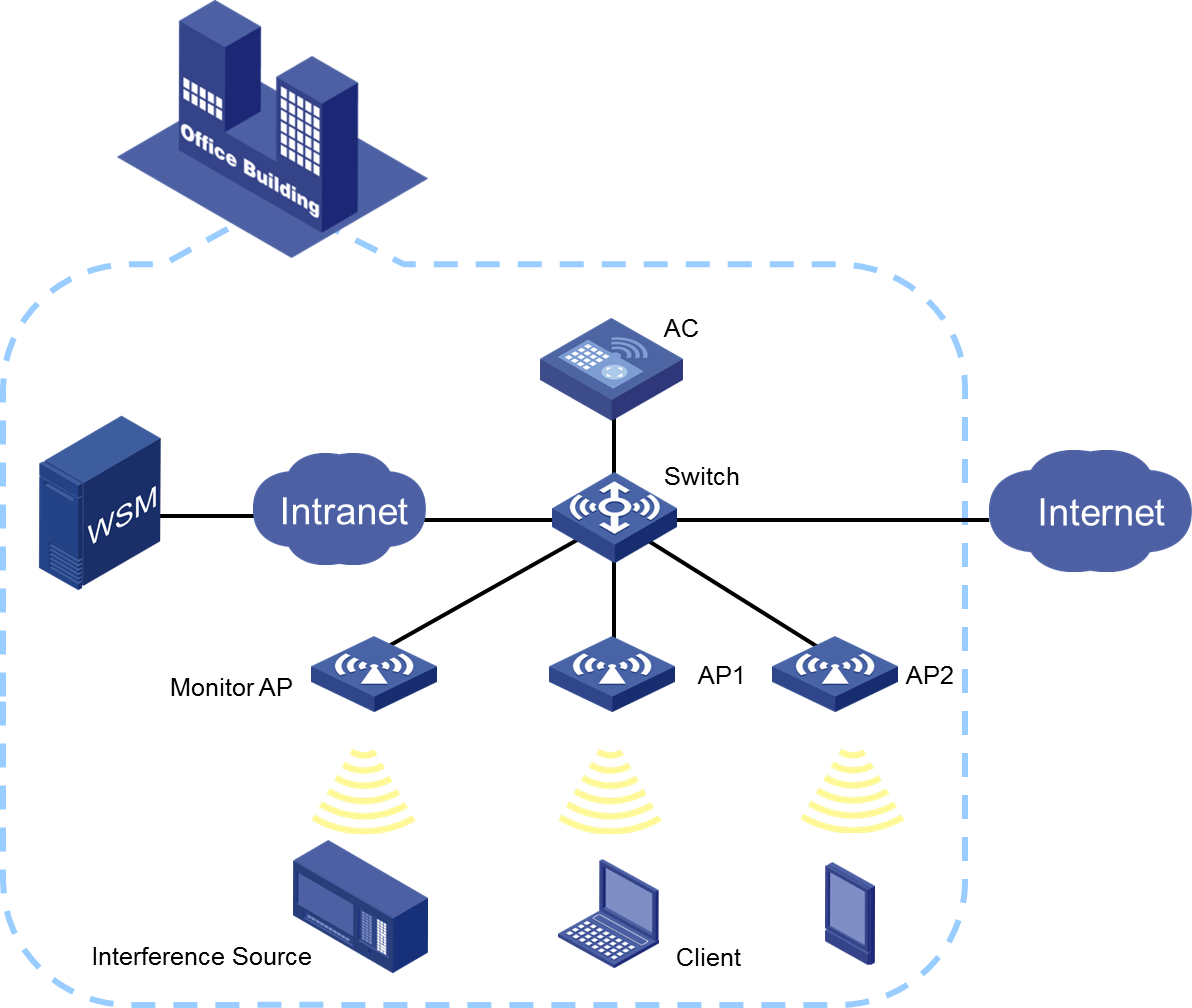
Network configuration
As shown in Figure 1, configure AP1 and AP2 to operate in normal mode to provide wireless services. Configure the monitor AP to operate in monitor mode. Enable spectrum analysis on the monitor AP to detect interference on the WLAN in an office building.
Analysis
To use spectrum guard to monitor a WLAN, complete the following tasks:
1. Configure the monitor AP to collect spectrum data.
2. Enable spectrum analysis and interference detection, and enable the alarm function and configure alarm trigger conditions.
3. View spectrum analysis data to discover interference and evaluate channel quality.
Software version used
This configuration example was created and verified on the following software versions:
· IMC PLAT 7.3 (E0504).
· IMC WSM 7.3 (E0505).
Setting the operating mode for the monitor AP
1. Log in to IMC.
2. Click the Service tab.
3. From the navigation tree, select WLAN Manager > Resource Management > Fit APs.
The Fit AP List page appears.
4. Click the label of the target monitor AP. In this example, click the label ap43.
The fit AP details page appears.
5. In the Action area located on the right of the page, click Modify AP Template.
The Modify AP Template page appears.
6. Select Monitor from the Work Mode list, as shown in Figure 2.
Figure 2 Setting the operating mode
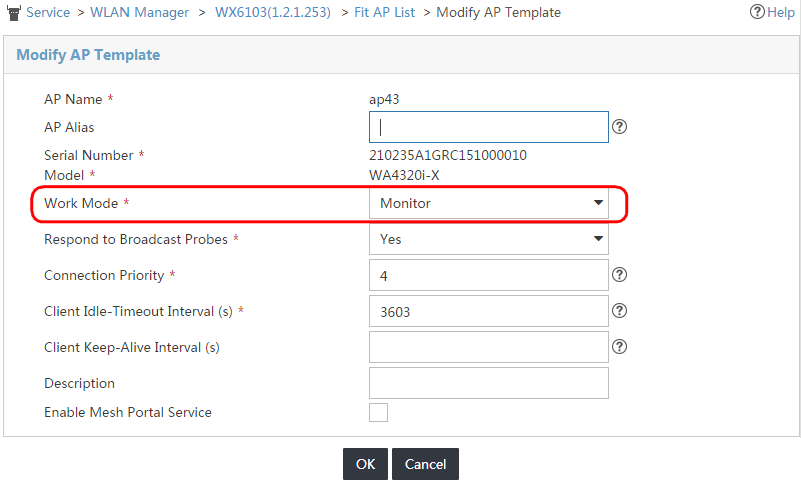
7. Click OK.
|
|
NOTE: · To switch between the hybrid mode and monitor mode, first change the operating mode to normal mode. · To view the Signal Strength by SSID statistics, set the AP to operate in monitor mode. |
Configuring spectrum analysis
To make spectrum analysis take effect on a radio, enable spectrum analysis both globally and on the radio.
Enabling spectrum analysis globally
Configure global spectrum analysis settings for the 2.4 GHz band and 5 GHz band separately.
To enable spectrum analysis globally:
1. Click the Service tab.
2. From the navigation tree, select WLAN Manager > Spectrum Guard.
The Spectrum Guard page appears.
3. Select an AC from the Device Configuration list. In this example, select the AC named WX6103_1.
4. Click Spectrum Analysis Configuration.
The Spectrum Analysis Configuration page for the 2.4 GHz band appears.
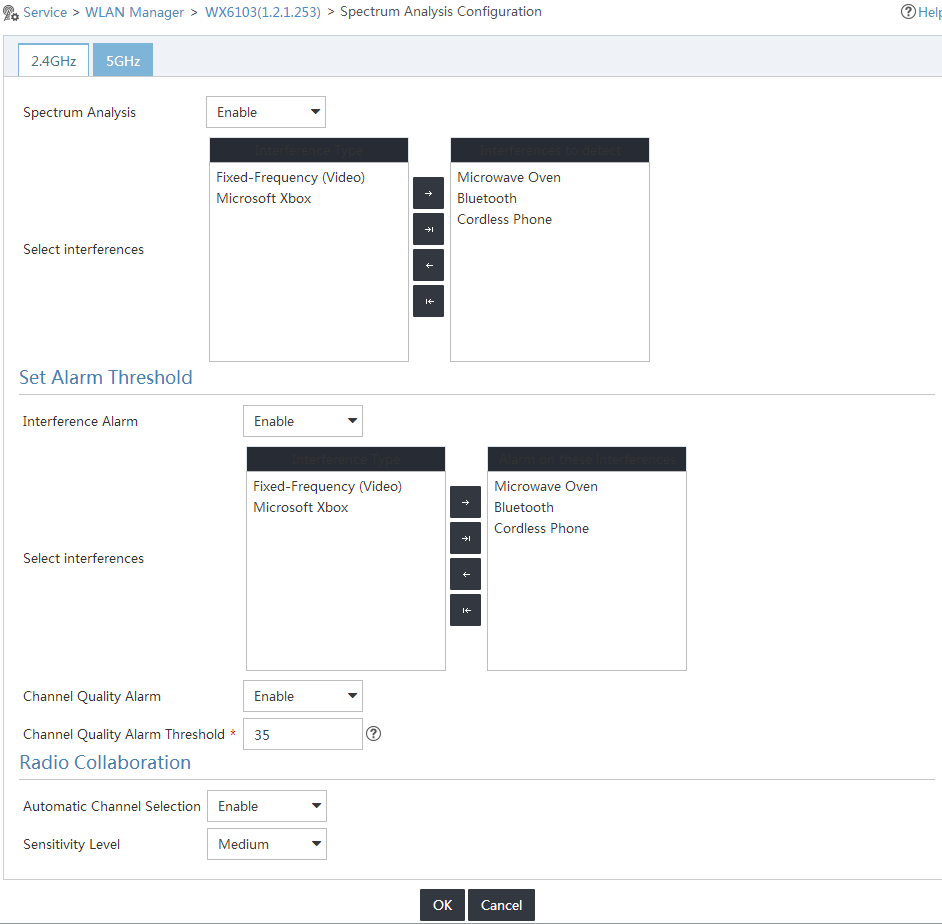
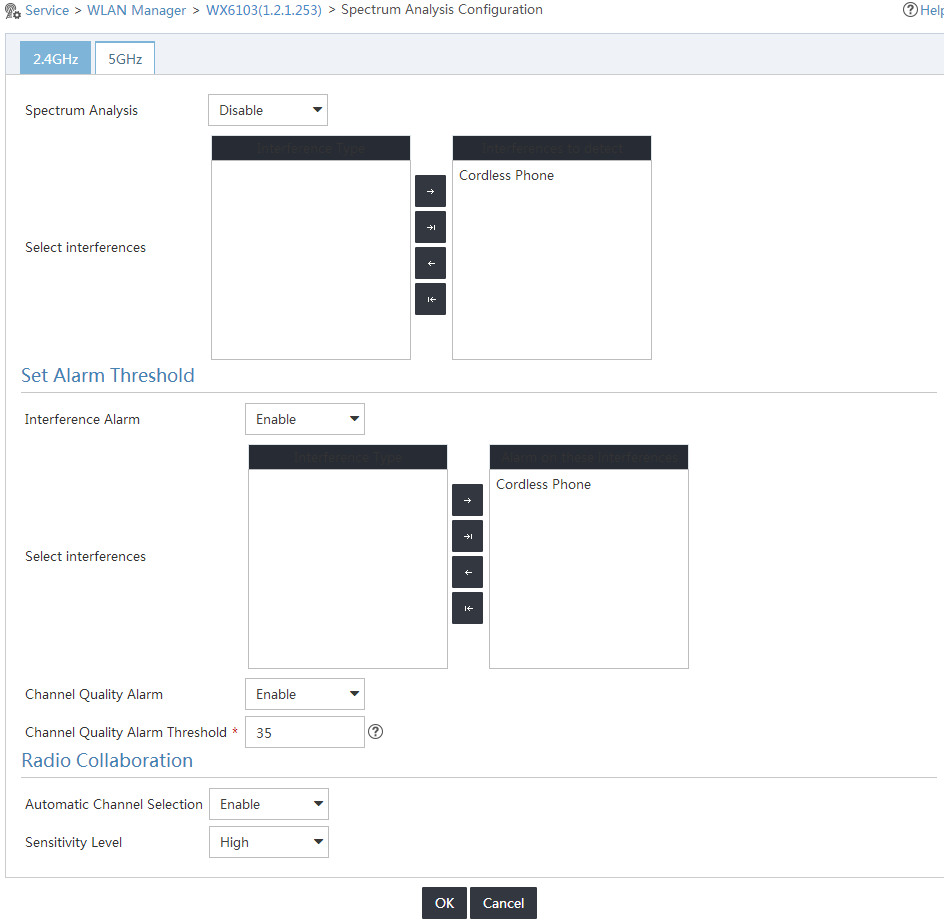
5. Configure the following parameters for the 2.4 GHz band, as shown in Figure 3:
¡ Select Enable from the Spectrum Analysis list.
¡ Select the type of devices to detect from the Select interferences list as needed. In this example, select Microwave Oven, Bluetooth, and Cordless Phone.
¡ Select Enable from the Interference Alarm list. Then, the AC sends alarms to IMC when the radio detects interference or when the interference disappears.
¡ Select the types of interference devices for which alarms are generated from the Select interferences list as needed. In this example, select Microwave Oven, Bluetooth, and Cordless Phone.
¡ Select Enable from the Channel Quality Alarm list. Then, the AC sends alarms to IMC when the channel quality is lower than the specified threshold.
¡ Enter 35 in the Channel Quality Alarm Threshold field.
¡ Select Enable from the Automatic Channel Selection list. Then, channel adjustment is triggered on the AC when the quality of the current working channel is lower than the specified threshold.
When the quality of the current channel drops below the threshold, the AC selects a new channel for the AP. However, the AP does not use the new channel until the channel quality difference between the new and old channels exceeds the tolerance level.
To enable automatic channel selection, make sure the AC uses automatic channel selection and channel lock is disabled.
¡ Select Medium from the Sensitivity Level list. The higher the sensitivity level, the higher the channel switchover frequency.
Figure 3 Setting spectrum analysis parameters for the 2.4 GHz band
6. Click OK.
7. Click the 5GHz tab to configure parameters for the 5 GHz band, as shown in Figure 4.
Configure the 5 GHz band in the same way the 2.4 GHz band is configured, except for the types of interference that can be detected.
Figure 4 Setting spectrum analysis parameters for the 5 GHz band
8. Click OK.
Enabling spectrum analysis for a radio
To detect interference or monitor channel quality of an AP, first enable spectrum analysis for the radio on the AP.
To enable spectrum analysis for a radio:
1. Click the Service tab.
2. From the navigation tree, select WLAN Manager > Spectrum Guard > Radio Config.
The Radio Config page appears.
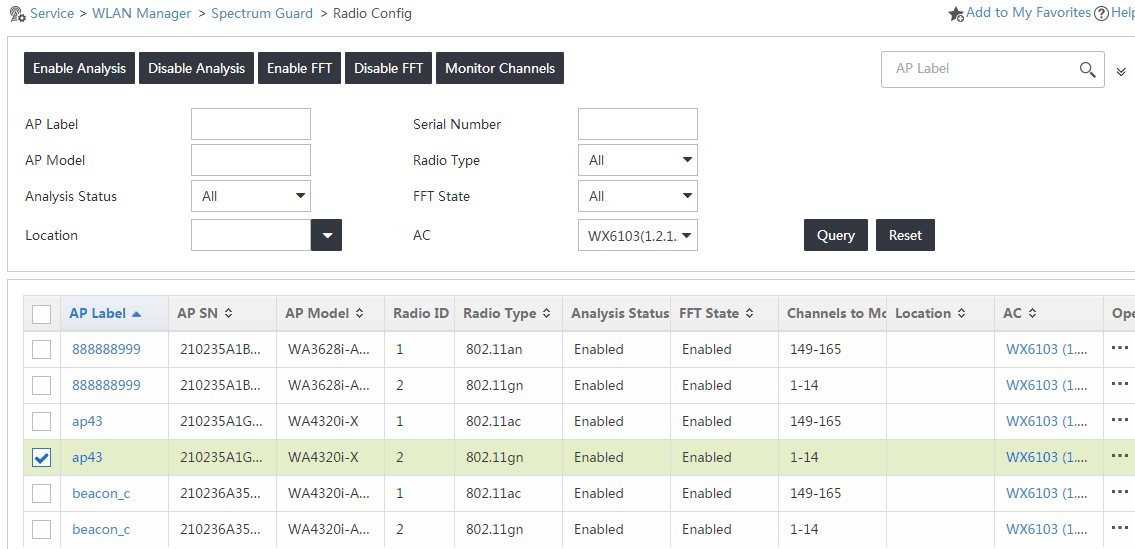
3. Select the radio for which you want to enable spectrum analysis. In this example, enable spectrum analysis for the radio with the ID of 2 on the AP with the label ap43.
4. Click Enable Analysis.
The Result List page shows the operation result for the radio.
5. Click Back to return to the Radio Config page.
Enabling FFT monitoring
To monitor, record, or save FFT, FFT duty cycle, or swept spectrogram data, you must first enable FFT monitoring.
To enable FFT monitoring:
1. Select the radio for which FFT monitoring is to be enabled on the Radio Config page.
2. Click Enable FFT.
The Result List page shows the operation result for the radio.
3. Click Back to return to the Radio Config page.
Configuring channels to be monitored
1. Select the radios for which you want to configure channel monitoring on the Radio Config page.
2. Click Monitor Channels.
The Monitor Channels window appears.
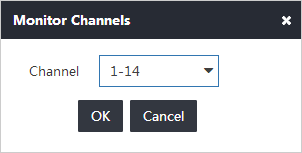
3. Select the channel range as needed, as shown in Figure 5.
Applicable channel ranges vary by regions. For the 2.4 GHz band, only the default channel range 1-14 is available. For the 5 GHz band, select 36-64, 100-140, or 149-165 from the Channel list.
Figure 5 Selecting the channel range
4. Click OK.
The Radio Config page displays the configuration result, as shown in Figure 6.
Viewing the spectrum guard result
The spectrum guard result enables you to locate interference on the WLAN to eliminate the interference and ensure correct operation of the WLAN.
Viewing spectrum analysis monitoring data
1. Click the Service tab.
2. From the navigation tree, select WLAN Manager > Spectrum Guard > Radio Config.
The Radio Config page appears.
3. Click the Operation
icon![]() for the
interference, and then select Spectrum Analysis Monitor from the shortcut menu.
for the
interference, and then select Spectrum Analysis Monitor from the shortcut menu.
The Spectrum Analysis Monitor window appears.
4. Configure the following monitoring parameters:
¡ Select the radio used to monitor channels.
¡ Select a maximum of four types of spectrum analysis monitoring information. Options are Channel Usage, Channel Usage Trend, Channel Quality, Channel Quality Trend, Interference Signal Strength, FFT, FFT Duty Cycle, Swept Spectrogram, and Signal Strength by SSID, as shown in Figure 7:
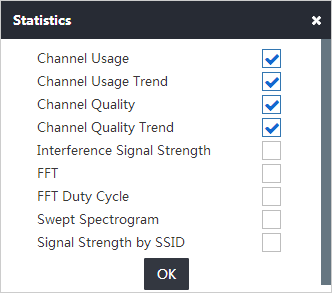
¡ Click OK.
5. Click Monitor.
Realtime spectrum monitoring starts. The spectrum monitoring data is refreshed every 6 seconds.
Table 1 provides the spectrum monitoring charts.
Table 1 Spectrum monitoring charts
|
Item |
Description |
|
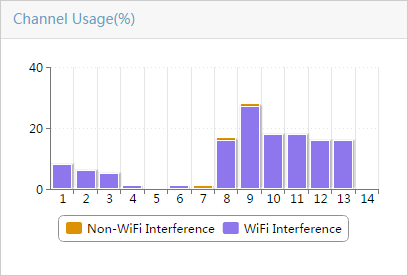
Channel usage bar chart |
Displays the usage of each channel and the channel resource assignment of each channel. |
|
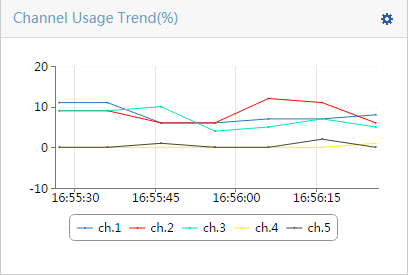
Channel usage trend graph |
· Helps administrators determine the time range during which interference or traffic congestion occurs to locate problems. · To configure channels to be monitored, click
the Configure icon |
|
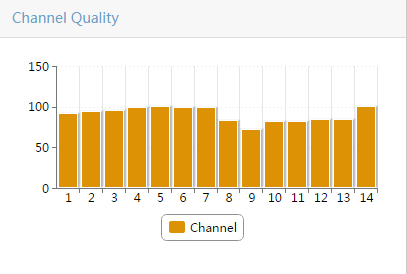
Channel quality chart |
· Higher channel quality indicates higher performance of wireless devices. · You can assign channel resources based on channel quality. |
|
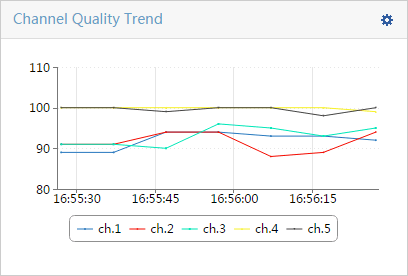
Channel quality trend graph |
· Provides channel quality data to help administrators assign channels. · To configure channels to be monitored, click
the Configure icon |
|
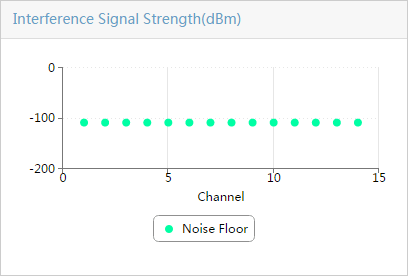
Interference signal strength graph |
Displays interference distribution and signal strength on different channels. This helps administrators plan channel resources. |
|
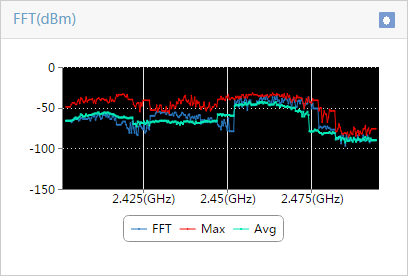
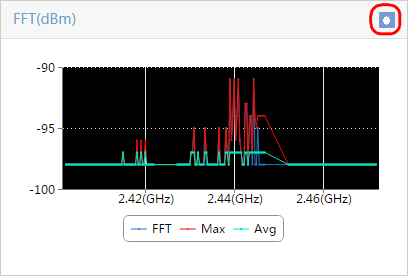
FFT chart |
· Displays the spectrum on the frequency. Administrators can locate interference and obtain the interference features such as the bandwidth, frequency-hopping spread spectrum, spread spectrum, and swept spectrogram. · FFT—Realtime interference signal strength on the frequency. · Max—Maximum interference signal strength on the frequency. · Avg—Average interference signal strength on the frequency. |
|
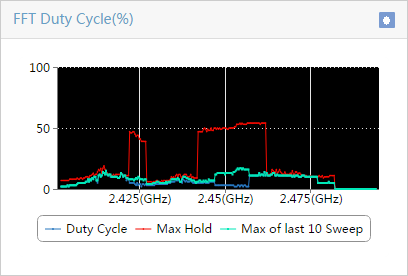
FFT Duty Cycle (%) graph |
· Displays percentage of the time that interference is present in the channel. This helps administrators evaluate interference severity. · Duty Cycle—Duty cycle of interference signals on the frequency. · Max Hold—Maximum duty cycle of interference signals on the frequency. · Max of last 10 Sweep—Maximum duty cycle of interference signals on the frequency over the most recent 10 sweeps. |
|
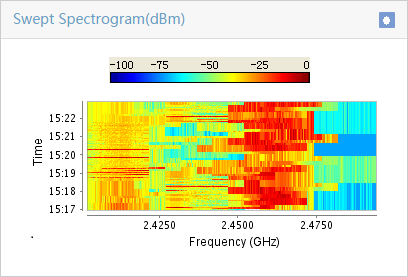
Swept Spectrogram graph |
The Swept Spectrogram graph combines a time- and frequency-based view of the RF spectrum to help you analyze interference features. |
|
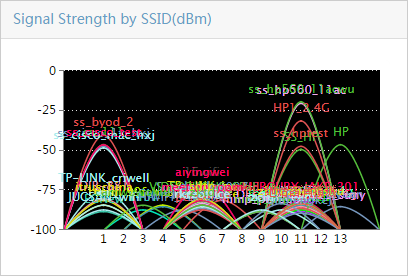
Signal strength by SSID graph |
Displays SSID distribution and signal strength on different channels. |
Recording spectrum analysis monitoring data
To record the monitoring data of FFT, FFT duty cycle, or swept spectrogram:
1. In the Spectrum Analysis Monitor window,
click the Start Recording
icon ![]() at the upper right of the graph, as shown in Figure 8.
at the upper right of the graph, as shown in Figure 8.
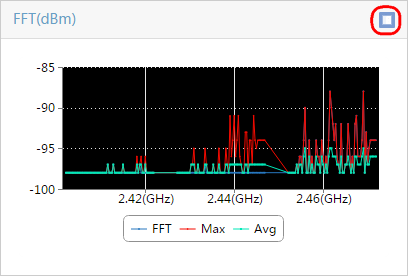
2. At the upper right of the graph, click the Stop Recording icon ![]() , as shown in Figure 9.
, as shown in Figure 9.
3. At the upper right of the graph, click the Save Recordings icon ![]() , as shown in Figure 10.
, as shown in Figure 10.
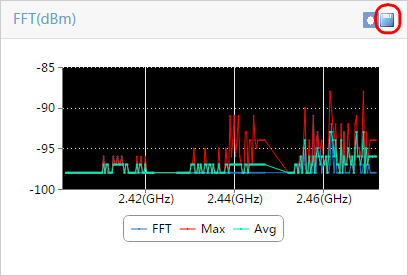
The monitoring data is saved in a .csv file.
Viewing spectrum analysis monitoring history
1. Click the Service tab.
2. From the navigation tree, select WLAN Manager > Spectrum Guard.
The Spectrum Guard page appears.
3. In the AP Spectrum Analysis area, click Spectrum Analysis Monitor History.
The Spectrum Analysis Monitor History window appears.
4. Configure the following parameters:
¡ Select FFT from the Statistics list.
¡ Click Select File to select the saved .csv file.
¡ Set the start time in the Start Time field.
¡ Set the end time in the Stop Time field.
5. Click Query.
The graph displays the data in the specified time period, as shown in Figure 11.
Figure 11 Viewing spectrum analysis monitoring history
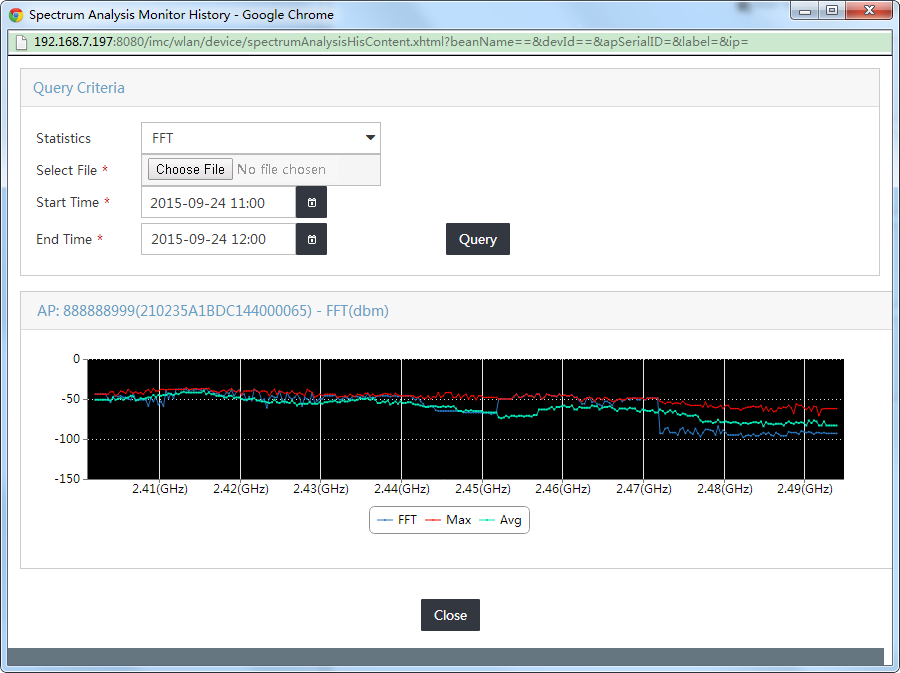
6. Click Close.
Viewing the current interference list
Administrators can obtain parameters of interference to clear interference by viewing and locating current interference.
To view the current interference list:
1. Click the Service tab.
2. From the navigation tree, select WLAN Manager > Spectrum Guard > Interferences.
The Interferences page appears.
3. Click Synchronize.
4. Open the Interferences page again after synchronization.
The Current Interference List displays all interference, as shown in Figure 12.
Figure 12 Current interference list
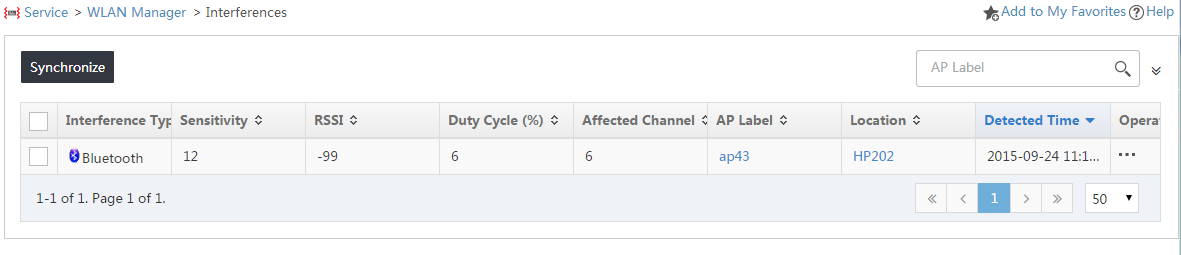
Current interference list:
¡ Sensitivity—Severity level of the interference. A higher value indicates a higher interference.
¡ RSSI—Signal strength of the interference.
¡ Duty Cycle (%)—Percentage of time during which the RSSI of the interference exceeds the threshold.
¡ Affected Channel—Channel affected by the interference.
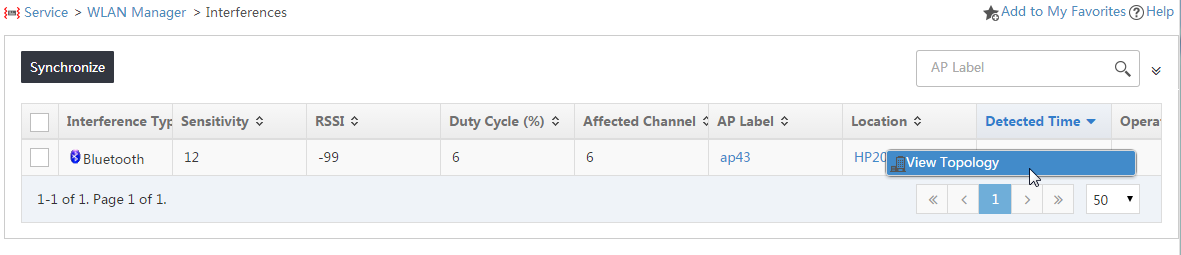
5. Click the Operation
icon ![]() for the interference, and then select View Topology from the shortcut
menu, as shown in Figure 13.
for the interference, and then select View Topology from the shortcut
menu, as shown in Figure 13.
Figure 13 Locating interference in the topology
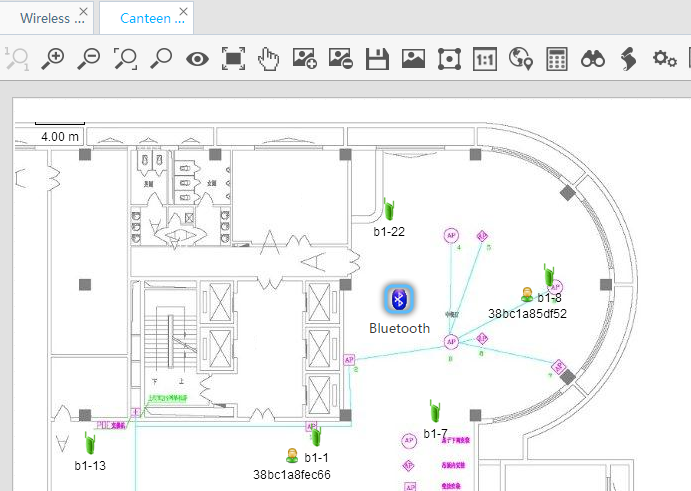
6. View the result, as shown in Figure 14.
The interference is located and then highlighted in the topology. In this example, the located interference is Bluetooth.
Figure 14 Located interference
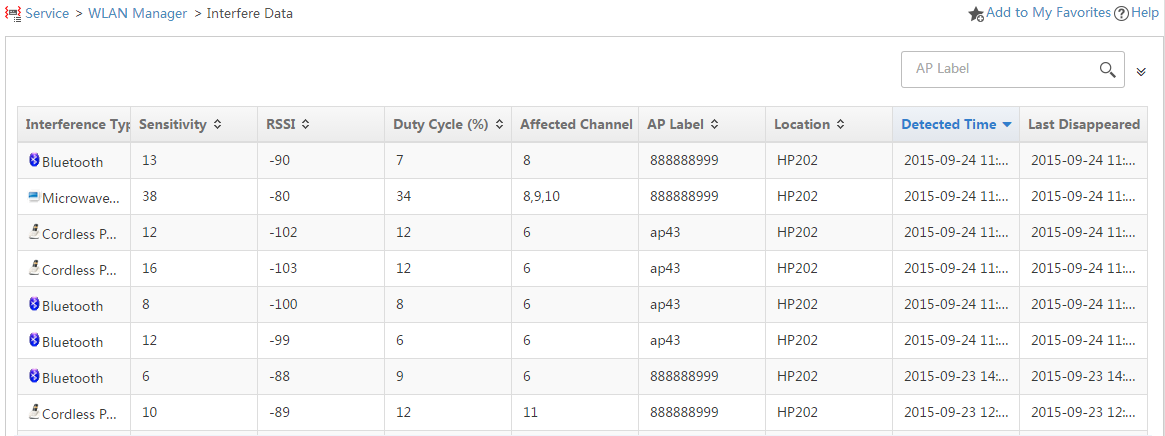
Viewing interference history
1. Click the Service tab.
2. From the navigation tree, select WLAN Manager > Spectrum Guard > Interfere Data.
The Interfere Data page appears, as shown in Figure 15.
Figure 15 Interference Data page
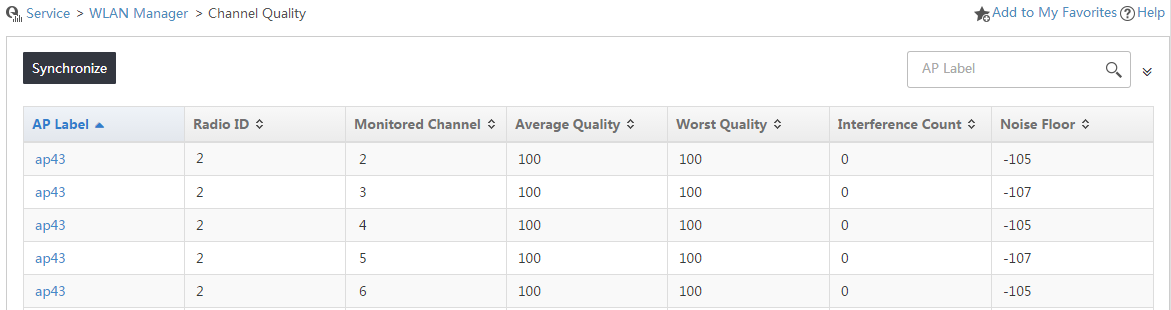
Viewing the AP channel quality list
1. Click the Service tab.
2. From the navigation tree, select WLAN Manager > Spectrum Guard > Channel Quality.
The Channel Quality page appears.
3. Click Synchronize.
4. Open the Channel Quality page again after synchronization.
The Channel Quality page displays all channel quality, as shown in Figure 16.
Channel quality list:
¡ Average Quality—Average score of the channel assessment. A greater value indicates a better quality.
¡ Worst Quality—Lowest quality score of the channel.
¡ Noise Floor—Noise floor of the radio in dBm. Noise floor affects channel quality and changes with the temperature.
Figure 16 Channel quality list
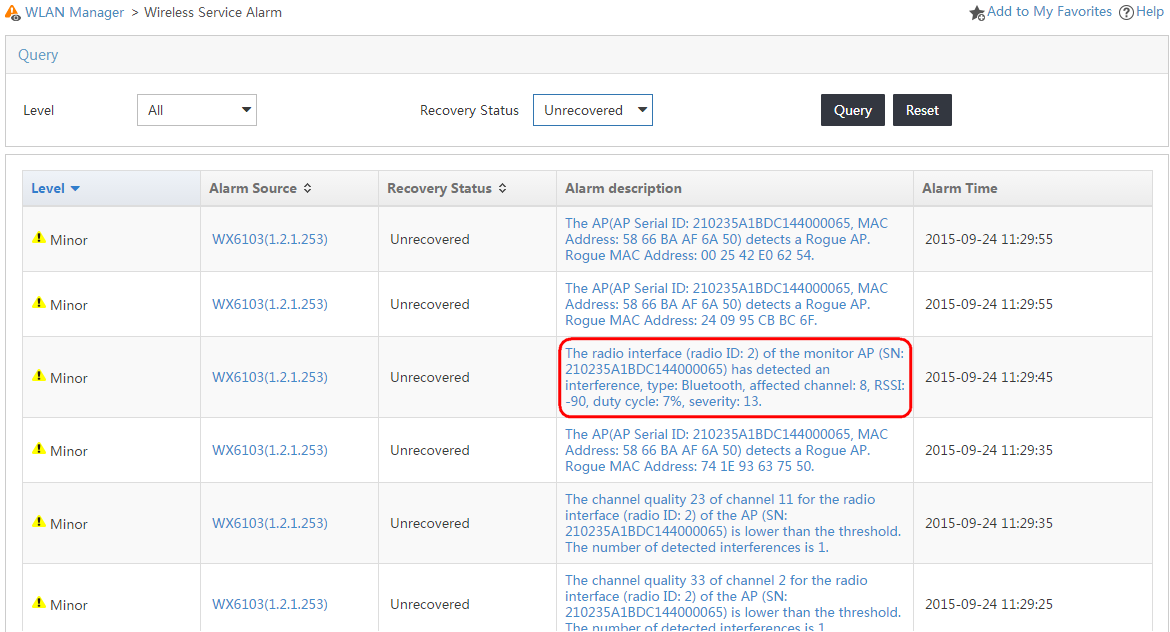
Viewing interference alarms
1. Click the Service tab.
2. From the navigation tree, select WLAN Manager > Wireless Service Alarm.
You can view an interference alarm on the alarm list, as shown in Figure 17.