- Released At: 27-10-2023
- Page Views:
- Downloads:
- Table of Contents
- Related Documents
-
|
Troubleshooting Guide |
|
|
|
H3C S5560S-EI & S5560S-SI Switch Series
H3C S5500V3-SI Switch Series
H3C S5570S-EI Switch Series
H3C S5170-EI Switch Series
H3C S5130S-HI & S5130S-EI & S5130S-SI & S5130S-LI Switch Series
H3C S5120V3-EI[SI] Switch Series
H3C S5120V2-SI & S5120V2-LI Switch Series
H3C S5110V2 & S5110V2-SI Switch Series
H3C S5000V3-EI & S5000E-X Switch Series
H3C S3600V3-EI Switch Series
H3C S3600V3-SI Switch Series
H3C S3100V3-EI & S3100V3-SI Switch Series
H3C E128C & E152C & E500C & E500D Switch Series
H3C MS4520V2 & MS4320V2 & MS4300V2 & MS4200 Switch Series
H3C WS5850-WiNet & WS5820-WiNet & WS5810-WiNet Switch Series
H3C WAS6000 Switch Series
Document version: 6W104-20220711
Copyright © 2022 New H3C Technologies Co., Ltd. All rights reserved.
No part of this manual may be reproduced or transmitted in any form or by any means without prior written consent of New H3C Technologies Co., Ltd.
Except for the trademarks of New H3C Technologies Co., Ltd., any trademarks that may be mentioned in this document are the property of their respective owners.
The information in this document is subject to change without notice.
Contents
Collecting log and operating information· 1
Collecting common log messages· 2
Collecting diagnostic log messages· 3
Collecting operating statistics· 3
Contacting technical support 4
Operating power module failure· 6
Newly installed power module failure· 7
ACL application failure with an error message· 10
ACL application failure without an error message· 10
IRF fabric establishment failure· 13
Troubleshooting Ethernet link aggregation· 18
A fiber port fails to come up· 21
A copper port fails to come up· 23
Troubleshooting other issues· 25
Layer 2 forwarding failure· 25
Layer 3 forwarding failure· 28
Introduction
This document provides information about troubleshooting common software and hardware issues with the switches.
This document is not restricted to specific software or hardware versions.
General guidelines
| IMPORTANT: To prevent a failure from causing loss of configuration, save the configuration each time you finish configuring a feature. For configuration recovery, regularly back up the configuration to a remote server. |
When you troubleshoot the switch, follow these general guidelines:
· To help identify the failure cause, collect system and configuration information, including:
¡ Symptom, time of failure, and configuration.
¡ Network topology information, including the network diagram, port connections, and points of failure.
¡ Log messages and diagnostic information. For more information about collecting this information, see "Collecting log and operating information."
¡ Physical evidence of failure:
- Photos of hardware.
- Status of the LEDs.
¡ Measures you have taken, such as reconfiguration, cable swapping, and reboot.
¡ Output from the commands executed during the troubleshooting process.
· To ensure safety, wear an ESD wrist strap when you replace or maintain a hardware component.
· If hardware replacement is required, use the release notes to verify the hardware and software compatibility.
Collecting log and operating information
| IMPORTANT: To facilitate quick troubleshooting, execute the following commands: · info-center enable—Enables the information center. By default, the information center is enabled. · info-center logfile enable—Enables the log file feature so the system outputs logs to the log file. By default, the log file feature is enabled. · info-center diagnostic-logfile enable—Enables saving diagnostic logs to the diagnostic log file. By default, saving diagnostic logs to the diagnostic log file is enabled. |
Table 1 shows the types of files that the system uses to store operating log and status information. You can export these files by using FTP, TFTP, or USB.
In an IRF system, the common log and diagnostic log files are stored in the flash:/logfile and flash:/diagfile directories of the master device, respectively. Multiple devices will have log files if master/subordinate switchovers have occurred. You must collect log files from all member devices. To more easily locate log information, save the files to a separate folder for each member device, and include their member IDs in the folder names.
Table 1 Log and operating information
Category | File name format | Content |
Common log | logfile.log | Log messages about command executions, event occurrences, state changes, and so on. |
Diagnostic log | diagfile.log | Diagnostic log messages about device operation, including the following items: · Parameter settings used when an error occurs. · Information about a card startup error. · Handshaking information between member devices when a communication error occurs. |
Operating statistics | file-basename.tar.gz |
Current operating statistics for feature modules, including the following items: · Device status. · CPU status. · Memory status. · Configuration status. · Software entries. · Hardware entries. |
Collecting common log messages
1. Save the common log messages from the log buffer to a log file.
By default, the log file is saved in the logfile directory of the flash memory on each member device.
<Sysname> logfile save
The contents in the log file buffer have been saved to the file flash:/logfile/logfile.log
2. Identify the log file on each member device:
# Display the log file on the master device.
<Sysname> dir flash:/logfile/
Directory of flash:/logfile
0 -rw- 21863 Jul 11 2015 16:00:37 logfile.log
251904 KB total (147468 KB free)
# Display the log file on each subordinate device (subordinate device 2 for example):
<Sysname> dir slot2#flash:/logfile/
Directory of slot2#flash:/logfile
0 -rw- 21863 Jul 11 2015 16:00:37 logfile.log
251904 KB total (147468 KB free)
3. Transfer the files to the desired destination by using FTP, TFTP, or USB. (Details not shown.)
Collecting diagnostic log messages
1. Save the diagnostic log messages from the diagnostic log file buffer to a diagnostic log file.
By default, the diagnostic log file is saved in the diagfile directory of the flash memory on each member device.
<Sysname> diagnostic-logfile save
The contents in the diagnostic log file buffer have been saved to the file flash:/diagfile/diagfile.log
2. Identify the diagnostic log file on each member device:
# Display the diagnostic log file on the master device.
<Sysname> dir flash:/diagfile/
Directory of flash:/diagfile
0 -rw- 161321 Jul 11 2015 16:16:00 diagfile.log
251904 KB total (147468 KB free)
# Display the diagnostic log file on each subordinate device (subordinate device 2 for example):
<Sysname> dir slot2#flash:/diagfile/
Directory of slot2#flash:/diagfile
0 -rw- 161321 Jul 11 2015 16:16:00 diagfile.log
251904 KB total (147468 KB free)
3. Transfer the files to the desired destination by using FTP, TFTP, or USB. (Details not shown.)
Collecting operating statistics
You can collect operating statistics by saving the statistics to a file or displaying the statistics on the screen.
When you collect operating statistics, follow these guidelines:
· Log in to the device through a network port or management port (if any) instead of the console port as long as possible. Network and management ports are faster than the console port.
· Do not execute commands during operating statistics collection.
· As a best practice to ensure information completeness, save the statistics to a file.
| NOTE: The amount of time to collect statistics increases along with the number of IRF member devices. |
To collect operating statistics:
1. Collect operating statistics for multiple feature modules.
<Sysname> display diagnostic-information
Save or display diagnostic information (Y=save, N=display)? [Y/N] :
2. At the prompt, choose to save or display operating statistics:
# To save operating statistics, enter y at the prompt and then specify the destination file path.
Save or display diagnostic information (Y=save, N=display)? [Y/N] :y
Please input the file name(*.tar.gz) [flash:/diag_Sysname_20160101-000704.tar.gz] :flash:/diag.tar.gz
Diagnostic information is outputting to flash:/diag.tar.gz.
Please wait...
Save successfully.
<Sysname> dir flash:/
Directory of flash:
…
6 -rw- 898180 Jun 26 2013 09:23:51 diag.tar.gz
251904 KB total (147468 KB free)
# To display operating statistics on the monitor terminal, enter n at the prompt. (The output from this command varies by software version.)
Save or display diagnostic information (Y=save, N=display)? [Y/N] :N
===============================================
===============display clock===============
23:49:53 UTC Tue 01/01/2016
=================================================
---- More ----
3. Display operating statistics in the file.
# Decompress the file.
<Sysname> tar extract archive-file diag.tar.gz
Extracting archive flash:/diag.tar.gz Done.
<Sysname> gunzip diag.gz
Decompressing file flash:/diag.gz.... Done.
# Display the statistics in the file.
<Sysname> more diag
===============================================
===============display clock===============
23:49:53 UTC Tue 01/01/2016
=================================================
---- More ----
Contacting technical support
· Information described in "General guidelines."
· Product serial numbers.
This information will help the support engineer assist you as quickly as possible.
You can contact H3C Support at [email protected].
Troubleshooting hardware
This section provides troubleshooting information for common hardware issues.
| NOTE: · This section describes how to troubleshoot unexpected switch reboot, removable power modules, and fixed fan trays. To troubleshoot transceiver modules and ports, see "Troubleshooting ports." · Hardware varies by device model. For example, a switch might use fixed power modules or removable power modules. |
Unexpected switch reboot
Symptom
The switch reboots unexpectedly when it is operating.
Troubleshooting flowchart
Figure 1 Troubleshooting unexpected switch reboot
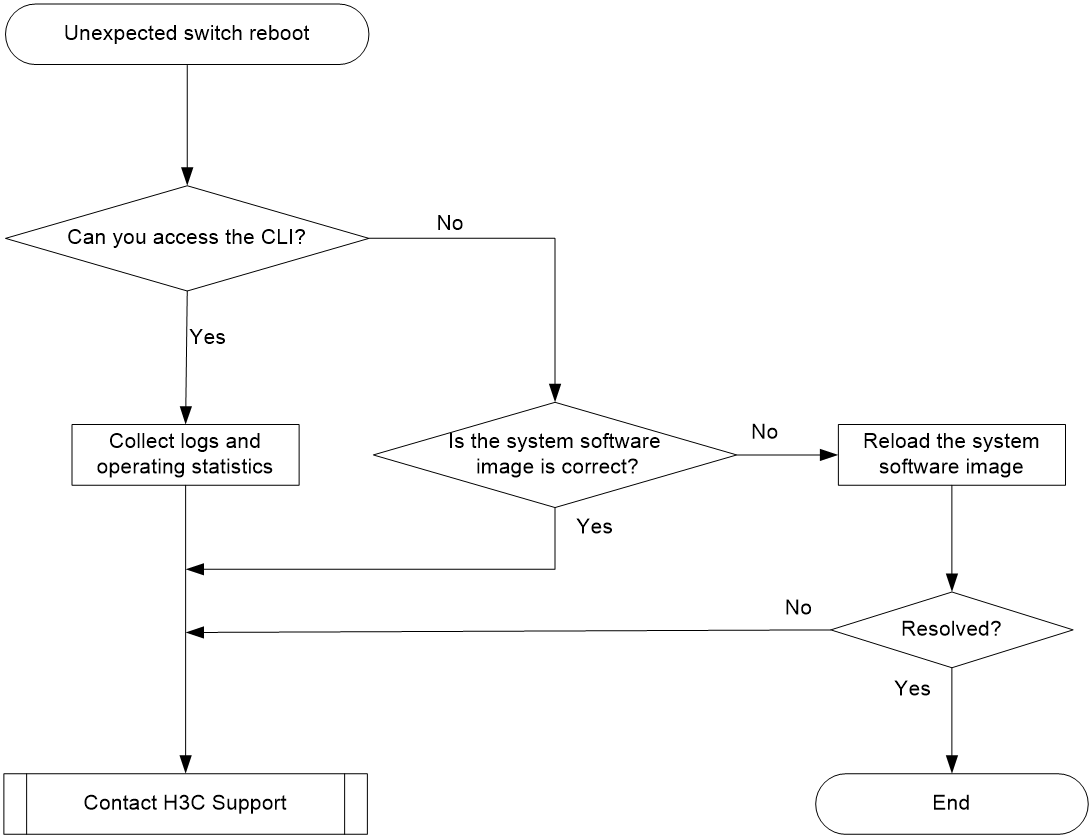
Solution
To resolve the issue:
1. Verify that you can access the CLI.
¡ If you can access the CLI, execute the display diagnostic-information command to collect operating statistics.
¡ If you cannot access the CLI, go to step 2.
2. Verify that the system software image on the switch is correct.
Log in to the switch through the console port and restart the switch. If the system reports that a CRC error has occurred or that no system software image is available during the BootWare loading process, reload the system software image on the BootWare menu and configure it as the current system software image.
3. If the issue persists, contact H3C Support.
Operating power module failure
Symptom
A trap or log is generated indicating that an operating power module is faulty.
Solution
To resolve the issue:
1. Execute the display power command to display power module information.
<Sysname> display power
Slot 1:
PowerID State Mode Current(A) Voltage(V) Power(W)
1 Normal DC -- -- --
2 Fault AC -- -- --
If the power module is in Absent state, go to step 2. If the power module is in Fault state, go to step 3.
2. If the power module is in Absent state, perform the following tasks:
a. Remove and reinstall the power module to make sure the power module is installed correctly. Then, execute the display power command to verify that the power module has changed to Normal state.
b. If the power module remains in Absent state, remove and reinstall the power module in an empty power module slot. Then, execute the display power command to verify that the power module has changed to Normal state.
c. If the power module remains in Absent state, replace the power module.
3. If the power module is in Fault state, perform the following tasks:
b. Verify that the power module surface is clean. If there is dust accumulated on the power module, remove the dust. Then remove and reinstall the power module. Execute the display power command to verify that the power module has changed to Normal state. If the power module remains in Fault state, go to step c.
c. Install the power module into an empty power module slot. Then execute the display power command to verify that the power module has changed to Normal state in the new slot. If the power module remains in Fault state, replace the power module.
4. If the issue persists, contact H3C Support.
Newly installed power module failure
Symptom
A trap or log is generated indicating that a newly installed power module is faulty.
Solution
To resolve the issue:
1. Execute the display power command to display power module information.
<Sysname> display power
Slot 1:
PowerID State Mode Current(A) Voltage(V) Power(W)
1 Normal DC -- -- 0
2 Fault AC -- -- 0
If the power module is in Absent state, go to step 2. If the power module is in Fault state, go to step 3.
2. When the power module is in Absent state, perform the following tasks:
a. Remove and reinstall the power module to make sure the power module is installed securely. Then execute the display power command to verify that the power module has changed to Normal state. If the power module remains in Absent state, go to step b.
b. Remove and install the power module into an empty power module slot. Then execute the display power command to verify that the power module has changed to Normal state in the new slot. If the power module remains in Absent state, go to step 4.
3. Remove and install the power module into an idle power module slot. Then execute the display power command to verify that the power module has changed to Normal state in the new slot. If the power module remains in Fault state, go to step 4.
4. If the issue persists, contact H3C Support.
Fan tray failure
Symptom
A fan tray is not operating correctly. The display fan command displays that the fan tray is in Fault state.
<Sysname> display fan
Slot 1:
Fan 1:
State : Normal
Fan 2:
State : Fault
Solution
Contact H3C Support to resolve the issue.
USB device anomaly
Symptom
The USB device connected to the USB port is in abnormal state.
Solution
To resolve the issue:
1. Display information about the USB device.
<Sysname> display device usb
slot 1:
Device Name : usba
State : Absent
If the USB device state is Absent, it has failed to be identified by the USB port. Go to 2.
2. Verify that the USB device is operating correctly.
Connect another USB device to the USB port. If this USB device cannot be identified, go to 3.
3. If the issue persists, contact H3C Support.
Interface card anomaly
Symptom
An interface card is in abnormal state.
Solution
To resolve the issue:
1. View the message displayed for the interface card.
%Jan 1 20:57:42:169 2013 H3C DRVPLAT/4/DrvDebug:
Subslot 1 can not support this card.
If the device outputs this message repeatedly, determine whether the device supports this interface card. If the device does not support this interface card, replace the interface card with one compatible with the device. If the issue persists, go to 4.
2. View interface card information on the device.
<sysname> display device manuinfo slot 1
Subslot 1:
DEVICE_NAME : LSWM2SP2PB
DEVICE_SERIAL_NUMBER : 210231A9UFM186A0000R
MANUFACTURING_DATE : 2018-06-19
VENDOR_NAME : H3C
…
If no information about the interface card is displayed, go to 3.
3. Verify that the interface card is installed securely.
Remove and reinstall the interface card and then view interface card information. If information about the interface card is still not available, go to 4.
4. If the issue persists, contact H3C Support.
Related commands
This section lists the commands that you might use for troubleshooting hardware.
Command | Description |
display device manuifo | Displays information about the device. |
display device usb | Displays operating information about USB devices. |
display fan | Displays operating information about fan trays. |
Troubleshooting ACL
This section provides troubleshooting information for common issues with ACLs.
ACL application failure with an error message
Symptom
The system fails to apply a packet filter or an ACL-based QoS policy to the hardware. It also displays the "Reason: Not enough hardware resource" message.
Solution
To resolve the issue:
1. Execute the display qos-acl resource command, and then check the Remaining field for ACL resources insufficiency.
If this field displays 0, the ACL hardware resources are exhausted.
2. To free hardware resources for packet filtering or QoS classification, remove unused ACLs.
3. If the issue persists, contact H3C Support.
ACL application failure without an error message
Symptom
The system applies a packet filter or an ACL-based QoS policy to the hardware. However, the ACL does not take effect.
Troubleshooting flowchart
Figure 2 Troubleshooting an ACL application failure
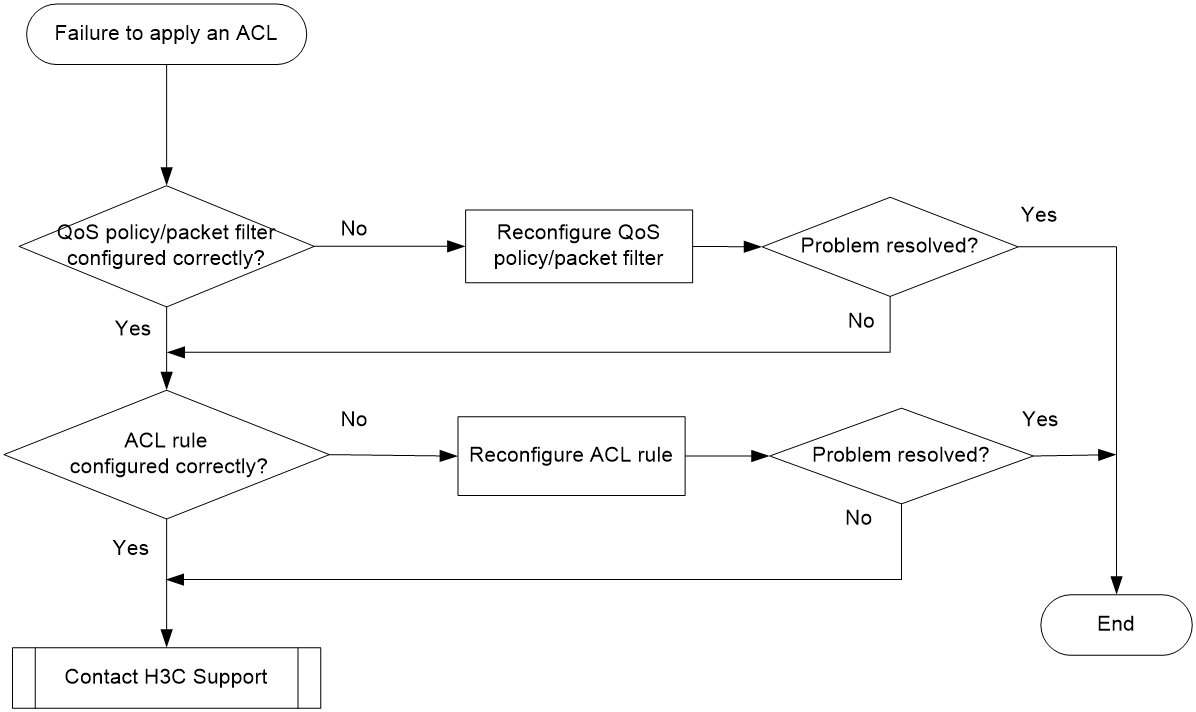
Solution
Choose a solution depending on the module that uses the ACL.
ACL used in a QoS policy
To resolve the issue when the ACL is used in a QoS policy:
1. Verify that the QoS policy is configured correctly:
a. Use one of the following commands to check the QoS policy for configuration errors, depending on the policy application destination:
Destination | Command |
Interface | display qos policy interface |
VLAN | display qos vlan-policy |
Global | display qos policy global |
b. If the QoS policy does not contain a class-behavior association, associate the traffic behavior with the traffic class.
c. If the QoS policy contains a class-behavior association, execute the display traffic classifier user-defined command and the display traffic behavior user-defined command to check for traffic class and behavior configuration errors, respectively.
- If they are configured incorrectly, reconfigure them.
- If they are configured correctly, go to step 2.
2. Verify that the ACL is configured correctly.
Execute the display acl command to check whether the ACL is configured correctly.
¡ If the ACL is configured incorrectly, reconfigure it.
¡ If the ACL is configured correctly, go to step 3.
3. If the issue persists, contact H3C Support.
ACL used in a packet filter
To resolve the issue when the ACL is used in a packet filter:
1. Verify that the packet filter is configured correctly.
Execute the display packet-filter command to check whether the packet filter is configured correctly.
¡ If there are any configuration errors, reconfigure the packet filter.
¡ If there is no configuration error, go to step 2.
2. Verify that the ACL is configured correctly.
Execute the display acl command to check whether the ACL is configured correctly.
¡ If the ACL is configured incorrectly, reconfigure it.
¡ If the ACL is configured correctly, go to step 3.
3. If the issue persists, contact H3C Support.
Related commands
This section lists the commands that you might use for troubleshooting ACLs.
Command | Description |
display packet-filter | Displays whether an ACL has been successfully applied to an interface for packet filtering. |
display qos-acl resource | Displays QoS and ACL resource usage. |
display qos policy global | Displays information about global QoS policies. |
display qos policy interface | Displays information about the QoS policies applied to an interface or to all interfaces. |
display qos vlan-policy | Displays information about QoS policies applied to VLANs. |
display traffic classifier user-defined | Displays traffic class configuration. |
display traffic behavior user-defined | Displays traffic behavior configuration. |
Troubleshooting IRF
This section provides troubleshooting information for common issues with IRF.
IRF fabric establishment failure
Symptom
An IRF fabric cannot be established.
Troubleshooting flowchart
Figure 3 Troubleshooting IRF fabric establishment failure
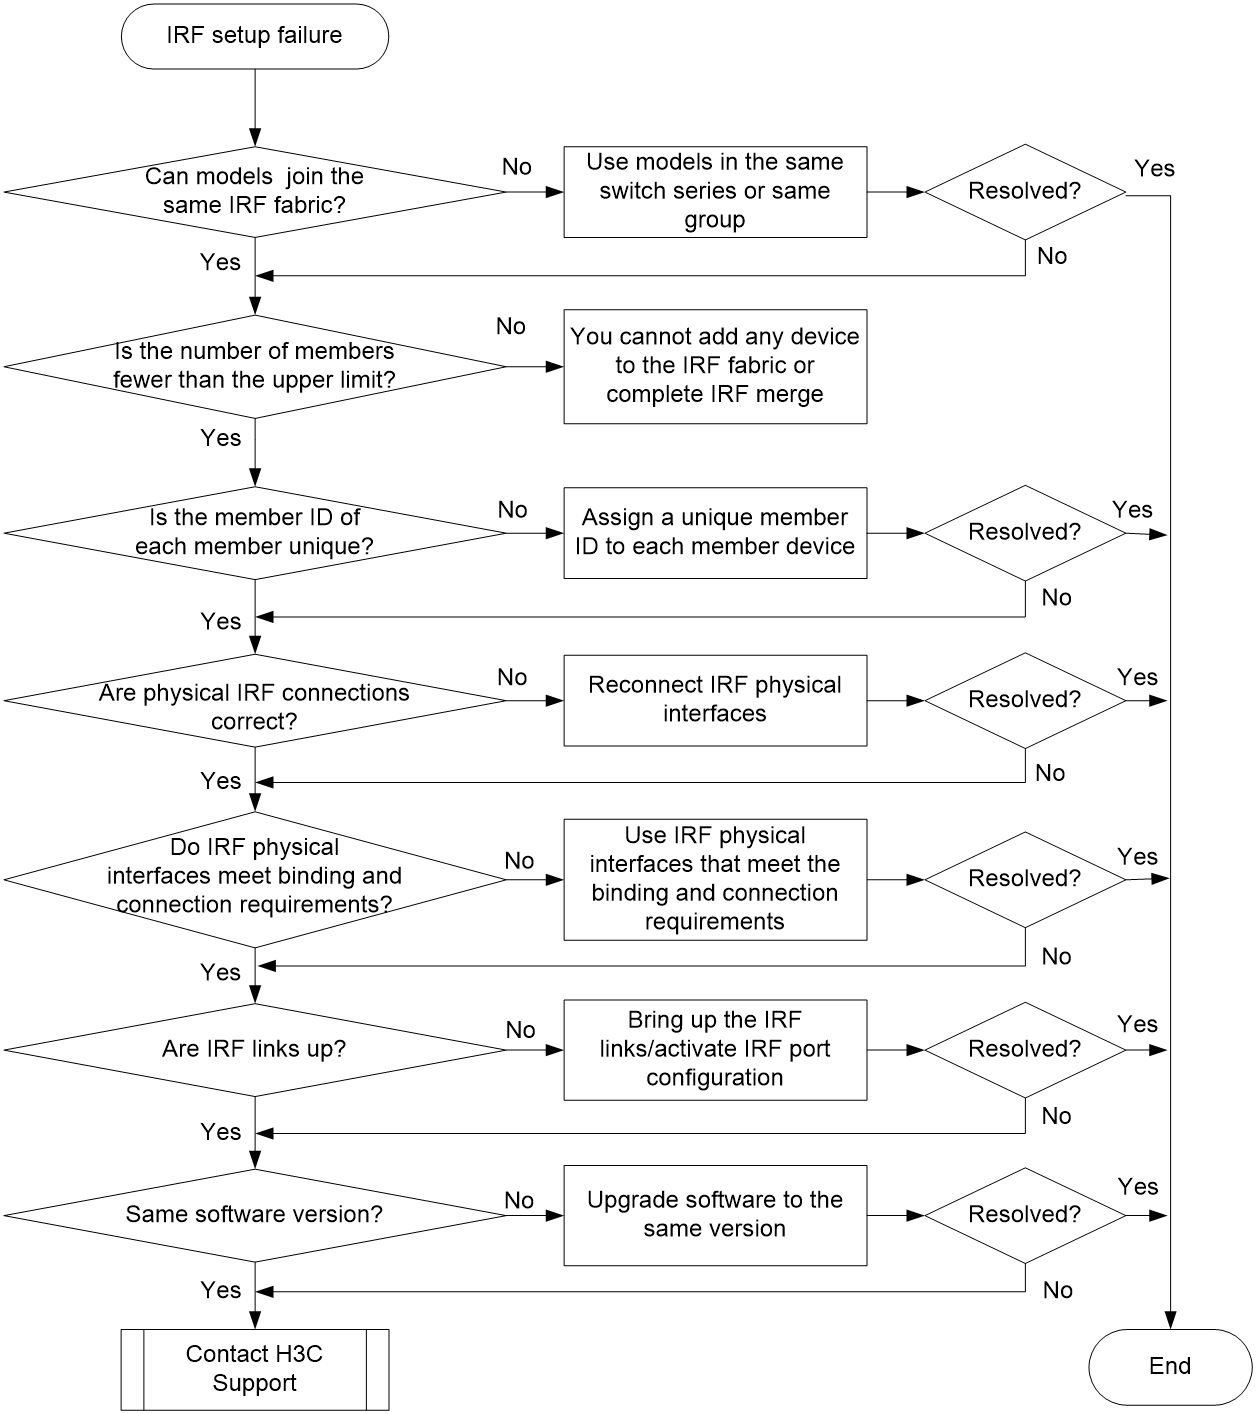
Solution
To resolve the issue:
1. Verify that the switch models can form an IRF fabric:
a. Verify that the member switches are from the same switch series.
b. Use the virtual technologies configuration guide for the switch series to verify whether the switches in the switch series are grouped for IRF compatibility. If they are grouped, make sure the IRF member switches are from the same IRF compatibility group.
2. Verify that the number of member devices does not exceed the upper limit (varies by software version and device model).
To obtain the upper limit for your device, contain H3C Support.
If you are adding a new member device to an existing IRF fabric or merging IRF fabrics, use the display irf command to identify the number of member devices in the IRF fabrics. If the total number of member devices exceeds the upper limit, the IRF setup will fail.
3. Verify that the member ID of each member device is unique:
a. Execute the display irf command to view the member ID of each member device.
b. Assign a unique member ID to each member.
- If you are adding a new member device to an existing IRF fabric, assign the member device a member ID that is not being used in the IRF fabric.
- If you are merging IRF fabrics, make sure each member device in these IRF fabrics has a unique member ID.
4. Verify that the physical IRF connections are correct:
a. Execute the display irf configuration command on each member device, and check the IRF-Port1 and IRF-Port2 fields for physical interfaces bound to IRF ports.
b. Verify that the physical interfaces of IRF-port 1 on one member are connected to the physical interfaces of IRF-port 2 on the other member.
5. Verify that the IRF physical interfaces meet the binding and connection requirements:
a. Verify that the physical interfaces bound to IRF ports can be used as IRF physical interfaces.
Table 2 Candidate IRF physical interfaces
Hardware platforms | Software version | Candidate IRF physical interfaces |
S5560S-EI[SI] switch series S5500V3-24P-SI switch S5500V3-48P-SI switch S5130S-HI switch series S5130S-EI switch series S5130S-SI switch series S5130S-LI switch series S5120V2-SI[LI] switch series S5110V2 switch series S5110V2-SI switch series S5000V3-EI switch series S5000E-X switch series S3100V3-EI[SI] switch series E128C & E152C & E500C & E500D switch series MS4520V2 & MS4320V2 & MS4300V2 & MS4200 switch series WS5800-WiNet switch series WAS6000 switch series | R63xx and later | Use the 10-GE, 5-GE, 2.5-GE, and 1-GE ports as IRF physical interfaces. Make sure a port is operating at its highest rate when it is used as an IRF physical interface. For example, a 10-GE port must operate at 10 Gbps when it acts as an IRF physical interface. Make sure all the member devices use ports of the same type as IRF physical interfaces. |
R612x | For all switches except the S5130S-28MP-EI, S5130S-52MP-EI, and S5130S-28MP-HPWR-EI switches and the S5000E-X switch series, only the following ports can be used as IRF physical interfaces: · 10-GE ports if the switches have 10-GE ports. The 10-GE ports must operate at 10 Gbps. · 1-GE ports if the switches do not have 10-GE ports. The 1-GE ports must operate at 1 Gbps. For the S5130S-28MP-EI, S5130S-52MP-EI, and S5130S-28MP-HPWR-EI switches, use only the following ports as IRF physical interfaces: · 5-GE autosensing ports operating at 5 Gbps. · 1-GE ports operating at 1 Gbps. For the S5000E-X switch series, use only the following ports as IRF physical interfaces: · 10-GE ports operating at 10 Gbps. · 1-GE ports operating at 1 Gbps. Make sure all the member devices use ports of the same type as IRF physical interfaces. | |
S5570S-EI switch series S5170-EI switch series S5120V3-EI[SI] switch series S5500V3-SI switch series (except the S5500V3-24P-SI and S5500V3-48P-SI switches) | R11xx | Use only the following ports as IRF physical interfaces: · 10-GE ports operating at 10 Gbps. · 1-GE ports operating at 1 Gbps. Make sure all ports bound to an IRF port are operating at the same rate. For switches that have six SFP+ ports, use the four highest numbered SFP+ ports as IRF physical interfaces. For switches that have four SFP+ ports, use the two highest numbered SFP+ ports. This configuration ensures that IRF protocol packets on these ports are forwarded in a queue with higher priority and prevents IRF split and other failures caused by IRF protocol packet malfunction when too many data packets are forwarded. |
S3600V3-EI switch series S3600V3-SI switch series | Use only the 1-GE ports as IRF physical interfaces. Make sure the ports operate at 1 Gbps when they are used as IRF physical interfaces. Make sure all ports bound to an IRF port are operating at the same rate. |
b. Verify that the cables and transceiver modules match the IRF physical interfaces.
If you use transceiver modules and fibers for IRF connections, make sure the transceiver modules at the two ends of the link are the same type.
c. Verify that the IRF port bindings meet the grouping restrictions if you use ports in a group for IRF links. When you use the ports in a group for IRF links, follow these restrictions and guidelines:
- If you use one port in a group as an IRF physical interface, the remaining ports in the group can only act as IRF physical interfaces. You cannot use them for any other purposes. To use a port in a group for any purpose other than IRF physical interfaces, do not bind any of the ports in the group to an IRF port.
- The ports in a group can be bound to different IRF ports.
- You must shut down all ports in a group before you can assign or remove any of the ports to or from an IRF port. To bring up the ports after the assignment or removal is complete, execute the undo shutdown command.
To identify ports in a port group, use the debug port mapping command in probe view. Ports that have the same unit value belong to the same group.
| IMPORTANT: The following information varies by device model: · Candidate IRF physical interfaces. · Port binding restrictions. · Applicable transceiver modules or cables. For more information, see configuration and installation guides for the device. |
6. Verify that all IRF links are up:
a. Execute the display irf topology command, and then check the Link field.
- If the Link field for each IRF port does not display DOWN, go to step 7.
- If the Link field for an IRF port in use displays DOWN, go to step b.
b. Execute the display irf link command, and then check the Status field of the physical interfaces bound to the IRF port.
- If the field displays DOWN or ADM (administratively down) for all the physical interfaces, remove the link failures or use the undo shutdown command to bring up the administratively down interfaces.
- If the field displays UP for a minimum of one of the physical interfaces, go to step c.
c. Save the configuration, and then execute the irf-port-configuration active command in system view to activate the IRF port configuration.
| IMPORTANT: Activating IRF port configuration requires a reboot. To prevent configuration loss, you must save the configuration before you execute the irf-port-configuration active command. |
7. Verify that all member devices use the same software version:
a. Execute the display version command to identify the software version of each member device.
b. Upgrade the software of all member devices to the same version. As a best practice, upgrade the earlier versions to the most recent version.
| NOTE: Typically, the irf auto-update enable command can automatically synchronize a member device with the software version of the master device. However, the synchronization might fail when the gap between the software versions is too large. For more information, see the release notes. |
8. If the issue persists, contact H3C Support.
Related commands
This section lists the commands that you might use for troubleshooting IRF.
Command | Description |
display irf | Displays IRF fabric information, including the member ID, role, priority, bridge MAC address, and description of each IRF member. |
display irf link | Displays IRF link information, including the member ID, IRF port, interfaces bound to each IRF port, and status of each IRF link. |
display irf configuration | Displays basic IRF settings, including the current member ID, new member ID, and physical interfaces bound to the IRF ports on each IRF member device. The new member IDs take effect at reboot. |
display irf topology | Displays the IRF fabric topology, including the member IDs, IRF port state, and adjacencies of IRF ports. |
display version | Displays system version information. |
irf-port-configuration active | Activates IRF configuration on IRF ports. |
Troubleshooting Ethernet link aggregation
This section provides troubleshooting information for common issues with Ethernet link aggregation.
Link aggregation failure
Symptom
Some member ports fail to be placed in Selected state, and link aggregation does not operate correctly.
Troubleshooting flowchart
Figure 4 Troubleshooting link aggregation failure
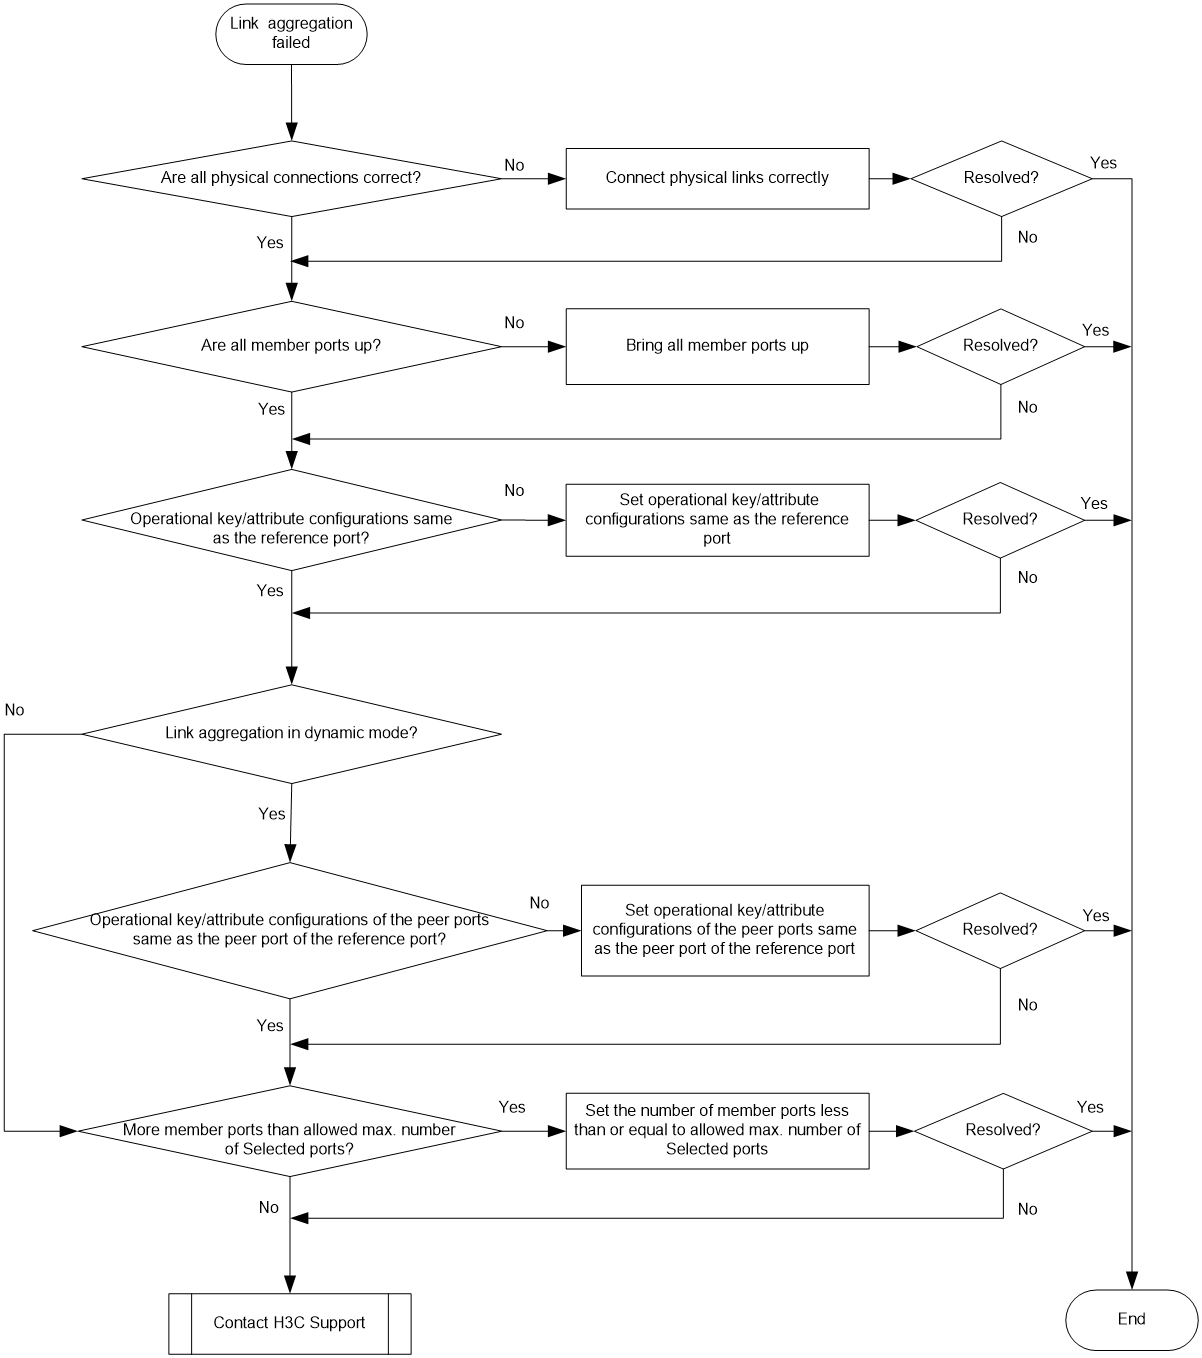
Solution
To resolve the issue:
1. Verify that all physical connections are correct.
You can verify the physical connections against your network plan.
2. Verify that all member ports are up:
a. Execute the display interface command to display the status of the member ports.
b. If the member ports are down, follow the solution in "Troubleshooting ports" to troubleshoot the issue.
3. Verify that the member ports have the same operational key and attribute configurations as the reference port:
a. Execute the display link-aggregation verbose command to display the Selected state of the member ports.
b. Execute the display current-configuration interface command to display the configurations of the aggregate interface and the Unselected ports.
c. Configure the Unselected ports to make sure they have the same operational key and attribute configurations as the reference port.
4. Identify the aggregation mode of the aggregation group.
¡ If the aggregation mode is static, proceed to step 6.
¡ If the aggregation mode is dynamic, proceed to step 5.
5. Verify that the peer member ports have the same operational key and attribute configurations as the peer port of the reference port:
a. Execute the display current-configuration interface command on the peer device to display the configurations of the peer member ports.
b. Configure the peer member ports to make sure the peer ports have the same operational key and attribute configurations as the peer port of the reference port.
6. Verify that the number of member ports in the aggregation group does not exceed the configured maximum number of Selected ports.
a. Execute the link-aggregation selected-port maximum command to set the maximum number of Selected ports allowed in the aggregation group. The value range is 1 to 16.
b. Execute the display link-aggregation verbose command to verify that the number of member ports does not exceed the configured maximum number of Selected ports.
If the number of member ports exceeds the maximum number of Selected ports, the ports with higher port numbers are in Unselected state.
c. Use the undo port link-aggregation group command to remove undesired member ports from the aggregation group.
This makes sure all member ports you assign to the aggregation group can become Selected ports.
7. If the issue persists, contact H3C Support.
Related commands
This section lists the commands that you might use for troubleshooting Ethernet link aggregation.
Commands | Description |
display current-configuration interface | Displays interface configuration. |
display interface | Displays Ethernet interface information. |
display link-aggregation verbose | Displays detailed information about the aggregation groups that correspond to the existing aggregate interfaces. |
link-aggregation selected-port maximum | Configures the maximum number of Selected ports allowed in an aggregation group. |
Troubleshooting ports
This section provides troubleshooting information for common port issues.
A fiber port fails to come up
Symptom
A fiber port fails to come up.
Troubleshooting flowchart
Figure 5 Troubleshooting link up failure on a fiber port
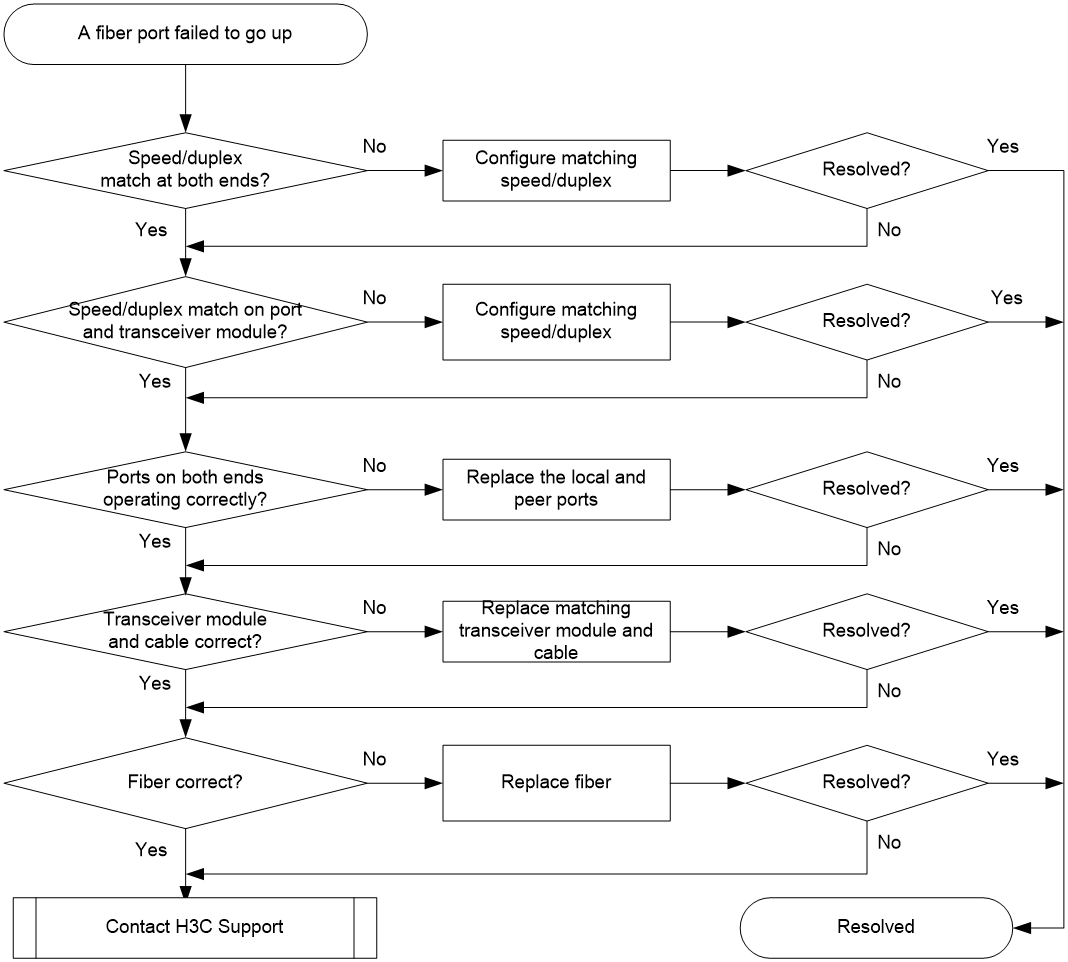
Solution
To resolve the issue:
1. Verify that the speed and duplex mode of the local port match the speed and duplex mode of the peer port:
a. Execute the display interface brief command to examine whether the speed and duplex mode of the port match the speed and duplex mode of the peer port.
b. If they do not match, use the speed command and the duplex command to set the rate and duplex mode for the port.
2. Verify that the speed and duplex mode of the local port match the speed and duplex mode of the transceiver module:
a. Execute the display interface brief command to examine whether the speed and duplex mode of the port match the speed and duplex mode of the transceiver module.
b. If they do not match, use the speed command and the duplex command to set the rate and duplex mode for the port.
3. Verify that the ports at both ends are operating correctly:
For a GE SFP port, use an SFP transceiver module and a fiber to connect it to another SFP port on the local end. For a 10-GE SFP+ fiber port, use an SFP+ cable (used for connection over a short distance) to directly connect it to another 10-GE SFP+ fiber port on the local end. Identify whether the port can come up:
¡ If the port can come up, you can determine that the peer port fails. Replace the peer port with a new port operating correctly.
¡ If the port cannot come up, you can determine that the local port fails. Replace the local port with a new port operating correctly.
4. Verify that the transceiver module and cable are operating correctly:
a. Use the display transceiver alarm interface command to display the alarms present on the transceiver module:
- The device displays None if no error occurs.
- The device displays alarms if the transceiver module fails or the type of the transceiver module does not match the port type.
b. Use an optical power meter to verify that the Tx power and Rx power of the transceiver module are stable and are within the correct range.
c. Execute the display transceiver interface command to verify that the wavelength and transmission distance of the local transceiver module are consistent with the wavelength and transmission distance of the peer transceiver module.
d. If the transceiver module is not operating correctly, replace it with a H3C transceiver module that matches the fiber port.
For more information about transceiver modules and cables, see the installation guide.
5. Verify that the fiber matches the transceiver module. If they do not match, replace the fiber with a new one that matches the transceiver module.
For more information about fibers, see the installation guide.
6. If the issue persists, contact H3C Support, and provide the following information:
<Sysname> display diagnostic-information
Save or display diagnostic information (Y=save, N=display)? [Y/N]:Y
A copper port fails to come up
Symptom
A copper port fails to come up.
Troubleshooting flowchart
Figure 6 Troubleshooting link up failure on a copper port
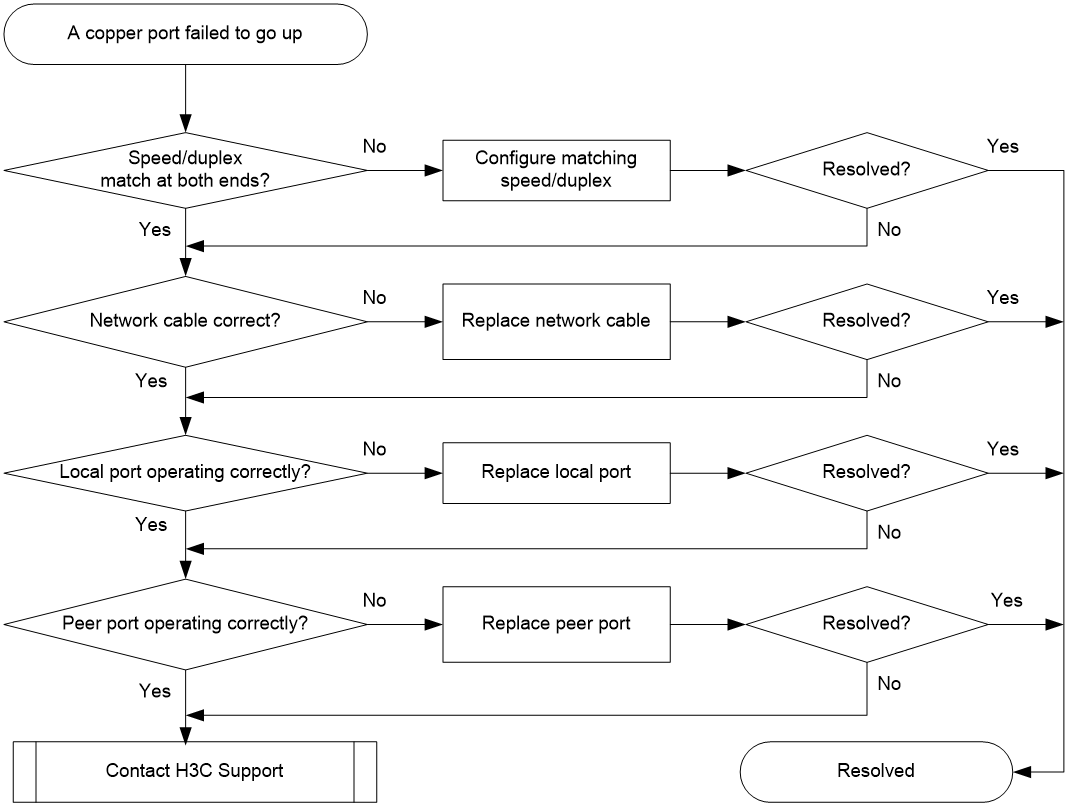
Solution
To resolve the issue:
1. Verify that the speed and duplex mode of the local port match the speed and duplex mode of the peer port:
a. Execute the display interface brief command to examine whether the speed and duplex mode of the port match the speed and duplex mode of the peer port.
b. If they do not match, use the speed command and the duplex command to set the rate and duplex mode for the port.
2. Replace the network cable with a new one to verify that the network cable is in good condition.
3. Replace the local port with a new one to verify that the local port is operating correctly.
4. Replace the peer port with a new one to verify that the peer port is operating correctly.
5. If the issue persists, contact H3C Support.
Related commands
This section lists the commands that you might use for troubleshooting ports.
Command | Remarks |
display diagnostic-information | Displays or saves running status data for multiple feature modules. |
display interface brief | Displays brief interface information. |
display transceiver alarm interface | Displays alarms present on transceiver modules. |
display transceiver interface | Displays key parameters of the transceiver module installed in an interface. |
Troubleshooting other issues
Layer 2 forwarding failure
Symptom
Layer 2 packet loss occurs when the switch forwards packets to a peer on the same network segment and in the same VLAN.
Troubleshooting flowchart
Figure 7 Troubleshooting Layer 2 packet loss failure
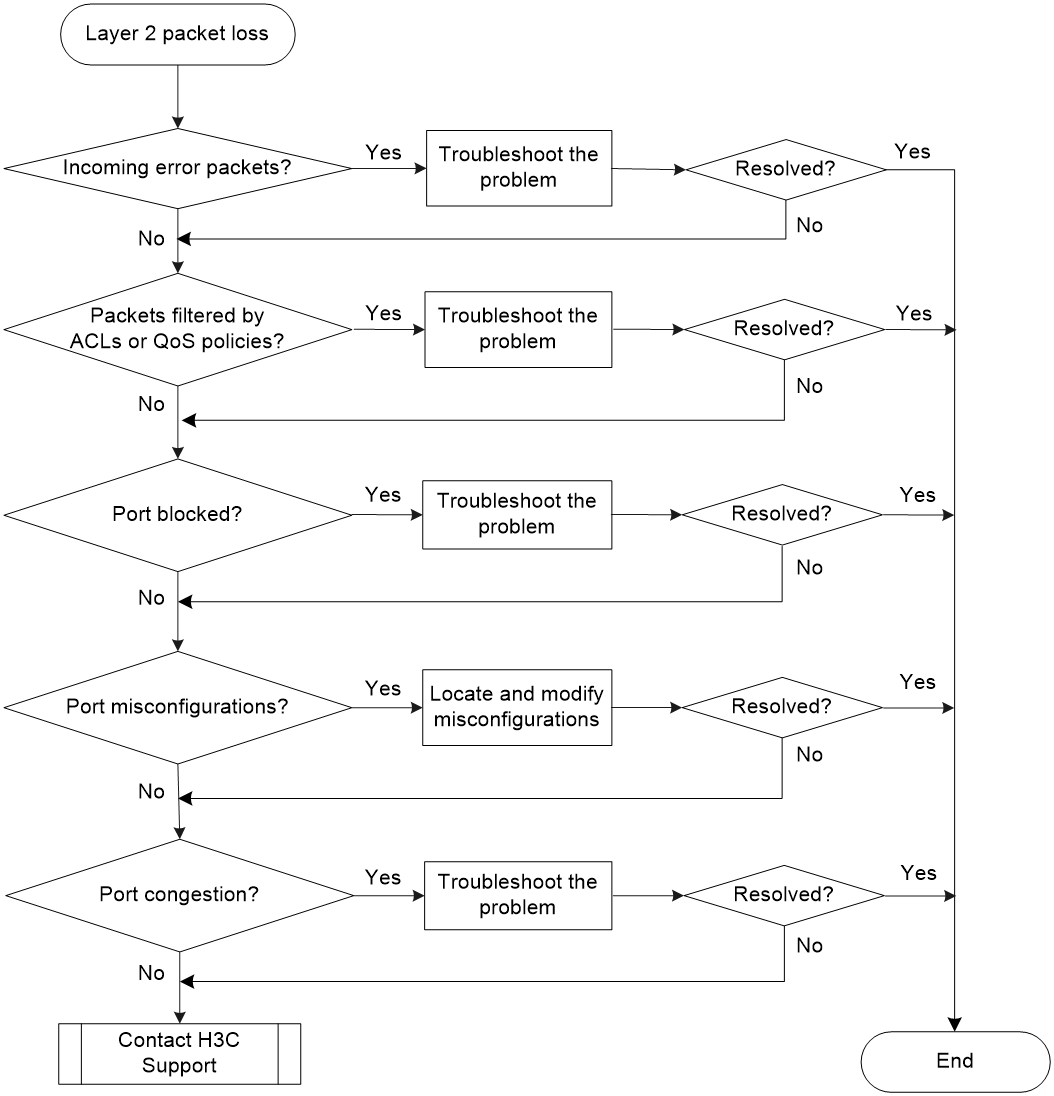
Solution
To resolve the issue:
1. Verify that no error packets have been received on the local port:
a. Execute the display interface command and check for error packets.
<Sysname>display interface Ten-GigabitEthernet1/0/25
Ten-GigabitEthernet1/0/25 current state: UP
Line protocol state: UP
IP Packet Frame Type: PKTFMT_ETHNT_2, Hardware Address: aa11-2233-4496
……
Last 300 seconds input: 0 packets/sec 10 bytes/sec 0%
Last 300 seconds output: 0 packets/sec 10 bytes/sec 0%
Input (total): 1438 packets, 480292 bytes
0 unicasts, 0 broadcasts, 1438 multicasts, 0 pauses
Input (normal): 1438 packets, - bytes
0 unicasts, 0 broadcasts, 1438 multicasts, 0 pauses
Input: 0 input errors, 0 runts, 0 giants, 0 throttles
0 CRC, 0 frame, - overruns, 0 aborts
- ignored, - parity errors
Output (total): 1440 packets, 475200 bytes
0 unicasts, 0 broadcasts, 1440 multicasts, 0 pauses
Output (normal): 1440 packets, - bytes
0 unicasts, 0 broadcasts, 1440 multicasts, 0 pauses
Output: 0 output errors, - underruns, - buffer failures
0 aborts, 0 deferred, 0 collisions, 0 late collisions
0 lost carrier, - no carrier
b. If the statistics are not zero, the following failures might occur:
- Interface hardware failure—To test such a failure, connect the cable that is connected to the local port to a correctly operating port (for example, Port A) with the same configurations as the local port. If Port A forwards traffic correctly, you can determine that the hardware of the local port fails. In this event, you must replace the local port with a correctly operating port.
- Transceiver module, fiber, or twisted pair failure—To test and resolve such a failure, replace the transceiver module, fiber, or twisted pair with a good one.
- Inconsistent configurations—Verify that the configurations (including speed and duplex mode) of the peer are consistent with the local port. If they are inconsistent, modify the configurations of the local port.
c. If the issue persists, contact H3C Support.
2. Verify that packets are not mistakenly filtered out by ACLs:
a. Examine the ACL and QoS policy configurations for packet filtering on the port, on the VLAN of the port, or globally. If packets are mistakenly filtered out, modify the ACL or QoS policy configuration.
- To display the ACL configuration on the port for packet filtering, execute the display packet-filter command.
- To display the QoS policy configuration on the port, execute the display qos policy command.
- To display the QoS policy configuration on the VLAN of the port, execute the display qos vlan-policy command.
- To display the global QoS policy configuration, execute the display qos policy global command.
b. Verify that packets are not filtered out by automatically created ACLs.
- The IP source guard feature creates ACLs automatically.
Execute the display this command in Ethernet interface view to verify that the ip source guard command is configured on the port. To display source guard binding entries, execute the display ip source binding or display ipv6 source binding command. If the ip source binding command or ip verify source command is configured but the packets match no entry, further troubleshoot the issue based on the way the binding entries are created.
- The EAD assistant feature creates ACLs automatically.
The EAD assistant feature discards packets for a user that fails authentication when the user accesses an IP address not in the free IP segment.
Execute the display dot1x command to verify that the EAD assistant feature is enabled. If the EAD assistant feature is enabled, identify whether the user fails the authentication and accesses an IP address not in the free IP segment.
3. Verify that the port is not blocked:
¡ Execute the display stp brief command to verify that STP does not set the state of the port to discarding. When the port is in discarding state, it cannot forward traffic. H3C recommends that you disable STP on the port, or configure the port as an edge port if the port is connected to a terminal device.
¡ If the port belongs to an aggregation group, execute the display link-aggregation verbose command to identify the port status. When the port is an Unselected port, it cannot forward traffic. Locate the reasons why the port is in Unselected state. For example, the attribute configurations of the port are different from the configurations of the reference port.
¡ If the port belongs to a smart link group, execute the display smart-link group command to verify the port status. The port cannot forward packets if its state is standby or down. If the port is standby, configure the port as a primary port. If the port is down, verify the causes and resolve the issue as required. A port might go down if the uplink device is configured with the monitor link function, the port is shut down, or the link fails.
4. Examine the following configurations that might cause packet loss:
¡ VLAN configuration—Execute the display this command in Ethernet interface view to verify that the port is in the VLAN of the packets. If it is not, add the port to the VLAN.
¡ Blackhole MAC address entries—Execute the display mac-address blackhole command to display blackhole MAC address entries. If the packets are discarded because they match a blackhole MAC address entry, delete the entry. To delete the blackhole MAC address entry, execute the undo mac-address blackhole mac-address vlan vlan-id command.
¡ Rate limit—Execute the display qos lr interface command to display the rate limit configuration on the port. If rate limit is configured on the port, make sure the committed information rate (CIR) and the committed burst size (CBS) are appropriate. To adjust the CIR and CBS values, execute the qos lr { inbound | outbound } cir committed-information-rate [ cbs committed-burst-size ] command.
¡ Storm suppression—Execute the display this command in Ethernet interface view to display the configuration of storm suppression. Storm suppression includes broadcast suppression, multicast suppression, and unknown unicast suppression. To adjust the suppression thresholds, execute the broadcast-suppression, multicast-suppression, and unicast-suppression commands, respectively.
5. Verify that no congestion occurs by using the display qos queue interface command.
If congestion occurs, locate and resolve the issue by referencing related congestion management documents.
6. If the issue persists, contact H3C Support.
Related commands
This section lists the commands that you might use for troubleshooting Layer 2 forwarding failure.
Command | Description |
display dot1x | Displays session information, statistics, and configurations about 802.1X. |
display interface | Displays Ethernet interface information. |
display ip source binding | Displays IPv4 source guard binding entries. |
display ipv6 source binding | Displays IPv6 source guard binding entries. |
display link-aggregation verbose | Displays detailed information about the aggregation groups that correspond to the aggregate interfaces. |
display mac-address blackhole | Displays blackhole MAC address entries. |
display packet-filter | Displays whether an ACL has been successfully applied to an interface for packet filtering. |
display qos lr interface | Displays the rate limit configuration and statistics on a specified interface or all the interfaces. |
display qos policy | Displays user-defined QoS policy configuration information. |
display qos policy global | Displays information about global QoS policies. |
display qos policy interface | Displays information about the QoS policies applied to an interface or all interfaces. |
display qos queue interface | Displays traffic statistics collected for an interface on a per-queue basis. |
display qos vlan-policy | Displays information about QoS policies applied to VLANs. |
display smart-link group | Displays smart link group information. |
display this | Displays the running configuration in the current view. |
Layer 3 forwarding failure
Symptom
Packet loss occurs when the switch forwards packets to a different network.
Troubleshooting flowchart
Figure 8 Troubleshooting Layer 3 forwarding failure
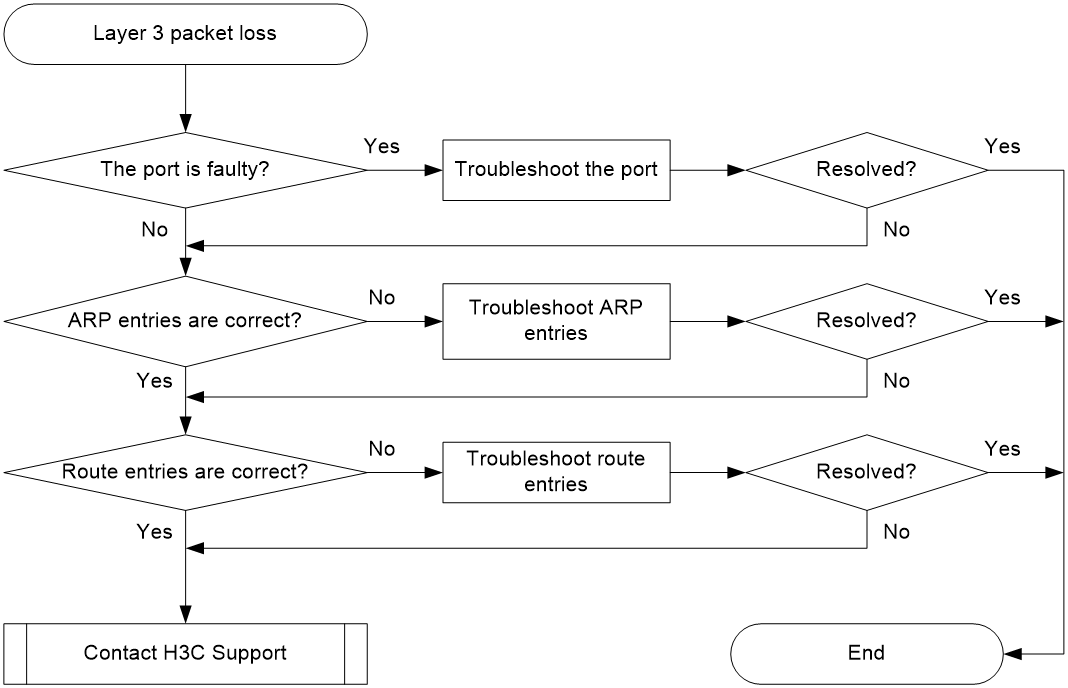
Solution
To resolve the issue:
1. Verify that the port is not faulty (due to hardware or configuration issues).
If the port is faulty, follow the solution in "Layer 2 forwarding failure" to troubleshoot the issue.
2. Verify that ARP entries are correct:
a. Execute the display arp command to verify that ARP entries are correct.
- If incorrect ARP entries exist, execute the debugging arp packet command to locate the issue.
- If the switch learns no ARP entries, you can execute the arp static command to configure static ARP entries.
b. Execute the display mac-address command to verify that the output interfaces in the MAC address entries and ARP entries are the same by using the display mac-address command.
If the output interfaces are not the same, execute the reset command to clear the ARP entries. Then the switch can learn ARP entries again.
3. Verify that route entries are correct:
a. Execute the display ip routing-table command to verify that route entries are correct.
If incorrect route entries exist, troubleshoot the protocol that learns the route entries.
b. Execute the display fib command to verify that the output interfaces in the FIB entries and route entries are the same.
If the output interfaces are not the same, execute the reset command to clear the route entries. Then the switch can learn route entries again.
4. If the issue persists, contact H3C Support.
Related commands
This section lists the commands that you might use for troubleshooting Layer 3 forwarding failure.
Command | Description |
debugging arp packet | Enables ARP packet debugging. |
display arp | Displays ARP entries. |
display fib | Displays FIB entries. |
display ip routing-table | Displays brief information about active routes in the routing table. |
display mac-address | Displays MAC address entries. |
Protocol flapping
Symptom
The switch cannot send or receive protocol packets.
Troubleshooting flowchart
Figure 9 Troubleshooting protocol flapping
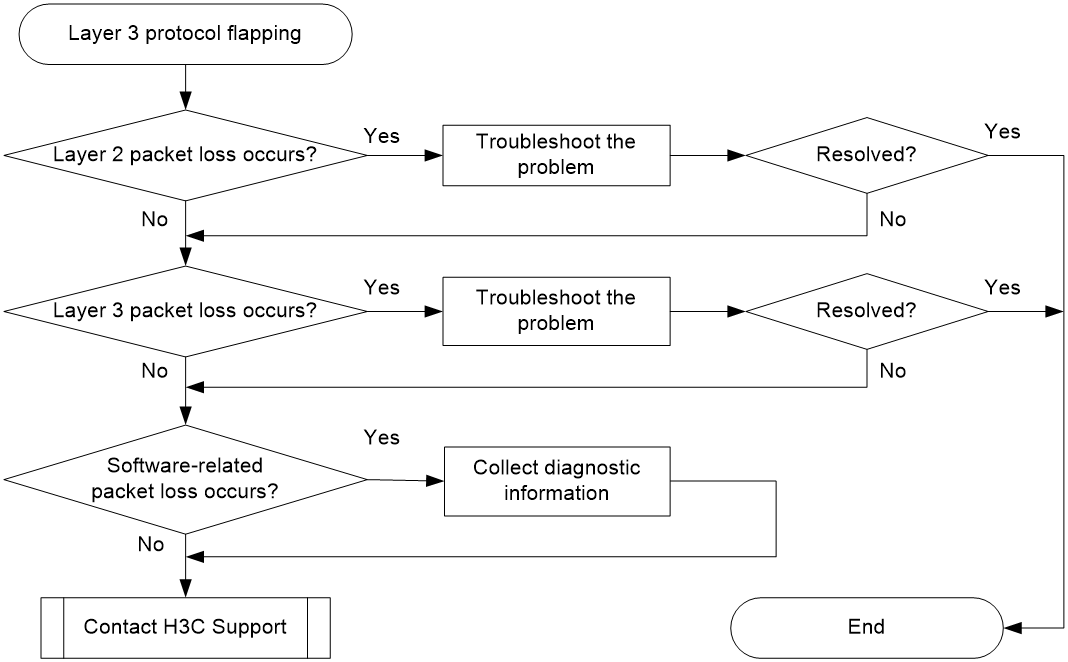
Solution
To resolve the issue:
1. Verify that Layer 2 is operating correctly, as described in "Layer 2 forwarding failure."
2. Verify that Layer 3 is operating correctly, as described in "Layer 3 forwarding failure."
3. Execute the debug rxtx softcar show 1 command in probe view to check for software-related packet loss.
[Sysname-probe] debug rxtx softcar slot 1
ID Type RcvPps Rcv_All DisPkt_All Pps Dyn Swi Hash ACLmax
0 ROOT 0 0 0 300 S On SMAC 0
1 ISIS 0 0 0 200 D On SMAC 8
2 ESIS 0 0 0 100 S On SMAC 8
3 CLNP 0 0 0 100 S On SMAC 8
4 VRRP 0 0 0 1024 S On SMAC 8
5 UNKNOWN_IPV4MC 0 0 0 100 S On SMAC 8
6 UNKNOWN_IPV6MC 0 0 0 100 S On SMAC 8
7 IPV4_MC_RIP 0 0 0 150 D On SMAC 8
8 IPV4_BC_RIP 0 0 0 150 D On SMAC 8
9 MCAST_NTP 0 0 0 100 S On SMAC 8
10 BCAST_NTP 0 0 0 100 S On SMAC 8
4. If the issue persists, contact H3C Support.
When you contact H3C Support, provide diagnostic information if software-related packet loss occurred.
PoE power supply anomaly
Symptom
The PoE device cannot supply power correctly.
Troubleshooting flowchart
Figure 10 Troubleshooting PoE power supply anomaly
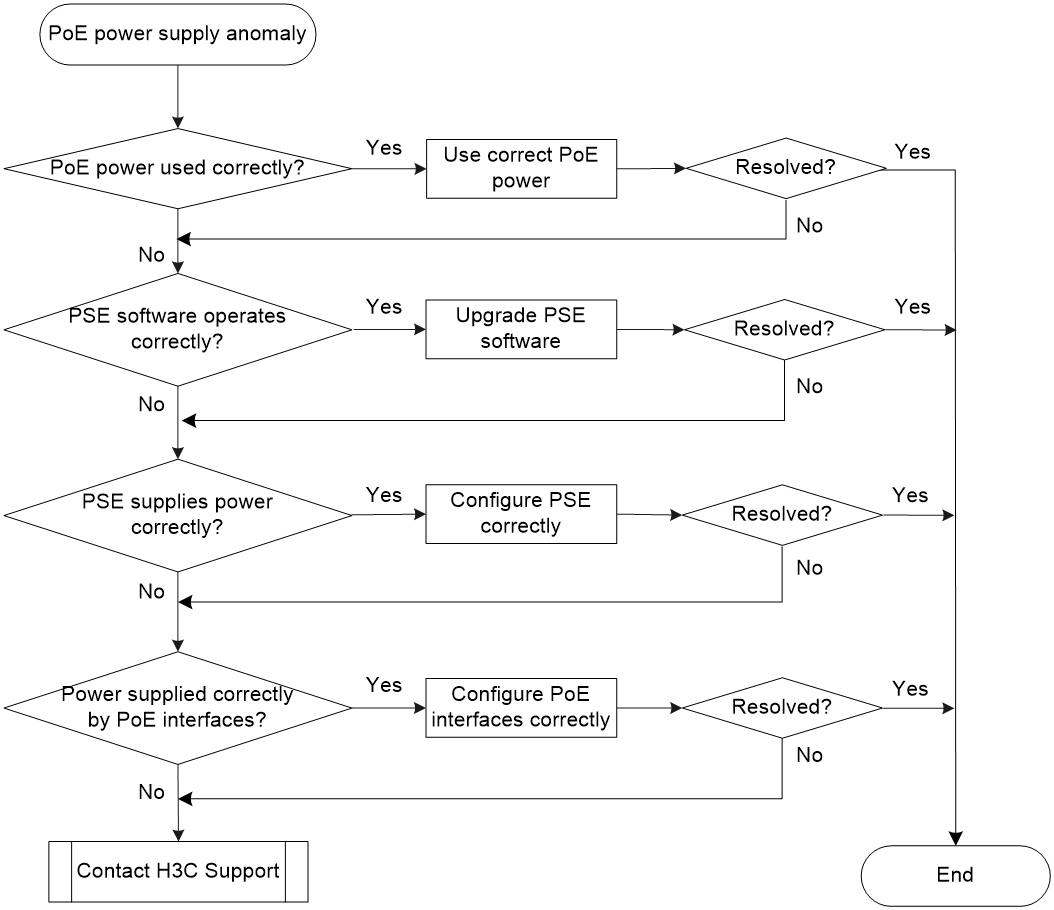
Solution
To resolve the issue:
1. Verify that the PoE power is correctly used.
For a PoE switch, use the PoE power according to the PoE power supply scheme. For information about the power supply compatibility, see the installation guide for your device.
2. Execute the following commands to display power supply information:
a. Execute the display poe device command in any view to display PSE information, and check the faulty field to identify PSE issues.
<Sysname> display poe device
PSE ID SlotNo SubSNo PortNum MaxPower(W) State Model
4 1 0 24 370 faulty LSW124POED-M
The output shows that the PSE has issues.
b. Execute the poe update command to upgrade the PSE processing software in service.
<Sysname> system-view
[Sysname] poe update full ver_3_9_0_release.bin pse 4
This command will fully update firmware on the specific PSE(s), Continue? [Y/N]:y
System is downloading firmware into the hardware. Please wait
Update firmware on the specific PSE(s) successfully!
The output shows that the PSE processing software has been upgraded.
c. Execute the display poe device command again to display PSE information, and check the on or off field for the PSE state.
[Sysname] display poe device
PSE ID SlotNo SubSNo PortNum MaxPower(W) State Model
4 1 0 24 370 off LSW124POED-M
The output shows that the PSE issue has been resolved.
d. Execute the display poe pse command in any view to display detailed PSE information. Verify the following:
- The current power, average power, and peak power of the PSE are correct.
- Nonstandard PD detection by the PSE is enabled.
[Sysname] display poe pse
PSE ID : 4
PSE Slot No : 1
PSE SubSlot No : 0
PSE Model : LSW124POED-M
PSE Power Enabled : enabled
PSE Power Priority : -
PSE Current Power : 0 W
PSE Average Power : 0 W
PSE Peak Power : 0 W
PSE Max Power : 370 W
PSE Remaining Guaranteed : 370 W
PSE CPLD Version : -
PSE Software Version : 390
PSE Hardware Version : 57603
PSE Legacy Detection : disabled
PSE Utilization-threshold : 80
PSE Pd-policy Mode : disable
PSE PD Disconnect Detect Mode : AC
If the current power, average power, and peak power of the PSE are close to or reach the maximum power of the PSE, use PoE power with higher-wattage supply.
If the PSE Pd-policy Mode field displays disable, execute the poe legacy enable pse command to enable nonstandard PD detection by the PSE.
e. Execute the display poe interface gigabitethernet 1/0/1 command in any view to display power supply information for GigabitEthernet 1/0/1. Verify the following:
- The current power, average power, and peak power of the PoE interface are correct.
- The PoE interface current and voltage are correct.
<Sysname> display poe interface smartrate-ethernet 1/0/1
Port Power Enabled : disabled
Port Power Priority : low
Port Operating Status : off
Port IEEE Class : 0
Port Detection Status : disabled
Port Power Mode : signal
Port Current Power : 0 mW
Port Average Power : 0 mW
Port Peak Power : 0 mW
Port Max Power : 30000 mW
Port Current : 0 mA
Port Voltage : 0.0 V
Port PD Description :
If the current power, average power, and peak power of the PoE interface are close to or reach the maximum power of the PoE interface, execute the poe max-power command to configure the maximum power with higher-wattage supply.
3. If the issue persists, contact H3C Support.
Related commands
This section lists the commands that you might use for troubleshooting PoE.
Command | Description |
display poe device | Displays PSE information. |
display poe interface interface-type interface-number | Displays power supply information for PoE interfaces. |
display poe pse | Displays detailed PSE information. |
poe legacy enable pse | Enables the PSE to detect nonstandard PDs. |
poe max-power | Configures the maximum power for a PoE interface. |
