
- Released At: 27-01-2025
- Page Views:
- Downloads:
- Table of Contents
- Related Documents
-
H3C UIS Manager Maintenance Guide
Document version: 5W100-20250126
Copyright © 2025 New H3C Technologies Co., Ltd. All rights reserved.
No part of this manual may be reproduced or transmitted in any form or by any means without prior written consent of New H3C Technologies Co., Ltd.
Except for the trademarks of New H3C Technologies Co., Ltd., any trademarks that may be mentioned in this document are the property of their respective owners.
The information in this document is subject to change without notice
Contents
Identifying the cluster HA feature· 4
Identifying the shared storage in the cluster 4
Identifying host information· 4
Identifying the uptime of a host 5
Identifying host performance monitoring information· 5
Identifying vSwitch information· 9
Identifying physical NIC status· 9
Identifying the running status of CAStools· 10
Verifying disk and NIC types· 10
Identifying VM performance monitoring statistics· 11
Identifying VM backup information· 14
Identifying license information· 15
Configuration cautions and guidelines· 17
Starting or shutting down a UIS host 18
IP address and host name change· 18
Managing physical interfaces bound to a vSwitch· 19
Replacing a disk on a CVK host 27
Changing the password for accessing UIS Manager 27
Changing the root password of a host from the Web interface· 28
Changing the admin password· 28
Scaling out and scaling in a cluster 29
Performing a heterogeneous or homogeneous migration· 29
Obtaining the XML file of the VM·· 29
Identifying the storage volume for VM disk files· 32
Copying the XML file of the VM to the target host 32
Defining the VM through XML· 32
Clearing VM data on the original host 33
Configuring stateful failover 33
Replacing SSDs with NVMe drives· 34
Configuring storage disaster recovery· 34
Collecting logs of the UIS Manager 35
Collecting logs from the Web interface· 35
Collecting logs at the CLI of a CVK host 35
Collecting logs of CAStools· 40
Collecting logs of a VM operating system·· 40
Collecting logs of a Windows operating system·· 40
Viewing logs of a Windows operating system·· 42
Collecting logs of a Linux operating system·· 43
Troubleshooting tools and utilities· 44
Analysis with the Kdump file· 44
/var/log/ceph/ceph-osd.*.log· 49
/var/log/ceph/ceph-disk.log· 49
/var/log/ceph/ceph-mon.*.log· 50
/var/log/calamari/calamari.log· 50
/var/log/onestor_cli/ onestor_cli.log· 50
Distributed storage maintenance· 52
Rebalancing data placement when data imbalance occurs· 52
Resolving host issues caused by a full system disk· 53
Issues caused by network failure· 54
Handling failures to add or delete hosts· 54
Deleting a monitor node offline and restoring the node· 55
Deleting a storage node offline and restoring the node· 55
Missing or changing sdX device names due to host restart 55
Failure to display O&M and monitoring data· 58
Failure to display O&M and monitoring data (1) 58
Failure to display O&M and monitoring data (2) 59
Cluster initialization issues· 61
Compute cluster creation failure· 61
Storage configuration failure· 61
Health index lower than 100%·· 62
Deletion failure prompt for successful host deletion· 63
OSD process terminated unexpectedly· 67
UIS management node failure· 71
Down monitoring node due to high system disk usage· 73
Down monitoring node due to network error 74
Extent backup file decompression· 75
Script for data restoration· 75
Shared storage space reclamation· 76
Releasing space of a shared volume by editing the VM bus type· 76
Releasing space of a shared volume by deleting files· 78
Get responses not received by an NMS· 78
Data of a value-added service in the memory is different from that in the database· 80
Data inconsistency occurs if you mount a volume on a Windows client and create a snapshot online 80
The state of a snapshot is Creating, Deleting, or Restoring· 82
When the intel ixgbe network adapter is enabled with load balancing, storage access gets slow· 82
Using a QoS policy with low bandwidth and IOPS limits makes the storage disks of a client slow· 83
Failure to recognize an encryption dongle by VMs· 84
After a USB device is plugged into a CVK host, the host cannot recognize the USB device· 84
Use of USB-to-serial devices· 89
Disk performance optimization· 90
Guest OS and VM restoration· 96
Restrictions and guidelines· 96
Windows repair operations and steps· 101
Space occupation issue due to manual operations· 106
Space occupation issue due to software issues· 107
Message The maximum number of pending replies per connection has been reached generated· 108
Unified authentication issue· 109
CAS authentication service exception· 109
Cloud-native engine container service commands· 134
Process management commands· 151
Routine maintenance
Stable operation of the UIS system requires maintenance works that typically include reviewing alarms, identifying cluster status, host information, virtual machine (VM) status, license information, and reviewing logs.
Reviewing alarms
The UIS platform main page displays indicators for critical alarms, major alarms, minor alarms, and information alarms generated during UIS system operation in the top right corner.
If critical or major alarms are displayed, the UIS system operation might contain anomalies that require immediate troubleshooting.
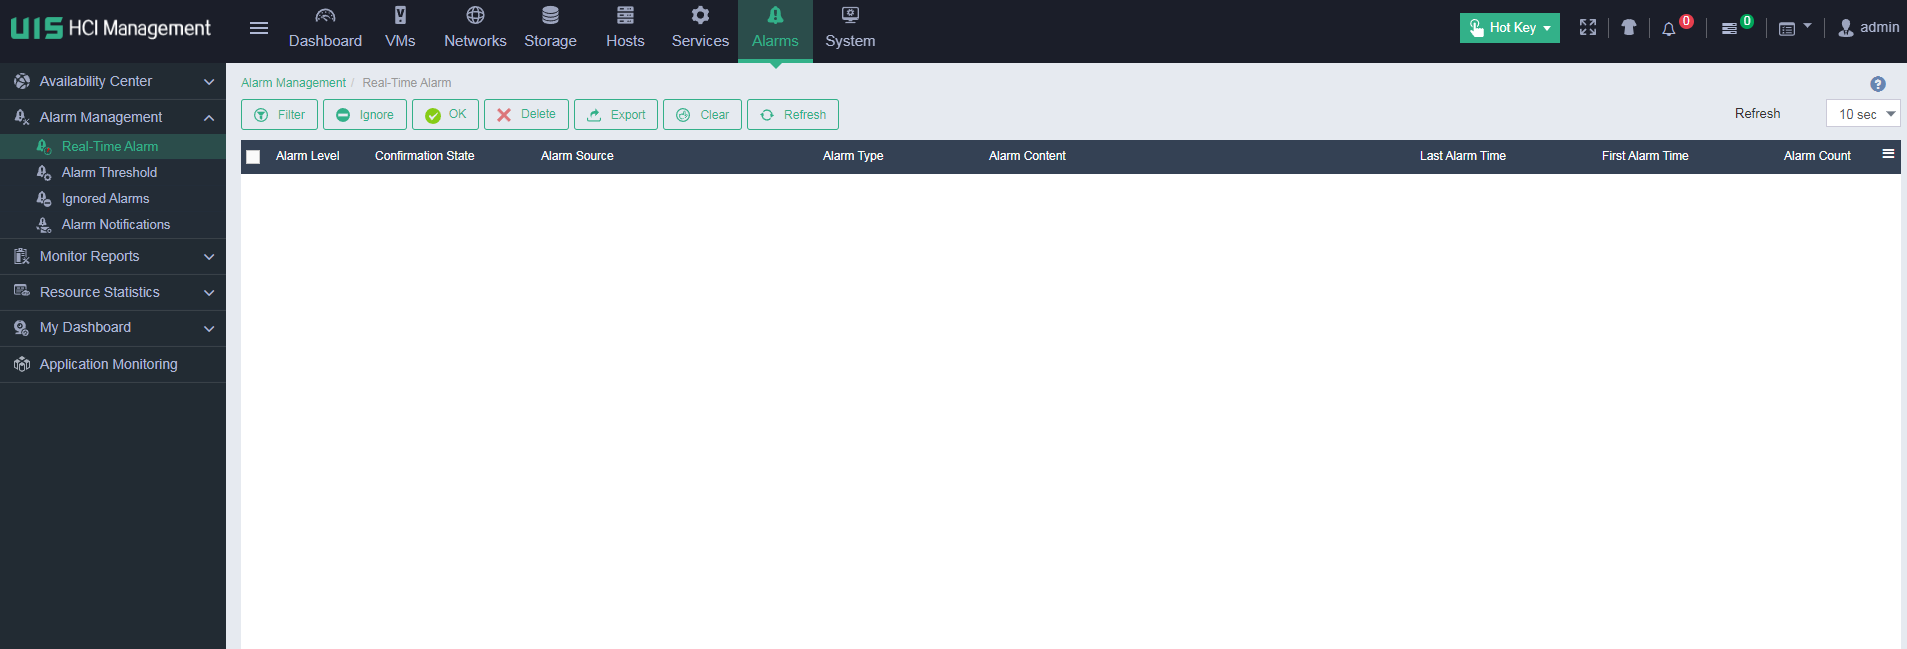
By clicking the corresponding alarm indicator, you can access the associated real-time alarm page. Alternatively, you can navigate to the Alarm Management > Real-Time Alarm page.
You can perform troubleshooting based on the alarm source, type, content, and the last alarm time on the real-time alarm page.
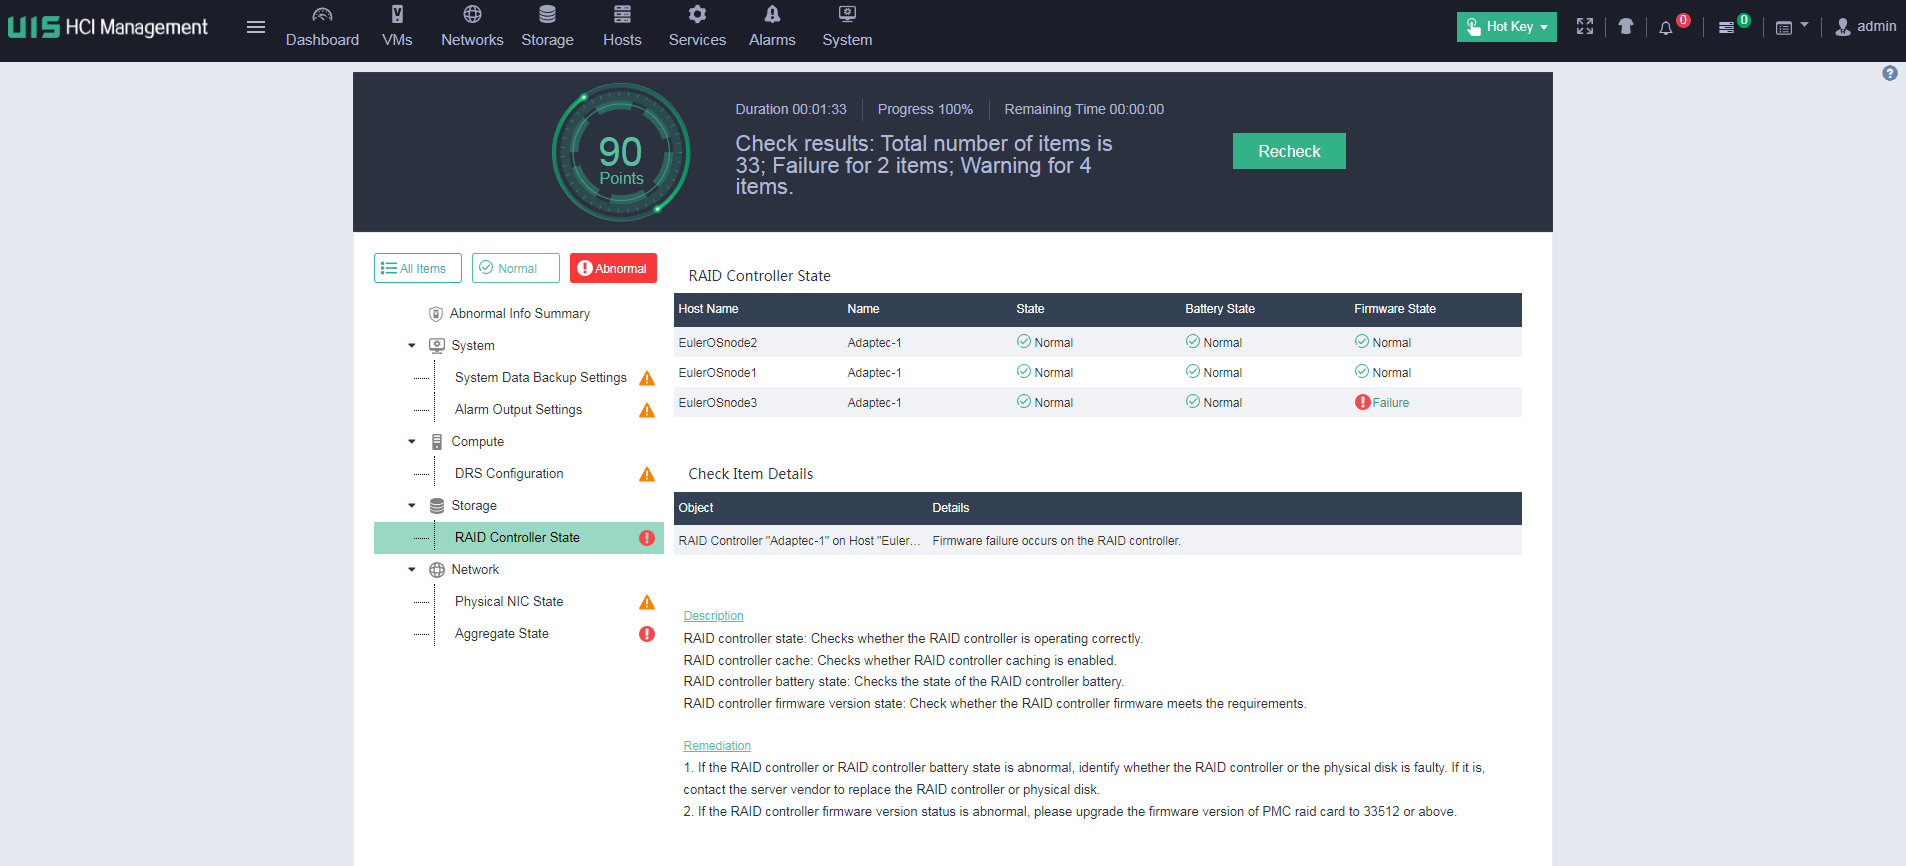
Performing health check
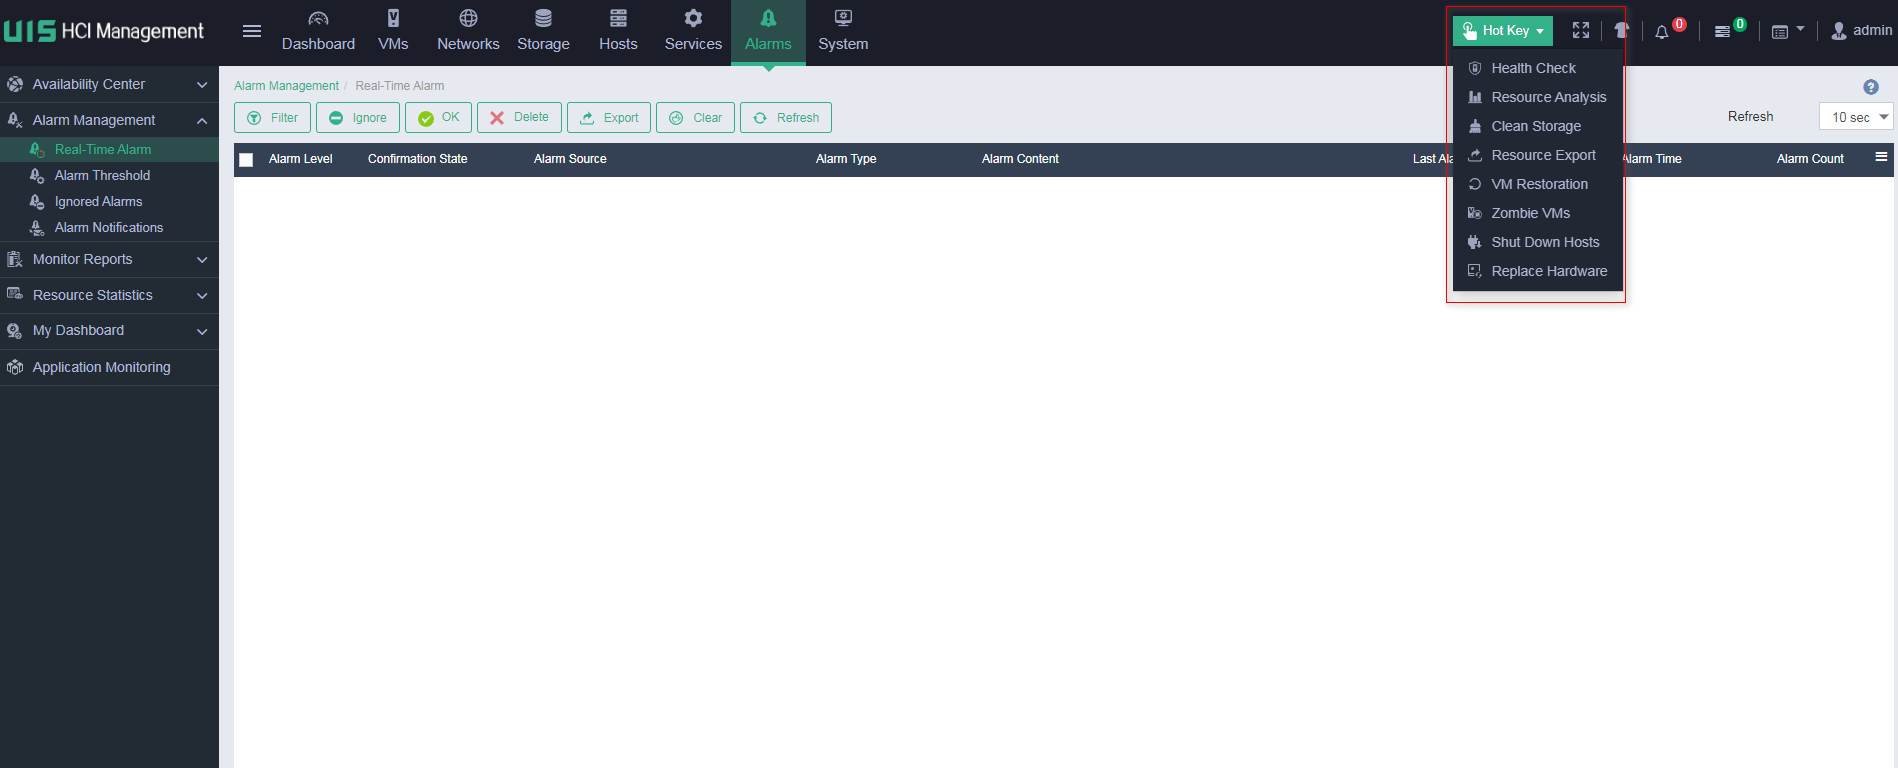
The UIS platform provides a hot key in the top right corner that allows you to perform health check, resource analysis, storage cleanup, resource export, VM restoration, and zombie VM operations.
Select Health Check to enter the health check page. You can perform health check for the specified modules.
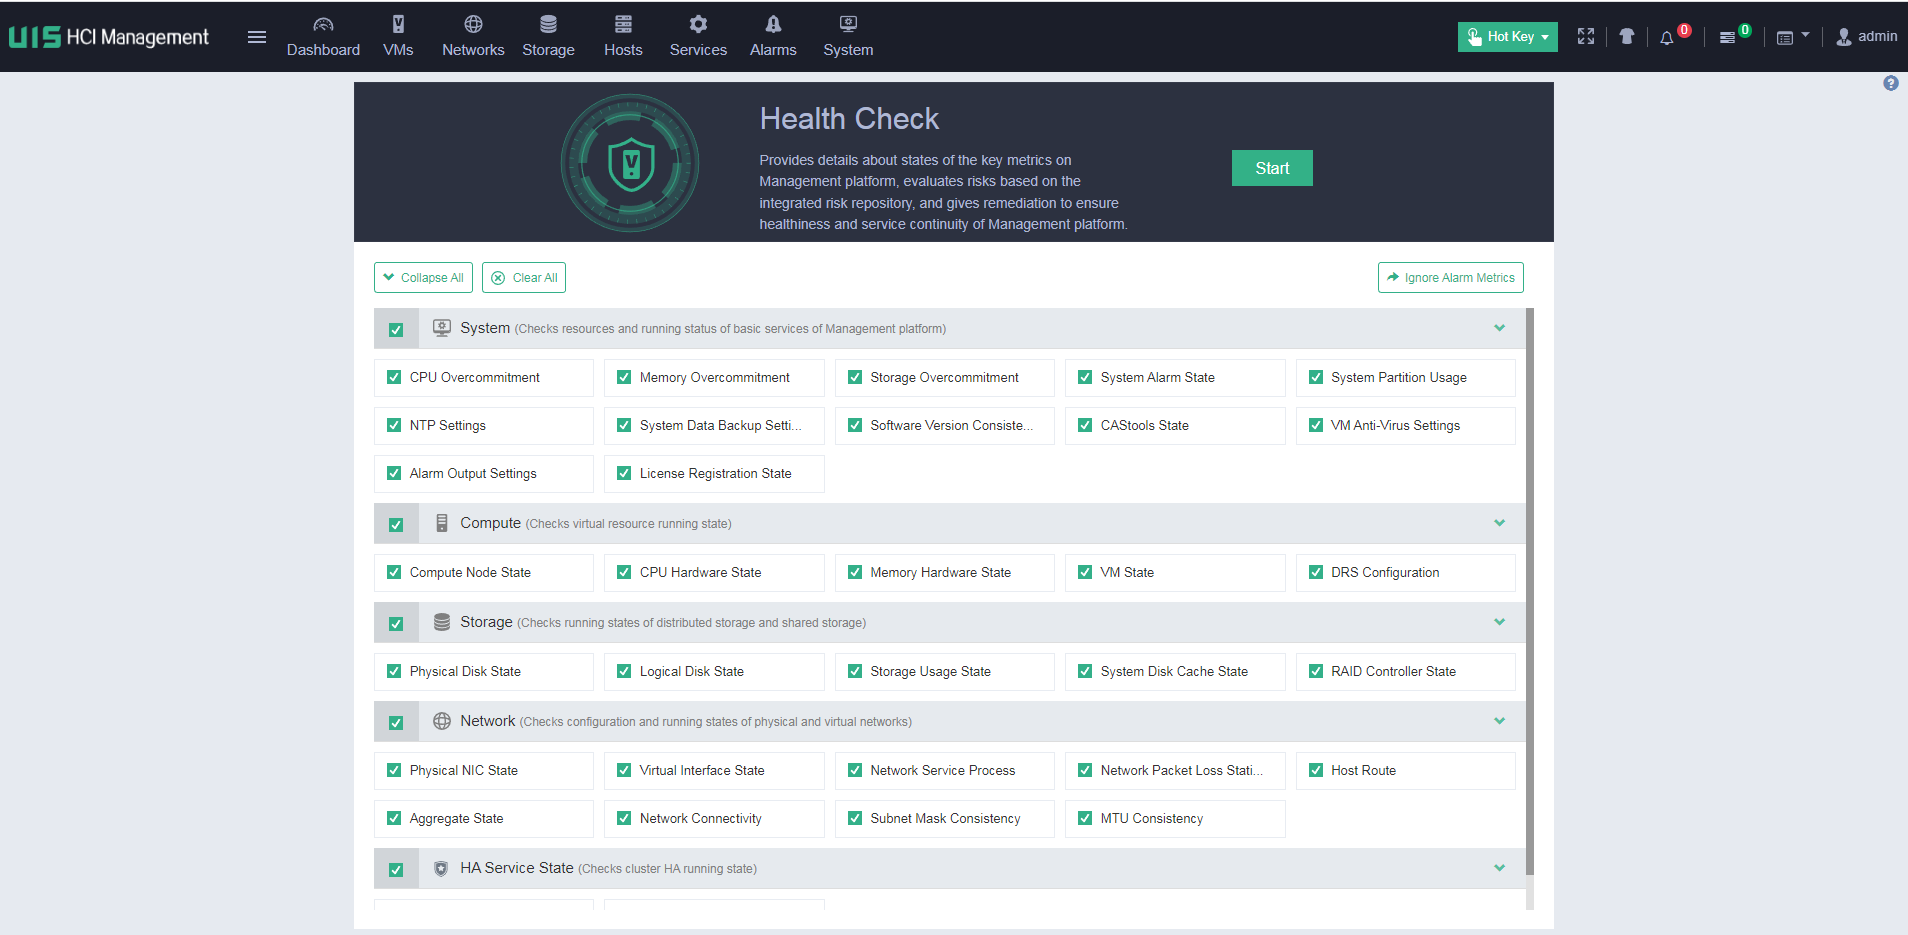
You can print and export the health check results.
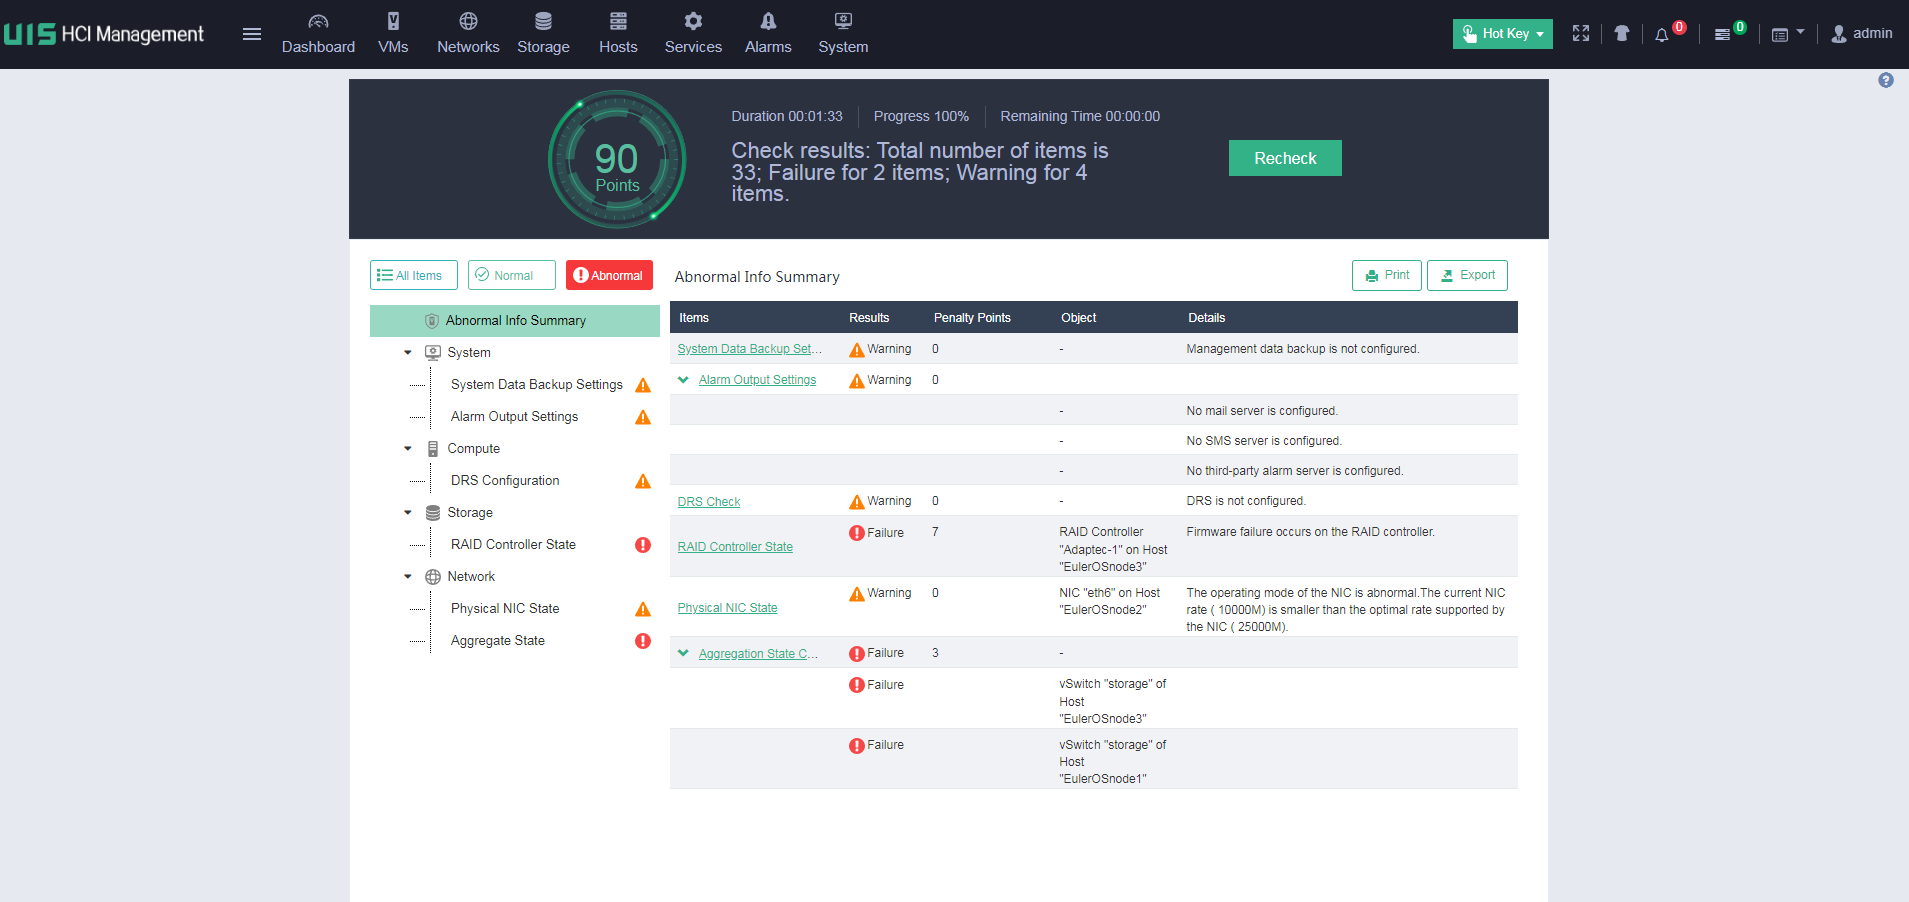
If a failure is detected in the health check, for example, a RAID controller or hard drive cache failure, you can click Remediation to resolve the issue.
Reviewing operation logs
The Operation Logs page records history operations in the UIS system, including front-end manual user operations and back-end automatic system operations.
The system provides important information about operation logs including` the operator name, finish time, login address, operation description, and failure result reason.
If an operation log message result is failed, you need to troubleshoot the failure based on the failure reason. If a large number of operation logs exist, you can download them for troubleshooting and analysis.
The following figure shows the UIS Manager operation logs.

Identifying cluster status
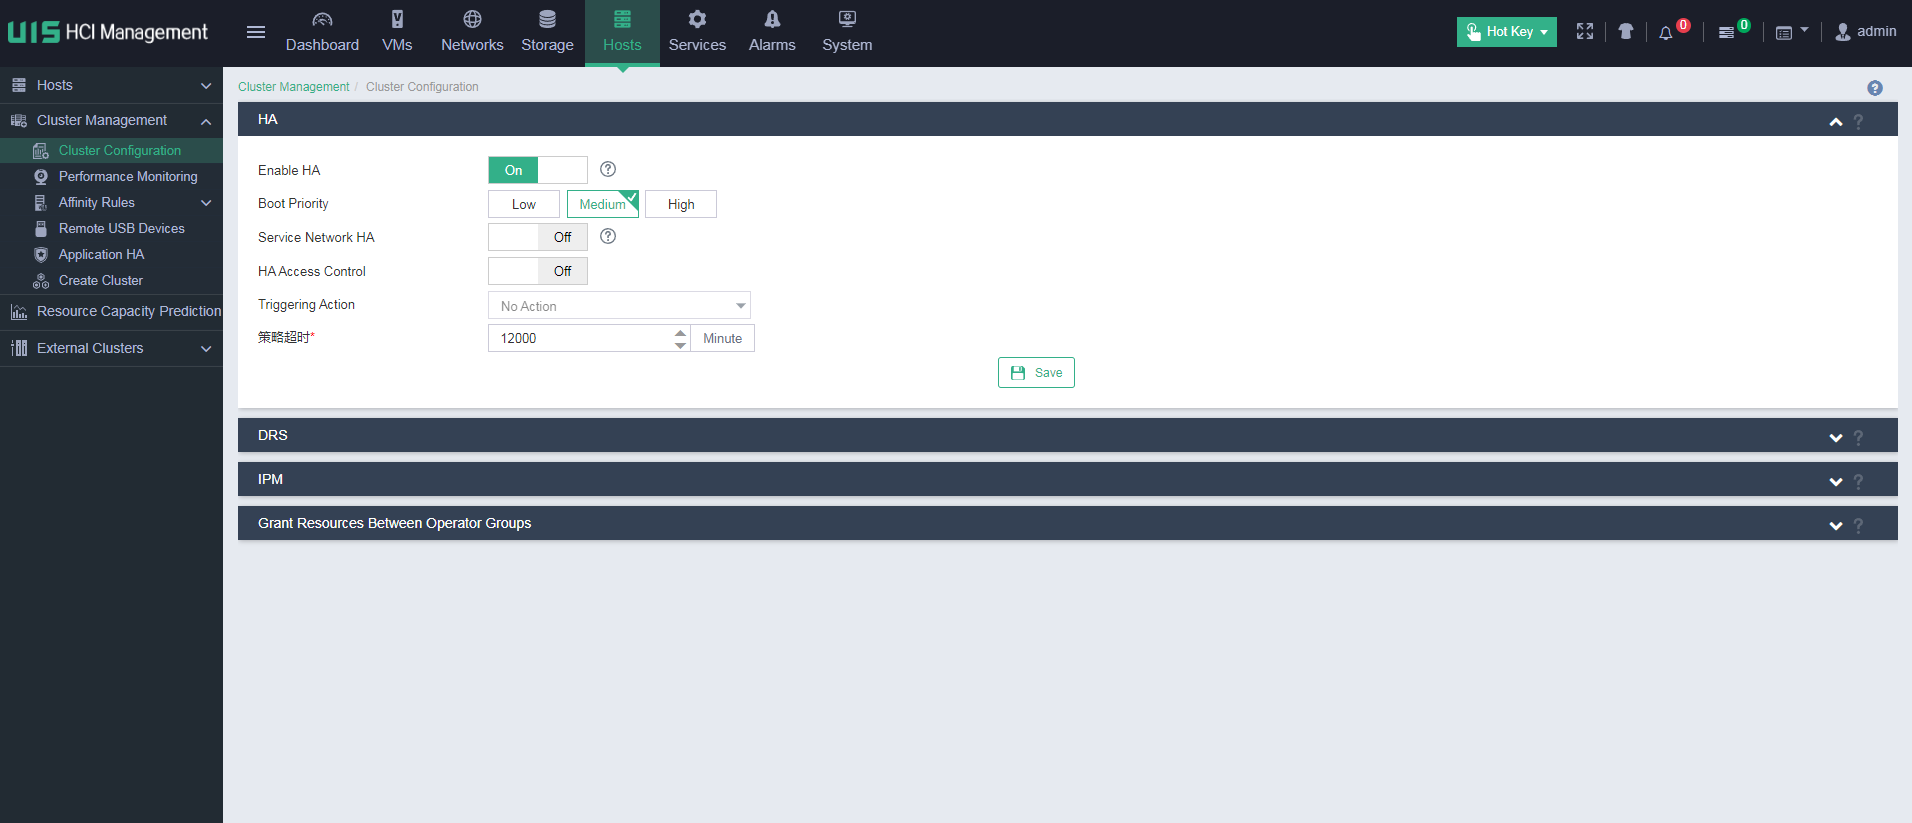
Identifying the cluster HA feature
Verify that the HA feature is enabled for the cluster. If HA is not enabled, and the next CVK host anomaly occurs in the cluster, the VMs on the CVK host cannot correctly migrate to other CVK hosts in the cluster.
After enabling HA for the cluster, you can enable service area HA. When the service area HA becomes faulty or a connectivity issue occurs for a VM, the VM can migrate to another host.
You can specify the boot priority for the VMs in the cluster. Options include Low, Medium, and High. The default boot priority is Medium. The VM boot priority is set upon adding or editing VMs. The boot priority specifies the startup order of VMs after a host failure occurs. The VMs restart on the new host according to the specified boot priorities. The VMs with the high, medium, and low boot priorities start up in descending order until all VMs restart or no more cluster resources are available.
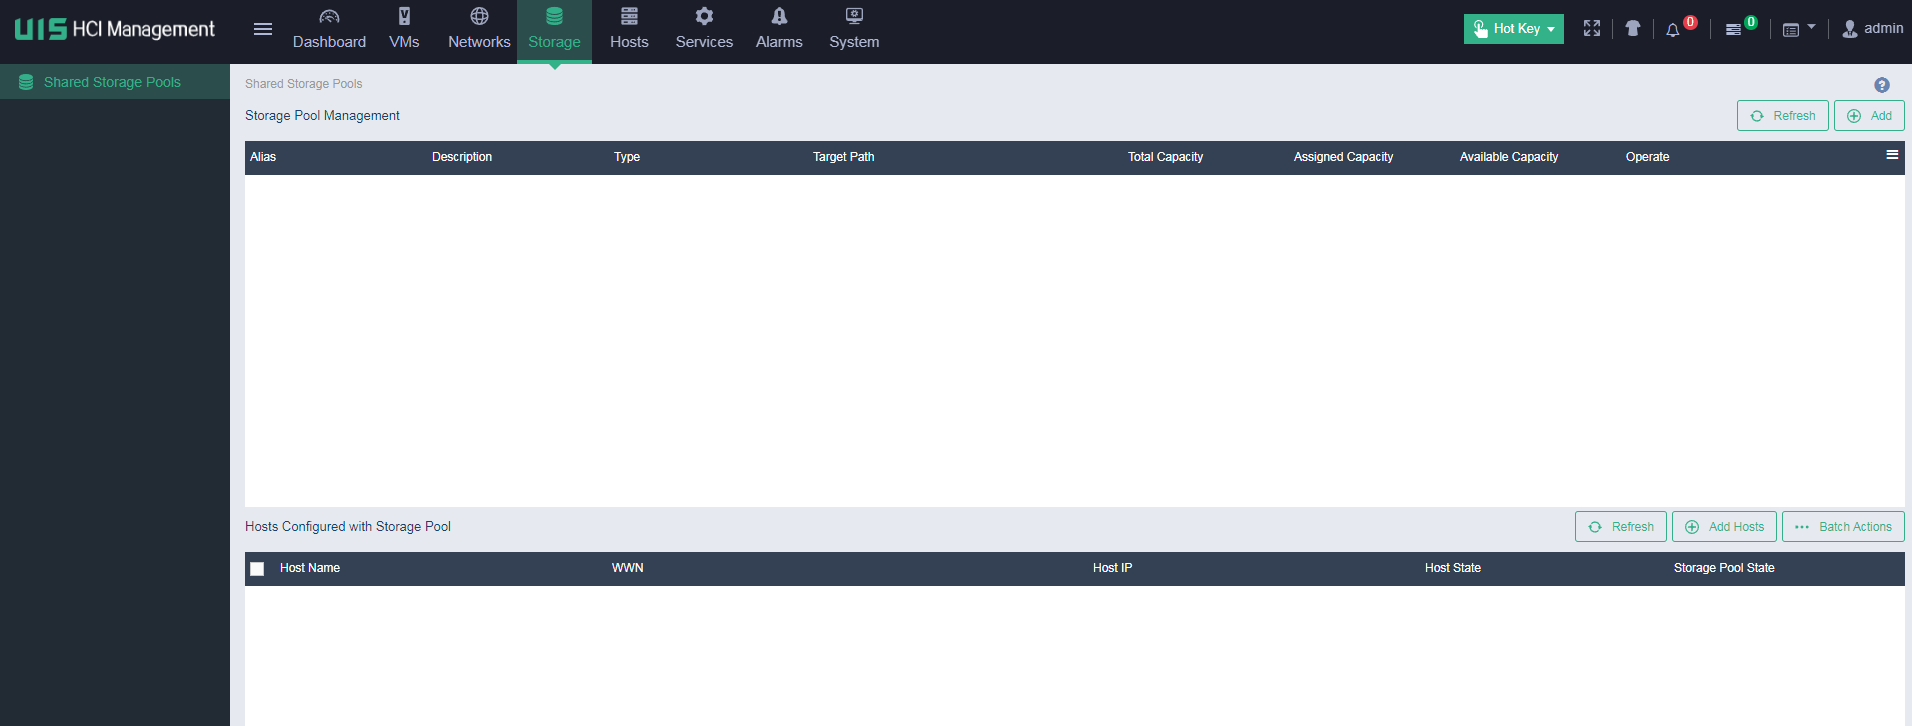
Identifying the shared storage in the cluster
During VM migration, if the target host has no shared storage mounted for VMs, the migration will fail.
Identifying host information
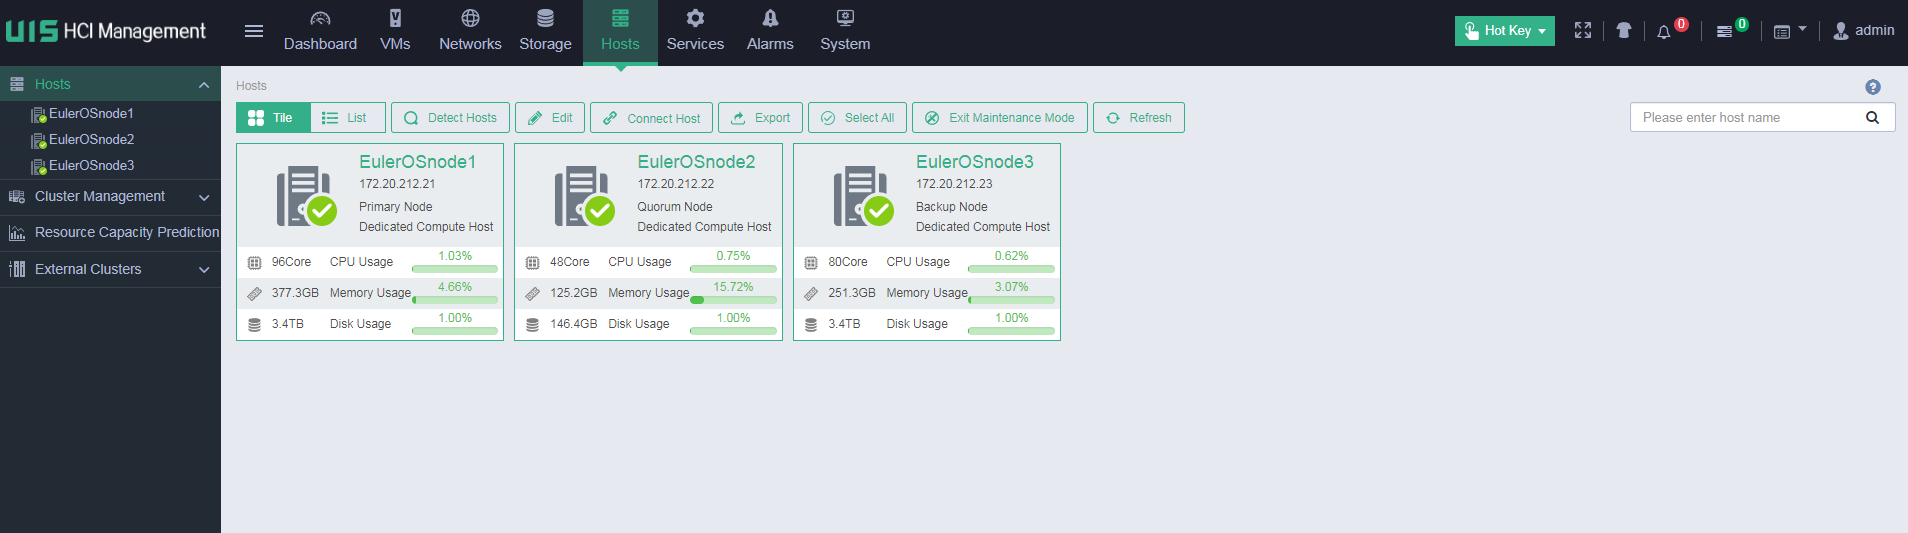
Identifying host status
View host status on the Hosts page to identify whether abnormal hosts exist.
Check the CPU and memory usage of each host, and pay special attention to the hosts with usage exceeding 80%.
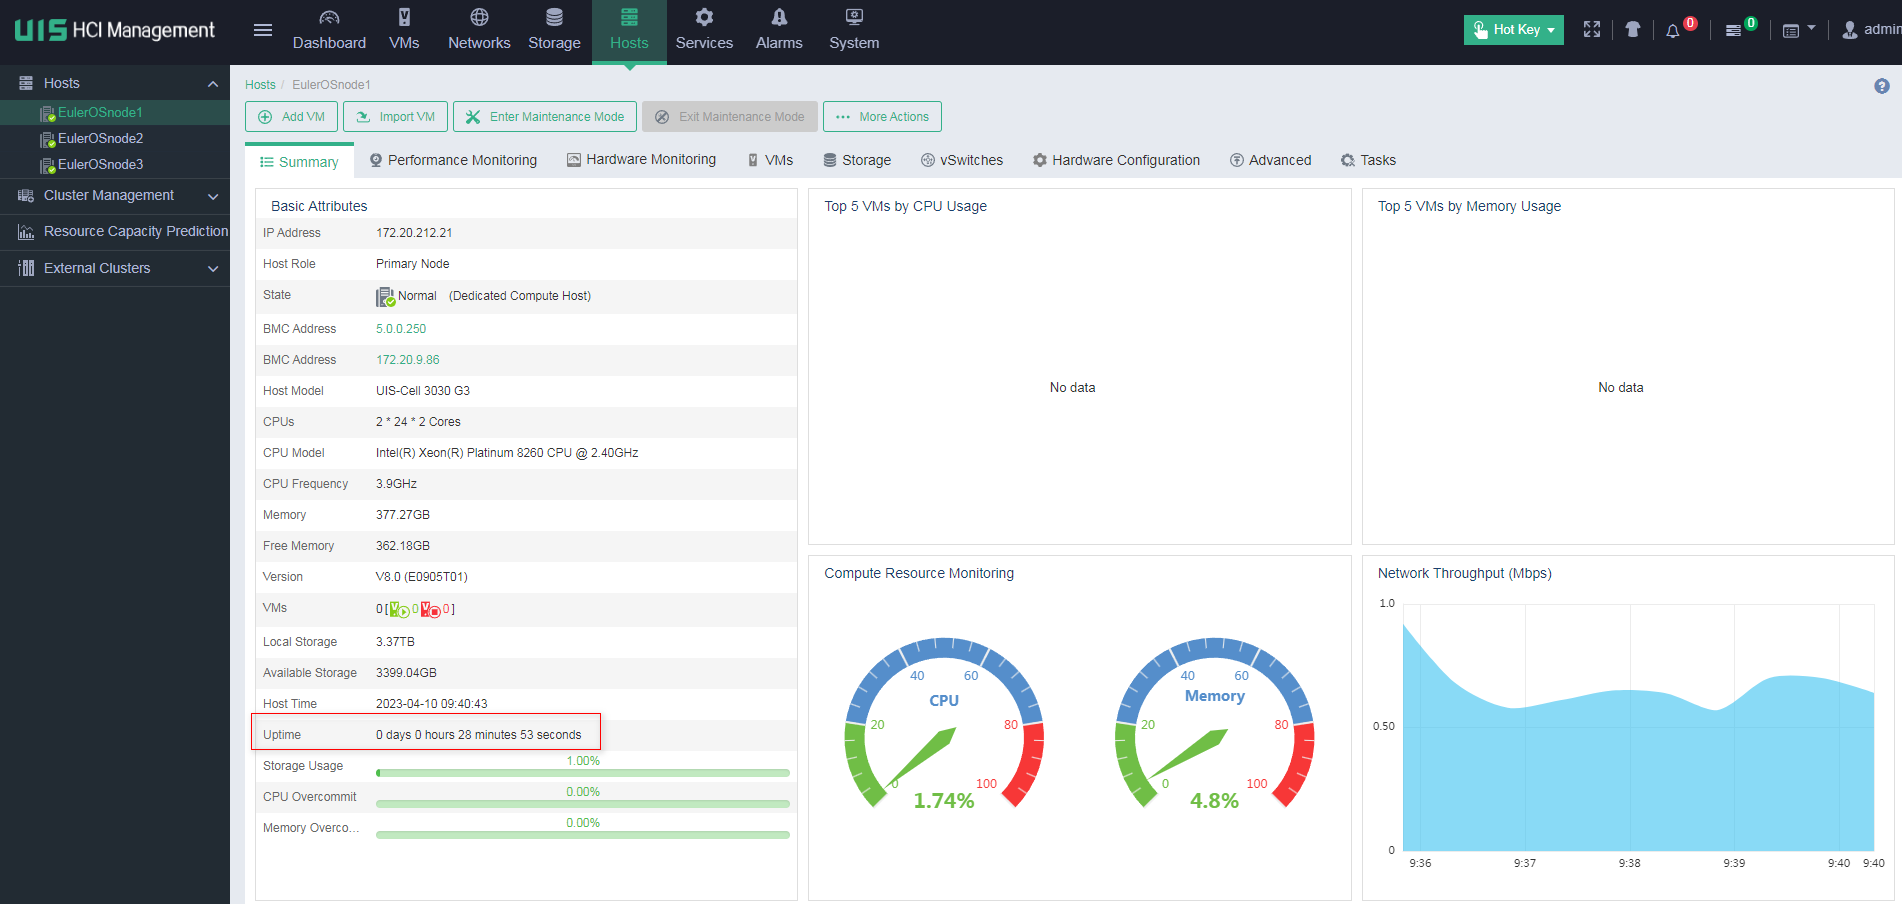
Identifying the uptime of a host
On the Summary page of a CVK host, you can see the detailed host configuration information. From the Uptime field, you can identify whether the host has been rebooted recently.
Identifying host performance monitoring information
On the Performance Monitoring page of the CVK host, you can see the CPU usage, memory usage, I/O throughput, network throughput, disk usage, and partition usage of the host.
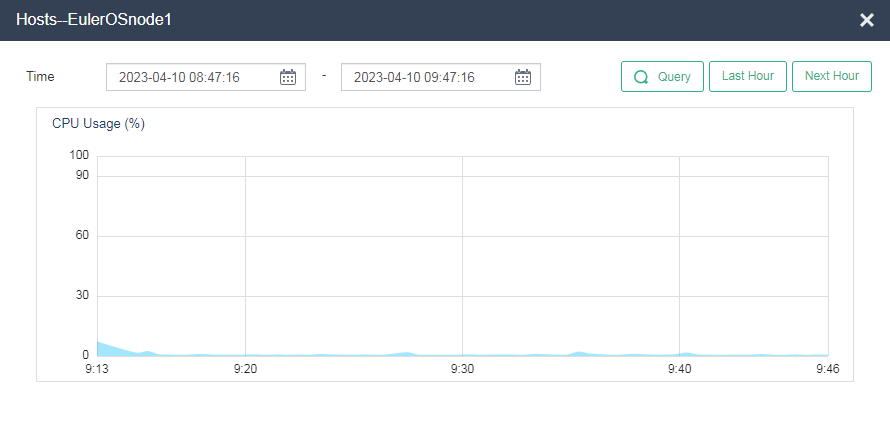
Identifying host CPU usage
On the Performance Monitoring > CPU Usage (%) page, click … to view CPU usage in a longer time range.
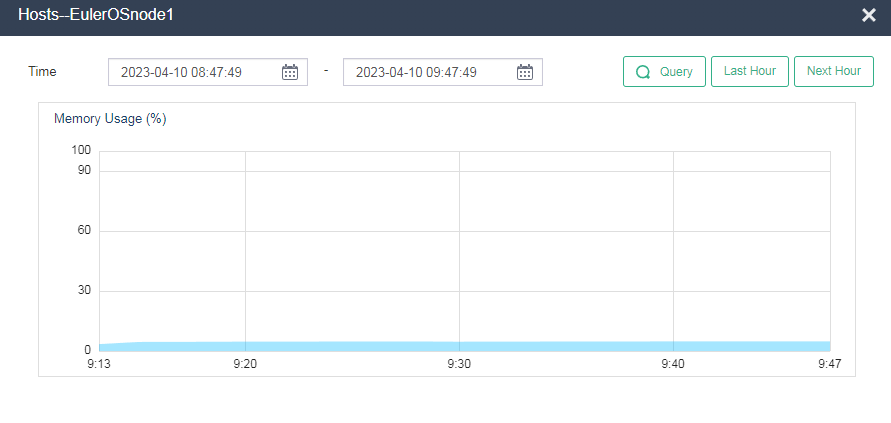
Identifying host memory usage
On the Performance Monitoring > Memory Usage (%) page, click … to view memory usage in a longer time range.
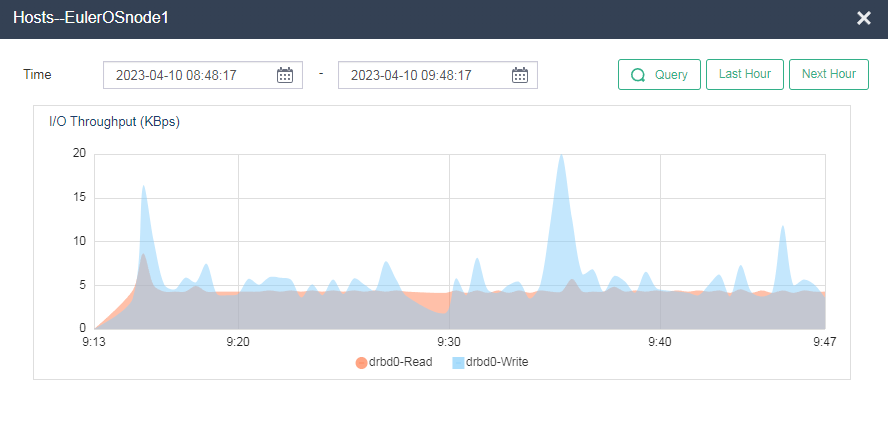
Identifying host I/O throughput
On the Performance Monitoring > I/O Throughput (KBps) page, click … to view I/O throughput in a longer time range.
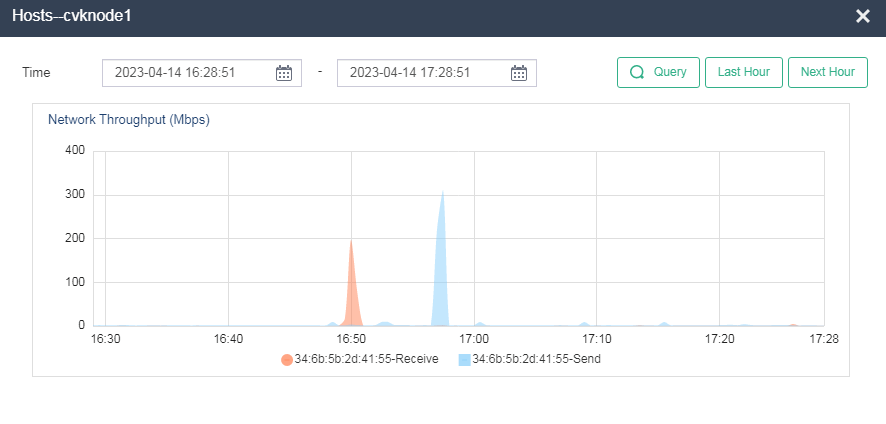
Identifying host network throughput
On the Performance Monitoring > Network Throughput (Mbps) page, click ... to view the network throughput of each physical NIC in a longer time range.
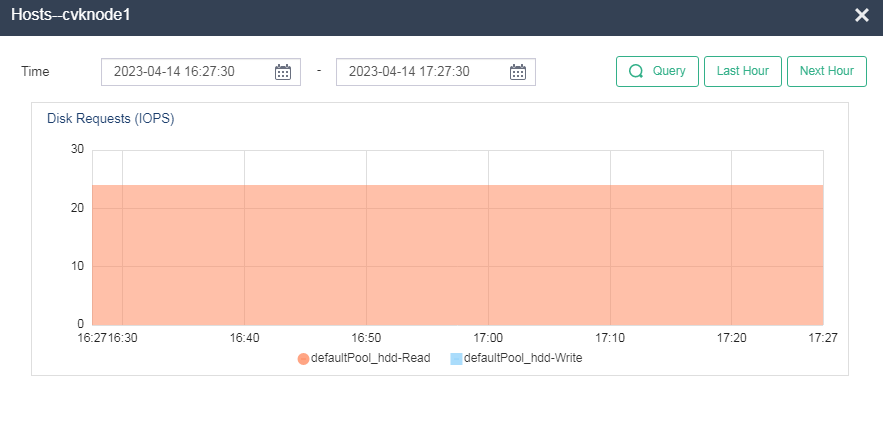
Identifying host disk usage
On the Performance Monitoring > Disk Requests (IOPS) page, you can see the host disk usage information.
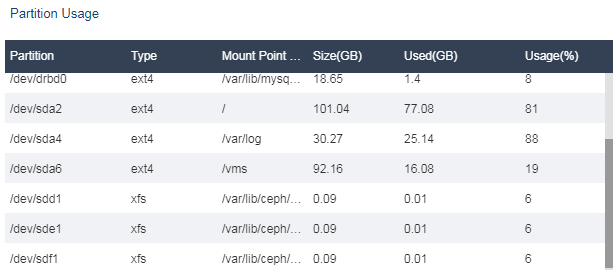
Identifying host partition usage
On the Performance Monitoring > Partition Usage page, you can see the host disk usage information.
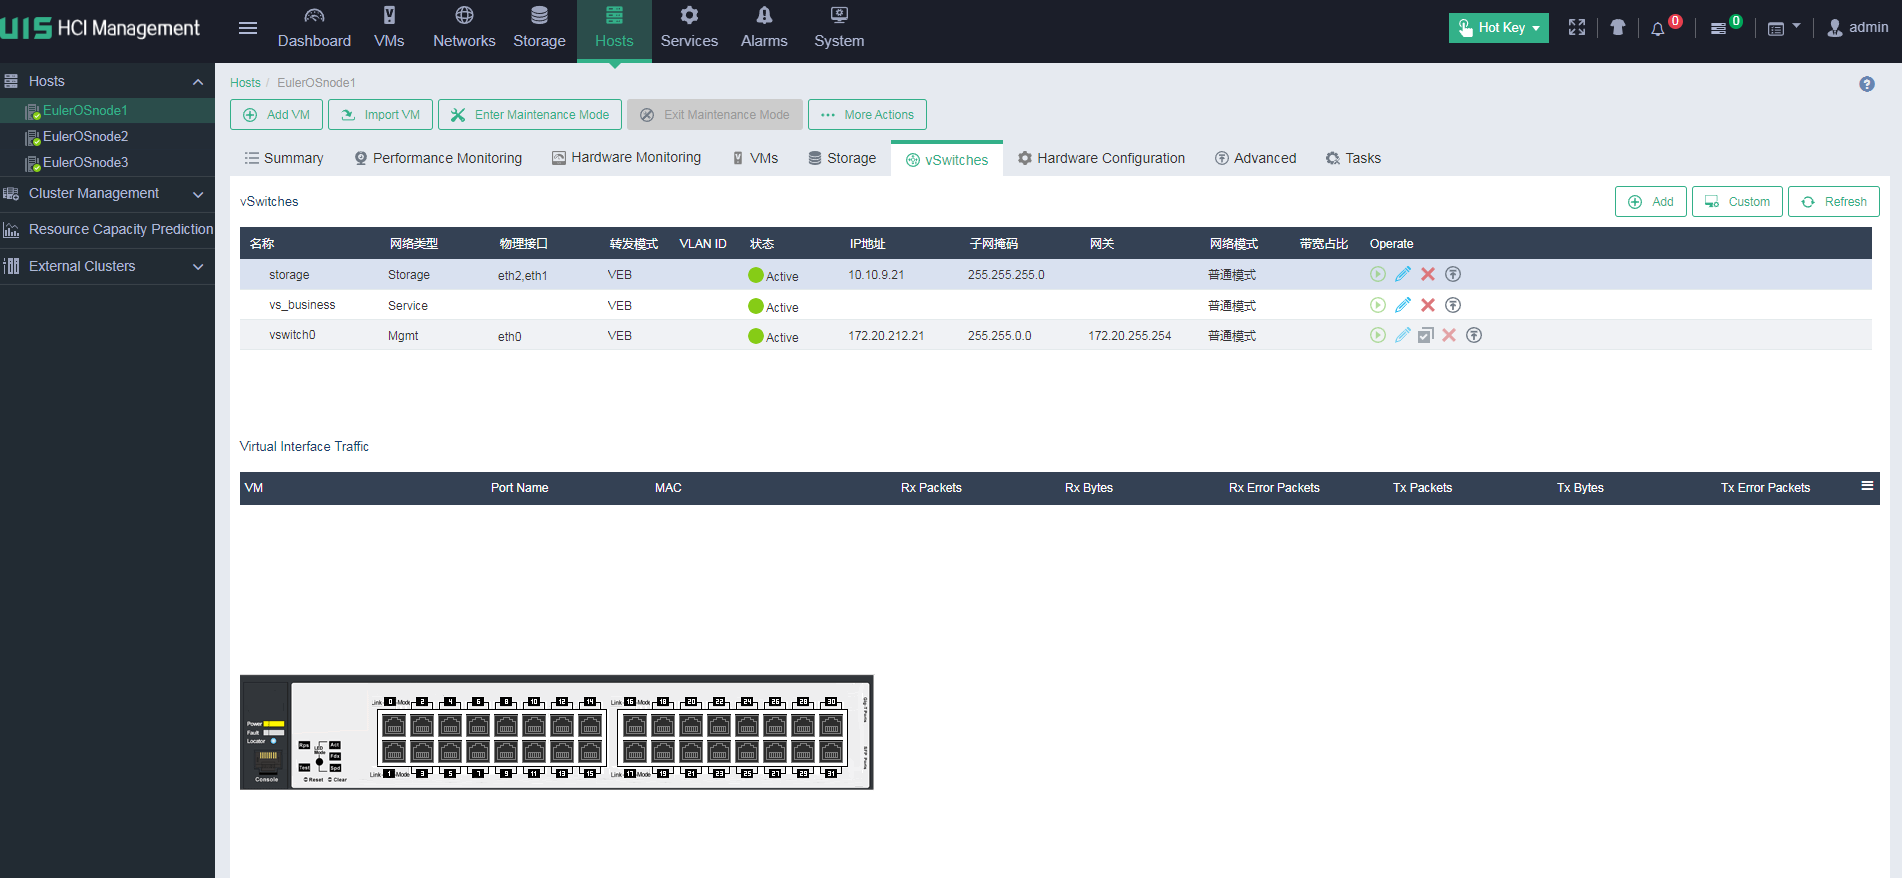
Identifying vSwitch information
Identify whether the names of vSwitches between hosts in the cluster are consistent.
On the vSwitches page of a host, identify whether the vSwitches are active. If a vSwitch is in abnormal state, identify whether the physical NIC is normal.
Make sure only one gateway is configured for all vSwitches of the host.
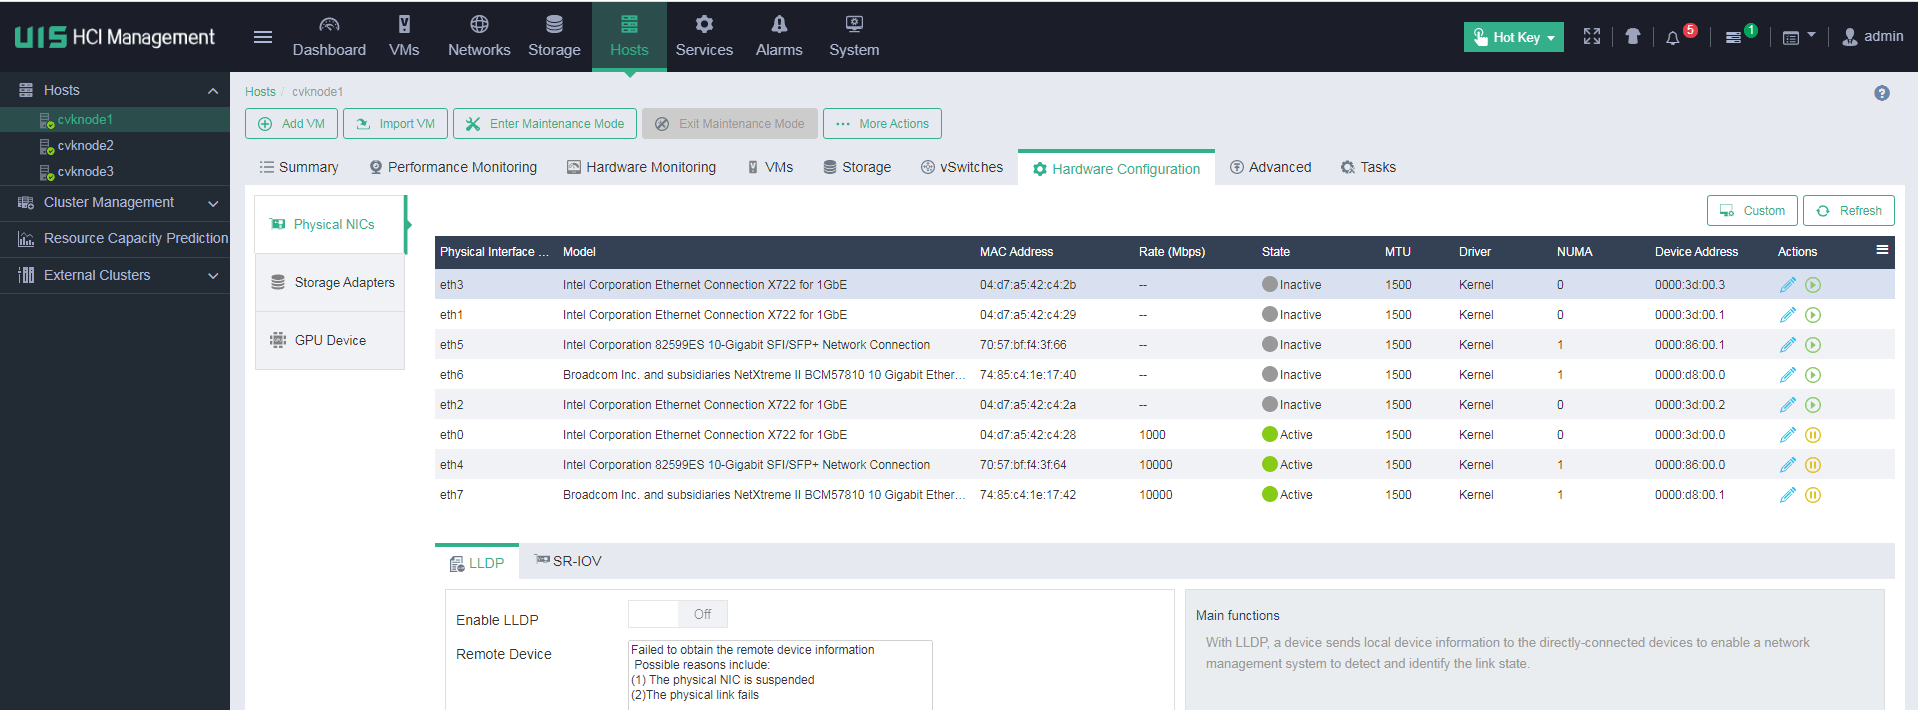
Identifying physical NIC status
On the Physical NICs page, identify whether the physical NICs of the host, such as the rate and state, are normal.
Abnormal physical NICs will affect vSwitch performance.
Identifying VM status
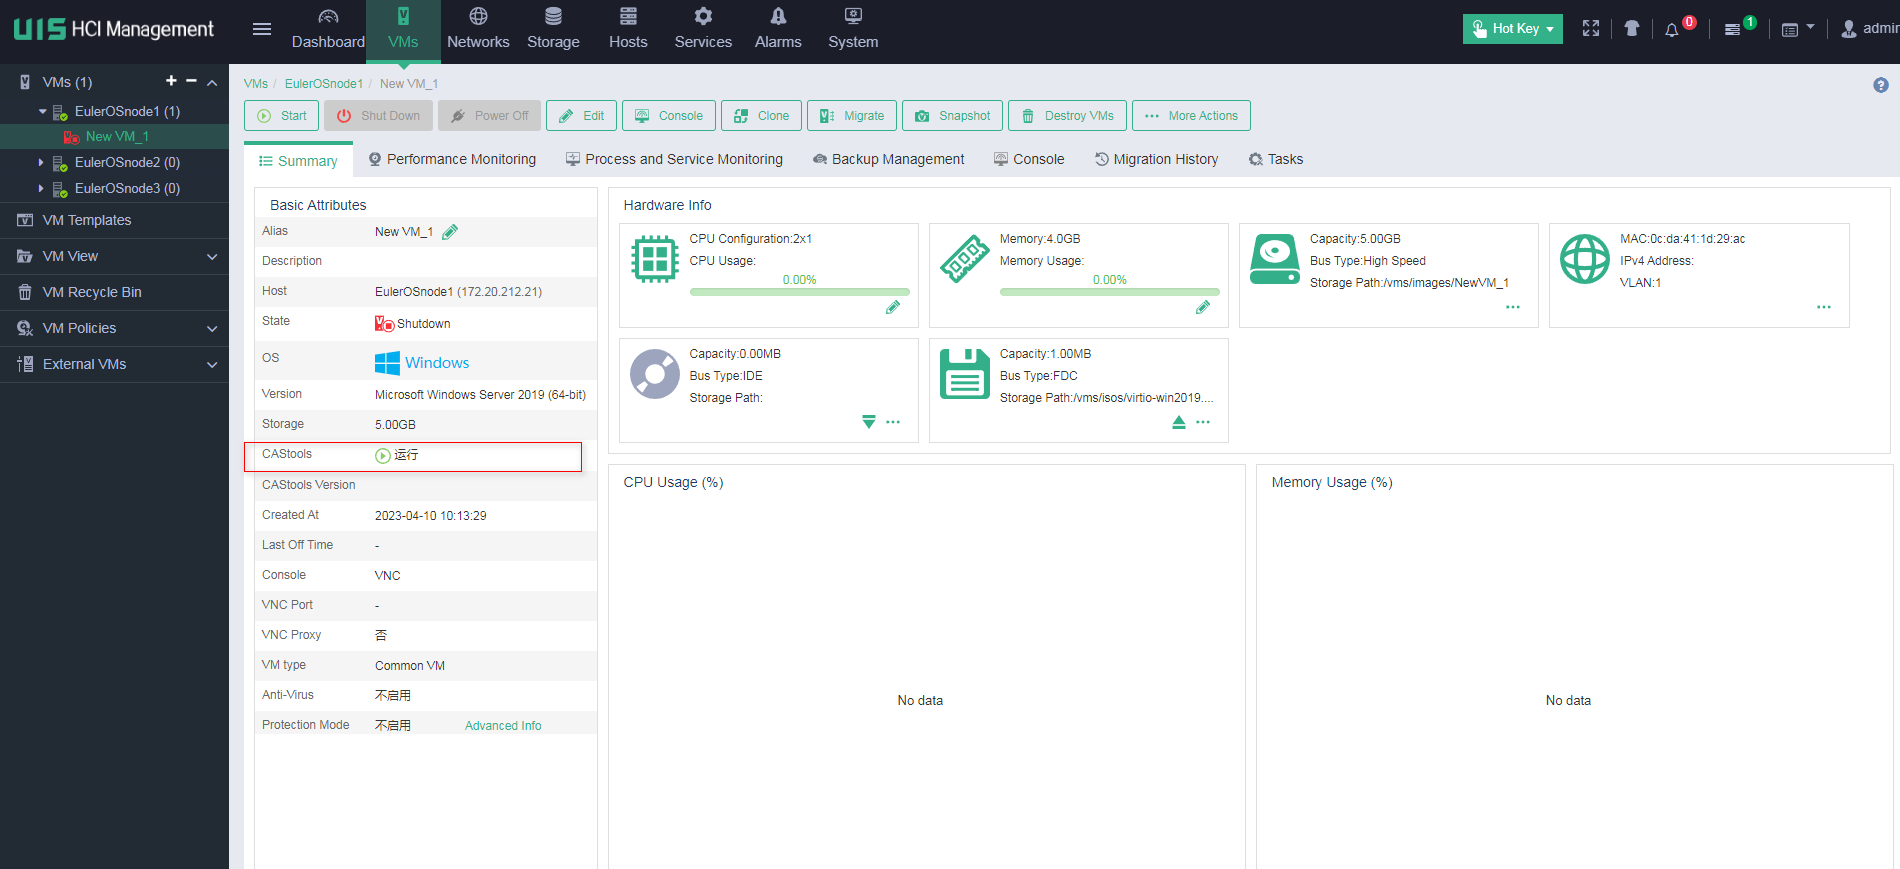
Identifying the running status of CAStools
On the Summary page of the VM, identify whether CAStools are installed to the VM and running correctly.
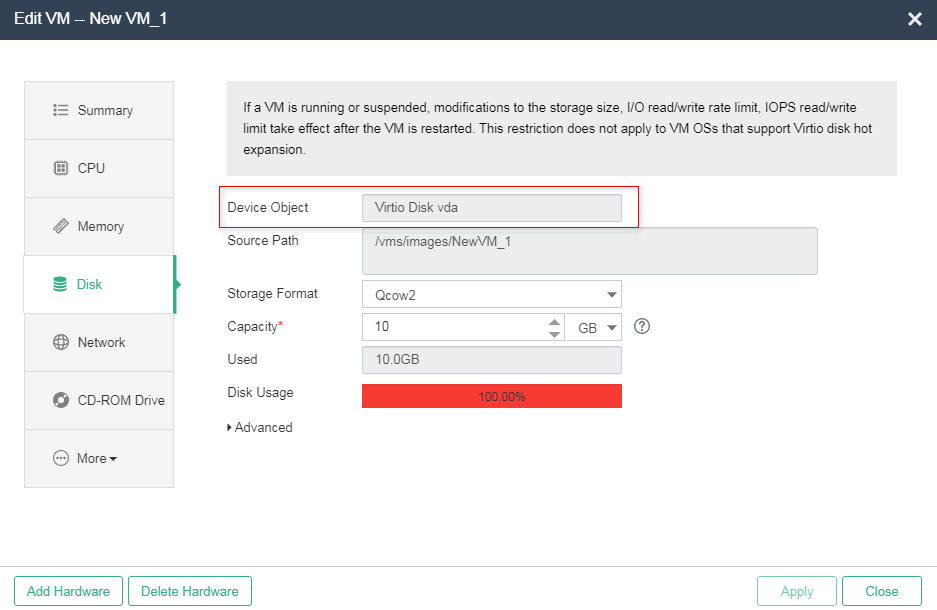
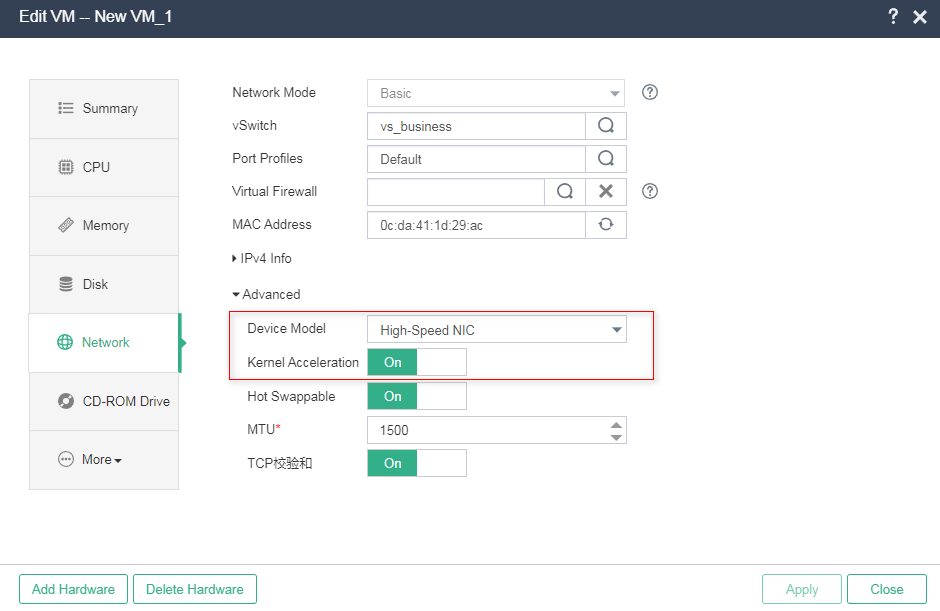
Verifying disk and NIC types
Verifying the disk type
On the Disk tab of the VM modification page, verify that the device object is Virtio disk (that significantly improves disk performance), the source path is a shared storage path, and the cache mode is directsync (recommended setting).
Verifying the NIC type
On the Network tab of the VM modification page, verify that the device model is high-speed NIC and kernel acceleration is enabled (that significantly improves NIC performance).
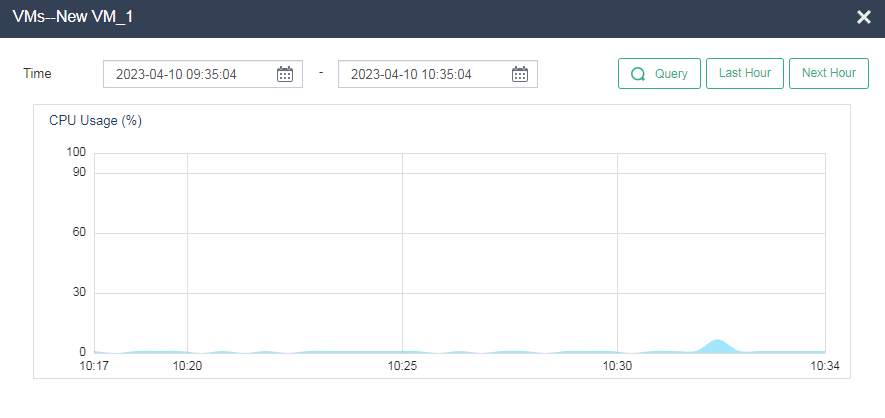
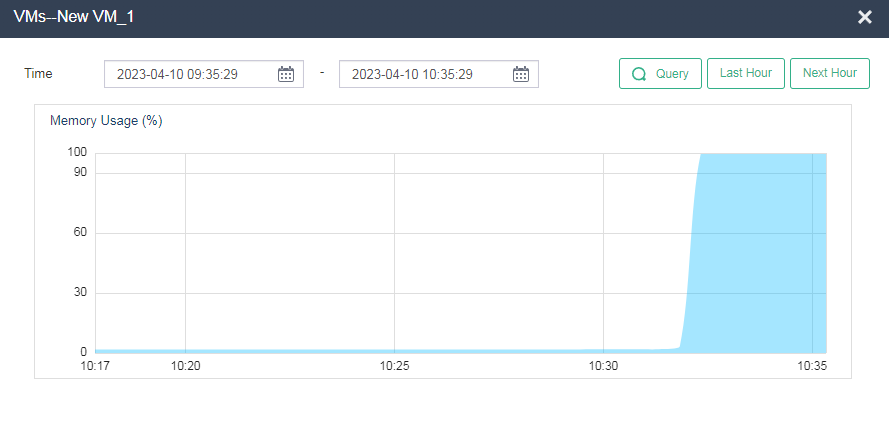
Identifying VM performance monitoring statistics
On the Performance Monitoring page of the VM, you can see the CPU usage, memory usage, I/O throughput, network throughput, disk usage, and partition usage of the VM.
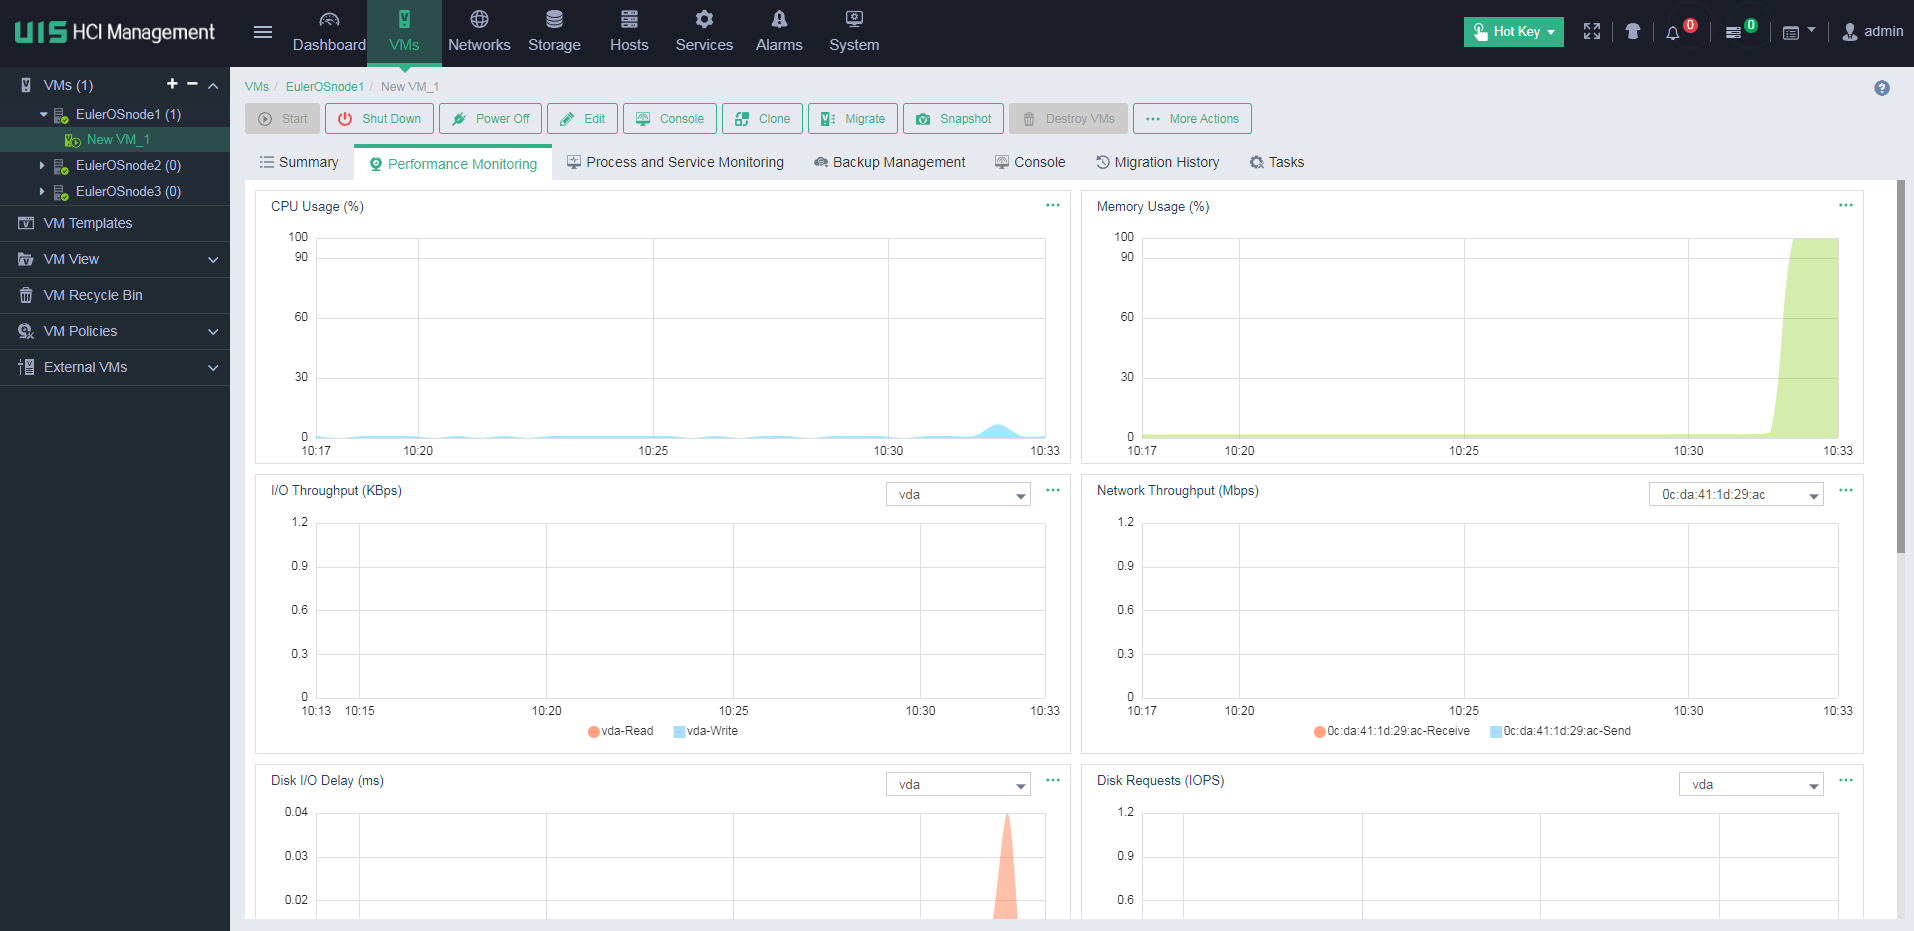
Identifying VM CPU usage
On the Performance Monitoring > CPU Usage (%) page, click … to view CPU usage in a longer time range.
Identifying VM memory usage
On the Performance Monitoring > Memory Usage (%) page, click … to view memory usage in a longer time range.
Identifying VM I/O throughput
On the Performance Monitoring > I/O Throughput (KBps) page, click … to view I/O throughput in a longer time range.
Identifying VM network throughput
On the Performance Monitoring > Network Throughput (Mbps) page, click … to view the network throughput of each physical NIC in a longer time range.
Identifying VM disk usage
On the Performance Monitoring > Disk Requests (IOPS) page, you can see the VM disk usage information.
Identifying VM partition usage
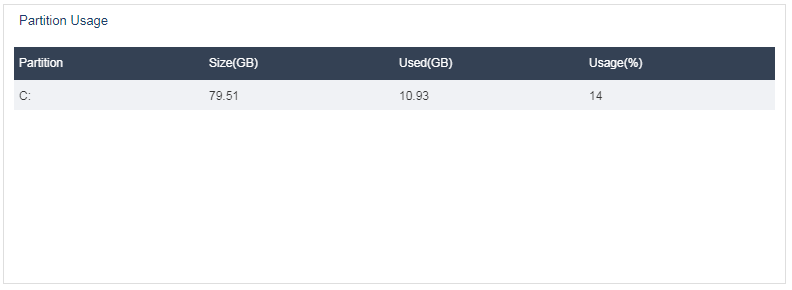
On the Performance Monitoring > Partition Usage page, you can see VM partition usage information.
Identifying VM backup information
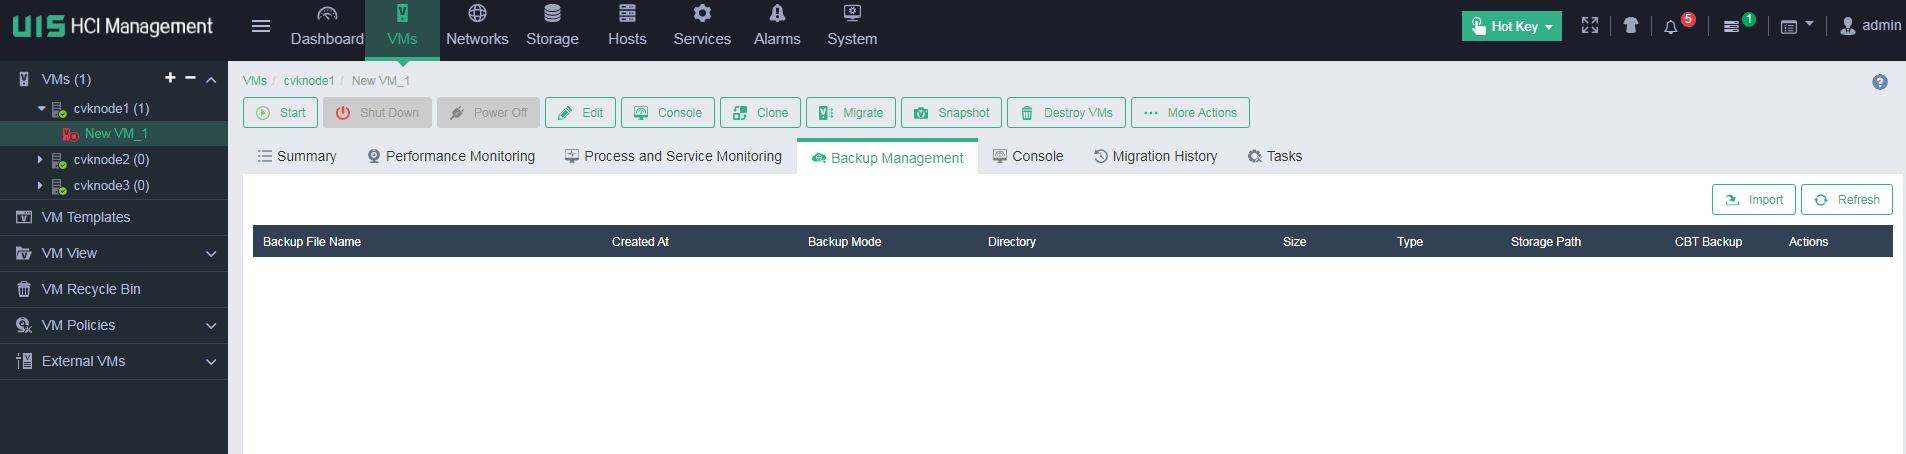
On the Backup Management page of a VM, you can see the backup history of the VM. As a best practice, back up all core VMs on the UIS platform.
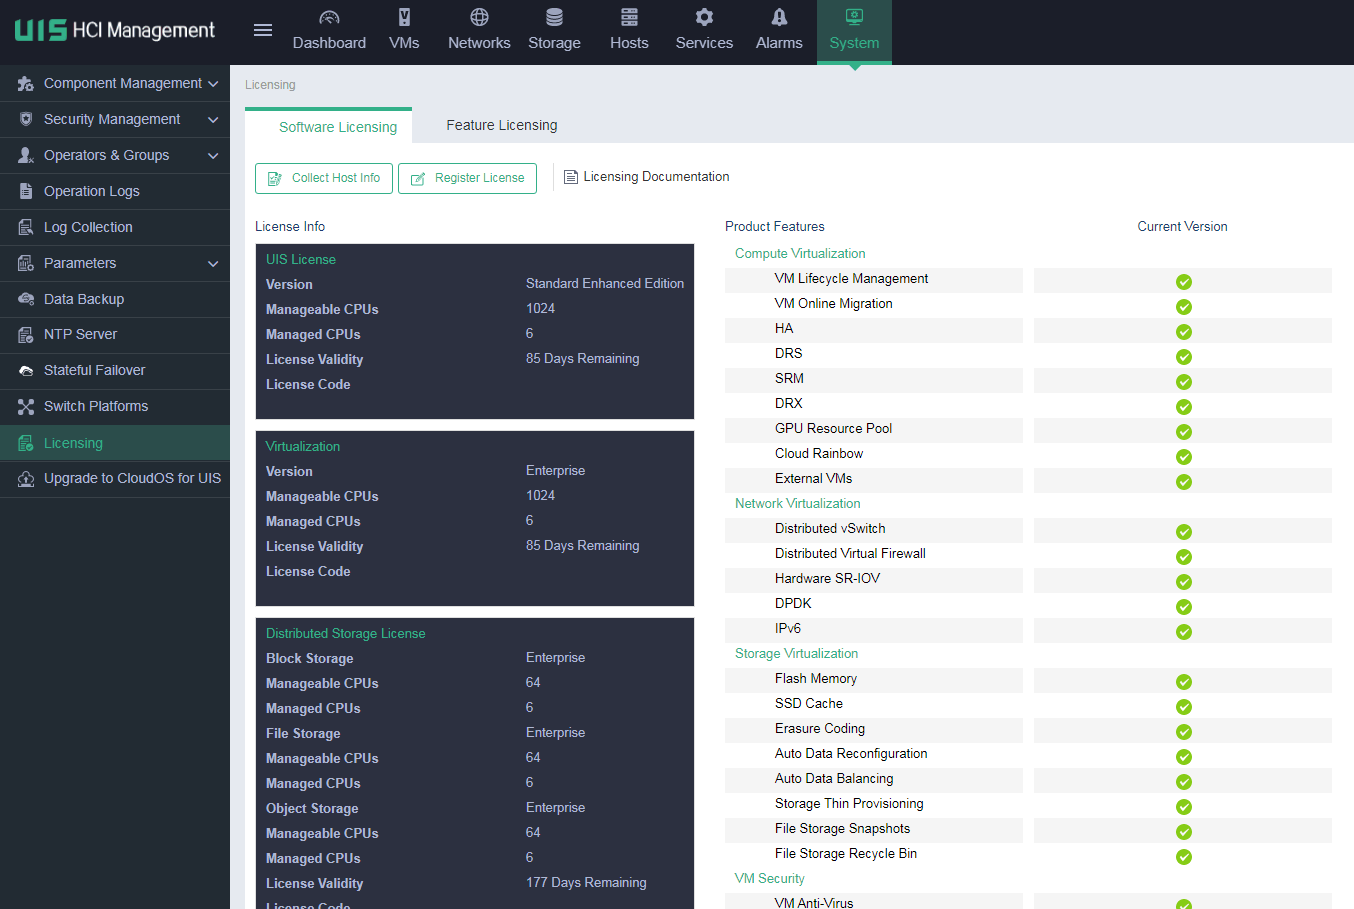
Identifying license information
The UIS system typically contains UIS Manager license, CAS license, and distributed storage license. You need to use official licenses at official deployment sites. You can use temporary licenses at test or temporary deployment sites. To avoid impacts on correct UIS system usage upon expiration of the temporary licenses, you need to update the temporary licenses in advance.
The following figure shows the licensing page of the UIS Manager component.
Managing alarms
The alarm management feature collects and displays statistics of concerned alarms for operators. In the current software version, UIS collects statistics of host resource alarms, VM resource alarms, cluster resource alarms, failure alarms, security alarms, other alarms, and distributed storage resource alarms.
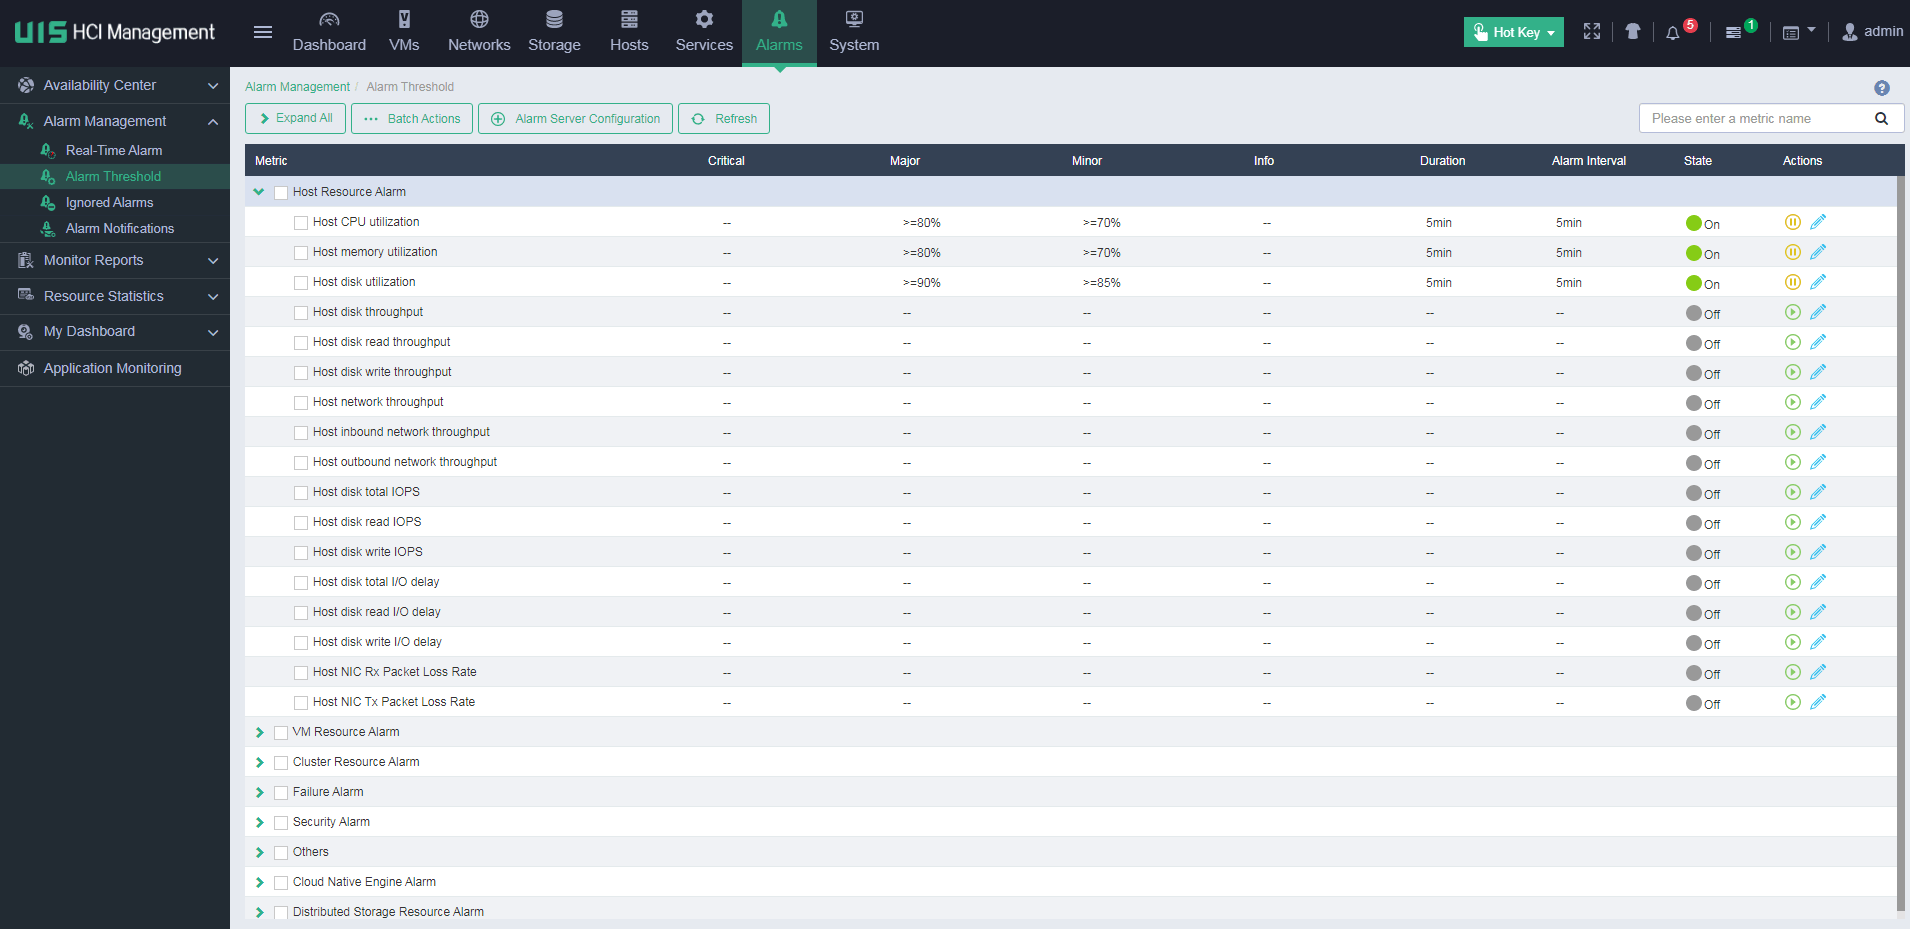
Users can configure alarm threshold settings for the indexes such as CPU usage and memory usage of hosts or VMs. When an index value reaches the alarm threshold, an alarm is generated and reported. Users can view the reported alarms in the real-time alarm list. The alarm filtering configuration allows users to filter the alarms that are not concerned. Such alarms will not be reported. In addition, the system supports sending alarms to users through Emails or SMS messages.
Configuration cautions and guidelines
See H3C UIS Manager Configuration Cautions and Guidelines.
See H3C UIS Manager Data Loss Prevention Best Practices.
Change operations
If issues occur during the UIS system running process, you must follow certain rules to resolve the issues. If you cannot do that, normal operation of services on the live network will be affected.
Upgrading UIS software
See H3C UIS Upgrade Guide.
Handling hardware failure
See H3C UIS Hyper-Converged Infrastructure Component Replacement Configuration Guide.
Starting or shutting down a UIS host
When you perform comprehensive maintenance for the UIS system, you must follow a certain order to power on or power off the device. If you cannot do that, the service system will be destroyed. Before powering on the device, make sure the health is 100%.
For more information, see H3C UIS Hyper-Converged Infrastructure Node Shutdown Configuration Guide.
IP address and host name change
| CAUTION: · To change the root password for a CVK the system, access the Web interface of UIS Manager. You cannot change the root password for a CVK host from its command shell. · If you delete a CVK host when the shared storage of the CVK host is suspended, the shared storage will be automatically deleted. Therefore, you must mount the shared storage to the CVK host again after the CVK host is added again. · When the number of nodes is equal to or less than four hosts, primary nodes, backup nodes, and quorum nodes, you cannot modify IP addresses through directly deleting hosts. For more information, contact Technical Support. |
After the UIS system is deployed, you might need to modify the UIS system IP address or hosts.
After a CVK host is added to the UIS cluster, you can modify the IP address or host name through the method provided by the Xconsole interface, as shown in the figure below. To do that, you must first delete the CVK host from the UIS system.
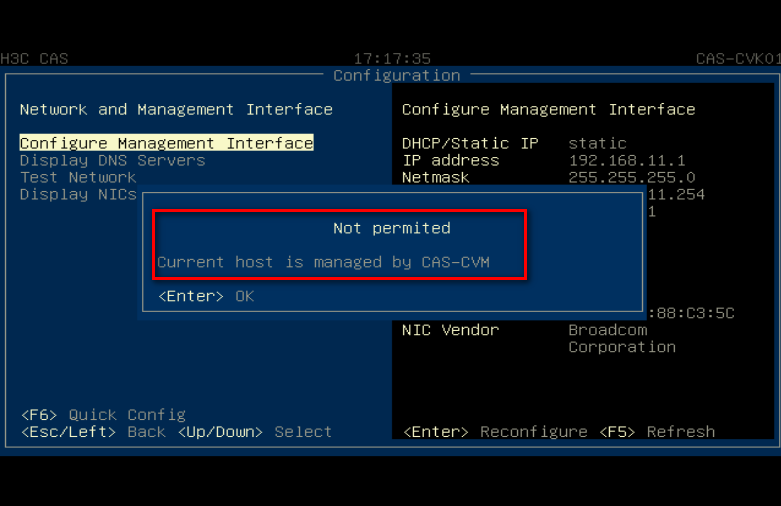
If the CVK host has shared storage enabled or runs VMs, it cannot be deleted. To delete the host in this case, you must first stop or migrate VMs and pause or delete the shared file system.
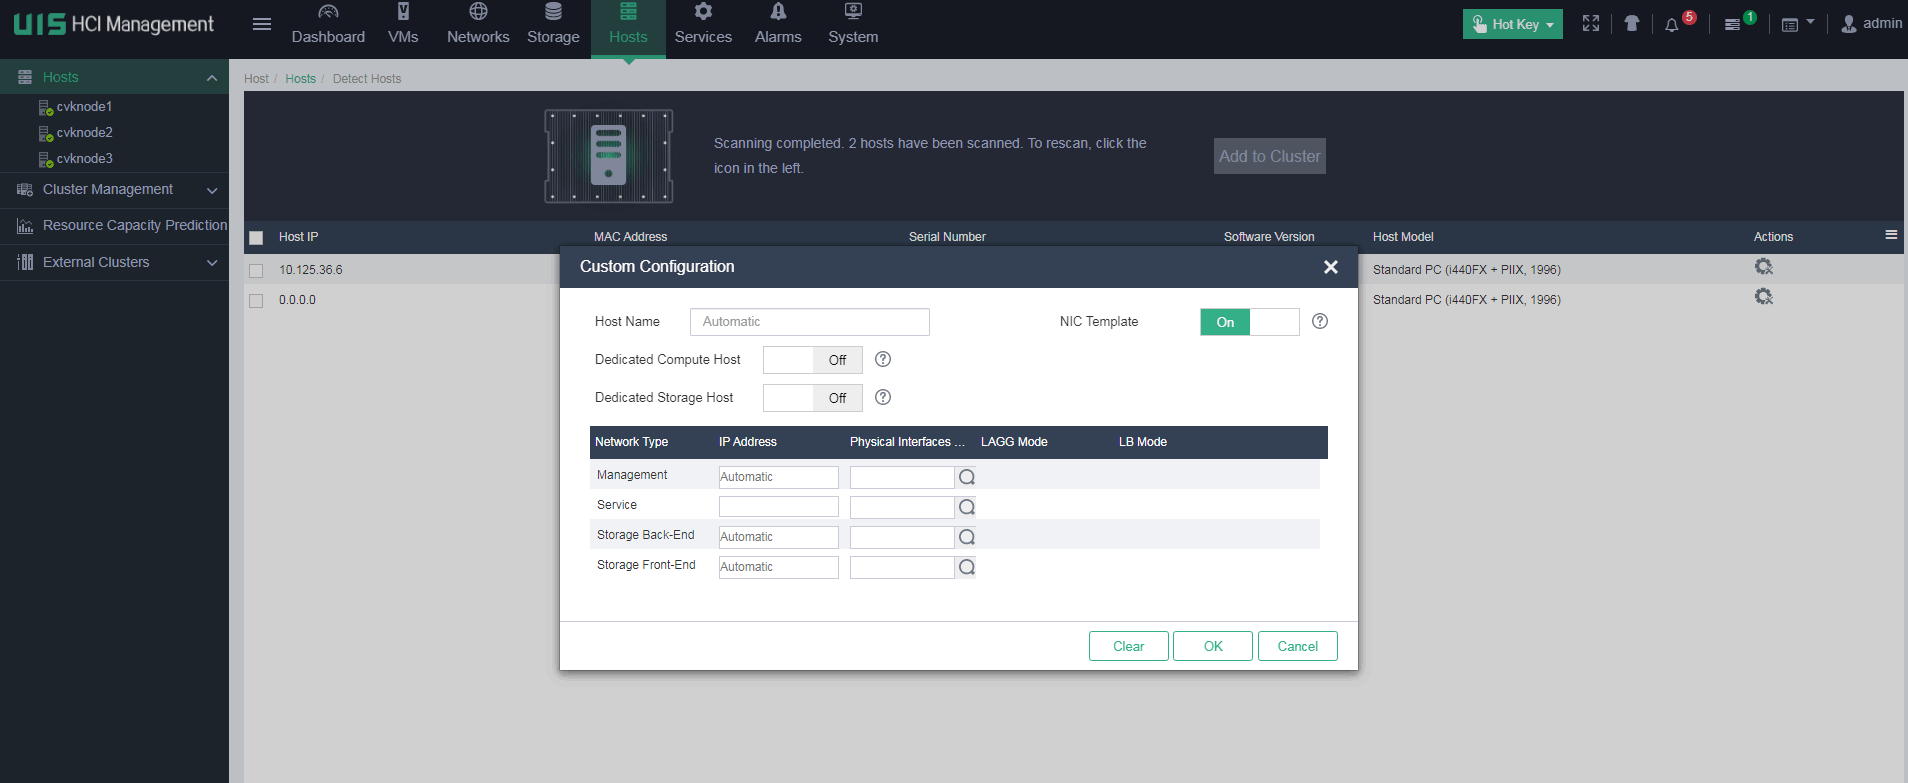
After the host is deleted, you can add the host through host expansion. During the host expansion process, you can manually configure an IP address for the host and select the corresponding NIC interface, and then add the host back to the cluster. Then, you can migrate the VMs back to the host.
| CAUTION: · Make sure the IP address you enter can communicate with the management network and internal/external storage networks of the original cluster. If you cannot do that, you will fail to add the host. · The IP address settings are planned in the deployment phase. You must determine the IP address settings at the beginning, because you cannot modify the IP address settings later. |
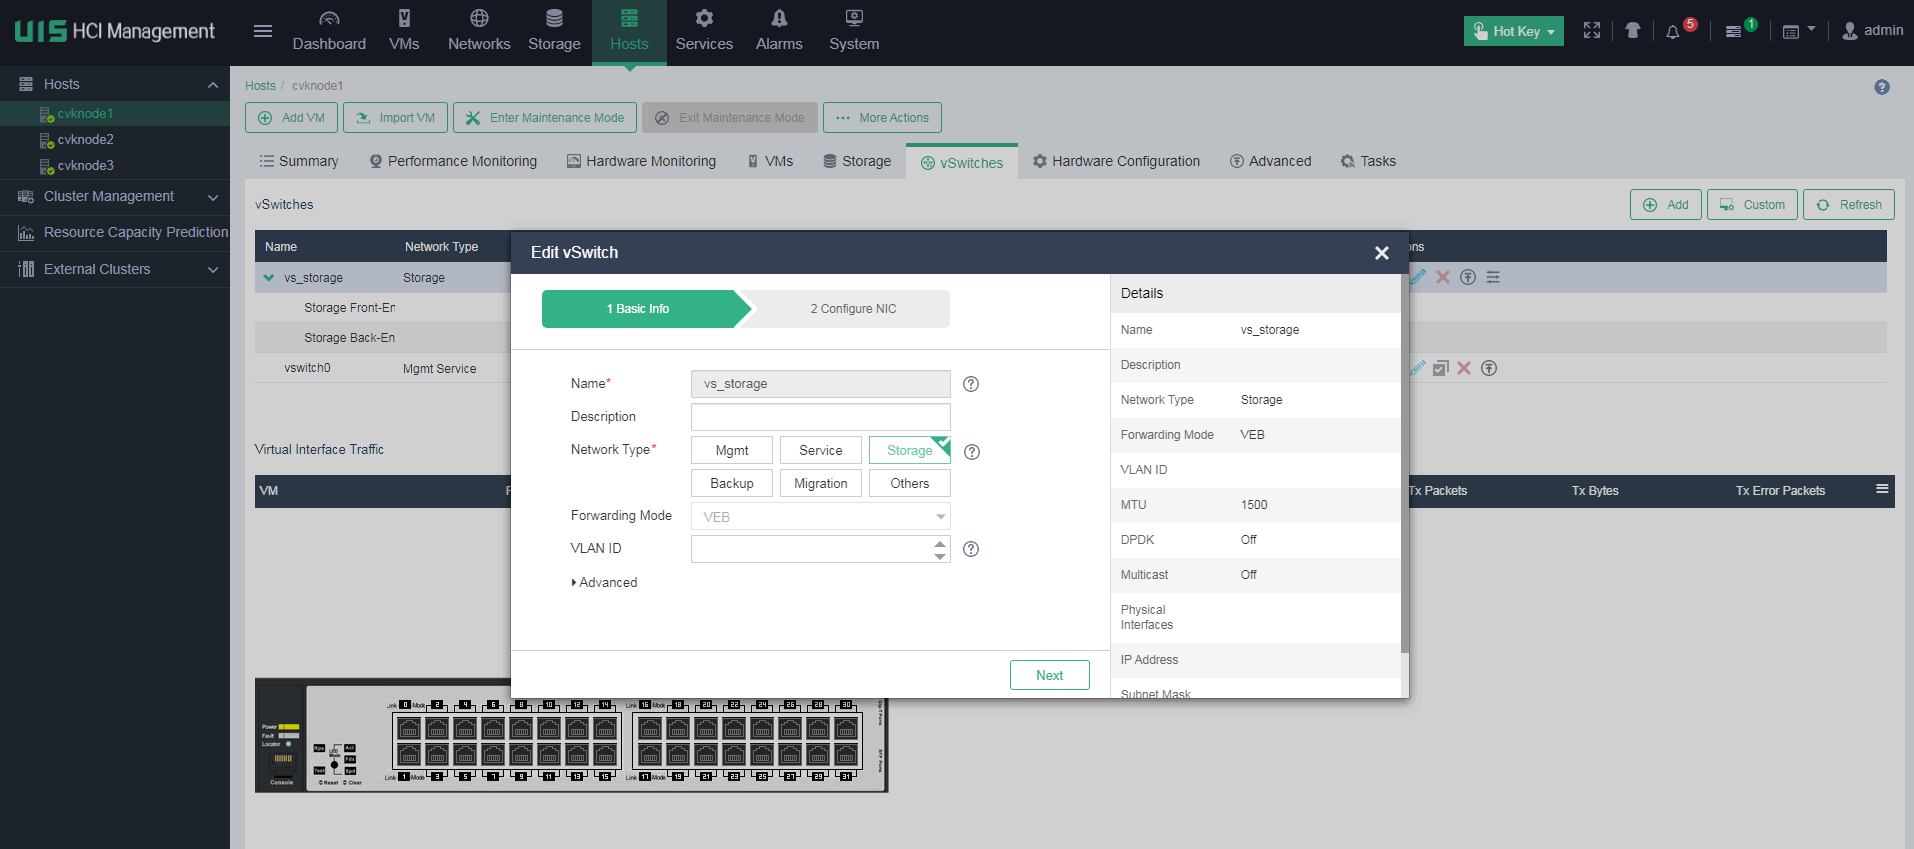
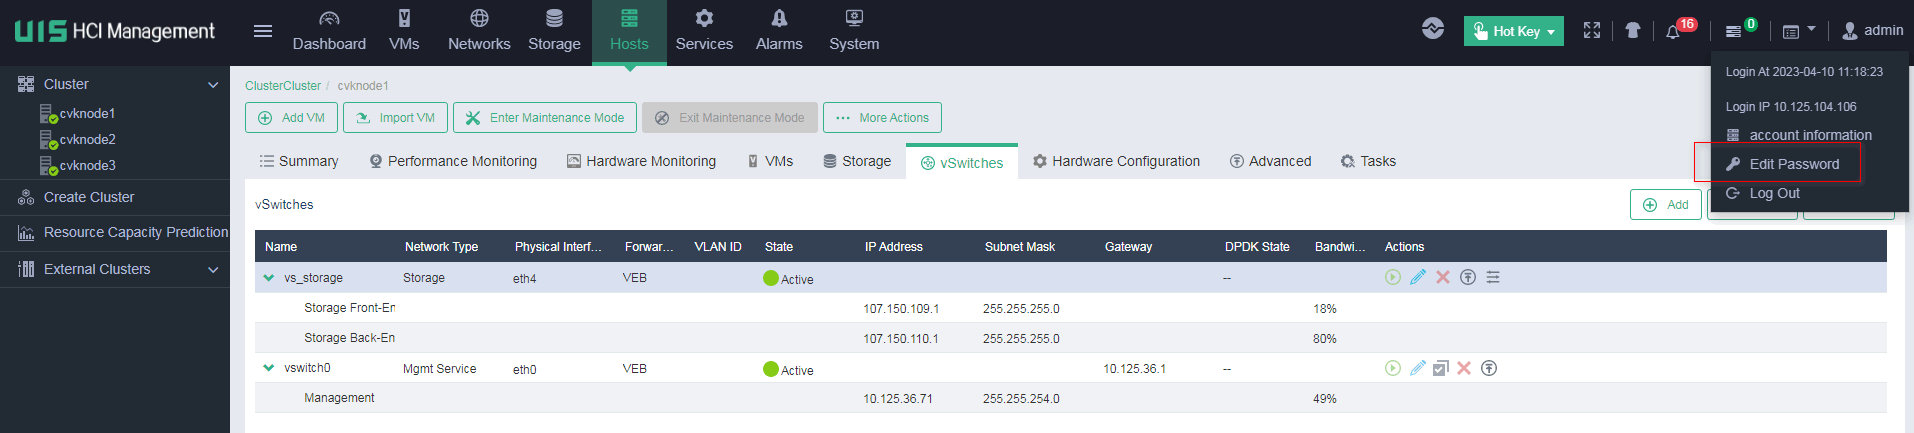
Managing physical interfaces bound to a vSwitch
When the live plan is improper, you must adjust the physical interfaces bound to the vSwitch. If you want to change the network settings after the deployment is finished, you must do that with caution and make sure you are familiar with the network topology and change requirements.
In version E0750P06 and later, you can do that in the Web interface as follows. First, configure the host to operate in maintenance mode. Then, access the Hosts > vSwitches page and edit the network settings. At last, confirm the connectivity and exit maintenance mode.
In versions earlier than E0750P06, you cannot modify the physical interfaces bound to a vSwitch and modify the mode in the Web interface. Instead, you must do that in the backend. By assigning multiple interfaces to an aggregation group, you can load-share the traffic among the member ports and provide higher connection availability for traffic.
Link aggregation delivers the following benefits:
· Increases the network bandwidth—Link aggregation binds multiple links into a logical link, whose bandwidth is the sum of the bandwidth of each single link.
· Improves the network connection availability—Multiple links in a link aggregation back up each other. When a link is disconnected, the traffic will be automatically load-shared again among the remaining links.
Based on whether LACP is enabled on the bond interfaces, link aggregation includes static aggregation and dynamic aggregation.
Dynamic aggregation on an OVS
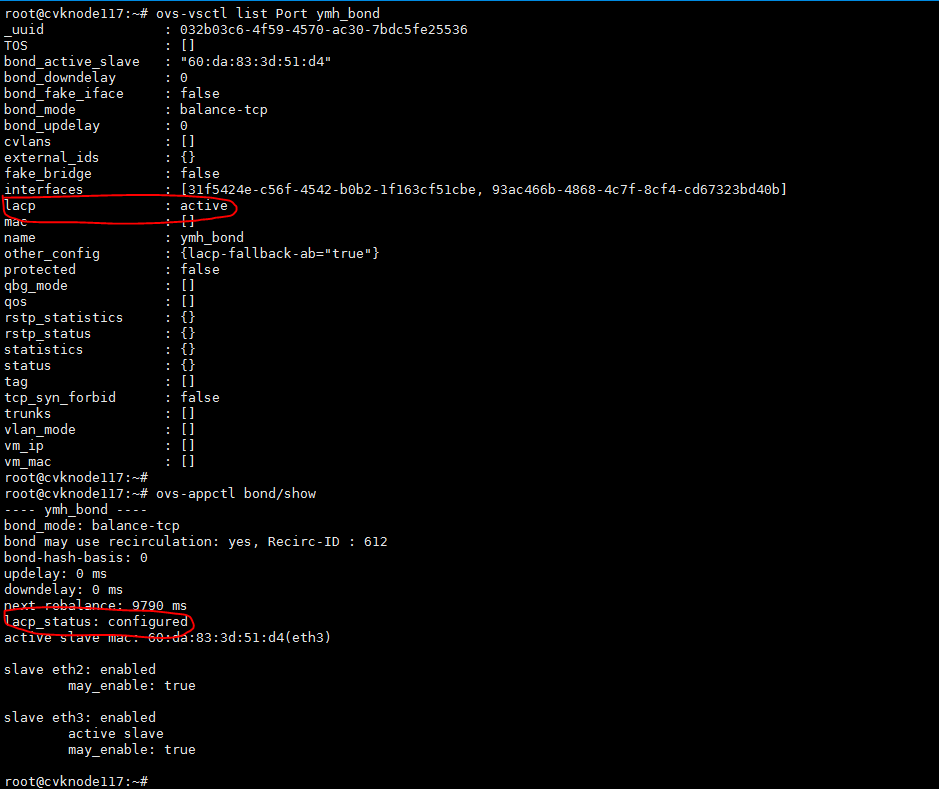
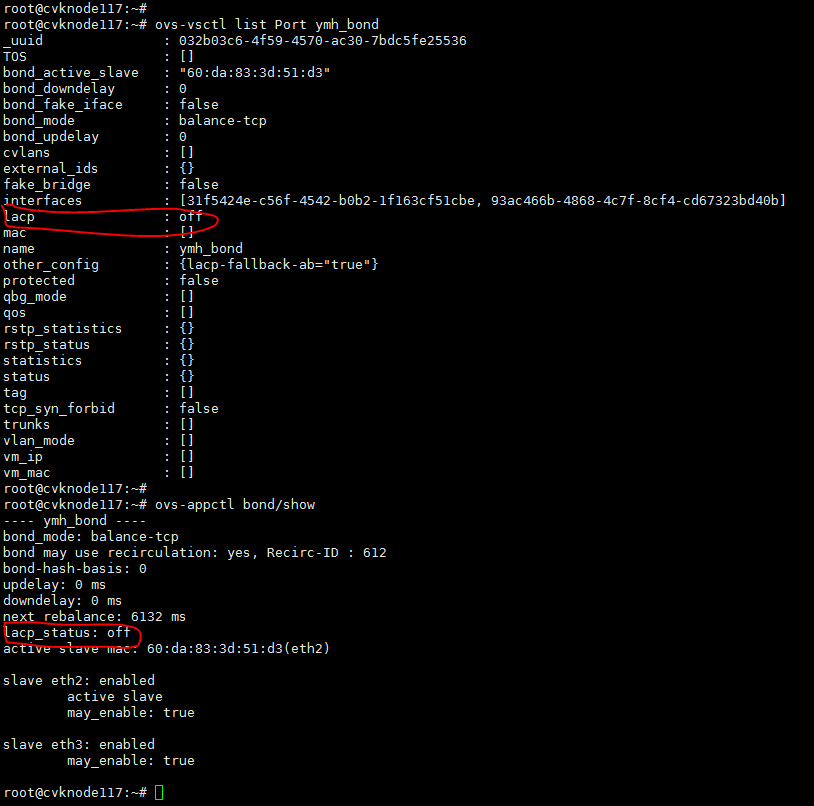
LACP is enabled on both the OVS side and switch side. On the bond interfaces of an OVS, the value for the lacp parameter can be active (enable LACP) or off (disable LACP).
The lacp_status parameter represents dynamic aggregation status. Options include negotiated (LACP negotiation succeeds), configured (LACP is enabled on the OVS side but LACP negotiation fails), and disabled (LACP is not enabled on the OVS side).
As shown in Figure 1, the lacp parameter is set to active on a bond interface to enable LACP on the bond interface of the OVS. However, the lacp_status parameter is configured on the bond interface. A possible reason is that LACP is not enabled on the peer device.
Figure 1 Dynamic aggregation autonegotiation fails
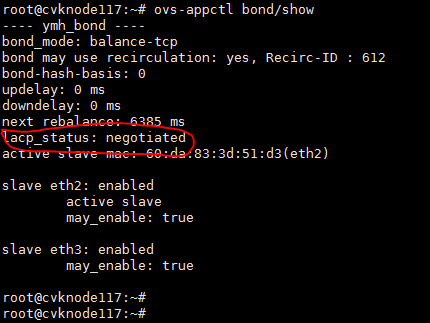
In normal conditions, LACP negotiation succeeds. In this case, the bond interface status is as shown in Figure 2.
Figure 2 Dynamic aggregation autonegotiation succeeds
On the OVS, dynamic aggregation supports advanced (balance-tcp mode) load sharing and basic (balance-slb mode) load sharing. The difference lies in the dimensions during the link entry hashing process.
· balance-tcp mode—Obtains the packet forwarding interface through hashing the Ethernet type, source/destination MAC address, VLAN ID, IP packet protocol, source/destination IP/IPv6 address, and source/destination Layer 4 port number fields of packets.
· balance-slb mode—Obtains the packet forwarding interface through hashing the source MAC and VLAN fields of packets. This bond_mode is deployed on the current Web interface.
Static aggregation on an OVS
LACP is disabled on both the OVS side and switch side. When the configuration succeeds, the state is as follows:
Figure 3 Static aggregation configuration state
In the bond interface configuration, the lacp parameter is set to off, and the lacp_status parameter is off for aggregation.
On the OVS, static aggregation supports advanced load sharing, basic load sharing, and active/backup load sharing. The difference between advanced load sharing and basic load sharing is the same as that in dynamic aggregation. The following information describes basic load sharing.
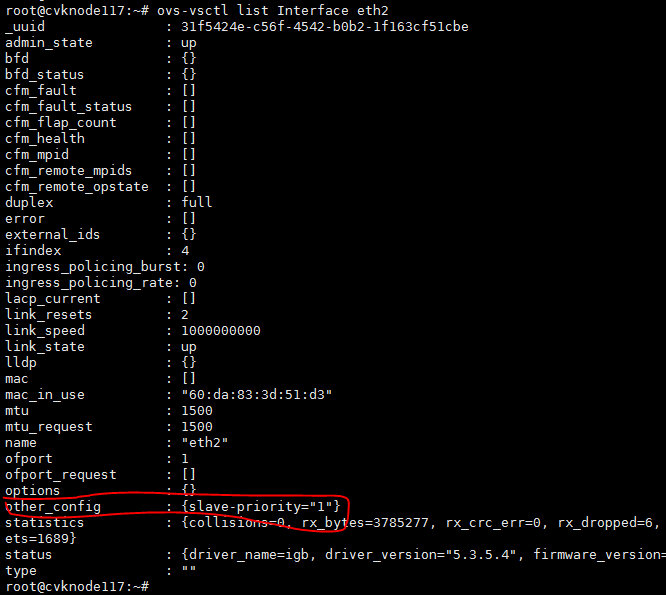
In the OVSDB, the bond interface configuration saves the active link selection method, and the interface configuration saves the physical NIC priority. Configure the following settings:
1. ovs-vsctl set Port bond-name other_config: active-algorithm=”speed|order”
The speed option means to select the active link by NIC speed. The order option means to select the active link in the NIC configuration order. If this command is not executed, the active link is selected by NIC speed by default.
2. ovs-vsctl set Port bond-name other_config:active-algorithm=”true|false”
The true option means the traffic will be switched back to the selected active link NIC when the NIC goes down and then comes up. The false option means the traffic will not be switched back. If this command is not executed, the traffic will not be switched back by default.
3. ovs-vsctl set Interface ethx other_config:slave-priority=”n”,
The n argument represents the ID assigned by the back end according to the configuration order, for example, 1, 2, 3... A smaller ID means a higher priority.
Figure 4 Active/backup aggregation group configuration
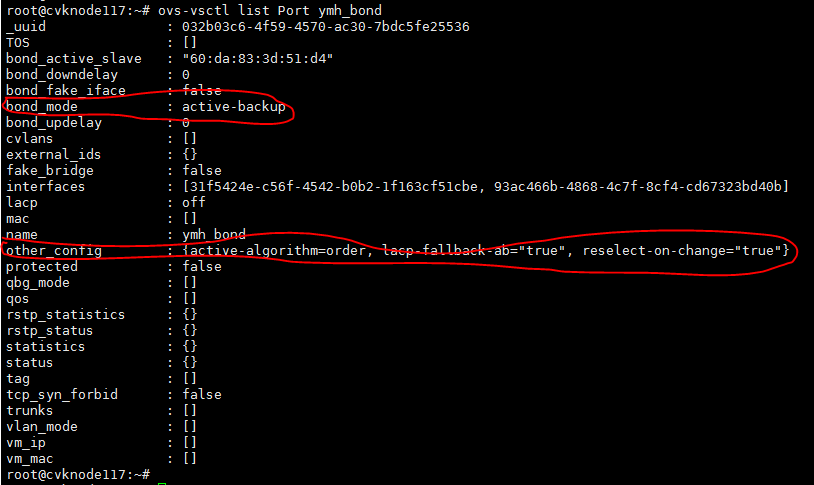
Figure 5 Member interface configuration for an active/backup aggregation group on an OVS
Changing single NIC interfaces to a dynamic aggregation group on an OVS
The following information describes how to change single NIC interface eth7 into a dynamic aggregation group with member interfaces eth5 and eth7 for advanced/basic load sharing on vswitch0 on the management network.
· If the peer switch of eth5 and eth7 has been configured with a dynamic aggregation group and the two interfaces have been assigned to the aggregation group, you only need to configure the dynamic aggregation group with advanced (bond_mode=balance-tcp) or basic (bond_mode= balance-slb) load sharing on the OVS.
ovs-vsctl del-port vswitch0 eth7; ovs-vsctl -- add-bond vswitch0 vswitch0_bond eth5 eth7 bond_mode=[balance-tcp | balance-slb] -- set port vswitch0_bond lacp=active
| CAUTION: You must enter the commands before and after the semicolon (;) at the same time. In this way, when the management interface is disconnected (eth7 is removed from vswitch0), vswitch0 is immediately configured with the dynamic aggregation group containing eth5+eth7. |
· If the peer switch of eth5 and eth7 is not configured with a dynamic aggregation group, you can configure a static active/backup aggregation and then switch the aggregation mode.
a. Create a static active/backup aggregation group with members eth5 and eth7 on the OVS:
ovs-vsctl del-port vswitch0 eth7;ovs-vsctl add-bond vswitch0 vswitch0_bond eth5 eth7 bond_mode=active-backup
b. Configure a dynamic aggregation group on the peer switch of eth5 and eth7, and assign the two interfaces to the aggregation group.
Without loss of generality, suppose eth5 is connected to GigabitEthernet 1/0/5 on the peer switch and eth7 is connected to GigabitEthernet1/0/7 on the peer switch.
[H3C]interface Bridge-Aggregation 8 //Create aggregation group 8
[H3C-Bridge-Aggregation8]link-aggregation mode dynamic //Specify the aggregation group as a dynamic aggregation group
[H3C]interface GigabitEthernet 1/0/5
[H3C-GigabitEthernet1/0/5]port link-aggregation group 8 //Assign GigabitEthernet 1/0/5 to aggregation group 8
[H3C]interface GigabitEthernet 1/0/7
[H3C-GigabitEthernet1/0/7]port link-aggregation group 8 //Assign GigabitEthernet 1/0/7 to aggregation group 8
| CAUTION: Make sure the configuration (especially the VLAN configuration) of aggregation group Bridge-Aggregation 8 is the same as the configuration of member interfaces (GigabitEthernet 1/0/5 and GigabitEthernet 1/0/7 in this example). If you cannot do that, dynamic aggregation and static advanced/basic load sharing will fail. |
c. Execute the following command to configure the static active/backup aggregation group to operate in dynamic advanced (bond_mode=balance-tcp) or basic (bond_mode= balance-slb) load sharing mode:
ovs-vsctl set port vswitch0_bond bond_mode=[balance-tcp | balance-slb] lacp=active
Changing single NIC interfaces to a static aggregation group on an OVS
The following information describes how to change single NIC interface eth7 into a dynamic advanced/basic load sharing aggregation group with member interfaces eth5 and eth7 on vswitch0 on the management network.
· If the peer switch of eth5 and eth7 has been configured with a dynamic aggregation group and the two interfaces have been assigned to the aggregation group, you only need to configure the dynamic aggregation group with advanced (bond_mode=balance-tcp) or basic (bond_mode= balance-slb) load sharing on the OVS.
ovs-vsctl del-port vswitch0 eth7; ovs-vsctl -- add-bond vswitch0 vswitch0_bond eth5 eth7 bond_mode=[balance-tcp | balance-slb] -- set port vswitch0_bond lacp=active
| CAUTION: You must enter the commands before and after the semicolon (;) at the same time. In this way, when the management interface is disconnected (eth7 is removed from vswitch0), vswitch0 is immediately configured with the dynamic aggregation group containing eth5+eth7. |
· If the peer switch of eth5 and eth7 is not configured with a dynamic aggregation group, you can configure a static active/backup aggregation and then switch the aggregation mode.
a. Create a static active/backup aggregation group with members eth5 and eth7 on the OVS:
ovs-vsctl del-port vswitch0 eth7;ovs-vsctl add-bond vswitch0 vswitch0_bond eth5 eth7 bond_mode=active-backup
b. Configure a dynamic aggregation group on the peer switch of eth5 and eth7, and assign the two interfaces to the aggregation group.
Without loss of generality, suppose eth5 is connected to GigabitEthernet 1/0/5 on the peer switch and eth7 is connected to GigabitEthernet1/0/7 on the peer switch.
[H3C]interface Bridge-Aggregation 8 //Create aggregation group 8
[H3C]interface GigabitEthernet 1/0/5
[H3C-GigabitEthernet1/0/5]port link-aggregation group 8 //Assign GigabitEthernet 1/0/5 to aggregation group 8
[H3C]interface GigabitEthernet 1/0/7
[H3C-GigabitEthernet1/0/7]port link-aggregation group 8 //Assign GigabitEthernet 1/0/7 to aggregation group 8
| CAUTION: Make sure the configuration (especially the VLAN configuration) of aggregation group Bridge-Aggregation 8 is the same as the configuration of member interfaces (GigabitEthernet 1/0/5 and GigabitEthernet 1/0/7 in this example). If you cannot do that, dynamic aggregation and static advanced/basic load sharing will fail. |
c. Execute the following command to configure the static active/backup aggregation group to operate in static advanced (bond_mode=balance-tcp) or basic (bond_mode= balance-slb) load sharing mode:
ovs-vsctl set port vswitch0_bond bond_mode=[balance-tcp | balance-slb]
Changing a dynamic aggregation group to a static aggregation group on an OVS
The following information changes the dynamic aggregation group with eth5 and eth7 to a static aggregation group on vswitch0.
To smoothly change a dynamic aggregation group to a static aggregation group (try to avoid packet loss as possible), you must configure a static active/backup aggregation group in between.
1. Change a dynamic aggregation group to a static active/backup aggregation group on the OVS.
ovs-vsctl set port vswitch0_bond bond_mode=active-backup lacp=off
2. Disable LACP for the aggregation group (Bridge-Aggregation 8 in this example) on the peer switch of eth5 and eth7.
[H3C]interface Bridge-Aggregation 8
[H3C-Bridge-Aggregation8]undo link-aggregation mode dynamic
3. Change the static active/backup aggregation group to a static aggregation group with advanced/basic load sharing on the OVS.
ovs-vsctl set port vswitch0_bond bond_mode=[balance-tcp | balance-slb]
Changing a static aggregation group to a dynamic aggregation group on an OVS
The following information switches the static aggregation group with eth5 and eth7 to a dynamic aggregation group on vswitch0.
1. Change a static aggregation group to a static active/backup aggregation group on the OVS.
Skip this step if the aggregation group on the OVS is a static active/backup aggregation group.
ovs-vsctl set port vswitch0_bond bond_mode=active-backup
2. Enable LACP for the aggregation group (Bridge-Aggregation 8 in this example) on the peer switch of eth5 and eth7.
[H3C]interface Bridge-Aggregation 8
[H3C-Bridge-Aggregation8]link-aggregation mode dynamic
3. Change the static active/backup aggregation group to a dynamic aggregation group with advanced/basic load sharing on the OVS.
ovs-vsctl set port vswitch0_bond bond_mode=[balance-tcp | balance-slb] lacp=active
Deleting an aggregation group on an OVS
The following information describes how to change a dynamic advanced load-sharing aggregation group with member interfaces eth5 and eth7 to single interface eth7 on vswitch0.
1. Change the aggregation mode to static active/backup aggregation on vswitch0.
ovs-vsctl set port vswitch0_bond bond_mode=active-backup lacp=off
2. Remove eth5 and eth7 from the aggregation group on vswitch0.
Suppose eth5 is connected to GigabitEthernet 1/0/5 on the peer switch and eth7 is connected to GigabitEthernet 1/0/7 on the peer switch.
[H3C]interface GigabitEthernet 1/0/5
[H3C-GigabitEthernet1/0/5]undo port link-aggregation group
[H3C]interface GigabitEthernet 1/0/7
[H3C-GigabitEthernet1/0/7]undo port link-aggregation group
3. Delete the static active/backup aggregation group on vswitch0, and assign eth7 to switch0.
ovs-vsctl del-port vswitch0_bond;ovs-vsctl add-port vswitch0 eth7
The way of switching a static advanced/basic load-sharing aggregation group to a single link is similar to the way of switching a dynamic advanced/basic load-sharing aggregation group to a single link. The difference is that the following command is executed in the first step:
ovs-vsctl set port vswitch0_bond bond_mode=active-backup
| CAUTION: Because of various objective restrictions (for example, restrictions on the peer physical switch), the CAS OVS cannot absolutely perform the aggregation mode switchover smoothly, and few packets will be dropped. As a best practice, perform aggregation mode switchover when the traffic is light. |
Replacing a disk on a CVK host
When a disk in the cluster fails, it cannot be directly replaced. Software operations and configurations are required for a successful disk replacement on UIS Manager. For more information, see H3C UIS Hyper-Converged Infrastructure Component Replacement Configuration Guide.
Changing the password for accessing UIS Manager
| CAUTION: · To change the root password for a CVK, access the Web interface of UIS Manager. You cannot change the root password for a CVK host from its command shell. · As a best practice, configure the same password for all hosts in the cluster. · Regularly change your password and avoid using simple or common passwords. |
To meet security requirements, user passwords need to be changed periodically. The following changes the password of the UIS root user as an example.
Changing the root password of a host from the Web interface
1. Right-click a host, and then select Edit Host.
2. In the dialog box that opens, enter a new password, and then click OK.

If you forget the root password, see H3C UIS&CAS Host Password Retrieval Configuration Guide.
Changing the admin password
UIS Manager has a default password. To change this password, access UIS Manager and click admin in the upper-right corner, and then change the password as needed.
As a best practice, change the root password and admin password in time at the first login to UIS Manager.
Scaling out and scaling in a cluster
See H3C UIS Manager Resource Scale-Out and Scale-In Configuration Guide.
Changing the system time
See H3C UIS Manager System Time Modification Configuration Guide.
Performing a heterogeneous or homogeneous migration
See H3C UIS HCI Cloud Migration Guide.
Redefining a VM
In some cases, such as when a VM fails to start up due to host operation issues, it might be necessary to redefine and restore a VM on a different host from the original location. However, VMs that use raw blocks and encrypted disks and have multi-level images do not support VM redefinition.
Obtaining the XML file of the VM
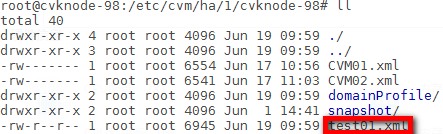
Obtaining the XML file of the VM when HA is enabled and the CVM node is normal
When HA is enabled and the CVM node is normal, the XML file of a VM is saved in the HA directory on the CVM node by default. Typically, the HA directory is /etc/cvm/ha/clust_id/cvk_name, for example, /etc/cvm/ha/2/cvknode191. In the corresponding HA directory, enter the CVK directory for the VM to find the XML file of the VM, for example, test01.
Obtaining the XML file of the VM when HA is disabled and the CVM node is normal
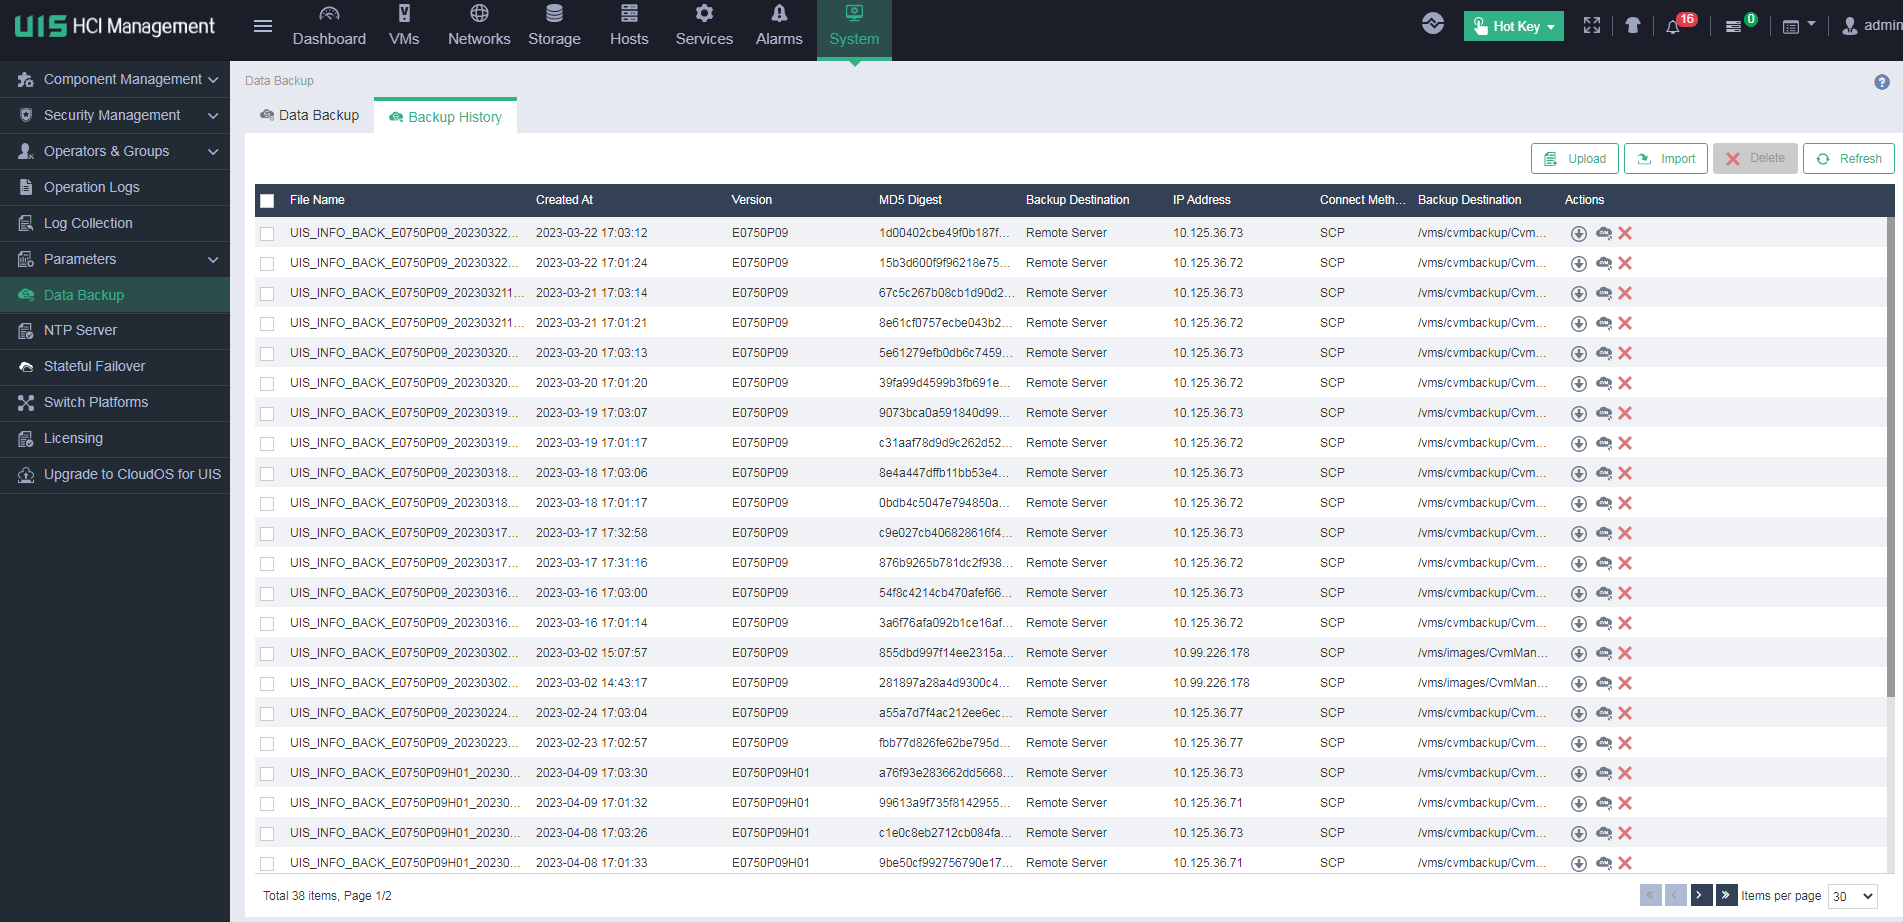
1. On the top navigation bar, click System, and then select Data Backup > Backup History from the left navigation pane. Then, download the most recent backup file.
This example downloads backup file UIS_INFO_BACK_E0750P07_20220713123106.tar.gz.
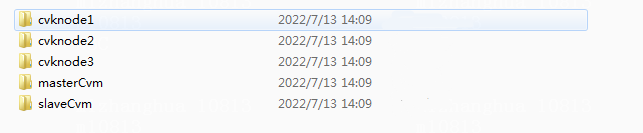
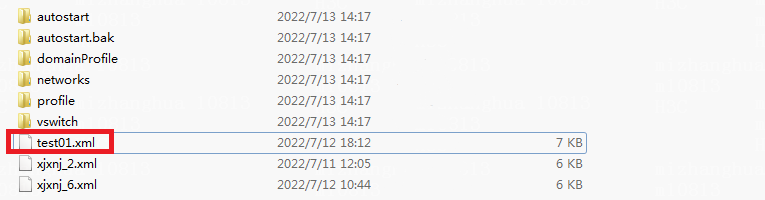
2. Decompress the downloaded backup file and enter directory UIS_INFO_BACK_E0750P07_20220713123106\cvknode1_crm_cvknode2\CVM_INFO_BACK_E0710P21_20220713123125\front\cvks.
![]()
3. Select the directory for the host where the VM is located, and then decompress the libvirt.tar.gz file in the directory. Then, enter the qemu subdirectory to obtain the XML file of the VM.
![]()
| NOTE: Directory cvknode1_crm_cvknode2 is named in the format of primary CVM node name_crm_secondary CVM node name. In a single host environment, this directory is named in the format of CVM node name. |
Obtaining the XML file of the VM when HA is disabled and the CVM node is faulty
If HA is disabled and the CVM node is faulty, you cannot access UIS Manager. To obtain the XML file of a VM in this case, perform the following steps:
1. Use an SSH client to access each node in the cluster to find a node that has the /vms/cvmbackup directory.
The backup data is saved on three random hosts managed by the system.
2. Enter the /vms/cvmbackup directory on the node, and then enter the cvknode1_crm_cvknode2 directory to identify the most recent backup record. Then, enter the corresponding directory to locate the front.tar.gz file.
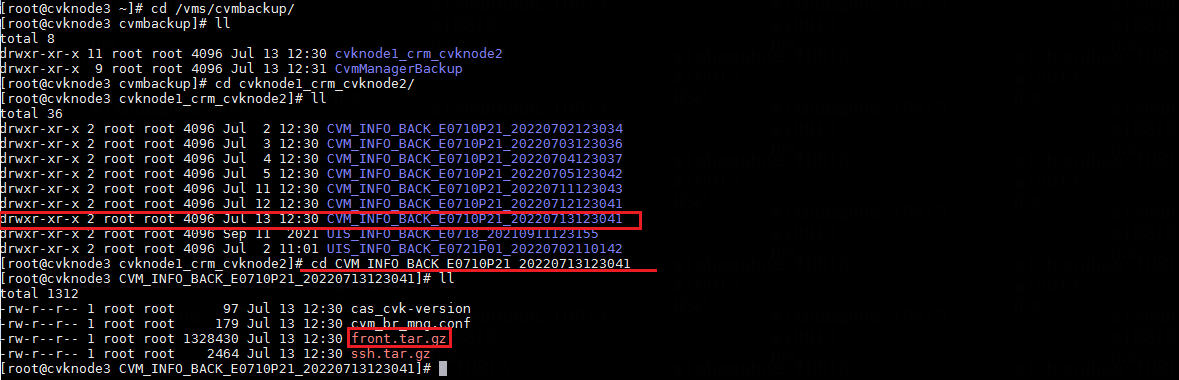
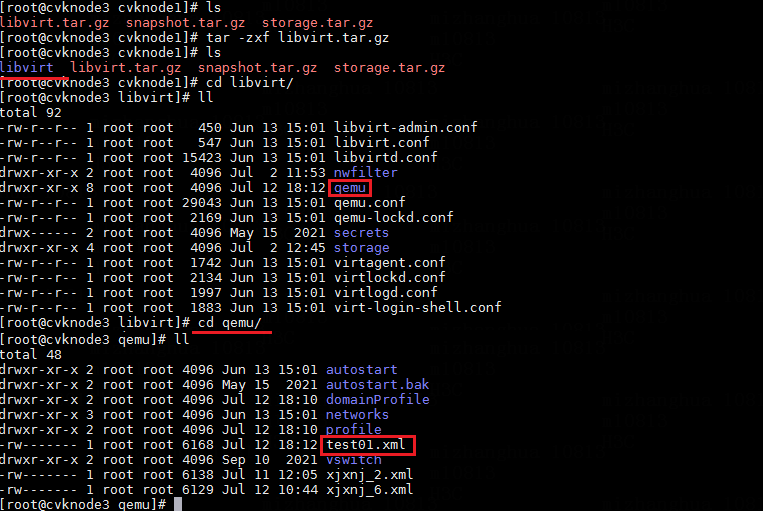
3. Decompress the front.tar.gz file, and then enter the cvks directory. Then, enter the directory for the host where the VM is located, and then decompress the libvirt.tar.gz file in the directory.
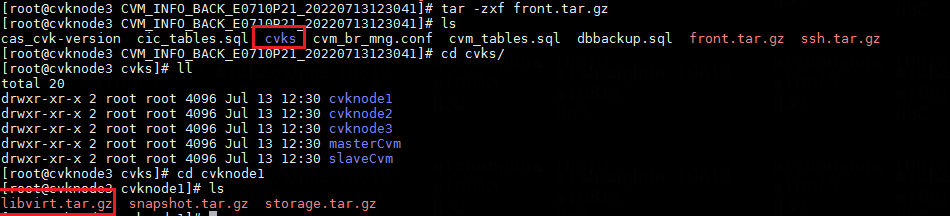
4. Enter the libvirt/qemu directory after decompression to find the XML file of the VM.
Identifying the storage volume for VM disk files
If you already know the storage volume for VM disk files, verify that the corresponding storage volume on another host that has mounted it is normal from the CLI of the host. If you do not know the storage volume for VM disk files, execute the vim or cat command to obtain the disk file location of the VM from the XML file obtained in "Obtaining the XML file of the VM." For example:
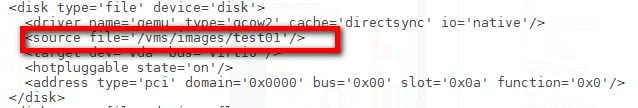
The source file field displays the location of the VM disk files.
Copying the XML file of the VM to the target host
Use SCP to copy the XML file of the VM to the /etc/libvirt/qemu directory on the host where the storage volume location has been identified in "Identifying the storage volume for VM disk files."
Defining the VM through XML
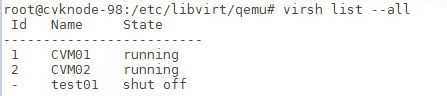
1. Execute the virsh define vm.xml command in the /etc/libvirt/qemu directory.
![]()
The VM is defined through XML.
2. Verify that the VM is also displayed in the output from the virsh list –all command at the CLI of the new host.
3. Connect the host from the Web interface. Then, you can view and start up the VM on from the Web interface.
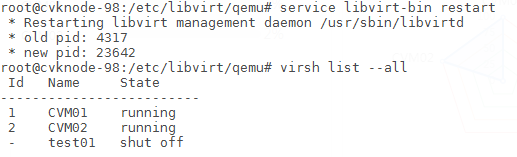
To define many VMs, you can also reboot libvirt to automatically define these VMs if the system does not have any VMs with their names in Chinese characters. Then, start up these VMs after successful definition, as shown in the following figure:
Clearing VM data on the original host
If the original host has been completely damaged due to some hardware issues, resolve the hardware issues, and then re-install the same UIS version as the original system.
If the original host does not have hardware issues, perform the following steps to clear VM data on the host:
1. Disconnect the network cable from the original host before the host starts up.
2. Log in to the CLI of the original host to remove the XML file of the VM to avoid dual writes that occur when HA brings up the VM on the original host after the server restarts.
Configuring stateful failover
See H3C UIS Manager Stateful Failover Configuration Guide.
Configure a stateful failover system before a version upgrade.
If you cannot access the ONEStor Web interface, access the CVM node to execute the following commands:
![]()
Then, execute the following command:
![]()
Replacing SSDs with NVMe drives
See H3C UIS Manager Configuration Guide for Replacing SSDs with NVMe Disks.
Migrating VMware VMs
See H3C UIS HCI Cloud Migration Guide.
Configuring GPUs
See H3C UIS Manager GPU Passthrough Configuration Guide.
Configuring vGPUs
See H3C UIS Manager vGPU Configuration Guide.
Configuring anti-virus
Contact Technical Support.
Configuring AISHU backup
See H3C UIS AISHU Solution Configuration Guide.
Configuring storage disaster recovery
See H3C UIS Manager Site Recovery Management Configuration Guide.
Collecting logs
Collecting logs of the UIS Manager
Collecting logs from the Web interface
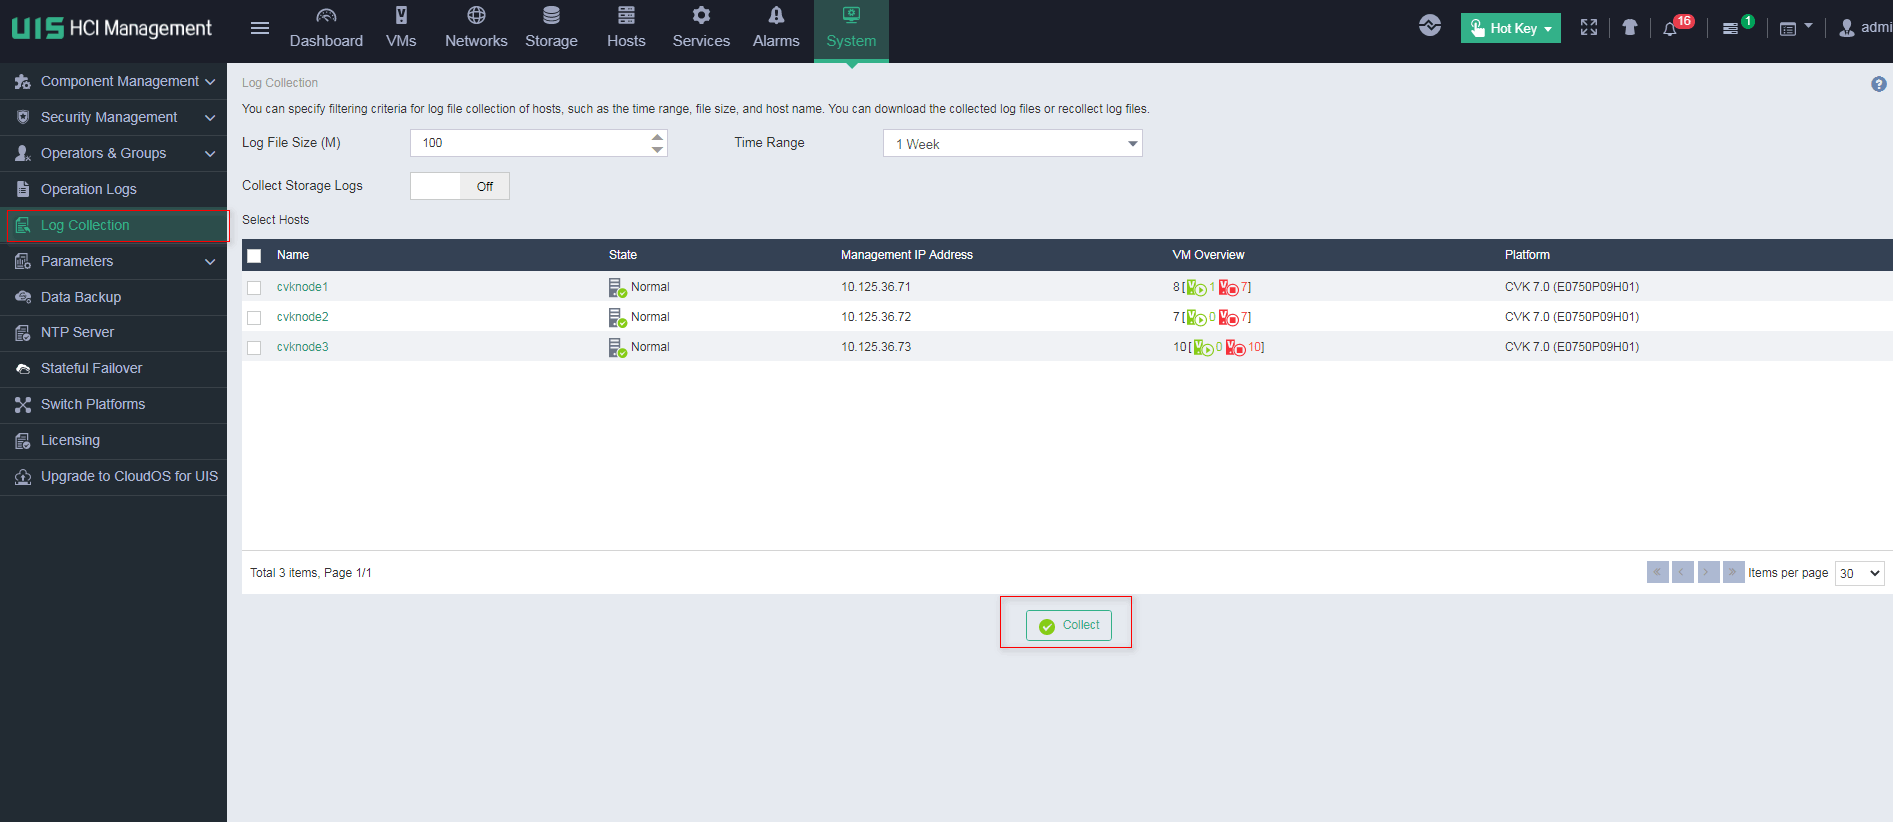
1. On the top navigation bar, click System, and then select Log Collection from the left navigation pane.
2. Select the CVK hosts for which the system collects logs, and then click Collect to save the log files locally.
Collecting logs at the CLI of a CVK host
If you cannot collect logs from the Web interface of the UIS Manager due to CVK failure, access the CLI of the CVK host to collect logs manually.
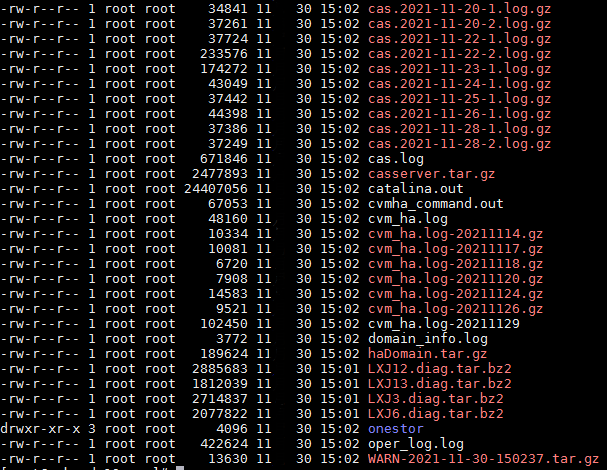
To collect logs at the CLI of a CVK host, access the CLI of the CVK host, and then execute the cas_collect_log.sh command. A compressed file is generated in the /vms directory as shown in the figure.

To analyze the logs, download the file to your local computer by using SSH client software.
For ONEStor-related hosts, you cannot collect logs for them by executing the script. To collect logs for a ONEStor-related host, manually copy the logs in the /var/log/storage and /var/log/ceph directories. If the time range for log collection is short or the log size is too large, you can collect part of the logs archived in the /var/log/storage/backup directory.
Introduction to logs
Logs collected from the Web interface
UIS log files downloaded from the Web interface are named in the UIS_×××_×××.tar.gz format. A decompressed log file includes the following types of files:
· catalina.out—Contains logs of Web functions on the UIS Manager.
· oper_log.log—Contains user operation logs.
· *.diag.tar.bz2—Contains logs of each CVK host.
· onestor—Contains operation logs and system logs of ONEStor.
· WARN*.tar.gz—Contains alarm messages.
Logs collected at the CLI
CVK host log files obtained at the CLI are named in the XXX.tar.bz2 format. A decompressed CVK host log file includes the following types of directory files:
· etc—Contains UIS configuration files, which are mainly VM configuration files. The VM configuration files are in the libvirt/qemu/VM.xml directory.
· var—Contains logs of each UIS feature module.
· command.out—Contains output information about frequently used commands at the CLI.
· cas _cvk-version—Contains UIS version information.
· loglist—Contains UIS log file names.
· uis_raid_card_info.log—Contains basic information about RAID controllers on the host.
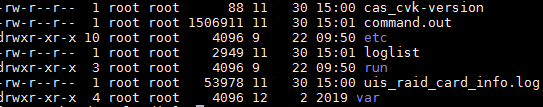
The var directory mainly contains the following logs:
![]()
· messages—Host system logs, which record the system running information.
· fsm—Shared file system logs.
· cas_ha—HA logs.
· Ha_shell_XX.log—HA logs.
· libvirt—VM logs.
· openvswitch—Logs generated by the OVS running process.
· Ovs_shell_XX.log—Logs generated by calling the ovs_bridge.sh script.
· tomcat8—UIS Web logs.
· operation—Logs for manual operations at the CLI of UIS Manager.
The following provides descriptions for CVK host logs:
· Messages logs
Messages logs record critical information during operating system operation. The following introduces the records for an abnormal reboot of a CVK host.
Feb 3 13:58:01 XJYZ-CVK01 CRON【64458】: (root) CMD (ump-node-sync )
Feb 3 13:58:01 XJYZ-CVK01 CRON【64459】: (root) CMD (ump-sync -p ALL)
Feb 3 13:58:01 XJYZ-CVK01 CRON【64460】: (root) CMD ( /opt/bin/ocfs2_iscsi_conf_chg_timer.sh)
Feb 3 13:58:01 XJYZ-CVK01 CRON【64443】: (CRON) info (No MTA installed, discarding output)
Feb 3 14:06:35 XJYZ-CVK01 kernel: imklog 5.8.6, log source = /proc/kmsg started.
Feb 3 14:06:35 XJYZ-CVK01 rsyslogd: 【origin software="rsyslogd" swVersion="5.8.6" x-pid="2747" x-info="http://www.rsyslog.com"】 start
Feb 3 14:06:35 XJYZ-CVK01 rsyslogd: rsyslogd's groupid changed to 103
Feb 3 14:06:35 XJYZ-CVK01 rsyslogd: rsyslogd's userid changed to 101
Feb 3 14:06:35 XJYZ-CVK01 rsyslogd-2039: Could not open output pipe '/dev/xconsole' 【try http://www.rsyslog.com/e/2039 】
Feb 3 14:06:35 XJYZ-CVK01 kernel: 【0.000000】 Initializing cgroup subsys cpuset
Feb 3 14:06:35 XJYZ-CVK01 kernel: 【0.000000】 Initializing cgroup subsys cpu
Feb 3 14:06:35 XJYZ-CVK01 kernel: 【0.000000】 Initializing cgroup subsys cpuacct
Feb 3 14:06:35 XJYZ-CVK01 kernel: 【0.000000】 Linux version 3.13.6 (root@cvknode22) (gcc version 4.6.3 (Ubuntu/Linaro 4.6.3-1ubuntu5) ) #5 SMP Mon Jul 21 10:07:26 CST 2014
Feb 3 14:06:35 XJYZ-CVK01 kernel: 【0.000000】 Command line: BOOT_IMAGE=/boot/vmlinuz-3.13.6 root=UUID=4beeb503-6e10-4836-93a4-0836a9a1571e ro nomodeset elevator=deadline transparent_hugepage=always crashkernel=256M quiet
Feb 3 14:06:35 XJYZ-CVK01 kernel: 【0.000000】 KERNEL supported cpus:
Feb 3 14:06:35 XJYZ-CVK01 kernel: 【0.000000】 Intel GenuineIntel
Feb 3 14:06:35 XJYZ-CVK01 kernel: 【0.000000】 AMD AuthenticAMD
Feb 3 14:06:35 XJYZ-CVK01 kernel: 【0.000000】 Centaur CentaurHauls
Feb 3 14:06:35 XJYZ-CVK01 kernel: 【0.000000】 e820: BIOS-provided physical RAM map:
Feb 3 14:06:35 XJYZ-CVK01 kernel: 【0.000000】 BIOS-e820: 【mem 0x0000000000000000-0x000000000009cbff】 usable
Feb 3 14:06:35 XJYZ-CVK01 kernel: 【0.000000】 BIOS-e820: 【mem 0x000000000009cc00-0x000000000009ffff】 reserved
Feb 3 14:06:35 XJYZ-CVK01 kernel: 【0.000000】 BIOS-e820: 【mem 0x00000000000f0000-0x00000000000fffff】 reserved
Feb 3 14:06:35 XJYZ-CVK01 kernel: 【0.000000】 BIOS-e820: 【mem 0x0000000000100000-0x00000000bf60ffff】 usable
As shown in the example, the messages log file does not have any records from 13:58:01 to 14:06:35, indicating that the CVK host failed in the time range.
The kernel-level logs record information about the CVK host after it restarted.
· Libvirt logs
In the /var/log/libvirt/libvirtd.log log file, an alarm that the CVK host lacks memory resources exists and the current memory usage has reached 97%. (The alarm message prompted when the CPU resources are insufficient is similar to that in the example.)
2014-10-24 09:15:52.792+0000: 2994: warning : virIsLackOfResource:1106 : Lack of Memory resource! only 374164 free 64068 cached and vm locked memory(4194304*0%) of 16129760 total, max:85; now:97
2014-10-24 09:15:52.792+0000: 2994: error : qemuProcessStart:3419 : Lack of system resources, out of memory or cpu is too busy, please check it.
The /var/log/libvirt/qemu directory saves the log files of VMs running on the CVK host.
root@UIS-CVK01:/var/log/libvirt/qemu# ls -l
total 44
-rw------- 1 root root 7067 Jan 9 19:08 RedHat5.9.log
-rw------- 1 root root 1969 Jan 18 15:41 win7.log
-rw------- 1 root root 26574 Feb 11 16:15 windows2008.log
VM logs files record VM running information, including the time when the VM started up and was closed and disk files of the VM.
2015-02-11 15:50:18.349+0000: starting up
LC_ALL=C PATH=/usr/local/sbin:/usr/local/bin:/sbin:/bin:/usr/sbin:/usr/bin QEMU_AUDIO_DRV=none /usr/bin/kvm -name windows2008 -S -machine pc-i440fx-1.5,accel=kvm,usb=off,system=windows -cpu qemu64,hv_relaxed,hv_spinlocks=0x2000 -m 1024 -smp 1,maxcpus=12,sockets=12,cores=1,threads=1 -uuid 43741f06-166d-4155-b47e-4137df68e91c -no-user-config -nodefaults -chardev file=/vms/sharefile/windows2008,if=none,id=drive-virtio-disk0,format=qcow2,cache=directsync –device
…
char device redirected to /dev/pts/0 (label charserial0)
qemu: terminating on signal 15 from pid 4530
2015-02-11 16:15:28.825+0000: shutting down
· OCFS2 logs
The /var/log/fsm/fsm_core*.log log file records information about processing triggered by OCFS2 Fence of the CVK host.
2021-11-04 06:40:35,882 manager:233 INFO Received an event: {'index': 7, 'type': 'fence_umount', 'uuid': u'851D36905AB74AFD93E1ABA8259DA3A2', 'seq': 11538, 'dev_name': u'dm-7'}
2021-11-04 06:40:35,923 manager:204 INFO Remain 0 events to be handling
2021-11-04 06:40:35,923 manager:131 INFO Manager received an event: Pool sharefile06 was fence_umount
2021-11-04 06:40:35,923 fspool:141 INFO Pool sharefile06 received a event fence_umount
· Operation logs
Operation logs record information about the commands executed at the CLI of the CVK host. The following contains commands executed from Apr 19th to Apr 21st.
root@cvknode1:~/cas# ll /var/log/operation/
total 32
drwxrwxrwx 2 root root 4096 Apr 21 10:06 ./
drwxr-xr-x 40 root root 4096 Apr 21 11:01 ../
-rwxrwxrwx 1 root root 5162 Apr 19 17:49 18-04-19.log*
-rwxrwxrwx 1 root root 829 Apr 20 19:11 18-04-20.log*
-rwxrwxrwx 1 root root 8505 Apr 21 11:00 18-04-21.log*
The following example shows the content of an operation log file, including the following information:
¡ Time when a command was executed.
¡ Login user.
¡ Login address.
¡ Login method.
¡ Executed commands.
¡ Directory where a command was executed.
2018/04/19 16:56:50##root pts/6 (172.16.130.3)##/root## vi /var/log/tomcat8/cas.log
2018/04/19 16:57:05##root pts/6 (172.16.130.3)##/root## service tomcat8 restart
2018/04/19 17:02:21##root pts/5 (172.16.130.3)##/root## cat /etc/cvk/system_alarm.xml
2018/04/19 17:02:23##root pts/5 (172.16.130.3)##/root## lsblk
2018/04/19 17:49:04##root pts/6 (172.16.130.3)##/root## ceph osd tree
2018/04/19 17:49:19##root pts/6 (172.16.130.3)##/root## stop ceph-osd id=3
Collecting logs of CAStools
The UIS system and VMs are separated. To monitor and manage VMs on the UIS Manager, you must install CAStools in the operating system of the VMs.
The log collection method for CAStools varies by the operating system installed on the VM:
· Windows operating system—Obtain the qemu-ga.log file in the C:\Program Files\castools\ directory of the VM.
· Linux operating system—Obtain the qemu-ga.log and set-ip.log files in the /var/log/ directory of the VM.
Collecting logs of a VM operating system
Collecting logs of a Windows operating system
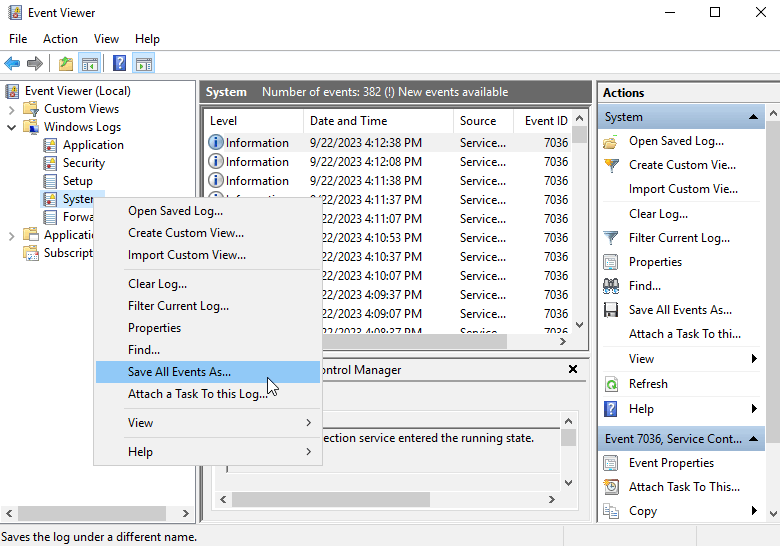
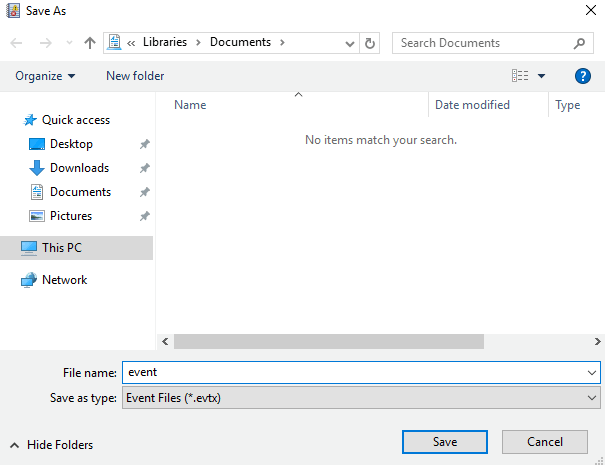
1. Open the Event Viewer window, and then select Windows Logs from the left navigation pane. Right click System, and then select Save All Events As.
2. Save the logs.
3. The downloaded log file is as shown in the figure.
Viewing logs of a Windows operating system
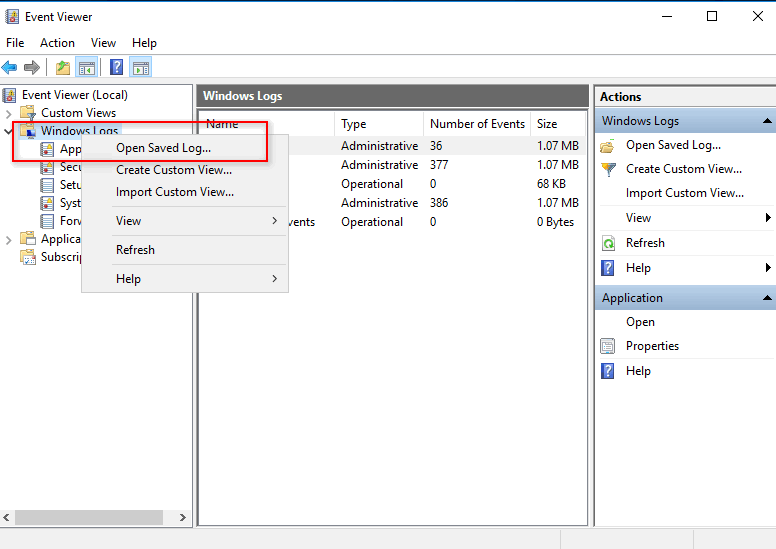
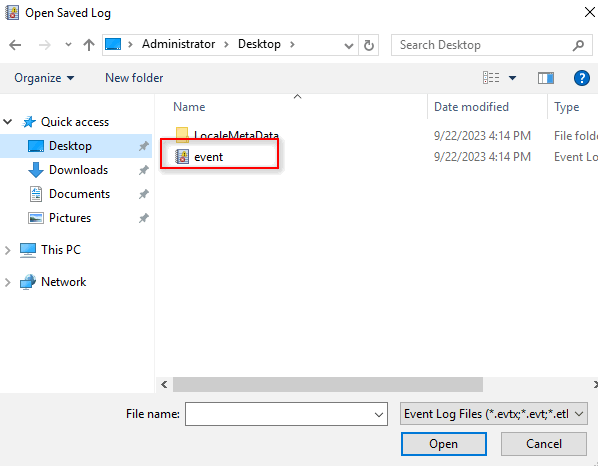
1. On the local computer (installed with the Windows 7 operating system), open the Event Viewer window. From the left navigation pane, right click Windows Logs, and then select Open Saved Log.
2. On the dialog box that opens, select the saved log file.
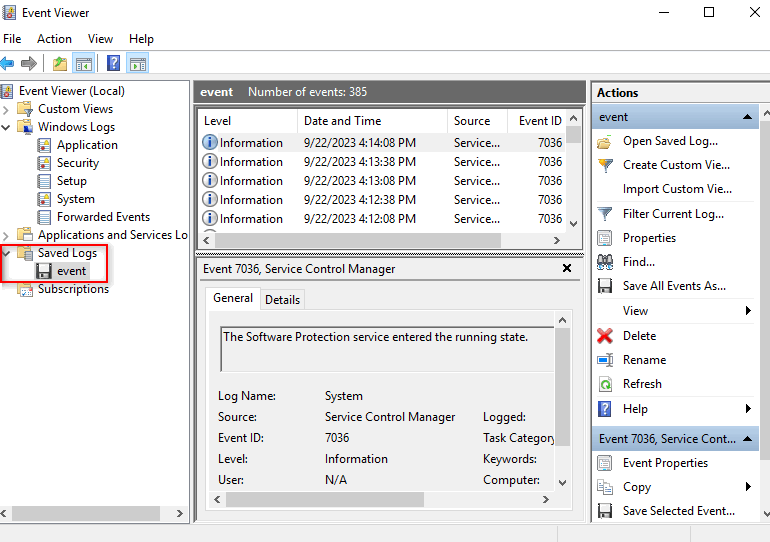
3. The logs are displayed on the Saved Logs > event page.
Collecting logs of a Linux operating system
To collect logs for a VM installed with a Linux operating system, collect logs in the /var/log directory. If the log size is large, first compress the logs and then copy the compressed file and save it locally.
For example, to collect logs generated on Sep 17th, 2019 for VM vm_test, execute the tar -cvf vm_test_20190917.tar.gz /var/log command.
Troubleshooting tools and utilities
Introduction to kdump
Kdump is a dump tool of the Linux kernel. It saves part of the memory to store the capture kernel. Once the current kernel crashes, kdump uses kexec to run the capture kernel. The capture kernel dumps complete information of the crashed kernel (for example, CPU register and stack statistics) to a file in a local disk or on the network.
By default, the UIS system supports kdump. When the kernel of a CVK host fails, the system generates a crash file in the /vms/crash directory for troubleshooting as shown in the example.
root@cvk29:/vms/crash# ls -lt
drwxr-sr-x 2 root whoopsie 4096 Jul 22 17:34 2014-07-22-09:34
The file named in the dump-*** format in the 2014-07-22-09:34 directory contains the output of kdump.
Analysis with the Kdump file
You can use the crash tool to analyze the Kdump file. The vmlinux file for the kernel version is needed for the analysis. You can find that file at /usr/src/linux-4.1.0-generic/vmlinux-kernelversion (the kernel version name might vary).
The following information describes how to use the Kdump file to locate typical online issues.
CPU error
Node cvknode1 at a site reboots repeatedly. After all virtual machines (VMs) are migrated and the shared storage settings are deleted from the node, the node still reboots repeatedly. The syslogs at reboots do not show occurrence of any anomalies before the reboot, while a vmcore file is present in the /vms/crash directory.
1. View abnormal call stack information in the vmcore file:
root@cvk21:/vms/tmp# crach vmlinux vmcore
No command 'crach' found, did you mean:
Command 'crash' from package 'crash' (main)
crach: command not found
root@cvk21:/vms/tmp# crash vmlinux vmcore
crash 7.0.5
Copyright (C) 2002-2014 Red Hat, Inc.
Copyright (C) 2004, 2005, 2006, 2010 IBM Corporation
Copyright (C) 1999-2006 Hewlett-Packard Co
Copyright (C) 2005, 2006, 2011, 2012 Fujitsu Limited
Copyright (C) 2006, 2007 VA Linux Systems Japan K.K.
Copyright (C) 2005, 2011 NEC Corporation
Copyright (C) 1999, 2002, 2007 Silicon Graphics, Inc.
Copyright (C) 1999, 2000, 2001, 2002 Mission Critical Linux, Inc.
This program is free software, covered by the GNU General Public License,
and you are welcome to change it and/or distribute copies of it under
certain conditions. Enter "help copying" to see the conditions.
This program has absolutely no warranty. Enter "help warranty" for details.
GNU gdb (GDB) 7.6
Copyright (C) 2013 Free Software Foundation, Inc.
License GPLv3+: GNU GPL version 3 or later [http://gnu.org/licenses/gpl.html]
This is free software: you are free to change and redistribute it.
There is NO WARRANTY, to the extent permitted by law. Type "show copying"
and "show warranty" for details.
This GDB was configured as "x86_64-unknown-linux-gnu"...
KERNEL: vmlinux
DUMPFILE: vmcore [PARTIAL DUMP]
CPUS: 8
DATE: Wed Nov 5 12:25:19 2014
UPTIME: 00:02:19
LOAD AVERAGE: 0.06, 0.05, 0.02
TASKS: 324
NODENAME: cvknode-1
RELEASE: 3.13.6
VERSION: #5 SMP Mon Jul 21 10:07:26 CST 2014
MACHINE: x86_64 (2132 Mhz)
MEMORY: 64 GB
PANIC: "Kernel panic - not syncing: Fatal Machine check"
PID: 0
COMMAND: "swapper/6"
TASK: ffff8807f4618000 (1 of 8) [THREAD_INFO: ffff8807f4620000]
CPU: 6
STATE: TASK_RUNNING (PANIC)
crash] bt
PID: 0 TASK: ffff8807f4618000 CPU: 6 COMMAND: "swapper/6"
#0 [ffff8807ffc6ac50] machine_kexec at ffffffff8104c991
#1 [ffff8807ffc6acc0] crash_kexec at ffffffff810e97e8
#2 [ffff8807ffc6ad90] panic at ffffffff8174ac9d
#3 [ffff8807ffc6ae10] mce_panic at ffffffff81038b2f
#4 [ffff8807ffc6ae60] do_machine_check at ffffffff810399d8
#5 [ffff8807ffc6af50] machine_check at ffffffff817589df
[exception RIP: intel_idle+204]
RIP: ffffffff8141006c RSP: ffff8807f4621db8 RFLAGS: 00000046
RAX: 0000000000000010 RBX: 0000000000000004 RCX: 0000000000000001
RDX: 0000000000000000 RSI: ffff8807f4621fd8 RDI: 0000000001c0d000
RBP: ffff8807f4621de8 R8: 0000000000000009 R9: 0000000000000004
R10: 0000000000000001 R11: 0000000000000001 R12: 0000000000000003
R13: 0000000000000010 R14: 0000000000000002 R15: 0000000000000003
ORIG_RAX: ffffffffffffffff CS: 0010 SS: 0018
--- [MCE exception stack] ---
#6 [ffff8807f4621db8] intel_idle at ffffffff8141006c
#7 [ffff8807f4621df0] cpuidle_enter_state at ffffffff81602a8f
#8 [ffff8807f4621e50] cpuidle_idle_call at ffffffff81602be0
#9 [ffff8807f4621ea0] arch_cpu_idle at ffffffff8101e2ce
#10 [ffff8807f4621eb0] cpu_startup_entry at ffffffff810c1818
#11 [ffff8807f4621f20] start_secondary at ffffffff8104306b
crash]
Abnormal call stack information shows that a machine check error (MCE) exception occurs. This exception is typically caused by hardware issues.
2. Execute the crash-dmesg command to view information printed before the unexpected reboots:
[ 15.707981] 8021q: 802.1Q VLAN Support v1.8
[ 16.416569] drbd: initialized. Version: 8.4.3 (api:1/proto:86-101)
[ 16.416573] drbd: srcversion: F97798065516C94BE0F27DC
[ 16.416575] drbd: registered as block device major 147
[ 17.142281] Ebtables v2.0 registered
[ 17.203400] ip_tables: (C) 2000-2006 Netfilter Core Team
[ 17.247387] ip6_tables: (C) 2000-2006 Netfilter Core Team
[ 139.114172] Disabling lock debugging due to kernel taint
[ 139.114185] mce: [Hardware Error]: CPU 2: Machine Check Exception: 4 Bank 5: be00000000800400
[ 139.114192] mce: [Hardware Error]: TSC 10ba0482e78 ADDR 3fff81760d32 MISC 7fff
[ 139.114199] mce: [Hardware Error]: PROCESSOR 0:206c2 TIME 1415161519 SOCKET 0 APIC 14 microcode 13
[ 139.114203] mce: [Hardware Error]: Run the above through 'mcelog --ascii'
[ 139.114208] mce: [Hardware Error]: Machine check: Processor context corrupt
[ 139.114211] Kernel panic - not syncing: Fatal Machine check
crash]
It can be determined from preceding information that an error has occurred on CPU 2.
Memory error
A CVK node at a site reboots unexpectedly. No abnormal records are found in the syslogs before and after the reboot. Kdump records are generated at the reboots.
1. View call stack information from the Kdump records.
If information as follows is output, a hardware error might occur.
crash] bt
PID: 0 TASK: ffffffff81c144a0 CPU: 0 COMMAND: "swapper/0"
#0 [ffff880c0fa07c60] machine_kexec at ffffffff8104c991
#1 [ffff880c0fa07cd0] crash_kexec at ffffffff810e97e8
#2 [ffff880c0fa07da0] panic at ffffffff8174ac9d
#3 [ffff880c0fa07e20] asminline_call at ffffffffa014c895 [hpwdt]
#4 [ffff880c0fa07e40] nmi_handle at ffffffff817598da
#5 [ffff880c0fa07ec0] do_nmi at ffffffff81759b7d
#6 [ffff880c0fa07ef0] end_repeat_nmi at ffffffff81758cf1
[exception RIP: intel_idle+204]
RIP: ffffffff8141006c RSP: ffffffff81c01da8 RFLAGS: 00000046
RAX: 0000000000000010 RBX: 0000000000000010 RCX: 0000000000000046
RDX: ffffffff81c01da8 RSI: 0000000000000018 RDI: 0000000000000001
RBP: ffffffff8141006c R8: ffffffff8141006c R9: 0000000000000018
R10: ffffffff81c01da8 R11: 0000000000000046 R12: ffffffffffffffff
R13: 0000000000000000 R14: ffffffff81c01fd8 R15: 0000000000000000
ORIG_RAX: 0000000000000000 CS: 0010 SS: 0018
--- [NMI exception stack] ---
#7 [ffffffff81c01da8] intel_idle at ffffffff8141006c
#8 [ffffffff81c01de0] cpuidle_enter_state at ffffffff81602a8f
#9 [ffffffff81c01e40] cpuidle_idle_call at ffffffff81602be0
#10 [ffffffff81c01e90] arch_cpu_idle at ffffffff8101e2ce
#11 [ffffffff81c01ea0] cpu_startup_entry at ffffffff810c1818
#12 [ffffffff81c01f10] rest_init at ffffffff8173fc97
#13 [ffffffff81c01f20] start_kernel at ffffffff81d37f7b
#14 [ffffffff81c01f70] x86_64_start_reservations at ffffffff81d375f8
#15 [ffffffff81c01f80] x86_64_start_kernel at ffffffff81d3773e
crash]
2. Execute the dmesg command to view information before the anomaly.
crash]dmesg
…
[10753.155822] sd 3:0:0:1: [sdd] Very big device. Trying to use READ CAPACITY(16).
[10804.115376] sbridge: HANDLING MCE MEMORY ERROR
[10804.115386] CPU 23: Machine Check Exception: 0 Bank 9: cc1bc010000800c0
[10804.115387] TSC 0 ADDR 12422f7000 MISC 90868002800208c PROCESSOR 0:306e4 TIME 1417366012 SOCKET 1 APIC 2b
…
[10804.283467] sbridge: HANDLING MCE MEMORY ERROR
[10804.283473] CPU 9: Machine Check Exception: 0 Bank 9: cc003010000800c0
[10804.283475] TSC 0 ADDR 1242ef7000 MISC 90868000800208c PROCESSOR 0:306e4 TIME 1417366012 SOCKET 1 APIC 26
[10804.303482] EDAC MC1: 28416 CE memory scrubbing error on CPU_SrcID#1_Channel#0_DIMM#0 (channel:0 slot:0 page:0x12422f7 offset:0x0 grain:32 syndrome:0x0 - OVERFLOW area:DRAM err_code:0008:00c0 socket:1 channel_mask:1 rank:0)
[10804.303489] EDAC MC1: 192 CE memory scrubbing error on CPU_SrcID#1_Channel#0_DIMM#0 (channel:0 slot:0 page:0x12424a7 offset:0x0 grain:32
…
[10804.319474] sbridge: HANDLING MCE MEMORY ERROR
[10804.319481] CPU 6: Machine Check Exception: 0 Bank 9: cc001010000800c0
[10804.319482] TSC 0 ADDR 1243087000 MISC 90868002800208c PROCESSOR 0:306e4 TIME 1417366012 SOCKET 1 APIC 20
[10805.303772] EDAC MC1: 64 CE memory scrubbing error on CPU_SrcID#1_Channel#0_DIMM#0 (channel:0 slot:0 page:0x1243087 offset:0x0 grain:32 syndrome:0x0 - OVERFLOW area:DRAM err_code:0008:00c0 socket:1 channel_mask:1 rank:0)
[10813.602696] sd 3:0:0:0: [sdc] Very big device. Trying to use READ CAPACITY(16).
[10813.603219] sd 3:0:0:1: [sdd] Very big device. Trying to use READ CAPACITY(16).
[10840.833238] Kernel panic - not syncing: An NMI occurred, please see the Integrated Management Log for details.
crash]
3. View information in the kern.log file.
Nov 30 07:05:01 HBND-UIS-E-CVK09 kernel: [229821.496666] sd 11:0:0:1: [sdd] Very big device. Trying to use READ CAPACITY(16).
Nov 30 07:05:55 HBND-UIS-E-CVK09 kernel: [229875.188854] sbridge: HANDLING MCE MEMORY ERROR
Nov 30 07:05:55 HBND-UIS-E-CVK09 kernel: [229875.188873] CPU 23: Machine Check Exception: 0 Bank 9: cc1e0010000800c0
Nov 30 07:05:55 HBND-UIS-E-CVK09 kernel: [229875.188874] TSC 0 ADDR 10638f7000 MISC 90868002800208c PROCESSOR 0:306e4 TIME 1417302355 SOCKET 1 APIC 2b
…
Nov 30 07:05:55 HBND-UIS-E-CVK09 kernel: [229875.244902] EDAC MC1: 30720 CE memory scrubbing error on CPU_SrcID#1_Channel#0_DIMM#0 (channel:0 slot:0 page:0x10638f7 offset:0x0 grain:32 syndrome:0x0 - OVERFLOW area:DRAM err_code:0008:00c0 socket:1 channel_mask:1 rank:0)
…
root@gzh-139:/vms/issue_logs/hebeinongda/20141201/HBND-UIS-E-CVK09/logdir/var/log# grep OVERFLOW kern* | wc
225 6341 60264
root@gzh-139:/vms/issue_logs/hebeinongda/20141201/HBND-UIS-E-CVK09/logdir/var/log#
It can be determined from preceding information that the issue is caused by a memory error. The issue is resolved after the memory is replaced.
Storage cluster logs
/var/log/ceph/ceph.log
The ceph.log file mainly records the health status and traffic of the cluster. It is available only on monitor nodes and has the same content as that output from the ceph –w command.
· If logs as follows are in the ceph.log file, the service network of the primary monitor node of the cluster has been disconnected.
2017-05-09 19:44:03.400143 mon.2 172.16.105.84:6789/0 2009 : cluster [INF] mon.cvknode84 calling new monitor election
2017-05-09 19:44:03.404362 mon.1 172.16.105.83:6789/0 2023 : cluster [INF] mon.cvknode83 calling new monitor election
2017-05-09 19:44:05.419510 mon.1 172.16.105.83:6789/0 2024 : cluster [INF] mon.cvknode83@1 won leader election with quorum 1,2
2017-05-09 19:44:05.428131 mon.1 172.16.105.83:6789/0 2025 : cluster [INF] HEALTH_WARN; 1 mons down, quorum 1,2 cvknode83,cvknode84
2017-05-09 19:44:14.383590 mon.1 172.16.105.83:6789/0 2057 : cluster [INF] osdmap e1397: 18 osds: 12 up, 18 in
· If logs as follows are in the ceph.log file, the health of the cluster is not 100%, and the cluster is in the process of recovery.
2017-06-06 19:31:41.319993 mon.0 192.168.93.21:6789/0 86387 : cluster [INF] pgmap v73931: 4096 pgs: 2561 active+clean, 1532 active+remapped+wait_backfill, 3 active+remapped+backfilling; 3362 GB data, 6730 GB used, 21941 GB / 28672 GB avail; 0 B/s rd, 127 kB/s wr, 256 op/s rd, 63 op/s wr; 5/2608637 objects degraded (0.000%); 1765938/2608637 objects misplaced (67.696%); 62992 kB/s, 15 objects/s recovering
· If logs as follows are in the ceph.log file, the storage network of a non-Handy or non-primary monitor node in the cluster has been disconnected.
2017-05-12 16:05:14.585496 mon.0 172.31.1.31:6789/0 106035 : cluster [INF] osd.31 marked itself down
2017-05-12 16:05:15.095824 mon.0 172.31.1.31:6789/0 106038 : cluster [INF] osd.33 marked itself down
2017-05-12 16:05:15.195542 mon.0 172.31.1.31:6789/0 106040 : cluster [INF] osdmap e286: 36 osds: 25 up, 36 in
2017-05-12 16:05:15.287350 mon.0 172.31.1.31:6789/0 106042 : cluster [INF] osd.27 marked itself down
2017-05-12 16:05:16.186527 mon.0 172.31.1.31:6789/0 106043 : cluster [INF] osdmap e287: 36 osds: 24 up, 36 in
/var/log/ceph/ceph-osd.*.log
The ceph-osd.*.log file mainly records information about an OSD in the cluster. If an error occurs on a cluster OSD, the error reasons will be recorded in the ceph-osd.*.log file for that OSD, which can be used for troubleshooting.
The following is an example about how to troubleshoot by using a ceph-osd.*.log file when an OSD is abnormal (the UI reports an OSD error):
1. Use the ceph osd tree command in the CLI to identify the identifier of the abnormal OSD.
2. Access the /var/log/ceph/ceph-osd.*.log file for the OSD and identify the reason for the OSD exception.
¡ If a log as follows is in the ceph-osd log file, the storage controller is damaged, causing the journal to be interrupted.
2017-04-25 14:34:08.807146 7f5bf690a780 -1 journal Unable to read past sequence 301115833 but header indicates the journal has committed up through 301115842, journal is corrupt
¡ If logs as follows are in the ceph-osd log file, the OSD has committed suicide because of is excessive pressure.
2017-03-09 11:46:01.576034 7f0878364700 1 heartbeat_map is_healthy 'FileStore::op_tp thread 0x7f086fa6c700' had suicide timed out after 180
2017-03-09 11:46:01.576049 common/HeartbeatMap.cc: 81: FAILED assert(0 == "hit suicide timeout")
¡ If a log as follows is in the ceph-osd log file, the OSD has not been mounted.
2017-04-27 19:46:18.280510 7fcfb954c700 5 filestore(/var/lib/ceph/osd/ceph-85) umount /var/lib/ceph/osd/ceph-85
¡ If logs as follows are in the ceph-osd log file, the data copies are inconsistent.
2016-10-22 06:49:23.854201 7fd2e860f700- 1 log_channel(cluster)log [ERR]:1.ad shard 1:soid 819850ad/rbd_date.3b7055757a07.0000000000000ab1/7//1 date_digest 0xd7ac1812 != best guess date_digest 0x43d61c5d from auth shard 0
2016-10-22 06:49:23.854253 osd/osd_types.cc:4148:FAILED assert(clone_size.count(clone))
/var/log/ceph/ceph-disk.log
The ceph-disk.log file mainly records information about OSD deployment and startup and is typically used in conjunction with the ceph-osd.*.log file to locate OSD related issues.
· If logs as follows are in the ceph-disk log file, the system stops OSD mounting and exits the OSD mounting process because files exist in the /var/lib/ceph/osd/ceph-* directory. This issue typically occurs at the restart of the host. When the host restarts, all OSDs must be reactivated and mounted and the mounting process will check whether other files than the heartbeat, osd_disk_info.ini, and osd_should_be_restart_flag files exist in the OSD directory. If other files exist in the directory, the OSD mounting process stops.
ceph-disk: Error: another ceph osd.71 already mounted in position(old/different cluster instance?);unmounting ours.
· If logs as follows are in the ceph-disk log file, the OSD has not been activated and cannot be mounted.
Fri. 07 Apr 2017 10:24:48 ceph-disk[line:2438] ERROR Failed to activate
Fri. 07 Apr 2017 10:24:48 ceph-disk[line:976] DEBUG Unmounting /var/lib/ceph/tmp/mnt.hD_6nh
/var/log/ceph/ceph-mon.*.log
The ceph-mon.*.log file mainly records information of a monitor node in the Ceph cluster. Monitor nodes are responsible for monitoring the cluster. If an error occurs on a monitor node, the error reason will be recorded in the ceph-mon.*.log file for that node, which can be used for troubleshooting.
To troubleshoot for a monitor node exception (the UI reports a monitor node anomaly):
1. Check the hostname of the abnormal monitor node on the host management page.
2. Access the /var/log/ceph/ceph-mon.*.log file for the host to check for the cause of the monitor node exception. If the following logs are found in the ceph-mon log file, the primary monitor node is abnormal (possible reason is an exception occurs on the service network of the primary monitor node or the ceph-mon process on the primary master node is stopped), and the backup monitor nodes trigger the election mechanism.
2017-05-08 19:24:58.017935 7fb173765700 1 mon.cvknode84@2(peon).paxos(paxos active c 24348..24883) lease_timeout -- calling new election
2017-05-08 19:24:58.024456 7fb172f64700 0 log_channel(cluster) log [INF] : mon.cvknode84 calling new monitor election
/var/log/calamari/calamari.log
The calamari.log file mainly records the operations on Handy.
If logs as follows are in the calamari.log file, the Handy node does not have network connectivity with the other nodes.
2017-05-08 15:08:29,060 - ERROR - onestor_common.py[network_check][line:494] - django.request <network_check> Host "172.16.105.84" is unreachable, retry again...
2017-05-08 15:08:29,060 - ERROR - onestor_common.py[execute][line:622] - django.request [ONEStor] onestor_request_all_node cvknode84:Host is unreachable
/var/log/onestor_cli/ onestor_cli.log
The onestor_cli.log file records information about the process of collecting real-time logs on a node. It can be used to diagnose and troubleshoot any issues related to log collection.
· If a log as follows is in the onestor_cli.log file, the size of the collected logs has exceeded 5 GB.
[2017-05-10 10:47:01,980][WARNING][monitor.py][line:157] We detect the current collecting log size is up to 5GB, ending collecting automatically!
· If the onestor_cli.log file disappears from a node, the log disk space on the node might be full.
Bimodal HCI logs
Bimodal HCI provides VMware VM lifecycle management and VMware VM agentless migration features.
1. The vmware-api-server service on the CVM host provides VMware VM lifecycle management. It stores related logs in the /var/log/vmware-api-server directory. If an exception occurs when you operate VMware VMs on the UIS, a log is generated in that directory to record the causes for the exception, which can be used for issue diagnosis.
For example, if a log as follows is generated, you can determine that the reason for failure to generate a snapshot is that the snapshot directory is too deep (which is limited by VMware):
[Vmware VM Request Processor Manager1] Trace[] UID[] c.h.h.u.s.v.handler.VmwareHandler – vmware vm “hdm2-snapshot” to generate a snapshot fail, cause:Snapshot hierarchy is too deep.
2. The vmware-agent service on the CVK host is responsible for migrating data from VMware. It stores related logs in the /var/log/vmware-agent directory. If a migration task fails or is interrupted unexpectedly on the UIS, you can view the logs in that directory.
¡ vmware-agent.log—Migration process logs. When an exception occurs during the migration process, the vmware-agent.log file will record the causes for the exception, which can be used for future issue diagnosis.
If a log as follows is output, a known VMware issue https://kb.vmware.com/s/article/2035976 has been triggered
2022-01-19 16:03:06 [ERROR] service.go:149 migrate failed, vcenter key: 172.20.67.6:443 vmref: vm-64 task 1955534340610146293 reason: {"code": 12002, "message": "Get QueryChangedDiskAreas failed. ", "error": "ServerFaultCode: Error caused by file /vmfs/volumes/61dd4ded-84b7a178-07ce-98f181b81b1c/ubuntu18041desktop/ubuntu18041desktop.vmdk"}
¡ vmware_vddk.log—VDDK operation logs. These logs record the operations related to connecting to vSphere and can assist in locating data transmission interruption during migration.
3. If an error of failed driver injection is reported on the UI during the VM migration process, you can check the relevant error logs to preliminarily locate the cause of the failure. The relevant error logs are saved in the /var/log/caslog/cas_xc_virtio_driver.log file.
4. If the VM still reports that castools is not running on the UI a period of time after the injection is completed, remount the ISO and install castools again.
5. If no errors are reported on the UI after the VM is migrated but you cannot access the desktop after the VM is powered on, a VM driver injection compatibility issue might exist. If this VM is in the compatible migrated VM list, contact Technical Support to locate the issue on site.
Distributed storage maintenance
Cluster issues
Rebalancing data placement when data imbalance occurs
ONEStor uses the CRUSH algorithm to automatically balance data across the object-based storage daemons (OSDs) in the cluster. Each OSD maps to a disk.
To rebalance data when occasional data imbalance occurs:
1. Execute the ceph osd df command and then identify the disk utilization of each OSD in the %USE field.
Figure 6 Identifying the disk utilization of each OSD
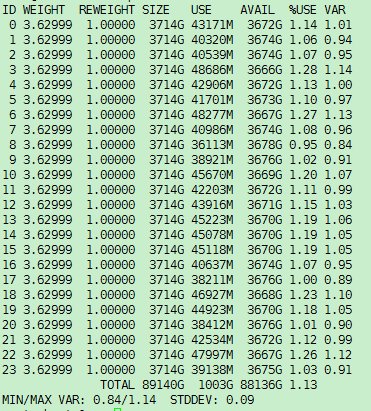
2. If the disk utilization of some OSDs is unusually higher than other OSDs, execute the ceph osd reweight-by-utilization command to rebalance data.
| IMPORTANT: Data rebalancing is read and write intensive and might cause cluster performance to degrade. To minimize its impact on storage services, perform this operation at off-peak hours. |
3. Verify that the system has finished the rebalancing operation successfully.
Execute the ceph -s command to monitor the cluster health state. When the cluster state changes to HEALTH_OK, you can determine that the system has finished the rebalancing operation.
Method to accelerate data rebalancing when the cluster is in an idle state
When the cluster is in an idle state, you can accelerate data rebalancing, as follows:
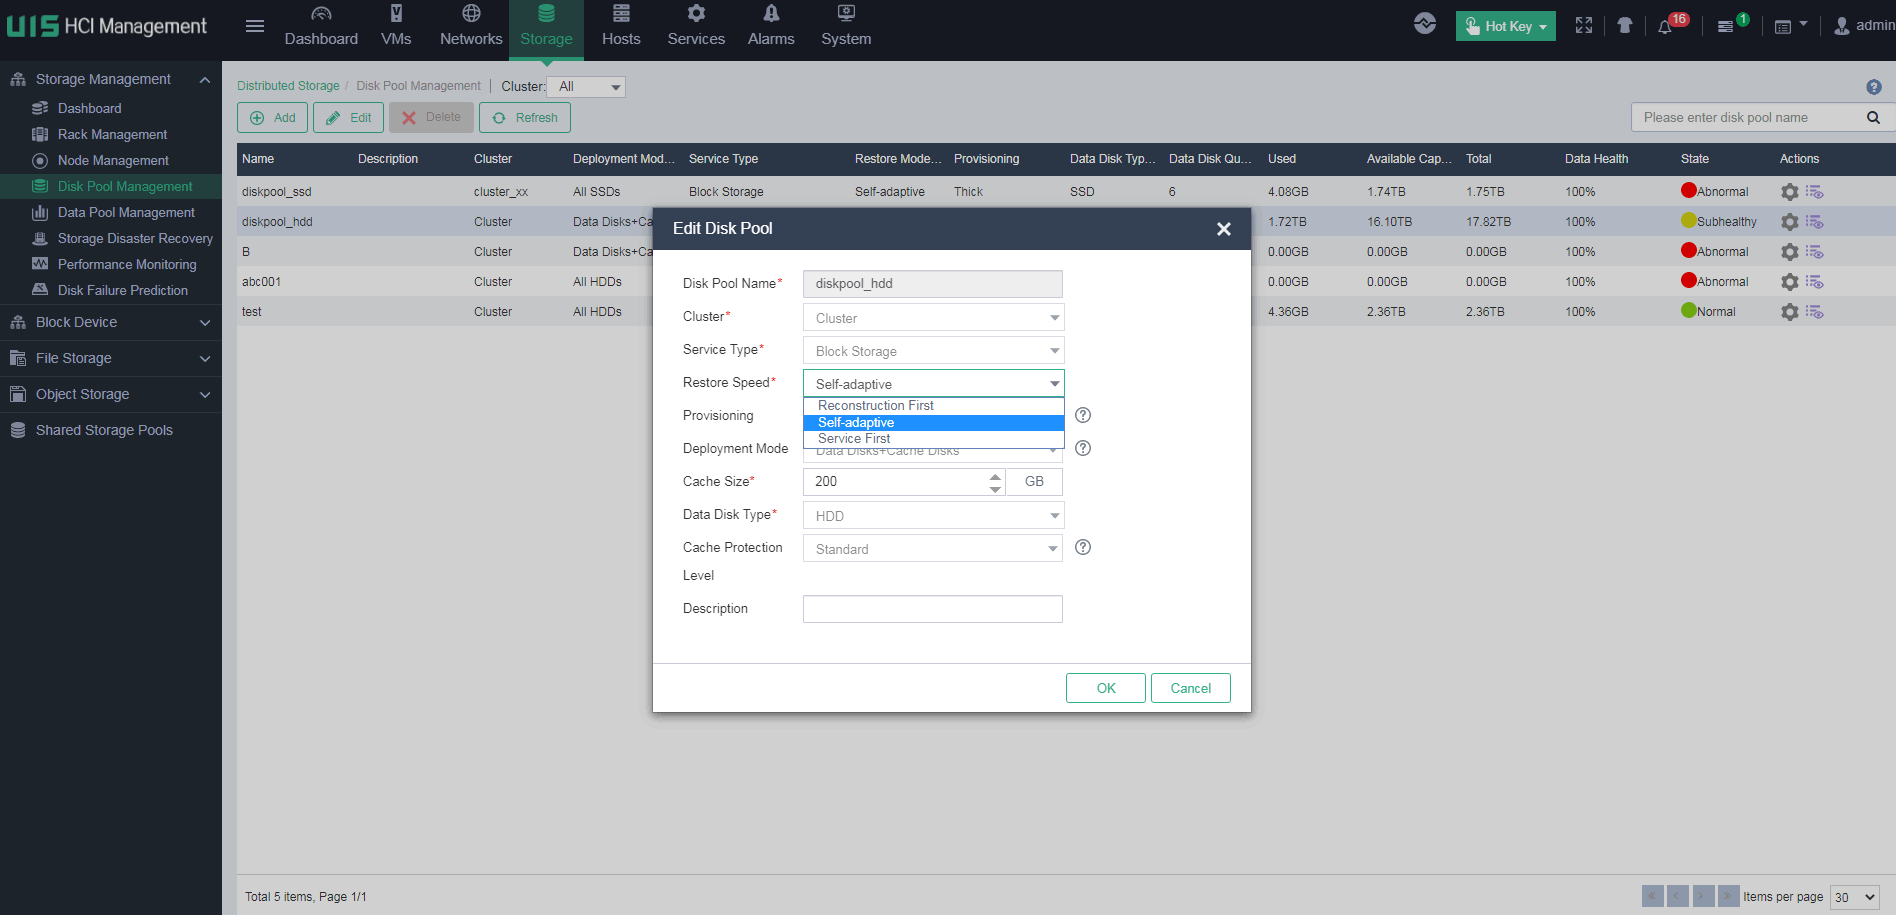
1. Log in to UIS Manager.
2. On the top navigation bar, click Storage, and then select Disk Pool Management from the left navigation pane.
3. Select the disk pool on which data rebalancing is to be performed, and then click Edit.
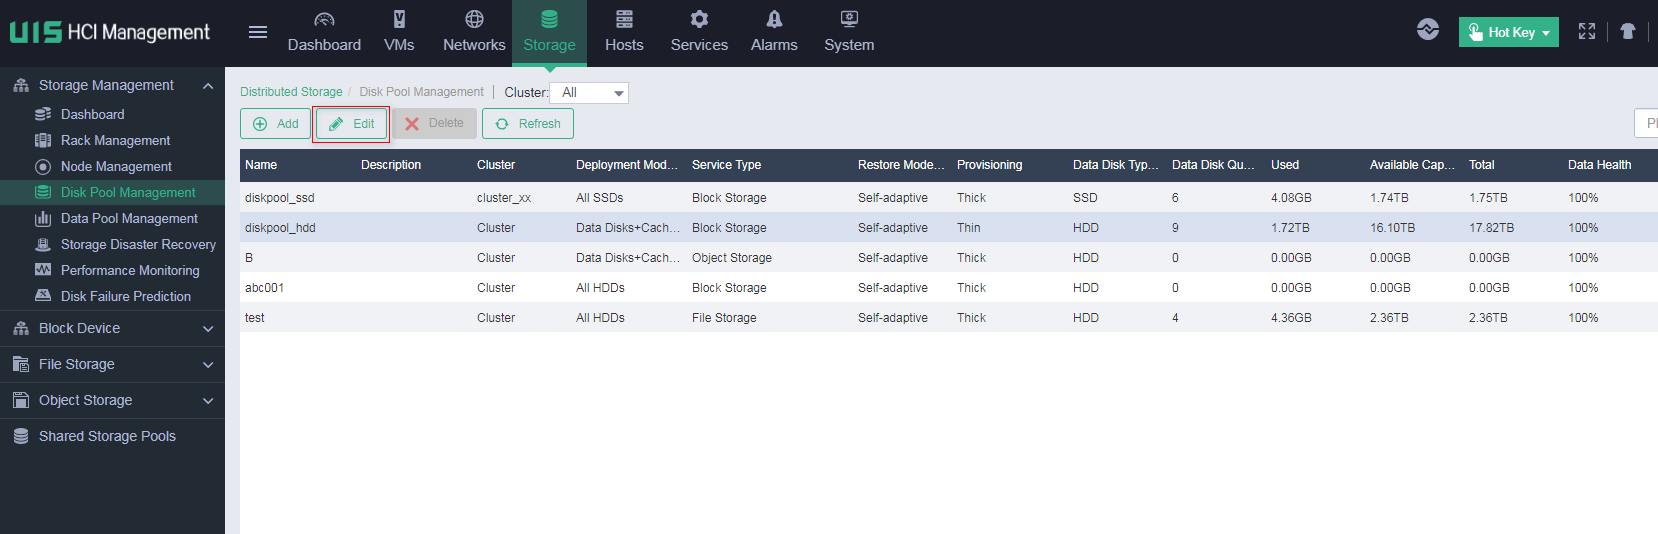
4. In the dialog box that opens, change the restore speed from self-adaptive to reconstruction first.
Node issues
Resolving host issues caused by a full system disk
A host might malfunction when the usage of its system disk reaches 100%. For example, Apache processes and the ceph-mon daemon might fail to start, resulting in issues such as the mon down error and inability to log in to the management node.
System disk might get full for the following reasons:
· Too many large files and log files are present.
· The fio tester stores a large test0.0 file on the system disk. This issue occurs if you run fio without specifying the --filename option.
To free up disk space:
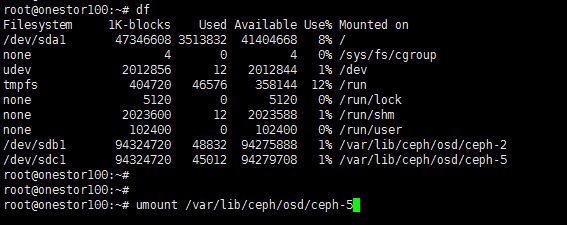
1. Execute the df –h command on the host to identify its system disk usage. The following is sample output:
root@cvknode86:~# df -h
Filesystem Size Used Avail Use% Mounted on
/dev/sda1 28G 4.0G 23G 16% /
If the Use field displays that the disk usage has reached 100%, proceed to remove unused files.
2. Remove unused large files or log files:
a. Access the /var/log directory and other directories that might contain large files or unused files.
b. Execute the du –h --max-depth=1 command to view the size of each folder in the directory.
c. Delete unused files.
3. Remove the test data file generated by fio:
a. Execute the echo ""> filename command.
b. Execute the rm –rf filename command to delete the test data file.
Issues caused by network failure
Handling failures to add or delete hosts
You will fail to add or delete a host or disks on the host if network failure occurs before the system finishes the operation. The system will then display a failure message indicating that the system failed to delete a host because of management network failure.
The solution to these issues differs depending on the timing of the network failure.
Network failure occurs before the system starts deleting disks
If network failure occurs before the system starts deleting disks, you only need to select the target host from the webpage and perform the operation again after the system regains network connectivity to the host.
If the connectivity to the host cannot be restored in extreme cases, for example, because the host's operating system is damaged, select the host from the webpage to delete it offline. However, data on the host's disks will remain. You must take action to handle residual data.
Network failure occurs before the system deleting all disks
See "Network failure occurs before the system starts deleting disks."
Network failure occurs during disk formatting after all the disks are deleted from the cluster
The host will be invisible on the management webpages after the system deletes all its disks from the cluster and proceeds to disk formatting. If network failure occurs before the system finishes formatting all the disks, the data and Ceph partitions on the unformatted disks will remain. After the host restarts, the unformatted disks will be automatically mounted to the operating system. UIS Manager will be unable to discover these disks when the host is re-added to the cluster.
To resolve these issues, execute the umount command to manually unmount the residual disks before you add the host back to the cluster.
Deleting a monitor node offline and restoring the node
You delete a monitor node offline from the cluster on the webpage only if the network connectivity to its host cannot be restored. This operation directly removes the node from the cluster.
To minimize the impact of the operation on the cluster:
1. Remove all roles of the host in the cluster.
2. Destroy the cluster data on the host.
| CAUTION: Destroying the cluster data on a host will result in loss of all cluster data on that host. Be sure that the node is no longer in use when you perform the operation. |
These operations ensure that you can add the host back to the cluster as a storage, monitor, or backup management node for management high availability.
Deleting a storage node offline and restoring the node
You delete a storage node offline from the cluster on the webpage only if the network connectivity to its host cannot be restored. This operation directly removes the node from the cluster.
Before you delete a storage node offline, verify the following items:
1. No abnormal placement groups (PGs) are present for the disk pool that contains the storage node.
| CAUTION: If abnormal PGs are present, data rebalancing might be in progress. To avoid loss of data, do not delete the node at this time. |
2. Verify that the disk pool is in healthy state.
Then, you can safely delete the node.
To minimize the impact of the operation on the cluster:
3. Remove all roles of the host in the cluster.
4. Destroy the cluster data on the host.
| CAUTION: Destroying the cluster data on a host will result in loss of all cluster data on that host. Be sure that the node is no longer in use when you perform the operation. |
These operations ensure that you can add the host back to the cluster as a storage, monitor, or backup management node for management high availability.
Disk issues
Missing or changing sdX device names due to host restart
When you remove a disk, the state of its corresponding logical drive on the RAID controller changes from OK to Failed. Normally, the sdX drive letters will stay unchanged after you re-insert or replace the disk and restore its logical drive back to the OK state. However, if the host restarts while the logical drive is in FAIL state, the disk will not be visible in the operating system. If you execute the lsblk or fdisk command to view disks on the host, you will notice that the disk is missing.
For example, the lsblk command displays that the host has disks sda, sdb, sdc, sdd, and sde when it is executed before a disk removal operation. ONEStor shows that the sdd disk is abnormal. The output from the hpssacli controller all show config command shows that the logical drive for sdd is in Failed state, as shown in the following figures:
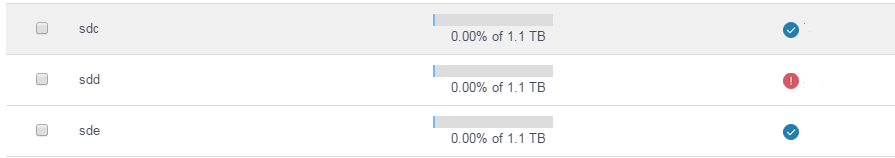
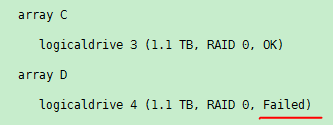
If the host accidentally restarts before the logical drive for sdd restores the OK state, the sdd disk will become invisible in the system. The drive letter of each subsequent disk will shift backward by one letter. In this example, the device name of the disk originally identified by sde will change to sdd. Even if the logical drive restores the OK state, the lost disk will still not be visible.
To resolve this issue:
1. Delete the logical drive that was originally in Failed state, regardless of whether its current state is Failed or OK:
hpssacli ctrl slot=0 logicaldrive 4 delete forced
2. Execute the hpssacli controller all show config command to identify the unassigned physical drive displayed in the end.
![]()
3. Recreate the logical drive.
hpssacli ctrl slot=0 create type=ld drives=2I:2:3 raid=0
4. Execute the lsblk command to verify that the new disk has been added to the end of the storage device list. In this example, the disk is named sde.
5. Remount the /dev/sde1 disk partition at the original OSD directory.
mount /dev/sde1 /var/lib/ceph/osd/ceph-4
6. If the ONEStor management system still shows that sde is abnormal, delete it and then add it again. The disk will be available for use.
Identifying the data partitions and journal partitions (for write caching) to which the OSDs are mounted
The following sample output shows that OSDs have been mounted:

The following sample output shows that no OSDs have been mounted:

You must identify the mapping between an OSD and its disk based on the partition UUID (partuuid) in the following situations:
· Remount the OSD if it was unmounted because of a disk issue.
· Identify the journal partition for an OSD for write caching.
To identify the partuuid of the data partition for an OSD, view the content of the fsid file in the OSD directory for that OSD, for example:
cat /var/lib/ceph/osd/ceph-8/fsid
d6d97f59-171e-46f7-9759-8037c7209bf1
To identify the partuuid of the journal partition for an OSD, view the content of the journal_uuid file in the OSD directory for that OSD.
cat /var/lib/ceph/osd/ceph-8/journal_uuid
1f8b0b99-69c6-404a-acfe-186f435fd877
To identify the partuuid values of all partitions on the host, execute the following command:
ll /dev/disk/by-partuuid/
lrwxrwxrwx 1 root root 10 Dec 6 19:55 1f8b0b99-69c6-404a-acfe-186f435fd877 -> ../../sdf1
lrwxrwxrwx 1 root root 10 Dec 6 19:55 260c435a-2c35-4562-979d-7a3d641dda48 -> ../../sdf2
The sample output shows the partuuid values of SSD write caches sdf1 and sdf2.
OSD for a disk cannot be deleted upon a disk replacement prior to deletion of its OSD from UIS Manager
If you replace a faulty disk prior to deleting its OSD from UIS Manager, Handy adds a new disk and OSD mapping for the replacement disk. When you attempt to delete the original OSD, you will receive a no data found message and the deletion attempt will fail.
To resolve this issue:
1. Execute the lsblk command to verify that no disk has been mounted at the old OSD node. If a disk is still mounted at that OSD node, unmount it first.
Mount status:
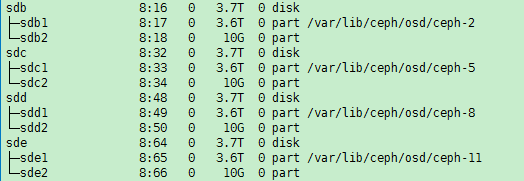
Unmount status:

2. Execute the ps -ef | grep osd command to check whether the old OSD daemon has stopped.
3. Execute the following commands to stop the OSD daemon. Replace x in these command lines with the OSD daemon ID.
| CAUTION: These commands will erase user data. Make sure you fully understand its impact on services when you use them. If you are not sure of their impact, contact H3C Support. |
stop ceph-osd id=x
ceph osd out osd.x
ceph osd crush remove osd.x
ceph auth del osd.x
ceph osd rm osd.x
4. Execute the cephosd tree command to verify that the OSD has been removed from the cluster.
5. Log in to UIS Manager to verify that the failed disk has been deleted.
Replacing disks
For information about disk replacement, see H3C UIS Hyper-Converged Infrastructure Component Replacement Configuration Guide.
Failure to display O&M and monitoring data
Failure to display O&M and monitoring data (1)
Symptom
· When you obtain the O&M and monitoring data, the page shows that the data failed to be obtained.
· When you obtain the log information of the Prometheus database, the opening storage failed error message is generated.
In addition, identify whether the Prometheus-cluster-stderr---xxxxx.log file has anomalies.
Solution
To resolve this issue:
1. Delete exceptional WAL files.
a. Access the /opt/h3c/var/lib/prometheus_node/data/wal directory and identify whether the file numbers are sequential. The following figure shows two continuous sequences: 000001, 000002, 000003, and 000006, 000007.
![]()
b. Delete the sequence with the smaller numbers. If the Prometheus-cluster-stderr---xxx.log file also has anomalies, perform the same steps in the /opt/h3c/var/lib/prometheus_cluster/data/wal directory.
![]()
2. Reboot prometheus processes.
¡ If the prometheus-node-stderr---xxxx.log file has anomalies, reboot the prometheus-node process:
# supervisorctl restart Prometheus-node
![]()
¡ If the prometheus-cluster-stderr---xxxx.log file has anomalies, reboot the prometheus-cluster process:
# supervisorctl restart Prometheus-cluster
![]()
Failure to display O&M and monitoring data (2)
Symptom
· When you obtain the O&M and monitoring data, the page shows that the data failed to be obtained or no monitoring report data is available.
· When you view information about Prometheus related processes, the prometheus-node or prometheus-cluster process is repeatedly rebooted:
# supervisorctl status prometheus-node
# supervisorctl status prometheus-cluster
· When you obtain the log information of the Prometheus database, the opening storage failed: invalid block sequence: block time ranges overlap error message is generated. For example:
level=error ts=2023-10-26T19:42:10.042Z caller=main.go:731 err="opening storage failed: invalid block sequence: block time ranges overlap:
In addition, identify whether the Prometheus-cluster-stderr---xxxxx.log file has anomalies.
Solution
To resolve this issue:
1. Delete the data in the data directory.
¡ For the prometheus-node process that is running on all nodes in the cluster:
# mkdir prometheus_node_bak
# cp -rf /opt/h3c/var/lib/prometheus_node/data/* prometheus_node_bak
# rm –rf /opt/h3c/var/lib/prometheus_node/data/*
¡ For the prometheus-cluster process that runs only on the primary and backup Handy nodes:
# mkdir prometheus_cluster_bak
# cp -rf /opt/h3c/var/lib/prometheus_cluster/data/* prometheus_cluster_bak
# rm –rf /opt/h3c/var/lib/prometheus_cluster/data/*
| CAUTION: This step will also delete historical monitoring data, back up data as needed before performing this step. |
2. Reboot prometheus processes.
¡ If the prometheus-node-stderr---xxxx.log file has anomalies, reboot the prometheus-node process:
# supervisorctl restart prometheus-node
![]()
¡ If the prometheus-cluster-stderr---xxxx.log file has anomalies, reboot the prometheus-cluster process:
# supervisorctl restart prometheus-cluster
![]()
Troubleshooting
Cluster initialization issues
Host scan failure
Symptom
A host cannot be discovered during cluster setup.
Solution
To resolve this issue:
· Check the network configuration as follows:
a. Verify that the management interface of the target host is in the same LAN as the management interface of the management node.
b. Verify that link aggregation is correctly configured on the switch interfaces connected to the management interface of the target host.
- If static link aggregation is configured, shut down one of the switch interfaces. After host scan is finished, bring up that interface.
- If dynamic link aggregation is configured, configure the host-facing aggregate interface as an edge aggregate interface by using the lacp edge-port command.
· Check for cluster initialization failure as follows:
c. Log in to each CVK host.
d. Access the /etc/cvk path and delete the cvm_info file (if it exists) by using the following command.
rm –rf cvm_info
e. Access the /root/.ssh path and delete the mhost file (if it exists) by using the following command.
rm –rf mhost
· Log in to the target host, access the /root/.ssh path, and delete the isCvmFlag file by using the following command. This file indicates that the host has acted as a management host.
rm –rf isCvmFlag
Compute cluster creation failure
Symptom
Creation of a compute cluster fails.
Solution
To resolve this issue, verify that each host can reach the management, storage front-end, and storage back-end networks.
Storage configuration failure
Symptom
Storage configuration fails.
Solution
To resolve this issue:
1. If UIS fails to discover all disks or a designated disk, perform the following tasks:
a. Log in to the affected host and execute the parted /dev/sdDrive letter rm partition number command to delete all partitions from an undiscovered disk.
b. Verify that the RAID controllers are included in the H3C CAS&UIS Server Virtualization Software and Hardware Compatibility Matrix.
2. If the distributed storage service is incorrectly installed on the management node, perform the following tasks:
a. Run the /opt/bin/uis_onestor_handy_install.sh script to reinstall ONEStor.
b. If an error is reported, contact Technical Support.
3. If device management is not supported by a server or RAID controller, perform the following tasks:
a. Modify configuration on the hardy node:
- For software versions earlier than UIS 0716, execute the sed –i ‘s/\$result/false/g’ /opt/h3c/sbin/check_raid_support command to modify the check_raid_support script. Then, execute the check_raid_support command and verify that false is output.
- For software versions later than UIS 0716, access the /opt/h3c/sbin/devmgr_check_dev_type script, and then add the return False string to the def check_raid_card() function.

b. Execute the devmgr_check_dev_type command and verify that the value of for_DM_ONEstor is False.
![]()
Cluster state
Health index lower than 100%
Symptom
The health index for a cluster is lower than 100%.
Solution
To resolve this issue:
1. Troubleshoot node failure or network disconnection issues as follows:
a. Log in to UIS, resolve alarms, and verify that the status of hosts is normal.
b. Log in to the command line of the management node, and verify connectivity to the hosts in the cluster by using ping operations.
2. Troubleshoot disk failure or RAID controller failure as follows:
a. Log in to UIS, and resolve the alarms generated for disk failure or RAID controller failure.
b. Log in to HDM, and resolve hardware alarms.
3. Verify that storage nodes are under maintenance or data balancing is in process as follows:
a. Log in to UIS, and verify that storage nodes are under maintenance and data balancing is enabled.
b. Log in to the command line of the management node, and verify that data balancing is in progress.
Host deletion
Deletion failure prompt for successful host deletion
Symptom
The system displays a deletion failure prompt when a host is deleted successfully.
Solution
To resolve this issue:
1. Execute the lsblk command on the deleted host and check for unmounted OSDs.
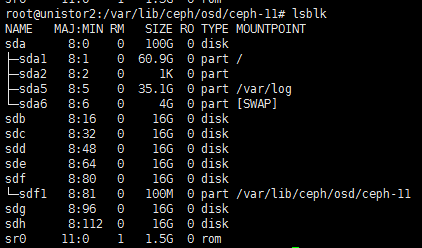
2. Verify that the directory of an OSD's directory is opened.
![]()
3. Execute the cd command to exit the OSD's directory, and then execute the umount /var/lib/ceph/osd/ceph-11 command.
4. Execute the sgdisk –zap-all /dev/sdf command to format partitions.
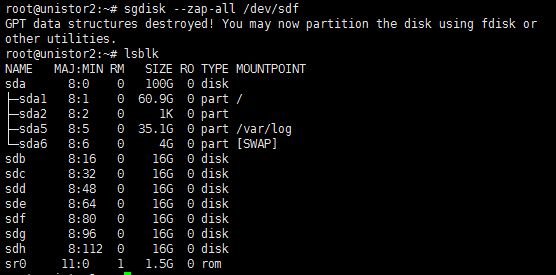
Disk issues
No available disk
Symptom
No disks are available
Solution
To resolve this issue:
1. Verify that the OSDs on the affected host have been used by the Ceph cluster:
a. Execute the lsblk command to view partitions on the target disk.
b. Execute the gdisk -l /dev/drive letter command to check for the ceph tag.
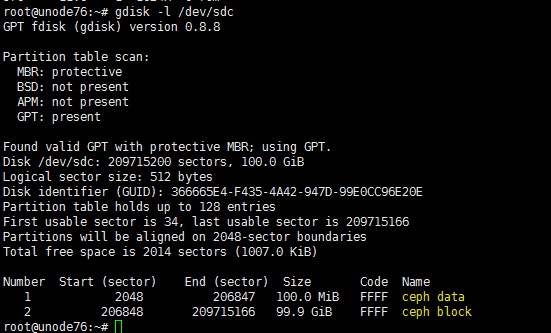
2. If the target disk is not in use, execute the ceph-disk zap /dev/drive letter command to clear residual data on the disk, and then add the disk again.
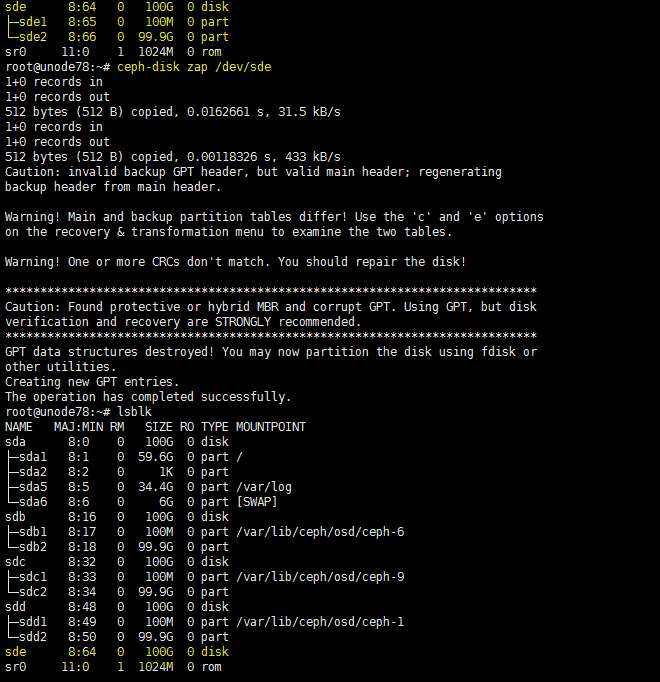
3. Clear partitions from the Web interface if you are using the most recent UIS version.
4. If UIS still cannot discover the disk, execute the ceph-disk zap /dev/drive letter command again.
5. Verify that the state of device management is consistent across the cluster nodes. For example, if the handy node does not support device management, a target node for expansion also does not support device management. To disable device management on the hardy node:
¡ For software versions earlier than UIS 0716, execute the sed –i ‘s/\$result/false/g’ /opt/h3c/sbin/check_raid_support command to modify the check_raid_support script. Then, execute the check_raid_support command and verify that false is output.
¡ For software versions later than UIS 0716, access the /opt/h3c/sbin/devmgr_check_dev_type script, and then add the return False string to the def check_raid_card() function.
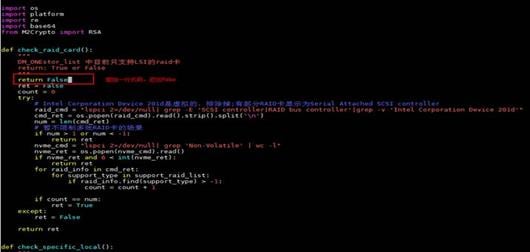
6. Execute the devmgr_check_dev_type command and verify that the value of for_DM_ONEstor is False.
![]()
Cluster alarms
Down monitor node
Symptom
A monitor node is down.
Solution
To resolve this issue:
1. On the top navigation bar, click Storage, and then select Storage Management > Node Management > Monitor Nodes from the left navigation pane.
2. If the down monitor node is powered off or shut down, start it up. Then, verify network connectivity between the cluster and the monitor node.
Figure 7 Verifying the monitor node state
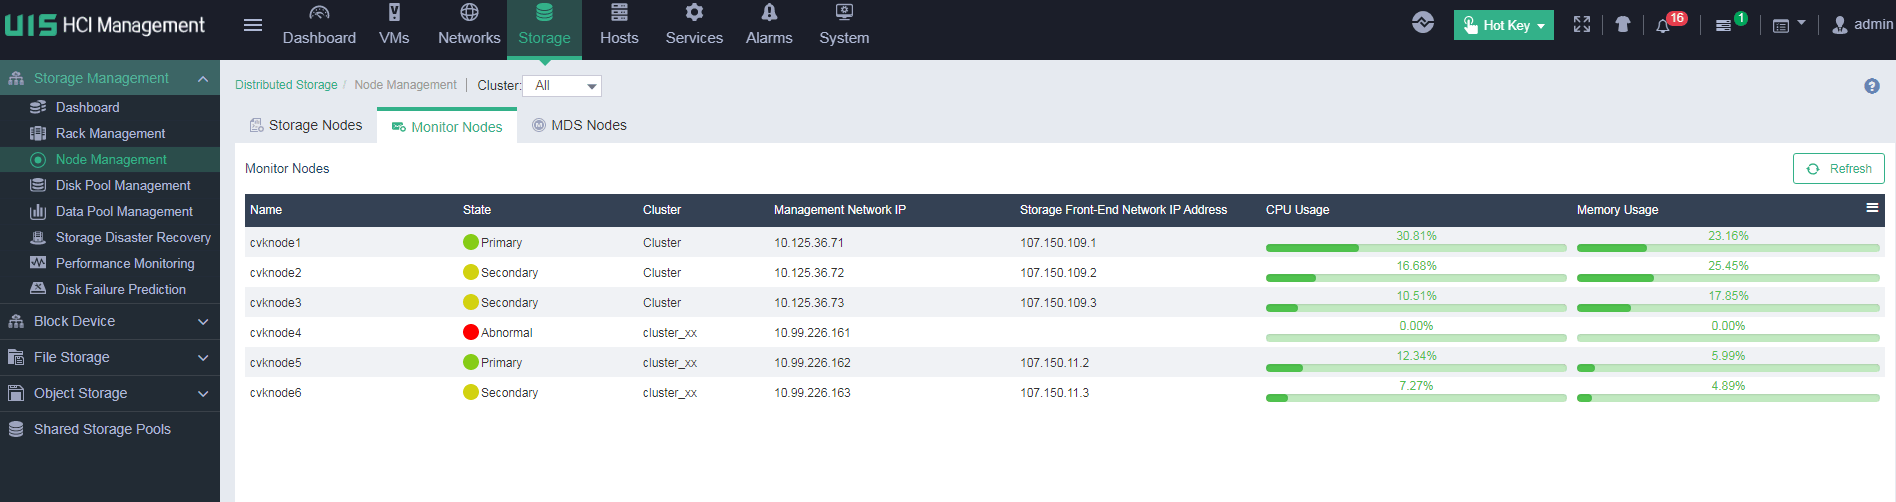
Down OSD
Symptom
An OSD is down.
Solution
To resolve this issue:
1. Verify that the storage node where the down OSD resides is not powered off or shut down and it does not have network connectivity issues.
a. On the top navigation bar, click Storage, and then select Storage Management > Node Management > Storage Nodes from the left navigation pane.
b. If the storage node where a down OSD resides is powered off or shut down (no data is displayed for the storage node), start the storage node up. Then, verify network connectivity between the cluster and the storage node.
Figure 8 Verifying the storage node state
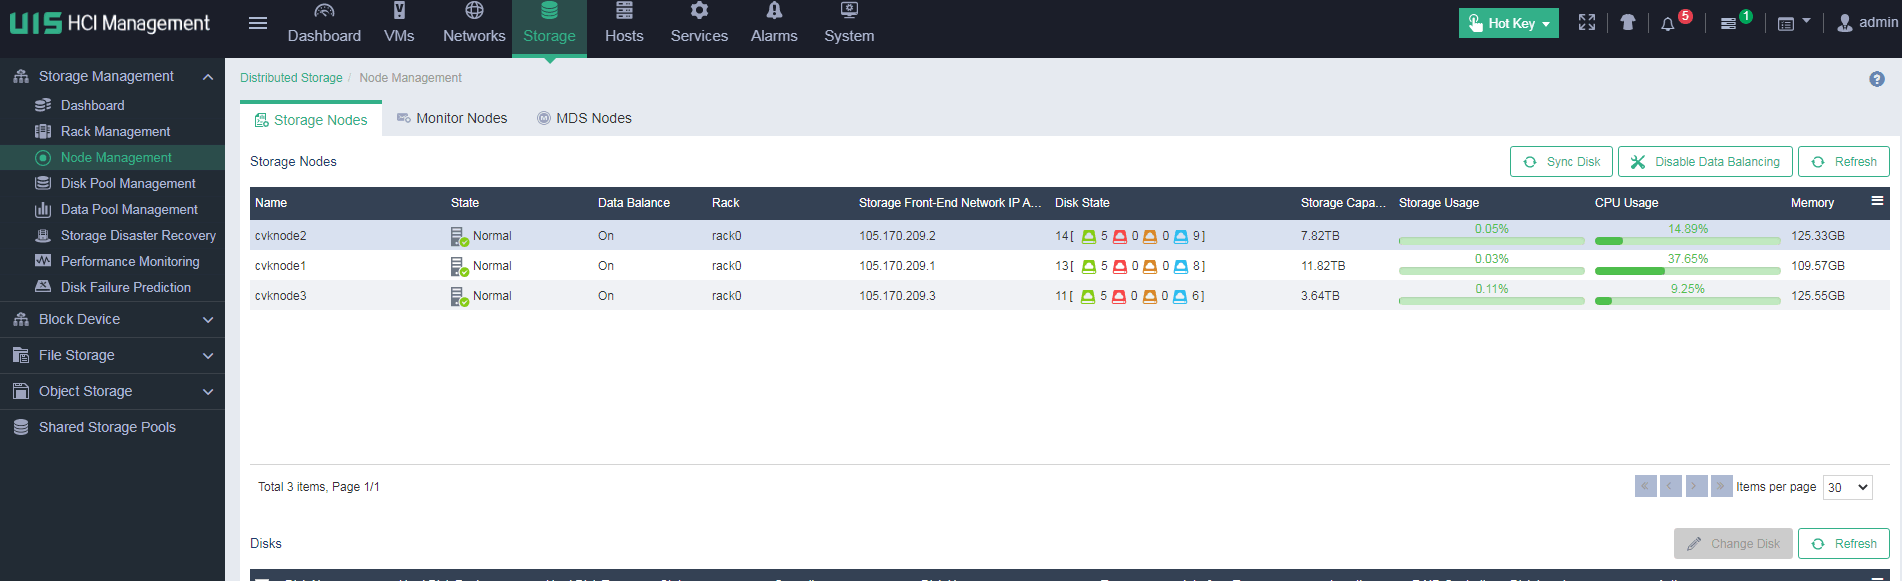
OSD process terminated unexpectedly
Symptom
An OSD process is terminated unexpectedly on a storage node.
Solution
To resolve this issue:
1. On the top navigation bar, click Storage, and then select Storage Management > Node Management > Storage Nodes from the left navigation pane.
2. Verify that the disks on the storage node are in normal state.
3. Log in to the host acting as the storage node through SSH from the management network, and execute the ceph osd tree command to view the status of al OSDs.
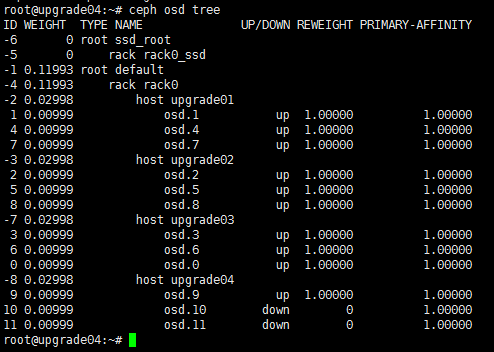
4. Execute the ps-ef | grep ceph-osd command to check the status of the osd processes.
![]()
5. If an osd process is not running, execute the systemctl start ceph-osd@OSD ID.service command to start it.
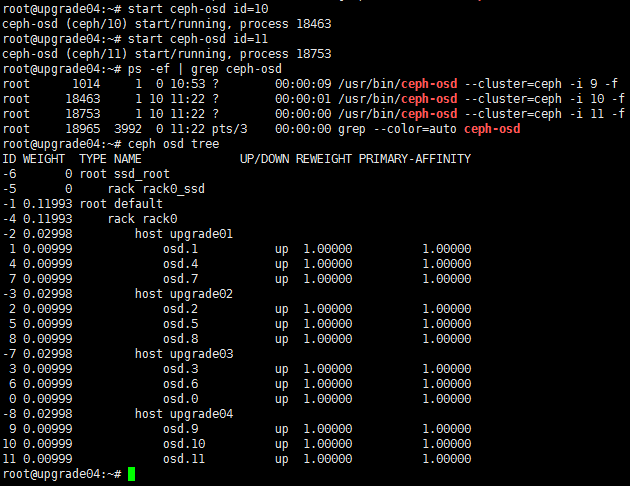
OSD soft link loss
Symptom
The OSD soft link for a disk is lost.
Solution
To resolve this issue:
1. Execute the lsblk command to view the OSD directory of the down disk.
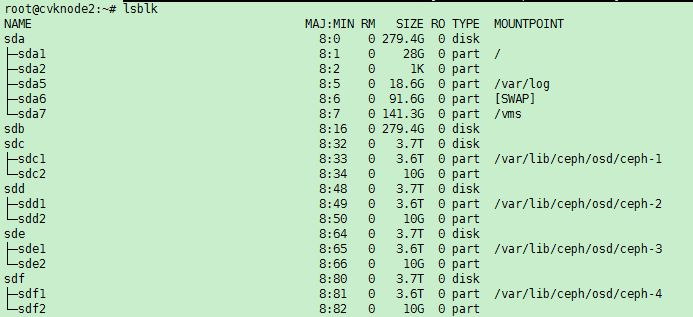
2. Access the OSD directory by executing the following command:
cd /var/lib/ceph/osd/ceph-4
3. Enter ll to check whether the soft link exists. If the soft link exists, the journal file line contains the UUID of the disk.
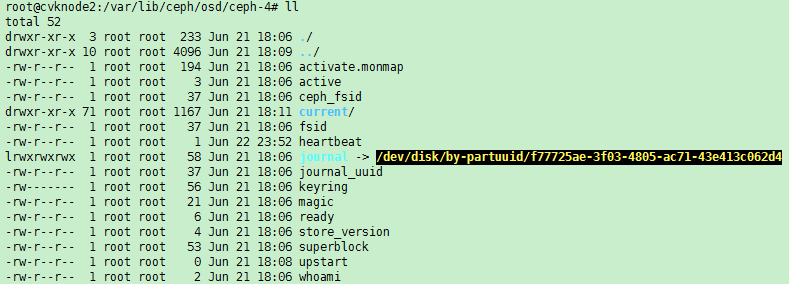
4. If the soft link does not exist, execute the following command:
ceph-disk activate-all
Loose or faulty disk
Symptom
The OSD process of a disk is down, which indicates that the disk is loose or faulty.
Solution
To resolve this issue:
1. Examine the disk status LEDs of the affected server to locate the disk.
2. Replace the disk.
Abnormal PG state
Symptom
PGs are degraded, stale, stuck unclean, or undersized.
Solution
If no other alarms are generated for the abnormal PGs, data migration is in process. The PGs will recover automatically.
Cache alarm
Symptom
Physical cache alarms or logical cache alarms are generated for the following reasons:
· RAID is manually configured and the state of caches is incorrectly set during system deployment.
· Faults occur during operation of the cluster. For example, a battery fault for a RAID controller might cause logical cache errors.
Solution
To resolve this issue:
1. On the top right of the page, click Hot Key, and then select Health Check.
2. Select Physical Disk State and Logical Disk State, and then click Start.
Figure 9 Performing health check
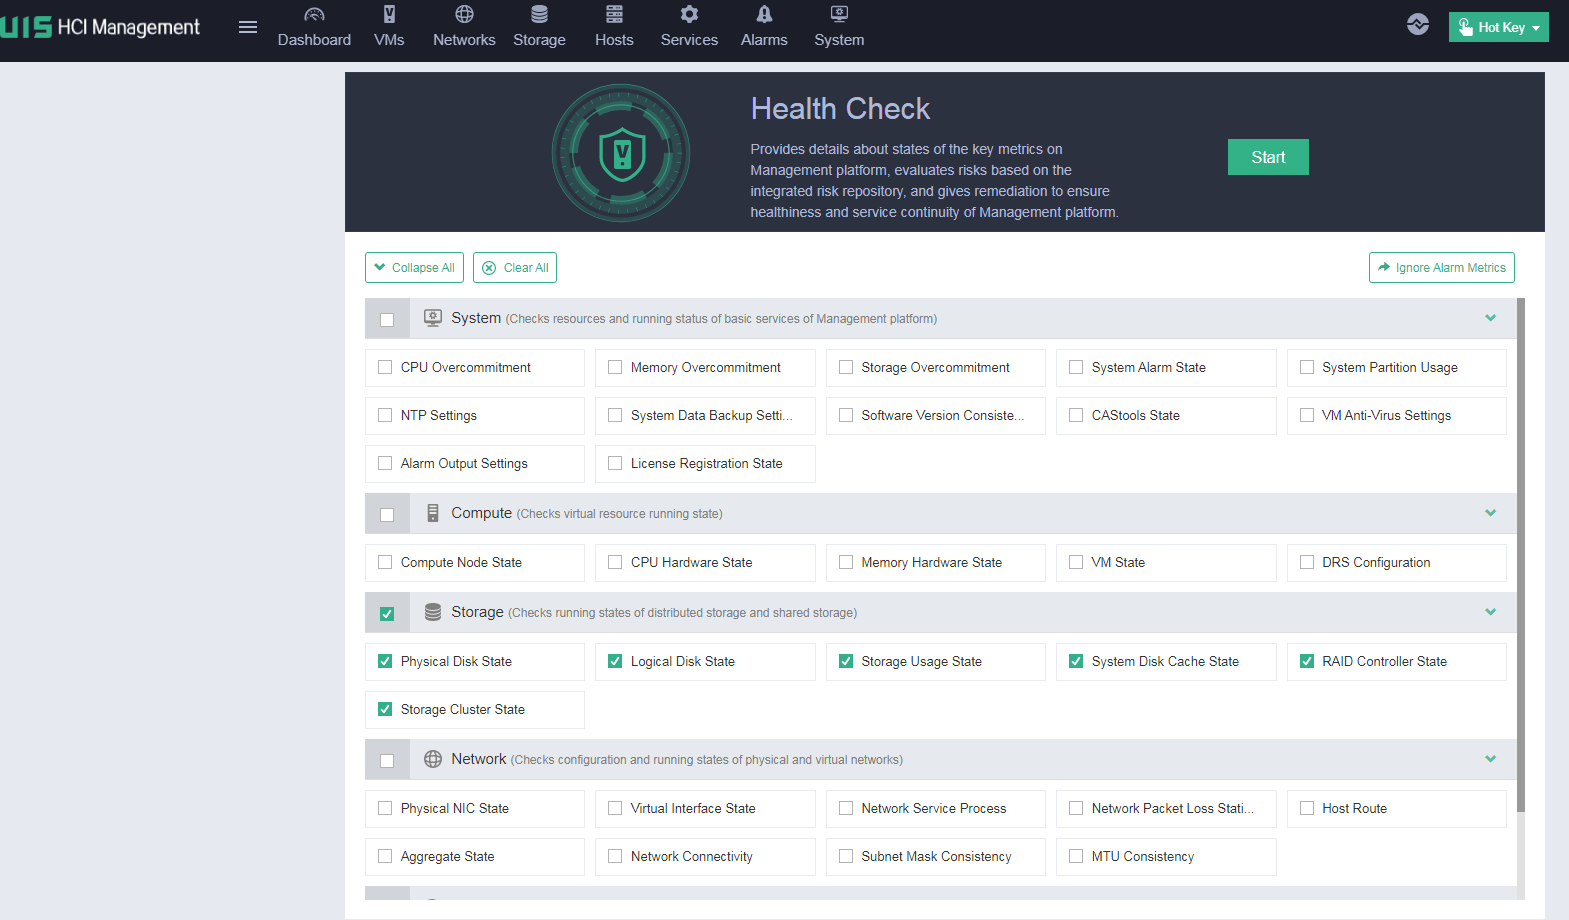
3. Click Failure in the Cache State column for a faulty disk.
Figure 10 Disk with faulty caches
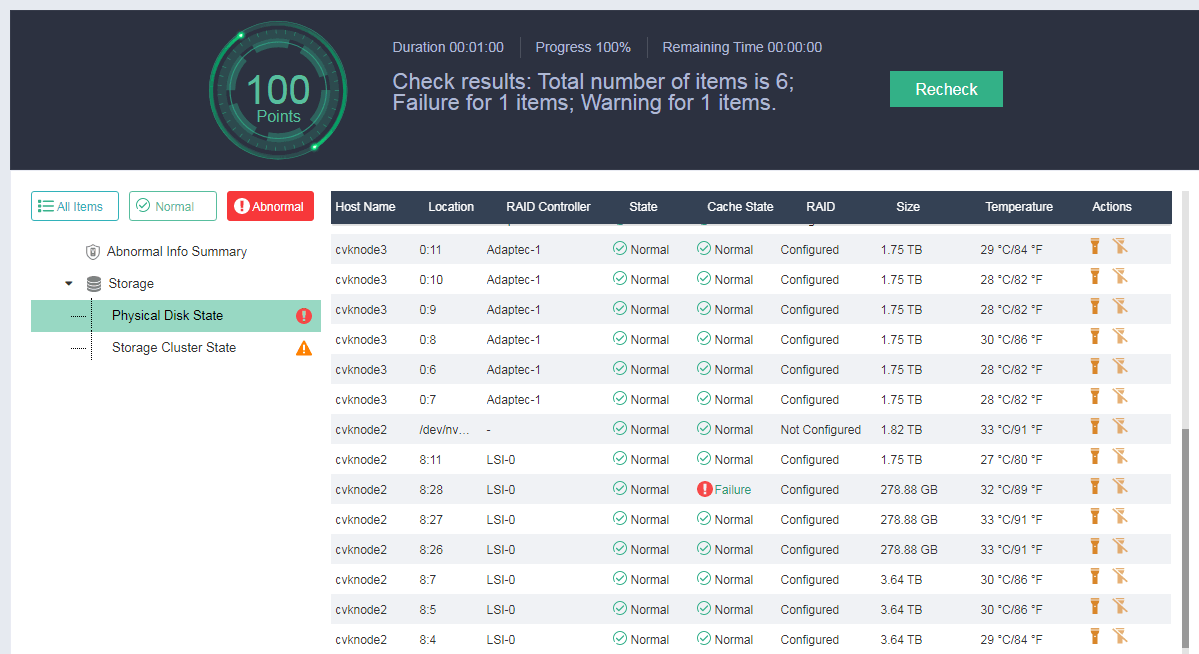
4. Fix the caches of the disk according to the remediation.
Figure 11 Remediation
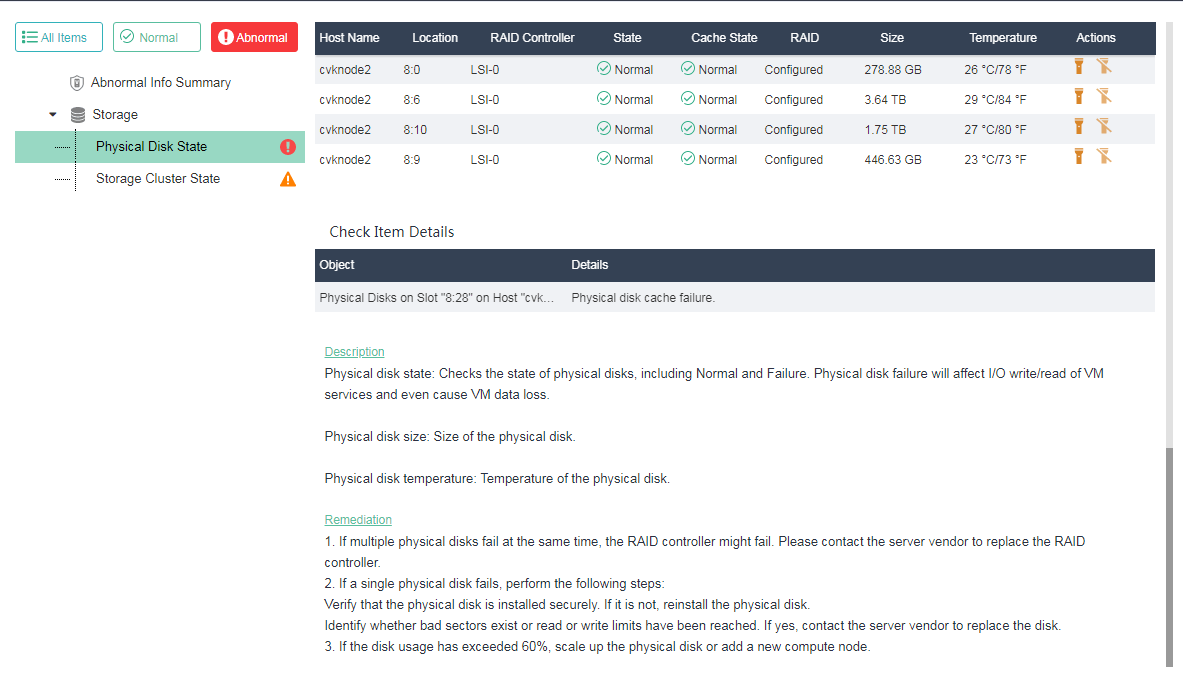
Host failure
UIS management node failure
Symptom
The management node cannot recover from failure.
Solution
To resolve this issue:
1. Install UIS Manager on a backup server.
2. Access UIS Manager as a system administrator.
3. On the top navigation bar, select System, and then select Data Backup from the left navigation pane.
4. On the Data Backup tab, configure the backup settings for accessing the backup files, and then click Connectivity.
Figure 12 Configuring data backup access
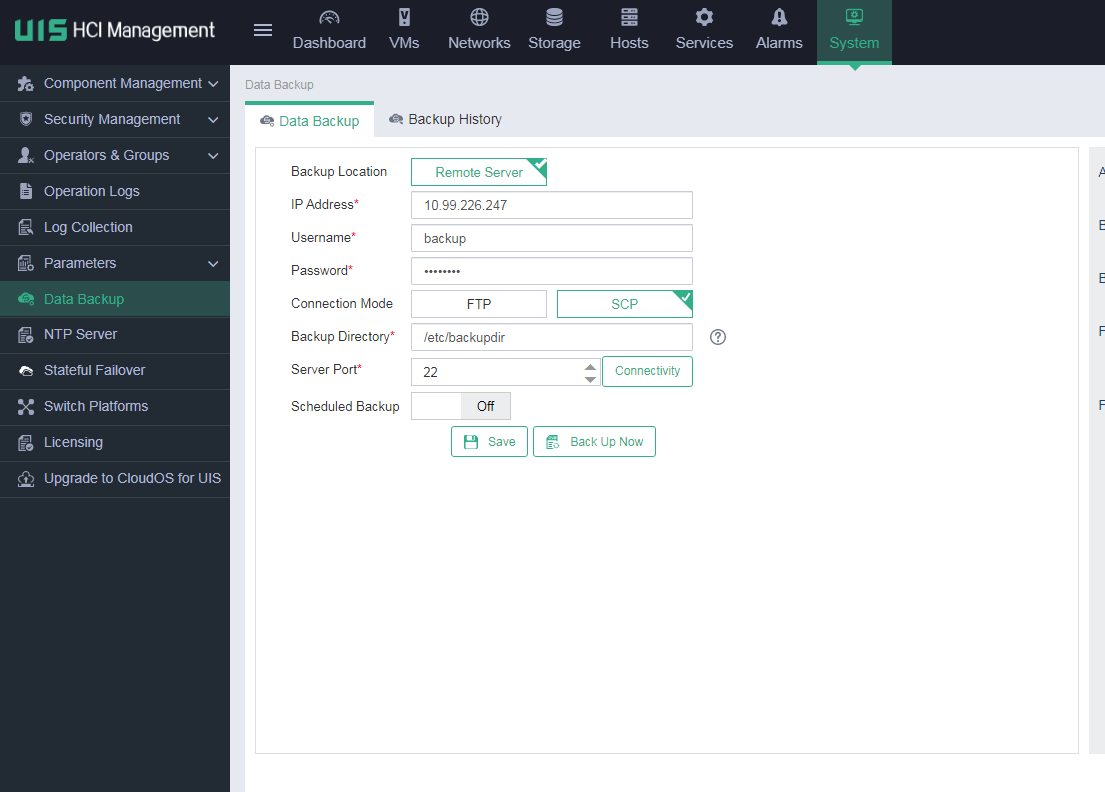
5. If the test succeeds, click Save. If the test fails, check the backup settings for misconfiguration.
UIS Manager automatically obtains backup files from the backup directory.
6. Click the Backup History tab.
Figure 13 Backup history
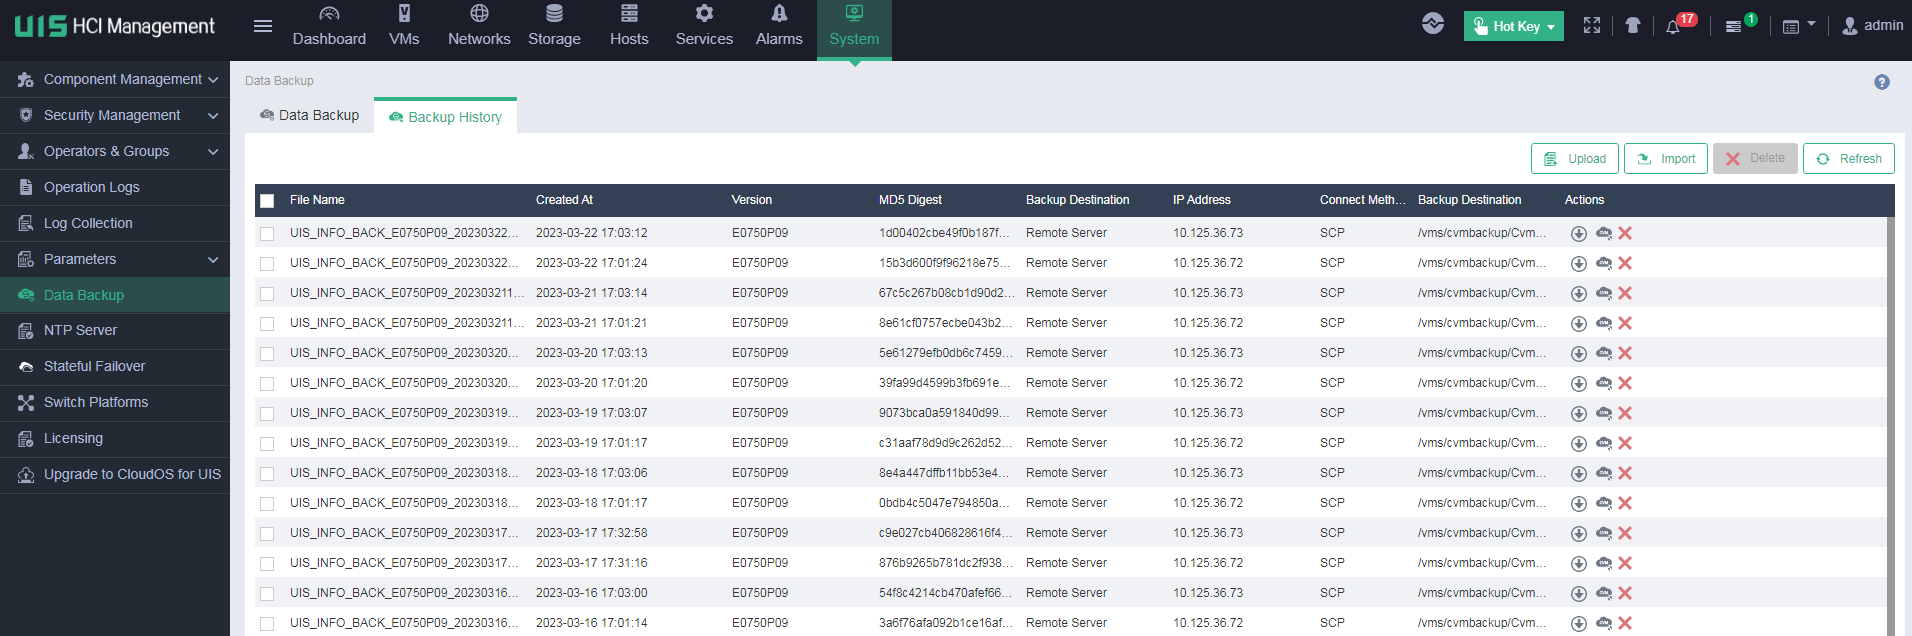
7. Select the target backup file, and then click its Restore UIS Data icon ![]() .
.
Figure 14 Restoring UIS data
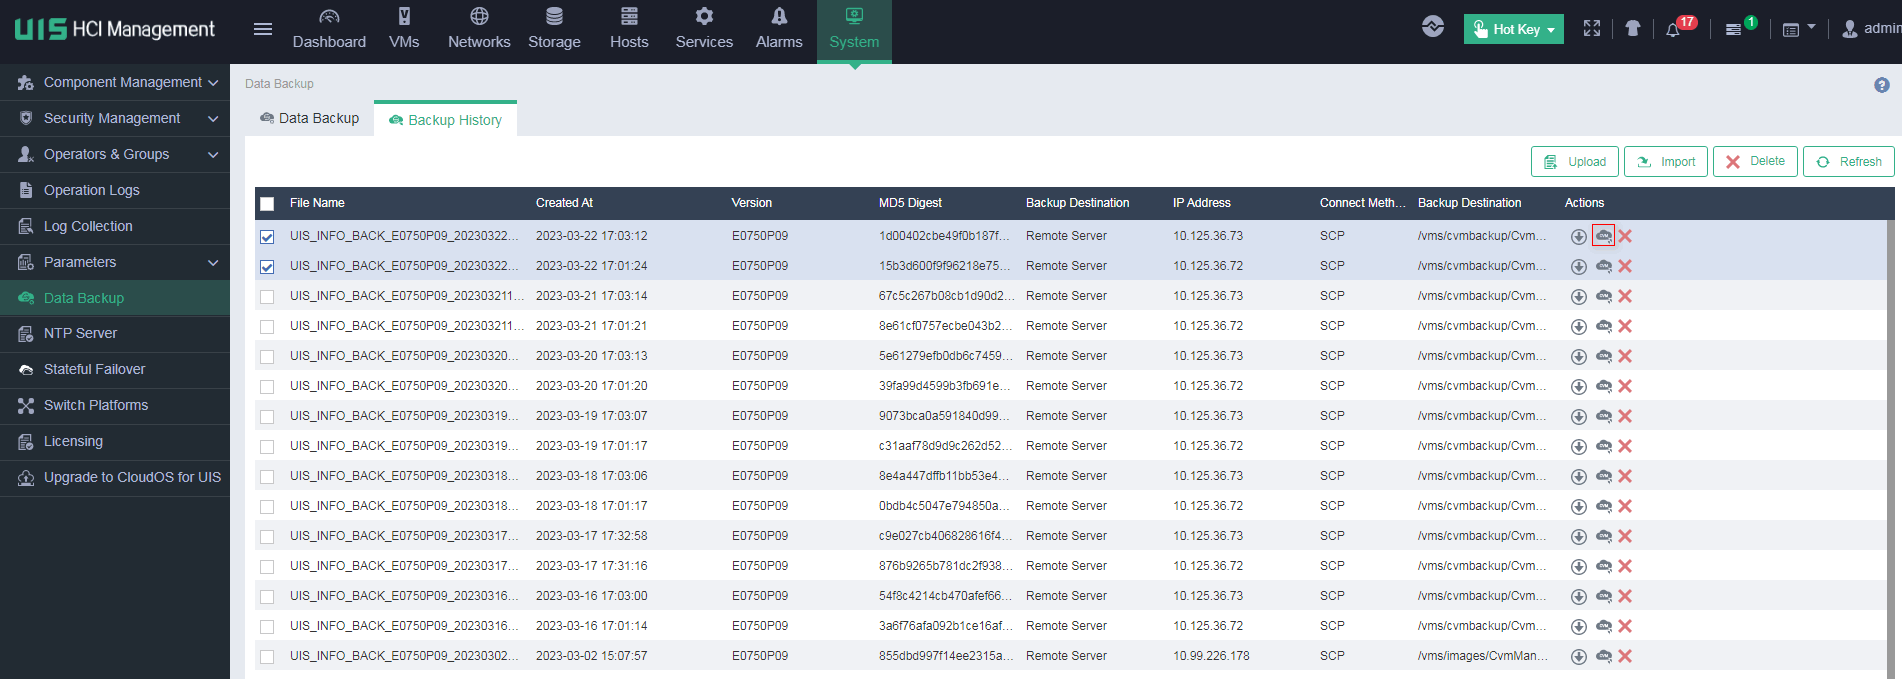
8. In the dialog box that opens, click Yes.
9. Clear the browser cache, and then log in to the in UIS Manager again.
| IMPORTANT: The two system disks backup each other. The system still can operate correctly if one of the system disks fails. However, the system cannot be restored if both of the system disks fail. If one of the system disks fails, replace it in time. |
Stateful failover
Quorum node failure
Symptom
The quorum node fails.
Solution
To recover the quorum node, contact Technical Support.
Monitoring node failure
Down monitoring node due to high system disk usage
Symptom
A monitoring node goes down because the system disk usage is high. The mon process exits or cannot start if the system disk usage exceeds 95%. The low disk space alarm is generated if the system disk usage crosses 70%.
To identify this symptom:
1. Execute the following command to check whether the mon process exists.
ps -ef|grep ceph-mon
2. If the mon process is not running, execute the df –h command to view the system disk usage.
root@cvknode1:df -h
Filesystem Size Used Avail Use% Mounted on
/dev/sda1 10G 9.6G 0.4G 96% /
udev 863M 12K 863M 1% /dev
tmpfs 349M 348K 349M 1% /run
none 5.0M 0 5.0M 0% /run/lock
none 873M 4.0K 873M 1% /run/shm
3. Check the status of the mon process by executing the ps aux | grep ceph-mon command.
root@cvknode20216:~/515# ps aux | grep ceph-mon
root 2619507 0.0 0.1 8112 2136 pts/3 S+ 17:47 0:00 grep --color=auto ceph-mon
Solution
To resolve this issue, release system disk space and start the mon process, for example, by executing the service ceph-mon@node name status command. The service name differs between nodes.
Down monitoring node due to network error
Symptom
A monitoring node goes down because of a network error.
To identify this symptom:
1. Verify that the mon process is running.
2. Verify that the monitoring nodes can ping one another.
3. Execute the arp -a and ifconfig commands to verify that the ARP table of the down monitoring node is correct.
Solution
To resolve this issue, troubleshoot the network error and start the mon process.
Extent backup file
Extent backup state
To verify that extent backup is enabled, execute the following command:
cat /etc/crontab
SHELL=/bin/bash
PATH=/sbin:/bin:/usr/sbin:/usr/bin
MAILTO=""
# For details see man 4 crontabs
# Example of job definition:
# .---------------- minute (0 - 59)
# | .------------- hour (0 - 23)
# | | .---------- day of month (1 - 31)
# | | | .------- month (1 - 12) OR jan,feb,mar,apr ...
# | | | | .---- day of week (0 - 6) (Sunday=0 or 7) OR sun,mon,tue,wed,thu,fri,sat
# | | | | |
# * * * * * user-name command to be executed
0 22 * * 5 root python /opt/bin/ocfs2_pool_fstrim.pyc -s onestor
1 2 * * * root /opt/bin/cas_clean_log.sh
*/1 * * * * root python /opt/bin/uis_host_network_probe.pyc
*/5 * * * * root flock -xn /tmp/util_memory_dropcaches.sh.lock -c "/opt/bin/util_memory_dropcaches.sh"
*/3 * * * * root /opt/bin/check_abrt_memory.sh
* * * * * root /opt/bin/ocfs2_iscsi_conf_chg_timer.sh
*/10 * * * * root python /opt/bin/ocfs2_cluster_config.pyc -s
0 */12 * * * root python /opt/bin/ocfs2_filesystem_layout_backup.pyc
* * * * * root /opt/bin/tomcat_check.sh
*/10 * * * * root /opt/bin/ntp_mon.sh
* * * * * root /opt/bin/tomcat_check.sh
Extent backup directory
To locate an extent backup file in the extent backup directory, access the /vms/.ocfs2_extent_backup directory, and search by the file names for the target .lzo file.
In the following example, defaultPool_hdd is the storage pool, and the file name contains a timestamp.
ll –a /vms/.ocfs2_extent_backup/defaultPool_hdd/normal/
-rw-r--r-- 1 root root 176 Dec 24 00:00 .8257798_root_zhanji_1_202012240000.lzo
Therefore, the path of the most recent extent backup file is as follows:
/vms/.ocfs2_extent_backup/defaultPool_hdd/normal/.8257798_root_zhanji_1_202012240000.lzo.
Extent backup file decompression
To decompress an extent backup file, first copy it to another directory, /home or example.
cp /vms/.ocfs2_extent_backup/defaultPool_hdd/normal/.8257798_root_zhanji_1_202012240000.lzo /home
cd /home
lzop -dv .8257798_root_zhanji_1_202012240000.lzo
Script for data restoration
To run the script for restoring data from an extent backup file, execute the following command:
python /opt/bin/ocfs2_restore_utils.pyc dd /dev/dm-0 /home/.8257798_root_zhanji_1_202012240000 /vms/hw235-1/8257798_root_zhanji_1_202012240000_new
The parameters in the script are as follows:
· /dev/dm-0—Driver letter of the shared storage that saves the extent backup file. To check the drive letter of shared storage, execute the fsmcli command.
fsmcli showpool --name defaultPool_hdd
…
device name: /dev/dm-0
device path: /dev/disk/by-id/dm-name-360000000000000000e0000003b75836c
device naa: 360000000000000000e0000003b75836c
· /home/.8257798_root_zhanji_1_202012240000—Decompressed extent backup file.
· /vms/hw235-1—Path on newly created shared storage or local storage to save the restored file. Make sure the target path has enough space. Do not save the restored file to the original shared storage.
· 8257798_root_zhanji_1_202012240000_new—Name of the restored file. This name must be different from the name of the original file.
Shared storage space reclamation
Releasing space of a shared volume by editing the VM bus type
1. Execute the df –h command to check the available space of the target shared volume.
![]()
2. Log in to the VM with the shared volume attached and check the drive letter and mount path of the data disk provided by the shared volume.
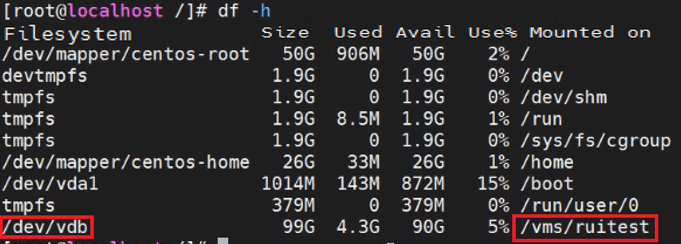
3. Log in to UIS, shut down the VM, and delete the data disk.
Figure 15 Editing the VM
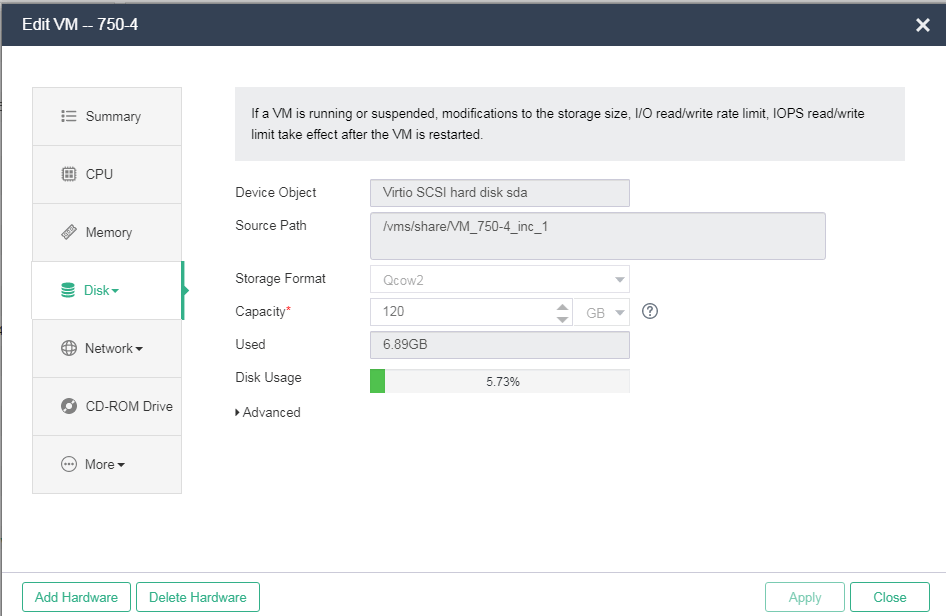
4. Mount the data disk to the VM again by adding hardware, and select the high-speed SCSI bus type.
Figure 16 Mounting the data disk
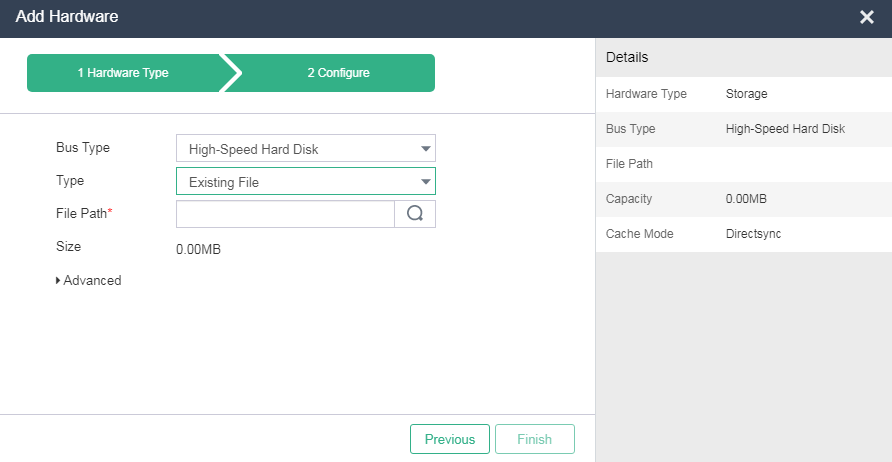
5. Log in to the VM, and mount the data disk again with the new drive letter.
mount /dev/sda /vms/ruitest
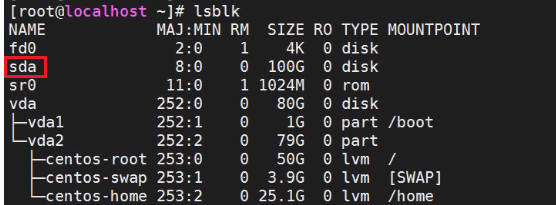
6. Execute the fstrim /vms/ruitest command to release space.
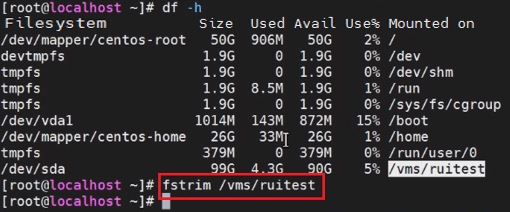
7. Log in to the host where the VM resides and verify that the available space of the shared volume has increased.
![]()
Releasing space of a shared volume by deleting files
1. Mount a data disk whose bus type is high-speed SCSI disk to a VM by using the following command:
mount -o discard /dev/sda /vms/ruitest
![]()
2. Verify that the discard option is specified in the mount command.
![]()
3. Log in to the host where the VM resides and check the available space of the shared volume.
![]()
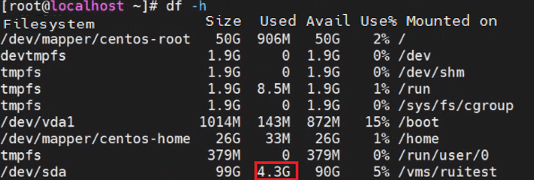
4. Delete large file from the shared volume and verify that the available space of the shared volume has increased.
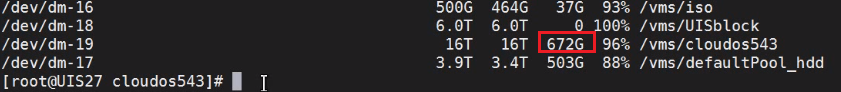
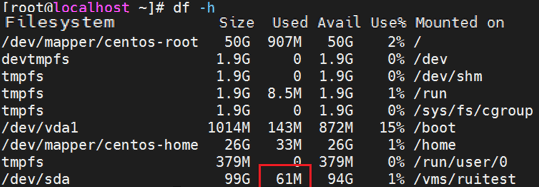
SNMP
Get responses not received by an NMS
Symptom 1
An NMS cannot receive get responses because the destination port for get responses is in use.
Solution 1
To resolve this issue:
1. Execute the netstat -apn |grep desination port command to obtain the process IDs for the destination port.
2. Execute the ps –aux | grep process ID command to check the processes that occupy the destination port.
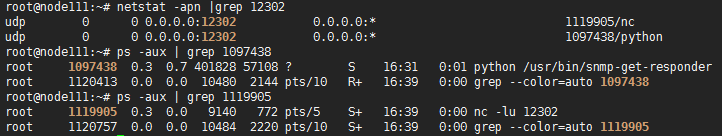
3. If processes other than the snmp-get-responder process occupy the destination port, terminate those processes or kill them by using the kill process ID command.
![]()
Symptom 2
An incorrect OID is configured for SNMPv1 get responses on an NMS
Solution 2
To resolve this issue:
1. Log in to the leader storage node and execute the snmpget -v1 -c $community $ip:$port $oid command.
¡ $community—Community name. To ignore this configuration, enter public.
¡ $ip—Storage-end IP address.
¡ $port—Destination port for get responses.
¡ $oid—OID configured on the NMS.
If the following error message is output, the OID on the NMS is incorrect.
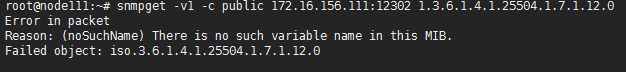
2. Modify the OID, and verify that the oid=string information is output.
![]()
![]()
Symptom 3
An incorrect OID is configured for SNMPv2c or SNMPv3 get responses on an NMS.
The storage supports the following OID ranges:
· 1.3.6.1.4.1.25506.1.7.1.2
· 1.3.6.1.4.1.25506.1.7.1.9
· 1.3.6.1.4.1.25506.1.7.1.10
· 1.3.6.1.4.1.25506.1.7.1.12
· 1.3.6.1.4.1.25506.1.7.1.13
On the NMS, a number in the range of 0 to 2147483647 is added to the end of an OID.
Solution 3
To resolve this issue:
1. Check the /var/log/onestor/snmp_get_responder.log file.
2. If the NoSuchObjectError error exists, the OID is not among the OIDs supported by the storage, and the OID does not exist in the MIB. Verify that the OID does not exceed the valid length.
![]()
3. If the NoAccessError error exists, the OID is not among the OIDs supported by the storage. The OID exists in the MIB, but the node does not have read or write permission. Verify that the OID is not shorter than the valid length.
![]()
4. If the ValueConstraintError error exists, make sure that the last number of the OID is in the range of 0 to 2147483647.
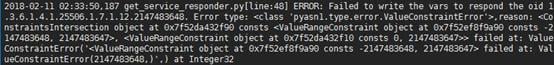
5. After you correct the OID, verify that the Success to write the vars log message is generated.
Value-added services
Data of a value-added service in the memory is different from that in the database
Analysis
This issue occurs if the handy node fails. Upon such a system event, a value-added service fails to update its data in the database, which causes data inconsistency between the memory and the database.
Solution
The solution varies by value-added service as follows:
· For the volume migration service, delete the inconsistent migration pairs, and then create migration pairs as needed.
· For the volume copy service, stop the inconsistent copy tasks, and then start copy tasks as needed.
Data inconsistency occurs if you mount a volume on a Windows client and create a snapshot online
Analysis
The product provides the storage-side snapshot function. When the system creates a snapshot, the host side might cache data. The hang IO service is used to implement data synchronization at multiple time points. This ensures that data is flushed to the data buffer on the host side at the time when a snapshot is created. Therefore, if the Windows client performs data caching at the time when a snapshot is created, data of the snapshot might be different from the real data.
Solution
As a best practice to avoid this issue, use an agent on the host side to achieve data caching and data flushing to the data buffer upon snapshot creation. However, such agent does not exist at present. Alternatively, you can take snapshots offline.
If you mount multiple snapshots of a volume on a Windows client at the same time, you are prompted that some snapshots are not initialized or assigned
Analysis
This issue might occur if you synchronously map a volume and its snapshots to the same host. The operating system of that host might recognize the source volume and its snapshots as the same volume, due to the volume recognition mechanism used by the operating system. For example, in the Oracle ASM scenario, a host identifies different volumes by ASM disk header information. This error will result in data corruption of the source volume and its snapshots.
Solution
Do not map a volume and its snapshots to the same host synchronously.
If you take a snapshot for a volume, delete its host mapping on the handy page without disk scanning or iSCSI disconnection, and restore the snapshot, the restored data is different from the original data.
Analysis
When the volume is unmapped from the host on the storage side, the host side is not aware of this event and still has data cache. If you restore data from the volume snapshot and mount the restored volume to the host again, data cache of the host will overwrite data of the restored volume.
Solution
Perform one of the following tasks before restoring data from the volume snapshot:
· Unmap the source volume from the host and perform disk scanning.
· Tear down the iSCSI connection.
If you create a read-only snapshot for a volume that is mounted by a directory, the snapshot cannot be mounted and the system prompts a wrong fs type message
Analysis
When you mount a volume on a Linux client, the new file system might not be flushed to the data buffer due to data caching. In this situation, if you take a snapshot for the mounted volume, the snapshotted file system is incomplete. Errors will occur if you mount the snapshot later.
Solution
Unmount the volume from the Linux client before snapshot creation.
The state of a snapshot is Creating, Deleting, or Restoring
Analysis
This issue might occur if the following conditions exist:
1. The system has an exception and thus fails to create, delete, or restore a snapshot.
2. The system cannot roll back its system records.
Solution
· For snapshots in Creating or Deleting state, manually delete the residual records generated for those snapshots.
· For snapshots in Restoring state, restore those snapshots again.
Compatibility
When the intel ixgbe network adapter is enabled with load balancing, storage access gets slow
To avoid this issue, perform the following tasks:
1. Use the ethtool –i eth0 command to check whether the driver is ixgbe.
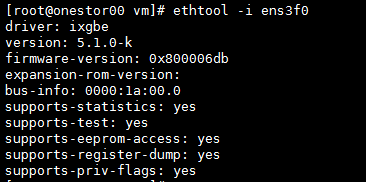
2. Use the ethtool –k eth0 command to check whether the large-receive-offload (LRO) service is disabled.
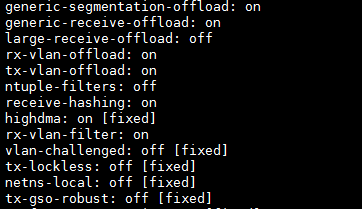
3. If the LRO service is enabled, use the ethtool –K eth0 lro off command to disable this service.
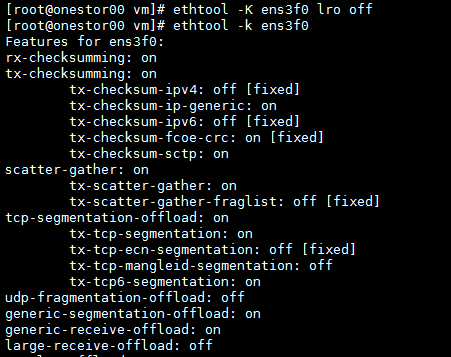
To ensure that the LRO service is disabled upon startup, add the ethtool –K eth0 lro off command in the /etc/rc.local file.
Using a QoS policy with low bandwidth and IOPS limits makes the storage disks of a client slow
Analysis
The I/O of a client might drop to 0 if the following conditions exist:
· The client uses multiple storage disks and a QoS policy with low bandwidth and IOPS limits is applied to those disks.
· Each used storage disk has high I/O concurrency. For more information about I/O concurrency, see the configuration file in method 2.
If Number of storage disks × Number of I/O concurrencies per storage disk is greater than the number of concurrencies on the iSCSI initiator, those storage disks have high concurrency.
Solution
To resolve this issue, use one of the following methods:
· Method 1: Distribute the service load if the service load is heavy on a single client.
¡ If only one client is available and you must deploy multiple storage disks on the client, install the multipathing service on the client and configure multiple iSCSI connections.
¡ If you can use multiple clients, distribute storage disks across different clients.
· Method 2: Increase the I/O limit on the iSCSI initiator.
a. Open the iSCSI initiator configuration file on the client. The default path is /etc/iscsi/iscsid.conf.
b. Find the session and device queue depth area in the configuration file, and then increase the value to the maximum (2048) for the node.session.cmds_max parameter.
Figure 17 Original I/O limit
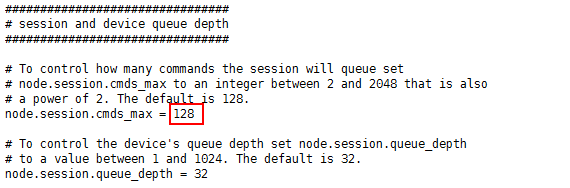
Figure 18 New I/O limit
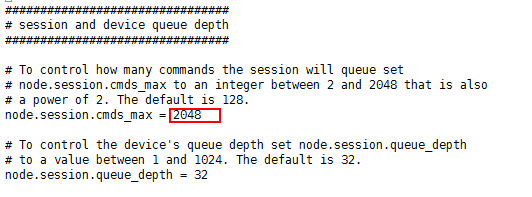
c. After the modification, restart the iSCSI initiator.
Failure to recognize an encryption dongle by VMs
To add an encryption dongle to a VM, make sure that dongle supports USB over network.
If an issue persists, contact Technical Support.
After a USB device is plugged into a CVK host, the host cannot recognize the USB device
Symptom
After a USB device is plugged into a CVK host, you cannot find the USB device when you attempt to add a USB device on the Web management page of UIS.
Analysis
Troubleshoot this issue as follows:
1. This issue occurs if the USB device is plugged into an incorrect slot. You can insert the USB device to another slot, for example, a USB slot inside the server. If the server has multiple types of USB slots, make sure the USB device is plugged into the matching slot.
To check whether a USB device is plugged into the correct slot, use the lsusb –t command. The following is an output example:
root@cvk-163:~# lsusb -t
/: Bus 04.Port 1: Dev 1, Class=root_hub, Driver=xhci_hcd/6p, 5000M
/: Bus 03.Port 1: Dev 1, Class=root_hub, Driver=xhci_hcd/15p, 480M
/: Bus 02.Port 1: Dev 1, Class=root_hub, Driver=ehci-pci/2p, 480M
|__ Port 1: Dev 2, If 0, Class=hub, Driver=hub/8p, 480M
/: Bus 01.Port 1: Dev 1, Class=root_hub, Driver=ehci-pci/2p, 480M
|__ Port 1: Dev 2, If 0, Class=hub, Driver=hub/6p, 480M
In the command output:
¡ UHCI represents USB 1.1. The maximum data transfer speed of USB 1.1 is 12Mbps.
¡ EHCI represents USB 2.0. The maximum data transfer speed of USB 2.0 is 480Mbps.
¡ XHCI represents USB 3.0. The maximum data transfer speed of USB 3.0 is 5Gbps.
If the server supports multiple USB standards and you plug a USB 2.0 device into the correct slot on the server, a USB device is added in the bus of USB 2.0 (ehci-pci).
At present, USB 3.0, 2.0, and 1.0 are supported. Although you can plug a lower-version USB device into a higher-version USB slot, USB device incompatibility issues might occur. For example, when you plug a USB 1.0 device into a server that has only USB 3.0 slots, disable USB3.0 for the BIOS of that server to avoid USB device incompatibility issues.
If the host still cannot recognize the USB device, proceed to the next step.
2. On the command shell of the CVK host, use the lsusb command before and after you plug the USB device into the host. Compare the outputs to identify whether a new USB device is added. The following is an output example:
root@ CVK:~# lsusb
Bus 001 Device 001: ID 1d6b:0002 Linux Foundation 2.0 root hub
Bus 005 Device 001: ID 1d6b:0001 Linux Foundation 1.1 root hub
Bus 004 Device 001: ID 1d6b:0001 Linux Foundation 1.1 root hub
Bus 003 Device 001: ID 1d6b:0001 Linux Foundation 1.1 root hub
Bus 002 Device 001: ID 1d6b:0001 Linux Foundation 1.1 root hub
Bus 006 Device 002: ID 03f0:7029 Hewlett-Packard
Bus 006 Device 001: ID 1d6b:0001 Linux Foundation 1.1 root hub
If no new USB device is added, the Ubuntu operating system cannot recognize the USB device. In this situation, the USB device might have faults, because an operating system with the Linux kernel supports most of the USB devices on the market. To check whether the USB device operates correctly, you can plug the USB device into an office PC. If the USB device can operate correctly on the PC, it is normal and you need to proceed to the next step.
3. Check whether the CAS system has faults or the server is not compatible with the USB device.
a. Install the operating system of an office PC on the server, plug the USB device into the server, and then check whether the system can recognize the USB device.
- If it cannot be recognized, the server is not compatible with the USB device.
- If it can be recognized, the server is compatible with the USB device.
b. Install the native CentOS system on the server, plug the USB device into the server, and then check whether the system can recognize the USB device.
- If it cannot be recognized, the CentOS system does not support the USB device. Since UIS is CentOS-based, it also does not support the USB device.
If there is a new device, it shows that the CentOS system has recognized the device, continue with the following steps to troubleshoot.
- If it can be recognized, proceed to the next step.
4. Use the virsh nodedev-list usb_device command to view the name of the new USB device. The following is an output example:
root@ CVK:~# virsh nodedev-list usb_device
usb_2_1_5
usb_usb1
usb_usb2
usb_usb3
usb_usb4
As shown in the command output, the name of the new USB device is usb_2_1_5. Then, use the virsh nodedev-dumpxml xxx command to view XML information of USB device usb_2_1_5. The following is an output example:
| NOTE: The xxx argument represents the name of a device. You can obtain this information by using the virsh nodedev-list usb_device command. |
root@CVK:~# virsh nodedev-dumpxml usb_2_1_5
<device>
<name>usb_2_1_5</name>
<path>/sys/devices/pci0000:00/0000:00:1d.0/usb2/2-1/2-1.5</path>
<parent>usb_2_1</parent>
<driver>
</driver>
<capability type='usb_device'>
<bus>2</bus>
<device>70</device>
<product id='0x6545'>DataTraveler G2 </product>
<vendor id='0x0930'>Kingston</vendor>
</capability>
</device>
Check whether the bus ID, device ID, product ID, and vendor ID are correct. If these IDs are all correct and you still cannot find the USB device on the Web management page of UIS, contact Technical Support.
After a USB device is loaded to a VM, the device manager of the VM cannot recognize the USB device, or the USB device appear and disappear quickly, or there is an exclamation mark on the device
Symptom:
After a USB device is loaded to a VM, the device manager of the VM cannot recognize the USB device, or the USB device appear and disappear quickly, or there is an exclamation mark on the device
Analysis
To resolve this issue:
1. Connect the USB device to another USB connector. If you use a USB extension cable, connect the USB device directly to a build-in USB connector and try again. If the server provides USB slots of multiple types, make sure the USB device is connected to the correct connector.
To identify whether the USB device is connected to the correct connector, use the lsusb –t command.
root@cvk-163:~# lsusb -t
/: Bus 04.Port 1: Dev 1, Class=root_hub, Driver=xhci_hcd/6p, 5000M
/: Bus 03.Port 1: Dev 1, Class=root_hub, Driver=xhci_hcd/15p, 480M
/: Bus 02.Port 1: Dev 1, Class=root_hub, Driver=ehci-pci/2p, 480M
|__ Port 1: Dev 2, If 0, Class=hub, Driver=hub/8p, 480M
/: Bus 01.Port 1: Dev 1, Class=root_hub, Driver=ehci-pci/2p, 480M
|__ Port 1: Dev 2, If 0, Class=hub, Driver=hub/6p, 480M
UHCI represents USB1.1, EHCI represents USB2.0, and XHCI represents USB3.0. Typically, the maximum transmission rate for USB1.1 is 12 Mbps, for USB2.0 is 480 Mbps, and for USB3.0 is 5 Gbps.
For example, if a server supports multiple USB bus standards, and a USB2.0 device is added to the server, and a USB device is then added to the USB2.0 (ehci-pci) bus, it indicates that the USB device is correctly inserted in the slot.
2. If the USB devices such as USB Key, encryption token, or SMS modem are USB1.0, and the server only has USB3.0 connectors, it is recommended to disable USB3.0 in the BIOS.
3. To identify whether the CVK host can recognize the USB device, unplug and plug in the USB device, and then use the virsh nodedev-list usb_device command to check if there are any newly added USB devices.
¡ If no newly added USB device is detected, see "After a USB device is plugged into a CVK host, the host cannot recognize the USB device."
¡ If a newly added USB device is detected, proceed to the next step.
4. When adding the USB device to a VM, it is important to examine if the selected USB controller is correct for the device and to identify the USB version of the device (USB 1.0, USB 2.0, or USB 3.0). Typically, for USB devices such as USB Key, encryption token, or SMS modem, it is recommended to use the USB 1.0 controller.
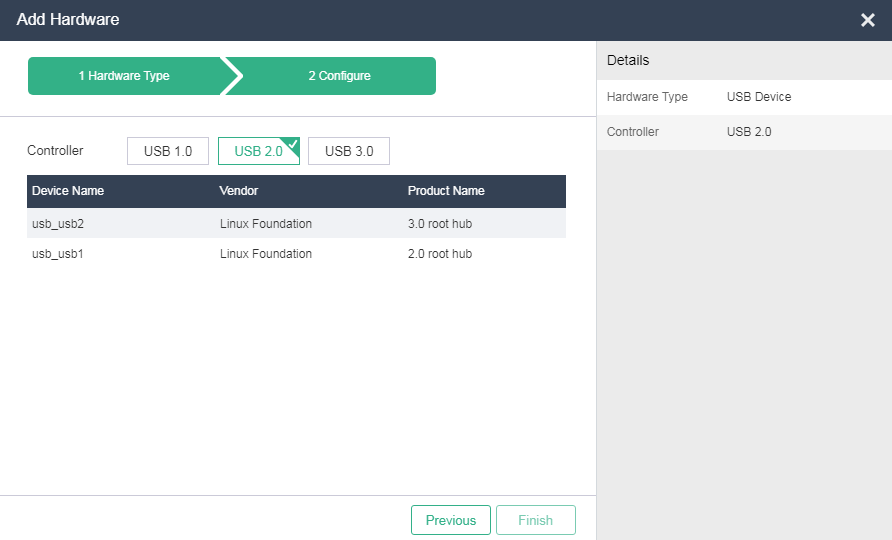
5. If the USB device is not recognized by the VM, it is possible that the driver may be incompatible or outdated. Examine if the driver version matches the operating system of the VM.
One way to identify whether the driver is correct is to install the same operating system on a physical machine and test if the driver works correctly or consult with the USB device manufacturer. Another way is to create a similar VM on the VMware platform, install the same driver, and load the USB device to see if it is recognized by the VM.
If the correct driver is used, and the VM still cannot recognize the device, proceed to the next step.
6. Use virsh nodedev-dumpxml xxx to view the XML information of the newly added USB device. xxx represents the name of the newly added USB device in the output from the virsh nodedev-list usb_device command.
root@ CVK:~# virsh nodedev-list usb_device
usb_2_1_5
usb_usb1
usb_usb2
usb_usb3
usb_usb4
In this example, the name of the newly added USB device is usb_2_1_5.
root@CVK:~# virsh nodedev-dumpxml usb_2_1_5
<device>
<name>usb_2_1_5</name>
<path>/sys/devices/pci0000:00/0000:00:1d.0/usb2/2-1/2-1.5</path>
<parent>usb_2_1</parent>
<driver>
<name>usb</name>
</driver>
<capability type='usb_device'>
<bus>2</bus>
<device>70</device>
<product id='0x6545'>DataTraveler G2 </product>
<vendor id='0x0930'>Kingston</vendor>
</capability>
</device>
7. After loading the USB device to the VM, use the virsh nodedev-dumpxml xxx command again to examine if there is any change in the values of device ID, product ID, and vendor ID.
If there is a change in these values, it could be a compatibility issue between the server and the USB device. To troubleshoot this issue, try installing the same operating system used by the VM directly on the server and see if the USB device can be used normally. Examine the system logs for any errors. It is important to ensure that the USB device is not only visible but also functional. If the USB device works fine when the operating system is installed directly on the server, please contact H3C Support.
Use of USB3.0 devices
For a USB3.0 device, if you select the USB3.0 controller from the Web interface at USB device adding to a VM, but the USB device cannot be found in the VM after loading, possible reasons include:
· The VM lacks USB 3.0 driver. USB 3.0 is a relatively new protocol, and some old operating systems do not have the corresponding driver built-in, which requires downloading and installing the appropriate USB 3.0 driver for the corresponding operating system.
You can view the item in the red the following contents highlighted in the red box in the device manager in systems that support USB 3.0:
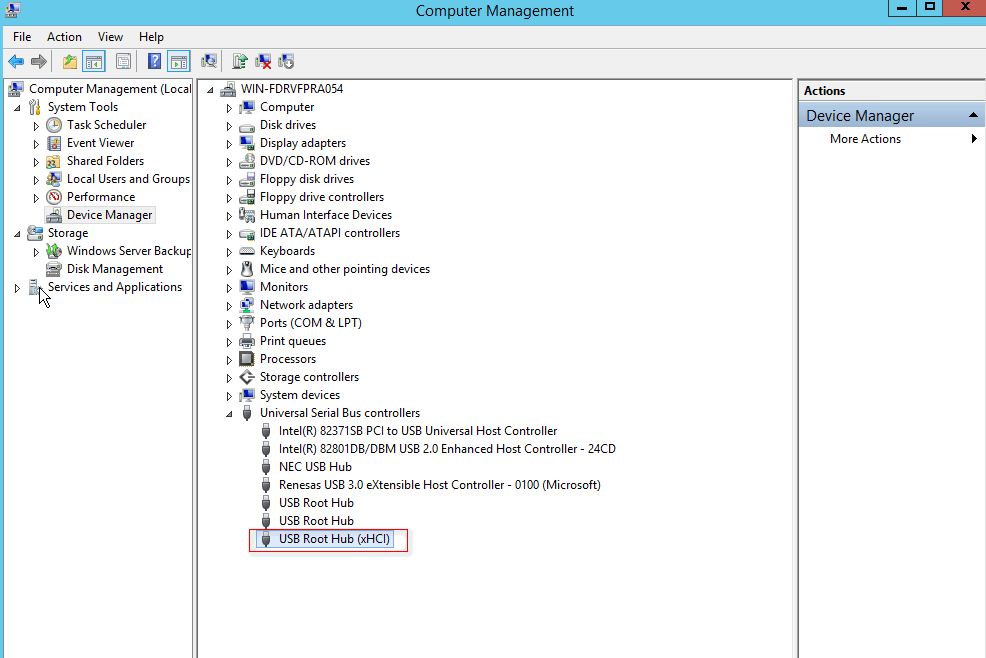
· The USB3.0 device is incompatible with the server. In this case, after you plug the USB 3.0 device into the server equipped with UIS, log in through an SSH terminal, and execute lsusb -t, no new devices can be displayed.
Use of USB-to-serial devices
Plug in a USB-to-serial device into a server equipped with UIS, log in through an SSH terminal, and use lsusb -t to check for new USB devices. If the speed of the newly added device is 12 Mbps, select the USB 1.0 controller when you add the USB device to a VM. If the speed is 480 Mbps, select the USB 2.0 controller.
For example:
After you load a USB-to-serial port device to a VM, no newly added serial port device can be viewed on the VM. After you install the USB-to-serial driver on the VM, the device still cannot be displayed. This issue occurs because the selected USB2.0 controller does not match the device speed. The issue is removed after you change to a USB1.0 controller.
A USB-to-serial cable is connected to four switches on one end and connected to a UIS-equipped server on the other end. After you log in through an SSH terminal and use the lsusb -t command to view new devices, the four newly added devices cannot be seen simultaneously. If you unplug and then plug the cable repeatedly, only one, two, or three devices can be seen. When an unrecognized USB connector is plugged in, the following syslog is generated:
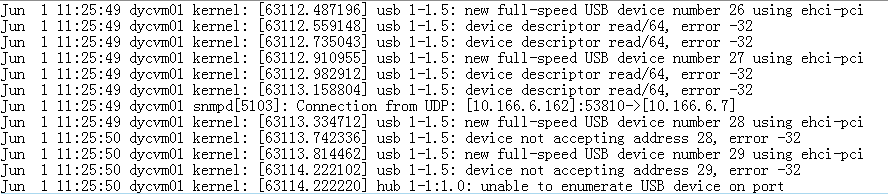
The log is generated because of bus negotiation errors occurred at device and server connection establishment. In this case, identify whether the server is compatible with the USB-to-serial connection method as a best practice. In this example, the server is not compatible with the method. After the HP FlexServer R390 server used on-site is replaced with an R590 server, all the four new devices can be correctly identified.
Performance improvement
Disk performance optimization
The disk queue mode for the E0705 and E0706 versions is cfq (E0707 version). This mode results in poor SSD performance, and also significantly impacts the I/O performance of OCFS2 shared storage volumes. This ultimately leads to poor cluster performance and affects the VM performance. To resolve this issue, switch to the deadline mode.
· Permanent change:
[root@cvknode1 ~]# cat /proc/cmdline
BOOT_IMAGE=/boot/vmlinuz-4.14.0-generic root=UUID=da51eb22-6c64-4b3b-af57-960a117823c4 ro biosdevname=0 rhgb elevator=deadline transparent_hugepage=always net.ifnames=0 crashkernel=256M quiet
Edit grub configuration:
python /opt/bin/util_kernel_cmdline.pyc -s elevator=deadline transparent_hugepage=always net.ifnames=0 crashkernel=256M
If additional grub configurations exist, include them as parameters of the command.
· Online modification:
Edit the sd device:
for i in `ls /sys/block/sd*/queue/scheduler`; do echo "deadline" > ${i};done
Edit the dm device:
for i in `ls /sys/block/dm*/queue/scheduler`; do echo "deadline" > ${i};done
The permanent modification method requires the host to be restarted in order for the changes to take effect. The online modification method does not take effect on newly added block devices and these devices continue to use the default cfq mode.
Performance optimization
Adjusting the I/O priority
On the VMs > Edit > Summary page, set the I/O priority to High.
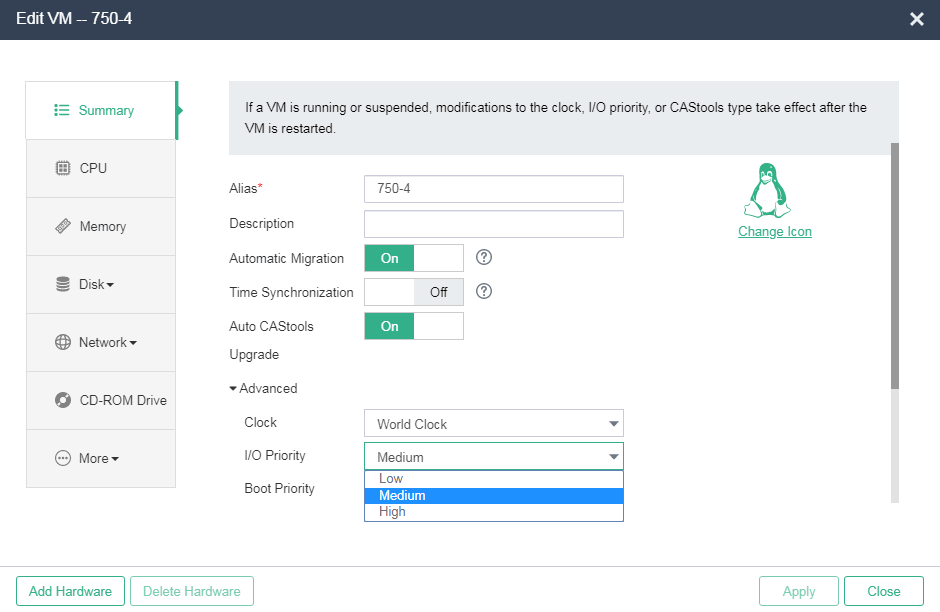
Adjusting the CPU operating mode
On the VMs > Edit > CPU page, set the operating mode to Straight-Through.
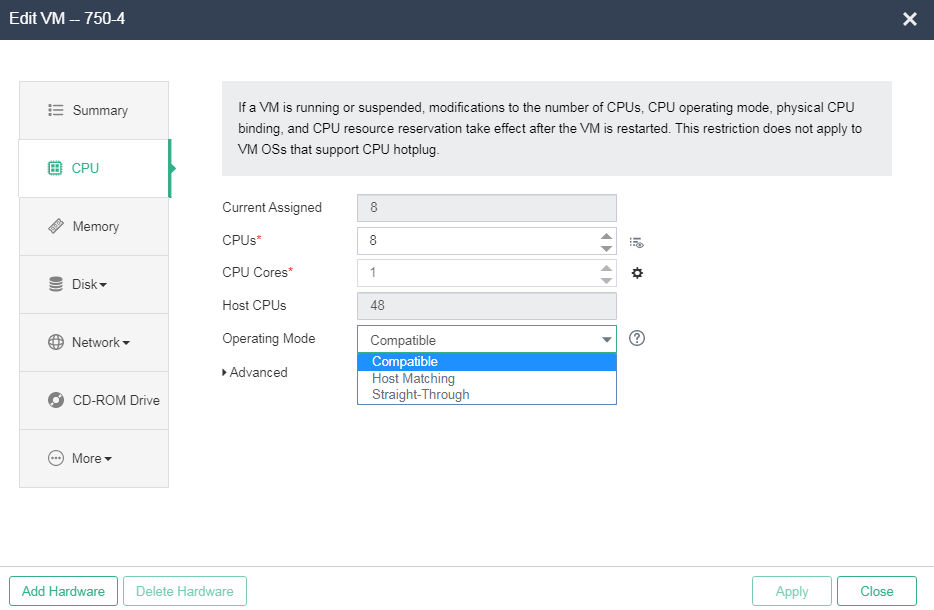
By default, the operating mode is Compatible. This mode virtualizes physical CPUs of different models into vCPUs of the same model to provide compatibility.
The straight-through mode enables the guest OS to access the physical CPUs directly. This mode provides higher performance than compatible mode.
Adjusting the VM disk mounting method
In the case of shared storage, when you create a VM, the system creates a volume on the shared storage for VM disks by default. In scenarios that have higher performance requirements, use the raw block method to directly provision the volume to the VM, bypassing the file system layer of the CVK.
Figure 19 Creating a volume for VM disks
Figure 20 Mounting the volume to the VM through raw block
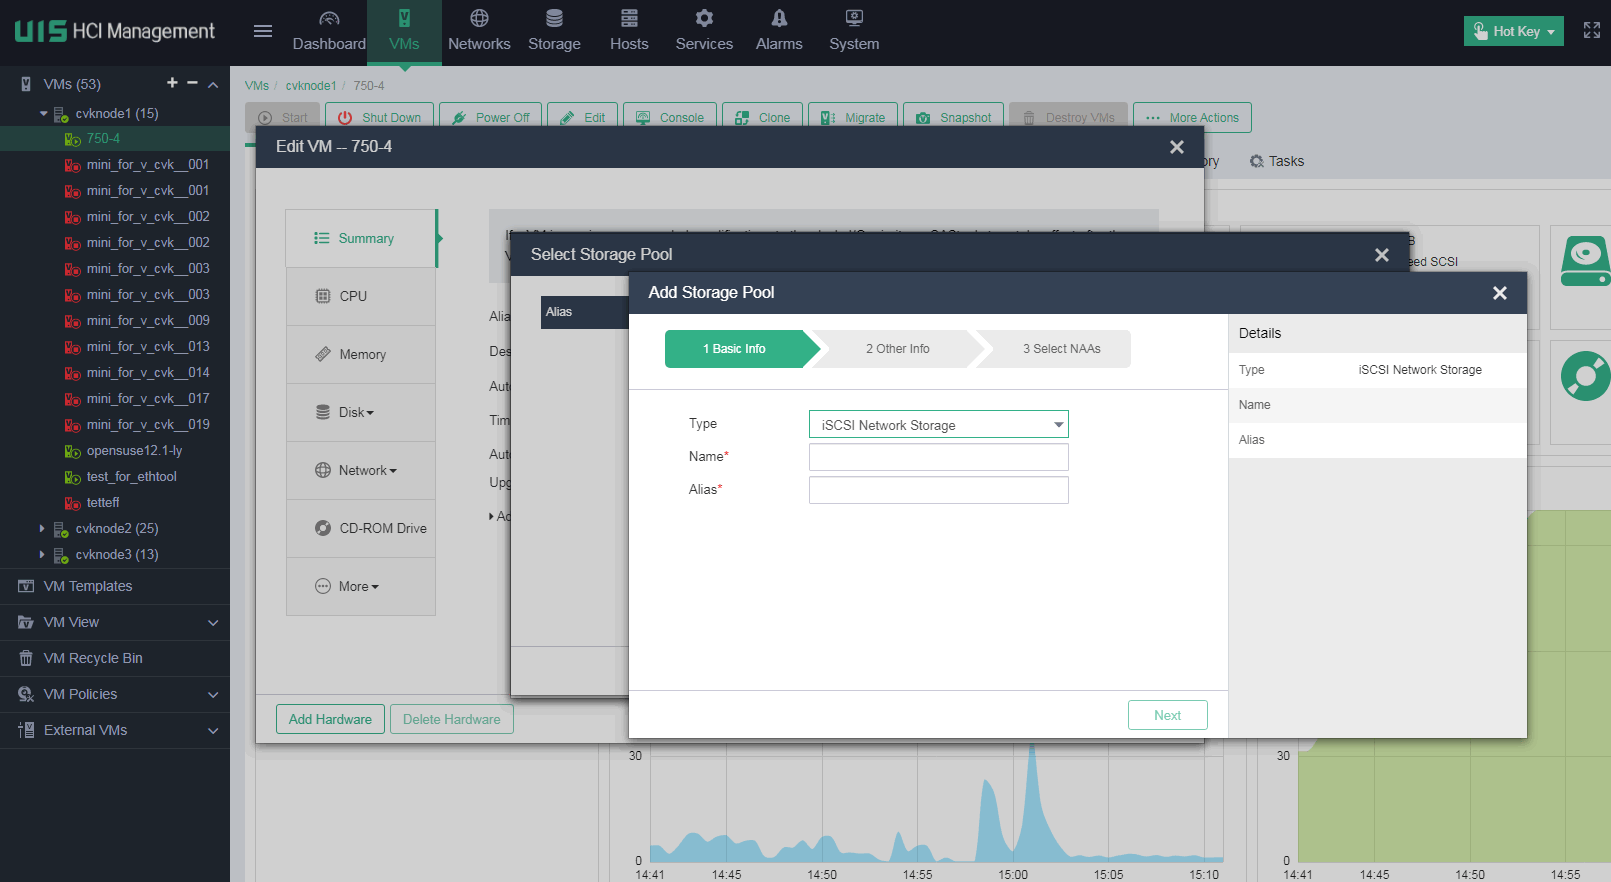
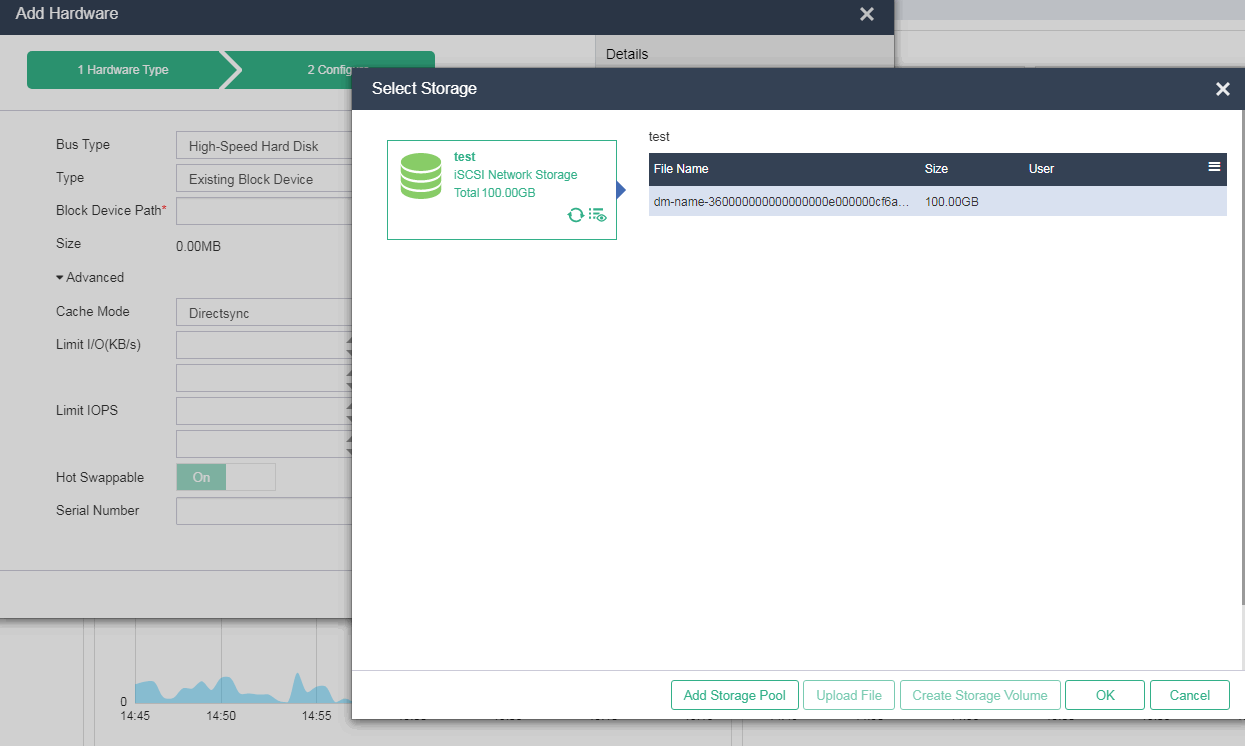
Figure 21 Information about the VM disk mounted through raw block
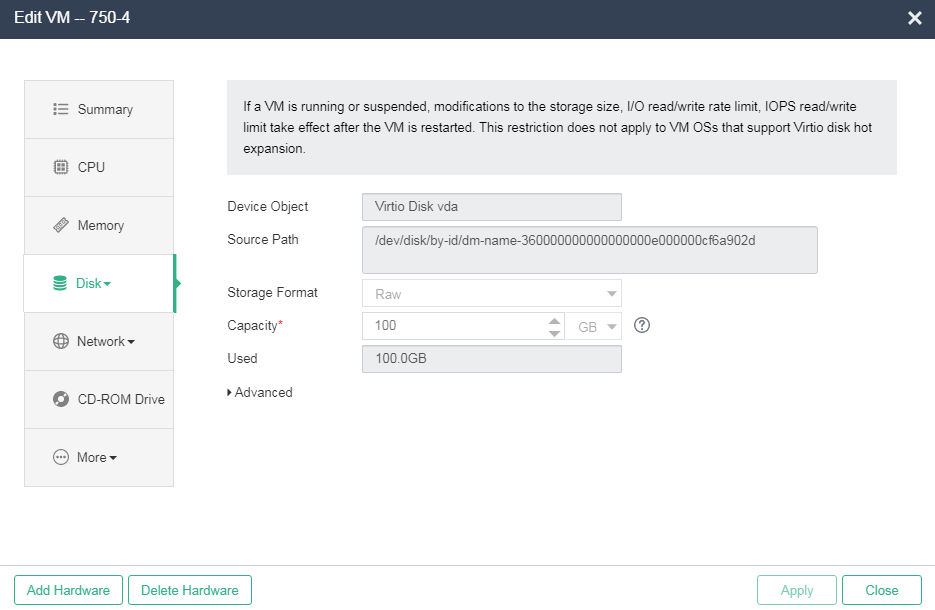
Adjusting the VM disk preprovisioning method
· For VMs deployed on shared storage that experience performance issues, you can adjust the disk preallocation method to improve performance. When creating a volume, change the preallocation method to thin provisioning.
· Increase the VM memory size.
· Change the log severity level.
Log in to the backend of any CVK, and execute the following commands:
ceph tell osd.* injectargs --debug_osd=1/1
ceph tell osd.* injectargs --debug_ms=0/0
ceph tell osd.* injectargs --debug_bluestore=1/1
ceph tell osd.* injectargs --debug_bluefs=1/1
ceph tell osd.* injectargs --debug_rocksdb=1/1
ceph tell osd.* injectargs --debug_bdev=1/1
· Change the I/O size.
Log in to the backend of all the CVKs and execute the following command on all nodes:
cd /proc/sys/dev/flashcache;for i in `ls`; do cd ${i}; echo 16 > skip_seq_thresh_kb; cd ..; done //16 indicates that the system skips flashcache for I/Os that has a higher value than 16.
Note that the adjustment is applicable only to small I/O, such as databases, and has little meaning for copy modification operations.
· Change the number of replicas.
This can help improve performance.
| CAUTION: Changing the number of replicas can affect data balance and might cause system risks. If you are to change the number of replicas, contact Technical Support. |
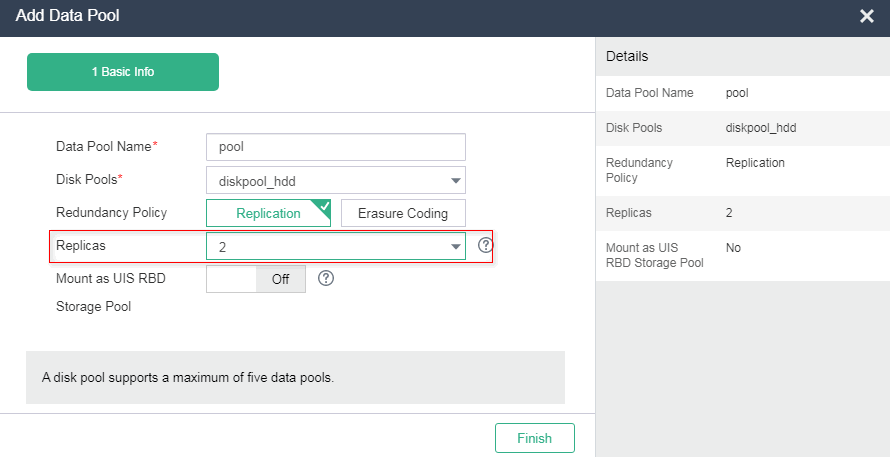
· Create a Window scaled-out file server
After adding disks to VMs, select to execute fast initialization when you perform volume initialization.
Guest OS and VM restoration
Restrictions and guidelines
· This document provides a general Linux and Windows OS repair process, which can be referenced for other systems.
· Disaster recovery system repair does not ensure complete success. Perform data backup and take other necessary measures in advance.
· The repair method might not be able to completely repair the VM. If the damage is severe and cannot be repaired using ISO or related tools, professional disaster recovery tools might be needed for data recovery and rescue, such as Diskgenius and diskrec. If necessary, contact a professional data recovery company for assistance.
Preparation before repair
Backup of system disks
For a damaged system's hard drive, perform a full disk backup in advance as a best practice, in case one repair attempt fails and additional repair methods need to be attempted.
For a damaged hard drive, you can use dd or other backup tools to copy the disk and create a backup.
In virtualization systems, you can back up the VM image file and clone it to another storage pool. Alternatively, you can create a snapshot on the storage side for the disk data to prevent unexpected situations during repair.
Preparing the corresponding ISO system
For Linux systems, prepare a CentOS or Ubuntu ISO installation disk to facilitate repair of Linux system directories. For Windows systems, use the ISO file or disk with the same version as the damaged system.
| CAUTION: · As a best practice, use the same version or a newer version of the ISO to mount and repair the system. · During the repair process, it may be discovered that the file system format in the old version of the ISO is incompatible with the new version, leading to repair failure. |
Linux system repair steps
1. Mount the optical drive and configure the system to boot from the optical drive, and then restart the system.
In a virtual environment using CAS, mount the ISO file as the optical drive on the VM to be repaired. On the Edit VM page, set the boot sequence to prioritize booting from the optical drive.
2. Start the system and attempt to repair it on the terminal.
In a virtual environment, locate the IP address of the CVK used by the VM and the corresponding VNC port in the CAS interface. Use a VNC client installed on your PC to connect to the port. TightVNC is a recommended VNC client.
| NOTE: As a best practice, do not use a browser console because some browsers may require frequent clearing of the browser cache to open the corresponding page after a few operations. |
3. On the CentOS control interface, select Troubleshooting.
4. Select Rescue a CentOS System.
5. Select option 3 to enter the shell command prompt.
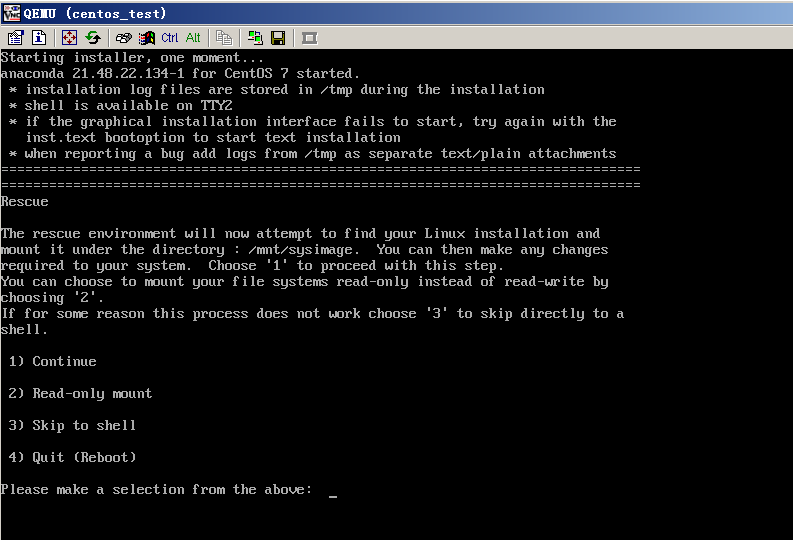
If an older version of the CentOS ISO is used, you can select the corresponding Skip button to enter the shell interface. The options for older CentOS versions include Continue, Read-only, Skip, and Advanced.
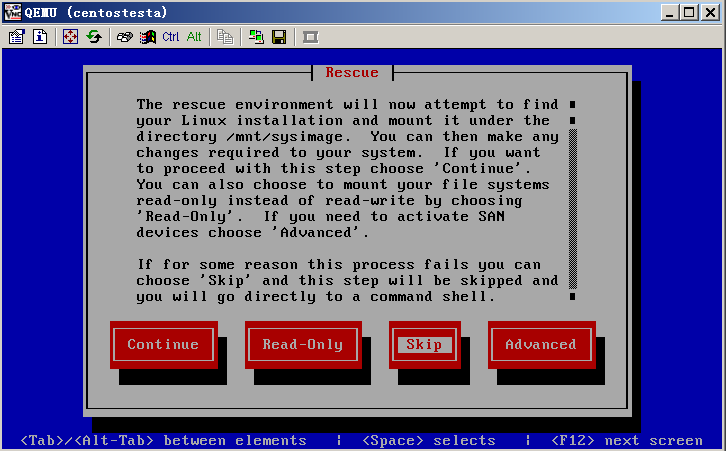
If using the Ubuntu ISO for repair, select Execute a shell in the installer environment.
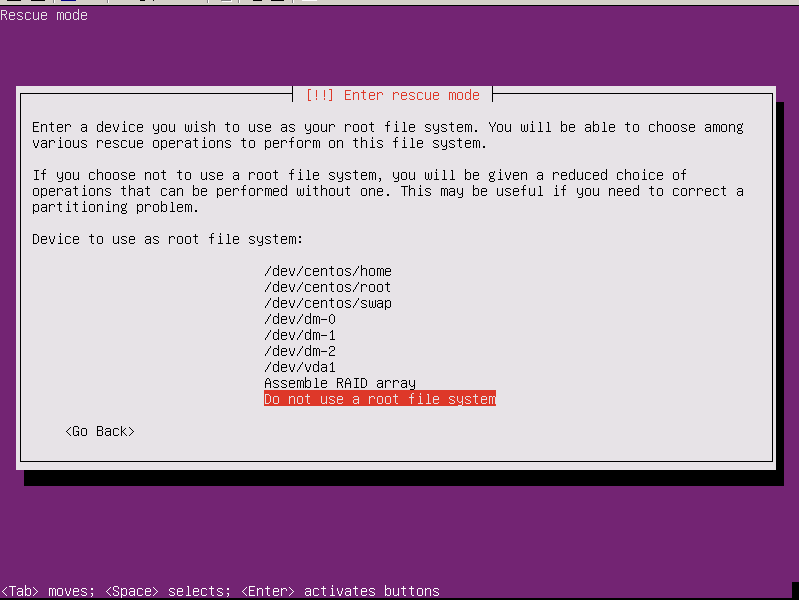
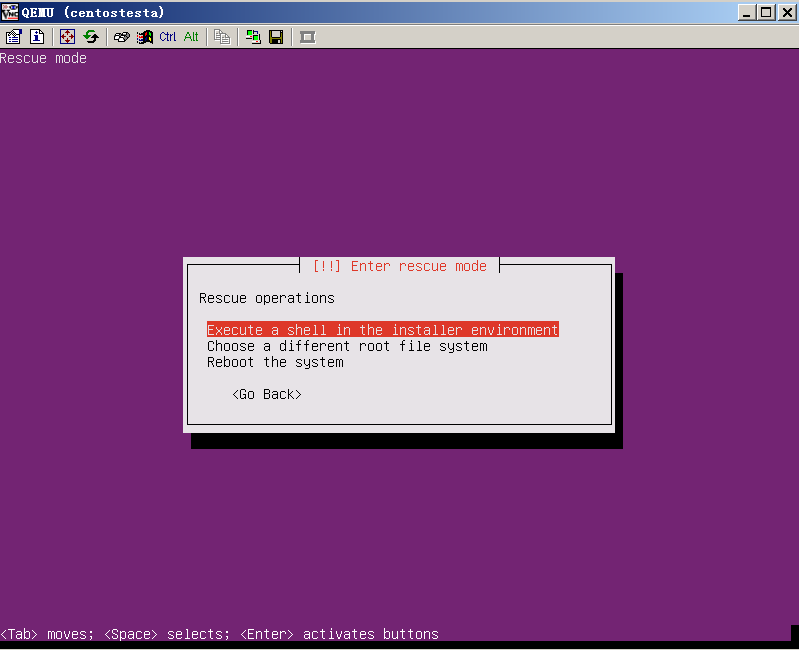
| CAUTION: · The Ubuntu 1804 ISO repair mode does not have the XFS related tools installed by default. As a best practice, use the latest version of CentOS for XFS repair. · Make sure to use the matching or updated version of the ISO. |
6. Use LVS to check if LVs are being used.
As shown in the following figure, 3 LVs are found, the swap does not need to be repaired, and the corresponding VG name is centos.
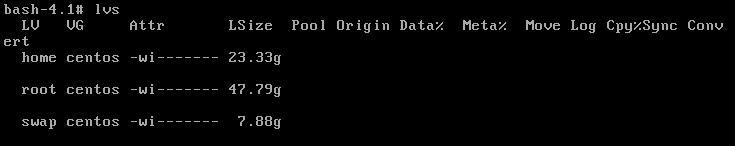
Use the lvchange -a y command to activate the corresponding LV to make it readable.
lvchange -a y centos/home
lvchange -a y centos/root
Check the file system on the corresponding LV. Different file systems require different repair commands. Use blkid /dev/centos/home to identify the file system.
blkid /dev/centos/home
| CAUTION: · Different installation systems might have different VGs (some are centos, while others are VolGroup01, etc.). Select the VGs appropriately based on the actual output content. · If the system does not use LVM, use blkid to identify the file system on the corresponding /dev/sdaX partition. |
7. Repair XFS.
xfs_repair /dev/centos/lv_root
If the repair fails, collect log information (if any) and contact Technical Support.
8. Repair Ext4.
fsck /dev/datavg/lv_data
You might be prompted to enter yes in the middle, please do so. The repair steps for other file systems are similar.
9. Shut down the VM by executing the init 0 command.
10. Unmount the ISO drive and fall back to booting from the hard disk, and then restart the system.
11. Upon reboot, verify that the system's operations are normal.
Windows repair operations and steps
Symptom
After a CAS upgrade, a Windows 2008 VM prompts for repair upon starting up. Selecting repair results in a loading screen freeze, while selecting normal startup results in a black screen.
Repair steps
1. Attach the disk to another working Windows VM.
If the object being repaired is a VM, you can mount the system disk image of the faulty VM onto a working Windows VM. Then, use the disk check tool provided by Windows to check and repair disk errors. Delete the system disk of the faulty VM via the Edit VM > Disk page with the Delete Hardware operation.
2. On the working VM, add the system disk of the faulty VM via the Add Hardware option.
3. Select the faulty VM image. At this point, the system disk of the faulty VM can be seen in the working system.
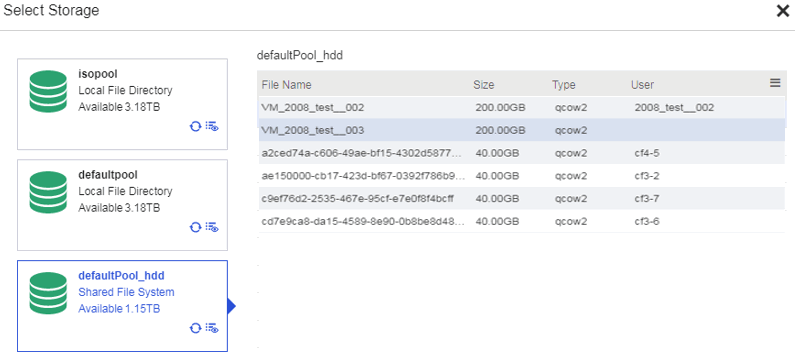

For Windows 2012, a similar process applies. Select Computer Management, select a disk to view its properties, and perform error checking.
4. After mounting the disk, an error message might appear. Click on the blue error area to proceed.
Alternatively, scan and repair the properties of both partitions.

| CAUTION: · For both the process of operation and the image files, please use original system ISO files. · In a virtualized environment, for qcow2 formatted files, multiple VMs cannot mount the same file at the same time. Therefore, one VM should unmount the file before another VM can mount the file for repair. A RAW format, preallocate set to zero format, or raw block format image can be mounted to multiple VMs simultaneously. |
5. If errors persist after repair, an ISO file needs to be mounted for further repair. Reattach the repaired disk to the faulty VM. A black screen error might appear, indicating boot failure or bootmgr missing.
6. Mount the system disk in the optical drive to repair the bootmgr. Change the boot order to booting from the optical drive. In Windows 2008, open Repair Computer and select the command prompt window.
7. Enter the command below to repair the bootmgr file. The machine should restart normally after the bootmgr is repaired.
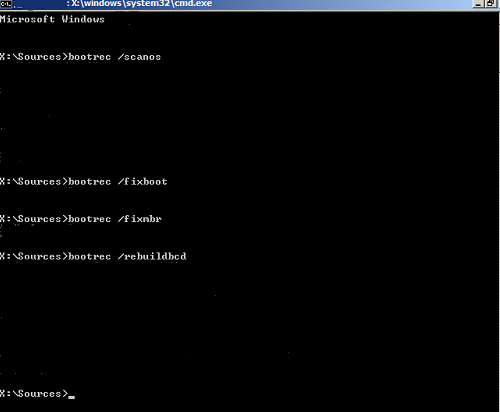
| CAUTION: · In a virtualization environment, select an IDE disk and mount the appropriate version of the ISO file. · If the system still reports errors after repair, such as antivirus software or application startup errors, the related software or program needs to be closed or uninstalled (modify the name so that it cannot be started) in a normally working Windows system. Try booting the system again and according to the specific error information, make corresponding adjustments and modifications. |
Space occupation issue
The stable operation of UIS depends on key partitions like the root partition and /var/log partition. When these partitions are full, some critical services might fail.
Space occupation issue due to manual operations
When the operator stores large files in the root partition or log partition, these partitions might be fully occupied. To resolve this issue:
1. Use du to identify the names of large files. For example, check the /var/log directory.
![]()
2. Confirm with the customer if the files are valid data.
3. Determine whether to move these files to another directory or delete them.
Space occupation issue due to software issues
Space occupation due to the large size of the /var/log/secure file
The space might be fully occupied because the size of the /var/log/secure file is too large as follows:
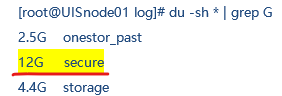
This issue is already known in versions earlier than UIS 6.5. The secure log compression mechanism is imperfect, which might the /var/log/secure file to become too large.
To resolve this issue temporarily, clear the secure file:
1. Access the /var/log/ directory.
2. Clear the secure file in the directory.
![]()
To resolve this issue permanently, upgrade UIS.
Space occupation due to /var/spool/postfix/maildrop/
The /var/spool/postfix/maildrop/ directory on the host records scheduled task execution logs. In early versions, these logs accumulate over time with the operation of the UIS hyper-converged environment. Then, the size of the /var/spool/postfix/maildrop/ directory increases, eventually occupying the full space of the root partition. To fundamentally resolve this issue, upgrade UIS to the most recent version.
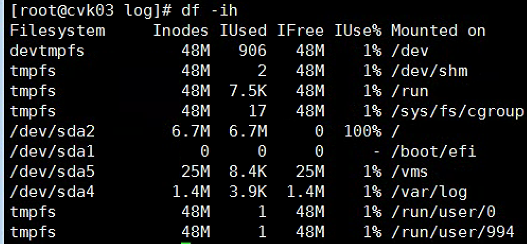
To resolve this issue temporarily:
1. Create an empty directory in the /var/log/ path, such as blkdir.
![]()
2. Delete the /var/spool/postfix/maildrop file.
![]()
| IMPORTANT: The deletion process might take several hours. This step is required on all nodes in the cluster with full root partitions. To ensure the deletion success, do not interrupt the deletion task. |
Log message exception
Message The maximum number of pending replies per connection has been reached generated
Symptom
The following message is generated in the /var/log/messages file on the host system:systemd-logind: Failed to start session scope session-c202601308.scope: The maximum number of pending replies per connection has been reached.
Solution
To resolve this issue:
1. Edit the org.freedesktop.NetworkManager.conf file in the /etc/dbus-1/system.d/ path. Before you edit this file, back up it as needed.
2. Increase the value for the max_replies_per_connection field in the configuration file, such as 10240.

3. Reboot the related services.
systemctl daemon-reexec
systemctl restart systemd-logind.service
Unified authentication issue
CAS authentication service exception
Symptom
After the CAS service is enabled, you cannot UIS due to CAS authentication failure or other issues.
Solution
1. SSH to the CLI console of CVM and execute the mysql –p uis command to access the MySQL console.
2. Execute MariaDB [uis]> update TBL_PARAMETER set VALUE='0' WHERE NAME='cas.sso.enable';.
3. Reboot the UIS service: service uis-core restart.
4. Log in to UIS through the browser again.
D-state process issue
Symptom
Due to storage issues or storage network failures, many processes appear in D state. This applicable to scenarios where the cluster only has block service deployed or uses external iSCSI storage.
Solution
| IMPORTANT: Execute the commands in this section based on the actual conditions instead of copying the directly. |
To resolve this issue:
1. Continuously stop the fsm_core.service and iscsi services, which requires two SSH windows.
¡ To stop fsm_core.service continuously: while true; do systemctl stop fsm_core.service; sleep 1; done
¡ To stop iscsi continuously: while true; do iscsiadm -m node -u; sleep 1; done
To terminate the execution of these two commands, press Ctrl + C, separately.
2. Disconnect the iscsi session: iscsiadm -m node -T IQN -u, where the IQN value is filled in as needed. For example:
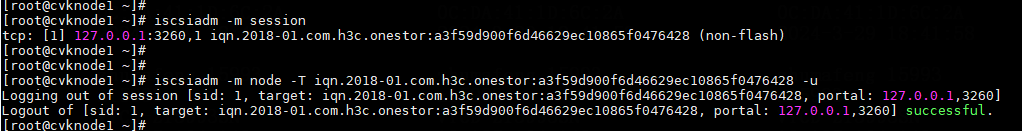
3. Stop the fsm_core service.
![]()
4. Observe for several minutes to identify whether the D-state processes disappear.
5. Reboot the fsm_core server after the D-state processes disappear.
![]()
| IMPORTANT: If you have executed while xxxxx commands, terminate those while commands first before performing this step. |
If this issue persists after you perform the above steps, use a maintenance window to stop the corresponding services on hosts, and then restart the host.
Commonly used commands
UIS Manager commands
HA commands
H3C UIS Manager provides HA features. The following are the commonly used HA commands.
All the following commands, except for the cha -k set-loglevel level command run on a node where UIS Manager is deployed. The cha -k set-loglevel level command runs on a CVK host.
Obtaining the clusters managed by the HA process
cha cluster-list
# Obtain the clusters managed by the HA process.
root@UIS-UISManager:~# cha cluster-list
------------------------------------------------------------
HA database info:
Cluster list:
cluster:1, name:Cluster
HA memory info:
Cluster list:
cluster ID: 1
Obtaining state statistics for a cluster
cha cluster-status cluster-id
# Obtain the hosts and VMs in a cluster.
root@UIS-UISManager:~# cha cluster-status 1
------------------------------------------------------------
HA database info:
Cluster 1 information:
Is HA enabled: 1
Cluster priority: 1
2 nodes configured
6 VM configured
host and vm list:
Host:UIS-CVK01, vm:windows2008
Host:UIS-CVK02, vm:win2008
Host:UIS-CVK02, vm:rhce-lab
Host:UIS-CVK02, vm:Linux-RedHat5.9
Host:UIS-CVK02, vm:fundation1
Host:UIS-CVK02, vm:win7
HA memory info:
Cluster 1, Least_host_number(MIN_HOST_NUM) is 1.
Obtaining information for hosts in a cluster
cha node-list cluster-id
# Obtain information for hosts and VMs in a cluster.
root@UIS-UISManager:~# cha node-list 1
------------------------------------------------------------
HA database info:
In cluster 1, node list :
host: UIS-CVK01, in cluster: 1, IP: 192.168.11.1
host: UIS-CVK02, in cluster: 1, IP: 192.168.11.2
HA memory info:
Cluster 1, Least_host_number(PermitNum) is 1. hosts list:
host: UIS-CVK02 ID: 4
host: UIS-CVK01 ID: 3
Total host num in this cluster is: 2
Obtaining information for a host in a cluster
cha node-status host-name
# Obtain information for a host in a cluster.
root@UIS-UISManager:~# cha node-status UIS-CVK01
------------------------------------------------------------
HA database info:
Node UIS-CVK01 :
in cluster: 1
ip address: 192.168.11.1
VM count: 1
HA memory info:
Host: UIS-CVK01, ID: 3, IP address: 192.168.11.1
status: CONNECT
heart beat num: 101
storage total num: 1
storage fail num: 0
heartbeat fail num: 0
recv packet: 1
host model(maintain): 0
time statmp: Fri Jan 30 15:34:04 2015
Storage info:
storage name:sharefile path:/vms/sharefile
storage status:STORAGE_NORMAL
time stamp:0
update flag:0
last send flag:0
fail num:0
Obtaining information for a VM on a host
cha vm-list host-name
# Obtain information for a VM on a host.
root@UIS-CVK03:~# cha vm-list UIS-CVK01
------------------------------------------------------------
HA database info:
1 vms in host UIS-CVK01 :
vm: windows2008 ID: 11 HA-managed: 1 Target-role: 1
Obtaining information for a VM in a cluster
cha vm-status vm-name
# Obtain information for a VM in a cluster.
root@UIS-CVK03:~# cha vm-status windows2008
------------------------------------------------------------
HA database info:
vm ID: 11 name: windows2008
at node ID: 3
target-role: 1
is-managed: 1
prority: 1
storage name: sharefile
storage psth: /vms/sharefile
Setting the log level
cha set-loglevel module level
Parameters:
· cmd|UIS managerd: Sets the log level for the cmd or UIS Manager process.
· level: Specifies the log level, including debug, info, trace, warning, error, and fatal.
# Set the log level.
root@UIS-UIS Manager:~# cha set-loglevel info
Setting the log level for a CVK host
cha -k set-loglevel level
Parameters:
level: Specifies the log level, including debug, info, trace, warning, error, and fatal.
# Set the log level for a CVK host.
root@UIS-CVK01:/vms/sharefile# cha -k set-loglevel debug
Set cvk log level success.
root@UIS-CVK01:/vms/sharefile#
vSwitch commands
The following are the basic commands for vSwitches in UIS Manager.
Obtaining the internal version number of the vSwitch
root@hz-cvknode2:~# ovs-vsctl -V
ovs-vsctl (Open vSwitch) 2.9.1
DB Schema 7.15.1
Displaying status of processes related to the vSwitch
Execute the ps aux | grep ovs command on a CVK host. ovs_workq is an OVS kernel process, and ovsdb-server and ovs-vswitchd represent a monitor process and service process, respectively.
root@UIS-CVK01:~# ps aux | grep ovs
root 2207 0.0 0.0 0 0 ? S Dec07 0:00 [ovs_workq]
root 3411 0.0 0.0 23228 772 ? Ss Dec07 6:44 ovsdb-server: monitoring pid 3412 (healthy)
root 3412 0.0 0.0 23888 2656 ? S Dec07 6:15 /usr/sbin/ovsdb-server /etc/openvswitch/conf.db --verbose=ANY:console:emer --verbose=ANY:syslog:err --log-file=/var/log/openvswitch/ovsdb-server.log --detach --no-chdir --pidfile --monitor --remote punix:/var/run/openvswitch/db.sock --remote db:Open_vSwitch,Open_vSwitch,manager_options --remote ptcp:6632 --private-key=db:Open_vSwitch,SSL,private_key --certificate=db:Open_vSwitch,SSL,certificate --bootstrap-ca-cert=db:Open_vSwitch,SSL,ca_cert
root 3421 0.0 0.0 23972 804 ? Ss Dec07 7:23 ovs-vswitchd: monitoring pid 3422 (healthy)
root 3422 0.4 0.0 1721128 9364 ? Sl Dec07 55:24 /usr/sbin/ovs-vswitchd --verbose=ANY:console:emer --verbose=ANY:syslog:err --log-file=/var/log/openvswitch/ovs-vswitchd.log --detach --no-chdir --pidfile --monitor unix:/var/run/openvswitch/db.sock
root 23503 0.0 0.0 8112 936 pts/10 S+ 10:43 0:00 grep --color=auto ovs
Restarting a vSwitch
root@UIS-CVK01:~# service openvswitch-switch restart
Adding a vSwitch
root@UIS-CVK01:~# ovs-vsctl add-br vswitch-app
After a vSwitch is added successfully, you can see the vSwitch on UIS Manager after connecting all hosts on UIS Manager.
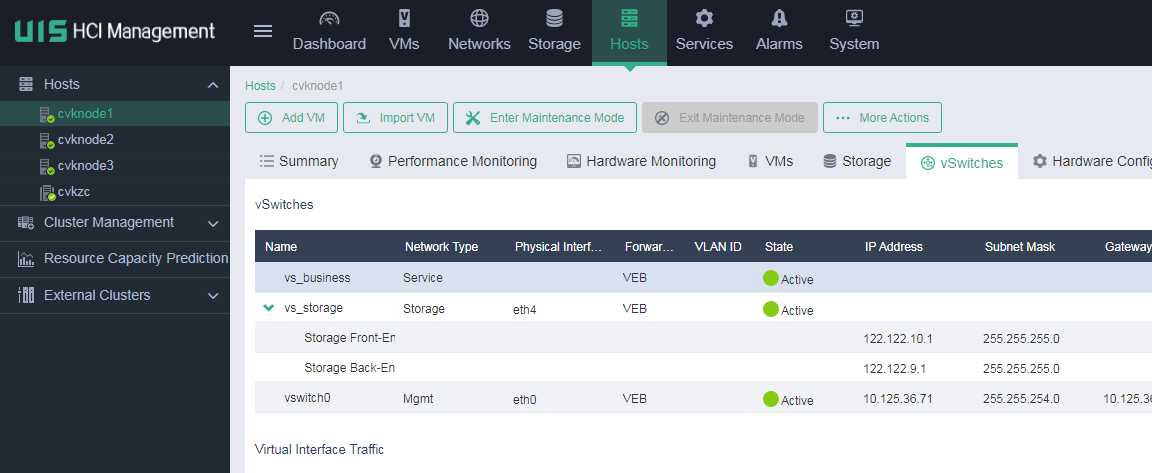
Deleting a vSwitch
root@UIS-CVK01:~# ovs-vsctl del-br vswitch-app
A vSwitch cannot be deleted from UIS Manager after it is deleted from the CVK host.
Adding a port for a vSwitch
root@UIS-CVK01:~# ovs-vsctl add-port vswitch-app eth2
Deleting a port from a vSwitch
root@UIS-CVK01:~# ovs-vsctl del-port vswitch-app eth2
The port on a vSwitch cannot be deleted from UIS Manager after it is deleted from the CVK host.
Displaying vSwitch and port information
vswitch0 is an internal port (or local port), eth0 is a physical port, and vnet0 is a vSwitch port.
root@UIS-CVK01:~# ovs-vsctl show
ba390c40-8826-4a7a-8e17-f8834dab6eb3
Bridge "vswitch0"
Port "eth0"
Interface "eth0"
Port "vswitch0"
Interface "vswitch0"
type: internal
Port "vnet0"
Interface "vnet0"
root@UIS-CVK01:~#
Displaying the configuration on a vSwitch
root@UIS-CVK01:~# ovs-vsctl list br vswitch0
_uuid : 3500114d-5619-460e-ada7-d1b97f63c93c
br_mode : 【0】
controller : 【】
datapath_id : "0000ac162d88c35c"
datapath_type : ""
drop_unknown_uniUISt: 【】
external_ids : {}
fail_mode : 【】
firewall_port : 【】
flood_vlans : 【】
flow_tables : {}
ipfix : 【】
mirrors : 【】
name : "vswitch0"
netflow : 【】
other_config : {}
ports : 【16a48463-f90b-42fe-9a12-ceacfd256235, 5495812e-29e0-4364-a89f-b54ea52dd344, dec98186-2c83-447d-9215-28f99750a410】
protocols : 【】
sflow : 【】
status : {}
stp_enable : false
Displaying port configuration
root@UIS-CVK01:~# ovs-vsctl list port vnet0
_uuid : bc0b1e57-2d72-4fae-97b4-0bbca5d17ba1
TOS : routine
bond_downdelay : 0
bond_fake_iface : false
bond_mode : []
bond_updelay : 0
dynamic_acl_enable : false
external_ids : {}
fake_bridge : false
interfaces : [5495133f-7e81-4047-a0bd-734fae81f6f3]
lacp : []
lan_acl_list : []
lan_addr : []
mac : []
name : "vnet0"
other_config : {}
qbg_mode : [4]
qos : []
statistics : {}
status : {}
tag : [4]
tcp_syn_forbid : false
trunks : []
vlan_mode : []
vm_ip : []
vm_mac : "0cda411dad80"
wan_acl_list : []
wan_addr : []
Displaying the port number for a port in user mode and kernel mode
root@UIS-CVK01:~# ovs-appctl dpif/show
system@ovs-system: hit:10133796 missed:181938
flows: cur: 11, avg: 12, max: 23, life span: 79639399ms
hourly avg: add rate: 26.506/min, del rate: 26.462/min
daily avg: add rate: 24.205/min, del rate: 24.210/min
overall avg: add rate: 24.356/min, del rate: 24.354/min
vswitch0: hit:6478229 missed:39021
eth0 1/5: (system)
vnet1 2/8: (system)
vswitch0 65534/6: (internal)
For example, the port number of ether0 is 2 in user mode (OpenFlow port number) and 5 in kernel mode.
Displaying the MAC addresses on a vSwitch
root@UIS-CVK01:~# ovs-appctl fdb/show vswitch0
port VLAN MAC Age
1 0 00:0f:e2:5a:6a:20 134
2 0 0c:da:41:1d:3d:18 95
1 0 ac:16:2d:6f:3f:4a 6
1 0 a0:d3:c1:f0:a6:ca 6
1 0 c4:ca:d9:d4:c2:ff 2
4 0 0c:da:41:1d:6d:94 2
LOCAL 0 2c:76:8a:5d:df:a2 2
3 0 0c:da:41:1d:80:03 0
Displaying port binding information on a vSwitch
root@UIS-CVK02:~# ovs-appctl bond/show
---- vswitch-bond_bond ----
bond_mode: active-backup
bond-hash-basis: 0
updelay: 0 ms
downdelay: 0 ms
lacp_status: off
slave eth2: enabled
active slave
may_enable: true
slave eth3: disabled
may_enable: false
Displaying flow entry information
root@UIS-CVK01:~# ovs-ofctl dump-flows vswitch0
NXST_FLOW reply (xid=0x4):
cookie=0x0, duration=752218.541s, table=0, n_packets=15106363, n_bytes=3556156038, idle_age=0, hard_age=65534, priority=0 actions=NORMAL
Displaying kernel flow entry information on a vSwitch
root@UIS-CVK01:~# ovs-appctl dpif/dump-flows vswitch0
skb_priority(0),in_port(5),eth(src=74:25:8a:36:d8:9b,dst=ff:ff:ff:ff:ff:ff),eth_type(0x0806),arp(sip=10.88.8.1/255.255.255.255,tip=10.88.8.206/255.255.255.255,op=1/0xff,sha=74:25:8a:36:d8:9b/00:00:00:00:00:00,tha=00:00:00:00:00:00/00:00:00:00:00:00), packets:2, bytes:120, used:3.018s, actions:6
skb_priority(0),in_port(5),eth(src=38:63:bb:b7:ed:6c,dst=01:00:5e:00:00:fc),eth_type(0x0800),ipv4(src=10.88.8.140/0.0.0.0,dst=224.0.0.252/0.0.0.0,proto=17/0,tos=0/0,ttl=1/0,frag=no/0xff), packets:1, bytes:66, used:1.139s, actions:6
skb_priority(0),in_port(5),eth(src=c4:34:6b:6c:ef:a8,dst=ff:ff:ff:ff:ff:ff),eth_type(0x0800),ipv4(src=10.88.8.200/0.0.0.0,dst=10.88.9.255/0.0.0.0,proto=17/0,tos=0/0,ttl=128/0,frag=no/0xff), packets:17, bytes:1564, used:3.370s, actions:6
skb_priority(0),in_port(5),eth(src=14:58:d0:b7:24:07,dst=ff:ff:ff:ff:ff:ff),eth_type(0x0800),ipv4(src=10.88.8.229/0.0.0.0,dst=10.88.9.255/0.0.0.0,proto=17/0,tos=0/0,ttl=64/0,frag=no/0xff), packets:6, bytes:692, used:0.771s, actions:6
skb_priority(0),in_port(5),eth(src=14:58:d0:b7:53:f6,dst=01:00:5e:7f:ff:fa),eth_type(0x0800),ipv4(src=10.88.8.146/0.0.0.0,dst=239.255.255.250/0.0.0.0,proto=17/0,tos=0/0,ttl=1/0,frag=no/0xff), packets:1, bytes:175, used:0.739s, actions:6
Displaying all kernel flow entries
root@UIS-CVK01:~# ovs-dpctl dump-flows
skb_priority(0),in_port(4),eth(src=c4:34:6b:6c:f5:ab,dst=ff:ff:ff:ff:ff:ff),eth_type(0x0800),ipv4(src=10.88.8.159/0.0.0.0,dst=10.88.9.255/0.0.0.0,proto=17/0,tos=0/0,ttl=128/0,frag=no/0xff), packets:25, bytes:2300, used:0.080s, actions:3
skb_priority(0),in_port(5),eth(src=14:58:d0:b7:53:f6,dst=33:33:00:01:00:02),eth_type(0x86dd),ipv6(src=fe80::288d:70d6:36ce:60f3/::,dst=ff02::1:2/::,label=0/0,proto=17/0,tclass=0/0,hlimit=1/0,frag=no/0xff), packets:0, bytes:0, used:never, actions:6
skb_priority(0),in_port(13),eth(src=0c:da:41:1d:80:03,dst=c4:ca:d9:d4:c2:ff),eth_type(0x0800),ipv4(src=192.168.2.15/255.255.255.255,dst=192.168.2.121/0.0.0.0,proto=6/0,tos=0/0,ttl=128/0,frag=no/0xff), packets:1, bytes:54, used:2.924s, actions:2
skb_priority(0),in_port(4),eth(src=c4:34:6b:68:9b:78,dst=33:33:00:00:00:02),eth_type(0x86dd),ipv6(src=fe80::85b7:25a0:d116:907a/::,dst=ff08::2/::,label=0/0,proto=17/0,tclass=0/0,hlimit=128/0,frag=no/0xff), packets:0, bytes:0, used:never, actions:3
skb_priority(0),in_port(4),eth(src=5c:dd:70:b0:39:3d,dst=ff:ff:ff:ff:ff:ff),eth_type(0x0806),arp(sip=192.168.11.149/255.255.255.255,tip=192.168.11.150/255.255.255.255,op=1/0xff,sha=5c:dd:70:b0:39:3d/00:00:00:00:00:00,tha=00:00:00:00:00:00/00:00:00:00:00:00), packets:1, bytes:60, used:0.264s, actions:3
Capturing packets on a port
Use tcpdump to capture packets on the port corresponding to the vSwitch: For more information about the tcpdump command, see "Networking."
tcpdump -i vnet1 -s 0 -w /tmp/test.pcap host 200.1.1.1 &
iSCSI commands
H3C UIS uses iSCSI to mount IP SAN storage devices. When an iSCSI shared file system has exceptions, you can use iSCSI commands for troubleshooting. To enable iser mode, add the -I iser option to the iscsiadm command.
Discovering iSCSI storage
iscsiadm -m discovery -t st -p ISCSI_IP or
iscsiadm -m discovery -t st -p ISCSI_IP –I iser (iser mode)
# Discover iSCSI sotorage.
root@HZ-UIS01-CVK01:~# iscsiadm -m discovery -t st -p 192.168.1.248:3260
192.168.1.248:3260,1 iqn.1991-05.com.microsoft:c09599-cmh-target
root@HZ-UIS01-CVK01:~#
Displaying iSCSI storage discovery records
iscsiadm -m node
# Display iSCSI storage discovery records.
root@HZ-UIS01-CVK01:~# iscsiadm -m node
192.168.1.248:3260,1 iqn.1991-05.com.microsoft:c09599-cmh-target
Deleting the iSCSI storage discovery records
iscsiadm -m node -o delete -T LUN_NAME -p ISCSI_IP
iscsiadm -m node -o delete -T LUN_NAME -p ISCSI_IP –I iser (iser mode)
# Delete the iSCSI storage discovery records.
# iscsiadm -m node -o delete -T iqn.1991-05.com.microsoft:c09599-cmh-target -p
192.168.1.248:3260
Logging in to an iSCSI storage device
iscsiadm -m node -T LUN_NAME -p ISCSI_IP –l or
iscsiadm -m node -T LUN_NAME -p ISCSI_IP –l –I iser (iser mode)
# Log in to an iSCSI storage device.
root@HZ-UIS01-CVK01:~# iscsiadm -m node -T iqn.1991-05.com.microsoft:c09599-cmh-target
-p 192.168.1.248:3260 -l
Logging in to 【iface: default, target: iqn.1991-05.com.microsoft:c09599-cmh-target, portal:
192.168.1.248,3260】
Login to 【iface: default, target: iqn.1991-05.com.microsoft:c09599-cmh-target, portal:
192.168.1.248,3260】: successful
Logging out of an iSCSI storage device
iscsiadm -m node -T LUN_NAME -p ISCSI_IP –u
iscsiadm -m node -T LUN_NAME -p ISCSI_IP –u –I iser (iser mode)
# Log out of an iSCSI storage device.
root@HZ-UIS01-CVK01:~# iscsiadm -m node -T iqn.1991-05.com.microsoft:c09599-cmh-target
-p 192.168.1.248:3260 -u
Logging out of session 【sid: 4, target: iqn.1991-05.com.microsoft:c09599-cmh-target, portal:
192.168.1.248,3260】
Logout of 【sid: 4, target: iqn.1991-05.com.microsoft:c09599-cmh-target, portal:
192.168.1.248,3260】: successful
Mounting FC storage
Obtaining the HBA card information
Method 1: Log in to the CVM system, access the storage management page, and then click a storage adapter to view HBA card information. If the card is in active state, storage access is available.
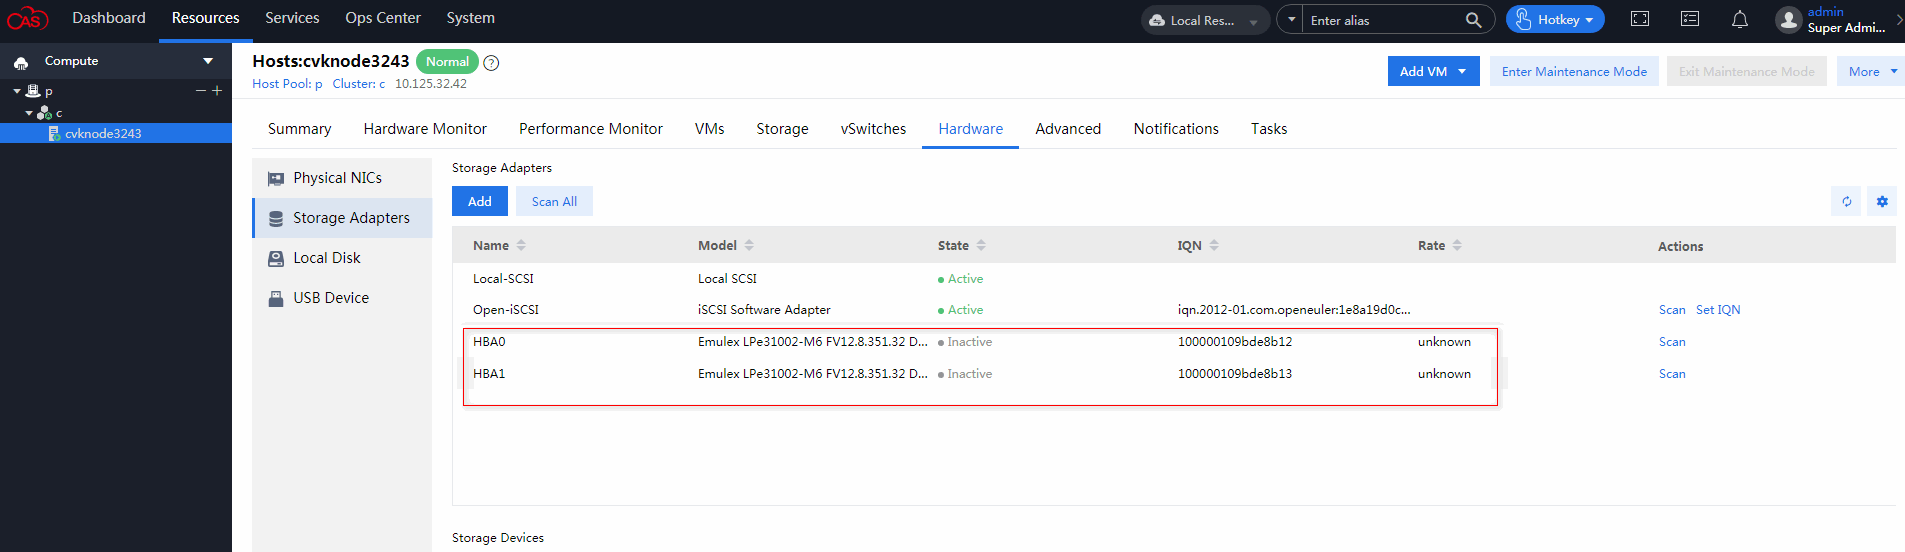
Method 2: Display driver information. If the driver is loaded correctly for the HBA card, HBA information will be displayed in the /sys/class/fc_host/host* directory.
[root@cvknode2-158 /]#ls /sys/class/fc_host/
host0 host2 host3 host4
[root@cvknode2-158 /]#ls /sys/class/fc_host/host0
device issue_lip npiv_vports_inuse port_state speed supported_classes system_hostname vport_create
dev_loss_tmo max_npiv_vports port_id port_type statistics supported_speeds tgtid_bind_type vport_delete
fabric_name node_name port_name power subsystem symbolic_name uevent
Connecting to the FC storage
Execute the following command:
echo hba_channel target_id target_lun > /sys/class/scsi_host/host*/scan
Hba_channel represents the HBA card channel, target_id represents the target ID, and target_lun represents the LUN. To obtain the information, execute the /sys/class/fc_transport/ command.
[root@cvknode2-158 /]#ls /sys/class/fc_transport/
target0:0:0
[root@cvknode2-158 /]# echo 0 0 0 > /sys/class/scsi_host/host0/scan
Disconnecting the FC storage
Execute the following command:
echo 1 > /sys/block/sdX/device/delete
sdX represents the SD corresponding to the FC storage device. To obtain the SD ID, execute the ll command.
[root@cvknode2-158 /]# ll /dev/disk/by-path
lrwxrwxrwx 1 root root 9 Oct 12 09:48 pci-0000:05:00.0-fc-0x21020002ac01e2d7-lun-0 -> ../../sdb
[root@cvknode2-158 /]# echo 1 > /sys/block/sdb/device/delete
Tomcat commands
H3C UIS Manager provides the Tomcat service. When an exception occurs, you can restart the Tomcat service.
To view the Tomcat status:
root@HZ-UIS01-CVK01:~# service tomcat8 status
* Tomcat servlet engine is running with pid 3362
To stop the Tomcat service:
root@HZ-UIS01-CVK01:~# service tomcat8 stop
* Stopping Tomcat servlet engine tomcat8
...done.
To start the Tomcat service:
root@HZ-UIS01-CVK01:~# service tomcat8 start
* Starting Tomcat servlet engine tomcat8
...done.
To restart the Tomcat service:
root@ HZ-UIS01-CVK01:~# service tomcat8 restart
* Stopping Tomcat servlet engine tomcat8
...done.
* Starting Tomcat servlet engine tomcat8
...done.
root@ HZ-UIS01-CVK01:~#
MySQL database commands
H3C UIS Manager uses MySQL to provide database service.
To view the MySQL service status:
root@HZ-UIS01-CVK01:~# service mysql status
mysql start/running, process 3039
To stop the MySQL service:
root@HZ-UIS01-CVK01:~#
root@HZ-UIS01-CVK01:~# service mysql stop
mysql stop/waiting
To start the MySQL service:
root@HZ-UIS01-CVK01:~# service mysql start
mysql start/running, process 4821
virsh commands
virsh commands allow you to obtain VMs attached to a CVK host and the VM status. In addition, you can start and shut down the VMs by using the commands.
Displaying the VM status from a CVK host
Execute the virsh list --all command to view the status of all VMs on the host.
root@UIS-CVK01:/vms# virsh list --all
Id Name State
----------------------------------------------------
4 windows2008 running
- Linux-RedHat5.9 shut off
Starting a VM from a CVK host
Execute the virsh start VM name command.
root@UIS-CVK01:/vms# virsh start Linux-RedHat5.9
Domain Linux-RedHat5.9 started
root@UIS-CVK01:/vms#
Shutting down a VM from a CVK host
Execute the virsh shutdown VM name command.
root@UIS-CVK01:/vms# virsh shutdown Linux-RedHat5.9
Domain Linux-RedHat5.9 is being shutdown
casserver commands
The casserver service collects statistics such as disk usage and alarm information. When an exception occurs on the casserver service, you can use the service casserver restart command to restart the casserver service:
qemu commands
Use qemu commands to display image file information and convert disk file formats.
Displaying image file information for a VM
On UIS Manager, you can view the image file path for a VM. The Storage Path field displays the path for the image file for the VM.
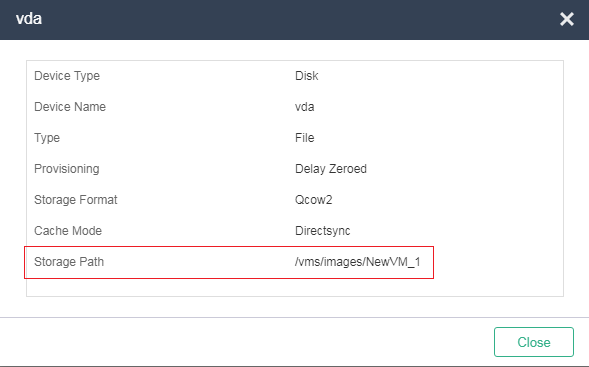
To display basic information for an image file, for example, file format, file size, and used file size, execute the qemu-img info command. For a three-level image file, the level-2 image file name will also be displayed.
root@ZJ-UIS-001:~# qemu-img info /vms/defaultShareFileSystem0/A_048
image: /vms/defaultShareFileSystem0/A_048
file format: qcow2
virtual size: 30G (32212254720 bytes)
disk size: 1.3G
cluster_size: 262144
backing file: /vms/defaultShareFileSystem0/A_048_base_1
backing file format: qcow2
Format specific information:
compat: 0.10
refcount bits: 16
If you display level-2 image file information, you can see information for the level-1 image file (base image file).
root@ZJ-UIS-001:~# qemu-img info /vms/defaultShareFileSystem0/A_048_base_1
image: /vms/defaultShareFileSystem0/A_048_base_1
file format: qcow2
virtual size: 30G (32212254720 bytes)
disk size: 1.0M
cluster_size: 262144
backing file: /vms/defaultShareFileSystem0/fio-cent-autorun_UIS-e0602fio-cent-autorun_UIS-e0602
backing file format: qcow2
Format specific information:
compat: 0.10
refcount bits: 16
If you display information for the base image file, you cannot see information for image files of other levels.
root@ZJ-UIS-001:~# qemu-img info /vms/defaultShareFileSystem0/fio-cent-autorun_UIS-e0602fio-cent-autorun_UIS-e0602
image: /vms/defaultShareFileSystem0/fio-cent-autorun_UIS-e0602fio-cent-autorun_UIS-e0602
file format: qcow2
virtual size: 30G (32212254720 bytes)
disk size: 5.5G
cluster_size: 262144
Format specific information:
compat: 1.1
lazy refcounts: false
refcount bits: 16
corrupt: false
Consolidating image files
If a VM uses a multi-level image file, you can use the qemu-img convert command to consolidate the image file.
root@UIS-CVK01:/vms/sharefile# qemu-img convert -O qcow2 -f qcow2 windows2008 windows2008-test
root@ZJ-UIS-001:/vms/defaultShareFileSystem0# qemu-img convert -O qcow2 -f qcow2 A_048 A048-test
The consolidated image file is not a multi-level image file.
root@ZJ-UIS-001:~# qemu-img info /vms/defaultShareFileSystem0/A048-test
image: /vms/defaultShareFileSystem0/A048-test
file format: qcow2
virtual size: 30G (32212254720 bytes)
disk size: 1.4G
cluster_size: 262144
Format specific information:
compat: 1.1
lazy refcounts: false
refcount bits: 16
corrupt: false
ONEStor commands
ONEStor commands are used to obtain the cluster status and status of monitors nodes, OSDs, and PGs.
· Mon (Monitor)—Monitor node in the cluster.
· OSD—Physical disks corresponding to the storage nodes.
· PG—Virtual node on the dashboard. A PG resides in a storage pool. Every time a storage pool is added, a number of PGs will be added in the cluster.
Obtaining the health status of a cluster
· ceph health detail
This command displays PGs in unclean, inconsistent, and degraded states. As shown in the following figure, if the cluster is in healthy state, the system displays HEALTH_OK.
![]()
If HEALTH_WARN is displayed, it indicates that the cluster is in warning state. The following figure shows that 1024 PGs are in degraded state, and 1024 PGs are in unclean state. This indicates that 33.333% PGs in the cluster are degraded, 1/3 OSDs are in down state, and the PGs on the down OSDs are in degraded state.
The following are the causes of this issue:
¡ A node is unreachable. Identify whether the service network and storage network are reachable.
¡ A node has failed. Use the ceph osd tree command to identify the node where the down OSDs reside and identify whether the node hardware and operating system are operating correctly.
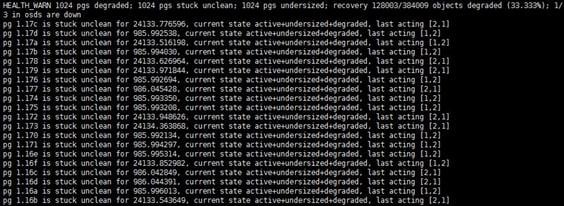
· ceph -s
To display the cluster status, use the ceph -s command.
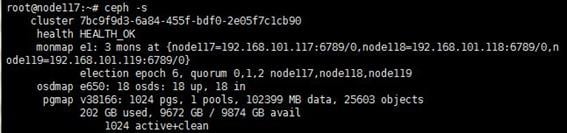
The output from the command is as follows:
¡ health
- HEALTH_OK—The cluster is in healthy state.
- HEALTH_WARN—Alarms have been triggered.
- HEALTH_ERR—A severe error such as data inconsistency has occurred in the cluster.
Typically, prompts related to PG and OSD abnormalities or time inconsistencies will appear in the health section.
¡ monmap—Number of monitors and the nodes where the monitors reside. As shown in the figure, the cluster contains three monitors, which reside in node 117, node 118, and node 119 respectively. The first monitor is the primary monitor.
¡ osdmap—Total number of OSDs, number of OSDs in up state, and number of OSDs in in state. As shown in the figure, all 18 OSDs in the cluster are in up and in states, which indicate they are all operating correctly.
¡ pgmap—Number of PGs, number of storage pools, space that a data replica is used, and total number of objects. This field also displays cluster usage information, including used capacity, free capacity, and total capacity. In addition, the PG state is displayed.
Error prompts:
¡ too many PGs per OSD—The error message will not be displayed if you add more OSDs or reduce the number of storage pools.
¡ clock skew detected—The system time is inconsistent on monitor nodes. Execute the ntpdate –u IP command to synchronize time from the primary NTP server. IP is the IP address of the primary NTP server. As shown in the following figure, six OSDs are in down state. The cluster puts the PGs corresponding to the OSDs in degraded state.
Execute the ceph -s command. The output shows that some PGs are abnormal, one monitor is down, 12 OSDs are up, and 18 OSDs are in in state. This indicates that node 118 might have an error or the service network is in abnormal state.
· ceph -w
To monitor a cluster, use the ceph -w command. The command continuously outputs information and can be terminated by pressing Ctrl+C. When the cluster's PG state is normal, the output from the ceph -w command is consistent with the output from the ceph -s command, as shown in the following figure.
To view cluster state changes, see the osdmap, pgmap, mon, and osd pgmap sections.
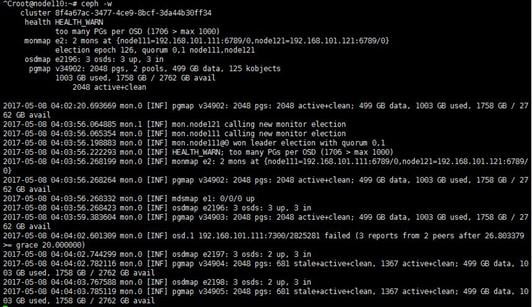
OSD commands
· ceph osd tree
To display the OSDs on each node and their positions in the CRUSH map, use the ceph osd tree command. This command helps maintain a large cluster. The following figure shows OSDs in normal state.

Use osd.1 as an example. The weight of the OSD is 0.89999, it is in rack 3, the host node is node 111, and the OSD is down and out state.
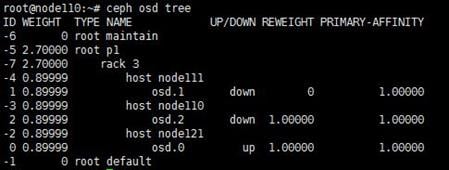
| IMPORTANT: The system marks the state of an OSD as down out five minutes after it state changes to down. · An OSD is in down/out state. A hard disk failure might occur. · The OSDs on the node are down. A node exception or network exception might occur. |
· ceph osd perf
To display the latency of an OSD, use the ceph osd perf command. If services are running, a latency of less than 100 ms is normal. When the cluster is idle, the latency is typically within 10 ms.
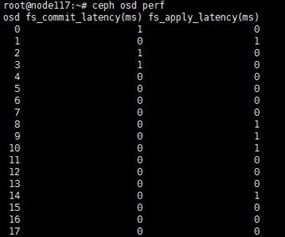
If the latency keeps higher than 10 ms when the cluster is idle, troubleshoot the issue. If the latency is higher than 100 ms when a large number of services are running, identify whether a network or hardware failure has occurred.
· ceph osd df
To display the disk usage, use the ceph osd df command. The command can display OSD statistics, such as OSD size, used capacity, available capacity, and usage. If the usage of an OSD is higher than 85%, the near full alarm is displayed on UIS Manager. If the usage of an OSD is higher than 5, the cluster is unavailable.
As shown in the following figure, the cluster contains three OSDs, each having a size of 920G, used capacity of 501G, and available capacity of 419G. The total capacity is 2762G, used capacity is 1505G, available capacity is 1257G, and usage of 54.48%.
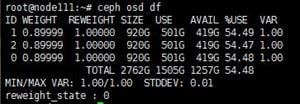
Obtaining the cluster usage statistics
ceph df
The command is used to obtain usage statistics for the cluster and storage pools. It displays the total capacity, remaining capacity, used capacity, and percentage of the cluster. In addition, it displays information about the storage pools, such as their names, IDs, usage status, and the number of objects in each storage pool.
For example, as shown in the figure below, the remaining capacity of the cluster is 1257G, the used capacity is 1505G, the usage is 54.48%, the used capacity by storage pool p1 is 499G, the usage is 54.29%, the available space is 419G, and the number of objects is 128003.
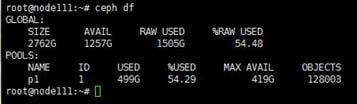
ONEStor commands
iostat
Use the iostat command to monitor system input/output (I/O) devices that are loaded and the length of time it takes for the system to process the I/O requests. This command is useful for analyzing whether there is a bottleneck in the IO process during the interaction between the process and the operating system. When executed without any parameters specified, this command displays statistical information from the time the system was started to the current time when the command was executed. The following figure shows the output from the iostat command.
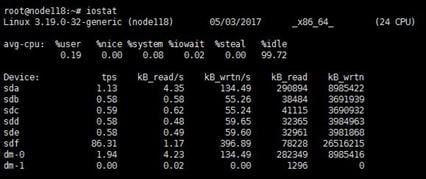
The following are the descriptions for the items:
· The first line displays the system version, host name, and date.
· avg-cpu—CPU usage statistics. For a multi-core CPU, this value is the average value of all cores.
· Device—IO statistics for each disk.
· CPU and disk IO statistics.
For the CPU statistics, the value for iowait is important. It indicates the percentage of time that the CPU was idle during which the system had pending disk I/O requests.
Disk names are displayed in the sdX format.
Item | Description |
tps | Number of IO read and write requests per second that were issued by the process. |
kB_read/s | The amount of data read from the device expressed in kilobytes per second. One sector has a size of 512 bytes. |
kB_wrtn/s | The amount of data written to the device expressed in kilobytes per second. |
kB_read | Total number of kilobytes read. |
kB_wrtn | Total number of kilobytes written. |
The iostat -x 1 command displays real-time IO device statistics. Specify the -x option when you analyze IO usage statistics.
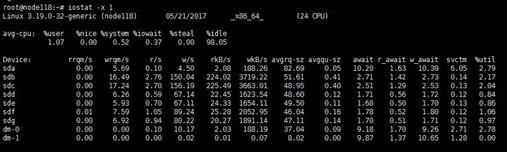
The iostat -x 1 command displays real-time information about the disk usage for a node. If the %util ratio of a single disk is high or close to 100%, a single disk might have an issue. If the overall disk %util ratio of the cluster is over 80% or close to 100%, the cluster's disk IO usage has reached its limit. In such a case, you can add more disks or reduce the services provided by the cluster.
The following are the descriptions for the items:
Item | Description |
rrqm/s | Number of read requests merged per second that were queued to the device. |
wrqm/s | Number of write requests merged per second that were queued to the device. |
r/s | Number of read requests completed per second for the device. |
w/s | Number of write requests completed per second for the device. |
rkB/s | Number of kilobytes read from the device per second. |
wkB/s | Number of kilobytes written to the device per second. |
avgrq-sz | Average size (in sectors) of the requests that were issued to the device. |
avgqu-sz | Average queue length of the requests that were issued to the device. |
await | Average time (in milliseconds) for I/O requests issued to the device to be served. The time includes the time spent by the requests in queue and the time spent servicing them. |
svctm | Average service time (in milliseconds) for I/O requests that were issued to the device. |
%util | Percentage of CPU time during which I/O requests were issued to the device. |
top
The top command provides real-time monitoring of resource usage for different processes in the system. This command can sort tasks based on CPU usage, memory usage, and execution time.
The following are the items that need to be focused on:
· Load average
· Tasks
· CPU usage
Sorting processes by CPU or memory usage can help identify which processes are causing system issues. To do this, press either the uppercase F or O key and choose either k or n when you execute the top command.
The following is the output from the top command.
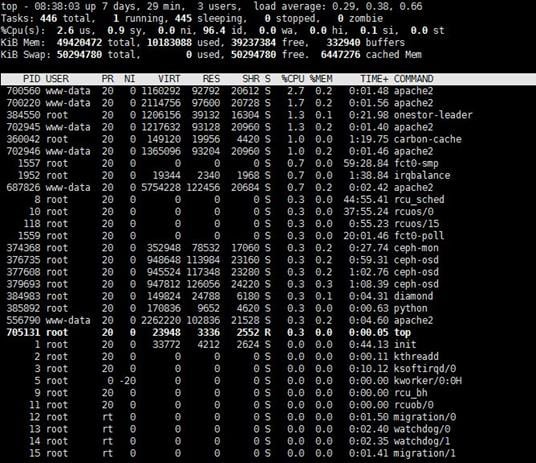
The following are the descriptions for the items:
· The first line is task queue information. This line shows the current time, system uptime, the number of currently logged-in users, and the system load, which is the average length of the task queue, displayed as three values for the past 1 minute, 5 minutes, and 15 minutes, respectively.
· The second and third lines display information about processes and CPUs. If multiple CPUs exist, these contents might exceed two lines. The content in memory is swapped out to the swap area, and then swapped back to memory, but the unused swap area has not been overwritten. This value is the size of the swap area that already exists in memory. When the corresponding memory is swapped out again, there is no need to write to the swap area again.
The area below system information displays detailed information for each process.
Item | Description |
PID | Process ID |
RUSER | Username of the owner of the process |
UID | User ID of the owner of the process |
USER | Username of the owner of the process |
VIRT | Total virtual memory used by the process. |
RES | The amount of actual physical memory a process is consuming in kb. |
SHR | Shared memory size (kb) used by the process. |
%MEM | Memory usage of the process. |
%CPU | CPU usage of the process. |
You can press the uppercase F or O key, and then press a-z to sort the processes according to the corresponding column. The uppercase R key can reverse the current sorting.
You can use the following commands during the execution of the top command.
Item | Description |
q /Ctrl+C | Quits the program. |
m | Displays memory information. |
t | Displays process and CPU information. |
c | Displays command name and complete command. |
M | Sorts processes by available memory. |
P | Sorts processes by CPU usage. |
T | Sorts processes by time/accumulated time. |
Other query commands
· lsblk
Use the lsblk command to view information about hard drive capacity, partition, usage, and mounting.
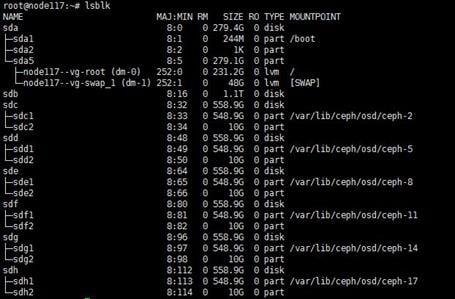
In the above figure, the NAME column lists all hard drives and partitions, SIZE displays the total capacity of the hard drive and partition size, TYPE displays the type of hard drive and partition, and MOUNTPOINT displays the file system mount point. The sda disk is the system disk with a size of 279.4G. Six hard disks with a size of 558.9G each are mounted as OSDs, and the size of the log partition is 10G.
· mount
Use the mount command to display all mounted file systems in a cluster and their types.
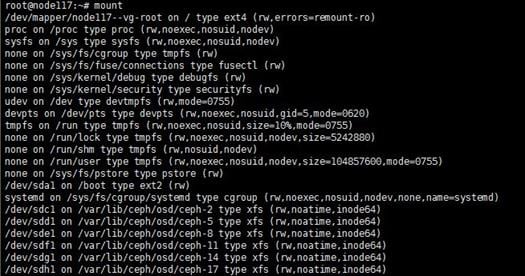
· df -h
Use the df -h command to list all mounted file systems, and display the total capacity, used capacity, available capacity, usage, and mount point for each mounted file system.
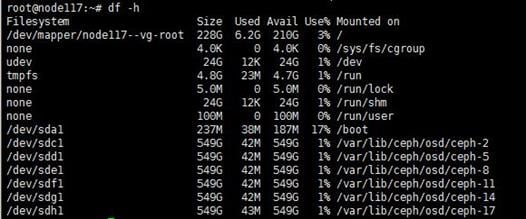
The output shows that 6 OSDs have been mounted, each with a capacity of 549G and a usage of 1%.
· fdisk -l
Use the fdisk -l command to display the hard drives, partitions, sizes, and usage of the nodes.
· free
Use the free command to display the total memory, used memory, buffer, cache, and swap usage of a node.
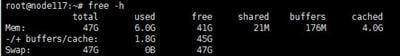
nvmof commands
Discovering NVMeoF storage
nvme discover -t rdma -a ISER_IP -s 4420
Logging in to NVMeoF storage
nvme connect -t rdma -n nqn.2010-05.com.macrosan:storage-1:50b34200-11f0-0052-5c6d-b5f32fe90761 -a ISER_IP -s 4420
Logging out of NVMeoF storage
nvme disconnect -n nqn.2010-05.com.macrosan:storage-1:50b34200-11f0-0052-5c6d-b5f32fe90761
Cloud-native engine container service commands
Run the commands on cloud-native engine component VMs.
Obtaining the running status of components in a cluster
Use the kubectl command to maintain a Kubernetes cluster. To display the running status or deployment status of components in the cluster, use the following command:
root@HZ-UIS01-CVK01:~# kubectl get pod -A
Item | Description |
NAMESPACE | Namespace to which the pod belongs. |
NAME | Pod Name |
READY | Current status, healthy containers/running containers. |
STATUS | Pod status, including Pending, Running, Succeeded, Failed, Unknown, and XXBackoff. |
RESTARTS | Number of restarts. |
AGE | Uptime. |
If a component is not in Running status, an exception has occurred.
Reviewing component logs
Cluster components run as pods in a Kubernetes cluster. To review the logs, use the following commands:
· Review all pod logs: kubectl logs (NAME) [-c CONTAINER]
Example: kubectl logs nginx
· Follow all pod logs: kubectl logs (NAME) [-c CONTAINER] –f
Example: kubectl logs nginx -f
· Review the most recent pod logs: kubectl logs (NAME) [-c CONTAINER] –tail=N
Example: kubectl logs nginx –tail=100
Restarting a cluster component
Cluster components run as pods in a Kubernetes cluster. To restart a component, use the kubectl delete pod [-n NAMESPACE] (NAME) command.
For example, to restart the abc container in the tke namespace, use the kubectl delete pod –n tke abc command.
Linux commands
vi
To create or edit a file in the Linux operating system, you must use commands such as vi and vim.
The Vi editor has two modes: Command and Insert.
The following uses the test.txt file as an example.
Executing the vi command
Enter the vi test.txt command in the command line window of Linux. If the test.text file already exists, you can use the vi command to edit its content. If the file does not exist, this command creates the file.
Entering Command mode
When you first open a file with Vi, you are in Command mode. The file does not contain any information.
In Command mode, you can use keyboard keys to navigate, delete, copy, paste except entering text.
Entering Insert mode
To enter Insert mode, press i, o, or a, as shown in the following figure.
Entering Insert mode
Enter the file content.
Returning to Command mode
To return to Command mode, press ESC.

Save & Exit
After you return to Command mode, enter a colon (:),and then execute the wq command to save the file and exit the vi editor.


To view the created file, execute the ls command.

Basic commands
Displaying the current directory
Use the pwd command to print the current working directory.
root@HZ-UIS01-CVK01:~# pwd
/root
Displaying file information
Use the ls command to display file information in the current directory.
# ls [-aAdfFhilnrRSt] directory name
Options and parameters:
-a: Lists all files including those that begin with .
-A: Lists all files except for . and ..
-d: Lists directory entries instead of contents
-h: when used with -l (long list), prints sizes in human readable format, for example GB, KB
-i: Prints the index number of each file
-r: Reverses order while sorting
-R: Lists all subdirectories recursively
-S: Displays entries sorted by file size
-t: Sorts by modification time
Example:
root@HZ-UIS01-UIS Manager:~# ls -al
total 44
drwx------ 5 root root 4096 May 23 15:33 .
drwxr-xr-x 24 root root 4096 May 13 09:47 ..
-rw------- 1 root root 847 Jan 1 12:35 .bash_history
-rw-r--r-- 1 root root 3106 Apr 19 2012 .bashrc
drwx------ 2 root root 4096 May 17 17:23 .cache
-rw-r--r-- 1 root root 8 May 23 15:33 UIS.conf
drwxr-xr-x 2 root root 4096 May 23 15:32 h3c
-rw-r--r-- 1 root root 140 Apr 19 2012 .profile
drwxr-xr-x 2 root root 4096 May 22 09:50 .ssh
-rw------- 1 root root 4962 May 23 15:33 .viminfo
Changing the working directory
Use the cd command to change the working directory.
.: The current directory.
..: One level up from the current directory.
-: Previous working directory
~: Home directory for the current user
For example, ~account represents the home directory for the account user.
Example:
root@HZ-UIS01-CVK01:/# cd ~root
# Enter the home directory for the root user.
root@HZ-UIS01-CVK01:~# cd ~
# Return to the home directory for the current user.
root@HZ-UIS01-CVK01:~# cd
# Return to the home directory for the current user.
root@HZ-UIS01-CVK01:~# cd ..
# Enter the directory one level up from the current directory.
root@HZ-UIS01-CVK01:/# cd -
# Return to the previous directory.
root@HZ-UIS01-CVK01:~# cd /root
# Enter the /root directory.
root@HZ-UIS01-CVK01:~# cd ../root
# Enter the root directory under the previous directory.
Creating a new directory
Use the mkdir (make directory) command to create a new directory.
# mkdir [-mp] directory name
Options and parameters:
-m: Sets access privilege.
-p: Adds a directory including its sub directory.
Example:
root@HZ-UIS01-UIS Manager:~# ls
root@HZ-UIS01-UIS Manager:~# mkdir h3c
root@HZ-UIS01-UIS Manager:~# ls
h3c
root@HZ-UIS01-UIS Manager:~#
Copying a file or directory
Use the cp (copy) command to copy a file or directory.
# cp [-adfilprsu] source destination
# cp [options] source1 source2 source3 .... destination directory
Options and parameters:
-a: Same as -pdr
-f: If any existing destination file can't be opened, delete it and attempt again
-i: Asks for confirmation before overwriting the destination file.
-p: Preserves the file attributes of the original file in the copy.
-r: Copies files recursively. All files and subdirectories in the specified source directory are copied to the destination.
If more than two source files exist, the last destination file must be a directory.
Example:
# Copy a file.
root@HZ-UIS01-UIS Manager:~# ls
UIS.conf
root@HZ-UIS01-UIS Manager:~# cp UIS.conf UIS.conf.bak
root@HZ-UIS01-UIS Manager:~# ls
UIS.conf UIS.conf.bak
root@HZ-UIS01-UIS Manager:~#
# Copy a directory.
root@HZ-UIS01-UIS Manager:~# ls
h3c
root@HZ-UIS01-UIS Manager:~# cp -rf h3c h3c.bak
root@HZ-UIS01-UIS Manager:~# ls
h3c h3c.bak
root@HZ-UIS01-UIS Manager:~#
Securely copying a file
scp (secure copy) allows you to securely copy files and directories between two locations. The protocol ensures the transmission of files is encrypted. It is a safer option for the cp (copy) command. If a disk on your server is read only system, you can use the scp command copy the files on that disk to a destination.
#scp [option] [source directory] [destination directory]
Options and parameters:
-1: Protocol 1 will be used.
-2: Protocol 2 will be used.
-4: Only IPv4 addresses will be used.
-6: Only IPv6 addresses will be used.
-B: Executes in batch mode, deactivating every query for user input.
-C: Enable compression. Compression will be activated, and transfer speed will be enhanced while copying with this option.
-p: Preserves file permissions, access time, and modifications while copying.
-q: Execute SCP in quiet mode. This option will not display the transfer process.
-r: Copies the directories and files recursively.
-v: Activates verbose mode. It will display the SCP command execution progress step-by-step on the terminal window. It is useful in debugging.
-c: Cipher. choose the cipher for the process of data encryption. This option is passed directly to SSH.
-F ssh_config: For SSH, describe a replacement configuration file. This option is passed directly to SSH.
-i identity_file: File through which to read the status for public key authentication. This option is passed directly to SSH.
-l limit: Restricts the bandwidth in Kbit/s.
-o ssh_option: Arranged options in the ssh_configure format to SSH.
-P port: Port to which to link.
-S program: Applies a specified function for encryption connection. This program must be able to understand the SSH(1) option.
Example:
root@HZ-UIS01-CVK01:~# scp UIS-E0218H06-Upgrade.tar.gz HZ-UIS01-CVK02:/root
UIS-E0218H06-Upgrade.tar.gz 100% 545MB 90.8MB/s 00:06
root@HZ-UIS01-CVK01:~#
Removing a file or directory
Use the rm (remove) command to remove a file or directory.
# rm [-fir] file or directory name
Options and parameters:
-f: Removes a directory forcefully.
-i: Removes a file interactively.
-r: Removes a directory recursively. Use this option with caution.
Example:
root@HZ-UIS01-UIS Manager:~# ls
h3c
root@HZ-UIS01-UIS Manager:~# rm -rf h3c
root@HZ-UIS01-UIS Manager:~# ls
root@HZ-UIS01-UIS Manager:~#
Moving files and directories or renaming a file or directory
Use the mv (move) command to move files and directories from one directory to another or rename a file or directory.
# mv [-fiu] source destination
# mv [options] source1 source2 source3 .... directory
Options and parameters:
-f: Overwrites the destination file or directory without asking for permission.
-i: Asks for permission to overwrite.
-u: Only moves those files that do not exist.
Example:
root@HZ-UIS01-UIS Manager:~# ls
UIS.conf
root@HZ-UIS01-UIS Manager:~# mv UIS.conf UIS.conf.bak
root@HZ-UIS01-UIS Manager:~# ls
UIS.conf.bak
root@HZ-UIS01-UIS Manager:~#
Creating an archive and extracting the archive files
# tar [-j|-z] [cv] [-f file name] filename... archive
# tar [-j|-z] [xv] [-f file name] [-C directory] extracting
Options and parameters:
-c: Creates the archive.
-t: Displays or lists files inside the archived file.
-x: Extracts archives. This option can be used together with the -C option.
The -c, -t, and -x option cannot be used in the same command.
-j: Filters archive tar files with the help of tbzip. As a best practice, use *.tar.bz2 as the archive name.
-z: A zip file and informs the tar command that makes a tar file with the help of gzip. As a best practice, use *.tar.gz as the archive name.
-v: Displays verbose information.
-f filename: Creates an archive along with the provided name of the file.
-C directory: Use this option to extract files in a specific directory.
Example:
# Create an archive.
root@HZ-UIS01-UIS Manager:~# ls
UIS.conf UIS.conf-01 UIS.conf-02
root@HZ-UIS01-UIS Manager:~# tar -czvf UIS.tar.gz UIS.conf*
UIS.conf
UIS.conf-01
UIS.conf-02
root@HZ-UIS01-UIS Manager:~# ls
UIS.conf UIS.conf-01 UIS.conf-02 UIS.tar.gz
# Extract the archive files.
root@HZ-UIS01-UIS Manager:~# ls
UIS.tar.gz
root@HZ-UIS01-UIS Manager:~# tar -xzvf UIS.tar.gz
UIS.conf
UIS.conf-01
UIS.conf-02
root@HZ-UIS01-UIS Manager:~# ls
UIS.conf UIS.conf-01 UIS.conf-02 UIS.tar.gz
System commands
Displaying the system kernel
# uname [-asrmpi]
Options and parameters:
-a: Displays all system information.
-s: Displays the system kernel name.
-r: Displays the kernel release.
-m: Displays the name of the machine’s hardware name, for example, i686 or x86_64.
-p: Displays the architecture of the CPU.
-i: Displays the hardware platform.(x86)
Example:
root@ZJ-UIS-001:~# uname -a
Linux ZJ-UIS-001 4.1.0-generic #1 SMP Wed Nov 9 02:04:23 CST 2016 x86_64 x86_64 x86_64 GNU/Linux
Displaying uptime of the system
Example:
root@HZ-UIS01-UIS Manager:~# uptime
17:54:04 up 3 days, 23:28, 1 user, load average: 0.08, 0.12, 0.13
Displaying system resource statistics
# vmstat [-a] [delay [total monitors]]
# vmstat [-fs]
# vmstat [-S unit]
# vmstat [-d]
# vmstat [-p partition]
Options and parameters:
-a: Displays active/inactive memory.
-f: Displays the number of forks since boot.
-s: Displays a table of various event counters and memory statistics.
-S: Followed by k or K or m or M switches outputs of bytes.
-d: Lists disk statistics.
-p: Followed by some partition name for detailed statistics.
Example:
root@HZ-UIS01-CVK01:~# vmstat 1 5
procs ---------------memory----------------- -----swap---- -----io---- ----system-- -----cpu--------
r b swpd free buff cache si so bi bo in cs us sy id wa
1 0 0 60402384 58716 1712736 0 0 15 6 87 116 1 0 98 0
0 0 0 60402500 58716 1712736 0 0 1 0 631 1051 0 0 100 0
0 0 0 60402608 58756 1712752 0 0 0 840 1444 1640 2 0 98 0
0 0 0 60403360 58756 1712760 0 0 2 33 991 1346 0 0 100 0
2 0 0 60400944 58780 1712784 0 0 0 60 2225 1682 0 0 99 0
Field description for Vm mode:
procs
· r: Number of processes waiting for run time.
· b: Number of processes in uninterruptible sleep.
memory
· swpd: The amount of virtual memory used.
· free: The amount of idle memory.
· buff: The amount of memory used as buffers.
· cache: The amount of memory used as cache.
swap
· si: The amount of memory swapped in from disk (/s).
·so: The amount of memory swapped to disk (/s).
If the values are large, data in the memory is swapped between disks and the primary adapter, which means the system has low efficiency.
· io
¡ bi: Blocks received from a block device (blocks/s).
¡ bo: Blocks sent to a block device (blocks/s). A larger value indicates that the system IO is busy.
system
· in: Number of interrupts per second, including the clock.
· cs: Number of context switches per second.
A larger value indicates more frequent communications between the system and devices such as disks, NICs, and clocks.
· CPU
¡ us: Time spent running non-kernel code.
¡ sy: Time spent running kernel code. (system time). id: Time spent idle.
¡ wa: Time spent waiting for IO.
¡ st: Time stolen from a VM. Supported in versions later than Linux 2.6.11.
Displaying the load on a device
Use the iostat command to display CPU and I/O usage statistics.
#iostat[parameter][time][count]
Options and parameters:
-c: Displays the CPU usage. It is mutually exclusive with the -d option.
-d: Displays the disk usage. It is mutually exclusive with the -c option.
-k: Displays statistics in kilobytes per second. The default unit is block.
-m: Displays statistics in megabytes per second.
-N: Displays logical volume mapping (LVM) statistics.
-n: Displays NFS statistics.
-p: Displays statistics for block devices and all their partitions used by the system. You can specify a device after this option, for example, # iostat -p /dev/sda. This option is mutually exclusive with the -x option.
-t: Prints the time for each report displayed.
-x: Displays detailed information.
-v: Displays version information.
Remarks:
· avg-cpu
¡ %user: Displays the percentage of CPU usage that occurred when executing at the user level.
¡ %nice: Displays the percentage of CPU usage that occurred when executing at the user level with nice priority.
¡ %user: Displays the percentage CPU usage that occurred when executing at the system (kernel) level.
¡ %steal: Displays the percentage of time spent in involuntary wait by the virtual CPU or CPUs when the hypervisor was servicing another virtual processor.
¡ %iowait: Displays the percentage of time the CPUs were idle during which the system had an outstanding disk I/O request.
¡ %idle: Displays the percentage of time the CPUs were idle.
· Device
¡ tps: Number of IO requests per second that were issued to the device.
¡ Blk_read /s: The amount of data read from the device expressed in blocks per second.
¡ Blk_wrtn/s: The amount of data written to the device expressed in blocks per second.
¡ Blk_read: Total number of blocks read.
¡ Blk_wrtn: Total number of blocks written.
| IMPORTANT: · If the value of %iowait is too high, the disk has IO issues. If the value of %idle is high, the CPUs are idle. · If the value of %idle is high but the system responds slowly, the CPUs might be waiting for memory allocation. You must increase the memory capacity. · If the value of %idle keeps lower than 10, the system has low CPU processing capabilities. |
iostat outputs:
· Blk_read: Total number of blocks read.
· Blk_wrtn: Total number of blocks written.
· kB_read/s: The amount of data read from the driver expressed in kilobytes per second.
· kB_wrtn/s: The amount of data written to the driver expressed in kilobytes per second.
· kB_read: Total number of kilobytes read.
· kB_wrtn: Total number of kilobytes written.
· rrqm/s: Number of read requests merged per second that were queued to the device.
· wrqm/s: Number of write requests merged per second that were queued to the device.
· r/s: Number of read requests completed per second for the device.
· w/s: Number of write requests completed per second for the device.
· rsec/s: Number of sectors read from the device per second.
· wsec/s: Number of sectors written to the device per second.
· rkB/s: The amount of data read from the device expressed in kilobytes per second.
· wkB/s: The amount of data written to the device expressed in kilobytes per second.
· avgrq-sz: Average size (in sectors) of the requests that were issued to the device.
· avgqu-sz: Average queue length of the requests that were issued to the device.
· await: Average time (in milliseconds) for I/O requests issued to the device to be served. This includes the time spent by the requests in queue and the time spent servicing them.
· svctm: Average service time (in milliseconds) for I/O requests that were issued to the device.
· %Util: Percentage of CPU time where I/O requests were issued to the device (bandwidth utilization for the device). Device saturation occurs when this value is close to 100%.
Example:
root@HZ-UIS01-CVK01:~# iostat
Linux 3.13.6 (HZ-UIS01-CVK01) 12/16/2015 _x86_64_ (24 CPU)
avg-cpu: %user %nice %system %iowait %steal %idle
20.48 0.00 3.48 0.23 0.00 75.80
Device: tps kB_read/s kB_wrtn/s kB_read kB_wrtn
sda 10.17 1.76 269.57 1309400 201017740
sdb 16.43 181.78 202.21 135552881 150792613
Execute the iostat -d -x -m /dev/sdb 1 5 command to display detailed information about /dev/sdb.
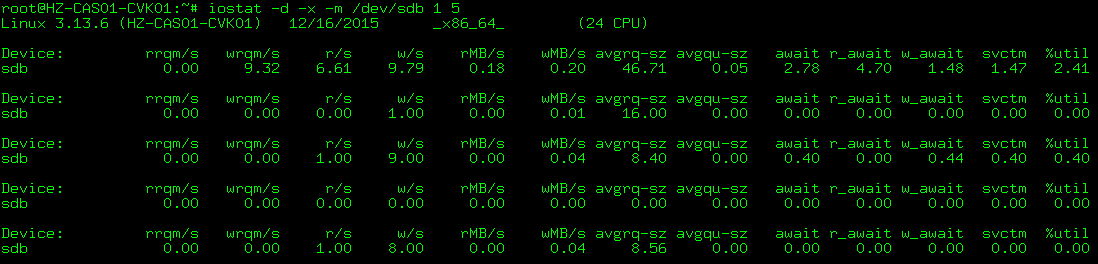
Testing the read and write performance for a disk
dd [option]
Options and parameters:
· if=file: Specifies the input file name. The default is standard input.
· of=file: Specifies the output file name. The default is standard output.
· ibs=bytes: Reads BYTES bytes at a time. One block is BYTES bytes.
· obs=bytes: Writes BYTES bytes at a time. One block is BYTES bytes.
· bs=bytes: Reads and writes BYTES bytes at a time. It can replace ibs and obs.
· cbs=bytes: Converts BYTES bytes at a time. It is the size of the conversion buffer.
· skip=blocks: Skips BLOCKS ibs-sized blocks at start of input.
· seek=blocks: Skips BLOCKS ibs-sized blocks at start of output. This option is valid only when the output file is a disk or tape.
· count=blocks: Copies only BLOCKS input blocks. The block size is the number of bytes specified by ibs.
· conv=ASCII: Converts EBCDIC to ASCII.
· conv=ebcdic: Converts ASCII to EBCDIC.
· conv=ibm: Converts ASCII to alternate EBCDIC.
· conv=block: Converts pad newline-terminated records with spaces to cbs-size.
· conv=ublock: Replaces trailing spaces in cbs-size records with newline.
· conv=uUISe: Converts lower-case letters to upper-case letters.
· conv=lUISe: Converts upper-case letters to lower-case letters.
· conv=notrunc: Does not truncate the output file.
· conv=swab: Swaps every pair of input bytes.
· conv=noerror: Continue after read errors.
· conv=sync: Pads every input block with NULLs to ibs-size; when used with block or unblock, pad with spaces rather than NULLs.
The specified numbers must be multiplied by their corresponding factors if they are followed by any of the following characters: b=512, c=1, k=1024, w=2, xm=number m, kB=1000, K=1024, MB=1000*1000, M=1024*1024, GB=1000*1000*1000, G=1024*1024*1024.
Displaying the free and used memory
free [-b|-k|-m|-g] [-t]
Options and parameters:
· -b: Displays output in Kbytes. The output can also be displayed in b(bytes), m(Mbytes), k(Kbytes), and g(Gbytes).
· -t: Displays summary for physical memory + swap space.
Example:
root@HZ-UIS01-CVK01:~# free
total used free shared buffers cached
Mem: 65939360 4208888 61730472 0 83224 277944
-/+ buffers/cache: 384772062091640
Swap: 10772220 0 10772220
User commands
Creating a user group
groupadd [-g gid] groupname
Options and parameters:
-g: Group ID.
Example:
root@HZ-UIS01-CVK01:~# groupadd -g 1000 it
root@HZ-UIS01-CVK01:/etc# more /etc/group | grep it
it:x:1000:
Deleting a user group
groupdel groupname
Example:
root@HZ-UIS01-CVK01:/etc# more /etc/group | grep it
it:x:1000:
root@HZ-UIS01-CVK01:/etc# groupdel it
root@HZ-UIS01-CVK01:/etc# more /etc/group | grep it
root@HZ-UIS01-CVK01:/etc#
Creating a user
useradd [-u UID] [-g initial_group] [-G supplementary group] [-m/M] [-d home_dir] [-s shell] username
Options and parameters:
· -u: User ID.
· -g: Initial group.
· -G: A list of supplementary groups which the user is also a member of.
· -M: The user home directory will not be created.
· -m: The user’s home directory will be created if it does not exist.
· -d: Specifies a directory as the home directory.
· -s: The name of the user’s login shell. If no login shell exists, the system selects the default login shell.
Example:
root@HZ-UIS01-CVK01:~# useradd -u 1000 -g it -m -d /home/it-user01 -s /bin/bash it-user01
root@HZ-UIS01-CVK01:~# more /etc/passwd | grep it-user01
it-user01:x:1000:1000::/home/it-user01:/bin/bash
root@HZ-UIS01-CVK01:~# ls /home/
it-user01
Deleting a user
userdel [-r] username
Options and parameters:
-r: Deletes files in the user’s home directory along with the home directory itself.
Example:
root@HZ-UIS01-CVK01:~# userdel -r it-user01
root@HZ-UIS01-CVK01:~# more /etc/passwd | grep it-user01
root@HZ-UIS01-CVK01:~# ls /home
root@HZ-UIS01-CVK01:~#
Setting the password
passwd [-l] [-u] [--sdtin] [-S] [-n days] [-x days] [-w days] [-i date] username
Options and parameters:
· -l: Locks the password.
· -u: Unlocks the password.
· -S: Displays password related parameters.
· -n: Sets the minimum number of days between password changes.
· -x: Sets the maximum number of days a password remains valid. After MAX_DAYS, the password must be changed.
· -w: Sets the number of days of warning before a password change is required.
· -i: Sets the day on which the password will expire.
Example:
root@HZ-UIS01-CVK01:~# more /etc/passwd | grep it-user01
it-user01:x:1000:1000::/home/it-user01:/bin/bash
root@HZ-UIS01-CVK01:~#
root@HZ-UIS01-CVK01:~# passwd it-user01
Enter new UNIX password:
Retype new UNIX password:
passwd: password updated successfully
Switching the user account
su [-lm] [-c command] [username]
Options and parameters:
· -: starts a new login shell as another username. If you do not add a username, you switch to the root user.
· -l: Similar as the - option except that you must specify the user account.
· -m: Preserves the current environment.
· -c: Passes a command to the shell.
Example:
root@HZ-UIS01-CVK01:~# su - it-user01
it-user01@HZ-UIS01-CVK01:~$ exit
logout
it-user01@HZ-UIS01-CVK01:~$ su - root
Password:
root@HZ-UIS01-CVK01:~#
File management commands
Changing the group ownership of a file or directory
chgrp [-R] group name directory/file
Options and parameters:
-R: Recursively changes the group of the directory and each file in the directory.
Example:
root@HZ-UIS01-CVK01:/home/it-user01# ls -l
total 4
drwxr-xr-x 2 it-user01 it 4096 May 30 15:44 testFile
root@HZ-UIS01-CVK01:/home/it-user01# chgrp root testFile
root@HZ-UIS01-CVK01:/home/it-user01# ls -l
total 4
drwxr-xr-x 2 it-user01 root 4096 May 30 15:44 testFile
Changing the file owner and group
chown [-R] user file or directory
chown [-R] user:group name file or directory
Options and parameters:
-R: Recursively changes the ownership of the directory and each file in the directory.
Example:
root@HZ-UIS01-CVK01:/home/it-user01# ls -l
total 4
drwxr-xr-x 2 it-user01 it 4096 May 30 15:44 testFile
root@HZ-UIS01-CVK01:/home/it-user01# chown root:root testFile
root@HZ-UIS01-CVK01:/home/it-user01# ls -l
total 4
drwxr-xr-x 2 root root 4096 May 30 15:44 testFile
root@HZ-UIS01-CVK01:/home/it-user01#
Changing file or directory mode bits or permissions.
chmod [-R] xyz file or directory
Options and parameters:
· xyz: File attribute in number, a sum of the values for r, w, and x.
· -R: Recursively changes file mode bits of the directory and the files in the directory.
Example:
root@HZ-UIS01-CVK01:/home/it-user01# ls -l
total 4
drwxr-xr-x 2 it-user01 it 4096 May 30 15:44 testFile
root@HZ-UIS01-CVK01:/home/it-user01# chmod 777 testFile
root@HZ-UIS01-CVK01:/home/it-user01# ls -l
total 4
drwxrwxrwx 2 it-user01 it 4096 May 30 15:44 testFile
root@HZ-UIS01-CVK01:/home/it-user01#
Process management commands
Displaying all running processes
top [-d number] | top [-bnp]
Options and parameters:
· -d: Specifies the delay between screen updates in seconds. The default value is 5 seconds.
· -b: Starts top in Batch mode, which is used to send output from top to a file.
· -n: Specifies the maximum number of iterations, or frames, top can produce before ending. This option is used together with the -b option.
· -p: Monitor only processes with specified process IDs.
You can use the following interactive commands during execution of the top:
· ?: Provides a reminder of all the basic interactive commands.
· P: Sorts by CPU usage.
· M: Sorts by memory usage.
· N: Sorts by PID.
· T: Sorts by CPU time used by processes.
· k: You will be prompted for a PID and then the signal to be sent.
· r: You will be prompted for a PID and then the value to nice it to.
· q: Quits top.
Example:
top - 17:40:48 up 2:13, 1 user, load average: 0.45, 0.55, 0.66
Tasks: 257 total, 1 running, 256 sleeping, 0 stopped, 0 zombie
Cpu(s): 0.6%us, 0.1%sy, 0.0%ni, 99.2%id, 0.0%wa, 0.0%hi, 0.0%si, 0.0%st
Mem: 65939360k total, 5703848k used, 60235512k free, 85832k buffers
Swap: 10772220k total, 0k used, 10772220k free, 1746992k cached
PID USER PR NI VIRT RES SHR S %CPU %MEM TIME+ COMMAND
4939 root 20 0 4583m 1.3g 4728 S 12 2.1 17:36.67 kvm
4874 root 20 0 4520m 908m 4576 S 5 1.4 11:54.61 kvm
4043 root 20 0 10.9g 402m 16m S 1 0.6 13:43.34 java
2370 root 20 0 23676 2168 1316 S 0 0.0 0:30.29 ovs-vswitchd
3184 root 20 0 15972 744 544 S 0 0.0 0:04.78 irqbalance
1 root 20 0 24456 2444 1344 S 0 0.0 0:04.07 init
2 root 20 0 0 0 0 S 0 0.0 0:00.00 kthreadd
3 root 20 0 0 0 0 S 0 0.0 0:00.07 ksoftirqd/0
6 root RT 0 0 0 0 S 0 0.0 0:00.00 migration/0
Output description:
· The first line displays the following:
¡ Current time and length of time since last boot
¡ Total number of users
¡ System load avg over the last 1, 5 and 15 minutes
A small value indicates that the system is idle. If the value is higher than 1, you must identify whether the system is too busy.
· The second line shows total tasks or threads. If the value for zombie is not 0, you must identify which process has become a zombie process.
· The third line shows the CPU state percentages. You must focus on the %wa parameter, which represents the time waiting for I/O completion. An IO issue can cause a system to respond slowly.
· The fourth and fifth lines show the physical and virtual memory statistics. If the virtual memory usage is high, the physical memory of the system is insufficient.
The lower section displays statistics for each process.
· PID: ID of the process.
· USEr: User of the process.
· PR: Priority of the process. A smaller value means the process has a higher execution priority.
· NI: Time running niced user processes. A smaller value means the process has a higher execution priority.
· %CPU: CPU usage.
· %MEM: Memory usage.
· TIME+: CPU time.
To view information about a process:
root@HZ-UIS01-CVK01:~# top -d 2 -p 4939
top - 08:59:13 up 17:31, 1 user, load average: 0.75, 0.70, 0.58
Tasks: 1 total, 0 running, 1 sleeping, 0 stopped, 0 zombie
Cpu(s): 0.1%us, 0.1%sy, 0.0%ni, 99.8%id, 0.0%wa, 0.0%hi, 0.0%si, 0.0%st
Mem: 65939360k total, 6484728k used, 59454632k free, 229880k buffers
Swap: 10772220k total, 0k used, 10772220k free, 1995728k cached
PID USER PR NI VIRT RES SHR S %CPU %MEM TIME+ COMMAND
4939 root 20 0 4583m 1.5g 4728 S 2 2.4 100:48.79 kvm
Returning the status of a process
ps aux
ps -lA
ps axjf
Options and parameters:
· -A: Displays information about all accessible processes on the system.
· -a: Displays information about all processes that are associated with terminals.
· -u: Displays information for processes with user IDs in the userlist.
· -x: Used together with the -a option to display complete information.
Output format:
· l: Displays BSD long format.
· j: BSD job control format.
· -f: Does full-format listing.
# Display bash processes.
root@HZ-UIS01-CVK01:~# ps -l
F S UID PID PPID C PRI NI ADDR SZ WCHAN TTY TIME CMD
4 R 0 11338 32857 0 80 0 - 2102 - pts/2 00:00:00 ps
4 S 0 32857 32797 0 80 0 - 5428 wait pts/2 00:00:00 bash
Using the ps -l command only lists programs related to the operating environment (bash). The parent program will be its own bash, which extends to the init process.
· F: Flags associated with the process.
¡ 4: used super-user privileges.
¡ 1: forked but didn't exec.
· S: Process state. R: Running. S: Sleep. D: Uninterruptible sleep (typically IO).
· T: Stop. Z: defunct zombie process, terminated but not reaped by its parent.
· UID/PID/PPID: Process ID.
· C: CPU usage.
· PRI/NI: Priority and Nice.
· ADDR/SZ/WCHAN: Memory related.
¡ ADDR: Location of the process in the memory. If it is Running, a hyphen (-) is displayed.
¡ SZ: size in physical pages of the core image of the process.
¡ WCHAN: Address of the kernel function where the process is sleeping.
· TTY: Controlling tty (terminal). For a remote login, pts/2 port is used.
· CMD: Command.
# Display all processes.
root@HZ-UIS01-CVK01:~# ps aux
USER PID %CPU %MEM VSZ RSS TTY STAT START TIME COMMAND
root 1 0.0 0.0 24572 2484 ? Ss 11:20 0:04 /sbin/init
root 2 0.0 0.0 0 0 ? S 11:20 0:00 [kthreadd]
root 3 0.0 0.0 0 0 ? S 11:20 0:00 [ksoftirqd/0]
root 6 0.0 0.0 0 0 ? S 11:20 0:00 [migration/0]
root 7 0.0 0.0 0 0 ? S 11:20 0:00 [watchdog/0]
root 8 0.0 0.0 0 0 ? S 11:20 0:00 [migration/1]
...
root 55719 1.0 0.0 71272 3520 ? Ss 17:42 0:00 sshd: root@pts/3
root 55752 8.6 0.0 21712 4204 pts/3 Ss 17:43 0:00 -bash
root 55927 0.0 0.0 16872 1284 pts/3 R+ 17:43 0:00 ps aux
root 62570 0.0 0.0 0 0 ? S 14:43 0:00 [kworker/7:2]
root 62840 0.0 0.0 0 0 ? S 16:40 0:00 [kworker/u:0]
# Display information about a process.
root@HZ-UIS01-CVK01:~# ps -fu mysql
UID PID PPID C STIME TTY TIME CMD
mysql 3144 1 0 11:21 ? 00:00:46 /usr/sbin/mysqld
Ending a process
kill -signal PID
The following are the signal types:
· 1 SIGHUP: Hangs up or disconnects a process. It's often used to restart a process or to update its configuration.
· 9 SIGKILL: Immediately terminates a process, without allowing it to clean up or save any data.
· 15 SIGTERM: Requests that the process terminate gracefully, allowing it to clean up any resources or save any data before exiting.
Networking
Configuring a network interface
# Display enabled network interfaces.
root@HZ-UIS01-CVK01:/etc/network# ifconfig
eth0 Link encap:Ethernet HWaddr 2C:76:8A:5B:3F:A0
UP BROADUIST MULTIUIST MTU:1500 Metric:1
RX packets:0 errors:0 dropped:0 overruns:0 frame:0
TX packets:0 errors:0 dropped:0 overruns:0 carrier:0
collisions:0 txqueuelen:1000
RX bytes:0 (0.0 b) TX bytes:0 (0.0 b)
Interrupt:26 Memory:f6000000-f67fffff
eth1 Link encap:Ethernet HWaddr 2C:76:8A:5B:3F:A4
UP BROADUIST MULTIUIST MTU:1500 Metric:1
RX packets:0 errors:0 dropped:0 overruns:0 frame:0
TX packets:0 errors:0 dropped:0 overruns:0 carrier:0
collisions:0 txqueuelen:1000
RX bytes:0 (0.0 b) TX bytes:0 (0.0 b)
Interrupt:28 Memory:f4800000-f4ffffff
...
The ifconfig -a command displays all network interfaces, including disabled network interfaces.
# Display information about a network interface.
root@HZ-UIS01-CVK01:/etc/network# ifconfig vswitch2
vswitch2 Link encap:Ethernet HWaddr 2C:76:8A:5D:DF:A0
inet addr:192.168.1.11 BUISt:192.168.1.255 Mask:255.255.255.0
inet6 addr: fe80::2e76:8aff:fe5d:dfa0/64 Scope:Link
UP BROADUIST RUNNING PROMISC MULTIUIST MTU:1500 Metric:1
RX packets:1134578 errors:0 dropped:7658 overruns:0 frame:0
TX packets:1013948 errors:0 dropped:0 overruns:0 carrier:0
collisions:0 txqueuelen:0
RX bytes:165047129 (157.4 Mb) TX bytes:111771007 (106.5 Mb)
# Shut down a network interface.
# ifconfig vswitch2 down
# Start a network interface.
# ifconfig vswitch2 up
# Configure a network interface (the configuration does not survive an interface or system restart).
# ifconfig vswitch2 192.168.2.12 netmask 255.255.255.0
# Restart a network interface.
# /etc/init.d/networking restart
To save the network interface configuration, use the vi editor to modify the /etc/network/interfaces configuration file.
Restart the network interface to have the change take effect.
auto vswitch2
iface vswitch2 inet static
address 192.168.1.11
netmask 255.255.255.0
network 192.168.1.0
broadUISt 192.168.1.255
gateway 192.168.1.254
# dns-* options are implemented by the resolvconf package, if installed
dns-nameservers 192.168.1.254
auto eth2
iface eth0 inet static
address 0.0.0.0
netmask 0.0.0.0
Displaying physical NIC information
root@UIS-CVK02:~# ethtool eth1
Settings for eth1:
Supported ports: [ TP ]
Supported link modes: 10baseT/Half 10baseT/Full
100baseT/Half 100baseT/Full
1000baseT/Half 1000baseT/Full
Supported pause frame use: No
Supports auto-negotiation: Yes
Advertised link modes: 10baseT/Half 10baseT/Full
100baseT/Half 100baseT/Full
1000baseT/Half 1000baseT/Full
Advertised pause frame use: Symmetric
Advertised auto-negotiation: Yes
Link partner advertised link modes: 10baseT/Half 10baseT/Full
100baseT/Half 100baseT/Full
1000baseT/Full
Link partner advertised pause frame use: No
Link partner advertised auto-negotiation: Yes
Speed: 1000Mb/s
Duplex: Full
Port: Twisted Pair
PHYAD: 1
Transceiver: internal
Auto-negotiation: on
MDI-X: on
Supports Wake-on: g
Wake-on: g
Current message level: 0x000000ff (255)
drv probe link timer ifdown ifup rx_err tx_err
Link detected: yes
Displaying network statistics
netstat -[atunlp]
Options and parameters:
· -a: Displays the state of all sockets and all routing table entries.
· -t: Lists TCP network packet data.
· -u: Lists UDP network packet data.
· -n: Displays network addresses as numbers.
· -l: Lists the services that are being listened to.
· -p: Displays process PID information for the service.
# Display network connection statistics for the service that uses port 8080.
root@HZ-UIS01-CVK01:/etc/network# netstat -an | grep 8080
tcp6 0 0 :::8080 :::* LISTEN
tcp6 0 0 192.168.1.11:8080 10.165.136.197:55954 ESTABLISHED
tcp6 0 0 192.168.1.11:8080 10.165.136.197:55989 TIME_WAIT
tcp6 0 0 192.168.1.11:8080 10.165.136.197:55990 FIN_WAIT2
tcp6 0 0 192.168.1.11:8080 192.168.1.211:53366 ESTABLISHED
tcp6 0 0 192.168.1.11:8080 192.168.1.211:54850 TIME_WAIT
# Display routing information for the system.
root@HZ-UIS01-CVK01:/etc/network# netstat -rn
Kernel IP routing table
Destination Gateway Genmask Flags MSS Window irtt Iface
0.0.0.0 192.168.1.254 0.0.0.0 UG 0 0 0 vswitch2
192.168.1.0 0.0.0.0 255.255.255.0 U 0 0 0 vswitch2
192.168.2.0 0.0.0.0 255.255.255.0 U 0 0 0 vswitch-storage
192.168.3.0 0.0.0.0 255.255.255.0 U 0 0 0 vswitch-app
Capturing packets on a network
tcpdump
Options and parameters:
· -a: Converts network and broadcast addresses to names.
· -d: Displays the matching packet code in a human readable form to standard output and stop.
· -dd: Displays the matching packet code in the format of a C program segment.
· -ddd: Displays the matching packet code in decimal format.
· e: Prints data link layer header information on the output line.
· -t: Does not print timestamps on each output line.
· -vv: Outputs detailed packet information.
· -c: Stops tcpdump after receiving the specified number of packets.
· -i: Specifies the network interface to listen on.
· -w: Directly writes packet to a file without analyzing or printing it.
Example:
tcpdump -i vswitch2 -s 0 -w /tmp/test.cap host 200.1.1.1 &
Displaying routing information
# Display routing information.
root@HZ-UIS01-CVK01:/etc/network# route -n
Kernel IP routing table
Destination Gateway Genmask Flags Metric Ref Use Iface
0.0.0.0 192.168.1.254 0.0.0.0 UG 100 0 0 vswitch2
192.168.1.0 0.0.0.0 255.255.255.0 U 0 0 0 vswitch2
192.168.2.0 0.0.0.0 255.255.255.0 U 0 0 0 vswitch-storage
192.168.3.0 0.0.0.0 255.255.255.0 U 0 0 0 vswitch-app
# Add static routing information to access the network at 10.10.10.0/24.
# route add -net 10.10.10.0 netmask 255.255.255.0 gw 192.168.2.254
root@HZ-UIS01-CVK01:/etc/network#
root@HZ-UIS01-CVK01:/etc/network# route -n
Kernel IP routing table
Destination Gateway Genmask Flags Metric Ref Use Iface
0.0.0.0 192.168.1.254 0.0.0.0 UG 100 0 0 vswitch2
10.10.10.0 192.168.2.254 255.255.255.0 UG 0 0 0 vswitch-storage
192.168.1.0 0.0.0.0 255.255.255.0 U 0 0 0 vswitch2
192.168.2.0 0.0.0.0 255.255.255.0 U 0 0 0 vswitch-storage
192.168.3.0 0.0.0.0 255.255.255.0 U 0 0 0 vswitch-app
# Delete routing information.
# route del -net 10.10.10.0 netmask 255.255.255.0 gw 192.168.2.254
root@HZ-UIS01-CVK01:/etc/network# route -n
Kernel IP routing table
Destination Gateway Genmask Flags Metric Ref Use Iface
0.0.0.0 192.168.1.254 0.0.0.0 UG 100 0 0 vswitch2
192.168.1.0 0.0.0.0 255.255.255.0 U 0 0 0 vswitch2
192.168.2.0 0.0.0.0 255.255.255.0 U 0 0 0 vswitch-storage
192.168.3.0 0.0.0.0 255.255.255.0 U 0 0 0 vswitch-app
The static routing information generated by executing the command is only saved in the system's memory. For the information to take effect permanently, add the command to the system startup script so it can be executed during the startup process.
Use the vi editor in the operating system of UIS Manager to edit the /etc/rc.local file.
Add routing commands in the file. Restart the system for the modification to take effect.
root@HZ-UIS01-CVK01:/etc/network# vi /etc/rc.local
#!/bin/sh -e
#
# rc.local
#
# This script is executed at the end of each multiuser runlevel.
# Make sure that the script will "" on success or any other
# value on error.
#
# In order to enable or disable this script just change the execution
# bits.
#
# By default this script does nothing.
route add -net 192.168.5.0 netmask 255.255.255.0 gw 192.168.2.254
ulimit -s 10240
ulimit -c 1024
touch /var/run/h3c_UIS_cvk
/usr/bin/set-printk-console 2
exit 0
Disk management commands
Displaying the disk capacity
df [-ahikHTm] [directory or file]
Options and parameters:
· -a: Lists all file systems, including system-specific file systems such as /proc.
· -k: Displays the capacity of each file system in KBytes.
· -m: Displays the capacity of each file system in MBytes.
· -h: Displays the capacity of each file system in a human readable format, such as GBytes, MBytes, and KBytes.
· -H: Uses M=1000K instead of M=1024K for displaying capacities in larger units.
· -T: Lists the file system name of each partition, such as ext3.
· -i: Displays the number of inodes instead of disk usage.
# Display the partition size.
root@HZ-UIS01-CVK01:/etc/network# df -h
Filesystem Size Used Avail Use% Mounted on
/dev/sda1 28G 2.4G 25G 9% /
udev 32G 4.0K 32G 1% /dev
tmpfs 13G 396K 13G 1% /run
none 5.0M 0 5.0M 0% /run/lock
none 32G 17M 32G 1% /run/shm
/dev/sda6 241G 48G 181G 21% /vms
# Display information about a file system with partitions.
root@HZ-UIS01-CVK01:/etc/network# df -Th
Filesystem Type Size Used Avail Use% Mounted on
/dev/sda1 ext4 28G 2.4G 25G 9% /
udev devtmpfs 32G 4.0K 32G 1% /dev
tmpfs tmpfs 13G 396K 13G 1% /run
none tmpfs 5.0M 0 5.0M 0% /run/lock
none tmpfs 32G 17M 32G 1% /run/shm
/dev/sda6 ext4 241G 48G 181G 21% /vms
Displaying the disk usage
du [-ahskm] file or directory name
Options and parameters:
· -a: Lists the capacity of all files or directories.
· -h: Displays the capacity of each file system in a human readable format, such as G/M.
· -s: Displays the total capacity.
· -S: Does not include statistics from subdirectories, which is slightly different from -s.
· -k: Displays the capacity in KBytes.
· -m: Displays the capacity in MBytes.
Example:
root@HZ-UIS01-CVK01:/vms# du -sh *
15G images
11G isos
16K lost+found
3.4G rhel-server-6.1-x86_64-dvd.iso
4.0K share
4.0K share-test
17G templet
4.0K test
Partitioning a disk
fdisk [-l] disk name
Options and parameters:
-l: Lists the partition tables for the specified disk.
If no disk is specified, the system lists all partitions of all disks in the system.
Example:
root@HZ-UIS01-CVK01:~# fdisk -l
Disk /dev/sda: 300.0 GB, 299966445568 bytes
255 heads, 63 sectors/track, 36468 cylinders, total 585871964 sectors
Units = sectors of 1 * 512 = 512 bytes
Sector size (logical/physical): 512 bytes / 512 bytes
I/O size (minimum/optimal): 262144 bytes / 262144 bytes
Disk identifier: 0x00051ce2
Device Boot Start End Blocks Id System
/dev/sda1 * 512 58593791 29296640 83 Linux
/dev/sda2 58594302 585871359 263638529 5 Extended
Partition 2 does not start on physical sector boundary.
/dev/sda5 58594304 80138751 10772224 82 Linux swap / Solaris
/dev/sda6 80139264 585871359 252866048 83 Linux
Disk /dev/sdb: 4294 MB, 4294967296 bytes
133 heads, 62 sectors/track, 1017 cylinders, total 8388608 sectors
Units = sectors of 1 * 512 = 512 bytes
Sector size (logical/physical): 512 bytes / 512 bytes
I/O size (minimum/optimal): 512 bytes / 512 bytes
Disk identifier: 0x00000000
Disk /dev/sdb doesn't contain a valid partition table
# Create a partition on a disk.
root@HZ-UIS01-CVK01:~# fdisk /dev/sdb
Device contains neither a valid DOS partition table, nor Sun, SGI or OSF disklabel
Building a new DOS disklabel with disk identifier 0xeb665aa3.
Changes will remain in memory only, until you decide to write them.
After that, of course, the previous content won't be recoverable.
Warning: invalid flag 0x0000 of partition table 4 will be corrected by w(rite)
Command (m for help): m
Command action
a toggle a bootable flag
b edit bsd disklabel
c toggle the dos compatibility flag
d delete a partition
l list known partition types
m print this menu
n add a new partition
o create a new empty DOS partition table
p print the partition table
q quit without saving changes
s create a new empty Sun disklabel
t change a partition's system id
u change display/entry units
v verify the partition table
w write table to disk and exit
x extra functionality (experts only)
Command (m for help): p
Disk /dev/sdb: 4294 MB, 4294967296 bytes
133 heads, 62 sectors/track, 1017 cylinders, total 8388608 sectors
Units = sectors of 1 * 512 = 512 bytes
Sector size (logical/physical): 512 bytes / 512 bytes
I/O size (minimum/optimal): 512 bytes / 512 bytes
Disk identifier: 0xeb665aa3
Device Boot Start End Blocks Id System
Command (m for help): n
Partition type:
p primary (0 primary, 0 extended, 4 free)
e extended
Select (default p): p
Partition number (1-4, default 1): 1
First sector (2048-8388607, default 2048)
Using default value 2048
Last sector, +sectors or +size{K,M,G} (2048-8388607, default 8388607): 4000000
Command (m for help): n
Partition type:
p primary (1 primary, 0 extended, 3 free)
e extended
Select (default p): p
Partition number (1-4, default 2): 2
First sector (4000001-8388607, default 4000001)
Using default value 4000001
Last sector, +sectors or +size{K,M,G} (4000001-8388607, default 8388607): +500M
Command (m for help): p
Disk /dev/sdb: 4294 MB, 4294967296 bytes
133 heads, 62 sectors/track, 1017 cylinders, total 8388608 sectors
Units = sectors of 1 * 512 = 512 bytes
Sector size (logical/physical): 512 bytes / 512 bytes
I/O size (minimum/optimal): 512 bytes / 512 bytes
Disk identifier: 0xeb665aa3
Device Boot Start End Blocks Id System
/dev/sdb1 2048 4000000 1998976+ 83 Linux
/dev/sdb2 4000001 5024000 512000 83 Linux
Command (m for help): w
The partition table has been altered!
Calling ioctl() to re-read partition table.
Syncing disks.
# Display disk partition information.
root@HZ-UIS01-CVK01:~# fdisk -l /dev/sdb
Disk /dev/sdb: 4294 MB, 4294967296 bytes
133 heads, 62 sectors/track, 1017 cylinders, total 8388608 sectors
Units = sectors of 1 * 512 = 512 bytes
Sector size (logical/physical): 512 bytes / 512 bytes
I/O size (minimum/optimal): 512 bytes / 512 bytes
Disk identifier: 0xeb665aa3
Device Boot Start End Blocks Id System
/dev/sdb1 2048 4000000 1998976+ 83 Linux
/dev/sdb2 4000001 5024000 512000 83 Linux
Making a file system
mkfs [-t file system format] disk name
Options and parameters:
-t: Specifies the file system type, for example, ext2, ext3, ext4, or ocfs2.
# Make an ex3 file system on /dev/sdb1.
root@HZ-UIS01-CVK01:~# mkfs -t ext3 /dev/sdb1
mke2fs 1.42 (29-Nov-2011)
Filesystem label=
OS type: Linux
Block size=4096 (log=2)
Fragment size=4096 (log=2)
Stride=0 blocks, Stripe width=0 blocks
125184 inodes, 499744 blocks
24987 blocks (5.00%) reserved for the super user
First data block=0
Maximum filesystem blocks=515899392
16 block groups
32768 blocks per group, 32768 fragments per group
7824 inodes per group
Superblock backups stored on blocks:
32768, 98304, 163840, 229376, 294912
Allocating group tables: done
Writing inode tables: done
Creating journal (8192 blocks): done
Writing superblocks and filesystem accounting information: done
root@HZ-UIS01-CVK01:~#
# Make an ocfs2 file system on /dev/sdb1.
root@HZ-UIS01-CVK01:~# mkfs -t ocfs2 /dev/sdb2
mkfs.ocfs2 1.6.3
Cluster stack: classic o2cb
Label:
Features: sparse backup-super unwritten inline-data strict-journal-super xattr
Block size: 1024 (10 bits)
Cluster size: 4096 (12 bits)
Volume size: 524288000 (128000 clusters) (512000 blocks)
Cluster groups: 17 (tail covers 5120 clusters, rest cover 7680 clusters)
Extent allocator size: 2097152 (1 groups)
Journal size: 16777216
Node slots: 2
Creating bitmaps: done
Initializing superblock: done
Writing system files: done
Writing superblock: done
Writing backup superblock: 0 block(s)
Formatting Journals: done
Growing extent allocator: done
Formatting slot map: done
Formatting quota files: done
Writing lost+found: done
mkfs.ocfs2 successful
root@HZ-UIS01-CVK01:~#
Checking a disk
fsck [-t file system format] [-ACay] disk name
Options and parameters:
· -t: Specifies the file system type. This option is typically not required, because the current Linux system automatically distinguishes file system types through the superblock.
· -A: Scans the necessary disks based on the content of /etc/fstab. This command is typically executed during the boot process.
· -a: Automatically repairs detected abnormal sectors, so you don't have to keep pressing y.
· -y: Similar to -a, but some file systems only support the -y parameter.
· -C: Enables a histogram to display the current progress during the check.
# Check the /dev/sdb1 partition.
root@HZ-UIS01-CVK01:~# fsck -C /dev/sdb1
fsck from util-linux 2.20.1
e2fsck 1.42 (29-Nov-2011)
/dev/sdb1: clean, 11/125184 files, 16807/499744 blocks
Mounting a file system
mount [-t file system type] [-L Lable name] [-o additional option] [-n] disk file name mount point
Options and parameters:
· -a: Mounts all file systems based on the data in the /etc/fstab configuration file.
· -l: Displays the column label name besides the mounting information.
· -t: Specifies the type of file system to be mounted.
· -n: By default, the system writes the actual mounting information to /etc/mtab in real time to facilitate operation of other programs.
· -L: Mounts the partition that has the specified label.
· -l: Add labels in the mount output, for example, account, password, or read privilege.
# Mount /dev/sdb1 to /mnt.
root@HZ-UIS01-CVK01:~# mount /dev/sdb1 /mnt
root@HZ-UIS01-CVK01:~# df -Th
Filesystem Type Size Used Avail Use% Mounted on
/dev/sda1 ext4 28G 5.7G 21G 22% /
udev devtmpfs 32G 4.0K 32G 1% /dev
tmpfs tmpfs 13G 408K 13G 1% /run
none tmpfs 5.0M 0 5.0M 0% /run/lock
none tmpfs 32G 17M 32G 1% /run/shm
/dev/sda6 ext4 241G 48G 181G 21% /vms
/dev/sdb1 ext3 1.9G 35M 1.8G 2% /mnt
Umounting a file system
umount [-fn] disk file name
Options and parameters:
· -f: Unmounts a file system forcibly. Use this parameter if no data can be read from a network file system (NFS).
· -n: Unmounts a file system without writing in the /etc/mtab directory.
Example:
root@HZ-UIS01-CVK01:~# df -Th
Filesystem Type Size Used Avail Use% Mounted on
/dev/sda1 ext4 28G 5.7G 21G 22% /
udev devtmpfs 32G 4.0K 32G 1% /dev
tmpfs tmpfs 13G 408K 13G 1% /run
none tmpfs 5.0M 0 5.0M 0% /run/lock
none tmpfs 32G 17M 32G 1% /run/shm
/dev/sda6 ext4 241G 48G 181G 21% /vms
/dev/sdb1 ext3 1.9G 35M 1.8G 2% /mnt
root@HZ-UIS01-CVK01:~#
root@HZ-UIS01-CVK01:~# umount /mnt
root@HZ-UIS01-CVK01:~# df -Th
Filesystem Type Size Used Avail Use% Mounted on
/dev/sda1 ext4 28G 5.7G 21G 22% /
udev devtmpfs 32G 4.0K 32G 1% /dev
tmpfs tmpfs 13G 408K 13G 1% /run
none tmpfs 5.0M 0 5.0M 0% /run/lock
none tmpfs 32G 17M 32G 1% /run/shm
/dev/sda6 ext4 241G 48G 181G 21% /vms
Writing data to a disk
Use the sync command to write data not updated in the memory to a disk.
Example:
root@HZ-UIS01-CVK01:~# sync
root@HZ-UIS01-CVK01:~#
