
- Released At: 09-09-2024
- Page Views:
- Downloads:
- Table of Contents
- Related Documents
-
|
|
|
H3C Workspace Cloud Desktop |
|
Maintenance Guide |
|
|
|
|
Document version: 5W101-20240905
Copyright © 2024 New H3C Technologies Co., Ltd. All rights reserved.
No part of this manual may be reproduced or transmitted in any form or by any means without prior written consent of New H3C Technologies Co., Ltd.
Except for the trademarks of New H3C Technologies Co., Ltd., any trademarks that may be mentioned in this document are the property of their respective owners.
The information in this document is subject to change without notice.
Restoring and rebuilding the system disk
Powering on and powering off Workspace
Using UPM policies in desktop pools for IDV/VOI client anonymous users
Enabling HugePages memory for the UCC endpoint in IDV mode
Multimedia, vGPU, protocol, peripheral, and agent logs
Storage locations for course VMs
Important components and maintenance methods
Versions earlier than E1012P10
Configuration and debugging methods
Component running status check
Troubleshooting common display issues
Troubleshooting peripheral issues
ONEStor PG inconsistent recovery method
Restrictions and guidelines for PG inconsistent recovery
GlusterFS split-brain clearance method
Detecting GlusterFS split-brain issues
Using GlusterFS built-in commands to resolve split-brain issues
Resolving split-brain through mounting
Guidelines for data backup before system re-installation
Modifying host network configuration (after initial deployment)
Changing the Space Console IP address (before initial deployment)
Changing the Controller IP for client connection
Changing the Controller IP address on the Agent
Replacing the Space Console certificate
Replacing the teacher endpoint and changing an endpoint classroom (in education scenario)
Changing an endpoint classroom
Replacing a GlusterFS drive (in education scenario)
Changing the topology type for GlusterFS storage
Changing the topology type by deleting the existing GlusterFS storage and creating a new one
Changing the topology type by scaling down and then scaling up the existing GlusterFS storage
Overview
H3C Space Console provides basic and advanced O&M tasks to reduce workload and cost, ease routine maintenance, and simplify the IT environment.
· Basic O&M tasks include dashboard, health check, virtualization information, report, and ONEStor monitoring report.
· Advanced O&M tasks include log management, alarm management, and routine maintenance functions such as host discovery, file distribution, message delivery, command issuing, and task configuration.
For detailed information about O&M procedures, see H3C Workspace Space Console User Manual.
O&M best practices
· Monitor the health status and resource usage of Space Console and perform health check regularly to detect software and hardware issues in the virtualization environment.
· Monitor compute, network, and storage resource distribution and host, VM, IP, VLAN, and storage resource utilization.
· Enable alarm notifications and follow the recommendations to resolve the reported issues. Add maintenance experiences for alarms to ease future maintenance work.
· Check and analyze logs regularly to detect potential risks. Download the log files and send them to the technical support team for troubleshooting.
Basic O&M
Dashboard
The dashboard displays the system health, service status, online desktops, desktop state, resource usage, and alarms. In addition, the dashboard provides quick access to common operations.
For more information, see the dashboard section in H3C Workspace Space Console User Manual.
Health check
Perform health check to check the resources in the system. This feature helps the administrator to learn the operating state and performance issues and any other risks that might negatively impact VM services. On detection of any exceptions, the system automatically provides recommended actions to help you maintain or restore system health. The system provides fast health check configuration in different scenarios, and allows you to customize health check items.
For more information, see the health check section in H3C Workspace Space Console User Manual.
Virtualization information
The system displays detailed virtualization information, including various parameters for clusters, hosts, and VMs in the system.
For more information, see the virtualization section in H3C Workspace Space Console User Manual.
Cluster information
You can view the following cluster information:
· Cluster summary information: Detailed cluster configuration (number of hosts, total CPU cores, total memory, local storage, VMs and VM density, and state of high availability, compute DRS, and storage DRS), resource usage (CPU, memory, and shared storage usage and allocation rate), top 10 hosts by CPU or memory usage, and top 10 VMs by CPU or memory usage.
· Cluster performance monitoring information: Average CPU usage, average memory usage, I/O throughput, and disk requests of hosts in the cluster.
· Information about hosts in the cluster: State, management IP, number of running VMs, total CPU cores, memory size, disk size, and CPU and memory usage of hosts in the cluster.
· Information about VMs in the cluster: Information about all VMs in the cluster, including the corresponding host, VM state, total CPU cores, memory space, CPU and memory usage, IP address, and operating system information.
For more information, see the cluster management section in H3C Workspace Space Console User Manual.
Host information
You can view the following host information:
· Host summary information: Detailed configuration of the host (host IP address, host state, host iLO interface address, host model, version, memory), resource usage (CPU allocation ratio, memory allocation ratio, memory usage), compute resource monitoring information, network throughput, Top 5 VMs by CPU or memory usage.
· Host hardware monitoring information: Host hardware monitoring information, including host summary information, processor information, memory information, temperature information, power supply information, and fan information.
· Host performance monitoring information: CPU usage, memory usage, I/O throughput, network throughput, disk requests, disk I/O latency, disk usage, and partition usage for a host.
· Information about VMs running on a host: Information about all VMs on a host, including VM state, total CPU cores, memory space, CPU usage, memory address, IP address, and operating system.
For more information, see the host management section in H3C Workspace Space Console User Manual.
VM information
You can view the following VM information:
· VM summary information: Basic VM information (operating system, version, disk capacity, host, VM state, VNC port number for remote VM access, creation time, most recent shutdown time), hardware information (CPU, memory, disk, network, optical drive, and floppy information), and CPU usage and memory usage.
· VM performance monitoring information: CPU usage, memory usage, I/O throughput, network throughput, disk I/O latency, disk requests, CPU usage, disk usage, connection quantity, and partition usage for a VM.
|
|
IMPORTANT: · As a best practice to accurately monitor the CPU and memory usage of a VM, install CAStools on VMs. Space Console can use the tool to obtain the accurate CPU usage and memory usage of VMs. · If CAStools is not installed, the system cannot obtain information about a VM in shutdown or suspended state. The disk usage and partition usage fields will be empty on the page. · During VM online migration, the CPU usage, memory usage, I/O throughput statistics, and network throughput statistics might be inaccurate. |
· VM process monitoring information: Information about running programs, processes, and services on a VM, including the process username, PID, process name, CPU usage, memory usage, and used memory size.
|
|
IMPORTANT: During VM online migration, the CPU usage and memory usage statistics of the VM process might be inaccurate. |
· VM backup history: Information about VM backup, including the creation time, backup mode, backup location, file size, and backup type of a VM backup file as well as the storage path of backup files.
· VM migration history: Detailed information about VM migration, including the source and destination hosts and storage pools, migration method, administrator, migration start time, and time consumption.
· VM console information: VM console information, including VM UUID, VM state, VNC port, MAC address, and IP address.
For more information, see the VM management section in H3C Workspace Space Console User Manual.
Reports
Monitoring statistics
This feature is available on the System > Reports > Monitor page. It typically includes desktop monitoring, process monitoring, host reports, VM reports, and TopN reports.
· Desktop monitoring—Display the statistics such as desktop usage, number of online desktops, desktop online duration, and desktop idle time.
· Process monitoring—Display the system process state, CPU usage, memory usage, and start/stop time.
· Host reports—Display the statistics such as CPU usage and memory usage statistics of host for a specified time period. You can set criteria to filter the statistics and save the results to the local disk.
· VM reports—Display the statistics such as CPU usage and memory usage statistics of a VM for a specified time period. You can set criteria to filter the statistics and save the results to the local disk.
· Top N reports—Display hosts or VMs with the highest resource usage such as CPU or memory usage for a specified time period. You can set criteria to filter the statistics and save the results to the local disk.
For more information, see the monitoring section of report management in H3C Workspace Space Console User Manual.
Connection statistics
This feature is available on the System > Reports > Users page. It typically includes connection statistics, login statistics, online statistics, and static desktop statistics.
· Connection statistics—Display the statistics about user connection records and desktop connection duration.
· Login statistics—Display the statistics about login records and authentication duration.
· Online statistics—Display the statistics about the number of online users and the online durations of users. For the online users, you can view the number of online users and online gateway users during each time period of the day. For the online durations, you can view online durations of users (including gateway users) matching certain criteria within the specified time span.
· Static desktop statistics—Display information about all static desktops assigned to users, including desktop information statistics and desktop resource statistics.
For more information, see the users section of report management in H3C Workspace Space Console User Manual.
Usage statistics
This feature is available on the System > Reports > Statistics page. It typically collects statistics for host resource usage, VM resource usage, storage resource usage, IP address assignment, VLAN assignment, peripheral accesses, virtual app usage, and software download from the app store. You can customize the report information, print the report data, and export the reports as a .pdf file or .excel file.
· Host resource usage statistics: Host information and resource usage information, including uptime, host model, CPU model, CPU usage, memory usage, and local disk size.
· VM resource usage statistics: VM host information and resource usage information, including host name, VM state, CPU usage, memory usage, total CPU cores, VM disk, and OS.
· Storage resource usage statistics: Storage resource statistics for host pools, clusters, and hosts, including the VM disk, network storage, and shared file system.
· IP address assignment statistics: IP addresses assigned to host pools, clusters, and hosts.
· VLAN assignment statistics: VLANs assigned to VMs.
· Peripheral monitoring statistics: Such as the desktop name, desktop IP address, endpoint type, endpoint IP address, mapping state, and running state. You can also configure the retention period for peripheral monitoring statistics.
· Virtual app statistics: Such as the login name, endpoint type, application name, endpoint IP address, and endpoint MAC address. You can also configure the retention period for virtual app statistics.
· App upload statistics: App installation and usage statistics in the app store, such as the number of download times and desktop information for each application.
For more information, see the statistics section of report management in H3C Workspace Space Console User Manual.
ONEStor monitoring reports
This feature is available on the ONEStor page. It typically includes cluster summary information, cluster monitoring report, host monitoring report, and disk monitoring report.
· Cluster summary information: Summary information about the cluster, including cluster capacity, health state, and cluster IOPS/OPS.
· Cluster monitoring report: Displays running information about the cluster, including IOPS, OPS, bandwidth, traffic, capacity, CPU usage, memory usage, disk latency, and load.
· Disk pool monitoring report: Displays running information about the disk pool, including IOPS, bandwidth, and, capacity
· Storage pool monitoring report: Displays running information about the storage pool, including IOPS and bandwidth.
· Storage volume monitoring report: Displays running information about the volume, including IOPS, bandwidth, latency, and average I/O size.
· Host monitoring report: Displays running information about a host, including data disk IOPS, read/write bandwidth, capacity, read/write latency, file OPS, read/write bandwidth, CPU usage, memory usage, and Tx/Rx traffic.
· Disk monitoring report: Displays disk rank by usage, and disk usage statistics and charts.
For more information, see the cluster summary and monitoring charts sections of ONEStor management in H3C Workspace Space Console User Manual.
Advanced O&M
Managing logs
This feature is available on the Monitor Reports > Logs page. It typically includes system logs, administrator operation logs, user operation logs, and screen monitoring logs.
· System logs: Include host logs, desktop logs, and endpoint logs.
¡ Host logs: Allow you to collect and download log files of the management and service nodes (such as cloud desktop, visualization, and storage) on Space Console. By default, logs of management nodes are collected. To collect logs of service nodes, select hosts in the service node list. You can download the collected log files to a local file.
¡ Cloud desktop logs: Record logs related to VMs and collected by the agent. You can view, regularly clear, delete, or download cloud desktop logs.
¡ Endpoint logs: Record the operations performed by the user on the endpoint. You can view, regularly clear, delete, or download endpoint logs
· Administrator operation logs: Include host logs, desktop logs, and endpoint logs.
¡ Cloud desktop logs: Record the operations performed by the administrator on the cloud desktops, including desktop authorization, user management, system settings, and course management. You can filter, clear, and collect cloud desktop logs.
¡ Virtualization logs: Record the operations performed by the administrator on the VMs, including VM actions, host actions, and storage actions. You can filter, clear, and download virtualization logs.
¡ Cluster host logs: Record the operation performed by the administrator on the cluster hosts, including host action, storage action, platform action, and system settings. You can filter, clear, and download cluster host logs.
¡ Storage logs: Record the actions performed by the administrator on the ONEStor in the hyper-converged deployment scenario.
· User operation logs: Record operations performed by the user on the cloud desktop, including logging in to the client, disconnecting, rebooting, shutting down, snapshotting, and cloud desktop renaming in the office scenario and class taking and dismissing, self-study, endpoint deployment in the education scenario. You can filter, clear, and export user operation logs.
· Screen monitoring logs: If you enable screen monitoring policies, the recording operation by a cloud desktop user will be monitored and recorded. You can configure the screen recording server, and view and download screen monitoring log entries.
For more information, see the log management section in H3C Workspace Space Console User Manual.
Managing alarms
This feature is available on the Monitor Reports > Alarms page. It typically collects statistics of real-time alarms, VIP desktop alarms, gateway alarms, and endpoint alarms. In addition, it allows you to configure alarm threshold, ignored alarm, and alarm notification settings. To ensure the stable operation of the system, you can use alarms to detect and resolve issues that affect the system running state.
· Real-time alarms: View, acknowledge, or delete the real-time alarms. The real-time alarms page displays real-time alarms in chronological order and refreshes every 10 seconds by default.
· Real-time alarms: View or delete VIP desktop alarms, or configure VIP desktop policies.
· Gateway alarms: View and delete gateway alarms, and configure gateway alarm policies. Gateway alarms only support detecting connectivity between Space Console and internal ports of a gateway.
· Endpoint alarms: Configure the indexes that can trigger endpoint alarms. When the indexes of endpoints exceed the specified thresholds, the system generates corresponding endpoint alarms. You can view the endpoint alarms in the alarm list.
· Alarm threshold configuration: An alarm threshold defines the minimum value of the specified indicator that triggers an alarm. You can set CPU usage, memory usage, and disk usage alarm thresholds for hosts, VMs, and clusters, and set disk throughput and network throughput alarm thresholds for hosts and VMs. Alarm threshold management enables you to view the predefined alarm thresholds and configure the alarm server, alarm thresholds, and alarming state.
· Alarm notification configuration: Enable the system to send email notifications or SMS notifications for alarms to the users.
For more information, see the alarm management section in H3C Workspace Space Console User Manual.
Common operations
Discovering hosts
This feature allows you to discover the hosts installed with Space Console and add them to the system. This function is applicable to scenarios for system capacity expansion. Space Console automatically scans hosts that are reachable at Layer 2 network, and any extra network settings and management settings are not required.
For more information, see the host discovery section in H3C Workspace Space Console User Manual.
File distribution
This feature allows you to bulk distribute files to cloud desktops. If the user is online on a cloud host that is operating correctly, the cloud host receives files after a file distribution task is created. If the user is offline on a cloud host that is operating correctly or a cloud host is shut down, the cloud host receives the files after the user comes online and the operating system is loaded. The recipient cloud desktops automatically create directories to save the received files.
For more information, see the file distribution section (office scenario) in H3C Workspace Space Console User Manual.
Troubleshooting file distribution
1. Perform ping operations to verify the network connectivity between the VMs and Space Console.
2. Check the Space Console service state by executing the systemctl status smb.service command at the management node backend.
If the system prompts that the Space Console service runs correctly, the network connectivity might be lost.
3. Check the connectivity to port 445 on Space Console by using the tcping program.
If port 445 is disabled, enable that port.
Software deployment
This feature allows you to bulk install and upgrade software on VDI desktops without deleting desktop data.
For more information, see H3C Workspace Cloud Desktop Software Deployment Configuration Guide.
Message delivery
This feature allows you to send messages to cloud desktops. Administrators can use this feature to notify cloud desktops of user O&M information.
For more information, see the message delivery (office scenario) section in H3C Workspace Space Console User Manual.
Issuing commands
This feature allows you to issue a command or command attachment to desktops or endpoints for remote management and maintenance.
For more information, see the command issuing section in H3C Workspace Space Console User Manual.
Configuring tasks
This feature allows you to configure scheduled tasks for desktop pools VMs, endpoints, and classrooms, which is suitable for services that do not need to run all the time. This feature not only ensures the availability of services in a specified time period, but also timely releases resources to improve the system resource usage. The following types of tasks are supported:
· Desktop pool tasks—Include shutting down VMs, starting VMs, restarting VMs, restoring VMs in a manual desktop pool, creating snapshots, restoring snapshots, and deploying desktops.
· VM tasks—Include shutting down, starting, and restarting VMs, creating snapshots, and restoring snapshots.
· Endpoint tasks—Starting and shutting down endpoints, and clearing user data disks.
· Classroom tasks—Restoring classrooms, clearing user data disks, and clearing self-study VMs.
For more information, see the scheduled task section in H3C Workspace Space Console User Manual.
Restoring and rebuilding the system disk
System disk restoration and rebuilding mechanism
System disk rebuilding is to update or restore the system disk of a cloud desktop. The main process of rebuilding a desktop system disk is as follows:
1. Deploy a temporary desktop based on the selected image.
2. After the deployment is completed, uninstall the system disk of the temporary desktop.
3. Uninstall the system disk of the original desktop.
4. Mount the uninstalled system disk of the temporary desktop onto the original desktop.
5. Restore the desktop network configuration.
System disk restoration and rebuilding have no distinctions in essence. System disk restoration can be understood as a special type of system disk update. The difference between system disk restoration and rebuilding lies in the selection of the desktop image, which is associated with the desktop pool where the desktop is currently located.
Troubleshooting operation failures
1. After understanding the process of system disk rebuilding, if the task fails, you can identify the failure reason by checking the operation logs. You can identify which specific process has failed based on the rebuilding process.
2. The most common failure reason is operating system version inconsistency, which leads to the failure of system disk update.
3. The selected desktop image for update is incorrectly created, resulting in various abnormalities after the update.
4. During the system disk update process, the desktop will be set to maintenance mode. At this time, do not disable the maintenance mode on the management platform.
Powering on and powering off Workspace
For information about powering on and powering off Workspace, see H3C Workspace Cloud Desktop Shutdown and Startup Configuration Guide.
Using UPM policies in desktop pools for IDV/VOI client anonymous users
When you configure data management policies for IDV and VOI anonymous user desktop pools, the following restrictions apply:
· If you do not set a fixed account and password, you must create a local user Anonymous on Space Console and authorize the data management policy group to that user.
· If you set a non-special fixed account and password, you must create a local user with the same name on Space Console and authorize the data management policy group to that local user.
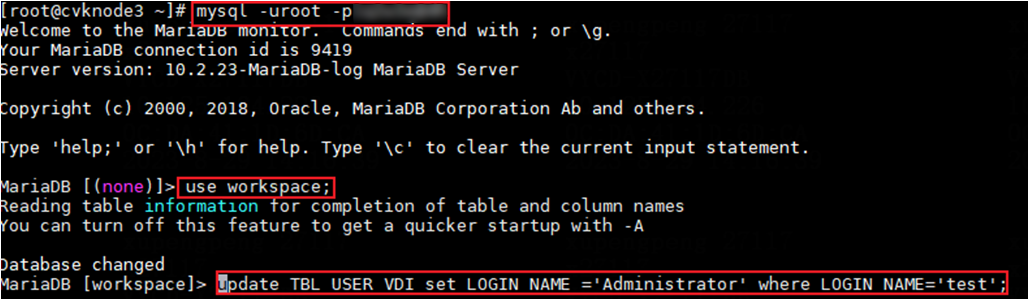
· If you set a special fixed account and password (such as Administrator), contact Technical Support to create local user Administrator in the database and authorize the data management policy group to that user. Modifying the database is a high-risk operation, so perform it under the guidance of a professional technician. The following describes how to create local user Administrator:
E1xxx versions
1. On Space Console, create a local user. This example creates user test.
2. Connect to the database server and use the root user to perform user authentication by using the following command where XXXX represents the database password and can be edited as needed:
mysql -uroot -pXXXX
3. Change the login name of user test to Administrator. Make sure the username of user test is the same as that in step 1.
update TBL_USER_VDI set LOGIN_NAME ='Administrator' where LOGIN_NAME='test';
Figure 1 Changing the login name of user test to Administrator
E2xxx versions
1. On Space Console, create a local user. This example creates user test.
2. Connect to the database server by using the following command where XXXX represents the database password and can be edited as needed:
su - omm -c "gsql -d workspace -p 15400 –r -W XXXX"
3. Change the login name of user test to Administrator. Make sure the username of user test is the same as that in step 1.
update TBL_USER_VDI set LOGIN_NAME ='Administrator' where LOGIN_NAME='test';
Figure 2 Changing the login name of user test to Administrator
![]()
Enabling HugePages memory for the UCC endpoint in IDV mode
1. Keep the endpoint in management machine state and use the SSH tool to access the CLI of the endpoint.
2. Set the number of pages: idvctl set-hugepages HP_TOTAL.
|
|
CAUTION: The HP_TOTAL argument specifies the number pages to be applied for. Make sure the number of pages multiplied by 2M is less than the current free memory. If the free memory space is insufficient, use sync & echo 3 > /proc/sys/vm/drop_caches to free page table caches. |
3. Enable HugePages on the VM: idvctl create-vm VM name System image full path --hp_flag on.
4. Stop the user interface service on the management machine: service ui stop.
5. Start the VM: idvctl start-vm VM name.
6. Start VdSession: service Workspace start.
7. View HugePages usage information: idvctl get-hugepages.
Logs
Endpoint logs
This chapter introduces the basic ideas of troubleshooting, log collection methods, and searching logs by issue. When sharing logs, provide the specific deployment location to facilitate analysis by R & D engineers.
An endpoint can be in management machine state or client machine state. During log collection, the endpoint must be in the corresponding state. When you collect endpoint management machine logs, the endpoint must be in the management machine state. When you collect endpoint client machine logs, the endpoint must be in the client machine state.
· Management machine state: Only the Workspace or Learningspace login programs are running on the endpoint, and the user's actual desktop system has not been accessed.
· Client machine state: The endpoint has entered the user's actual desktop system and can use the desktop correctly.
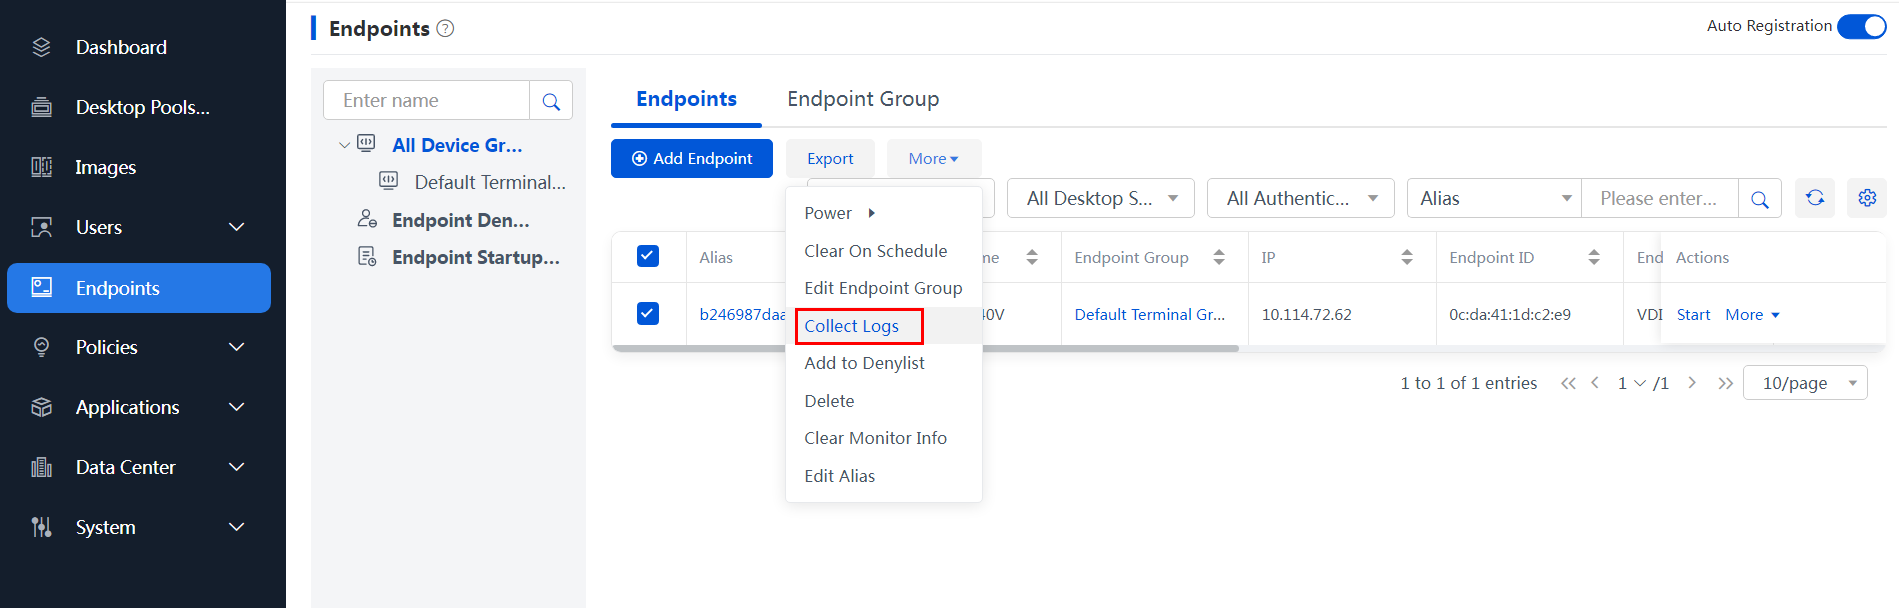
To collect endpoint logs:
1. Navigate to the Endpoints page, and use the log collection function to collect endpoint logs with one key.
Figure 3 Collecting endpoint logs
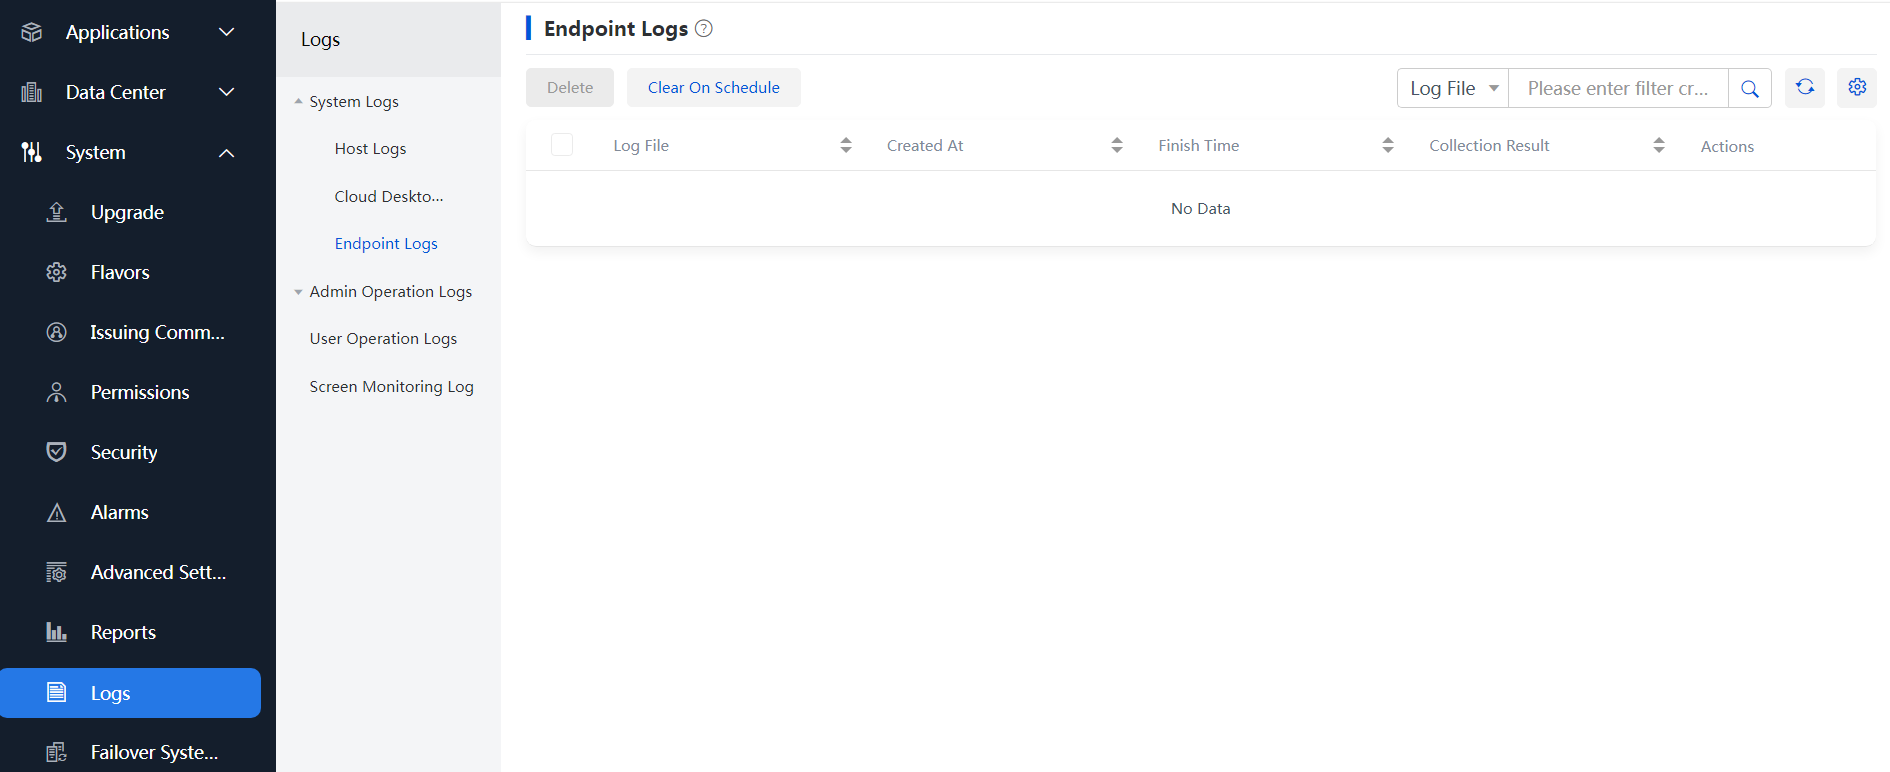
2. To download and view collected endpoint logs, navigate to the Monitor Reports > Logs > System Logs > Endpoint Logs page.
Figure 4 Viewing collected endpoint logs
VDI
Table 1 VDI endpoint logs
|
System |
Component |
Log directory |
Log file name |
Log contents |
|
Windows |
Workspace |
User file directory\Workspace\log |
Workspace.date.log |
Workspace software logs |
|
VdSession |
User file directory\VdSession\log |
VdSession-server address-desktop pool-desktop ID-date.log |
Logs for remote desktop connection program |
|
|
U2ec |
Workspace installation directory\log |
u2ec_date.log |
Logs for peripheral redirection program |
|
|
Installation logs |
Workspace installation directory\log |
Workspace_NSIS_log.txt |
Logs for Workspace client installation |
|
|
SpaceAgent |
SpaceAgent installation directory\log |
SpaceAgent.date.log |
Logs for SpaceAgent endpoint service proxy program |
|
|
SpaceConfig |
SpaceAgent installation directory\log |
SpaceConfig.date.log |
Logs for operation of client endpoint configuration program |
|
|
upgrader |
Liveupdate installation directory\log |
Upgrader.date.log |
Logs for client online upgrade |
|
|
popview.date.log |
||||
|
SpaceOS |
Workspace |
/home/spaceos/Documents/Workspace/log |
Workspace.date.log |
Workspace software logs |
|
VdSession |
/home/spaceos/Documents/VdSession/log |
VdSession-server address-desktop pool-desktop ID-date.log |
Logs for remote desktop connection program |
|
|
SpaceAgent |
/userdata/H3C/SpaceAgent/log |
SpaceAgent.date.log |
Logs for SpaceAgent endpoint service proxy program |
|
|
SpaceConfig |
/userdata/H3C/SpaceAgent/log |
SpaceConfig.date.log |
Logs for client endpoint configuration program |
|
|
upgrader |
/userdata/H3C/Liveupdate/log |
Upgrader.date.log |
Logs for client online upgrade |
|
|
popview.date.log |
IDV/VOI/UCC
Figure 5 IDV/VOI/UCC endpoint logs
|
Component |
Log directory |
Remarks |
|
VOI management machine client |
· E1004P04 and earlier versions: /var/log/voiclient/* · E1004P05 and later versions: /voisys/var/log/voiclient/* |
· The client of E1004P04 and earlier versions only records the current startup log. · The logs for the client of E1004P05 and later versions can retained for three days. |
|
VOI management machine Agent |
/home/spaceos/idvclient/log/* |
Only records the current startup log. |
|
Management machine system log |
/var/log/* |
Mainly syslogs. Only the current startup log is recorded. |
|
Client machine critical log |
· C:\Users\Administrator\Documents\Workspace\log · VOIAgent: C:\Program Files (x86)\H3C\VoiAgent\Vdagent Tools\Log · Peripheral control: C:\Program Files (x86)\H3C\VoiAgent\Device Redirect\log |
N/A |
|
IDV |
/var/log/idvclient/* |
N/A |
|
UCC |
/voisys/var/log/voiclient/* or /var/log/voi/* or /var/log/u3client/ |
N/A |
Multimedia, vGPU, protocol, peripheral, and agent logs
VM logs can be downloaded from a browser to a client by entering VM IP:9003 in the browser of the client.
Table 2 Multimedia, vGPU, protocol, peripheral, and agent-related logs
|
VM/Endpoint |
System |
Component |
Log directory |
Log file name |
Log contents |
|
Endpoint |
Windows |
Peripheral |
H3C installation path\workspace\Device Redirect\log\ |
VDIUsbServicedateday.log |
Port redirection logs |
|
UsbSetupdateday.log |
Driver installation logs for port redirection |
||||
|
VDIComServicedateday.log |
Serial redirection logs |
||||
|
ComSetupdateday.log |
Driver installation logs for serial redirection |
||||
|
devredirectdate.log |
Camera redirection logs |
||||
|
virtualCameradateday.log (dedicated for VM side) |
Virtual camera redirection logs (dedicated for VMs) |
||||
|
C:\Users\Currrent login user\H3CDClient\ |
CDriverMappdateday.log (dedicated for physical device side) |
Disk mapping logs |
|||
|
SDriverMappdateday.log (dedicated for VM side) |
Disk mapping logs |
||||
|
Video redirection |
User file directory\VdSession\log |
VdSession-server address-desktop pool-desktop ID-date.log |
Video redirection logs |
||
|
vGPU |
User file directory\VdSession\log |
VdSession-server address-desktop pool-desktop ID-date.log |
GPU logs |
||
|
HTML5 |
User file directory\VdSession\log |
VdSession-server address-desktop pool-desktop ID-date.log |
H5 redirection logs |
||
|
Spiceclient |
User file directory\VdSession\log |
protocol-server address-desktop pool-desktop ID-date.log |
Logs for operation of remote desktop connection protocol operation |
||
|
SpaceOS |
Spiceclient |
/home/spaceos/Documents/VdSession/log |
protocol-server address-desktop pool-desktop ID-date.log |
Logs for operation of remote desktop connection protocol |
|
|
Video redirection |
User file directory\VdSession\log |
VdSession-server address-desktop pool-desktop ID-date.log |
Video redirection logs |
||
|
H5 |
User file directory\VdSession\log |
VdSession-server address-desktop pool-desktop ID-date.log |
H5 redirection logs |
||
|
vGPU |
User file directory\VdSession\log |
VdSession-server address-desktop pool-desktop ID-date.log |
vGPU logs |
||
|
Peripheral |
/var/log/ comredirect/ |
Comredirdateday.log |
Serial redirection logs |
||
|
/var/log/camera_redirect/ |
devredirectdate.log |
Camera redirection logs |
|||
|
/var/log/eveusb/ |
Eveusbdateday.log |
Port redirection logs |
|||
|
/var/log/ |
syslog |
System logs and port redirection logs |
|||
|
/home/Current login user/document/DiskMapping/ |
CDriverMappdateday.log |
Disk mapping logs |
|||
|
/home/Current login user/Documents/DiskMapping/ |
|||||
|
VM |
Windows |
Peripheral |
Agent installation path\ VdiAgent \Device Redirect\log\ |
VDIUsbServicedateday.log |
Port redirection logs |
|
UsbSetupdateday.log |
Driver installation logs for port redirection |
||||
|
VDIComServicedateday.log |
Serial redirection logs |
||||
|
ComSetupdateday.log |
Driver installation logs for serial redirection |
||||
|
devredirectdate.log |
Camera redirection logs |
||||
|
virtualCameradateday.log (dedicated for VM side) |
Virtual camera redirection logs (dedicated for VMs) |
||||
|
H3C installation path\VdiAgent\Vdagent Tools\log\ |
CDriverMappdateday.log (dedicated for physical device side) |
Disk mapping logs |
|||
|
SDriverMappdateday.log (dedicated for VM side) |
Disk mapping logs |
||||
|
vGPU |
H3C installation path\VdiAgent\Vgpu\log |
VGPUCapturer_dateday.log (dedicated for VM side) |
Capturer logs |
||
|
Video redirection |
Agent installation path\VdiAgent\Vdagent Tools\log\ |
MMRRedirect+SN.log |
Video redirection logs |
||
|
Agent installation path\ VdiAgent \Device Redirect\log\ |
MMRPlayerHookExe+SN.log |
Video redirection logs |
|||
|
MMRPlayerHookDll+SN.log |
|||||
|
MMRVChannel+SN.log |
|||||
|
MMRTransfer+SN.log |
|||||
|
MMRDShowHook+SN.log |
|||||
|
MMRVRender+SN.log |
|||||
|
H5 |
H3C installation path\VdiAgent\Device Redirect\log |
H3CcivetwebServerdateday.log |
H5 redirection logs |
||
|
Optimization tool |
C:\ |
optToolsCopyProfileSevdateday.log (dedicated for VM side) |
Optimization logs |
||
|
agent |
C:\Users\Userxx\VDtray\ |
VDTray_date.log |
VDTray logs |
||
|
Notificition_date.log |
Notification component logs |
||||
|
C:\Users\Userxx\clipboard |
SClip_date.log/VDIClipboard_date.log |
Clipboard logs |
|||
|
Agent installation path\ VdiAgent\Vdagent Tools\log\ |
Vdagent_date.log |
Agent-related logs |
|||
|
ProfileManagement_date.log |
UPM logs |
||||
|
VDIGrpcAgent_date.log |
GRPC logs |
||||
|
VDILogDownload_date.log |
Log download module logs |
||||
|
VDIService_date.log |
Vdservice service logs |
||||
|
VDISSO_CP_date.log |
SSO component logs |
||||
|
VDIWaterMark_date.log |
Blind watermarking logs |
||||
|
VDICommon_date.log |
Common component logs |
||||
|
fw_vdservice_date.log |
Firewall exception component logs |
||||
|
MainPortSpiceVdAgentPlugin_date.log |
Student communication interface logs |
||||
|
Server |
Linux |
hostagent |
/var/log/vdi/hostagent/ |
hostagent+date.log |
Recording hostagent logs |
|
Linux |
Spiceserver |
/var/log/libvirt/qemu/ |
VM storage name.log |
Logs for spiceserver and kvm/qemu-based VM process |
Space Console logs
Space Console logs are saved under the /var/log/vdi/ directory, mainly including the following modules.
Table 3 Space Console component log directories
|
Component |
Log directory |
Remarks |
|
Workspace-server |
/var/log/vdi/workspace-sever/workspace.log |
Space Console backend log |
|
Controller |
· /var/log/vdi/controller/controller.log (platform, client, CAS, UIS communication services) · /var/log/vdi/controller/grpc.log (GRPC communication logs between the controller and agent) · /var/log/vdi/controller/grpc-client.log (GRPC communication logs between the controller and client. Detailed request/response packets are printed for both ends) |
All controller logs, including GRPC communication logs |
|
ssv |
/var/log/vdi/ssv |
Log of the ssv user log module |
|
hostagent |
/var/log/vdi/hostagent |
Log of hostagent |
|
vdi-install.log |
/var/log/vdi |
VDI installation log |
|
vdi-upgrade.log |
/var/log/vdi |
VDI update log |
Data storage locations
Storage locations for course VMs
The system and data disk files of each course VM are placed in the same path, which depends on the selected path upon course creation:
Figure 6 Course storage path
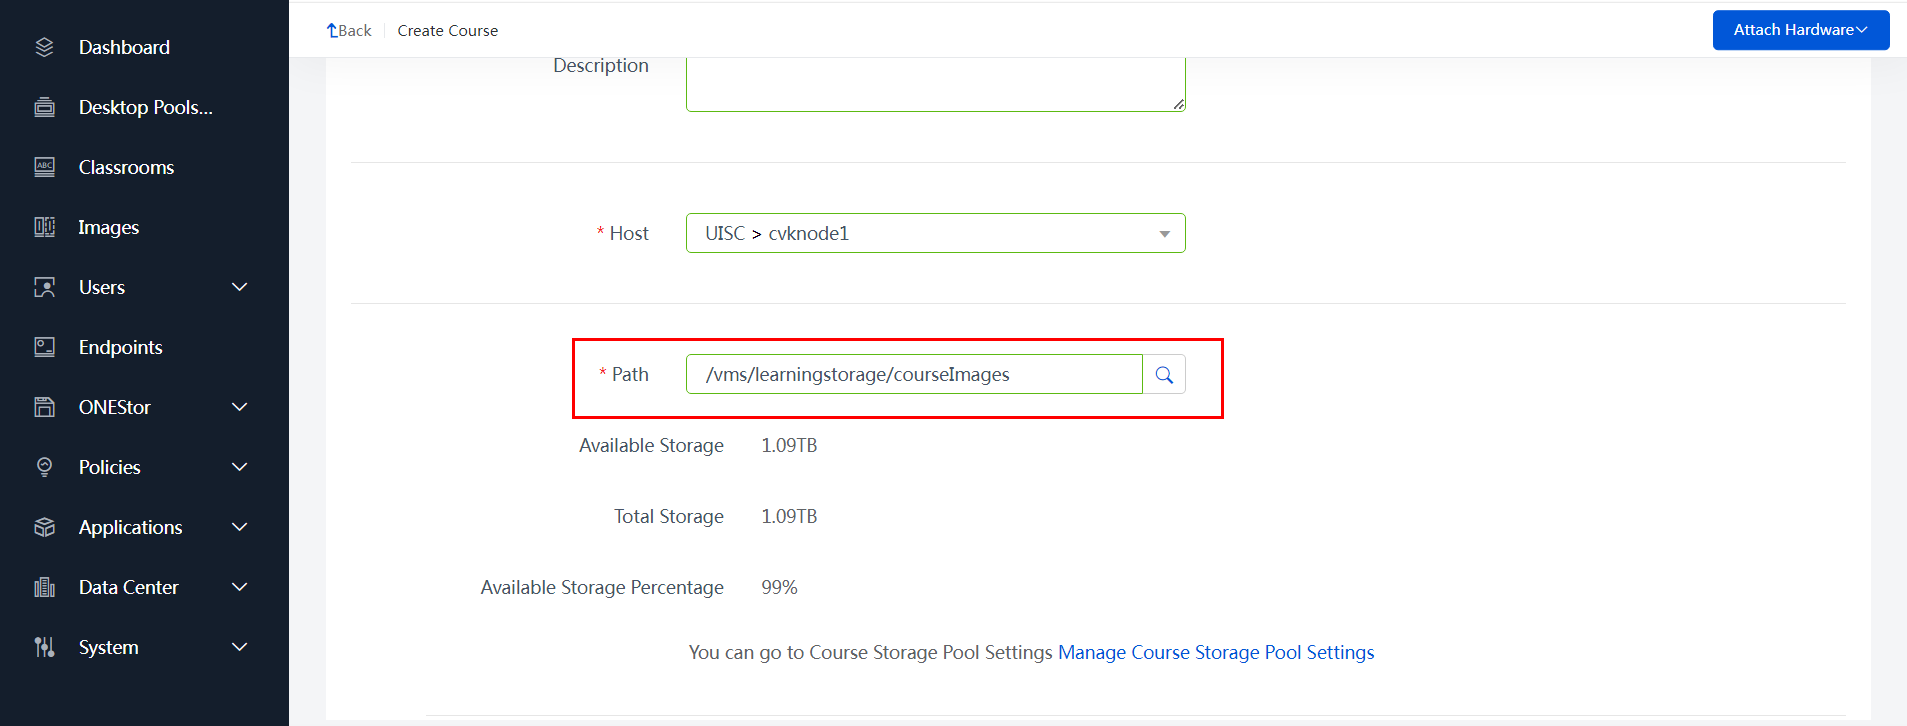
The available storage paths for creating a new course include the following:
· /vms/learningspace/courseImages (earlier than E1015) or /vms/learningstorage/courseImages (E1015 and later): Local storage, added on the Data Center > Teaching Storage page of Space Console.
· Local or shared storage that is newly added in the course storage pool.
Course VMs
The system and data disk files for course VMs are stored separately:
· System disk: Each classroom has its own subdirectory in the main directory, and a separate subdirectory is available for regular and exam courses in each classroom. The main directory is located at /vms/learningspace/desktop/ in versions earlier than E1015 and /vms/learningstorage/desktop/ in E1015 and later.
· Data disk: Each classroom has its own subdirectory in the main directory, and a separate subdirectory is available for regular and exam courses in each classroom. The main directory is located at /vms/desktop_data/ in versions earlier than E1015 and /desktop_data/ in E1015 and later.
Each classroom has four paths (storage pools) for storing the files of course VMs. These paths (storage pools) are automatically created when the classroom is created:
· In versions earlier than E1015
¡ /vms/learningspace/desktop/CLASSROOM-ID-GENERAL: System disk path for regular course VMs.
¡ /vms/learningspace/desktop/CLASSROOM-ID-EXAM: System disk path for exam course VMs.
¡ /vms/desktop_data/CLASSROOM-ID-DATA-GENERAL: Data disk path for regular course VMs.
¡ /vms/desktop_data/CLASSROOM-ID-DATA-EXAM: Data disk path for exam course VMs.
· In E1015 and later
¡ /vms/learningstorage/desktop/CLASSROOM-ID-GENERAL: System disk path for regular course VMs.
¡ /vms/learningstorage/desktop/CLASSROOM-ID-EXAM: System disk path for exam course VMs.
¡ /desktop_data/CLASSROOM-ID-DATA-GENERAL: Data disk path for regular course VMs.
¡ /desktop_data/CLASSROOM-ID-DATA-EXAM: Data disk path for exam course VMs.
Important components and maintenance methods
Space Console
System advanced command mode
Some commands at the CLI of the host in an E2xxx version can be executed only in advanced mode. To enter the advanced mode:
/opt/bin/command_config
![]()
Default password: Cloud@4321. The advanced mode is available after you enter the password.
workspace-server
About workspace-server
The workspace-server component is the core management component of the cloud desktop, providing backend service support for Space Console functions.
Service management
· To restart the workspace-server service, execute the service workspace-server restart command.
· To start the workspace-server service, executing the service workspace-server start command.
· To check the status of the workspace-server service, execute the service workspace-server status command.
· To stop the workspace-server service, execute the service workspace-server stop command.
Commonly used commands
· jps: Used to obtain the process ID of workspace-server.jar. Command syntax: jps -l.
· jstack: Used to obtain information about the Java stack and native stack for running Java programs. Command syntax: jstack -l <pid> <dstFileName>.
· jmap: Used to obtain detailed information about memory allocation for running Java programs, such as instance count and size. Command syntax: jmap -dump:format=b,file=<destFileName> <pid>. For example, the value for the destFileName parameter can be heap.bin.
· jstat: Used to obtain information related to class loader, compiler, and garbage collection. You can use this command to monitor resources and performance in real time. Command syntax: jstat –gcutil <pid> <interval>. The unit for the interval parameter is milliseconds.
|
|
CAUTION: As a best practice, do not execute the jmap command during busy service periods or under high pressure of the environment. Execute other commands when necessary to collect information. |
Commonly used logs
The workspace-server logs are stored in the /var/log/vdi/workspace-server/ log directory.
· workspace.log—This log file stores the internal running logs of workspace-server. If errors are prompted during interface operations, you can view this log file.
· ws-gc.log.0.current—You can view this log file when the memory usage of workspace-server is too high.
· jstack-generated logs—You can view specific stuck or blocked stacks from the logs when an interface task takes a long time to complete.
· jmap-generated logs—You can analyze and view jmap logs with the Eclipse MemoryAnalyzer tool. These logs are typically provided directly to developers after collection.
|
|
NOTE: When viewing the workspace.log file and jstack-generated logs, you can use fuzzy search based on the service operations performed on the interface. For example, you can use deploy as a keyword to search for VM deployment operation logs. |
Perform the following tasks to view specific information in the workspace.log file:
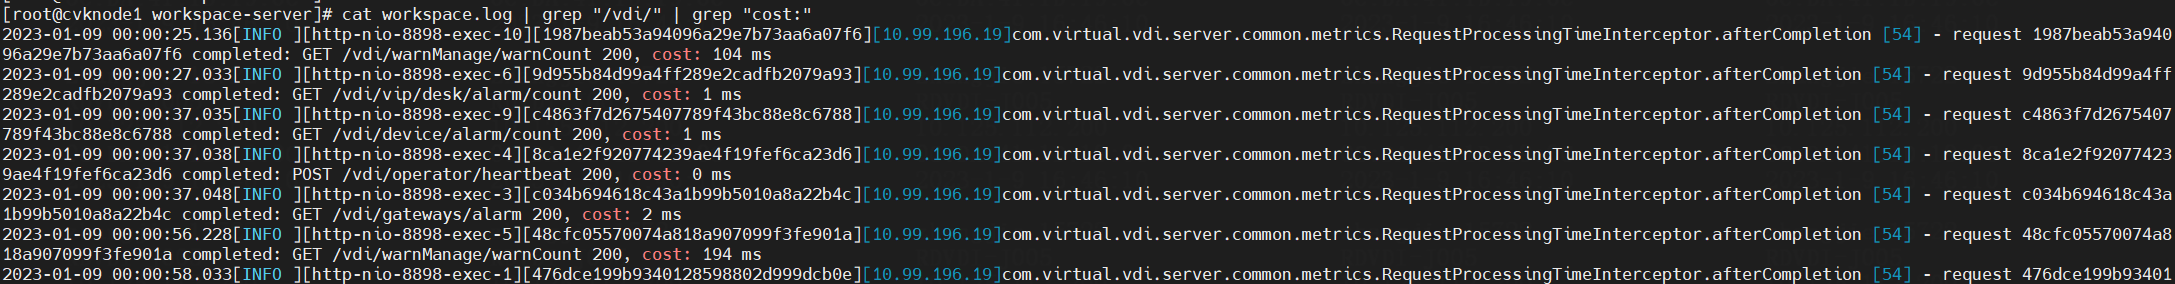
1. To filter and view exception information, execute the cat workspace.log | grep -i Exception command.
2. To view the return time of the VDI API, execute the cat workspace.log | grep "/vdi/" | grep "cost:" command. If the return time is long (for example, 20 s), it indicates an exception might have occurred on the API.
Figure 7 Viewing the return time of the VDI API
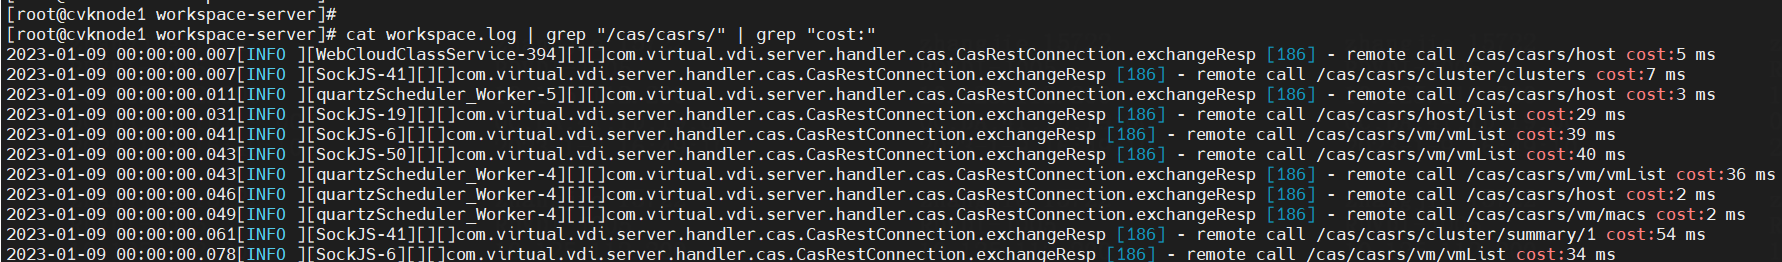
3. To view the return time of the CAS API, execute the cat workspace.log | grep "/cas/casrs/" | grep "cost:" command. If the return time is long (for example, 20 s), it indicates an exception might have occurred on the API.
Figure 8 Viewing the return time of the CAS API
Controller
About Controller
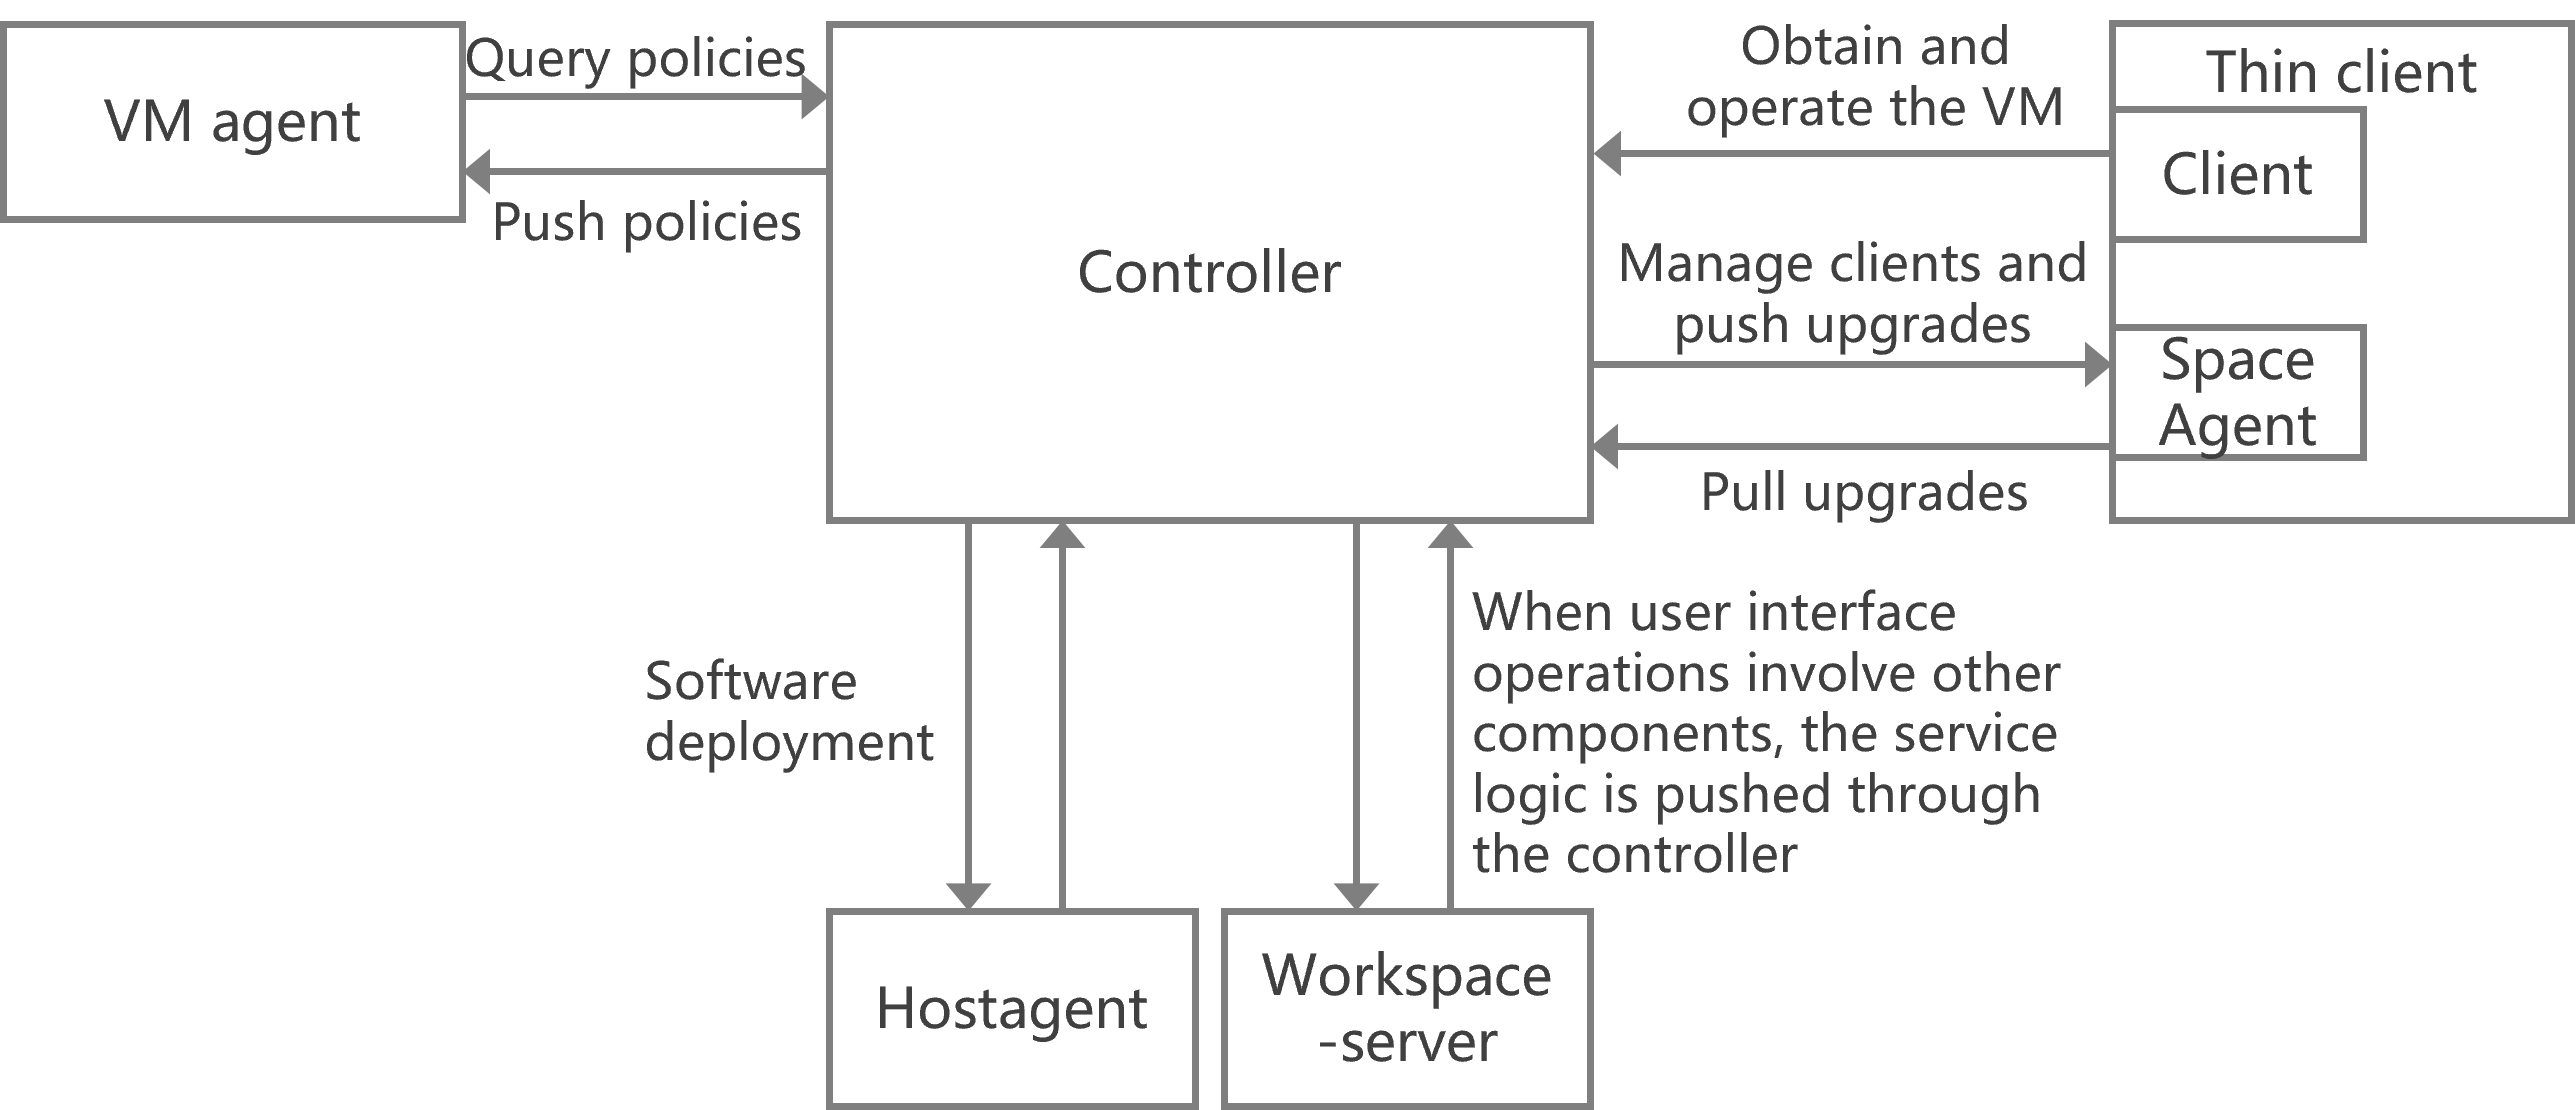
The Controller component, as the basic messaging component of the cloud desktop, acts as a message hub in cloud desktop services. It interacts with multiple other components and uses the gRPC and Protobuf protocols to carry messages. The Controller component interacts with other objects as follows:
· Communicates with the client on the thin client (for example, when the user logs in to the VM).
· Communicates with SpaceAgent on the thin client and maintains a long connection state (for realizing functions such as client management and service upgrades on the thin client).
· Communicates with the VM's internal agent and maintains a long connection state (for pulling and pushing policies to the agent).
· Communicates with HostAgent (which is used in only the software deployment function) on the host and maintains a long connection state.
· Communicates with workspace-server.java and maintains a long connection state. For example, user operations on the interface trigger the Controller component to push messages to other components.
Figure 9 Controller's interactions with other components
Service management
To restart, start, check the status of, and stop the service controller, execute the service controller restart, service controller start, service controller status, and service controller stop commands, respectively.
Commonly used commands
· jps: Used to obtain the process ID of workspace-server.jar. Command syntax: jps -l.
· jstack: Used to obtain information about the Java stack and native stack for running Java programs. Command syntax: jstack -l <pid> > <dstFileName>.
· jmap: Used to obtain detailed information about memory allocation for running Java programs, such as instance count and size. Command syntax: jmap -dump:format=b,file=<destFileName> <pid>. For example, the value for the destFileName parameter can be heap.bin.
· jstat: Used to obtain information related to class loader, compiler, and garbage collection. You can use this command to monitor resources and performance in real time. Command syntax: jstat –gcutil <pid> <interval>. The unit for the interval parameter is milliseconds.
|
|
CAUTION: As a best practice, do not execute the jmap command during busy service periods or under high pressure of the environment. Execute other commands when necessary to collect information. |
Commonly used logs
The following log files are stored in the /var/log/vdi/controller/ log directory:
· controller.log—This log file stores the internal running logs of the Controller. All calls (such as URLs) to the CAS API are logged. You can view this log file when service logic exceptions occur.
· grpc-client.log—This log file stores the logs for the communication between the Controller component and the client.
· grpc.log—This log file stores the logs for communication between the Controller component and non-client components, such as Agent, HostAgent, workspace-server, and SpaceAgent.
· jstack-generated logs—You can view specific stuck or blocked stacks from the logs when an interface task takes a long time to complete.
· jmap-generated logs—You can analyze and view jmap logs with the Eclipse MemoryAnalyzer tool. These logs are typically provided directly to developers after collection.
|
|
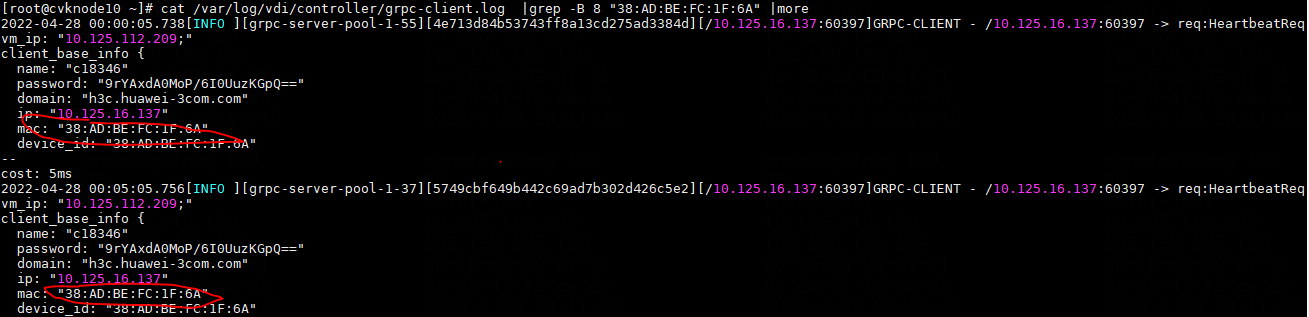
NOTE: When you view the grpc-client.log and grpc.log log files, you can filter the logs by the following information: · The communication peer's IP (such as the client's IP and the Agent's IP) in a non-gateway access environment. · The VM's IP or MAC address in a gateway access environment. You can determine whether the VM and client are connected to Space Console based on whether related logs exist. |
Figure 10 Viewing grpc-client.log in a non-gateway access environment
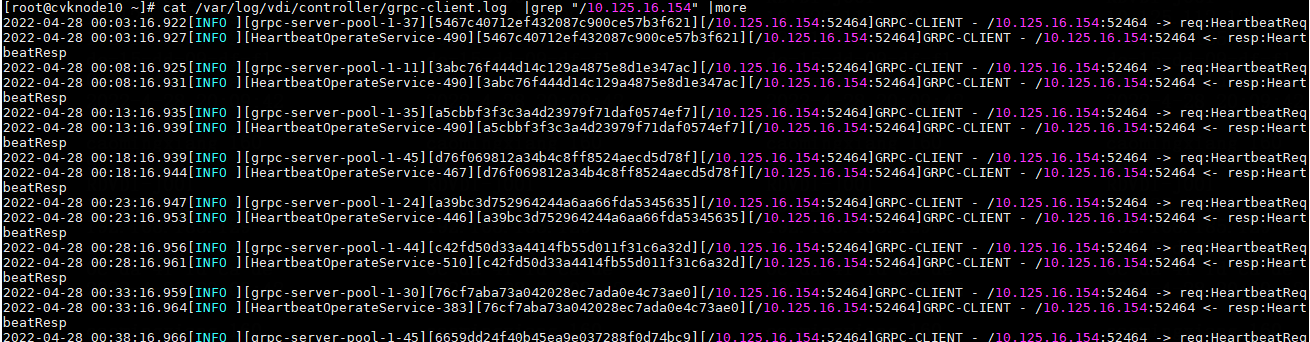
Figure 11 Viewing grpc-client.log in a gateway access environment
GlusterFS
About GlusterFS
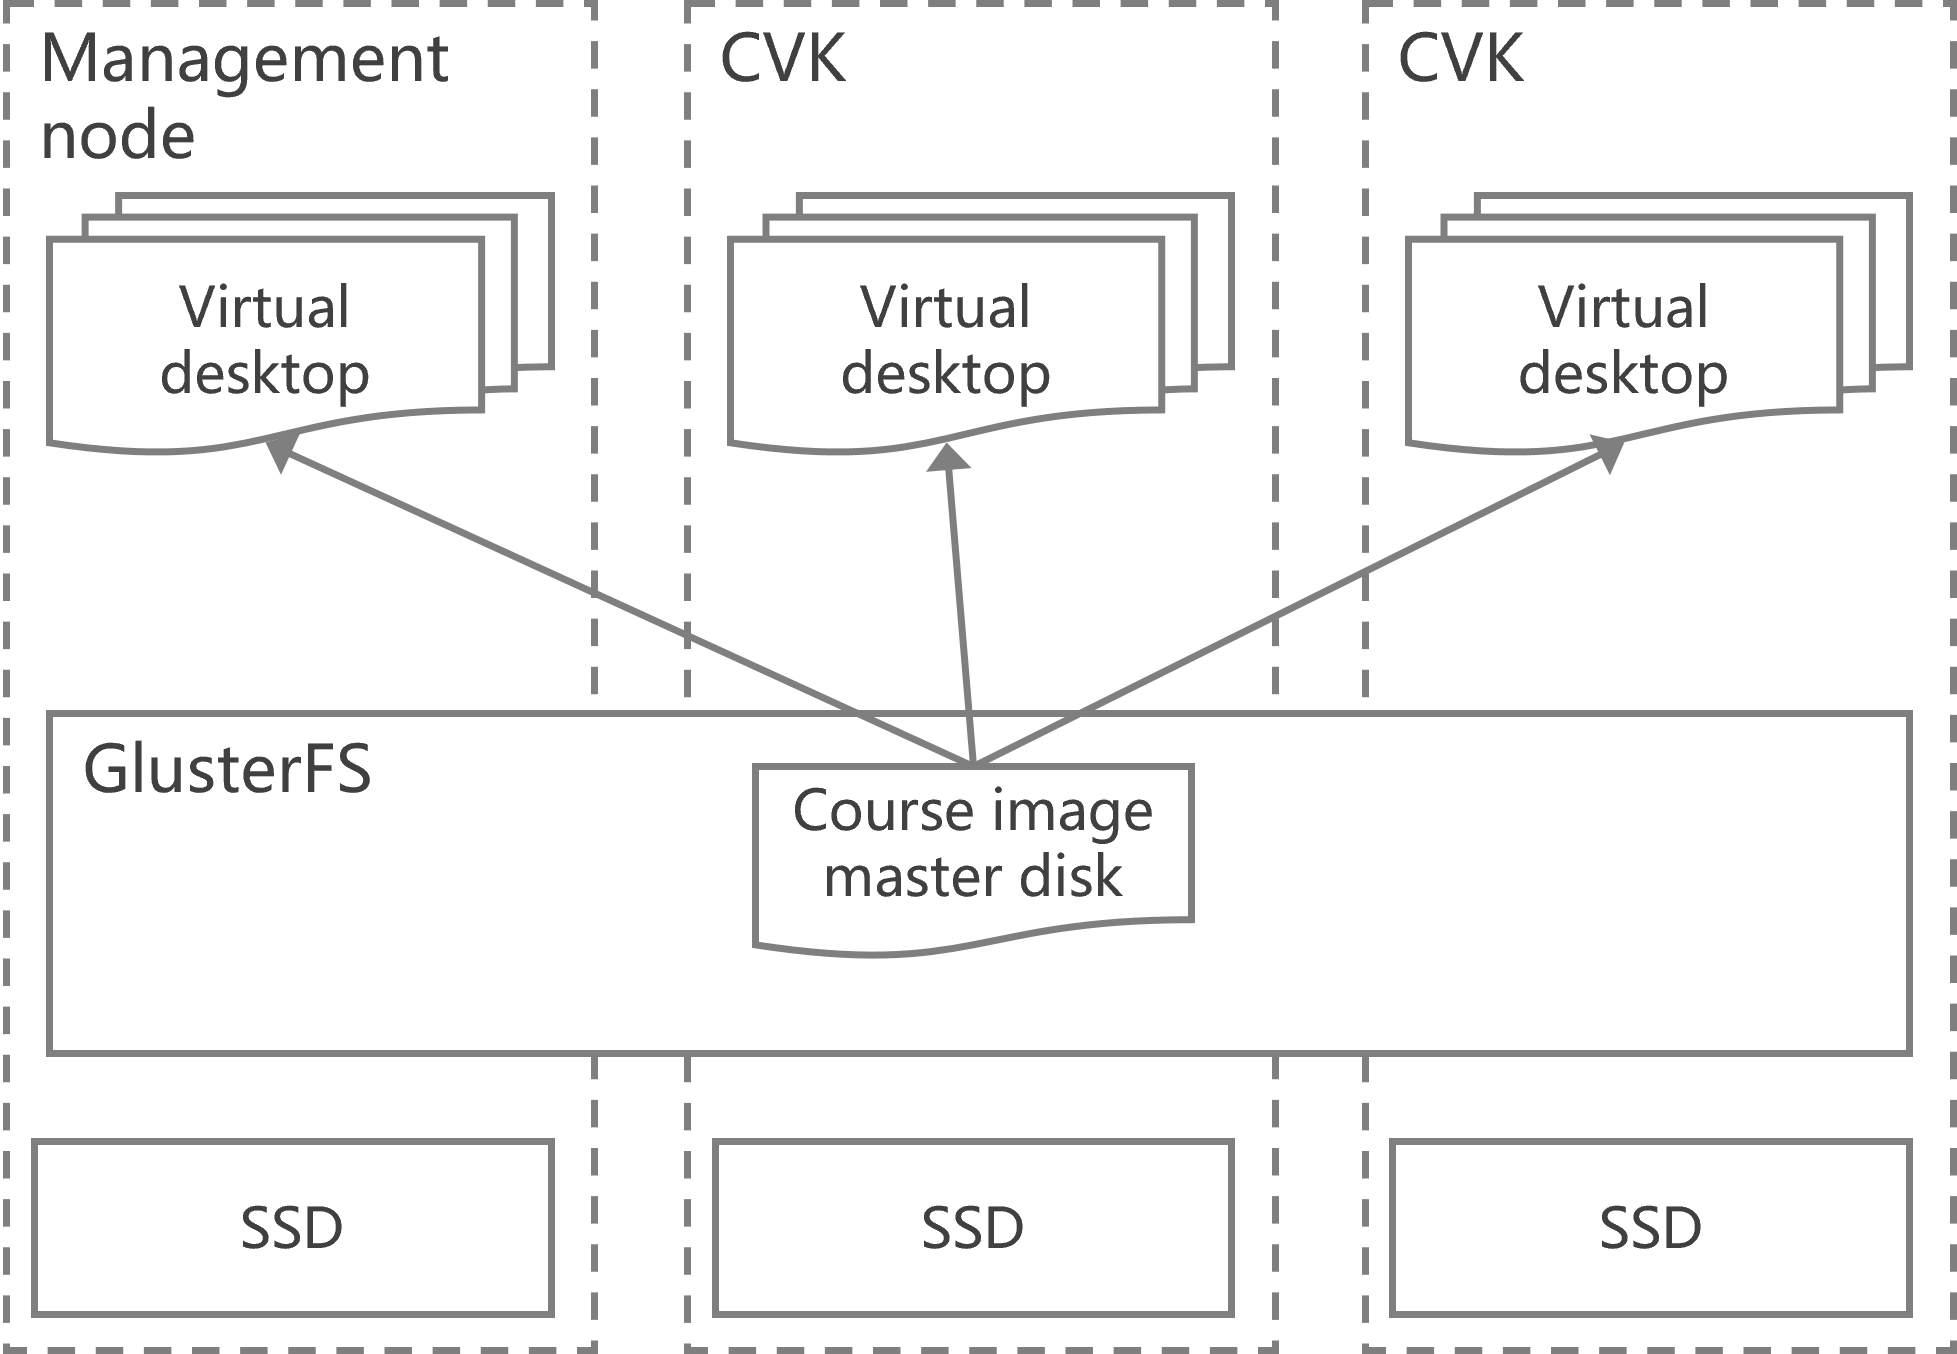
The essential principle of GlusterFS is to logically integrate the local disks on servers into a shared file system through the GlusterFS open source software. This allows the shared course image master disk to be hosted, realizing rapid distribution of student VMs during a class.
Figure 12 GlusterFS shared network topology
Service management
· To restart, stop, check the status for, and stop the uisfs-http service, execute the service uisfs-http restart, service uisfs-http start, service uisfs-http status, and service uisfs-http stop commands, respectively.
· To restart, start, check the status of, and stop the uisfs-cannikin service, execute the service uisfs-cannikin restart, service uisfs-cannikin start, service uisfs-cannikin status, and service uisfs-cannikin stop commands, respectively.
· To restart, start, check the status of, and stop the glusterd service, execute the service glusterd restart, service glusterd start, service glusterd status, and service glusterd stop commands, respectively.
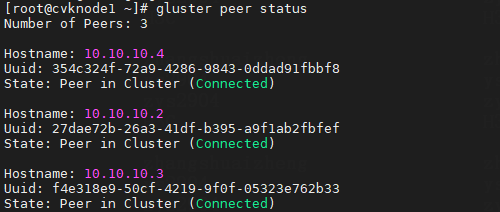
Commonly used commands
· peer status: Used to obtain the node status information. Command syntax: gluster peer status.
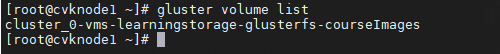
· volume list: Used to obtain information about storage volumes. Command syntax: gluster volume list.
· volume info: Used to obtain information about a specified storage volume. Command syntax: gluster volume info <name>.
· volume status: Used to obtain status information about a specified storage volume. Command syntax: gluster volume status <name>.
· volume heal: Used to identify whether split-brain files exist in a specified storage volume. Command syntax: gluster volume heal <name> info.
· mount -t glsuterfs: Used to mount a GlusterFS storage volume. Command syntax: mount -t glusterfs ip:/name /vms/learningspace/glusterfs/courseImages.
![]()
Commonly used logs
GlusterFS logs are stored in the /var/log/uisfs/ and /var/log/glusterfs/ directories.
· cistern.log—This log file stores the logs for the communication between Space Console and the uisfs-http service.
· cannikin.log—This log file stores the logs for the communication between the uisfs-cannikin service and the GlusterFS component.
· glusterd.log—This log file stores the running logs for the management process of the GlusterFS open source component.
Troubleshooting common issues
Poor health statuses of GlusterFS storage nodes
1. On the GlusterFS configuration node management page, identify whether the statuses of the storage node partitions, storage pool, and service node storage pool are all normal.
2. If any nodes are abnormal, repair the nodes.
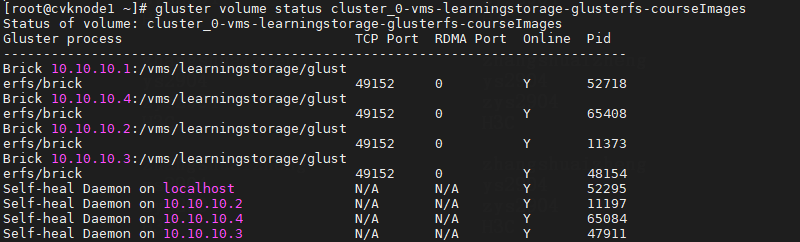
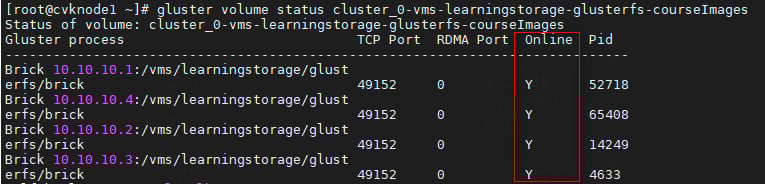
3. To check the online status of the GlusterFS storage node partitions, execute the gluster volume status <name> command (which is used to obtain status information about a specified storage volume).
Inactive GlusterFS storage pool and update status failure in manual start
1. Check the connectivity of the storage network.
2. Mount a GlusterFS storage volume to a temporary directory, and identify whether duplicate files exist in the GlusterFS storage volume. If yes, delete the duplicate files. The specific method is as follows:
a. Execute the mkdir -p /vms/temp command to create temporary directory /vms/temp.
b. Execute the mount -t glusterfs IP:/VolumeName /vms/temp command to mount the GlusterFS storage volume. The IP parameter indicates the IP address of a normal node of the GlusterFS storage volume, and the VolumeName parameter indicates the volume name.
c. Execute the df -h command to identify whether the mounting is successful.
d. Enter the /vms/temp directory, execute the ls -a command to view all files, and delete any duplicate files if found.
3. Unmount /vms/temp.
4. Start the storage pool
Inactive storage pool caused by Split-brain GlusterFS storage files
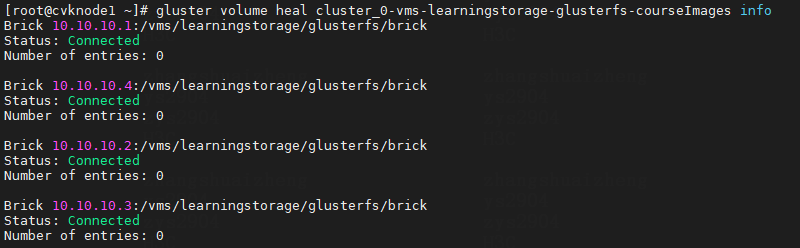
1. Execute the gluster volume heal VolumeName info (VolumeName is the name of the storage volume) command to identify whether split-brain files displayed as ls in split brain exist. If yes, delete the split-brain files.
If you want to keep the split-brain files, copy them from the block storage directory and copy them back to the original directory after the storage pool has been repaired. Backup the split-brain files in the corresponding nodes' brick directories.
2. Execute the mkdir -p /vms/temp command to create temporary directory /vms/temp.
3. Execute the mount -t glusterfs IP:/VolumeName /vms/temp command to mount the GlusterFS storage volume. The IP parameter indicates the IP address of a normal node of the GlusterFS storage volume, and the VolumeName parameter indicates the volume name.
4. Enter the /vms/temp directory and delete the split-brain files.
5. Unmount /vms/temp.
6. Start the storage pool.
7. Copy the backup files to the corresponding mount point directory.
Inactive GlusterFS storage pool and invalid mount point in manual start
1. Execute the df -h command to identify whether the corresponding GlusterFS storage mount point exists on the corresponding host.
2. If the mount point does not exist, delete the data in the GlusterFS mount point directory on the host. If the mount point directory is not mounted to GlusterFS storage, the mount point directory cannot have any data.
3. Start the storage pool.
Domain not found in creation of a GlusterFS teaching storage
For example, if the message Domain not found: no domain with matching name 'IMG_LCVEPXDE_1673668009778_1 appears when you create a GlusterFS teaching storage, troubleshoot the issue as follows:
1. Identify whether the vservice table TBL_DOMAIN in the CAS database contains residual data of the domain named IMG_LCVEPXDE_1673668009778_1. If a residual data entry exists, record the corresponding HOST_ID and delete the data entry.
Figure 13 Troubleshooting the TBL_DOMAIN table
![]()
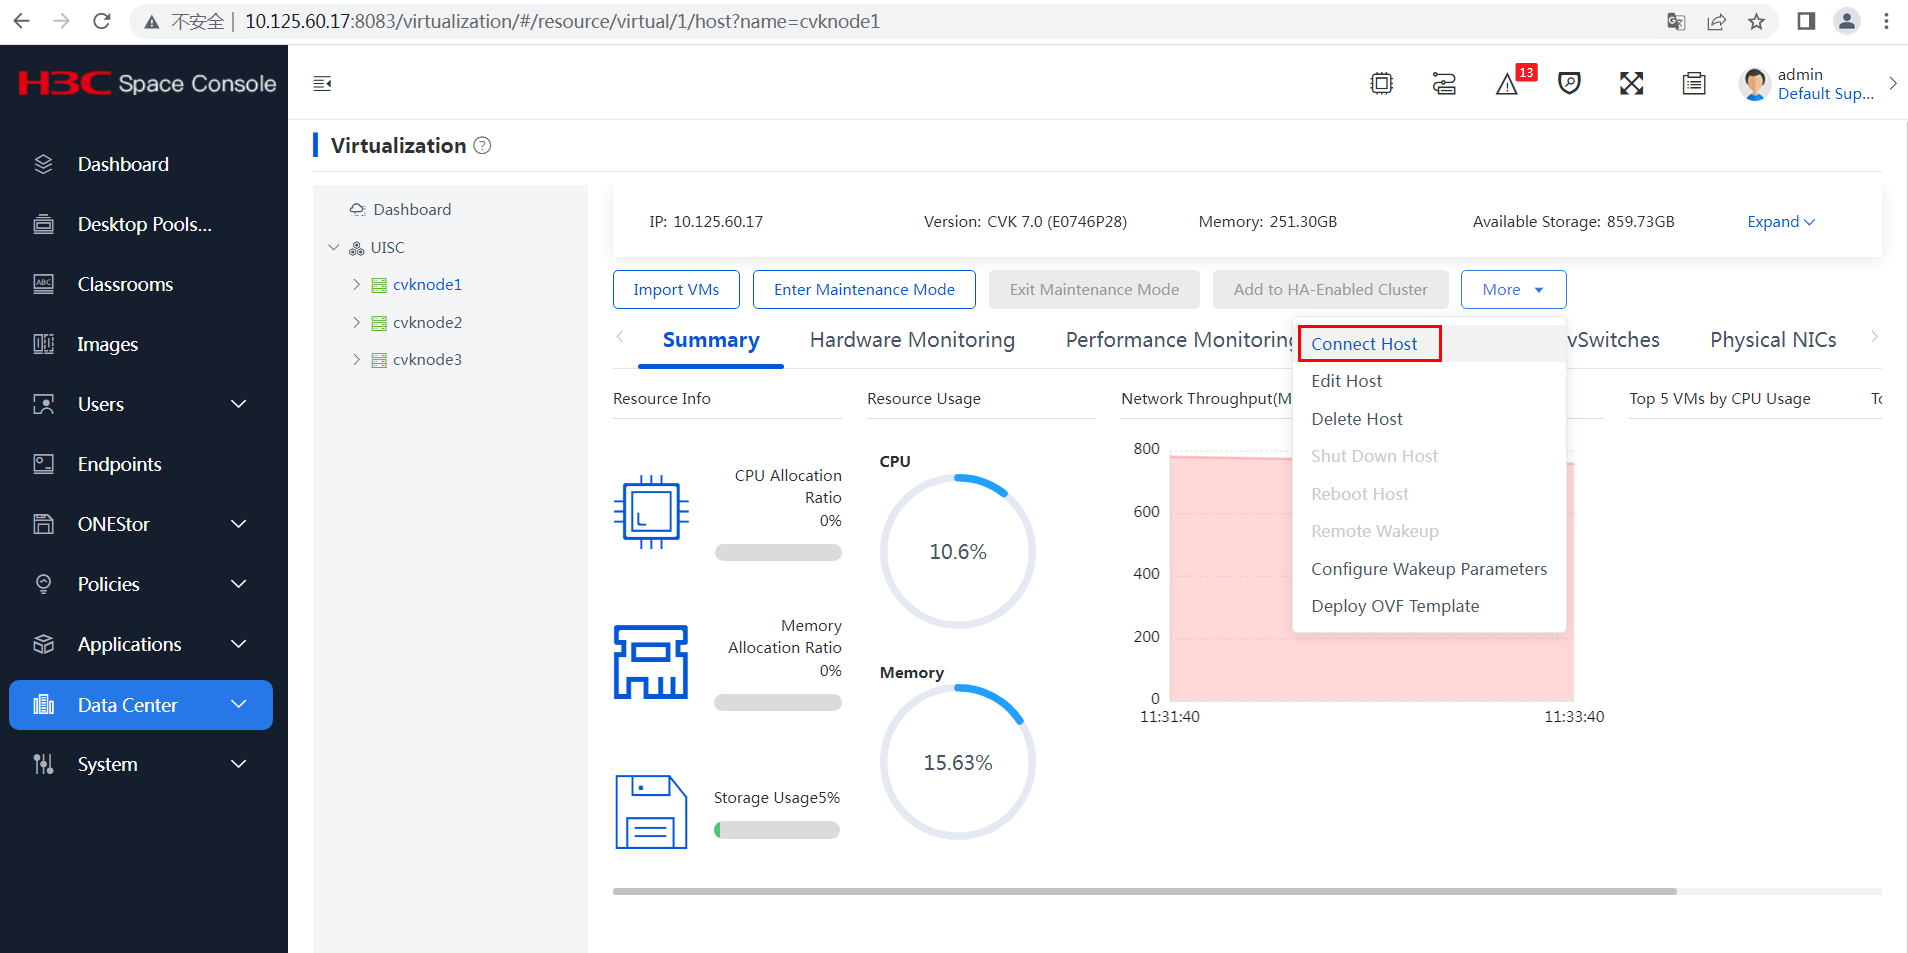
2. Locate the corresponding host on Space Console based on the host ID obtained in the previous step, and then connect to the host to perform data synchronization.
Figure 14 Connecting the host ID
3. Recreate the GlusterFS teaching storage.
No data available when you query GlusterFS configuration after switching to the backup device in the stateful failover scenario
1. Identify whether the backup device has a storage virtual switch with the same name required by GlusterFS.
2. If no such storage virtual switch exists, add the storage virtual switch with the same name.
3. Execute the following command on the primary node in the stateful failover system: gluster peer probe storage IP of the backup node. For example, gluster peer probe 10.10.10.1.
4. Execute the following command on the backup node in the stateful failover system: gluster peer probe storage IP of the primary node. For example, gluster peer probe 10.10.10.2.
5. Query GlusterFS configuration again.
openGauss
About openGauss
As from E2001, openGauss has been the database system used by the workspace-server service.
Service management
· To restart the openGauss service, execute su - omm -c "gs_om -t restart".
· To start the openGauss service, execute su - omm -c "gs_om -t start".
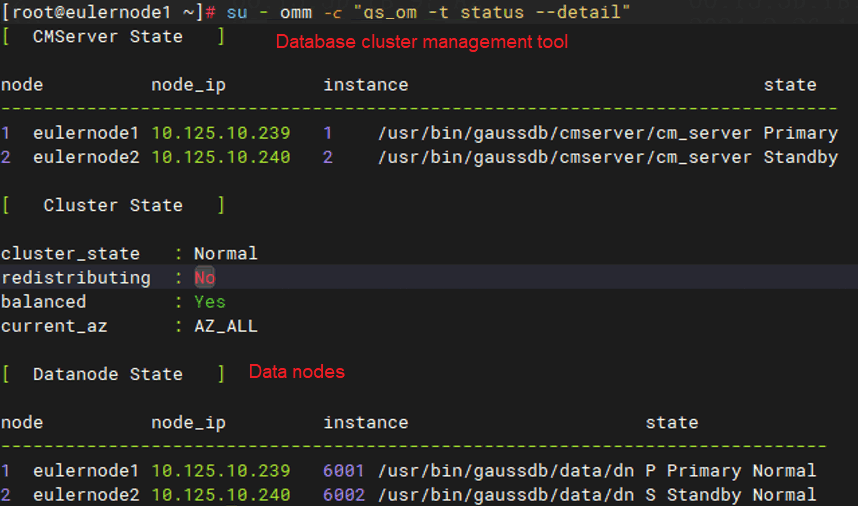
· To view the openGauss service status, execute su - omm -c "gs_om -t status --detail".
· To stop the openGauss service, execute su - omm -c "gs_om -t stop".
Commonly used commands
· To view the openGauss service status, execute su - omm -c "gs_om -t status --detail". In a dual-node environment, this command displays information about both primary and backup nodes. The information under [Datanode State] represents the states of data nodes. The information under [CMServer State] represents the states of nodes in the openGauss cluster management tool. The primary node under [Datanode State] represents the actual primary node of the database. The Cluster_state field displays the cluster status, which can be Unavailable, Normal, and Degraded. The Degraded option indicates that the database can still provide services but has some anomalies.
Figure 15 Viewing the openGauss service status
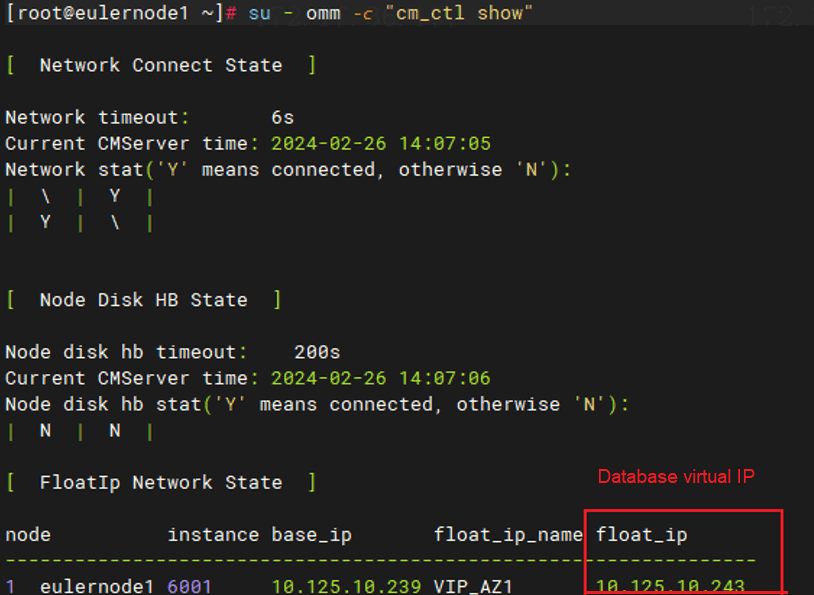
· To view the virtual IP of openGauss, execute su - omm -c "cm_ctl show". In the stateful failover scenario, the value for the float_ip field is the virtual IP of the database system.
Figure 16 Viewing the virtual IP of openGauss
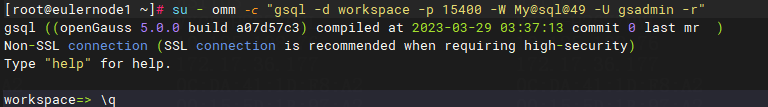
· To log in a database, execute su - omm -c "gsql -d database name -p 15400 -W database password -U database user -r". For example, execute su - omm -c "gsql -d workspace -p 15400 -W My@sql@49 -U gsadmin -r” to log in to the workspace database. After login, enter \q to exit the database and enter \c database name to switch to a new database. The other commands for adding, deleting, modifying, and querying databases are the same as those in MySQL.
Figure 17 Logging in to a database
· To perform a primary/backup database switchover, execute su - omm -c "cm_ctl switchover -n node ID -D service data path". The node ID and service data path are obtained from the command for querying the openGauss service status. For example:
Execute su - omm -c "cm_ctl switchover -n 2 -D /usr/bin/gaussdb/data/dn/" to promote the original backup node to the primary node. This command changes only information displayed in the [Datanode State] section.
Figure 18 Before the switchover
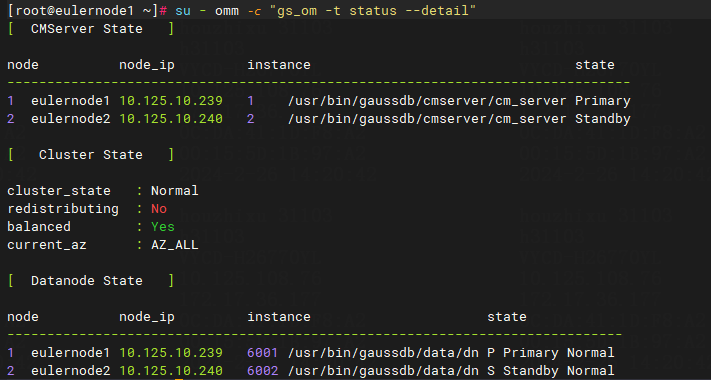
Figure 19 After the switchover
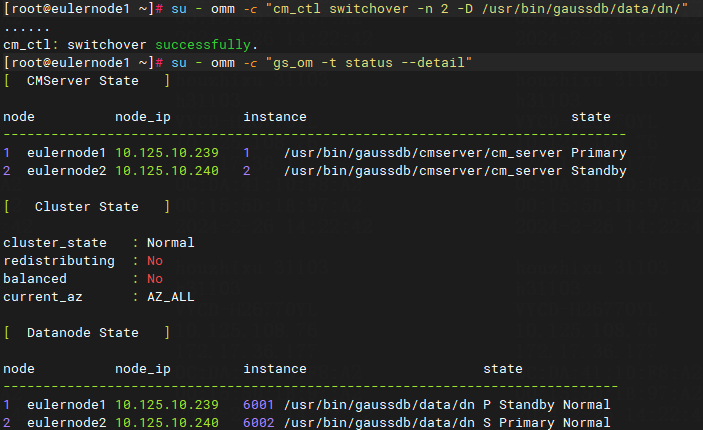
Common logs
The log messages are saved to the /usr/bin/gaussdb/log/omm directory, including the following subdirectories:
· /usr/bin/gaussdb/log/omm/om—In standalone mode, record log messages about common commands such as status checks and startups and log messages about installation and scaling.
· /usr/bin/gaussdb/log/omm/cm—In stateful failover mode, record common commands depending on components and logic log messages, such as switchover log messages.
· /usr/bin/gaussdb/log/omm/pg_log—Record data node log messages, including internal logic log messages containing actual data services.
· The remaining folders contain openGauss built-in component logs, which do not require attention.
BT component
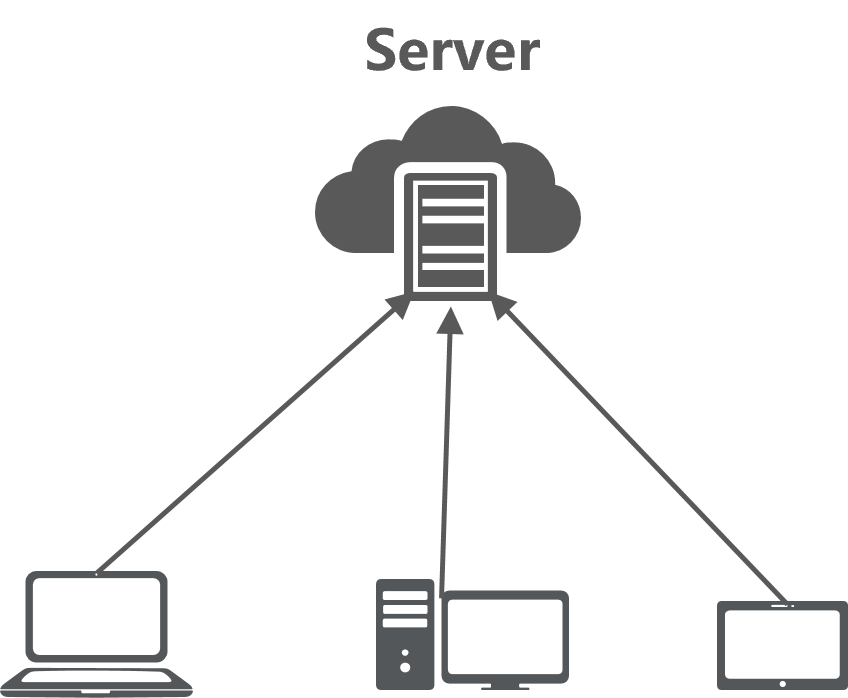
HTTP and BT are two commonly used methods for downloading files. Their main differences are as follows:
· HTTP uses a client-server model where files are stored on the server, and all clients request files from the server. If a file is too large, each client might take a long time to download it, and will maintain a connection with the server. If many clients need to download the file simultaneously, the connections significantly burden the server.
Figure 20 HTTP download model
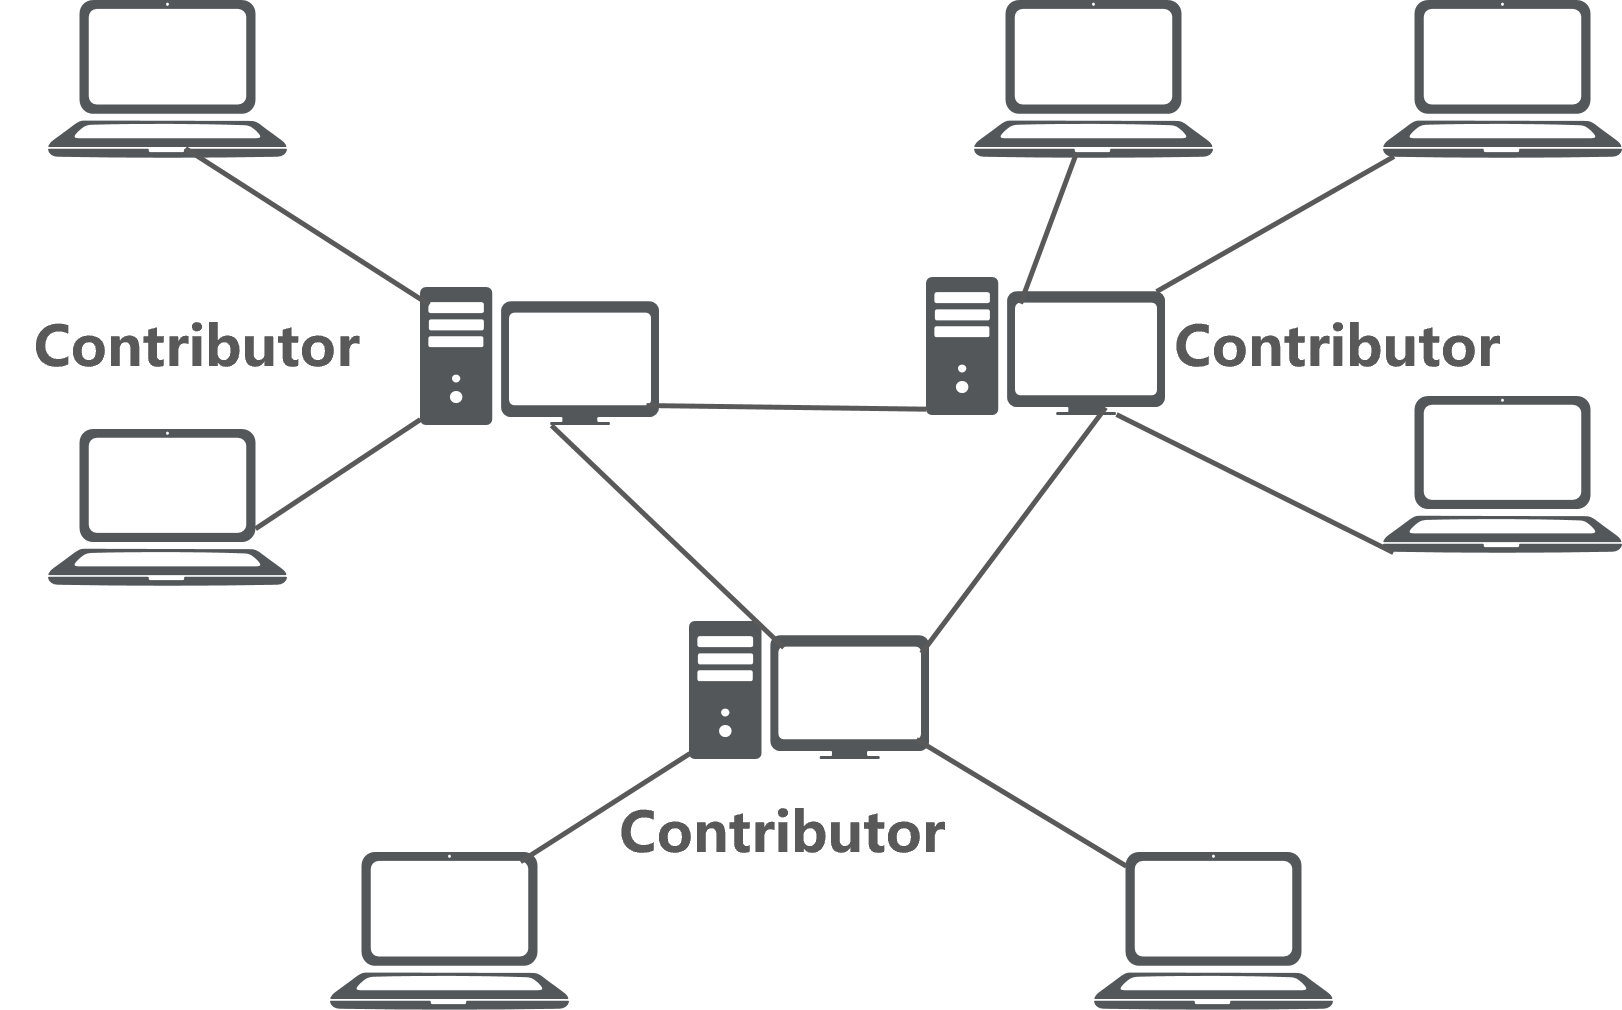
· BT uses a P2P model. When a client attempts to download a file, it first locates a host on the network that has the file, and then establishes a connection with the host to obtain the file. Each host acts as both a server and a client. As a server, a host can provide the files for other clients to download, and as a client, it can download files from other hosts. For BT, compared with HTTP, the more clients downloading, the faster the download speed.
Figure 21 BT download model
Versions earlier than E1012P10
Workspace BT is a file download service based on the open source BitTorrent component, providing download services for large file such as images, client installation packages, and agents in Workspace and Learningspace scenarios.
Workspace BT includes the following components:
· BT management service named bttorrent. For more information, see "About bttorrent."
· BitTorrent service, an open source component that provides the actual file download backend service. It is an application developed in Python based on the Bit Torrent protocol.
About bttorrent
The bttorrent service is a secondary development of the BitTorrent service, making it easier and more convenient to call BitTorrent during the development process. All core codes are in the bttorrent.sh script, located in the /var/lib/vdi/Bittorrent/bttorrent.sh directory of the main management node. The script supports using the following command parameters:
Figure 22 bttorrent.sh script parameters
![]()
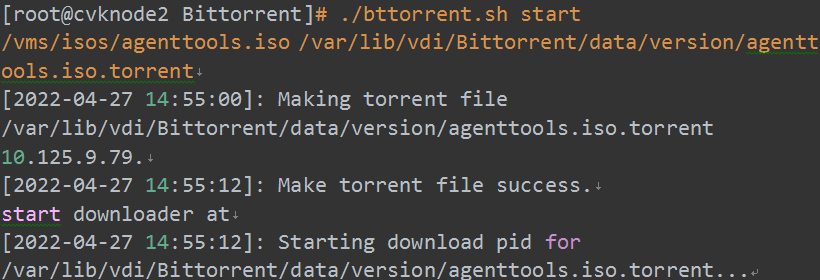
· start: Start the BT download process. This script is mainly used by developers. Command syntax: ./bttorrent.sh start original_file_path torrent_file_path. The main process includes two steps: generating a torrent file and using the torrent file to start the download process.
Figure 23 Output for the start parameter
· stop: Stop the BT download process.
Figure 24 Stop parameter
![]()
· restart: Restart the BT download process.
Figure 25 Output for the restart parameter
![]()
· status: Check the BT running status. You can view the running status of the BT tracker service and the current running download processes.
Figure 26 Output for the status parameter (running status)
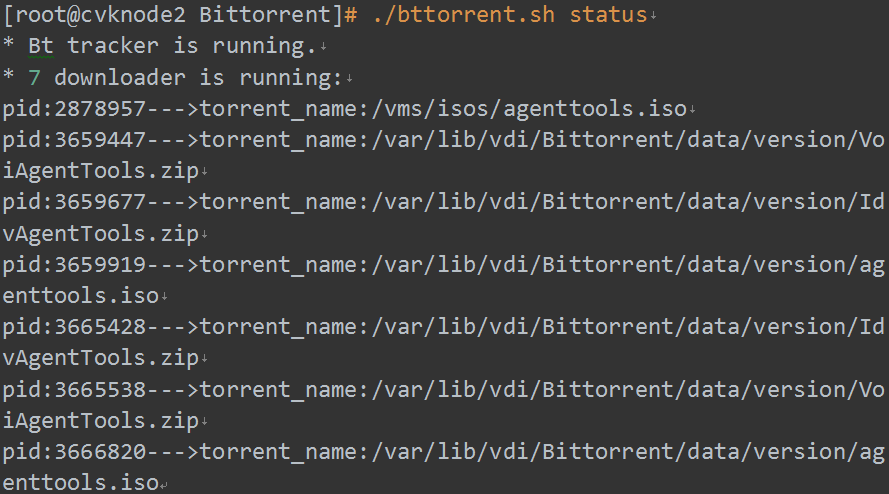
Figure 27 Output for the status parameter (not running status)
![]()
· refresh: This parameter is currently deprecated. Please do not use.
Troubleshooting common issues
1. Identify whether the status of the bttorrent service is normal.
Figure 28 Checking the status of bttorrent
![]()
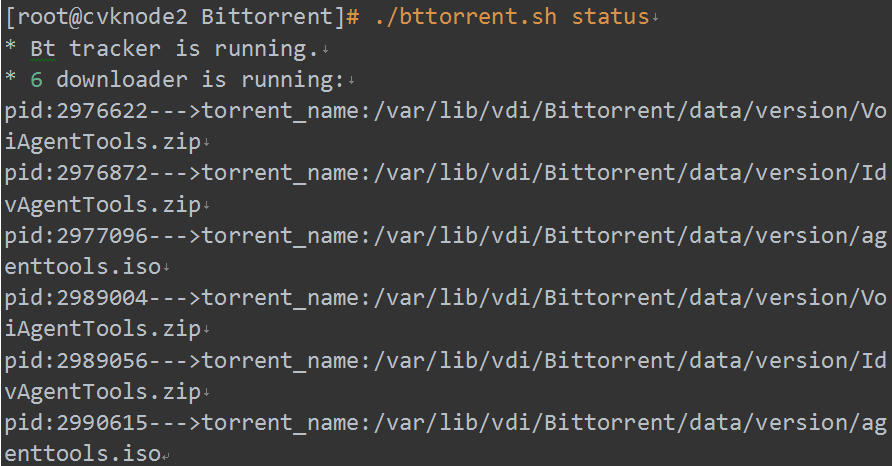
2. Identify whether the BT downloader process is normal and whether the downloader list contains files to be downloaded.
Figure 29 Checking the BT downloader process
3. Identify whether the source file and image file exist.
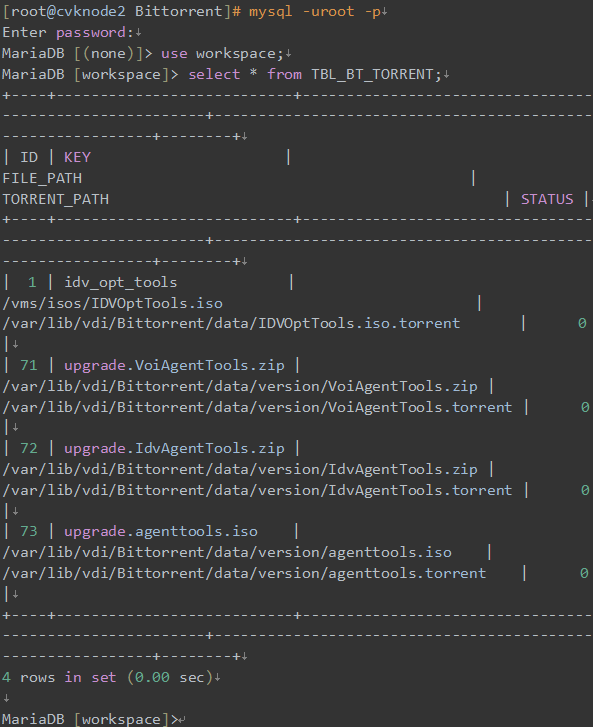
4. If the server has been restarted, the BT service will read the BT list from the database and start the downloader download process one by one. If you cannot find a file in the downloader list, check the database table for corresponding record. The FILE_PATH and TORRENT_PATH columns in the command output table displays the original file and the torrent file of each entry, respectively. You can identify whether the files exist based on the file directories.
Figure 30 Viewing the database table
5. Identify whether the communication from the client to the server on port 6969 is normal.
Figure 31 Viewing port 6969
![]()
|
|
NOTE: You can use the telnet command or access http://Space_Console_IP:6969/ on a browser to identify whether the communication from the client to the server on port 6969 is normal. |
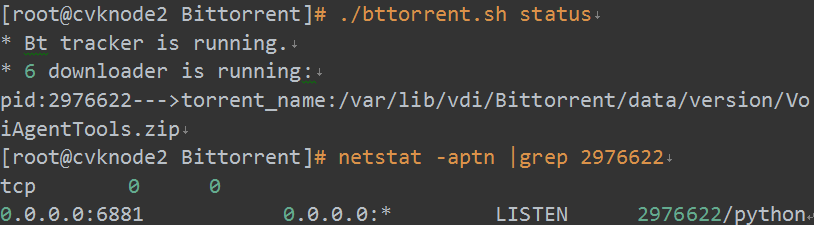
6. Each downloader occupies a port exclusively. When starting the port service, a downloader will find an available port, starting from 6881 and increasing. Figure 32 shows the command to check a specific downloader port. After querying the port, you can use related commands (such as telnet) on the client to identify whether the port communication is normal.
Figure 32 Querying a downloader port
E1012P10 and later versions
The BT component mainly includes the bittorrent-tracker and webtorrent-cli modules. The tracker module supports both IPv4 and IPv6 addresses and supports using multiple addresses. You do not need to configure the BT server address on Space Console because its address is the BT server address. If Space Console has multiple addresses, all can be used for BT download.
About the component script
The loopstart.sh script is used for periodic calls in scheduled tasks. It checks whether the torrent process exists and whether the server's address changes. A change in the server's address means the tracker address in the torrent file needs to be updated.
Collecting logs
Logs are stored on the management node, and located at the /var/lib/vdi/nodejs/logs directory. The structures of the log files are as follows:
· -rw-r--r-- 1 root root 8062 Aug 9 19:01 bt_log.log—Stores the bttorrent.sh script execution logs.
· -rw-r--r-- 1 root root 7297 Aug 9 19:01 loopstart.log—Stores the loopstart.sh script execution logs.
· -rw-r--r-- 1 root root 328 Aug 9 19:01 torrent_port_pid—Stores the torrent process records, including process ID, port, image or installation package path, and the path of the generated torrent.
· -rw-r--r-- 1 root root 47 Aug 11 13:47 tracker_ip—The tracker IP is the tracker address used to create torrent files.
Viewing processes
1. The tracker process uses port 6969, corresponding to the node.js process. To view the tracker process, execute the following command:
[root@cvknode1 logs]# ps -ef |grep 6969
root 4962 1 0 Jun14 ? 00:00:51 node /var/lib/vdi/nodejs/node-linux-x64/bin/bittorrent-tracker -p 6969 --http
2. Execute the following command to view the port number and process ID used by the WebTorrent process, as well as the process ID and port number of each torrent file's torrent process. The starting port number for a torrent process is 6881, which remains consistent with the versions earlier than E1012P10. Seeding one torrent file occupies two port numbers, a torrent port and a DHT port.
[root@cvknode1 logs]# netstat -anp |grep WebTorrent
tcp6 0 0 :::6881 :::* LISTEN 46610/WebTorrent
tcp6 0 0 :::6883 :::* LISTEN 42602/WebTorrent
udp 0 0 0.0.0.0:6771 0.0.0.0:* 42602/WebTorrent
udp 0 0 0.0.0.0:6771 0.0.0.0:* 46610/WebTorrent
udp 0 0 0.0.0.0:6882 0.0.0.0:* 46610/WebTorrent
udp 0 0 0.0.0.0:6884 0.0.0.0:* 42602/WebTorrent
|
|
NOTE: Identify whether the client can access the torrent port and DHT port. You can use the telnet command on the client for check. |
Accessing the tracker statistics page
The tracker statistics page displays the usage of the torrents. To access the statistics page, type http://Console_Space_IP:6969/stats on a browser.
Troubleshooting common issues
1. Identify whether the corresponding source file record exists in a torrent_port_pid log file. If the record does not exist, the torrent process will not exist either, and BT downloads cannot be performed. If the record exists, verify whether the process is running correctly.
[root@cvknode1 logs]# cat /var/lib/vdi/nodejs/logs/torrent_port_pid |grep Workspace_App //Check the source file records
46610 6881 /var/lib/vdi/Bittorrent/data/version/H3C_Workspace_App-E1013-win32.zip /var/lib/vdi/Bittorrent/data/version/H3C_Workspace_App-E1013-win32.torrent
[root@cvknode1 logs]#
[root@cvknode1 logs]# ps -ef |grep 46610 //Identify whether the process is running normally
root 46610 1 0 Jun17 ? 00:41:43 WebTorrent
root 67292 64960 0 14:22 pts/10 00:00:00 grep --color=auto 46610
2. If the process exists, identify whether the torrent file information is correct. The red text below containing the announce word is the tracker addresses. As long as the client can connect to any of these addresses, it can perform a BT download.
[root@cvknode1 logs]# webtorrent info /var/lib/vdi/Bittorrent/data/version/H3C_Workspace_App-E1013-win32.torrent //View torrent file information
WebTorrent: uTP not supported
{
"name": "H3C_Workspace_App-E1013-win32.zip",
"announce": [
"http://10.114.103.174:6969/announce",
"http://192.168.3.174:6969/announce",
"http://[2022:2022::3:174]:6969/announce"
],
"infoHash": "3d48aac756cfa080595e9dbac2e05dbbc3902b40",
"created": "2022-06-17T07:28:03.000Z",
"createdBy": "WebTorrent <https://webtorrent.io>",
"urlList": [],
"files": [
{
"path": "H3C_Workspace_App-E1013-win32.zip",
"name": "H3C_Workspace_App-E1013-win32.zip",
"length": 260873190,
"offset": 0
}
],
"length": 260873190,
"pieceLength": 262144,
"lastPieceLength": 39910,
"pieces": [
3. If all the above steps are completed, you can use a BT client to download the torrent file for test. If the test is successful, identify whether the issue is on the client side.
4. Collect upgrade download logs from the C:\Program Files (x86)\H3C\SpaceAgent\log directory on the client to check for relevant information.
VDP protocol
About the VDP protocol
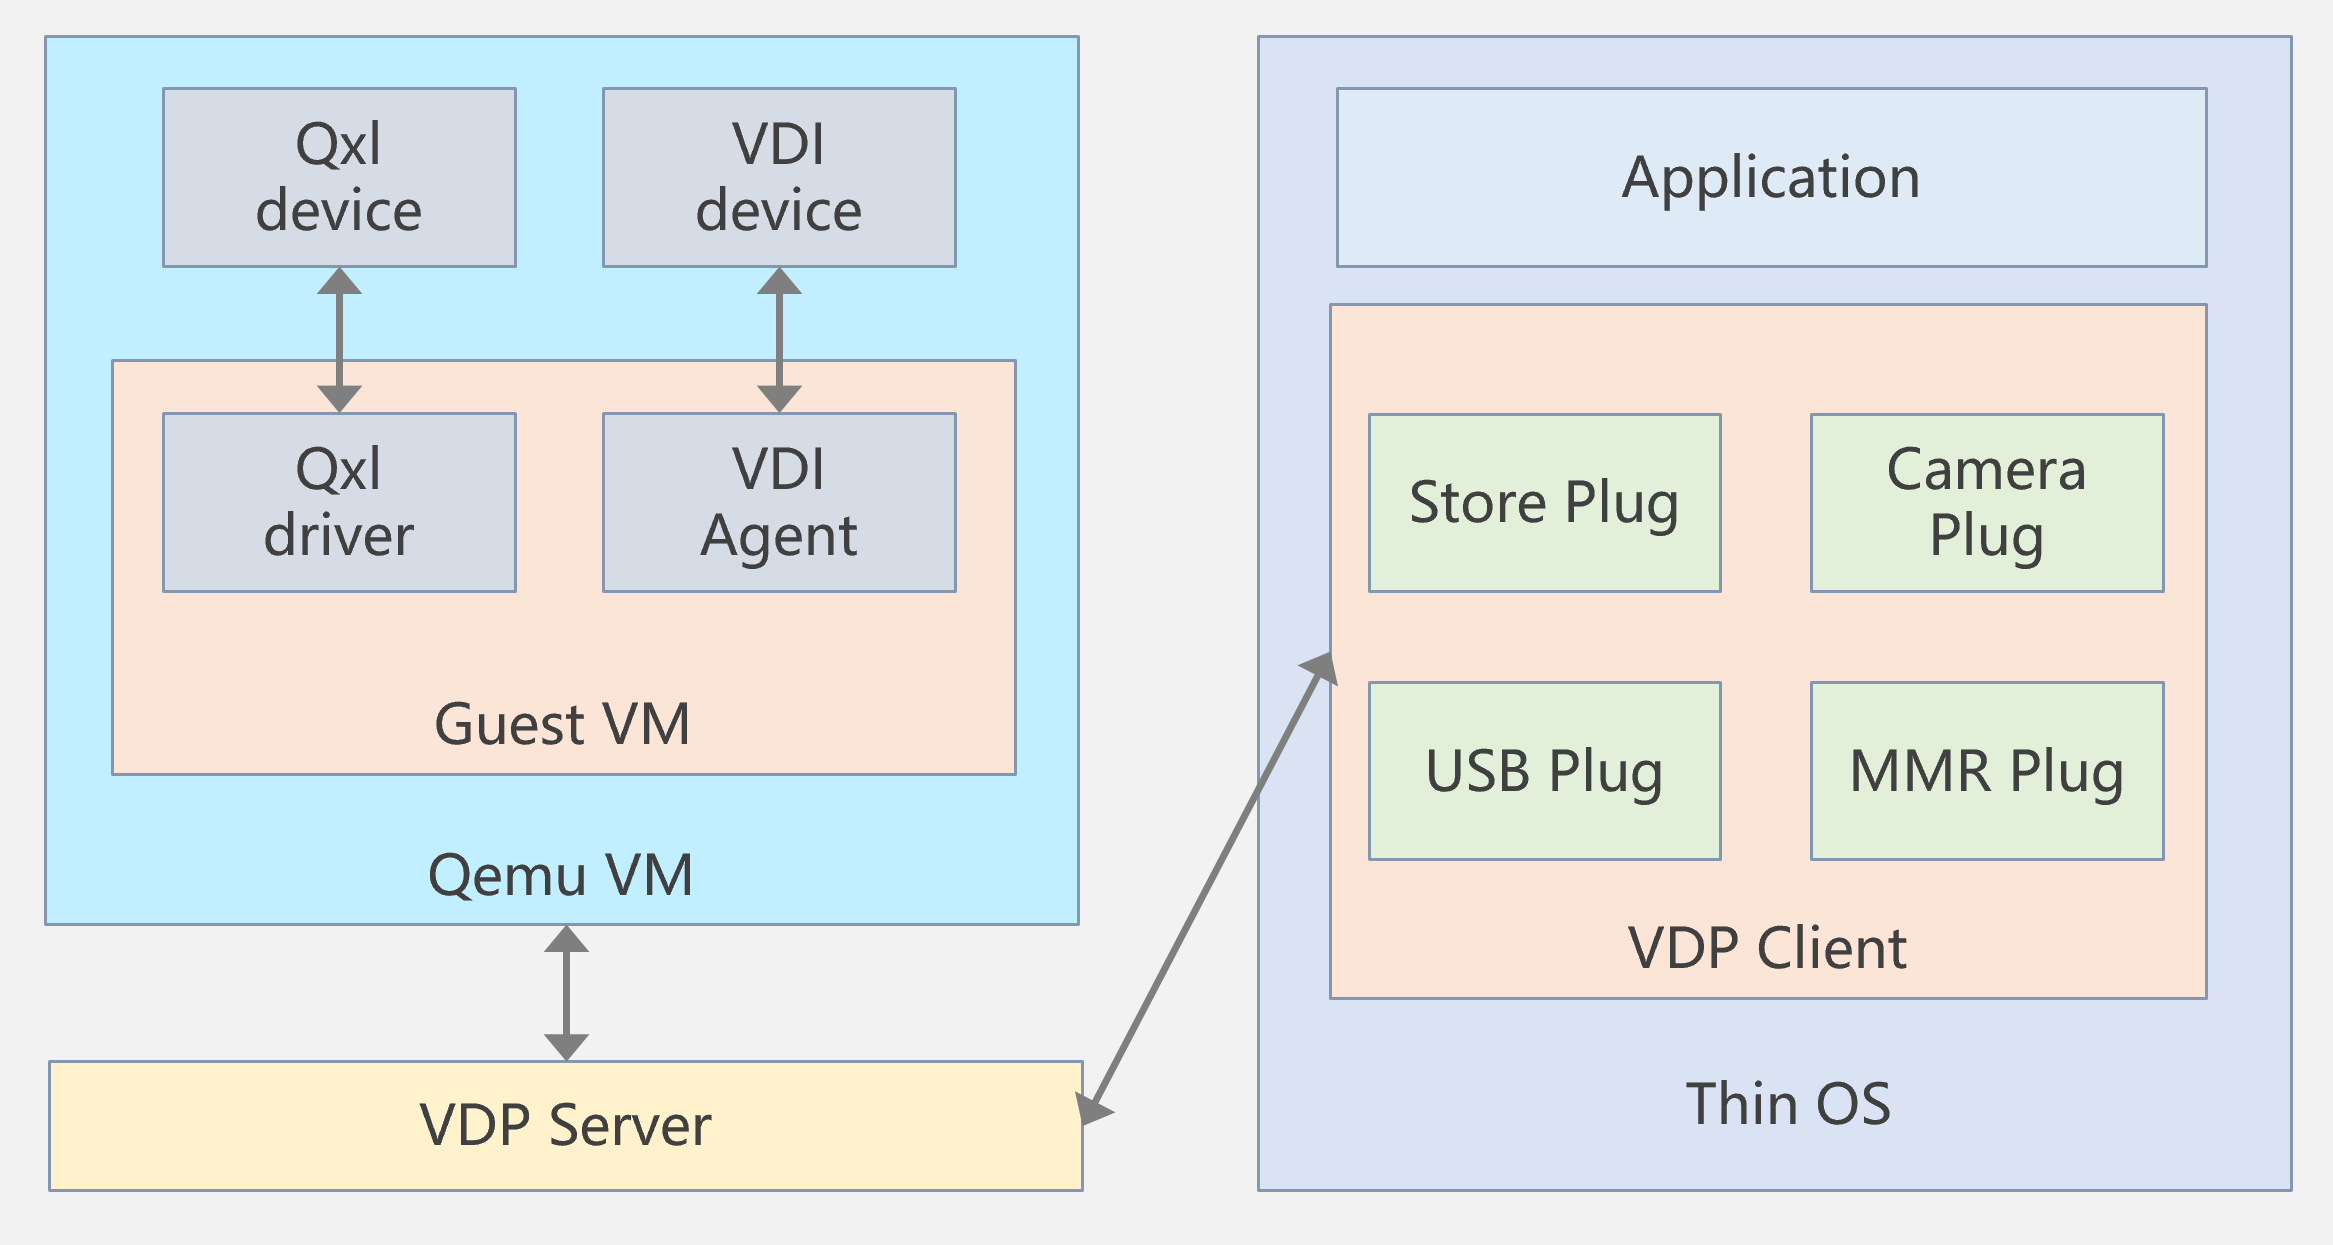
Virtual Desktop Protocol (VDP) is the fundamental protocol that connects the VDP server and the VDP client.
The VDP server obtains rendering commands and cursor commands from the VM through the Qxl device, and communicates internally with the VM through the VDI device.
The VDP client runs on devices such as a thin client or PC. The VDP client communicates with the VDP server and processes the commands sent from the VDP server. The VDP client provides basic functions of displaying the VM desktop and interacting with the VM. The VDP client uses plugins to load extended services, providing a data transfer channel. The mechanism of the virtual channel service is similar to that of the RDP protocol virtual channel. Plugins are added as dynamic libraries, and the VDP protocol automatically loads the corresponding plugins to enable the respective services. Service data communicates with programs in the VM through the VDP protocol channel. The service data communicates with programs in the VM through the VDP protocol channel.
Figure 33 VDP protocol module
About the VDP mode
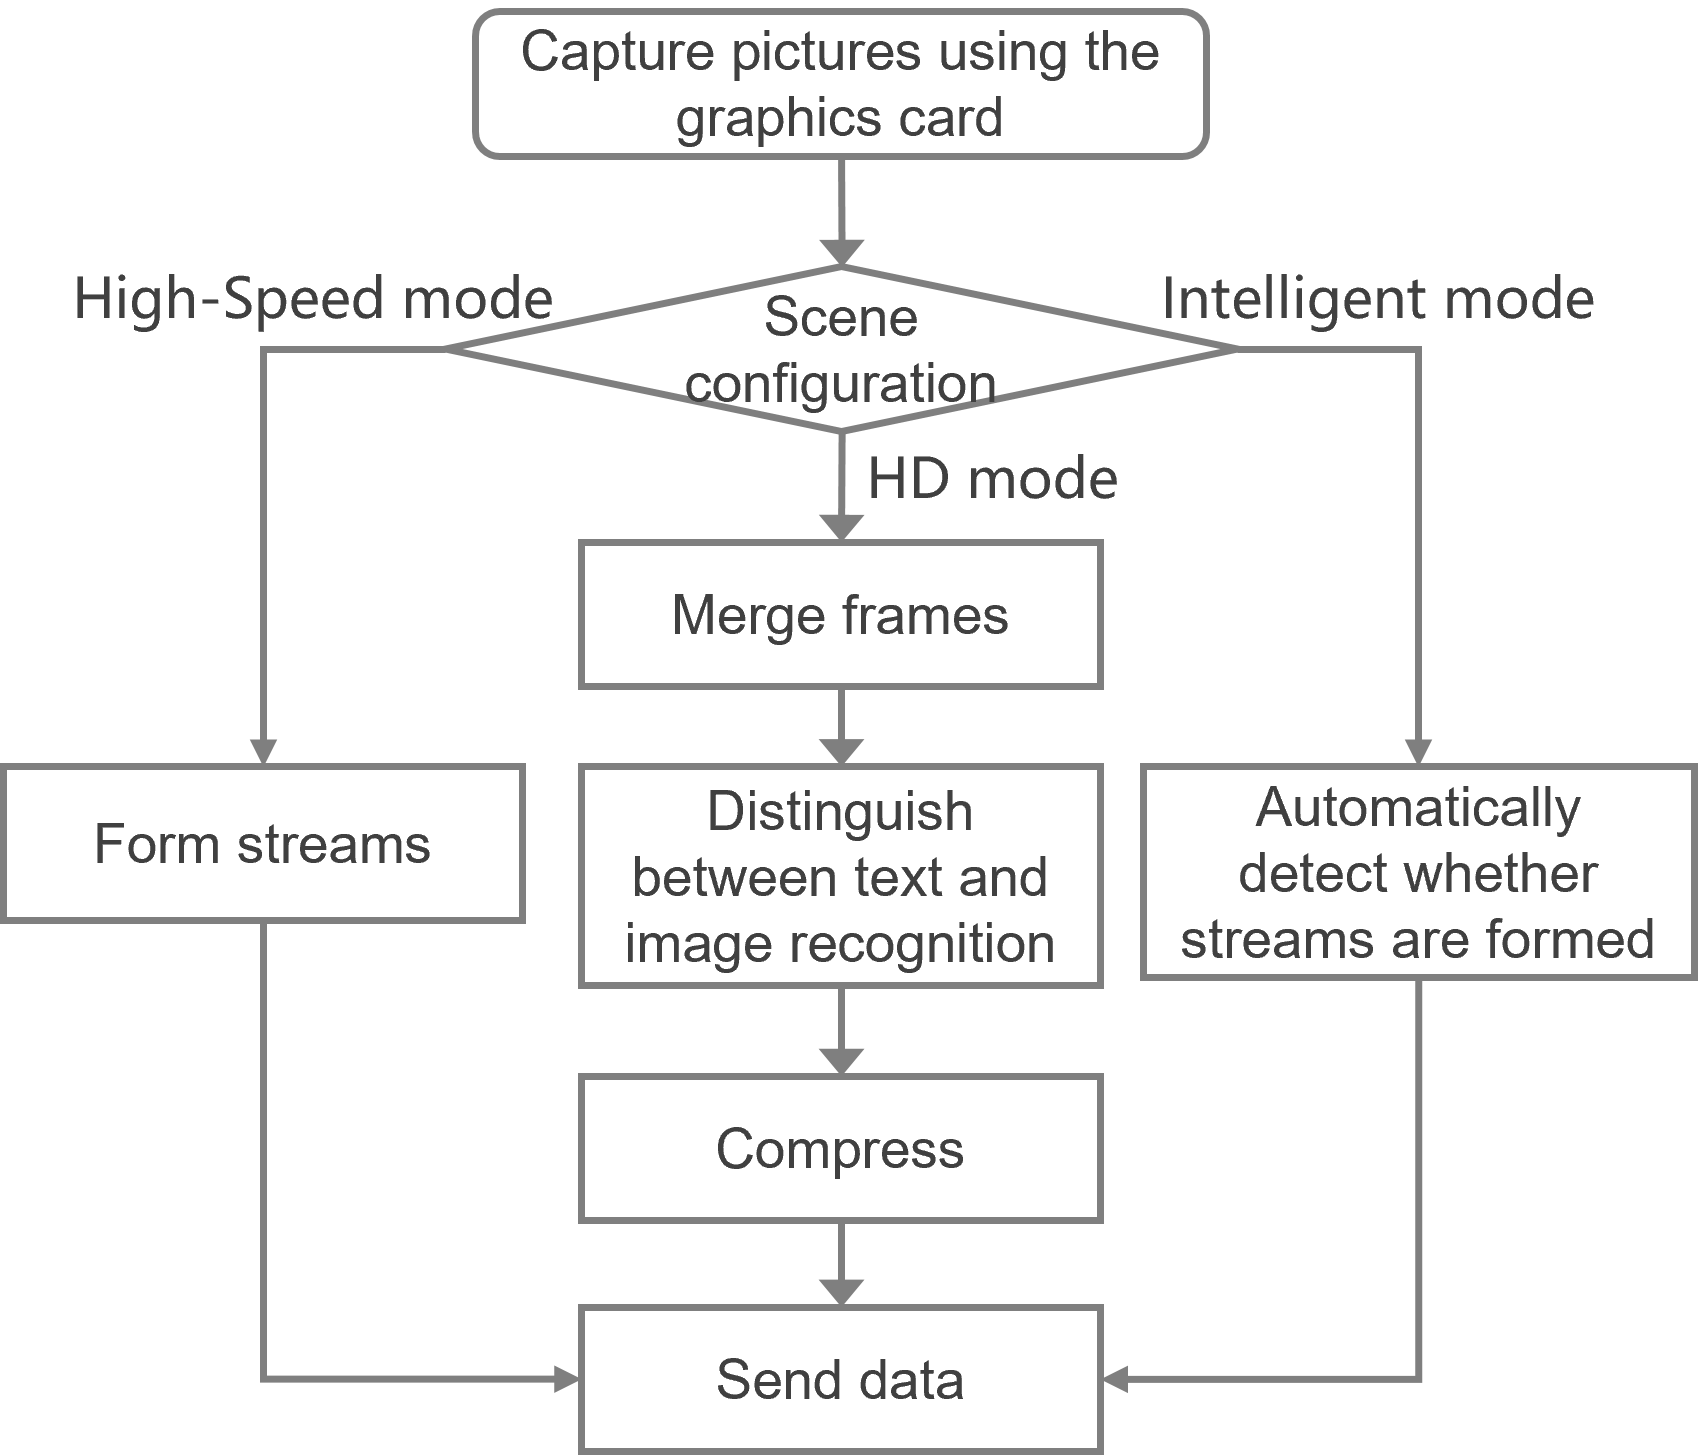
The VDP protocol supports using the following modes in different scenarios:
· HD mode—Mainly used in common office scenarios, and supports HD lossy and HD lossless.
· High-speed mode—Mainly used for video scenarios where the bandwidth is relatively low.
· Intelligent mode—Automatically detects the current scenario and switches the image compression algorithm accordingly.
Figure 34 Processing flows for different modes
Troubleshooting common issues
Client failed to connect the VM
1. Identify whether the client can access Space Console and the IP used for client access on the host normally.
2. Use the telnet or SSH command, or tcping tool to troubleshoot whether the host has opened the SPICE console port for the VM.
3. For the gateway access scenario, identify whether the client is connected to the gateway IP and whether the gateway's external port is open.
4. If the client cannot connect to the VM after login, try clearing the files in the following directory and restarting the client to connect to the VM.
¡ Windows client: C:\Users\current_user\Documents\Workspace\vdps.
¡ SpaceOS client: /home/spaceos/Documents/Workspace/vdps.
5. If the client system is Windows 10, identify whether the controlled folder access feature is disabled on the Windows Security > Virus & threat protection > Ransomware protection > Controlled folder access page. If the feature is enabled, disable it and then try again.
|
|
NOTE: The SPICE console port number on the VM is not fixed. To obtain the SPICE console port number, navigate to the Edit page of the VM on Space Console and then click the Console > Console SPICE tab. |
Sudden disconnection during VM use
The client pops up a message indicating that an exception occurred in the communication between the client and the server where the VM is located, or that the client is disconnected from the cloud desktop.
1. Identify whether the network between the client and the host is normal, and whether the TCP connection between the client and the VM SPICE console port on the host is normal. You can continuously ping the host IP from the client and check the ping results when the issue reoccurs. If the client is a Windows client, use the tcping tool as a best practice.
2. For a gateway access scenario, identify whether the connection from the client to the gateway IP and gateway port is stable.
3. Identify whether the TCP aging time of network devices (such as firewalls, routers, and Layer 3 switches) between the client and the host is too short.
VM lags
1. Identify whether the network bandwidth between the client and the host is too small, and whether the latency is too high. If so, optimize the network.
2. On Space Console, identify whether the VM's disk IO latency and disk request IOPS have peaks during the lags. If so, troubleshoot the storage or CAS virtualization component.
3. Identify whether the CPU usage and memory usage are too high inside the VM. If the usages are high, identify the processes consuming the most resources.
4. For VMs without vGPU cards, try changing the advanced settings of the client: set the image compression to lossy, or set the scene to the high-speed mode and set the decoding mode to hardware decoding. For VMs with vGPU cards, try changing the decoding mode to hardware decoding in the client's advanced settings. Disconnect and reconnect the VM for the changes to take effect.
5. Identify whether software that consumes a lot of GPU (such as AutoCAD) is running on the VM. If so, use vGPU cards as a best practice.
6. Try shutting down the VM normally and then restarting it (not rebooting).
7. Try connecting the VM to a client with higher specifications.
No response from the mouse and keyboard
1. Disconnect the client from the VM and identify whether the mouse and keyboard work normally on the local end. If not, try replacing them.
2. If you use a USB keyboard or mouse, troubleshoot the USB redirection policy to identify whether the device has been redirected to the VM.
3. If the mouse is unresponsive but the keyboard works normally, identify whether the vdservice.exe and vdagent.exe processes are running normally inside the VM. In addition, identify whether the Spice Agent service is running normally and try restarting it.
4. If the keyboard is unresponsive but the mouse works normally, connect the client to a different VM and identify whether the same issue occurs.
5. Try shutting down the VM normally and then restarting it (not rebooting).
VM cannot play sound
1. Identify whether the client can play sound normally.
2. Identify whether the VM and client system are muted and whether the playing volume is set to 0.
3. Identify whether the VM has a sound card device and whether the sound card driver is working normally, and whether the VM has been restarted after installation of the sound card and driver.
4. If you use a USB speaker or headphone, troubleshoot the USB redirection policy to identify whether the device has been redirected to the VM.
5. If choppy or noisy sounds exist during playing, identify whether identify whether the same issue occurs during normal operation of the VM. Try connecting the VM to a different client or connecting the client to a different VM to identify whether the same issue occurs.
6. Try shutting down the VM normally and then restarting it (not rebooting).
VM cannot record sound
1. Identify whether the client can record sound normally.
2. Identify whether the microphone on the VM or client system is muted and whether the microphone volume is set to 0.
3. Identify whether the VM has a sound card device and whether the sound card driver is working normally, and whether the VM has been restarted after installation of the sound card and driver.
4. If you use a USB microphone, troubleshoot the USB redirection policy to identify whether the device has been redirected to the VM.
5. If choppy or noisy sounds exist during playback of the recorded sounds, identify whether identify whether the same issue occurs during normal operation of the VM. Try connecting the VM to a different client or connecting the client to a different VM to identify whether the same issue occurs.
6. Try shutting down the VM normally and then restarting it (not rebooting).
Video playing lags on VM
1. First identify whether the video source itself is choppy or has a low frame rate. Then troubleshoot according to "VM lags."
2. Identify whether there is any lag when you play the video directly on a physical device.
3. Check the video player and related advanced settings on the client:
¡ For VMs without vGPU, as a best practice, use PureCode or SPlayer rather than the built-in Windows Media Player for video playing. Identify whether you have set the mode to the intelligent mode or high-speed mode in the client's advanced settings. The HD mode is currently not suitable for video playing.
¡ For VMs with vGPU cards, try changing the decoding mode to hardware decoding in the client's advanced settings.
4. Try shutting down the VM normally and then restarting it (not rebooting).
5. Use a client with higher specifications
VM gets stuck and becomes unresponsive during use
1. Identify whether the client tool bar is displayed normally and can be clicked, and whether it allows returning to the client system. If not, exceptions might occur on the client or client system. Try disconnecting and reconnecting the client or restarting the client system.
2. Identify whether the mouse or keyboard is unresponsive by viewing the VM screen for any updates (such as changes in system time or the interface activities when you operating the VM connected to the client on the console). If the mouse or keyboard is unresponsive, see "No response from the mouse and keyboard" for troubleshooting.
3. If the VM console on Space Console operates normally or can send keystrokes normally, try disconnecting and reconnecting the client or restarting the client system.
4. If the VM console on Space Console is also unresponsive, and disconnecting and then reconnecting the client or restarting the client system does not work, the VM system might get stuck. Try using RDP or authorizing another user to log in to the VM. If the issue persists and you want to quickly recover, try performing the safe shutdown and restart, reboot, and power off and then restart operations in sequence on the VM through Space Console.
Peripherals
H3C Workspace cloud desktop supports map local peripherals of a local endpoint for use on the cloud desktop by using local resource mapping or USB redirect. This chapter mainly introduces troubleshooting methods during peripheral use to quickly locate and resolve peripheral issues on the cloud desktop.
OS compatibility
Peripheral redirect is compatible with the following OSs:
· Endpoint OSs: Windows7, Windows10, SpaceOS, UOS, NeoKylin, and KylinOS.
· Cloud desktop OSs: Windows XP, Windows 7, Windows 10, Linux (see the specific operating systems in the table below).
Table 4 Linux cloud desktop OSs compatible with peripheral redirect
|
OS |
OS architecture |
OS versions |
|
UOS |
X86 |
uos-sp2-desktop-amd64.iso uos-sp2-server-amd64.iso |
|
ARM64 |
uos-arm-sp2-compile.iso |
|
|
Ubuntu |
X86 |
14.04 |
|
CentOS |
X86 |
6.9, 7.5 |
|
KylinOS |
X86 |
Kylin-Desktop-V10-Release-Build1-20200710-2-x86_64.iso Kylin-Desktop-V10-SP1-RC1-Build01-20210326-x86_64.iso |
|
ARM64 |
Kylin-Desktop-V10-Release-Build1-20200710-arm64.iso |
|
|
Mips64 |
Kylin-Desktop-V10-Release-Build1-20201026-mips64el.iso |
|
|
LINX |
X86 |
6.0.60, 6.0.80 |
|
SUSE |
X86 |
12 |
Restrictions and guidelines
· To use peripherals locally on endpoints, do not enable USB redirect for these peripherals.
· VDP has separate input, audio, and recording channels, and mouse, keyboard, microphone, and speaker do not need redirect.
· As a best practice, use local resource mapping for local resources, such as cameras, disks, serial devices, and parallel port devices, to redirect these local resources to the cloud desktop. Other devices are recommended to use USB redirect. If local resource mapping for redirect is not effective, apply USB redirect to cameras and disks. Serial port devices and parallel port devices must be connected to USB adapter cables before you use USB redirect.
· To enable a USB drive in NTFS format to be read-only, you can redirect the USB drive by using local resource mapping. Encrypted USB drives can only be redirected via USB redirect. To open .mlx project files via MATLAB software from a USB drive and edit them in real time, USB redirect is also required.
· USB redirect transmits USB hardware details. This might cause bandwidth consumption issues if you use devices like cameras and scanners via USB redirect. As a best practice, do not use USB redirect for image devices in low-bandwidth scenarios with less than a gigabit capacity.
· Storage devices on SpaceOS endpoints use the NTFS file system. If the read-only mode is enabled, the endpoints might display only drive letters without the capacity or contents.
· When the network connection between the cloud desktop and Space Console fails, the storage devices redirected to the cloud desktop might be set to read-only mode.
· Some peripherals are developed and adapted by device manufacturers specifically for certain OSs, while their drivers might not conform to standard specifications. These peripherals might operate correctly on a PC, but might face compatibility issues on a VM. Compatibility adaptation is required for these devices in the virtual environment.
Configuration and debugging methods
USB redirect
1. Enable USB redirect globally when you create or edit a policy group, and then enable USB redirect for a device as needed.
Figure 35 Enable USB redirect
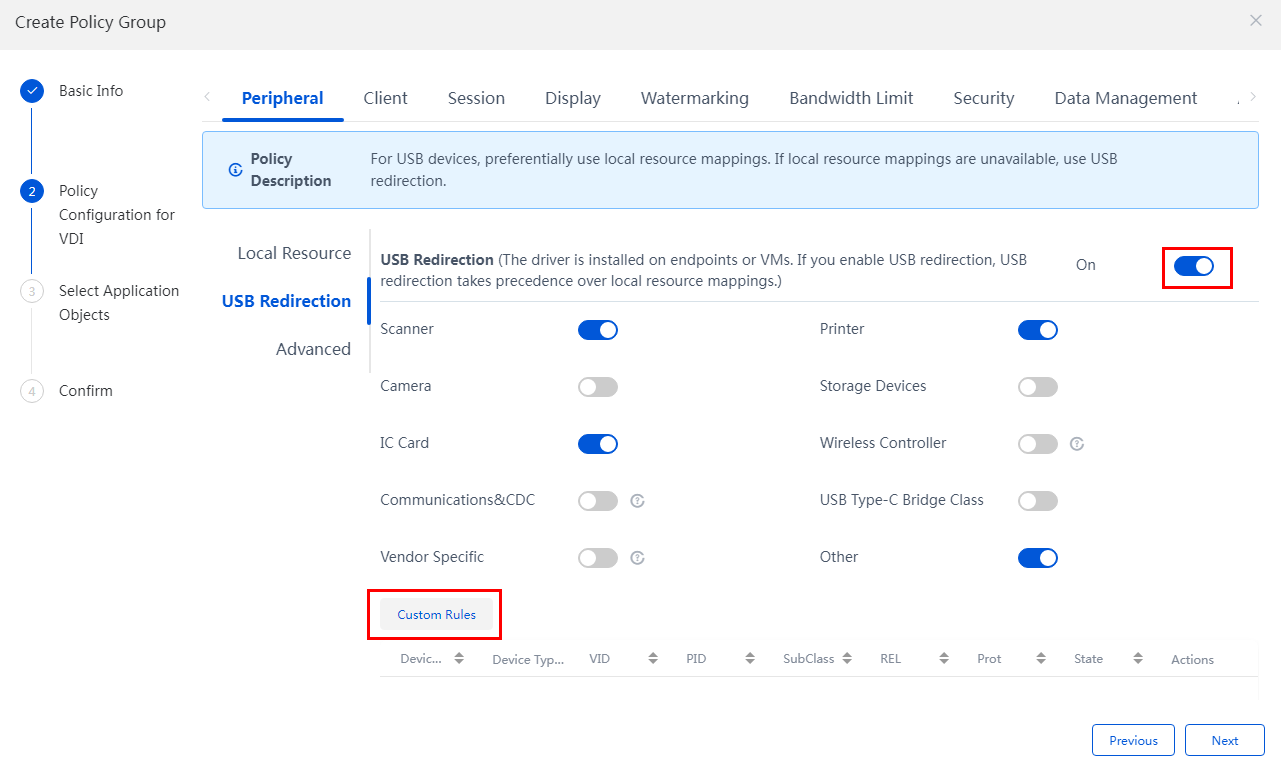
2. For some devices, such as HID devices, certain storage devices, and adapters, you can configure custom rules to define whether to redirect these devices to the cloud desktop.
Figure 36 Adding a custom rule
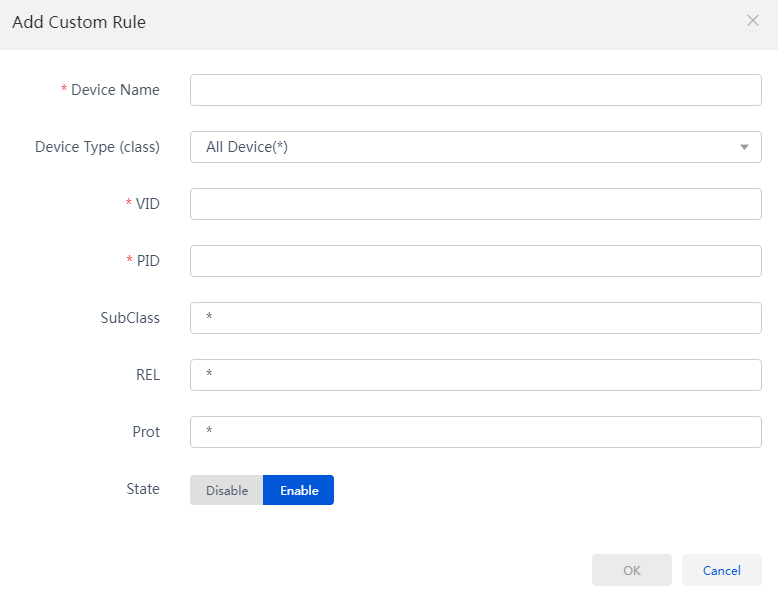
Camera redirect
If the network bandwidth is insufficient or the virtual desktop configuration is low, use camera redirect for peripheral cameras as a best practice.
Configuration procedure
For information about how to configure camera redirect, see H3C Workspace Cloud Desktop Camera Redirect Configuration Guide (Office Scenario).
Viewing camera status
After cameras are redirected to the cloud desktop by using local resource mapping, you can view the camera status from the device manager of the cloud desktop.
Figure 37 Viewing camera status
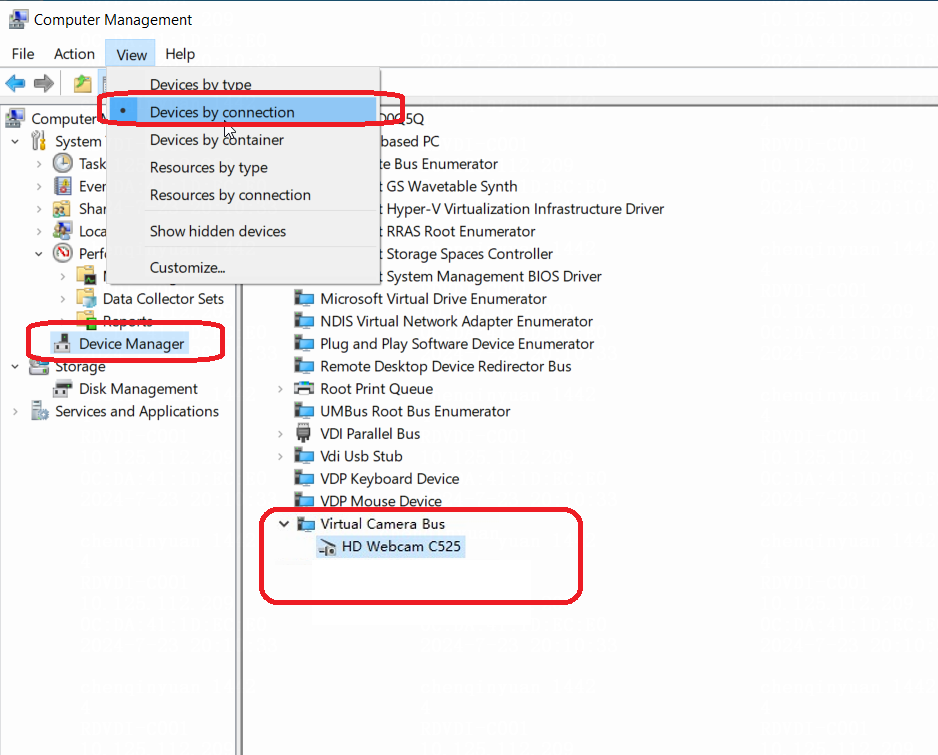
Debugging method
1. Obtain the debugging tool:
¡ In a version earlier than E1012, enter http://Space Console IP:8083/download/software/, and click cameratools.zip. Then, decompress the file to obtain the GraphEdit tool (graphedt_x86.exe or graphedt_xp.exe).
Figure 38 Obtaining the debugging tool (earlier than E1012)
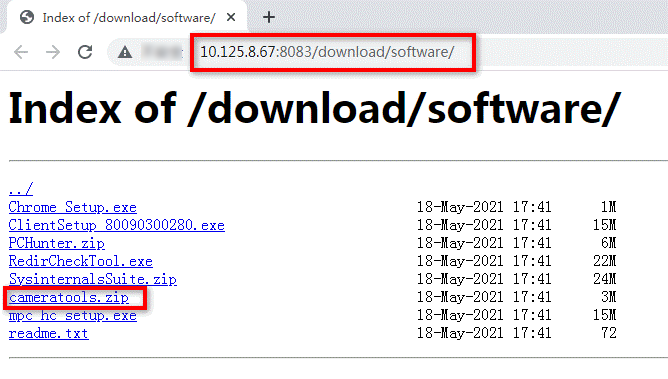
¡ In E1012 and later, on the Space Console login page, click App Download in the upper right corner. Click the Other tab, and then click the download button for cameratools.zip. After the download, decompress the file to obtain the GraphEdit tool (graphedt_x86.exe or graphedt_xp.exe)
Figure 39 Obtaining the debugging tool ( in E1012 and later) (1)
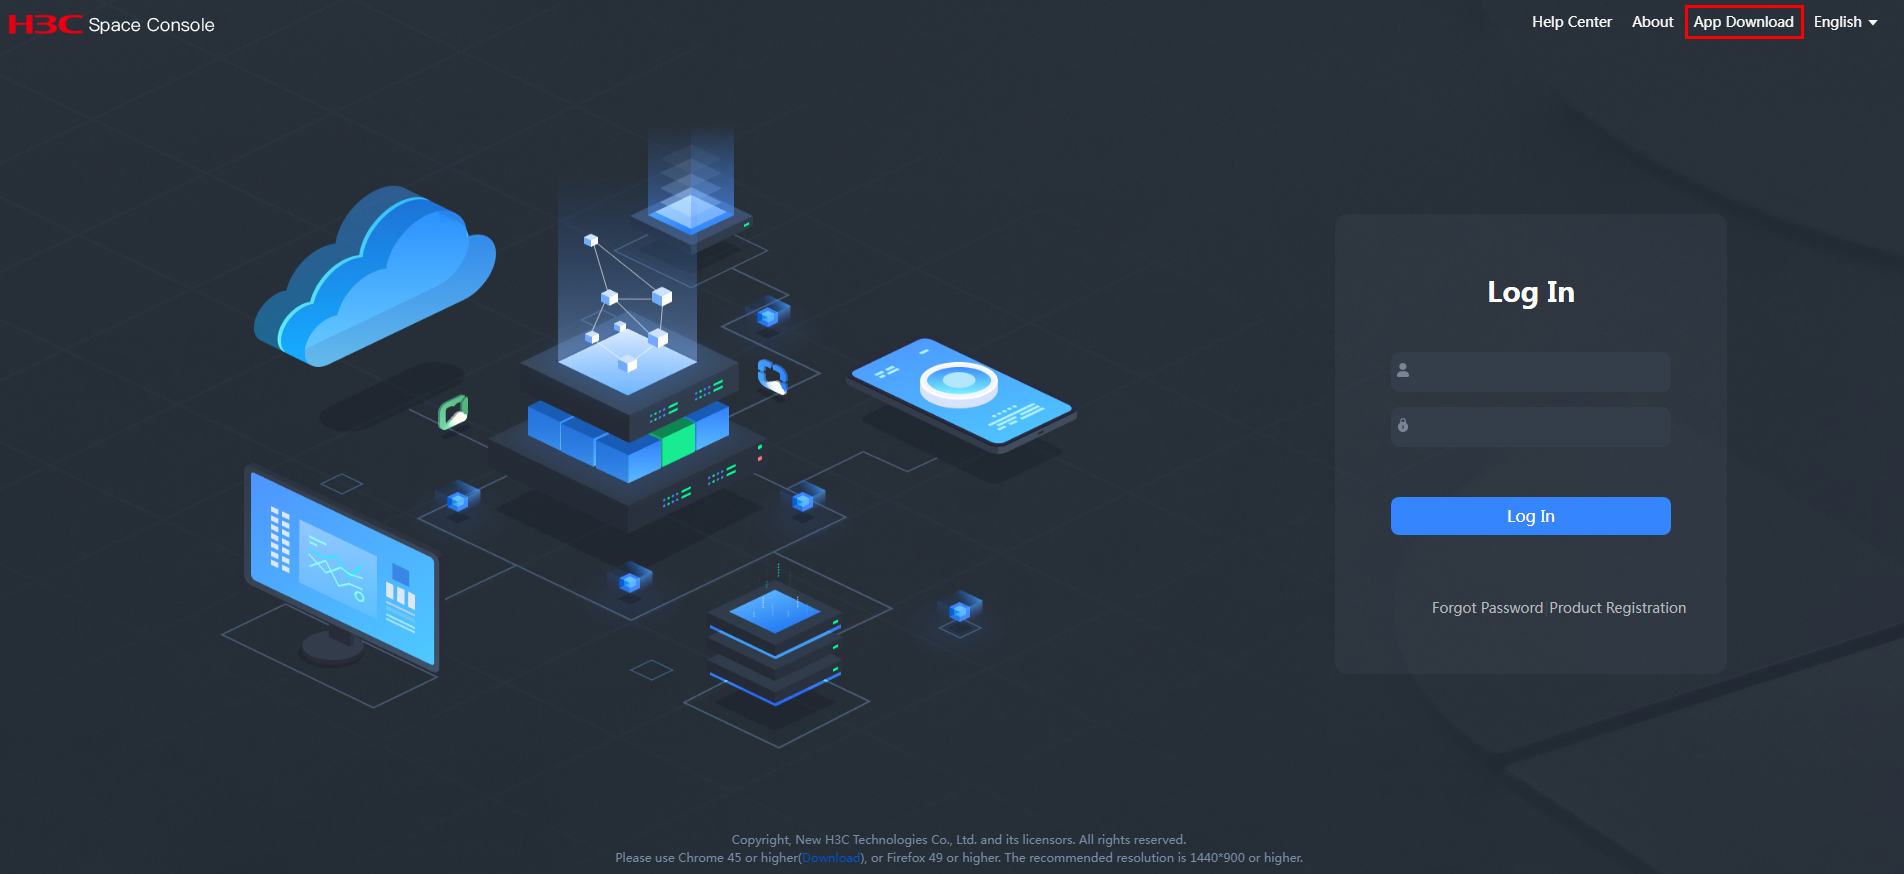
Figure 40 Obtaining the debugging tool ( in E1012 and later) (2)
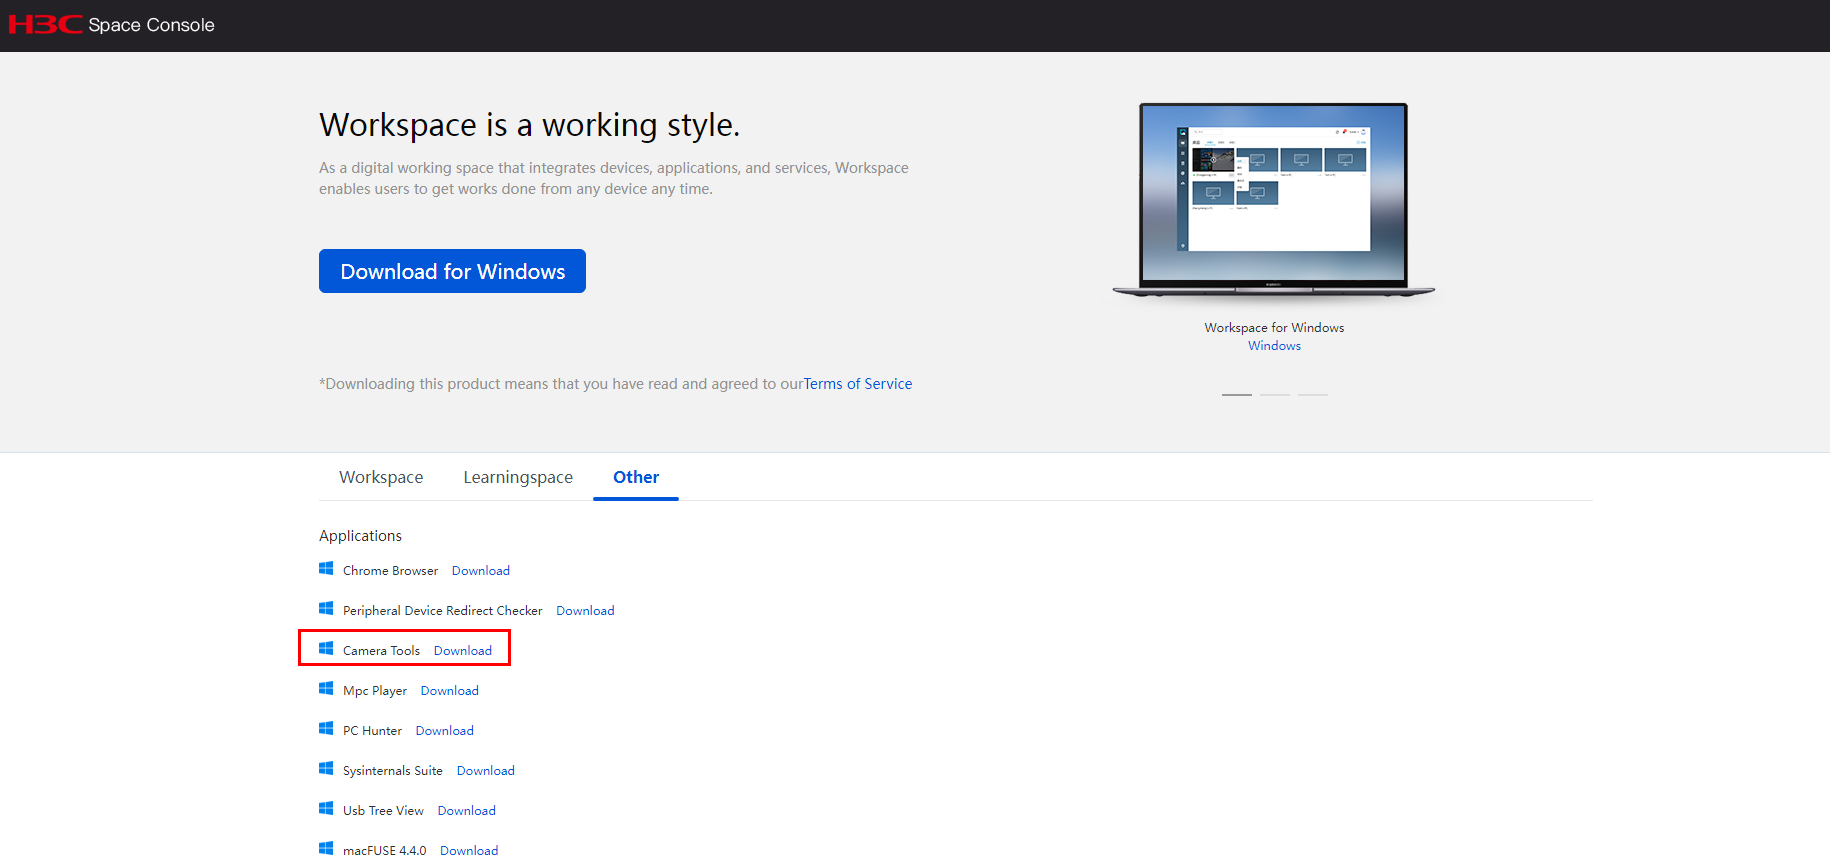
2. Run the GraphEdit tool and select Graph > Insert Filters.
Figure 41 GraphEdit tool
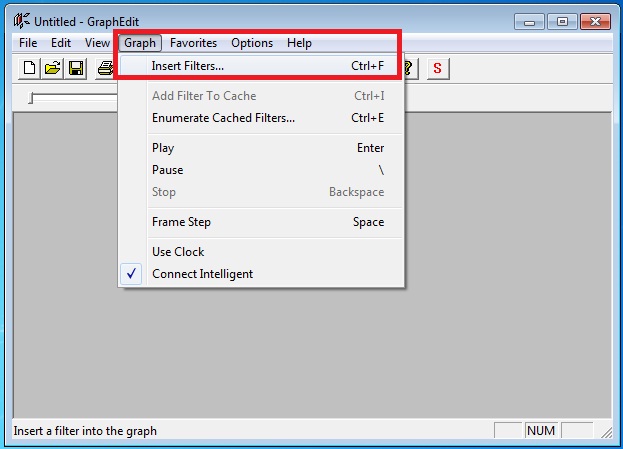
3. In the dialog box that opens, select the camera to be redirected to the cloud desktop and click Insert Filter. Then, click Close.
Figure 42 Selecting cameras
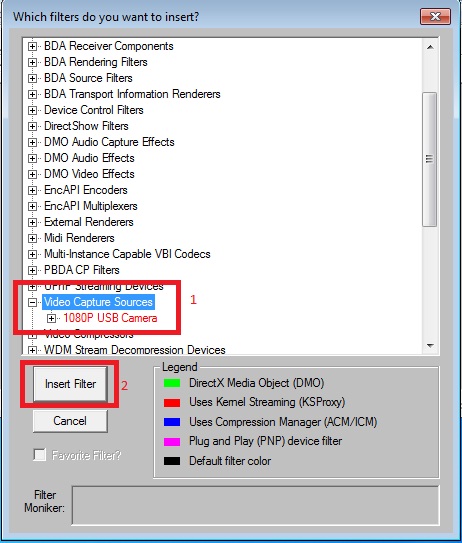
4. Right-click on the square button on the right side of the camera's frame and select Pin Properties.
Figure 43 Pin Properties
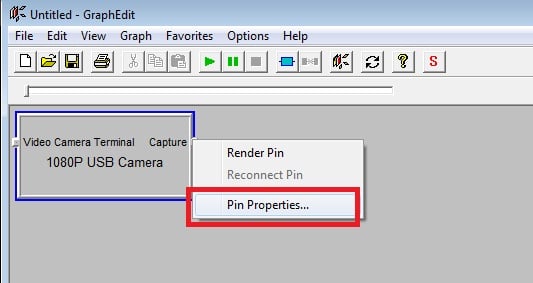
5. Configure camera parameters and click OK.
Figure 44 Configuring camera parameters

6. Right-click on the square button on the right side of the camera's frame again and select Render Pin to generate Video Render.
Figure 45 Selecting Render Pin
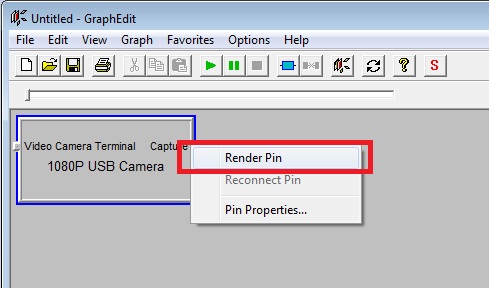
7. Click the run button to obtain the camera's view.
Figure 46 Running the camera
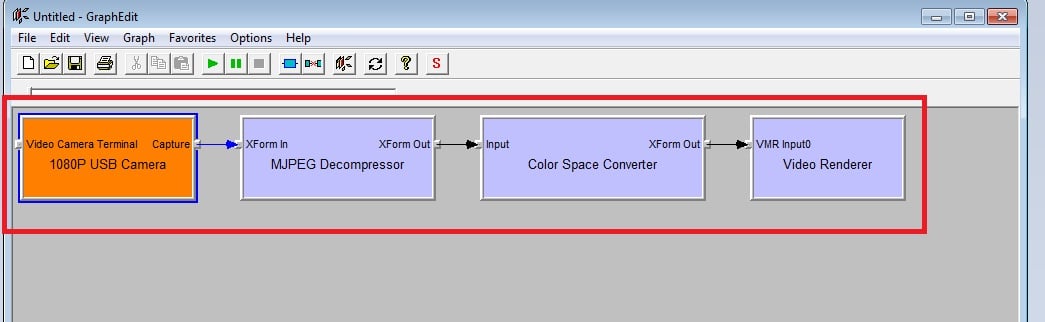
Figure 47 Camera debugging succeeded
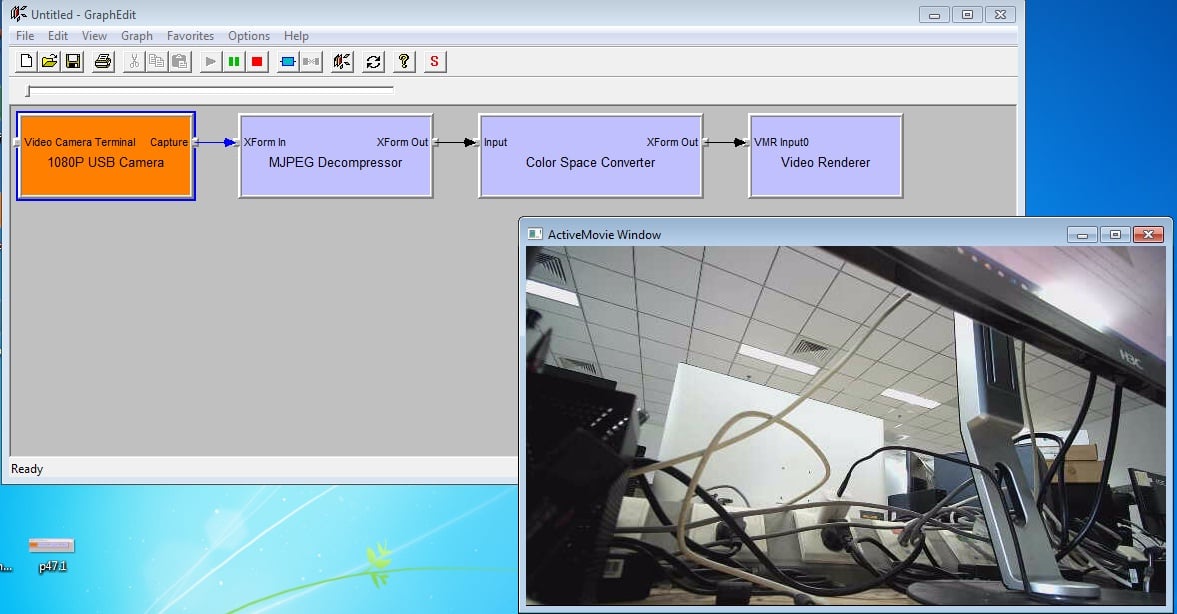
Disk mapping for storage devices including USB disks
As a best practice, use disk mapping for redirecting storage-type USB devices such as USB disks and hard disks to a cloud desktop.
· If USB redirect is disabled, enable Disk in the Local Resource Mappings section, as shown in Figure 50.
· If USB redirect is enabled, disable Storage Devices in the USB Redirection section except for enabling Disk in the Local Resource Mappings section, as shown in Figure 51.
Figure 48 Enabling Disk for Local Resource Mappings
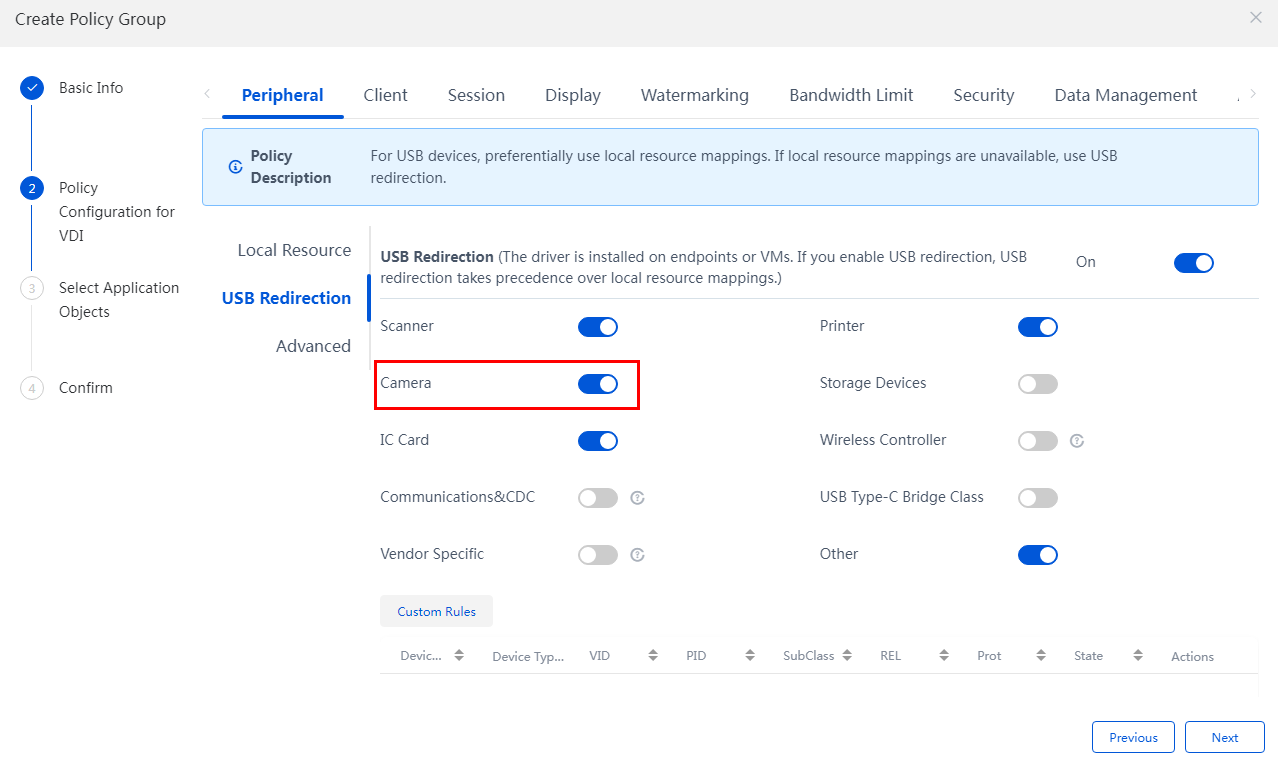
Figure 49 Disabling Storage Devices for USB Redirection
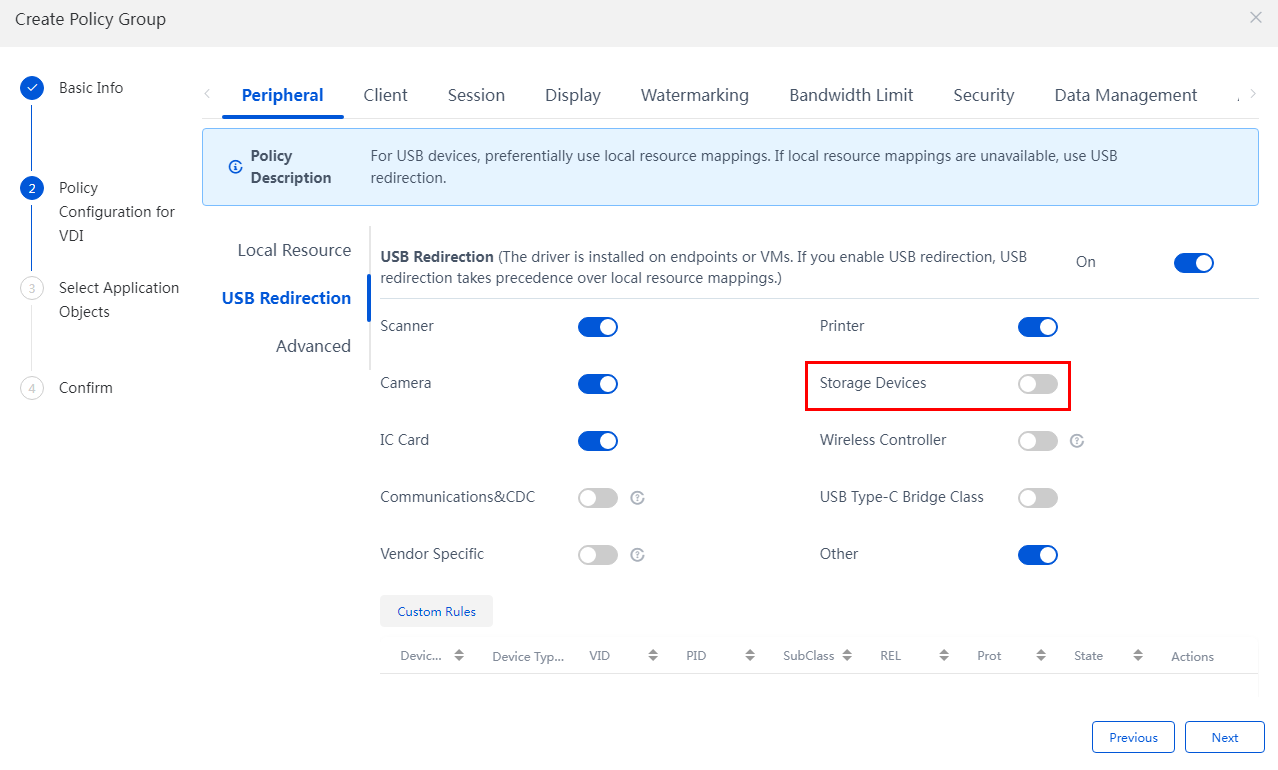
COM serial port redirect
For POS machines, serial barcode scanners, and other serial devices, use serial port redirect in local resource mapping.
Configuration procedure
Serial devices are typically used in the following situations:
1. If the endpoint has COM ports, change port COM1 to another port number, for example, COM3, as shown in Figure 52.
Figure 50 Changing endpoint port COM1
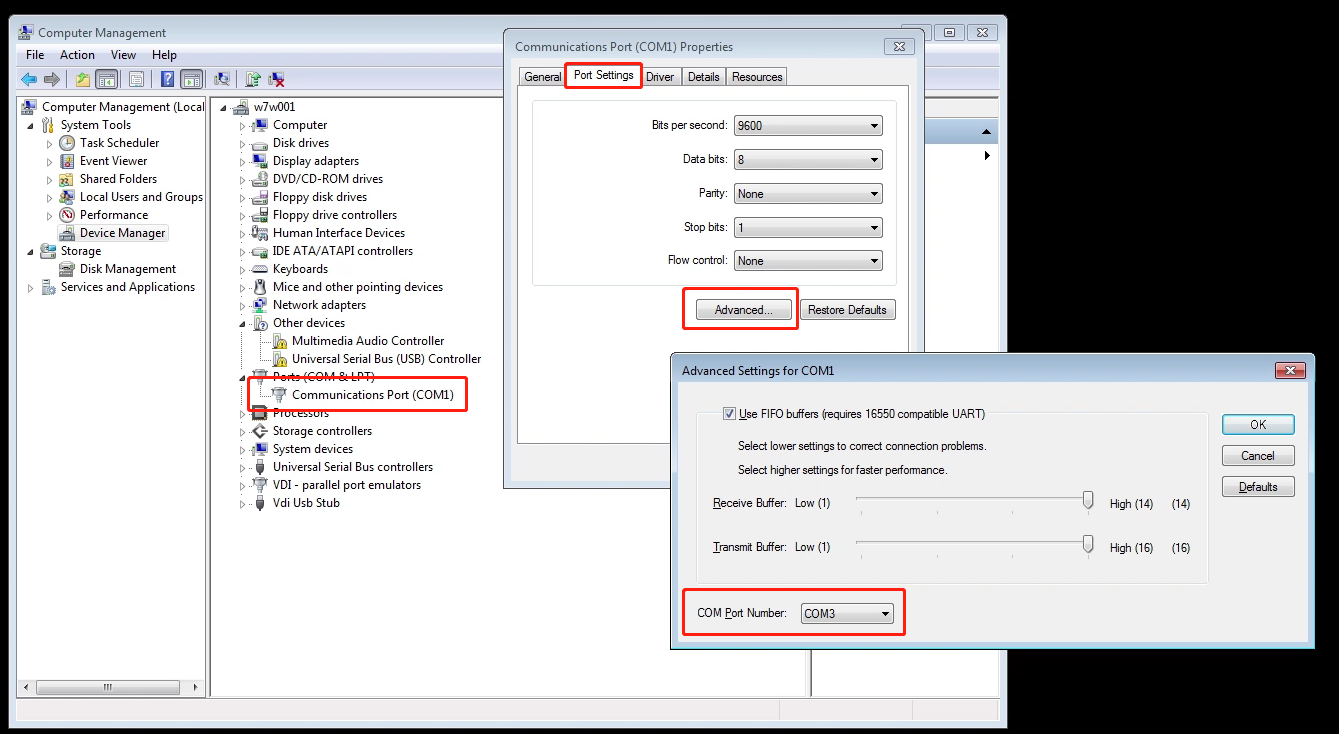
2. If the endpoint does not have COM ports, connect a serial device using a USB-to-serial adapter, enable Serial Port in the Local Resource Mappings section, and disable the USB-to-serial adapter in USB redirect, as shown in Figure 53 and Figure 54.
Figure 51 Enabling Serial port for Local Resource Mappings
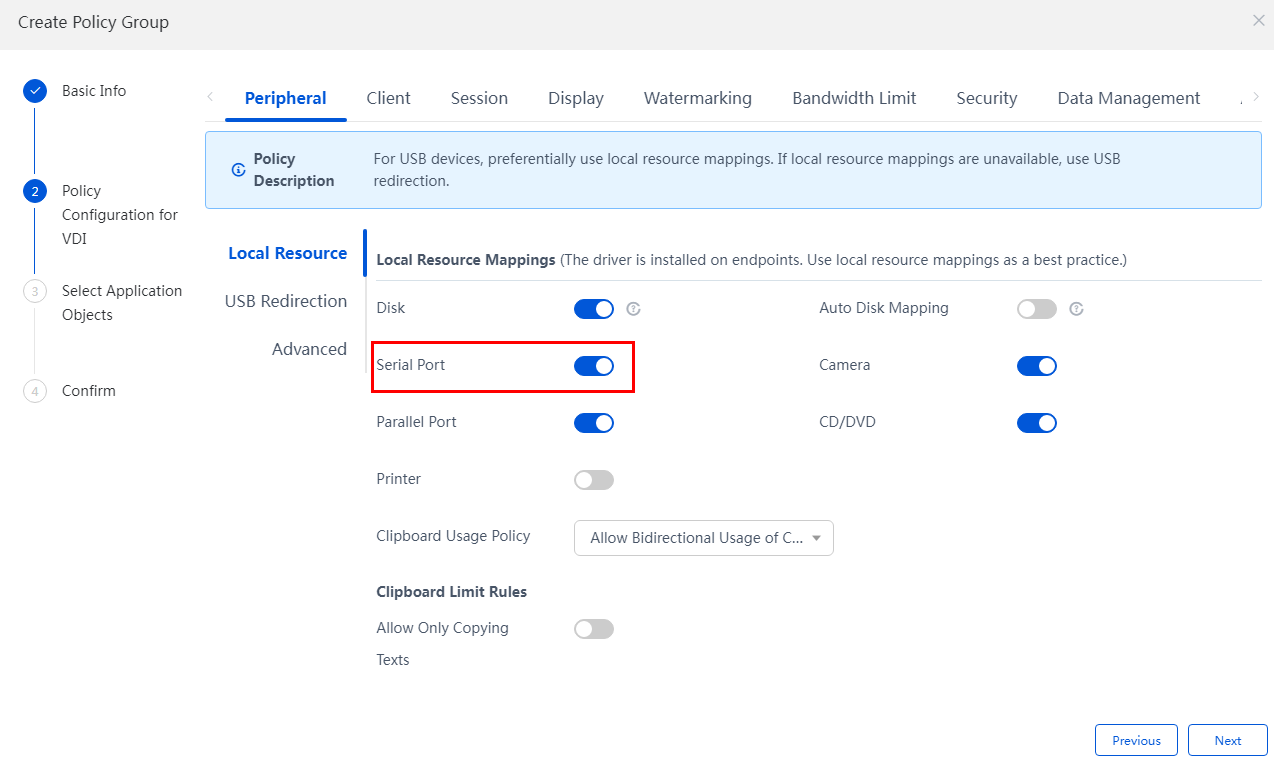
Figure 52 Disabling the USB-to-serial adapter
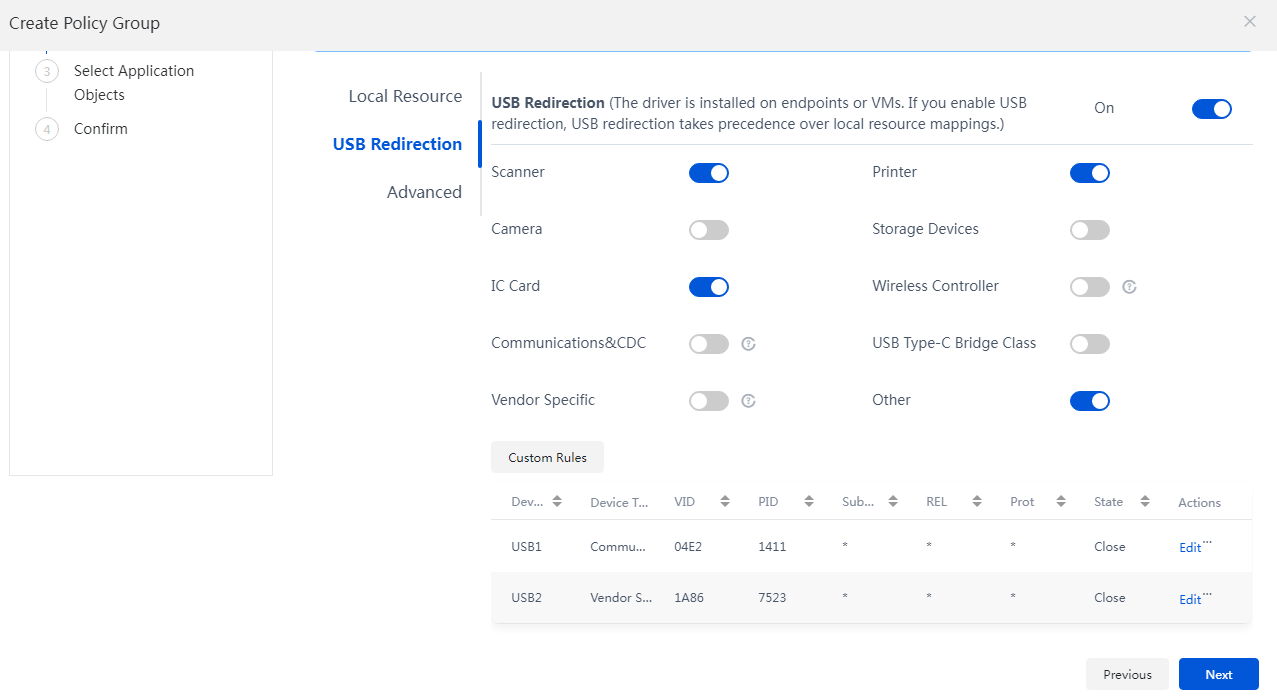
3. After serial port redirect is mapped successfully, you can view redirect status from Device Manager on the cloud desktop.
Figure 53 Viewing the status of serial port redirect
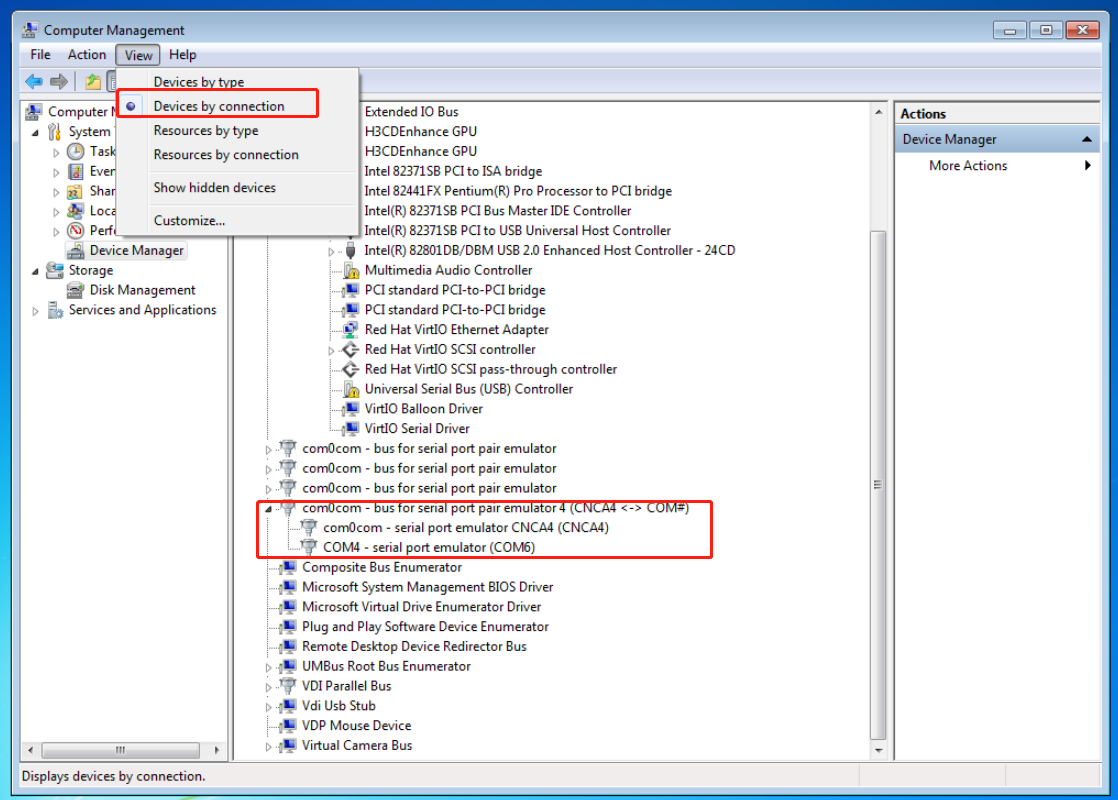
Serial port debugging
1. Run MobaXterm, and then click Session. In the dialog box that opens, select Serial.
Figure 54 Running MobaXterm
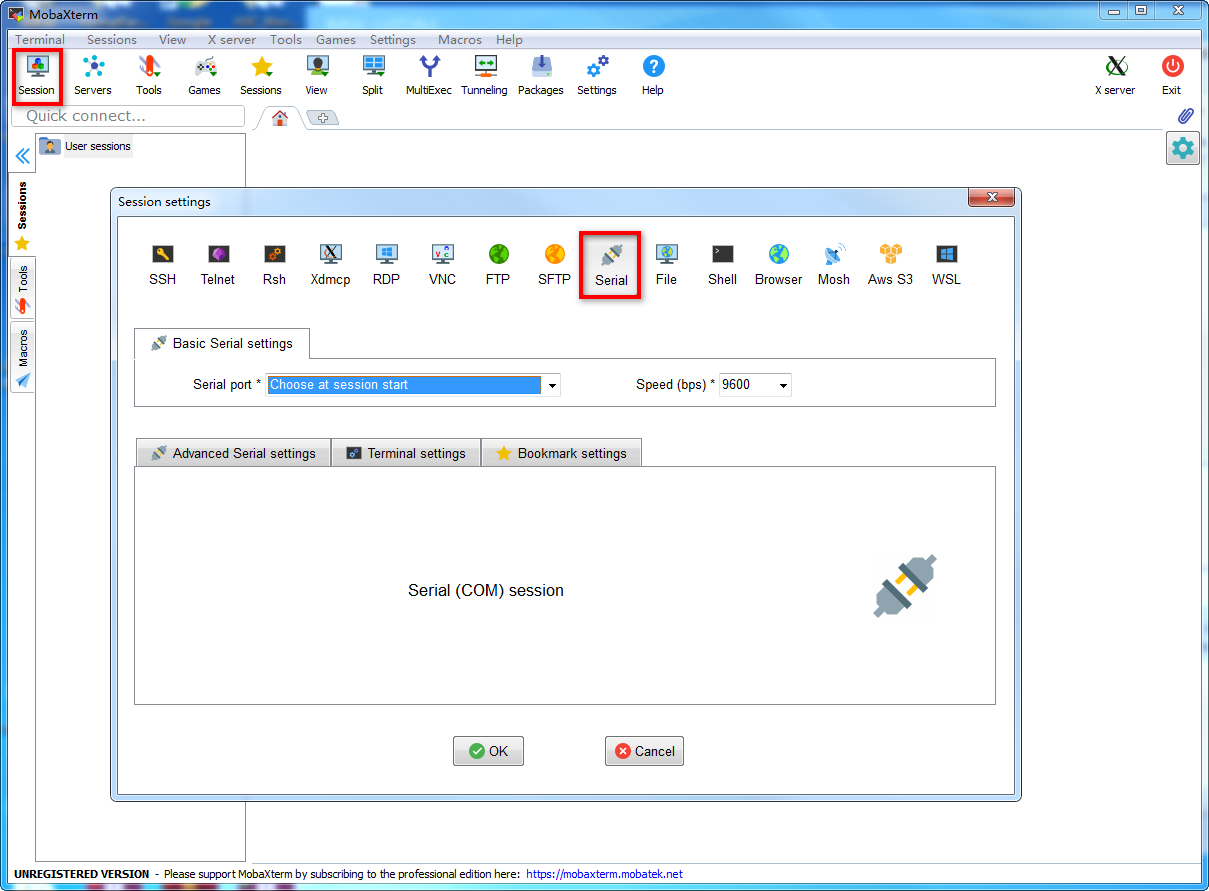
2. Select the serial port to be debugged and set the baud rate depending on the device parameters. Then, click OK to connect to the corresponding serial port.
Figure 55 Configuring serial port parameters
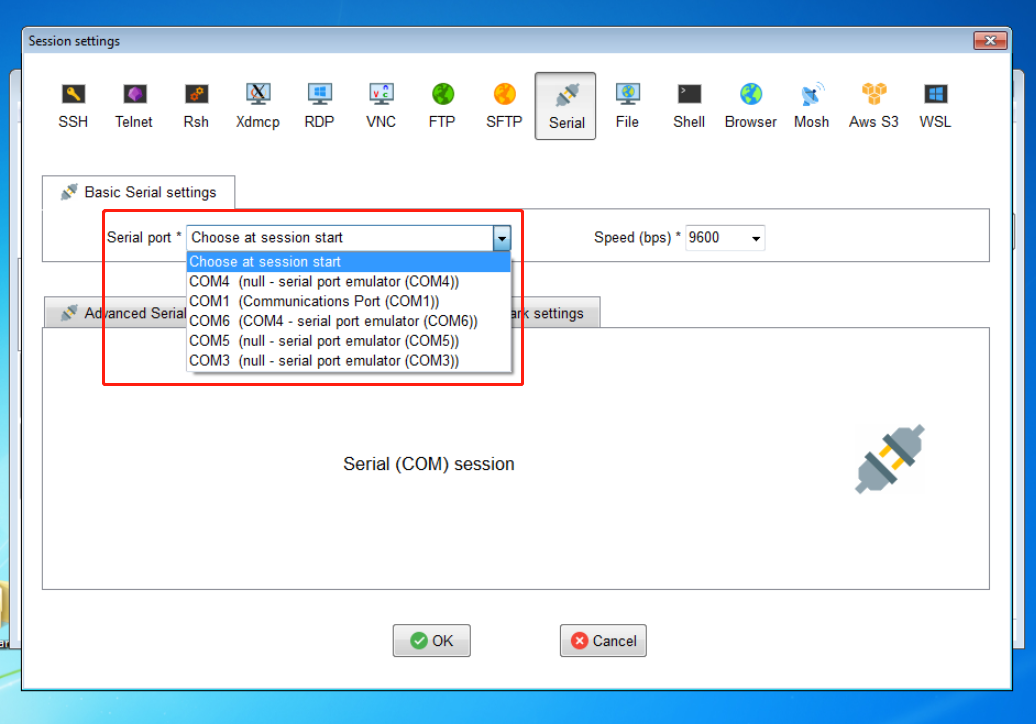
3. Once the serial port is connected successfully, the data from the serial port will be displayed on the interface. For example, when a barcode scanner scans a barcode, the obtained data will be displayed in the black area shown in the image below.
Figure 56 Data display window
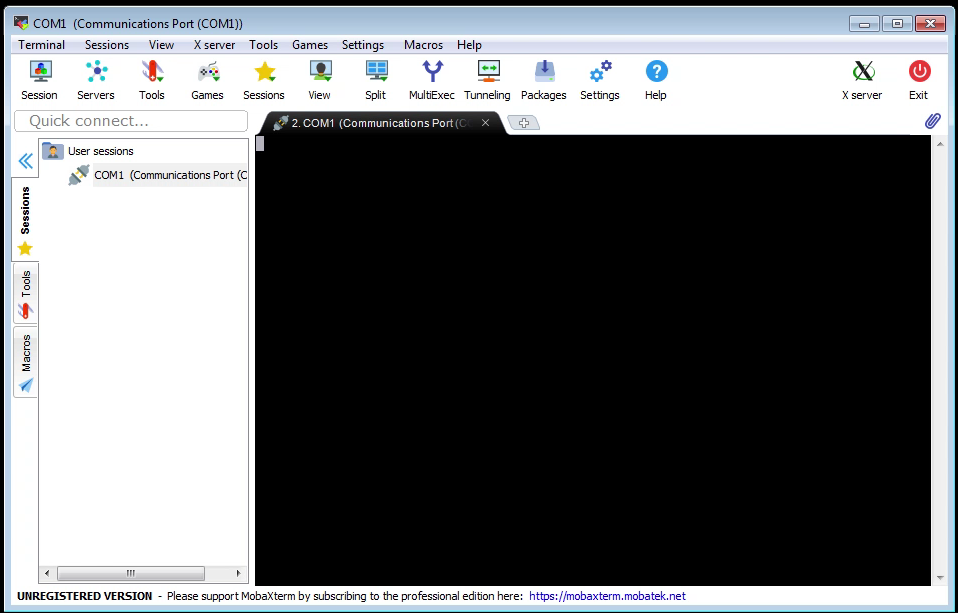
Parallel device redirect
To redirect parallel devices that are directly connected to the endpoint (without a USB-to-parallel adapter), you need to enable Parallel Port in the Local Resource Mappings section only.
Figure 57 Enabling Parallel Port for Local Resource Mappings
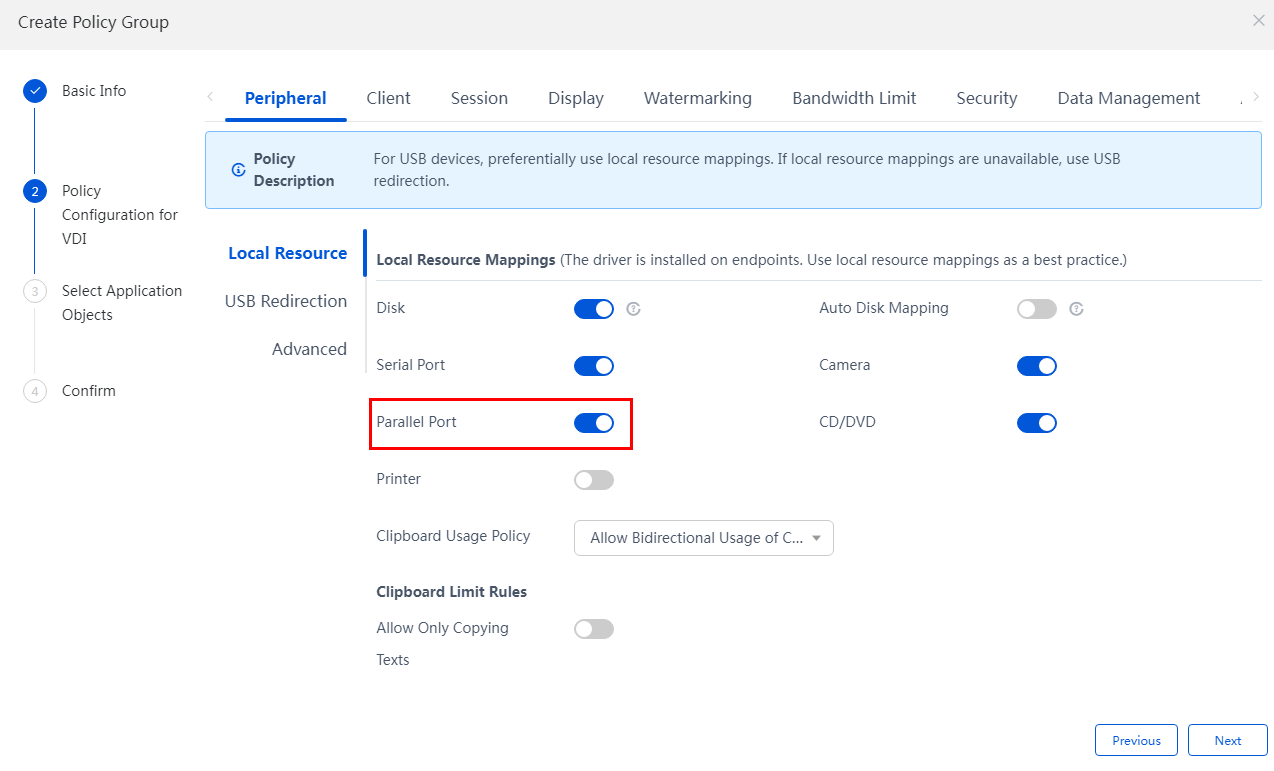
Adapters
1. If peripherals are connected to the endpoint through an adapter, you need to disable redirect for the adapter. For example, for two adapters as shown in Figure 60, add the adapters in the custom rules for USB redirect and disable redirect for the adapters separately.

|
|
NOTE: The USB end of the USB-to-serial adapter connected to the endpoint does not support hot swapping. If you re-connect the USB end of the adapter during cloud desktop connection, redirect is available only after you reconnect the cloud desktop. |
2. To use a USB-to-serial adapter on a Windows endpoint, install the corresponding driver. If you fail to do so, the corresponding serial device might fail to be loaded. The driver comes with an adapter. You can manually install the driver on the endpoint.
Figure 59 Installing the driver
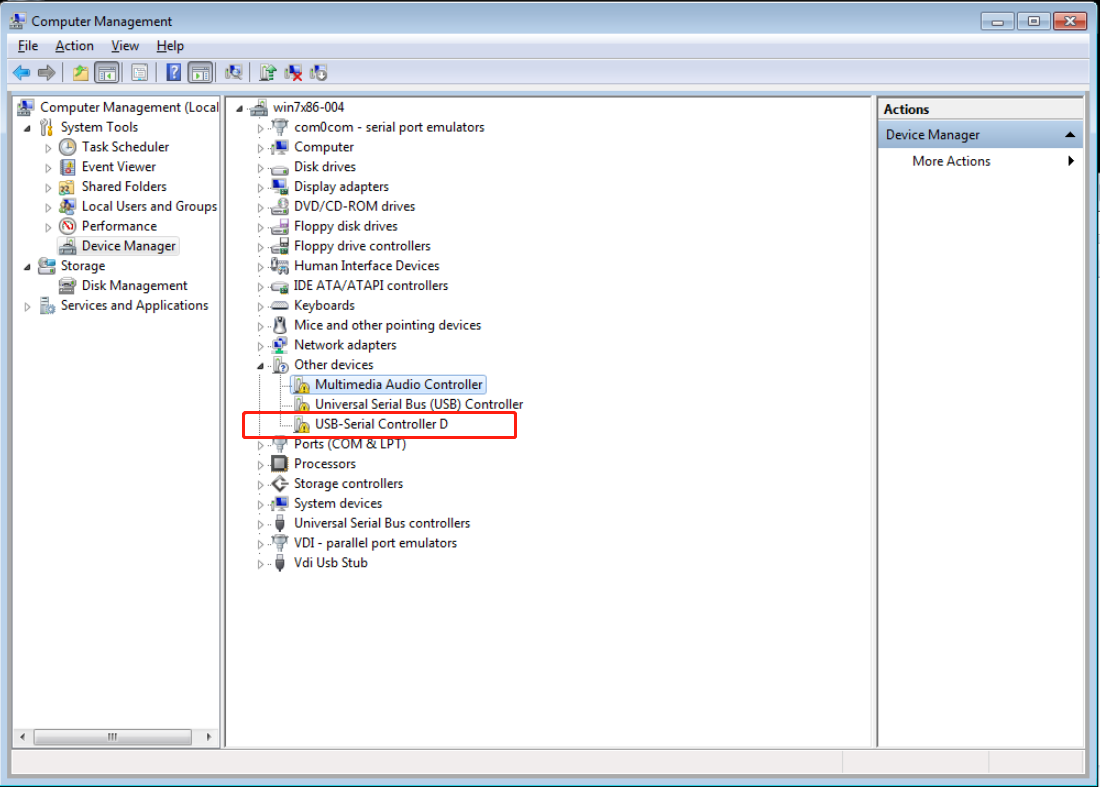
Figure 60 Driver installation completed
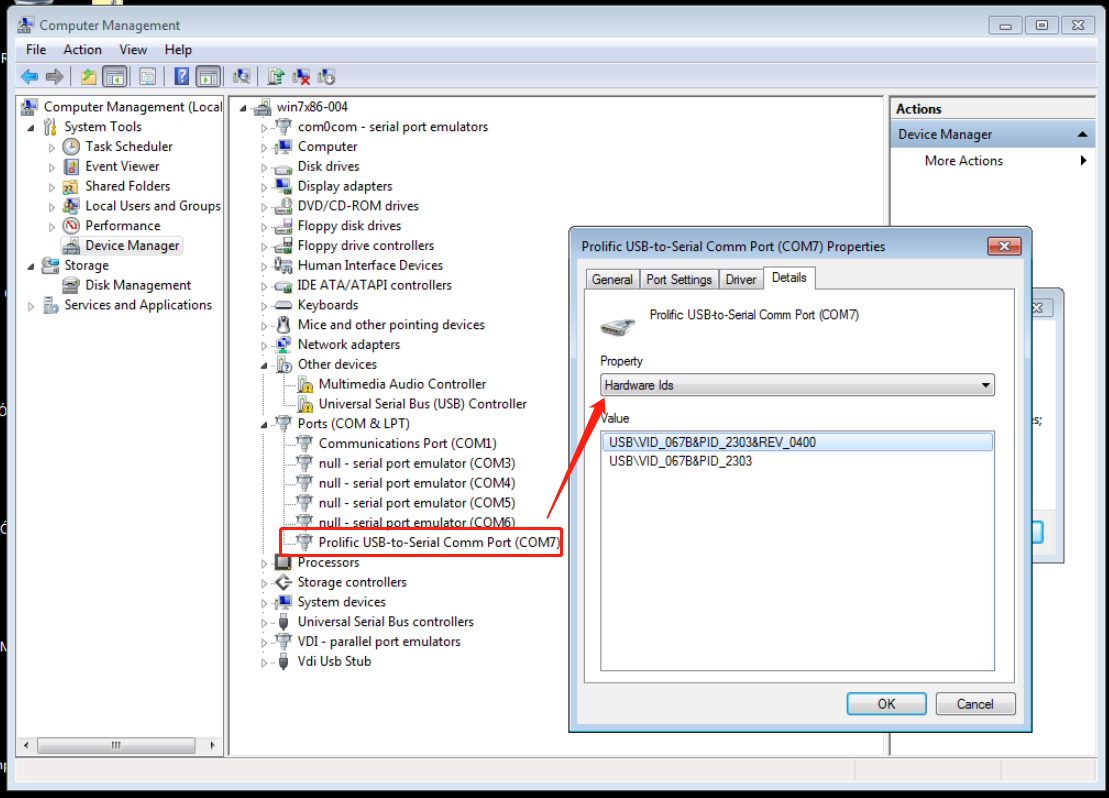
USB tokens
Class 00 devices
If this type of device cannot be redirected on the Windows endpoint, add the target device to the configuration file of the endpoint in the format of VID:PID. The configuration file of the path is C:\Program Files (x86)\H3C\Workspace\Device Redirect. The configuration method is as shown in Figure 63.
Figure 61 Adding the Class 00 device by VDI and PID
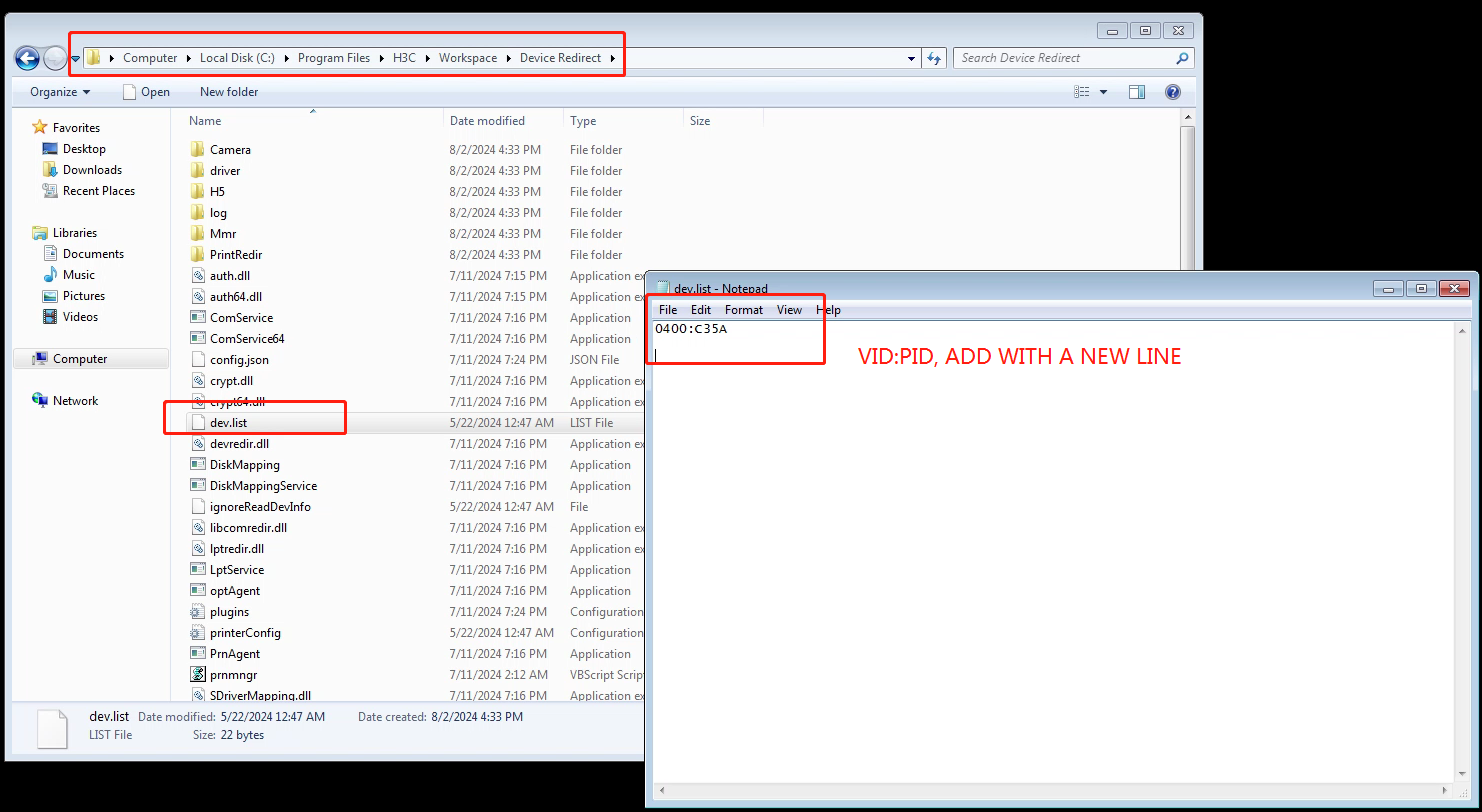
Compound-type devices
A compound-type device may include two or more Class types. By default, redirect is available if no policy is configured. However, if one Class type is already configured, the remaining Class types need to be configured as well. As shown in Figure 64, Xingye Bank's USB tokens belong to two Class types (03 and 08), which need to be added simultaneously.
Figure 62 Compound-type devices
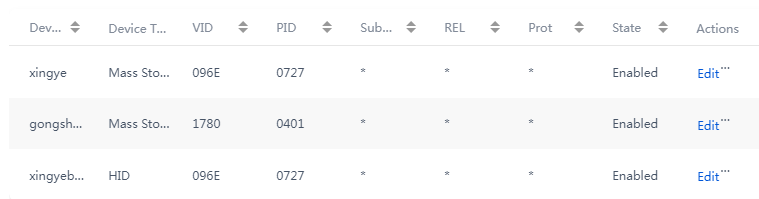
Document scanners
As a best practice, use camera redirect in local resource mapping for document scanners.
To enable redirect:
1. Access Space Console and enable camera redirect in local resource mapping.
2. Modify config parameters in the path as shown in Figure 65. Then, restart the server after modification. In the settings values of image encoding/decoding formats MJPG, YUY2, and RGB23, 1 indicates support while 0 indicates no support.
Figure 63 Configuring camera redirect parameters
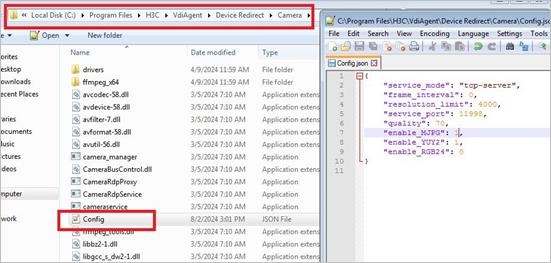
Figure 64 Restarting the server after modification
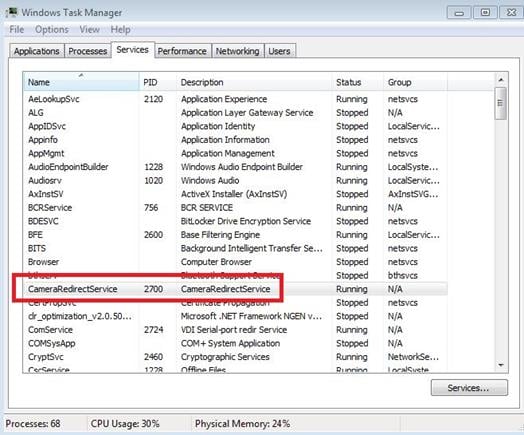
3. Configure config parameters for camera redirect on the endpoint when the network bandwidth is insufficient. Take E1010 as an example. The path of the configuration file is /userdata/H3C/Workspace/E1010/Device Redirect. The parameters include the following:
¡ frame_interval—Frame rate. Options include:
- 100—10 frames.
- 200—5 frames.
- 0—No limit.
¡ max_width—Maximum bandwidth for the resolution.
Figure 65 Configure config parameters for camera redirect on the endpoint
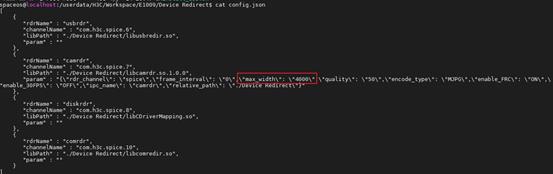
VM proxy Agent
About Agent
Agent typically processes various functions, including resolution adaptation for VMs, user authorization addition, single sign-on, peripheral policies, personal disks, file distribution, blacklisting/whitelisting, WEM policies, one-click log collection, command issuing, notifications, watermarking, clipboard management, and anti-uninstallation. In addition, Agent also receives and processes messages sent by Workspace clients and Space Console, and supports the installation, upgrade, and uninstallation of VM components, peripheral components, and castools components.
Viewing Agent information
Viewing Agent status from Space Console
You can view the cloud desktop status on the desktop pool page from Space Console, including running, abnormal and shutdown:
· The running status indicates that the cloud desktop is normal.
· The shutdown status indicates that the cloud desktop is shut down.
· The abnormal status indicates that the castools status of the cloud desktop is abnormal.
If the Agent is not operating correctly, the running status is followed by an exclamation mark (!), as shown in Figure 68.
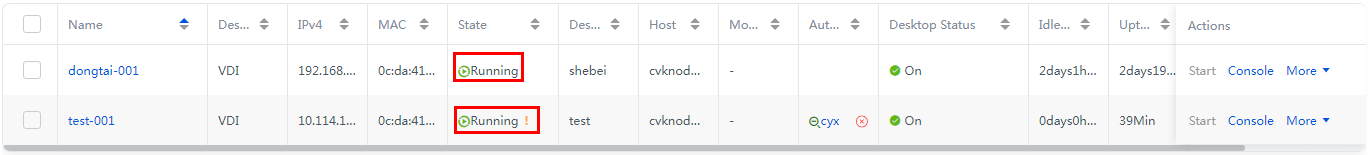
Viewing Agent version of a cloud desktop from Space Console
When the Agent is operating correctly, you can view the Agent version of the current cloud desktop. As shown in Figure 69, VM vdiwin10-002 is abnormal, so the Agen version is not displayed for it.
Figure 67 Obtaining Agent version

Viewing Agent status from a cloud desktop
You can view Agent status from cloud desktops. The method for viewing Agent status varies by OS type of a cloud desktop.
Windows VMs
The default installation path of Agent is C:\Program Files (x86)\H3C\VdiAgent, as shown in Figure 70.
Figure 68 Default Agent installation directory
To view the Agent status of a cloud desktop:
1. Log in to the cloud desktop, start the task manager. On the details tab, you can view the status of Agent related service and applications.
Figure 69 Viewing Agent status on a Windows VM
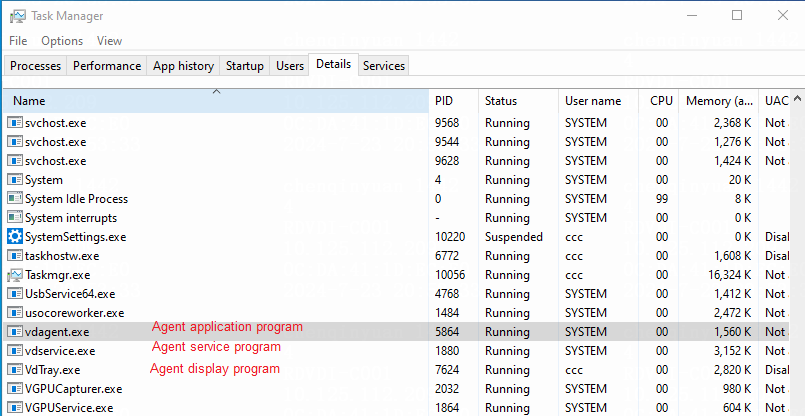
2. You can also view the Agent status from CMD.
Figure 70 Viewing the Agent status from CMD
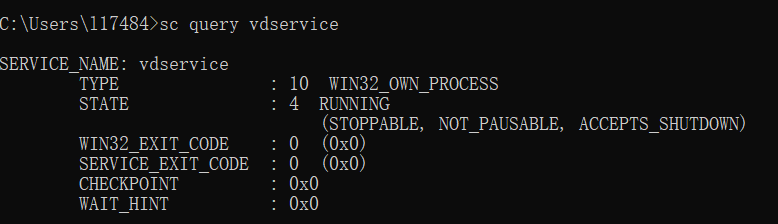
Linux VMs
Log in to the back end of a Linux VM and execute the following command to view the Agent status, where the name of the Agent service is spice-vdagentd:
root@cvknode-l17484:~# service spice-vdagentd status
Figure 71 Viewing Agent status on a Linux VM
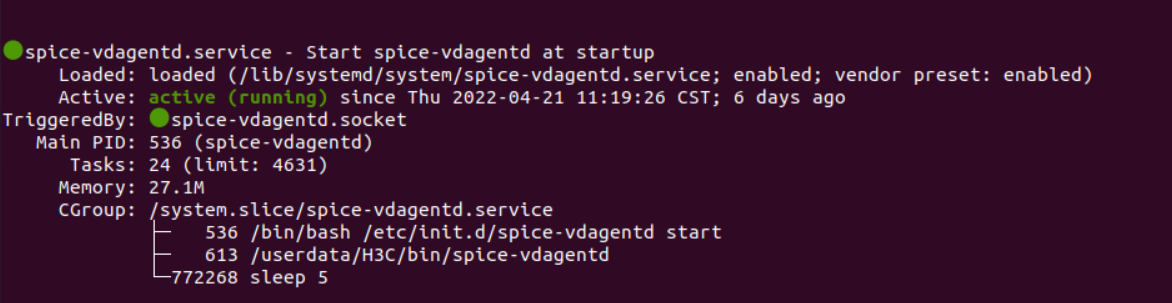
Agent log collection
You can collect Agent logs by one-click log collection from Space Console or the browser.
|
|
CAUTION: Before collecting Agent logs, make sure port 9003 on the cloud desktop is open. |
To collect Agent logs from Space Console:
1. In a desktop pool, click More in the Actions column for a desktop.
2. Select Collect Logs.
To view the collected logs, go to Monitor Reports > Logs > Desktop Logs.
Figure 72 Collecting Agent logs from Space Console
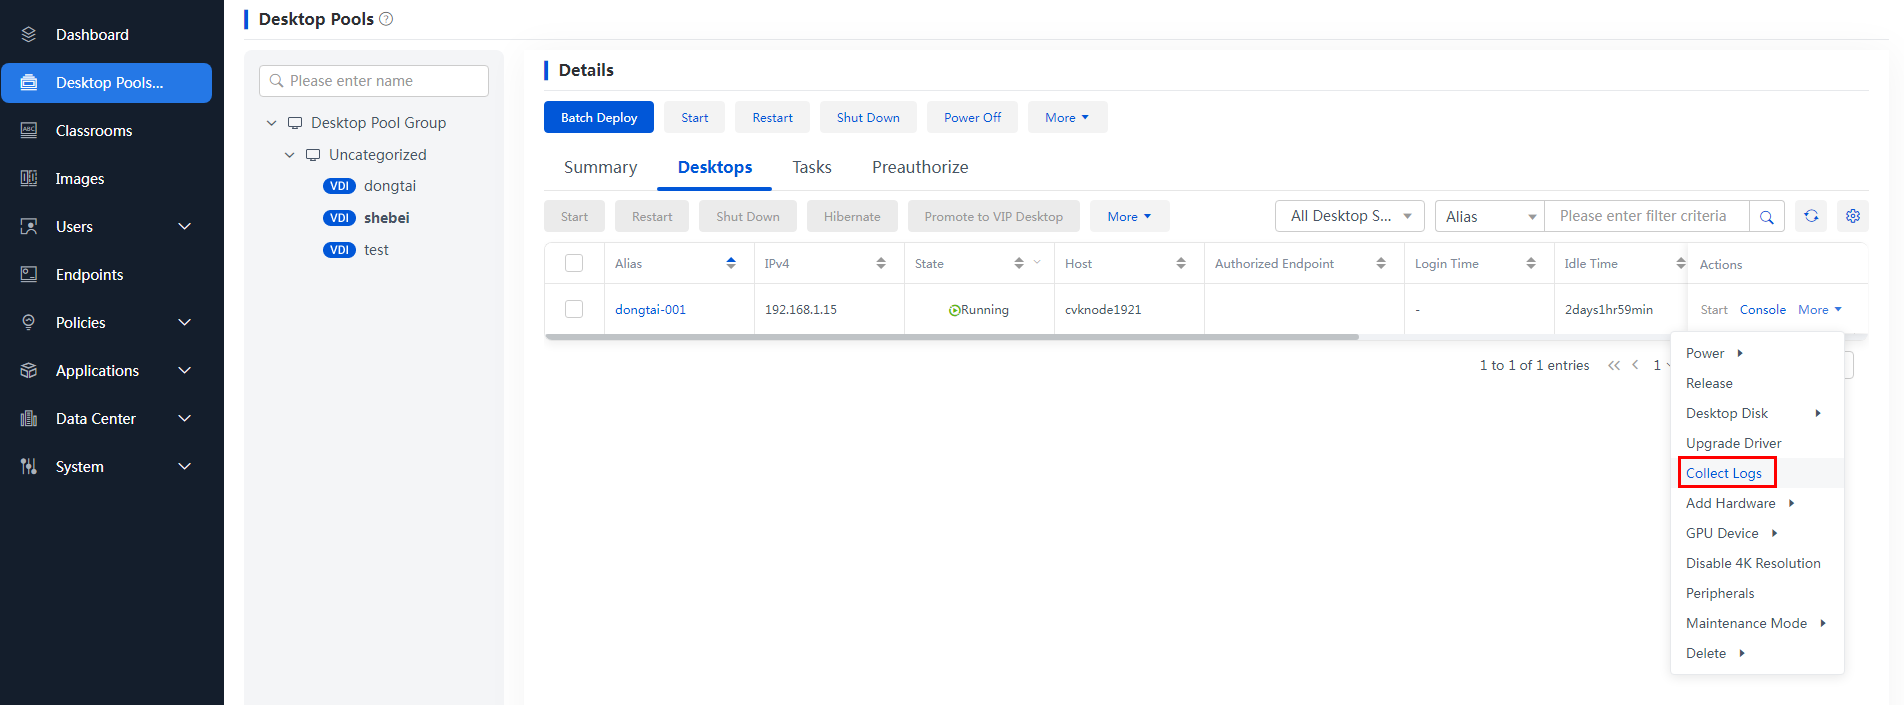
To collect Agent logs from the browser, make sure the VM is running. Enter VM IP:9003 in the browser. Then, click Log Collection to collect the Agent logs of the VM.
Figure 73 Collecting Agent logs from the browser
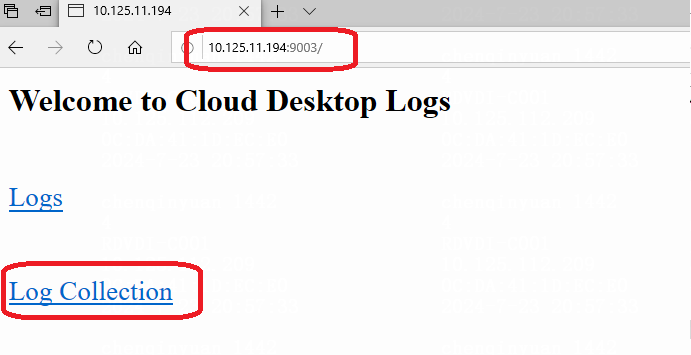
FAQ
Abnormal Agent status
Windows system
1. Identify whether the server address is configured correctly. The configuration file path is C:\Program Files (x86)\H3C\VdiAgent\conf\grpc_config.cfg. You can view the configuration file in Notepad, as shown in Figure 76.
Figure 74 Viewing the server address
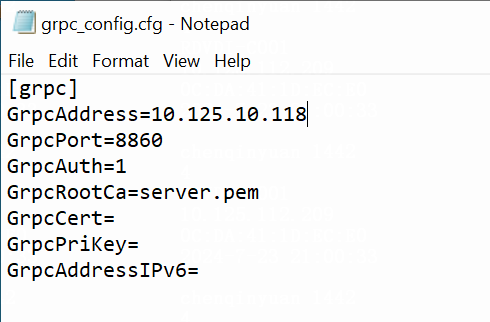
2. Identify whether a proxy is configured for the VM and data packets are forwarded by the proxy.
Figure 75 Viewing the VM proxy
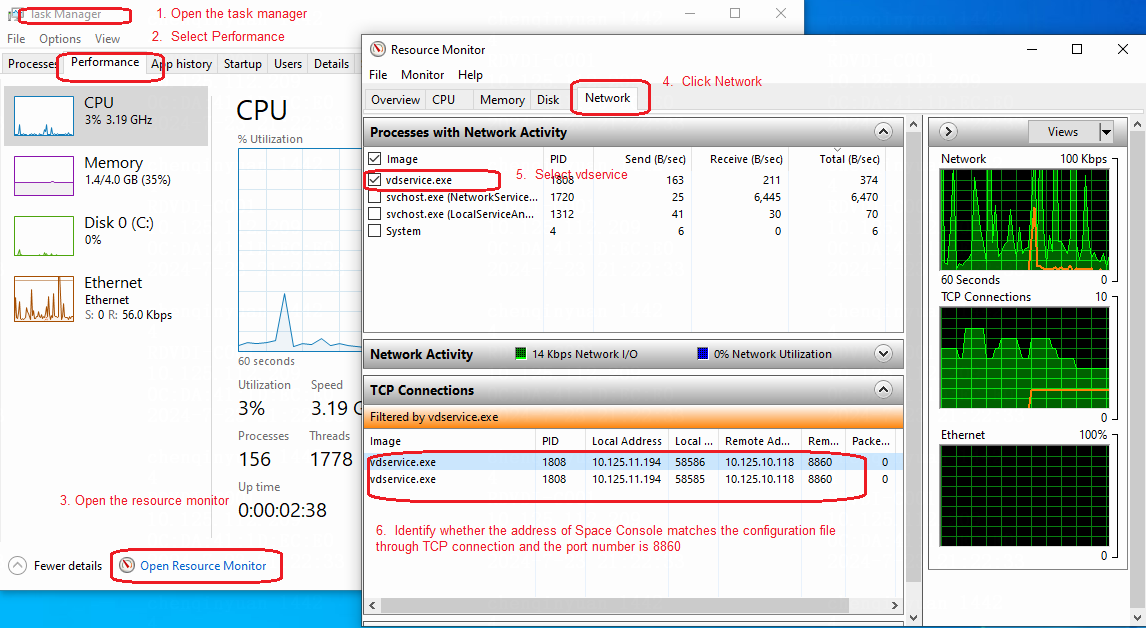
3. Identify whether communication logs are normal.
Figure 76 Viewing communication logs (1)
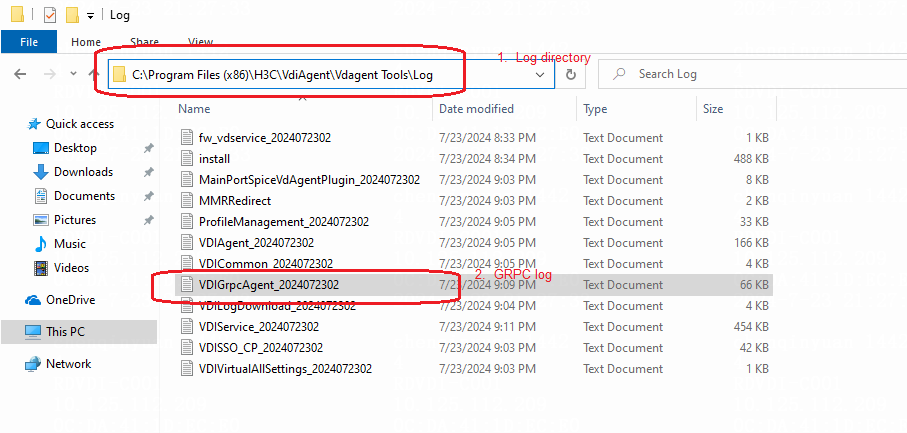
Figure 77 Viewing communication logs (2)
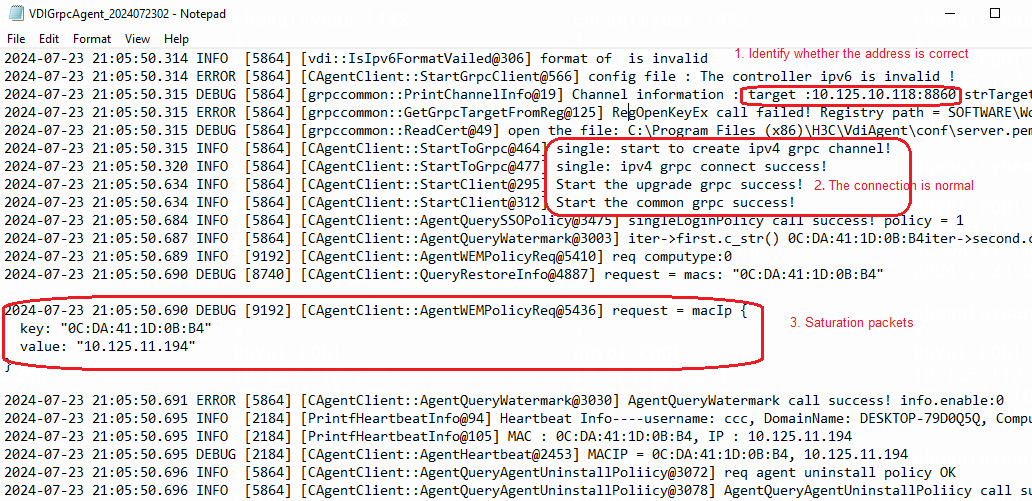
Linux system
1. Identify whether the server address is configured correctly. The configuration file path is/userdata/h3c/cfg/ip.cfg. Use vi to open the configuration file.
Figure 78 Viewing the server address
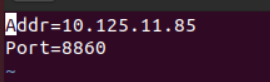
2. Check proxy configuration. The location of the proxy file might vary by Linux type. You can configure proxy settings as needed. Take Ubuntu as an example:
vi /etc/profile.d/proxy.sh //Identify whether a proxy file exists
export HTTP_PROXY=""//Identify whether the proxy file is configured with the HTTP_PROXY field
3. Execute the sudo journalctl –b | grep vdagentd command to view GRPC related logs. GRPC logs are displayed in syslog.
Figure 79 Viewing GRPC related logs
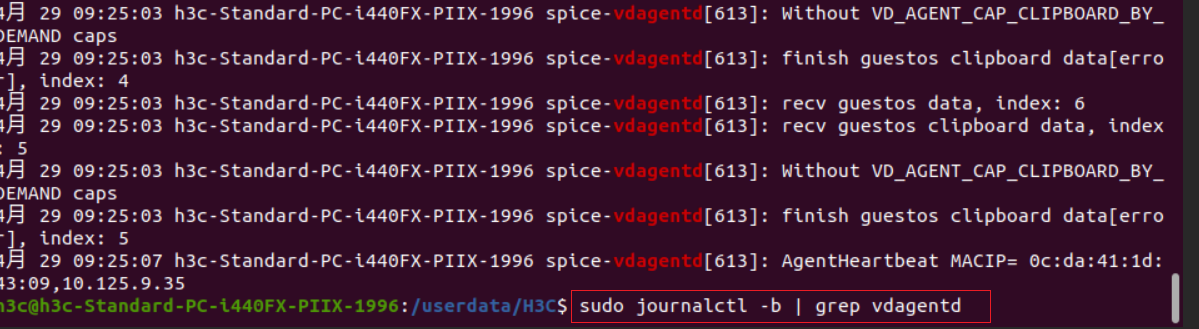
Domain joining analysis
Windows system
1. After collecting Agent logs, decompress the log file.
Figure 80 Decompressing Agent logs
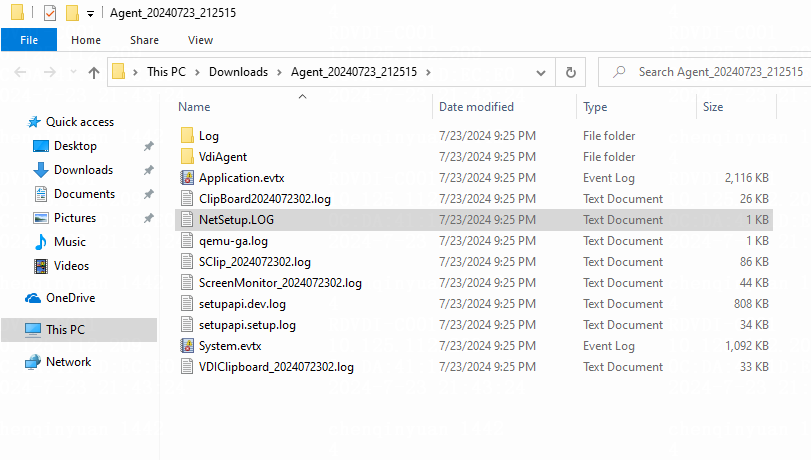
2. Identify whether NetSetup.LOG logs are normal. If an exception occurs, contact Technical Support.
Figure 81 Viewing NetSetup.LOG logs
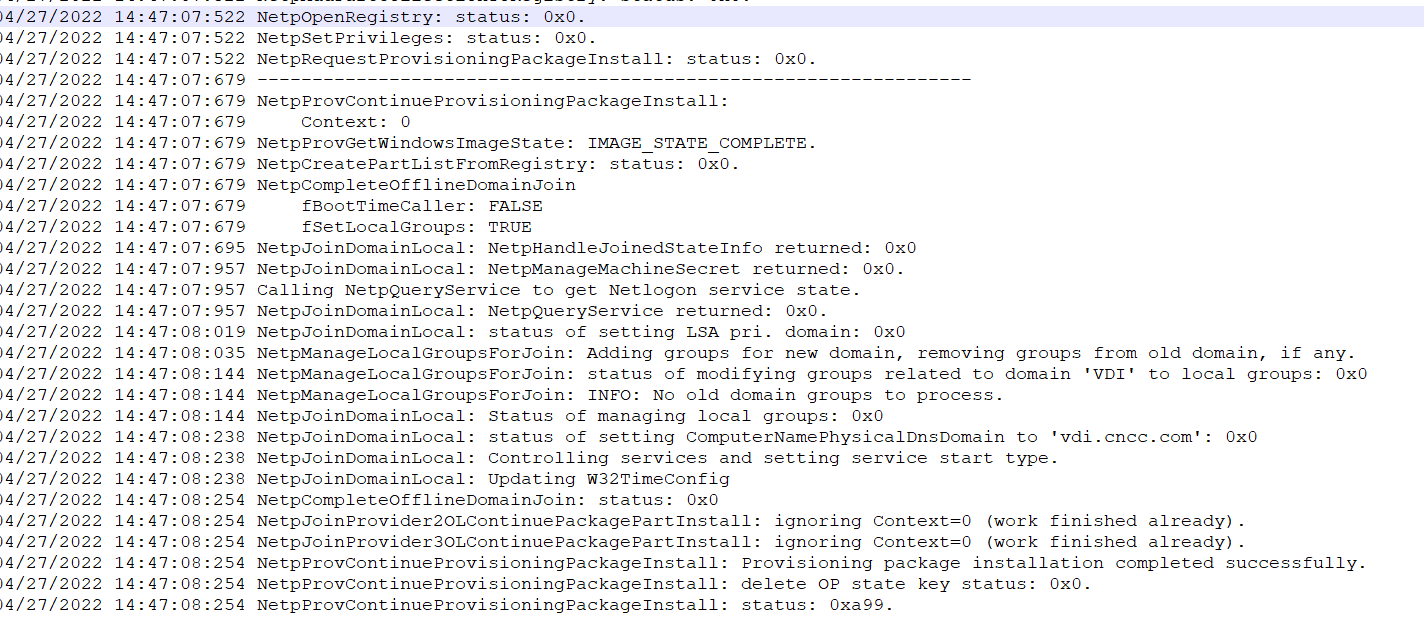
3. Open System.evtx in the C:\Windows\System32\winevt\Logs path and view the system logs to compare the time for editing the computer name and joining to a domain.
4. Identify whether the Agent has joined to a domain. Open the VdiAgent\Vdagent Tools\Log\VDIService_time.log file and search for the joinDomain keyword. Figure 84 shows that the computer has joined to a domain. If the NetJoinDomain Success message appears, the Agent has joined to the domain.
Figure 82 Identify whether the Agent has joined to a domain
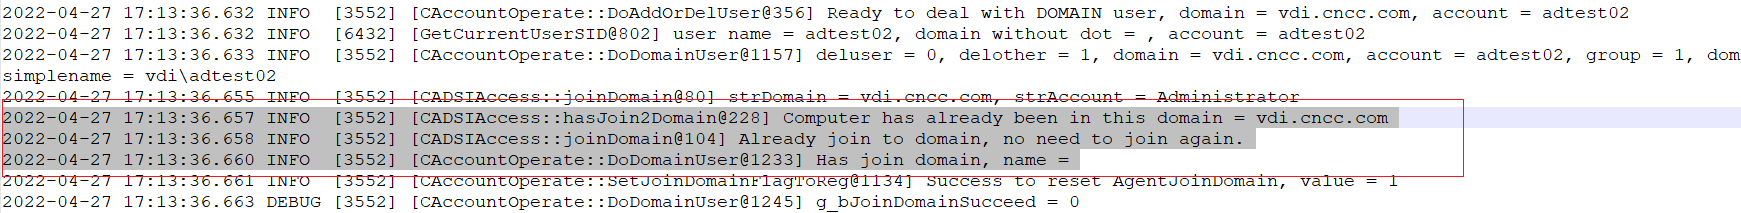
Linux system
After log collection in "Agent log collection," the log file structure is as shown in Figure 85 and Figure 86. You can provide logs and contact H3C Support for fault location.
Figure 83 Log file structure (E1011P09 and earlier versions)
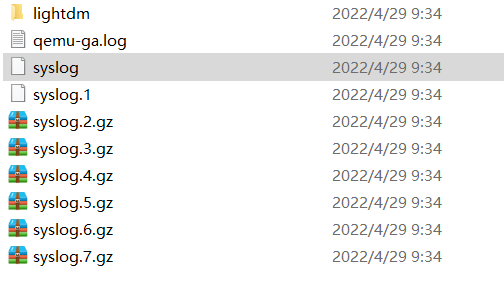
Figure 84 Log file structure (versions later than E1011P09)

SSO login failure
Windows system
1. Collect Agent logs and view SSO login logs in the VdiAgent\Vdagent Tools\Log\VDISSO_CP__time.log file to identify whether the username is correct.
Figure 85 Viewing SSO login logs (1)
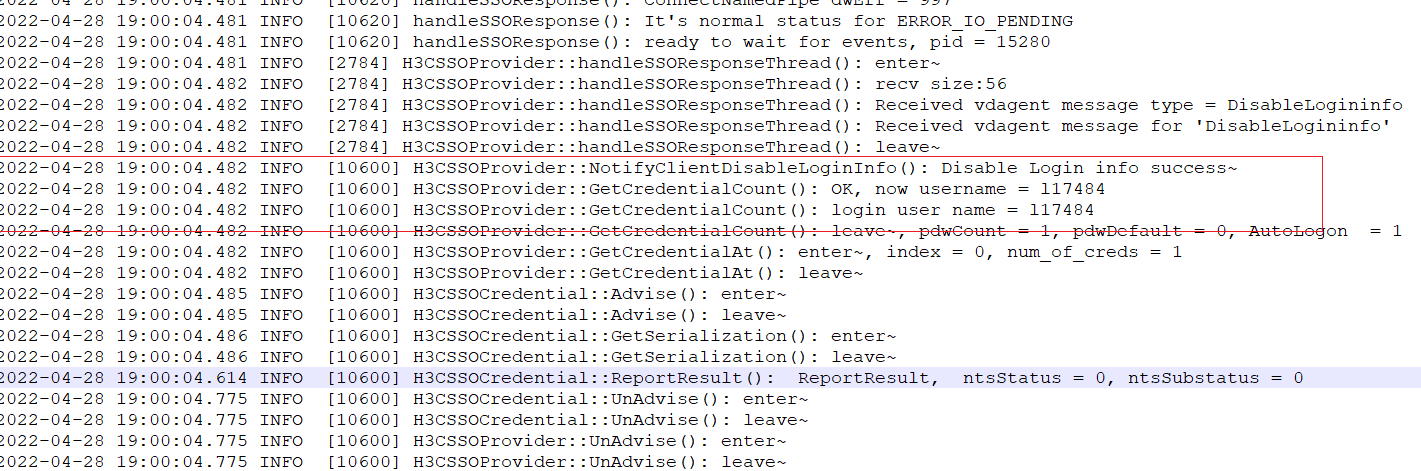
2. If SSO login fails, identify whether the username and password obtained from the client are empty. In this example, Figure 88 shows that the password is empty.
Figure 86 Viewing SSO login logs (2)
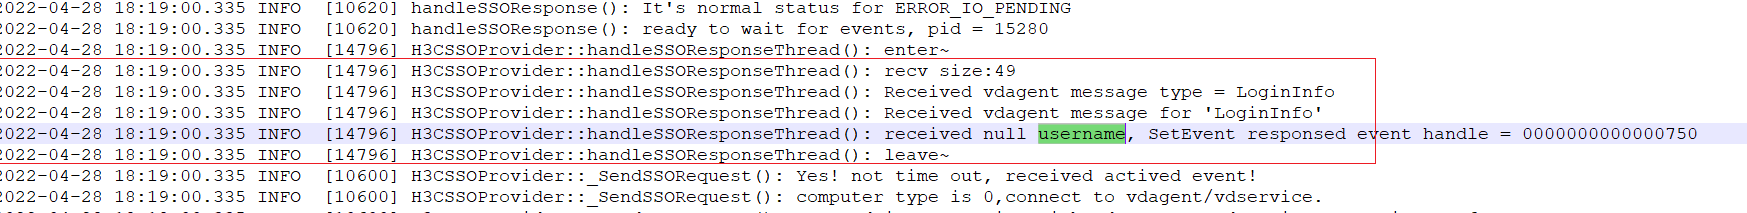
Linux system
After log collection in "Agent log collection", the log file structure is as shown in Figure 89 and Figure 90. You can provide logs and contact H3C Support for fault location.
Figure 87 Log file structure (E1011P09 and earlier versions)
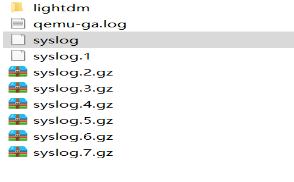
Figure 88 Log file structure (versions later than E1011P09)
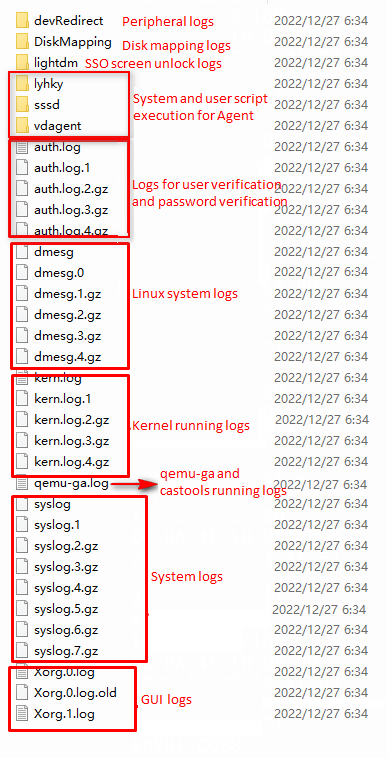
vGPU
For more information, see H3C Workspace Cloud Desktop vGPU and GPU Configuration Guidance.
CAStools
Qemu-ga module
Mechanism
Qemu-guest-agent (qemu-ga) is a regular application running inside a VM. The default executable name is qemu-ga. Its purpose is to enable interaction between the host and the VM. This method does not depend on the network, but relies on virtio-serial (the default preferred method) or isa-serial. QEMU simulates a serial device and provides a channel for data exchange. What finally appears are a serial device (inside the VM) and a unix socket file (on the host).
Qemu-ga appears as the qemu-ga service in the VM system.
Troubleshooting
1. Before troubleshooting, confirm the following problem.
¡ Identify whether the CAStools program is successfully installed on the VM.
¡ Identify whether the CAStools is running properly and whether the version is displayed correctly on Space Console.
Figure 89 Checking the CAStools
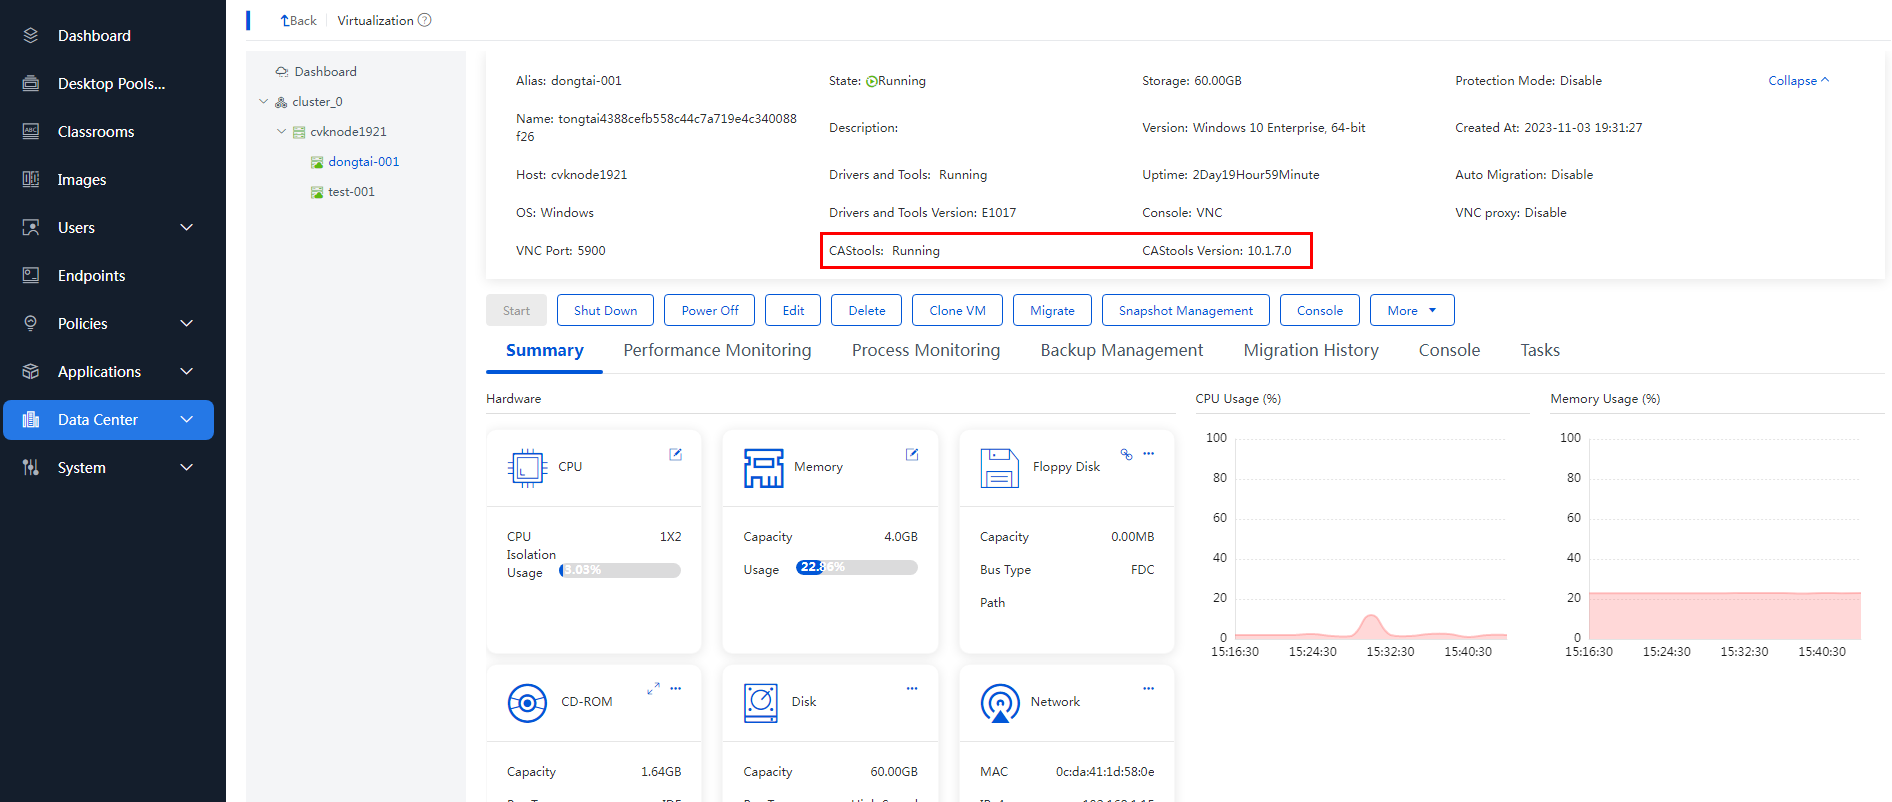
2. Execute the virsh qemu-agent-command vm-name '{“execute”:”guest-info”}’ command in the background of the CVK where the VM is located. If the return is normal and no error is reported, the program is working normally. Replace vm-name with the actual name of the VM on the CVK.
3. Within the VM, you can identify whether the qemu-ga service is running normally under the Services tab of the Task Manager in the Windows operating system. You can also check the program status using the service qemu-ga status command in the Linux operating system.
Log analysis
The log path of VM qemu-ga in Windows system is C:\Program Files\CAS tools\qemu-ga.log. The log path of VM in the Linux system is /var/log/qemu-ga.log.
By viewing the problem log, you can identify which function caused the exception. For example, open channel error related logs generally indicate an exception upon opening the serial device on the VM.
· For VMs installed with Windows, you can check the serial device in the Device Manager to identify whether the virtio driver of the serial device is installed normally. The virtio driver for Windows systems integrated with CAStools is in the path C:\Program Files\CAS tools\driver. If the driver is abnormal, you can manually update the driver in the Device Manager, that is, manually select the above path to repair it.
· For VMs installed with Linux, the virtio driver is usually integrated into the system by default. As long as the system kernel is not particularly old, exceptions rarely occur.
Restrictions and guidelines
Only when the VM and CAStools are running, qemu-ga related instructions can be sent.
Libguestfs module
Mechanism
The main principle of the libguestfs module is to mount the VM's disk onto a minimal system. It allows reading and writing VM disks without starting the VM. CAStools utilize this module to modify VM information offline. For example, modify the VM network address offline and write the initialization information of the deployed VM.
Troubleshooting
The module can troubleshoot issues by shutting down a test VM, modifying its network-related information, and inspecting logs.
To independently check the functionality of the libguestfs module, execute the libguestfs-test-tool command in the background of the CVK where the VM is located.
Log analysis
Most of the logs of this module are recorded in the /var/log/castools.log file corresponding to the CVK host. If the VM installed with Windows system uses full deployment mode, the deployment log is in the /var/log/sysprep.log file of the CVK host.
By viewing the castools.log and sysprep.log log, you can locate the cause of the problem. Common problems are as follows:
· To use libguestfs related functions, you must install CAStools in the VM. This means that the VM must have an operating system installed and CAStools fully installed on the VM. If the conditions are not met, you can see it in the log above.
· If the operating system of the VM is abnormal or damaged, this function will also cause an error.
Restrictions and guidelines
The libguestfs module can only be called when the VM is shut down.
Workspace client
Introduction
Workspace client includes the following components:
· Workspace: Workspace is the entrance to the entire cloud desktop client. Users can use Workspace to manage the applications and tools used in their work, including virtual desktops and virtual applications.
· VdSession: VdSession is the cloud desktop connection program. After logging in Workspace, the process of connecting to the cloud desktop is actually completed by VdSession.
· SpaceConfig: SpaceConfig is the configuration program used to automatically obtain or configure the management platform address, configure network and display information, and display information of endpoints and clients.
Mechanism
The relationship between the components of the client is as shown in Figure 92.
Figure 90 Relationship between the components of the client
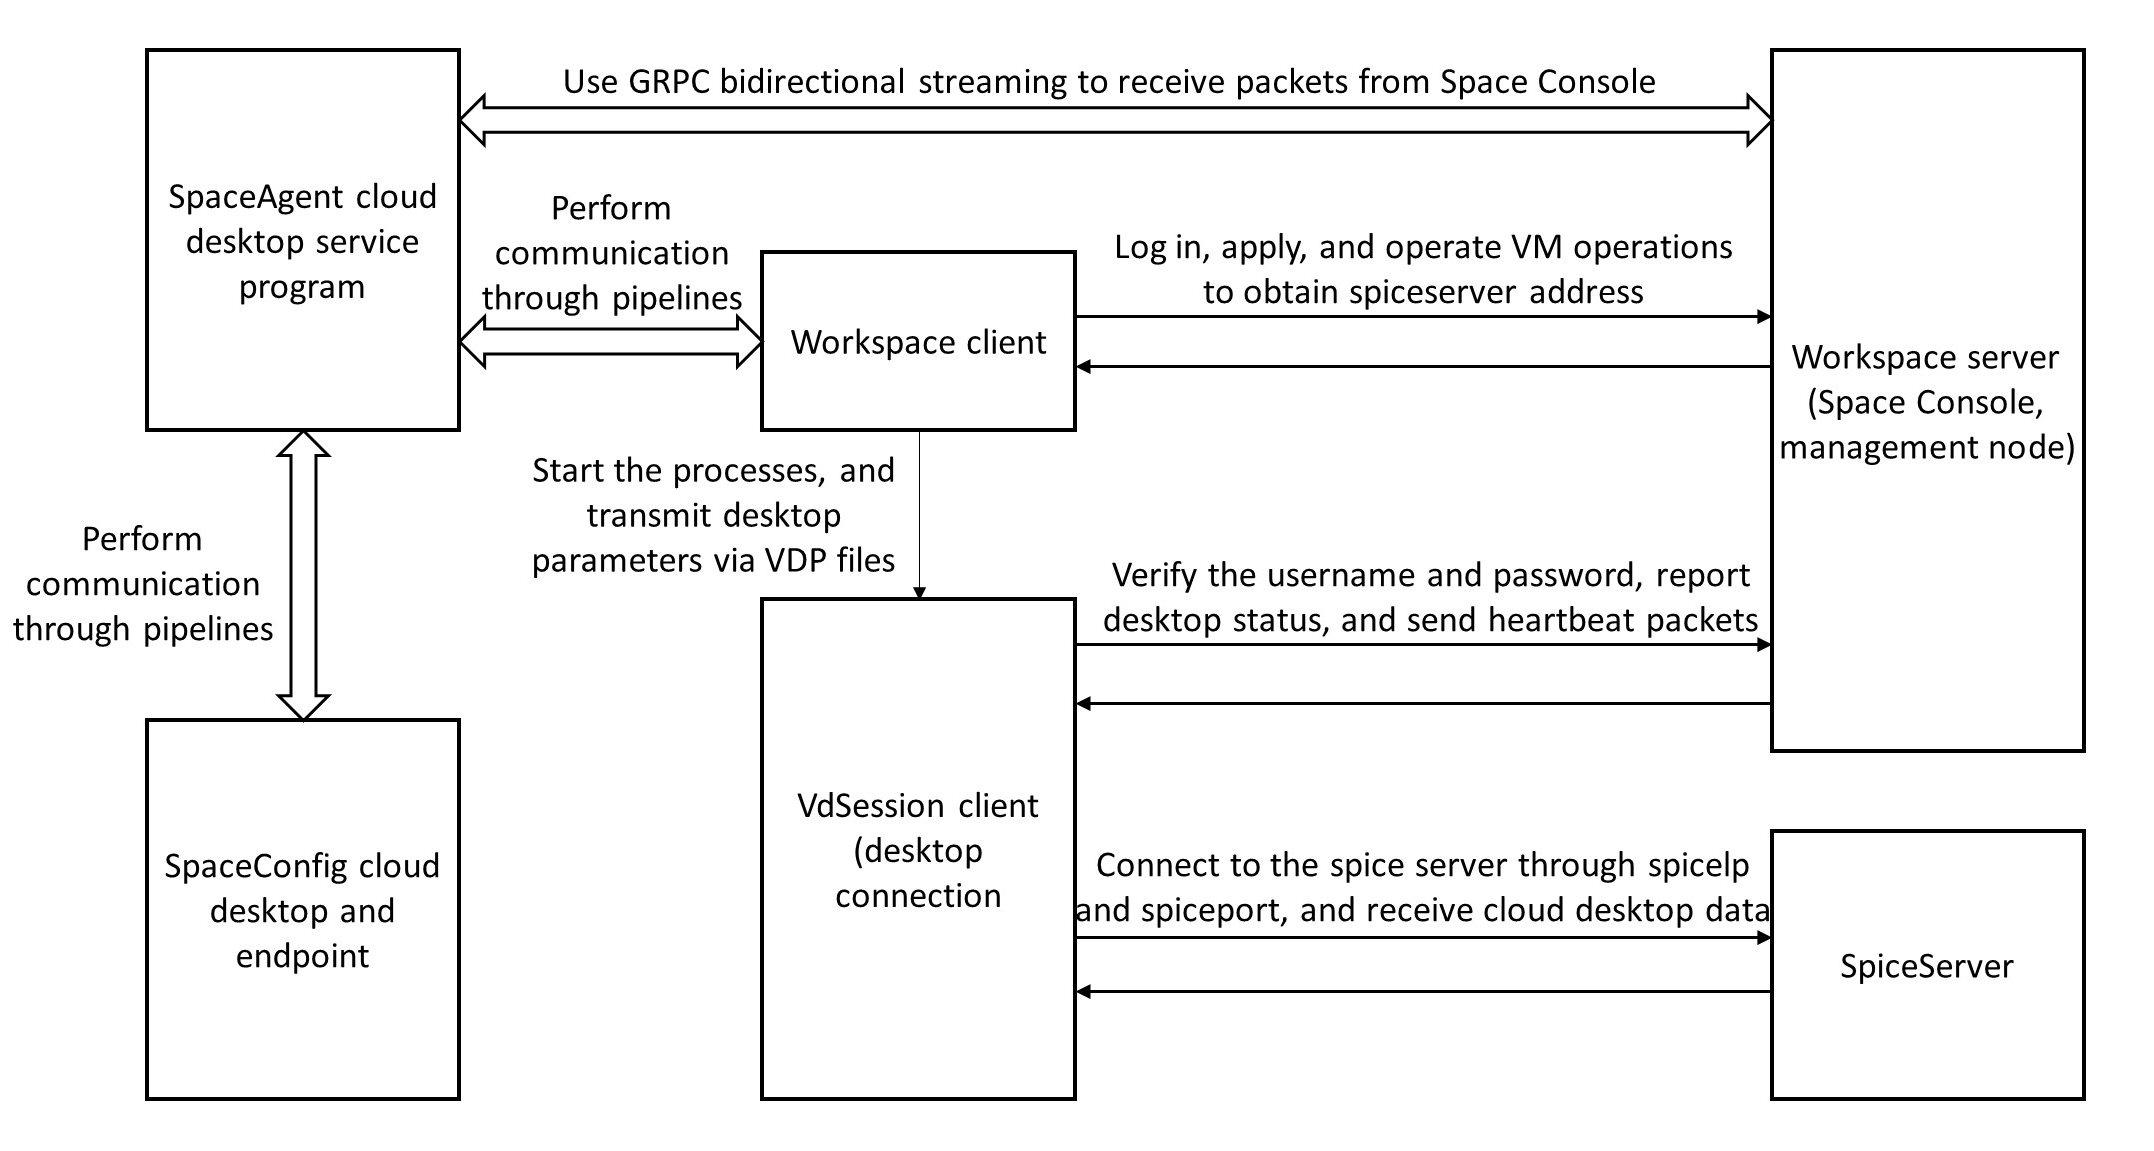
1. After the Workspace client starts, it first sends a message to the Space Console to retrieve the server type (gateway or non-gateway), login authentication type (user or endpoint authentication), and endpoint type (the client in thin endpoints will run in kiosk mode). If the communication between the client and the management platform is not smooth, the retry interface will be entered.
2. The user logs in by inputting the username and password.
3. The client communicates with the Space Console for logging in and requesting VM allocation. After receiving the VM connection authorization, Workspace launches the VdSession process, which establishes a connection with the SpiceServer server and transmits VM-related data.
4. After connecting to the VM, the client can perform common operations such as shutdown, restart, power off, and modify settings through the toolbar (circular or strip-shaped toolbars).
Logs
Path of logs
· Endpoints with Windows:
¡ Workspace log: Documents/Workspace/log
¡ VdSession log: Documents/VdSession/log
· Thin endpoints with SpaceOS or other domestic endpoints:
¡ Workspace log: ~/Documents/Workspace/log
¡ VdSession log: ~/Documents/VdSession/log
The log file names are as follows. The suffix varies by the date and desktop:
· Workspace.20220430.log
· VdSession-10.125.10.170-ac66a1da-cfc2-4f4e-be55-52c16b68231b-2.20220426.log
Collect logs
Enter 127.0.0.1:9001 in the local endpoint browser to collect client-related logs.
Modify the log level
The default client log level is 4. When locating the problem, you must modify the log level to reproduce the problem.
· The steps to modify the client log level on Windows systems are as follows:
a. Shut down the Workspace and VdSession processes, otherwise the modifications will not take effect.
b. Open the Documents/Workspace/settings.ini file, search for the LOGLEVEL field, edit its value to 5, and save the configuration.
c. Delete all files in the Documents/Workspace/vdps folder.
d. Reproduce the issue and collect logs.
· The steps to modify the client log level in the SpaceOS system are as follows:
a. To close the Workspace process, execute the pkill Workspace command.
b. Execute the vi /home/spaceos/Documents/Workspace/settings.ini command to open the settings.ini configuration file. Search for the LOGLEVEL keyword, edit its value to 5, and save the configuration.
c. Delete the files in the /home/spaceos/Documents/Workspace/vdps path.
d. Reproduce the issue and collect logs.
|
|
IMPORTANT: The steps to edit the log level of the client in Linux system are the same as in SpaceOS system. You can replace the spaceos parameter in the /home/spaceos/Documents/ path with the current username of your Linux system. |
Log examples
· If a user clicks a desktop on the desktop list, the corresponding log message will include start to connectvm. For example:
2024-06-28 15:19:05.816 [thread 13884][:][info]: start to connectvm, vmid:10.125.11.97-25a4e2f2-af6c-4fab-a088-1b94170d71c6 parentUuid:
· If the user clicks a connected desktop, the desktop window will pop up. The corresponding log message will include notify vdsession to show vdp. For example:
2024-06-28 15:19:22.640 [thread 13884][:][info]: notify vdsession to show vdp, uuid: 10.125.11.97-25a4e2f2-af6c-4fab-a088-1b94170d71c6
· If a user clicks a desktop that is not connected, it will initiate a desktop connection. The corresponding log message will include VdiDesktopSession::connectVM Launch and start vdsession. The former indicates that the client initiates a request to pace Console to query the VM. The latter indicates that the client launches the VdSession desktop connection program. For example:
2024-06-28 09:21:34.450 [thread 1556][:][info]: VdiDesktopSession::connectVM Launch
2024-06-28 09:21:44.905 [thread 1556][:][info]: start vdsession
· After a successful desktop connection, you can check the VdSession log. The presence of the following keywords indicates a successful connection and that the VM display is shown.
¡ Keywords: display mark (with the debug level enabled)
¡ Keywords: send message to workspace type
For example:
2024-06-28 15:16:10.647 [thread 16808][:][debug]: display mark
2024-06-28 15:16:10.647 [thread 16808][:][info]: send message to workspace type = started---.
· If a user actively click a desktop to disconnect from it, the corresponding log message will include user click disconnect. For example:
2024-06-28 15:16:56.194 [thread 17148][:][info]: UI [VdSession]: user click disconnect.
· The desktop initiates the disconnection process, and the corresponding log message will include the following keywords: receive disconnect message, maybe spice channel normal closed or error. is ByUserClick. Where, is ByUserClick indicates whether the disconnection is initiated actively by users. If the execution result is false, the disconnection is not initiated by users and might be caused by network issues or other exceptions.
2024-06-28 15:33:29.377 [thread 13200][:][info]: receive disconnect message, maybe spice channel normal closed or error. is ByUserClick : false
· If the policy group is enabled with reconnection upon network disconnection, the system will not reconnect to the network immediately after a network issue. The following log message will appear when the reconnection starts. The corresponding log message will include the following keywords: NetworkDisconnectDialog begin to reconnect!!!. For example:
2024-06-28 15:33:24.306 [thread 13200][:][info]: test TRACE NetworkDisconnectDialog begin to reconnect!!!
· When the client completes all disconnection processes and is ready for the next connection, the log message will include ~VdSession finished. For example:
2024-06-28 15:33:29.648 [thread 13200][:][info]: ~VdSession finished.
Troubleshooting
Failed to obtain and authorize the current server type after you start the client
Symptom: After opening the client, the system prompts that the current server failed to obtain the type and authorization. You can click Retry or try another server.
Figure 91 Failed to obtain and authorize the current server type

Solution:
1. Identify whether the endpoint network is smooth.
2. Identify whether the server address and port are filled in correctly.
3. Use the ping or telnet command to identify whether the network between the endpoint and the currently configured server is smooth.
4. Identify whether network access between the endpoint and the server is unreachable due to some firewall policies being enabled.
5. Identify whether the proxy is enabled on the endpoint, causing the network to be unreachable.
Workspace suddenly fails to start on an endpoint with Windows system, and no response after double-clicking the application (it could be started before)
Solution:
1. Check Task Manager in Windows for any remaining Workspace processes. If you find any Workspace processes, shut down them and then restart Workspace.
2. If the problem persists, restart the endpoint and try starting Workspace again.
3. If the problem persists, delete all files in the Documents/Workspace folder and restart the endpoint again. (Forcefully shutting down the Workspace process might cause configuration file issues, so this step is required).
An error occurs when logging into the client
Error prompts when logging in to the client include that the current user has no desktop assigned or the current user has no authorization to use the desktop.
Solution: Error prompts are generated by Space Console, so you can contact Space Console administrator for assistance.
The client unable to connect to the desktop after logging into the client and a startup timeout prompt is displayed
Solution:
1. Check Task Manager for any remaining VdSession processes. If you find any VdSession processes, shut down them and then connect again.
2. If the connection timeout prompt persists after shutting down the process or restarting the application, identify whether the VdSession log has been updated at the time of this connection. If the log has been updated, identify whether the log has any errors.
3. If the log is not updated, navigate to the Workspace installation directory and double-click VdSession to check for any error messages on Windows endpoint. For Linux endpoint, use the cd command to enter the version folder (enter the version number as needed) and execute the start_vdsession.sh script to check for any error messages.
//Enter the version folder (enter the version number as needed)
cd /userdata/H3C/Workspace/E1010
./start_vdsession.sh
Failed to connect to the desktop after logging in to the client, prompting that the cloud desktop has been disconnected or the communication between the endpoint and the host where the cloud desktop is located is abnormal
Solution:
1. Check the VdSession log and search for the disconnect reason keyword. The results are as follows:
[2021-12-16 17:13:35:574] [Warning] [38703] #### channel event: 0x7f4801c930 , event No: 24 , disconnect reason: SPICE_CHANNEL_ERROR_IO , channel info: it's MAIN channel.
[2021-12-16 17:13:35:574] [Verbose] [38703] spice channel error, will disconnect current VdSession, event = 24
[2021-12-16 17:13:35:574] [Verbose] [38703] vmdisconnectionFromSpice notify vm disconnect to client "The communication between the endpoint and the host where the cloud desktop is located is abnormal"
2. View the description behind the disconnect reason keyword:
¡ SPICE_CHANNEL_CLOSED, SPICE_CHANNEL_ERROR_CONNECT, SPICE_CHANNEL_ERROR_IO.
These three situations usually indicate network problems. Identify whether the network between the endpoint and the cloud desktop SPICE IP and SPICE port is smooth.
¡ SPICE_CHANNEL_ERROR_TLS.
In this case, the policy usually turns on TLS, and the TLS certificate authentication fails. Contact R&D for help.
|
|
NOTE: · SPICE IP is the IP of the host where the cloud desktop is located. · The port number under the Console SPICE tab is not fixed. You can check the port number on the Console tab of the Edit page on Space Console. |
Failed to connect again after disconnecting from the VM
Solution:
1. This is most likely caused by process residue. For Windows, enter the task manager to shut down the VdSession process or restart the endpoint to restore it.
2. For Linux, the method to shut down the process is as follows:
//Identify whether the VdSession process and process id exist
ps –fe |grep VdSession
//Shut down VdSession peocess
kill -9 process id
The connection to the cloud desktop automatically disconnects after a fixed period of time
Solution:
1. Identify whether the cloud desktop timeout disconnect feature in the custom settings is enabled. If it is enabled, this problem might occur.
2. Navigate to the Space Console > System > Advance Settings > System Parameters > Cloud Desktop Parameters page, identify whether the desktop logout timeout is enabled. If it is enabled, this problem might occur.
The screen freezes after connecting to the desktop
Solution:
1. Firstly, confirm whether the endpoint is frozen. Press the CapsLock key on the keyboard to observe if the indicator light changes. If it does not change, the endpoint has frozen and you can collect endpoint logs for analysis.
2. If the endpoint has not frozen, click Toolbar (the circular toolbar). If the toolbar responds normally, it means the client has not crashed. If Toolbar is unresponsive, it means the client has crashed. You can collect endpoint logs for analysis.
Figure 92 Toolbar
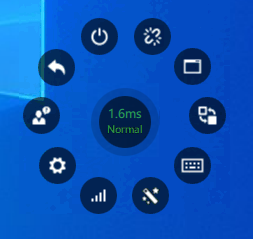
3. If the client has not crashed, open the console of the cloud desktop in the corresponding desktop pool of Space Console and identify whether the mouse can operate normally and if the interface is displayed normally. If the screen cannot be displayed normally, it means the cloud desktop has frozen. You can collect endpoint logs for analysis. Generally, restarting the cloud desktop can restore it. If the screen can be displayed normally, it may be an issue with the update mechanism of the cloud desktop on the client. Contact R&D for help.
Learningspace client
Software Features
The Learningspace client consists of teacher client, student client, and student VM application. The teacher client is installed on a PC and supports Windows operating system. The student client is installed on an endpoint box and supports both Windows and SpaceOS operating systems. The VM application supports Windows operating system and is installed in the course image.
Components introduction
The interactive components of the Learningspace client are shown in the figure below:
Figure 93 Learningspace components and interactions
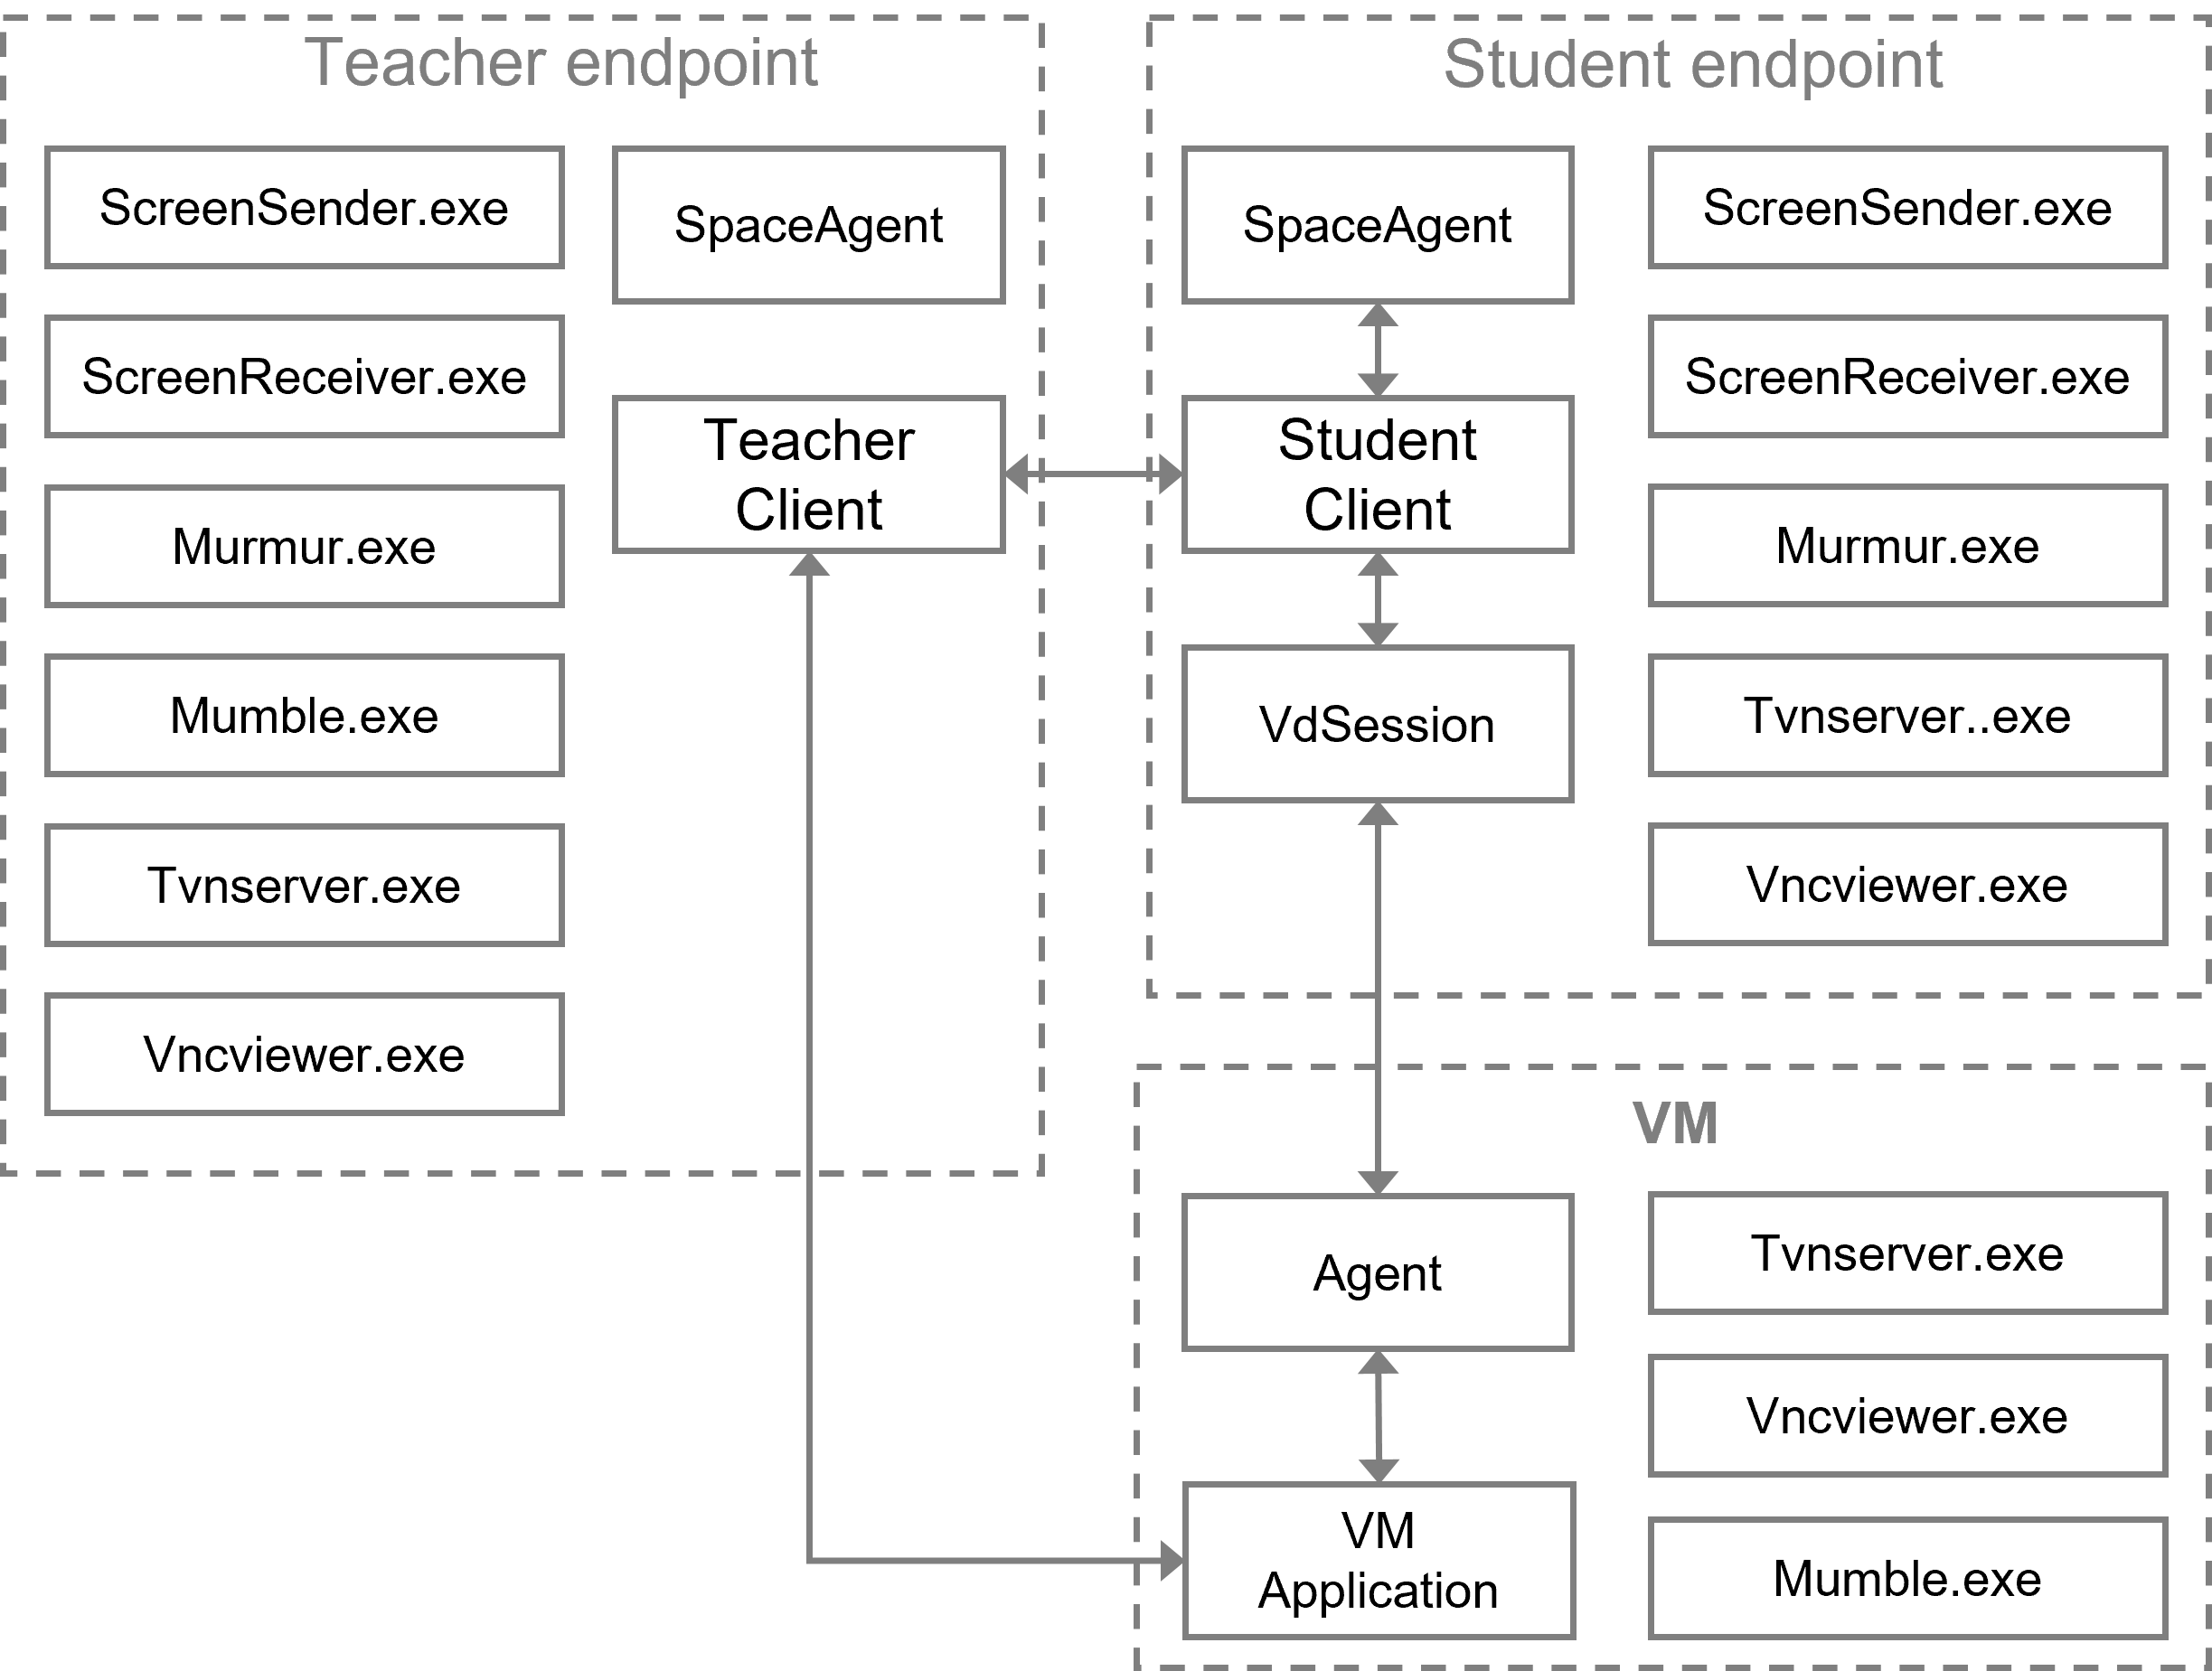
· The interactive components on the teacher client include SpaceAgent, ScreenSender, ScreenReceiver, Murmur, Mumble, tvnserver, vncviewer, and VdSession.
· The interactive components on the student client include SpaceAgent, ScreenSender, ScreenReceiver, Mumble, tvnserver, vncviewer, and VdSession.
· The interactive components involved in the student VM application include Agent/VOIAgent, Mumble, tvnserver, and vncviewer.
Component usage
· ScreenSender and ScreenReceiver are components used for screen broadcasting and monitoring. They capture the screen of the desktop system and send it to another computer's desktop on the local network in real time. ScreenSender is responsible for capturing the screen of the desktop system, compressing it into a video stream, and sending it to a specified network address. ScreenReceiver receives the compressed video stream, decompresses it, and displays it.
· Murmur and Mumble are third-party components used for voice functionality, primarily for interactive voice communication. Murmur serves as a voice server, controlling the forwarding of voice, while Mumble serves as a voice client responsible for voice capture and playback.
· Tvnserver and Vncviewer are third-party components used for remote assistance, primarily for assisting in operating another computer. Tvnserver serves as the server (controlled end), while Vncviewer serves as the client to control the server computer.
· SpaceAgent is a service on the endpoint that receives notifications for class start and end from the platform.
· Agent is a service on the VM that provides message forwarding in VDI scenarios.
· VoiAgent is a service on the VM that provides receiving notifications for class start and end, network management, USB control, and system restart in VOI scenarios.
· VdSession is a VM connection component that provides related functions for connecting to VMs.
Component interaction methods
· SpaceAgent interacts with the teacher and student endpoints through pipelines. After the teacher and student endpoints are started, they will connect to SpaceAgent's pipeline service. When the endpoint is restarted, SpaceAgent will be notified to perform corresponding system restart operations. When the class starts or ends successfully on the platform, the message will be forwarded to the teacher and student endpoints for processing through SpaceAgent.
· The teacher and student endpoints communicate through a long connection for the teacher endpoint to send control commands to the student endpoint, and the student endpoint feeds back the processing results to the teacher endpoint.
· The VM applications on the student endpoint and the student endpoint communicate through multiple components for message forwarding. The student endpoint uses VdSession and the Agent in the VM to forward to the student endpoint VM application.
· The VM applications on the teacher and student endpoints communicate through a long connection, only for homework submission and receiving.
Introduction
Common functions and processes are as follows:
Start/end class
You can start and end class both on the teacher endpoint and Space Console. The class start and end process on Space Console and teacher endpoint are similar. Taking class start on the teacher endpoint as an example:
Figure 94 Process of taking a class
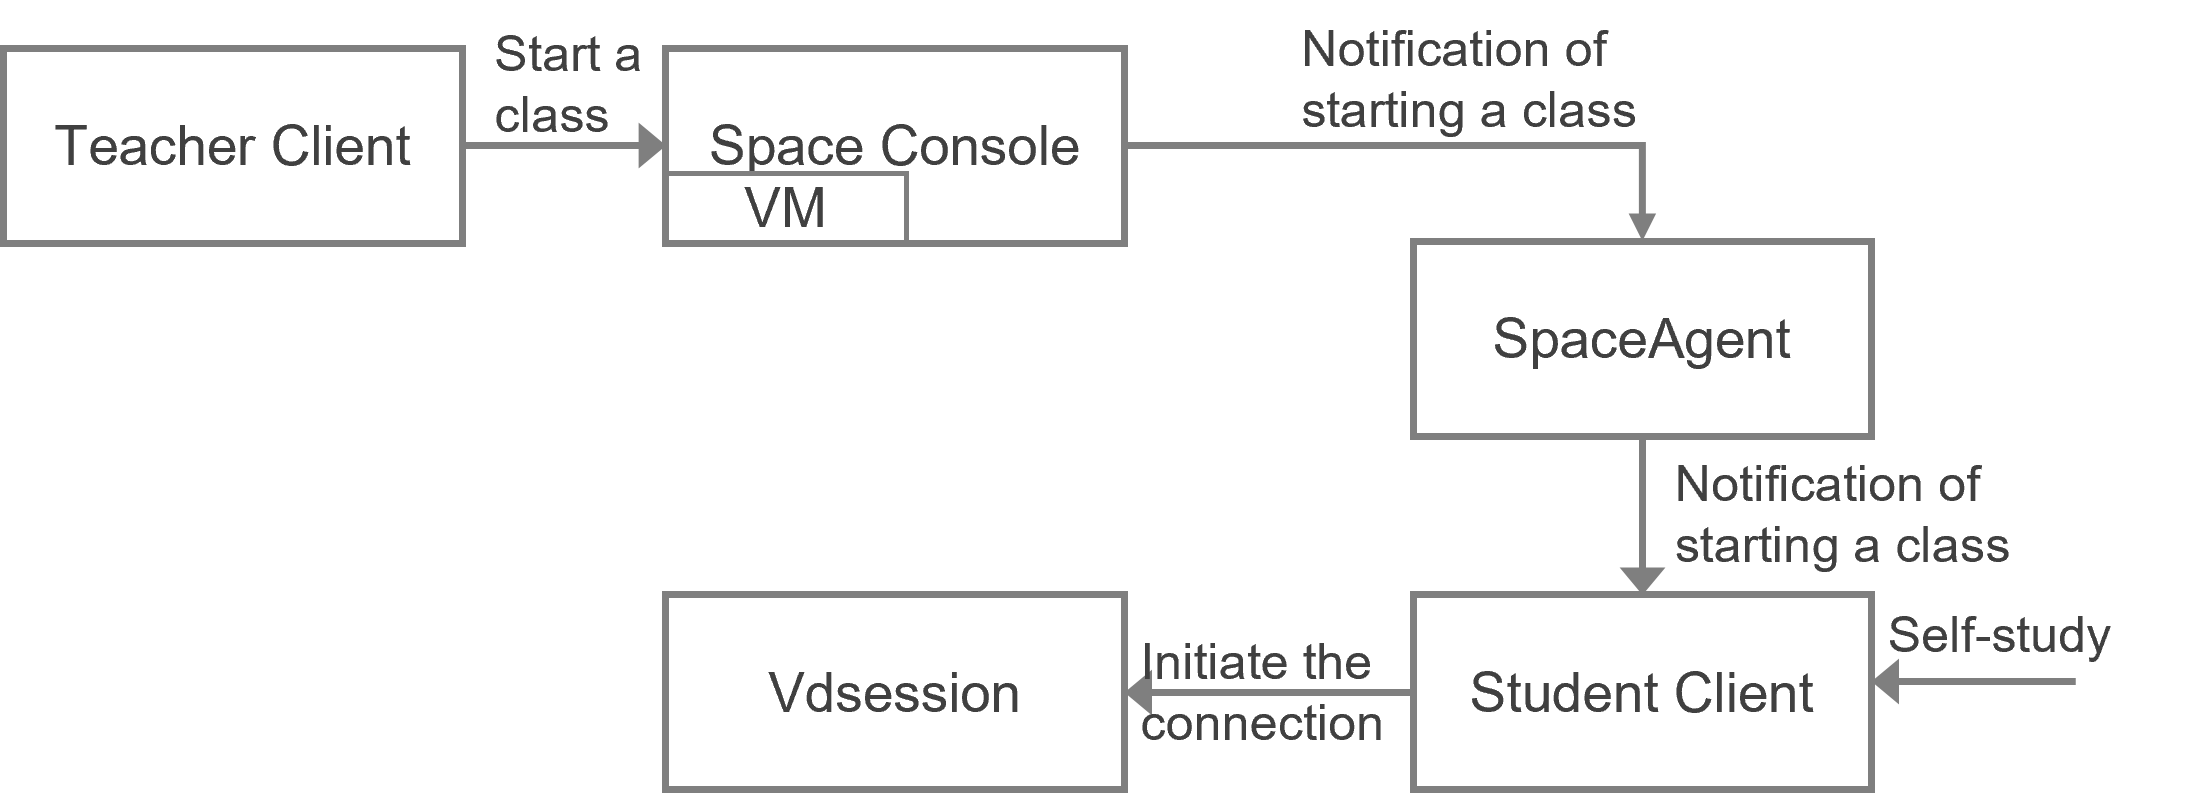
On the teacher endpoint, starting a class triggers the platform to create a VM. After creating the VM, the platform notifies the student endpoint to connect to it through SpaceAgent.
In a combined class scenario, students establish a connection with the teacher endpoint to receive instructional control. For example, if teacher endpoint A selects classrooms A and B for the class, students in classroom B will connect to teacher endpoint A to receive instructional control.
If students do not automatically connect to the VM after the teacher endpoint starts the class, identify whether the SpaceAgent component is installed on the student endpoints.
Homework distribution
Perform this task to send homework to the VM on the student endpoint from the teacher endpoint. The process of homework distribution is as follows:
Figure 95 Distributing homework
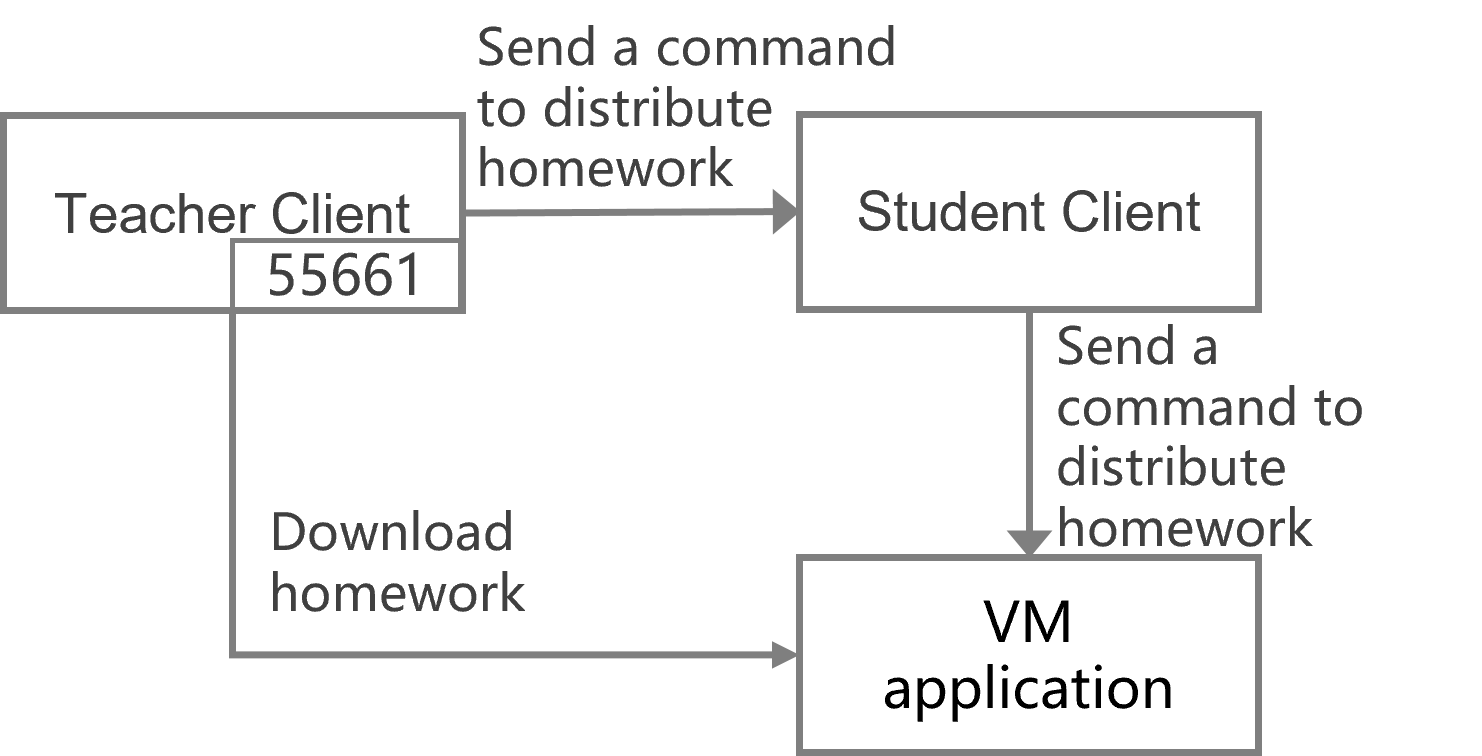
|
|
IMPORTANT: Use port 55661 when distributing homework. Ensure that the teacher endpoint and the student endpoint are connected to the network (the teacher endpoint sends commands such as a black screen, and the students endpoint can respond). Ensure that the student endpoint and the platform are connected to the network (the student endpoint can normally connect to the VM to indicate connectivity). Ensure that the teacher endpoint and the VM are connected to the network. |
Homework submission
The homework submission feature allows students to manually upload homework to the teacher endpoint. The process of homework submission is as follows:
Figure 96 Submitting homework
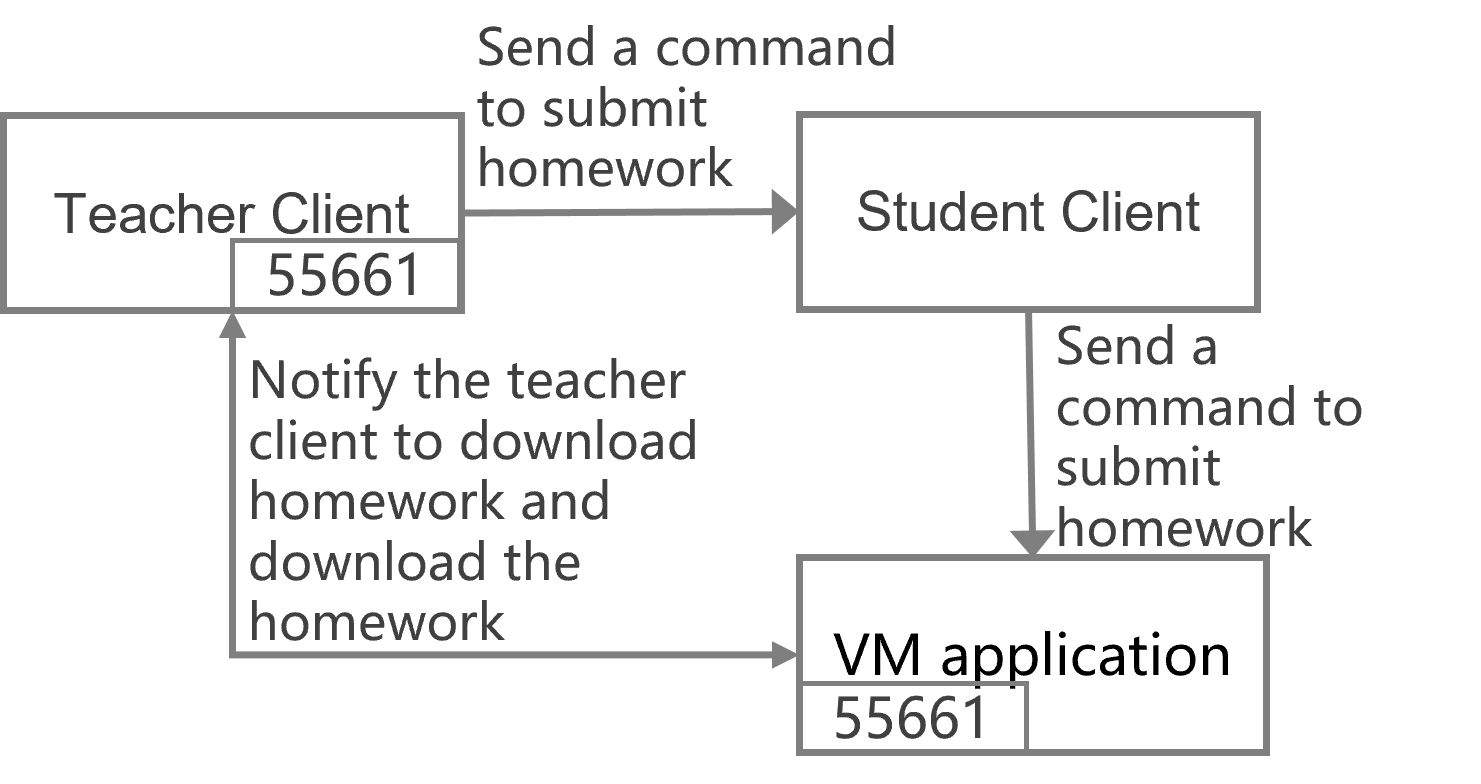
|
|
IMPORTANT: For successful submission of homework, the teacher endpoint and VM must have communication on port 55661, and the student endpoint and VM application must communicate via desktop protocol. If the homework is successfully distributed but fails to be submitted, first identify whether the teacher endpoint and the VM have single-pass communication. The VM can be connected to the teacher endpoint, but the teacher endpoint cannot be connected to the student endpoint. Also identify whether the firewall has a policy similar to blocking single traffic. |
Screen broadcasting
Perform this task to the share the screen from the teacher endpoint to the student endpoint, involving both the teacher endpoint and the student endpoint. The components and process are as follows:
Figure 97 Screen broadcasting

The network between the screen broadcasting sender and receiver uses multicast, requiring multicast communication capability. Screen broadcasting captures and encodes the screen on the teacher endpoint, sends it to the student endpoint, and the student endpoint decodes and displays the data. Screen capture, encoding, and decoding are resource-intensive tasks for PCs or endpoints.
Remote assistance
Remote assistance is mainly used for teachers to assist students in operating, so it is unable to achieve the same level of interface display as a VM connection. When the endpoint system is SpaceOS, the VNC component runs in the VM, and the teacher's commands will be forwarded to the VM through the student endpoint. When the endpoint system is Windows, the VNC component runs on the endpoint. The detailed process is as follows:
Figure 98 Remote assistance
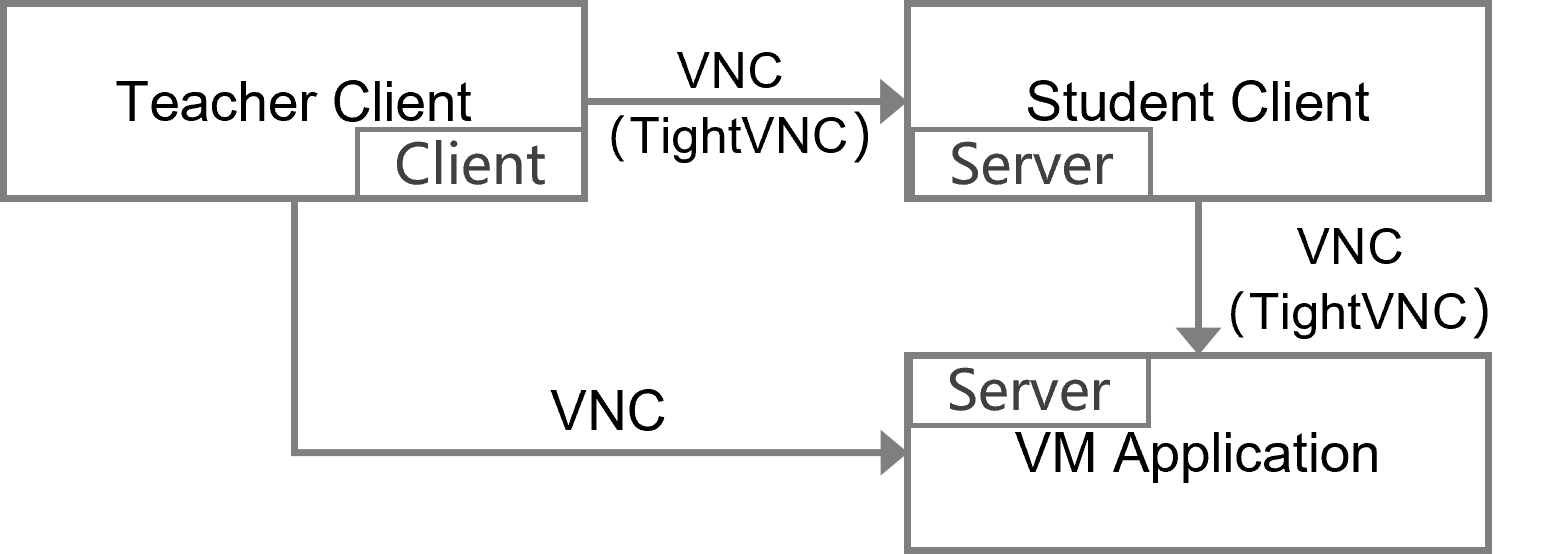
Student broadcasting
Student broadcasting is a combination of remote assistance and screen broadcasting. Start remote assistance first, and then start screen broadcasting. If any one of the components fails to start, the broadcast will fail. The process is as follows:
Figure 99 Student broadcasting
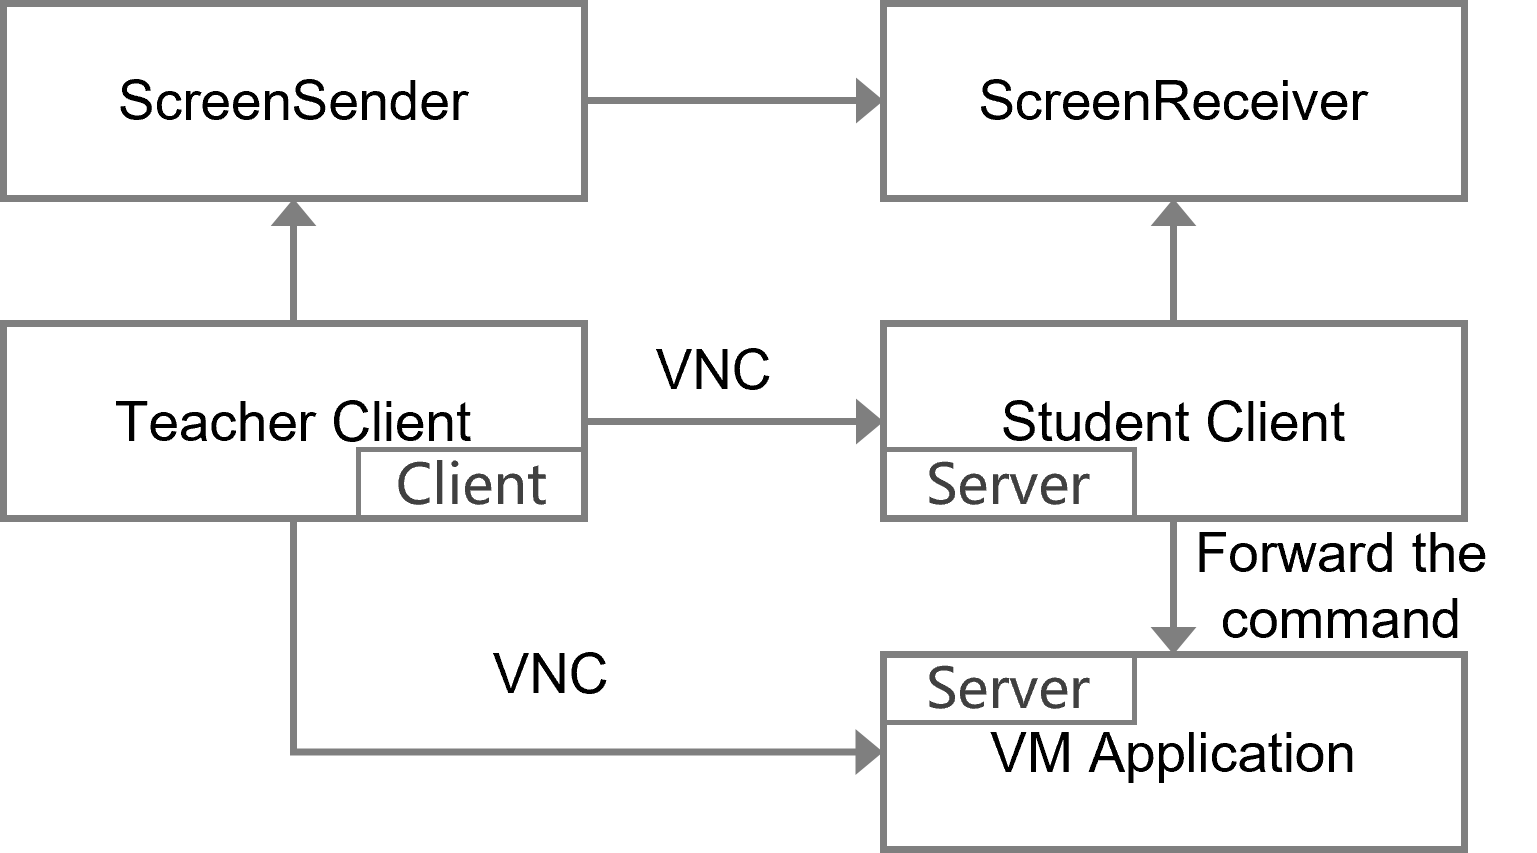
Student demonstration
Student demonstration is similar to student broadcasting, which is a combination of remote assistance and screen broadcasting. However, in student demonstration, the student client controls the teacher client and broadcasts the screen.
Figure 100 Student demonstration
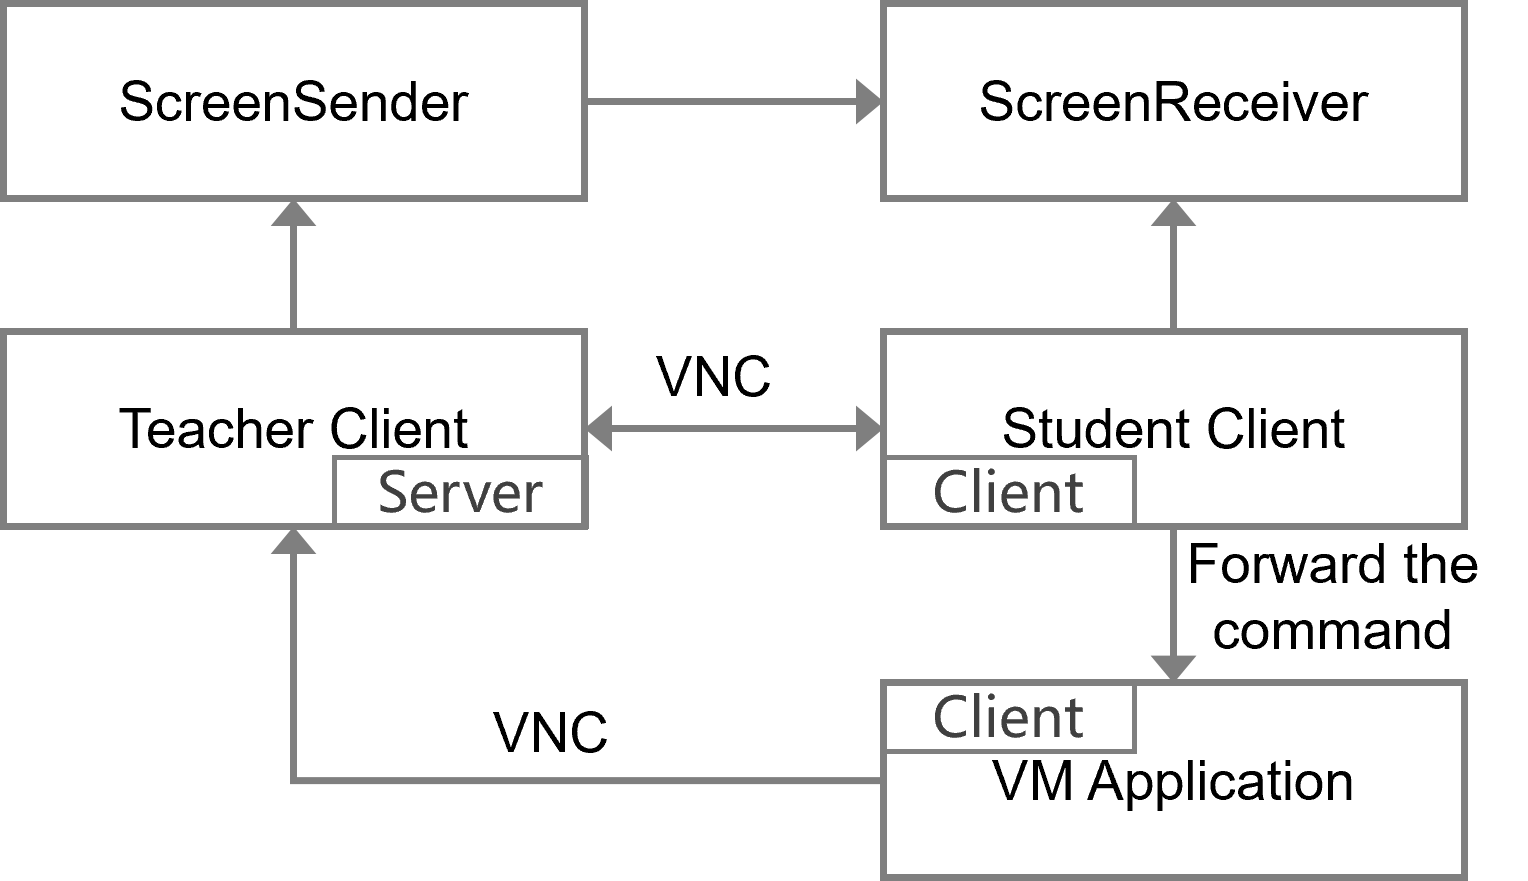
Deploy endpoints
On the endpoint maintenance page of the teacher endpoint, a search is initiated which triggers the teacher endpoint to send multicast deployment packets to the student endpoint.
Upon receiving the deployment message, the student endpoint uses the teacher endpoint's IP from the message to establish a GRPC connection and requests for an endpoint ID allocation. Once the student endpoint receives the assigned ID from the teacher endpoint, the deployment process is completed.
Figure 101 Deploy endpoints

Endpoint power on
Wake-on-LAN (WOL/WoL) is a technology commonly referred to remote wake-up technology. WOL is a technology and a standard for this technology. It allows a computer that is in sleep or powered-off state to be awakened or switched from the off state to the up state through a command sent over a local area network (typically Ethernet) from the other endpoint.
The endpoint power-on function sends a wake-up packet containing the MAC address of the endpoint to the endpoint, which is then sent to the network card of the endpoint through UDP packets. If the endpoint supports wake-on-LAN and has enabled this feature, it will be powered on. To address packet loss, the power-on packet from the teacher endpoint is sent 10 times.
Logs
Path of logs
· Teacher endpoint operation log: C:\Users\Currrent login user\Documents\Learningspace\log\teacher.*.log
· Logs of student endpoint with Windows system: C:\Users\Currrent login user\Documents\Learningspace\log\student.*.log
· Logs of student endpoint with SpaceOS system: /userdata/H3C/Learningspace/version/log/student.*.log
· Endpoint for sending screen broadcasts (Windows system): C:\Users\Currrent login user\Documents\Learningspace\log\screensender.*.log
· Endpoint for sending screen broadcasts (SpaceOS system): /userdata/H3C/Learningspace/version/log/screensender.*.log
· Endpoint for displaying screen broadcast (Windows system): C:\Users\Currrent login user\Documents\Learningspace\log\screenreceiver.*.log
· Endpoint for displaying screen broadcast (SpaceOS system): /userdata/H3C/Learningspace/version/log/screenreceiver.*.log
· Logs of student endpoint VM applications: C:\Users\Currrent login user\Documents\Learningspace\log\vm.*.log
Collect logs
Enter http://ip:9001 in the browser to obtain the endpoint logs, and enter http://ip:9003 in the VM browser to obtain the VM logs. After decompressing the file, you can view the corresponding log in the root directory of the decompressed folder. The files are as follows:
· Logs on teacher endpoint: teacher.*.log
· Logs on student endpoint: student.*.log
· Logs of student endpoint VM applications: vm.*.log
· Logs for screen broadcasts sending endpoint: screensender.*.log
· Logs for screen broadcasts receiving endpoint: screenreceiver.*.log
Troubleshooting
The teacher endpoint cannot deploy the student endpoint
1. Identify whether the student endpoint is waiting for the deployment page. Try to use the reset function of the student endpoint to completely clear the deployment information, and try again to search whether the deployment is successful on the teacher endpoint.
2. Identify whether the multicast on the teacher endpoint and the student endpoint are connected. Identify whether the network is connected by pinging each other on the teacher and the student endpoint. If they can all ping each other, start the search on the teacher endpoint and collect student endpoint logs (see "Collect logs"). Check the student endpoint log (student.*.log) to confirm whether the student endpoint has enabled multicast reception and received multicast. If it is found that multicast is enabled but no multicast messages are received, identify whether the switch network restricts multicast. Example of student endpoint log:
[2022-04-24 16:43:13:116] [Verbose] [27861] joinMulticastGroup ->>>>> "225.1.1.1" 12345
…
[2022-04-24 16:43:21:989] [Verbose] [27861] Network recved to send- "10.125.17.31:9111;2;18:65:71:EA:4C:28"
[2022-04-24 16:43:21:989] [Verbose] [27861] DepolymentProcessorPrivate::receiveTeacherMulticastInfo > "10.125.17.31:9111;2;18:65:71:EA:4C:28"
[2022-04-24 16:43:22:002] [Verbose] [27861] Settings::exists() > -1 2 ""
[2022-04-24 16:43:22:003] [Verbose] [27861] receive multicast info from teacher. ip: "10.125.17.31" ,port: "9111" ,classroom: "2" ,teacher mac: "18:65:71:EA:4C:28"
|
|
IMPORTANT: In the example, 10.125.17.31 is the IP address of the teacher endpoint. Identify whether the IP address is correct. |
3. Confirm whether the IP address of the teacher endpoint in the received deployment information (the red content in the log below) is correct. Confirm whether the student endpoint can connect to the teacher endpoint through this IP address (the red content in the log below indicates a successful connection). The sample log is as follows:
[2022-12-28 10:32:33:233] [Verbose] [384] Engine::createMessageHanlder grpcIp: "10.125.9.55" ,grpcPort: 9111 ,classRoomId: "1"
[2022-12-28 10:32:33:233] [Verbose] [384] Engine::createMessageHanlder connected: false
[2022-12-28 10:32:33:233] [Verbose] [384] Engine::createMessageHanlder d->teacherMessenger->teacherIpAddress() ""
[2022-12-28 10:32:33:233] [Verbose] [384] Engine::createMessageHanlder reconnect.
[2022-12-28 10:32:33:233] [Verbose] [384] init()--->teacher.ip "10.125.9.55"
[2022-12-28 10:32:33:233] [Verbose] [384] setGrpcConnected
[2022-04-24 16:43:22:067] [Verbose] [27861] setGrpcConnected
[2022-04-24 16:43:22:124] [Verbose] [28084] Student receive switch config msg
[2022-04-24 16:43:22:144] [Verbose] [27861] student first receive teacher HEARTBEAT_RECEIPT
[2022-04-24 16:43:22:144] [Verbose] [27861] setGrpcConnected
[2022-04-24 16:43:22:190] [Verbose] [27861] d->queryClient->signal flag--> false
[2022-04-24 16:43:22:190] [Verbose] [27977] do stop query teacher.
[2022-04-24 16:43:22:190] [Verbose] [27861] handleMonitor
[2022-04-24 16:43:22:191] [Verbose] [27861] handleMonitor config set is off.
[2022-04-24 16:43:22:191] [Verbose] [27861] stopMonitor
|
|
IMPORTANT: If the student endpoint has not been connected to the teacher endpoint, confirm whether the local IP address used by the teacher endpoint is correct and whether the teacher endpoint uses dual network cards. When the software checked that both network cards and the platform's network are available, it cannot be sure whether the network card used is correct. After disabling a network card, restart the teacher endpoint and try again, and then enable the network card. |
The teacher endpoint cannot control the student endpoint
1. Confirm whether the problem is that the students on the teacher endpoint are displayed as offline, or that the students are displayed as online but some functions cannot be used.
2. If the teacher endpoint shows that the student endpoint is offline, identify whether the student interface is visible on the student endpoint. In the VOI scenario, you can open the task manager to identify whether the student endpoint process exists. If the student endpoint process does not exist, you can restart the endpoint to restore it. If the student endpoint process exists, identify whether the classroom on the student endpoint is consistent with the classroom registered on the teacher endpoint in the settings page of the student endpoint. If they are inconsistent, you can reset the endpoint and redeploy. If they are consistent, you can identify whether the network information such as the subnet mask of the student endpoint is consistent with the teacher endpoint. (Ensure that the broadcast communication is normal so that the student endpoint can discover the current network address of the teacher endpoint through broadcast).
3. If the teacher endpoint shows that student endpoint is online, but some functions cannot be used, such as student broadcast, student demonstration, and homework distribution are not available. Identify whether the teacher endpoint uses dual network cards. When the software checked that both network cards and the platform's network are available, it cannot be sure whether the network card used is correct. After disabling a network card, restart the teacher endpoint and try again, and then enable the network card.
Failed to distribute and submit homework
1. Identify whether the student VM application is installed in the VM template and starts normally after starting class.
2. Identify whether the teacher endpoint and the VM network are connected. Network connectivity can be confirmed by collecting logs. Enter the VM log collection address in the teacher endpoint browser and identify whether you can access to the http://VM IP:9003 page. Enter the teacher endpoint log collection address in the browser of the VM and identify whether you can access to the http://teacher IP:9001 page. If it can be opened, execute the telnet command in Windows to identify whether port 55661 is accessible.
3. If the above is normal, identify whether the teacher endpoint uses dual network cards. When the software checked that both network cards and the platform's network are available, it cannot be sure whether the network card used is correct. After disabling a network card, restart the teacher endpoint and try again, and then enable the network card.
Black screen and freezes occur during screen broadcast
1. Identify whether the black screen or freeze occurs on a single endpoint or all endpoints. Black screen freezes on a single endpoint are generally caused by the endpoint network cable. This can be confirmed by exchanging network cables with a normal endpoint next to it.
2. If all endpoints have a black screen after the screen broadcast, you can identify whether the teacher endpoint uses dual network cards. When the software checks that both network cards and the platform's network are available, it cannot be sure whether the network card used is correct. After disabling a network card, restart the teacher endpoint and try again.
3. If all endpoints have a black screen after the screen broadcast, collect student endpoint logs 20 minutes after the screen broadcast (see "Collect logs"). Check the screen broadcast receiver log (screenreceiver.*.log) to identify whether packet statistics messages are printed (packet statistics are printed once every 2 minutes, as shown in the log below). If no log information is found, it means that the student endpoints did not receive the broadcast packet. Identify whether multicast is available from the switch.
[2022-04-25 10:22:09:976] [Verbose] [1958] seqInitErrCnt: 0 seqRecvIErrCnt: 2 seqIErrCnt: 0 seqRecvPErrCnt: 0
[2022-04-25 10:22:09:976] [Verbose] [1958] seqLostTotalCnt: 22 seqErrCnt: 2 lengthErrCnt: 0 decodeErrCnt: 0 otherErrCnt: 2
[2022-04-25 10:24:02:757] [Verbose] [1958] statusInitErrCnt: 54 statusRecvIErrCnt: 0 statusIErrCnt: 0 statusRecvPErrCnt: 0
[2022-04-25 10:24:02:758] [Verbose] [1958] seqInitErrCnt: 0 seqRecvIErrCnt: 6 seqIErrCnt: 0 seqRecvPErrCnt: 0
[2022-04-25 10:24:02:758] [Verbose] [1958] seqLostTotalCnt: 67 seqErrCnt: 6 lengthErrCnt: 0 decodeErrCnt: 0 otherErrCnt: 6
[2022-04-25 10:25:54:980] [Verbose] [1958] statusInitErrCnt: 143 statusRecvIErrCnt: 0 statusIErrCnt: 0 statusRecvPErrCnt: 0
[2022-04-25 10:25:54:981] [Verbose] [1958] seqInitErrCnt: 1 seqRecvIErrCnt: 15 seqIErrCnt: 0 seqRecvPErrCnt: 0
[2022-04-25 10:25:54:981] [Verbose] [1958] seqLostTotalCnt: 119 seqErrCnt: 16 lengthErrCnt: 0 decodeErrCnt: 0 otherErrCnt: 16
4. If the screen freezes after the broadcast, you can check the packet statistics printed in the endpoint log 20 minutes after the screen broadcast. If the number of the seqLostTotalCnt field is greater than 1000, a large amount of packet loss exist. Check the cause of packet loss on the switch.
After starting student broadcast or student demonstration for a period of time, the teacher prompts an abnormality and the endpoint screen goes black
Because broadcasts and demonstrations use both the remote assistance and screen broadcast functions, and the remote assistance function consumes a lot of network. In the case of high forwarding, network instability might cause this problem. First, upgrade the network card driver on the teacher endpoint, and then check the network situation.
The remote assistance function is unavailable after changing the IP address of the teacher endpoint
After changing the teacher endpoint IP address, it might lead to problems such as the unable to search for student endpoints during deployment, invalid screen monitoring, unable to provide remote assistance, and abnormal student broadcasting. The solutions are as follows:
1. Ensure that the modified IP address of the teacher endpoint and the student endpoint are on the same network segment or the same switch.
2. Restart the software on teacher endpoint and log in again. Try to see if the corresponding functions return to normal.
3. If the teacher endpoint has dual network cards, disable one network card, keep the available network card, and log in again.
4. If the problem persists, confirm whether the IP address recorded in the configuration file of the teacher endpoint is the real IP. The configuration file path is in the user document directory. For the specific path and fields, see Figure 104.
Figure 102 Viewing the configuration file on teacher endpoint
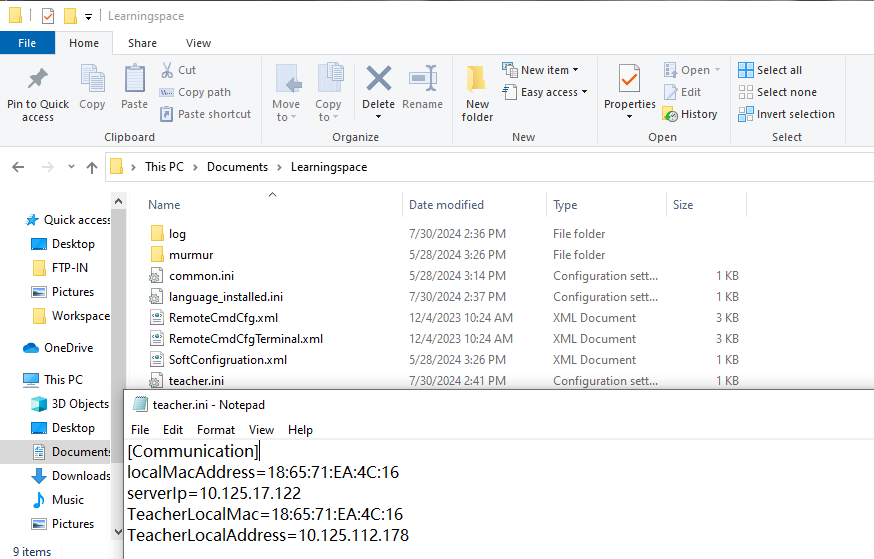
Remote wake-up the endpoint
|
|
NOTE: · The endpoint remote wake-up supports only SpaceOS endpoints. · As from E1013P31, Workspace allows remote wake-up of cross-segment endpoints not on the network segment of Space Console via forward nodes. |
1. Ensure that the teacher endpoint and student endpoint are on the same network segment or the same switch.
2. Ensure that the student endpoint supports and has the Wake-on-LAN feature enabled.
ARM endpoints (C113 and C1100 series)
¡ Execute the sudo spirit –i command. If the jsp wake on lan field displays 1, the Wake-on-LAN feature is enabled. If the jsp wake on lan field displays 0, the Wake-on-LAN feature is disabled.
¡ To enable the Wake-on-LAN feature, execute sudo spirit -w 1. To disable the Wake-on-LAN feature, execute sudo spirit -w 0.
|
|
NOTE: For endpoints in C113 series hardware version A0 (obtained from the endpoint nameplate), you must power cycle the endpoints after executing spirit-related commands. |
Figure 103 Enabling status of the Wake-on-LAN feature
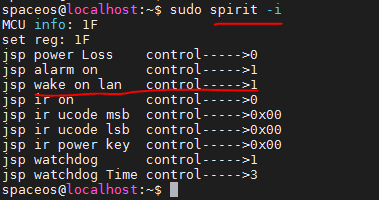
x86 endpoints (C31M and C3300 series)
a. Execute the ip a command to identify the name of the current NIC.
Figure 104 Current NIC name enp1s0
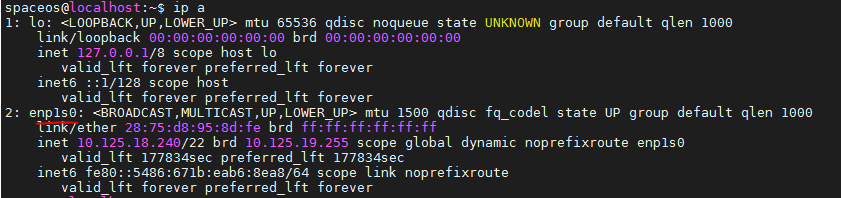
b. Execute sudo ethtool enp1s0 to obtain the enabling status of the Wake-on field. Where, enp1s0 is the name of the NIC obtained from the previous step. You can replace it with another NIC name as needed. When the output shows g for Wake-on, the endpoint supports the Wake-on-LAN feature.
c. To enable the Wake-on-LAN feature, execute sudo ethtool -s enp1s0 wol g. To disable the Wake-on-LAN feature, execute sudo ethtool -s enp1s0 wol d.
Figure 105 Viewing Wake-on status
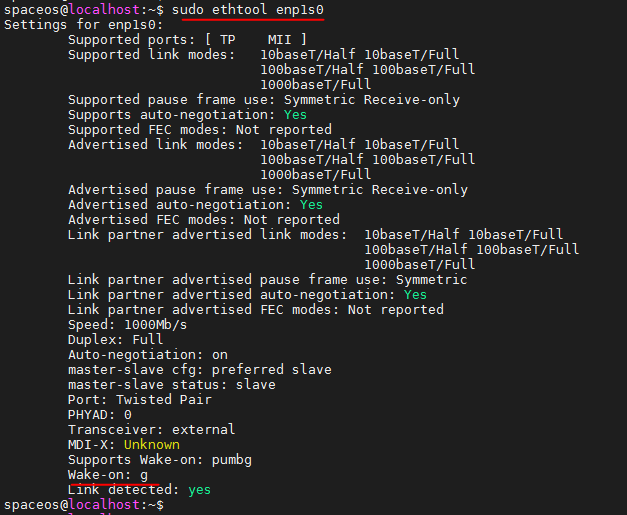
3. Identify whether the switch is forwarding the Wake-on-LAN packets normally.
SpaceAgent
Component overview
SpaceAgent is a system program for H3C client management. It automatically runs in the background when the client starts up. It provides client installation, upgrade, log collection, device registration, single sign-on, and remote management functions.
SpaceAgent consists of the SpaceAgent, upgrader, and popview components. SpaceAgent is used for communication and management, upgrader for downloading upgrades, and popview for display and interaction.
Features
Log collection
SpaceAgent provides log collection services. Enter endpoint IP:9001 in the browser to access the log collection page, and click Collect Logs. The compressed client logs will be downloaded to the browser's default download path, including logs for the operating system, client, SpaceAgent, and peripheral driver modules.
Figure 106 Log collection
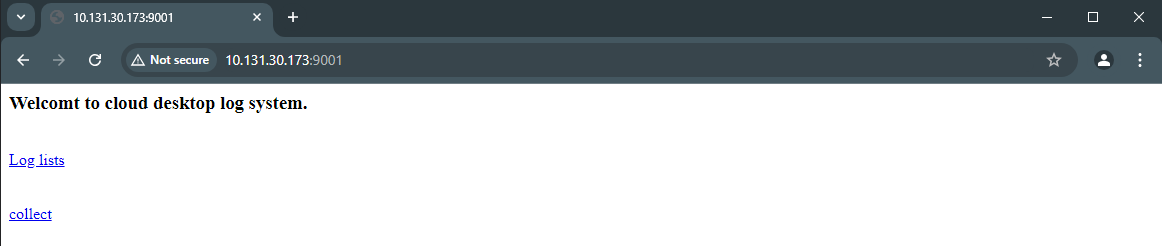
Figure 109 shows the log file structure for a Linux desktop.
Figure 107 Linux desktop log collection
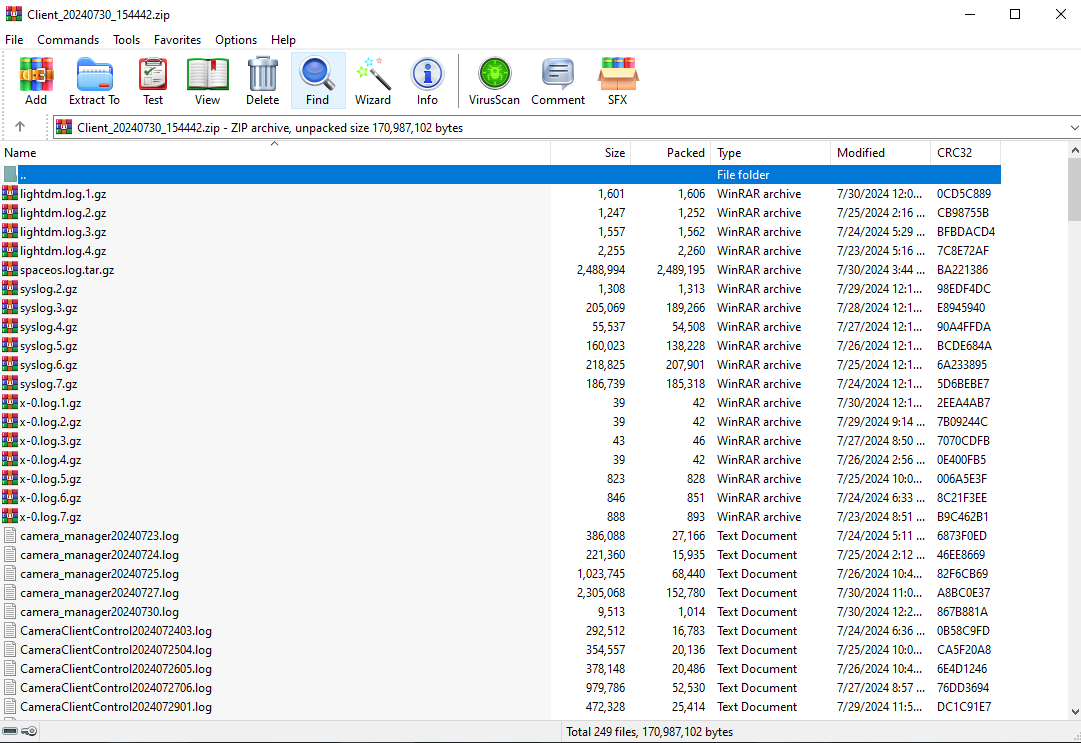
|
|
IMPORTANT: To use log collection, ensure that port 9001 is enabled on the endpoint. |
Upgrade services
SpaceAgent can run on Windows, Linux, and MacOS systems, and support VDI, IDV, and VOI clients, Learningspace client, and SpaceOS deployment and upgrade. SpaceOS is a type of Linux system.
See H3C Workspace Cloud Desktop Upgrade Guide for the upgrade methods of the clients and SpaceOS.
Component running status check
SpaceAgent running status check on a Linux endpoint
Use the Linux command ps to query the running processes.
ps aux | grep -I spaceagent
Figure 108 SpaceAgent running status check on a Linux endpoint
![]()
SpaceAgent running status check on a Windows endpoint
Use Task Manager to identify whether the SpaceAgent services are running correctly.
Figure 109 SpaceAgent running status check on a Windows endpoint
SpaceAgent running status check through logs
Enter endpoint IP:9001 in the browser. If the log service homepage can be opened, SpaceAgent is running. Otherwise, the SpaceAgent program is not running or running abnormally.
Troubleshooting
Table 5 Troubleshooting client upgrade issues
|
Error |
Symptom |
SpaceAgent log |
Remarks |
|
The client does not have network connectivity with the management platform. |
After the endpoint starts, no upgrade prompts are displayed on the endpoint. |
Ntpdate synchronization has failed, and gRPC message transmission has failed. |
· If Workspace is installed and you cannot access the server, the network is not available. · If Workspace is not installed, use ping or a port scanning tool to probe the server network for reachability. |
|
The OS upgrade package has not been uploaded to the platform. |
After the endpoint starts, no upgrade prompts are displayed on the endpoint. |
SpaceOS UpgradeResp is empty. |
Ignore this error for non-SpaceOS endpoints. |
|
The OS upgrade package has been uploaded to the platform, but upgrade is not enabled. |
After the endpoint starts, no upgrade prompts are displayed on the endpoint. |
SpaceOS UpgradeResp is empty. |
Ignore this error for non-SpaceOS endpoints. |
|
The SpaceAgent upgrade package has not been uploaded to the platform. |
After the endpoint starts, no upgrade prompts are displayed on the endpoint. |
SpaceAgent UpgradeResp is empty. |
Make sure that the upgrade package matches the endpoint architecture, such as ARM32, MIPS, ARM64, and Windows. |
|
The SpaceAgent upgrade package has uploaded to the platform, but upgrade is not enabled. |
After the endpoint starts, no upgrade prompts are displayed on the endpoint. |
SpaceAgent UpgradeResp is empty. |
Make sure that the upgrade package matches the endpoint architecture, such as ARM32, MIPS, ARM64, and Windows. |
|
The platform does not assign the endpoint to a specified type of group. |
After a client upgrade task is pushed to an endpoint, no upgrade prompts are displayed on the endpoint. |
No upgrade push information record exists. |
Make sure that the upgrade package matches the endpoint architecture, such as ARM32, MIPS, ARM64, and Windows. |
|
The Workspace client cannot be automatically upgraded in versions prior to E1012 (exclusive). |
· In the gateway scenario, the client upgrade package has been uploaded correctly and the endpoint group has been created correctly, but automatic deployment of the Workspace client cannot be performed. |
· A record of upgrade push information exists, but the download of the upgrade package has failed. |
In versions prior to E1012 (exclusive), SpaceAgent does not support the automatic deployment of the Workspace client in the gateway scenario. Only E1012 and later versions support the automatic deployment of the client in the gateway scenario. |
|
The NTP synchronization service is not enabled on the platform. |
· An endpoint with version 1009 or earlier does not upgrade a long period of time (about 20 minutes) after startup, and the endpoint state is offline on the management platform. Before you check the endpoint state, refresh the endpoint list. If you can restart an endpoint by clicking the remote restart button, the endpoint is online. · An endpoint with a version later than 1009 might go offline and do not upgrade after connecting to the server if there is a significant time deviation between the endpoint and the server (about 2 minutes). |
Ntpdate synchronization has failed. |
On a Linux endpoint, you can manually check the NTP service status by entering the ntpdate -d <server IP> command. |
|
The NTP port is blocked in the network environment. |
Same as the above row. |
Same as the above row. |
· Use a network port scanning tool to detect whether port 123 is available. · You can manually check the NTP service status by entering the ntpdate -d <server IP> command. |
|
The network environment restricts privileged ports. |
Same as the above row. |
Same as the above row. |
If execution of the ntpdate -d <server IP> or ntpdate -u <server IP> command is successful and execution of the ntpdate <server IP> command is abnormal, modify the network configuration of the site. |
SpaceOS (VDI)
This section introduces the troubleshooting and handling methods for the VDI SpaceOS system.
Pre-check items
Before performing problem localization and troubleshooting, check the following pre-check items.
1. Determine whether the issue occurs on the VM side or the endpoint side.
2. Identify whether there are any obvious business errors in the /var/log/syslog log of the endpoint system by connecting to it remotely via SSH.
3. Identify whether the problem recurs regularly, and timely record the triggering operations and symptom for recurrence.
4. Collect system endpoint logs in a timely manner.
Table 6 Common maintenance commands
|
Common maintenance commands |
|
|
View the SpaceOS system version. |
cat /etc/spaceos-version |
|
View disk information. |
lsblk |
|
View the endpoint model. |
dmidecode -s system-product-name |
|
Check the disk space usage. |
df -h |
|
View the file system type of the system disk. |
blkid |
|
View the endpoint resolution. |
export DISPLAY=:0.0 xrandr |
|
Play audio. |
apply |
|
Record. |
arecord |
|
Control audio. |
Pavcontrol |
Troubleshooting common display issues
The reasons for endpoint black screen and display issues include software, hardware, and peripheral compatibility.
Insufficient available space in the root partition causes the system to fail to start correctly
1. Log in to the system via SSH, check the disk space usage, and view if the available space in the root partition is insufficient, as shown in the following figure.
Figure 110 Disk space usage
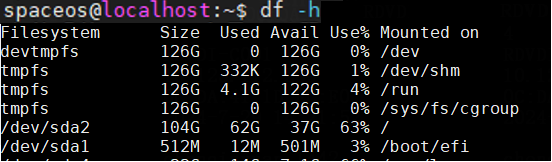
2. If the available space is insufficient, identify whether the user has imported any large files to frequently used directories, such as the desktop directory (/home/spaceos/Desktop/) and the download directory (/home/spaceos/Downloads).
3. Check the log storage directory (/var/log) for oversized log files. If there are any, export them, delete them, and restart the system. Provide the large logs to Technical Support for analysis.
The SpaceOS system login interface appears
Log in to the system via SSH and check for and resolve the following issues.
Insufficient available space in the root partition
Use the df -h command to check the available disk space and whether the root partition is full. If yes, see "Insufficient available space in the root partition causes the system to fail to start correctly" for the solution.
The Lightdm display service restarts
Use the cat /var/log/syslog | grep -I lightdm command to identify whether the system service lightdm has restarted. If the process ID of lightdm changes from 305 to 11854, the service has restarted.
Figure 111 Checking the system service startup status
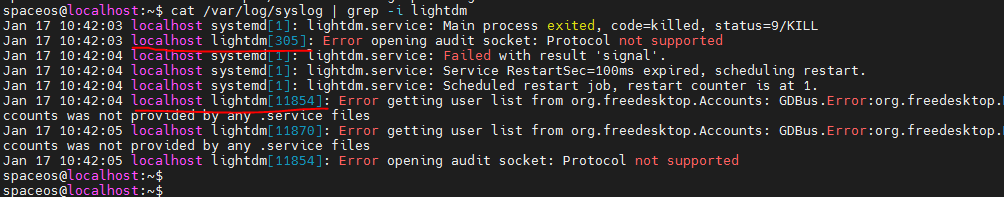
An OOM event causes the graphics service to fail to start correctly
View the /var/log/syslog file and search for any OOM-related logs. If found, check which process is consuming memory and report to Technical Support to troubleshoot memory leak issues.
VGA/HDMI cable contact issue
1. Log in to the system via SSH, and execute the following commands in sequence.
export DISPLAY=:0.0
xrandr
Figure 112 Executing commands

2. If the execution result shows that HDMI/VGA is in disconnected state, the system has not recognized the monitor correctly. Try again after replacing the connection cable.
Figure 113 Viewing the result
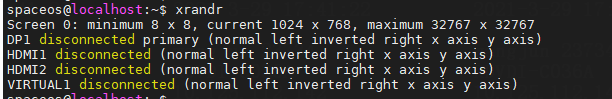
The screen resolution does not match the system default setting
1. Log in to the system via SSH, and execute the following commands in sequence.
export DISPLAY=:0.0
xrandr
Figure 114 Executing commands
2. Examine the resolution of the system, as shown in the following figure. The asterisk (*) represents the current resolution, and the plus sign (+) represents the optimal resolution. The xrandr command outputs the supported resolutions. Typically, the current resolution is the optimal resolution. If the screen resolution is different from the system default setting, modify the resolution from the client and restart the cloud desktop. If the modification is ineffective, contact Technical Support for assistance.
Figure 115 Viewing the resolution
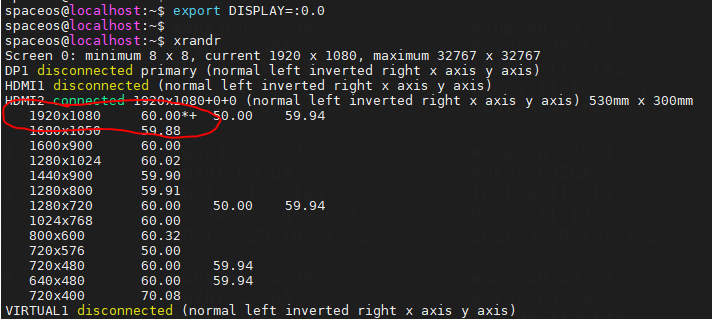
Troubleshooting peripheral issues
To troubleshoot peripheral issues, first identify whether the problem is on the VM side or the endpoint side.
The methods are as follows:
· If the VM is disconnected and a peripheral issue exists, the issue is on the endpoint side.
· If the VM is connected, disconnect it and return to the SpaceOS system of the endpoint. If the issue does not recur on the endpoint system, it is on the VM side.
Headphone issues
No sound during playing
Check the sound output channel using by the built-in pavcontrol software on the endpoint local system. Identify whether the sound is outputted through the headphone or HDMI. If there is an issue, switch the output channel and execute the following command to play the system built-in audio. If the headphone has sound, the problem is not on the endpoint side.
aplay /usr/share/sounds/alsa/Front_Right.wav
Abnormal recording
1. On the endpoint local system, use the built-in pavcontrol software to identify whether the sound input channel is correct. If there is an anomaly, switch the input channel and then execute the following command to record.
arecord ~/test.wav
2. Then enter the following command to play the audio file for testing.
aplay ~/test.wav
Keyboard and mouse
1. Identify whether the keyboard and mouse are powered correctly.
2. Disconnect the VM, return to the endpoint local system, replug the mouse, and identify whether the mouse recovers. If the issue persists, use another USB port.
3. If port replacement does not resolve the issue, contact Technical Support for troubleshooting.
Barcode scanner input devices
Input devices availability issues typically are as follows:
· The device driver is not supported, resulting in the functionality being unavailable.
· The Linux system has poor compatibility and occasional functional issues.
To resolve the issue:
1. Enter the endpoint SpaceOS system, and access System Tools > LX endpoint. Use a barcode scanner for scanning, and observe the output characters for issues such as missing characters.
2. If the characters cannot be outputted, switch to another USB port. If the issue persists, execute the following command and then replug the barcode scanner. Provide the output result to Technical Support for troubleshooting. If an x86 endpoint is available, perform the same operations and provide feedback to Technical Support.
tail –f /var/log/syslog
Storage peripherals (such as USB flash drives)
Perform the following checks on the endpoint local SpaceOS system:
1. After a USB flash drive is installed, check for a shortcut on the desktop.
2. Enter the mount command in the command line to identify whether the mounting is successful.
Figure 116 Checking the mounting status
![]()
3. If the USB flash drive mounting fails, check for poor contact issues. Verify on other endpoints if the issue exists. Identify whether the issue is limited to a specific port.
Network issues
Common network issues are as follows:
· Static IP configuration does not take effect.
· The endpoint is unable to dynamically obtain an IP address.
· The network connection of the endpoint suddenly disconnects and cannot be restored during a period of time.
· The endpoint experiences severe packet loss.
The following are troubleshooting methods for these issues.
The static IP configuring on the C113 endpoint is not effective (DHCP is not enabled on the server side)
1. Identify whether the MAC address changes every time the system starts up. This issue occurs randomly on the C113 endpoint. Execute the following command to view the MAC address.
ip address
Figure 117 Viewing the MAC address
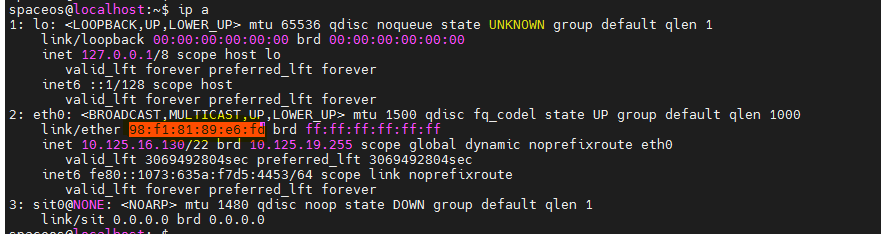
2. If the MAC address changes, reflash the MAC address for the C113 endpoint. For the operation procedure and tool, access Zhiliao Community.
An endpoint cannot obtain either a static or dynamic IP address after startup
3. Enter the following command to identify whether the NetworkingEnabled field is false in the NetworkManager.state file on the endpoint. If it is false, network connection is disabled.
spaceos@localhost:~$ cat /var/lib/NetworkManager/NetworkManager.state
\\View the NetworkingEnabled field.
[main]
NetworkingEnabled=false
WirelessEnabled=true
WWANEnabled=true
4. Check the network management interface on the endpoint system to see if the network connection feature has been disabled. The following figure shows that network connection is disabled. Enable the network connection feature.
Figure 118 Enabling network connection
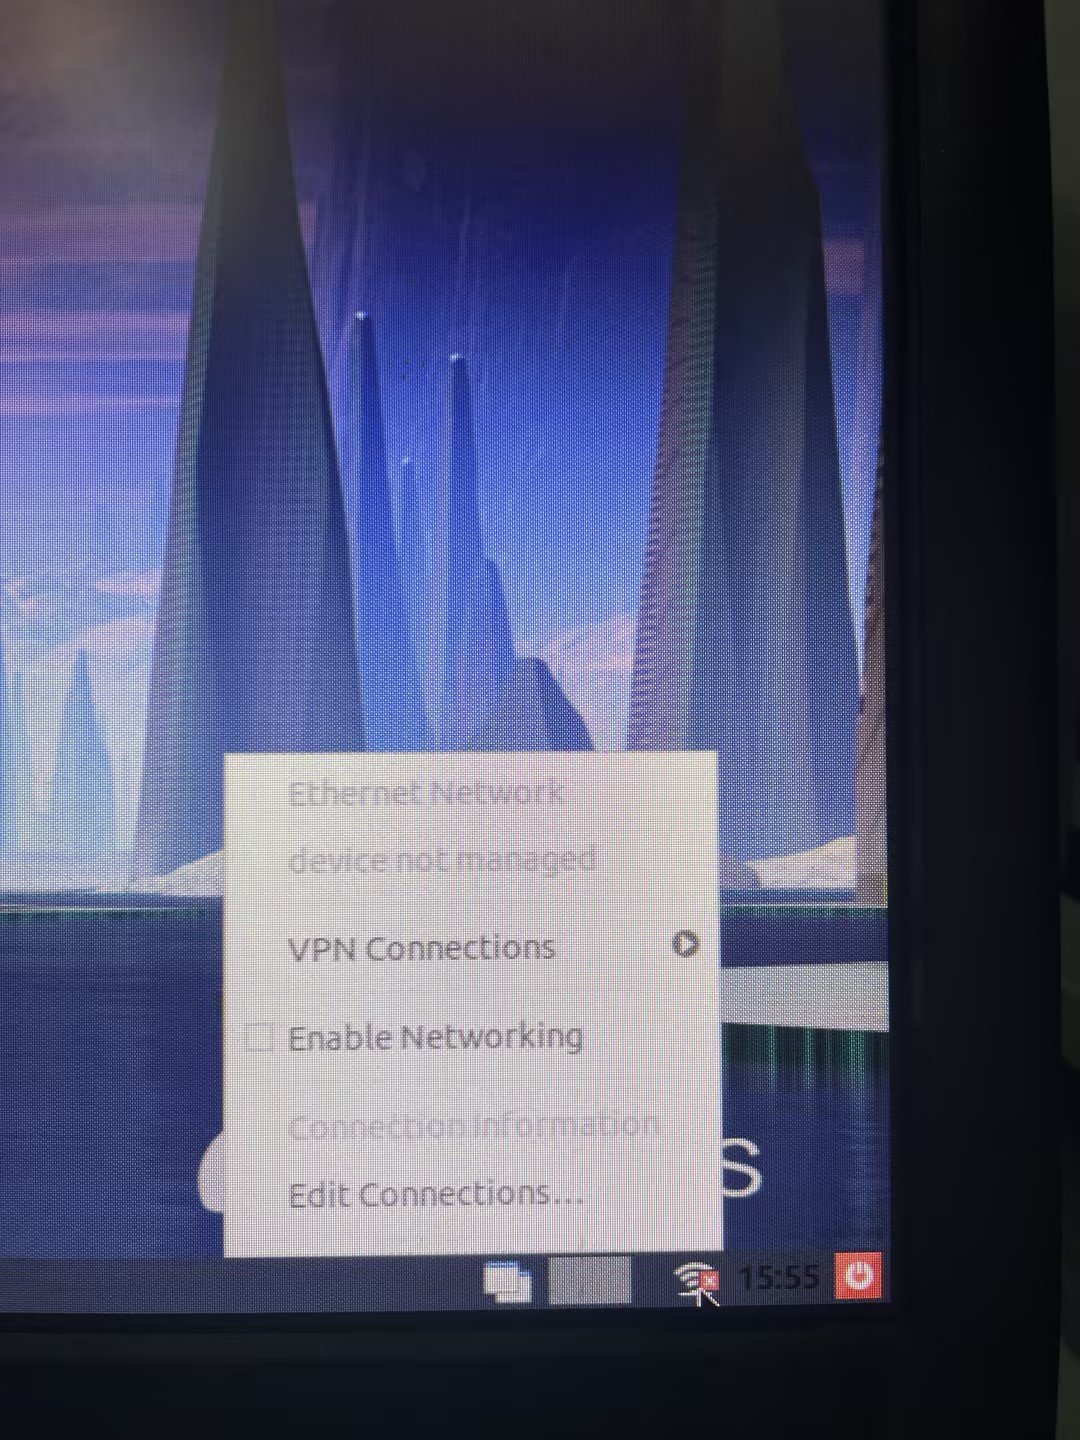
An endpoint cannot obtain a dynamic IP address after startup
1. Check the network management interface on the endpoint system to see if the network connection feature has been disabled. If network connection is not disabled, troubleshoot the issue on the DHCP server side. For example, identify whether the lease is too long, the address pool is full, or there are no available IP addresses to allocate.
2. If no abnormalities are found on the DHCP server side, contact Technical Support.
An endpoint encountered an error during initial connection to cloud desktops
Identify whether the endpoint has failed to obtain an IP address in a timely manner during startup due to prolonged DHCP server allocation time. Examine the dhclient log in the /var/log/syslog directory. The time range is from when Dhclient initiates the DHCPDISCOVER packet to when it receives the DHCPACK packet. Alternatively, use a packet capture tool to observe the negotiation process between Dhclient and the DHCP server.
Figure 119 Viewing the dhclient log
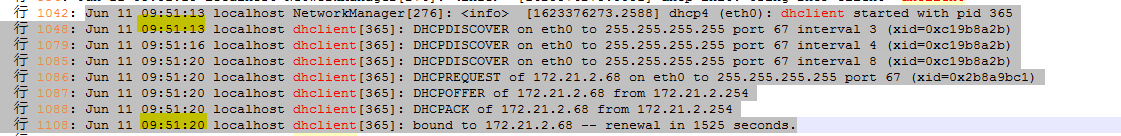
Solution: Enable edge ports on the switch or configure a static IP address.
An endpoint occasionally disconnects the Workspace client and the network must be reconnected to resolve the issue
Verify that the network connection is stable, and then check for endpoint time changes by examining the /var/log/syslog file. Endpoint time changes cause DHCP lease renewal requests not being sent in a timely manner and the IP address being reclaimed.
Solution: Modify the time of the endpoint, modify the lease renewal time, or configure a static IP address. Select a method based on your environment.
Intermittent packet loss occurs on an endpoint
Use the ping command to check the network condition. Execute the cat /proc/net/dev command on the endpoint to view the incoming and outgoing packet statistics on the network interface, analyze the statistics, and (such as netstat), and perform dynamic observation. Packet loss exists, provide endpoint logs to Technical Support for troubleshooting.
Persistent packet loss or network disconnection on an endpoint
Use the ping command to check the network condition, and view latency and packet loss rate. Alternatively, use the iperf tool to test the bandwidth, packet loss rate, and latency.
SpaceOS (VOI)
This section introduces the troubleshooting and handling methods for the SpaceOS VOI system.
Pre-check items
1. Check for any issues after updating hardware, environment, or configuration.
2. Confirm whether the issue is on the management side or the client side.
3. Identify whether the problem recurs regularly, and timely record the triggering operations and symptom for recurrence.
4. Obtain system version information and collect system endpoint logs in a timely manner.
Table 7 Common maintenance commands
|
Common maintenance commands |
Remarks |
|
|
View the SpaceOS system version. |
cat /etc/spaceos-version |
N/A |
|
View disk information. |
lsblk |
View system partition types and mounting status. |
|
View the endpoint model. |
dmidecode -s system-product-name |
N/A |
|
Check the disk space usage. |
df -h |
N/A |
|
View the file system type of the system disk. |
blkid |
Identify whether a partition has been modified. |
Troubleshooting
The VOI system consists of the VOI management system and VOI user system.
· VOI management system: After power-on, the SpaceOS system starts up. The management system connects to the management platform, providing functions such as user system management and download, as well as user login.
· VOI user system: A system whose startup is controlled by the management system. Typically, the VOI user system is a Windows system, the target system used by users. The system interface is consistent with the Windows system used by uses and does not involve virtualization.
Typically, VOI does not has peripheral issues. The performance of the peripherals is consistent with that of a regular Windows PC. Common issues related to VOI are screen flickering, black screen, incorrect resolution, user system startup failure, and image download failure. Data loss issues might occur as user data is stored locally on the endpoint.
First, check for external causes, such as replacement of a new monitor, VGA/HDMI cable, power compatibility, changes in network deployment, and any abnormal power outages.
Screen display issues
The cause of endpoint black screen and display issues involves software, hardware, and peripheral compatibility.
The VOI management system suddenly has a black screen or distorted screen
1. Identify whether the monitor, VGA, or HDMI hardware is replaced. If yes, use the original device and verify that the issue is resolved.
2. If SSH connection is available, obtain logs as described in "Managing logs." If SSH connection is unavailable, check for VOI system crashes for response failure to keyboard operations.
The VOI user system suddenly has a black screen or distorted screen
If no device is replaced, a Windows system driver or hardware issue unrelated to the VOI system might occur.
Some models have abnormal resolution after operating system installation
Identify whether the system is in UEFI mode. In UEFI mode, some models might have abnormal resolutions. Use one of the following methods for troubleshooting. The first method is recommended.
1. Enter the following command. If the disk type is GPT, the system is in UEFI mode. If the disk type is dos, the system is in legacy mode.
sudo fdisk -l /dev/sda (disk node)
Figure 120 Viewing the disk type-1
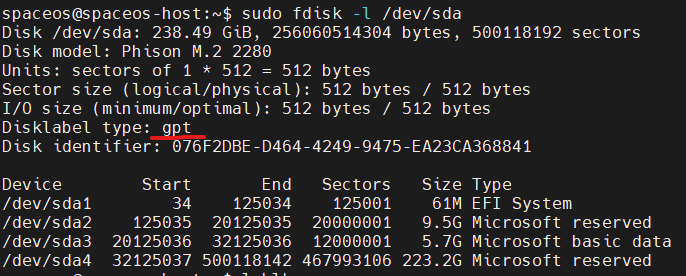
2. Enter the following command to identify whether a /boot/efi partition exists. If yes, the system is in UEFI mode. If not, the system is in legacy mode.
sudo lsblk
Figure 121 Viewing the disk type-2
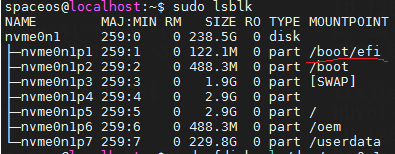
Monitor hot-plug issues
Because VOI does not have xorg-related functionality, hot-plug issues exist in versions prior to E1009. E1009 and subsequent versions have added support for hot-plug.
System startup issues
The system starts with a black screen in the BIOS stage
A BIOS black screen occurs during startup, and the system freezes after the manufacturer logo appears. Identify whether the power supply is compatible and the system restarts after abnormal power. Otherwise, system hardware or BIOS issues exist.
BIOS startup fails and a boot disk is not found
This issue is typically caused by a problem with the disk, resulting in the inability to identify the boot disk. The problem is actually caused by a sudden power failure and needs to be resolved by the hardware vendor.
The system enters recovery mode upon startup
The following figure shows this issue on the C5320V endpoint. After the VOI system starts, it occasionally enters the BIOS recovery mode. Typically, operations such as installing the operating system and configuring the system does not trigger this issue. This issue is caused by abnormal power failure of the endpoint and needs to be resolved by the hardware vendor.
Figure 122 Recovery mode
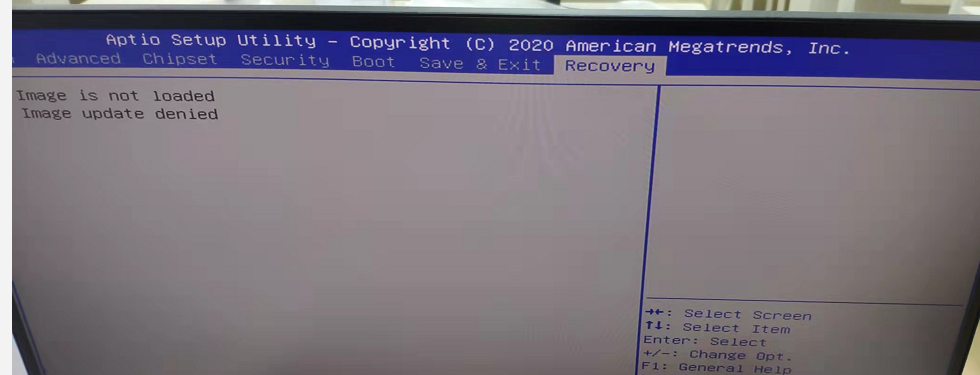
User data loss
Because the SpaceOS system provides functions such as system partition adjustment and partition hiding, user data might be lost during system upgrade or partition resizing from the management platform.
|
|
IMPORTANT: For the above operations, first perform them on selected VMs to verify that the operations do not lead to unexpected issues. If any issues occur, perform as few operations as possible and protect the environment for analysis by Technical Support. |
VOI/IDV/UCC
Overview
VOI
Virtual OS Infrastructure (VOI) is an essential component of Workspace, fulfilling requirements in specialized fields such as education and healthcare. VOI is a technology that does not rely on virtualization to achieve 100% utilization of computing resources on the user endpoint (IDV only achieves 80% to 90%). The user operating system of VOI is downloaded from the management platform to the user endpoint. The user system is processed by functions such as authentication and resource query by the management system, and booted into the system startup module to load the image file. Local system operations of VOI are similar to a PC.
Software technical architecture
The VOI architecture consists of two or more systems, one management system (SpaceOS) and multiple user systems (guest OSs). The management system is responsible for user authentication and data exchange with remote platforms (mainly management data). The user system provides the endpoint user environment and is typically a Windows 7 or Windows 10 system. These two systems are collocated on the same endpoint hardware environment. The two systems are isolated without communication between them. At any given point in time, only one system is in active state. Each time the endpoint starts, it will first enter the management system, and then use internal programs to boot into the user system.
To ensure that some important data can be transmitted to the user system, a swap disk is used in the VOI architecture. The swap disk provides the following functions:
· Transfers important data unidirectionally from the management system to the user system for purposes such as single sign-on, cloud disk self-login, and retention of authorization policies.
· Stores user data, often referred to as the D drive. The swap disk is now extensible with a default size of 6 GB. Users can expand the size of the swap disk as needed.
Figure 123 VOI architecture
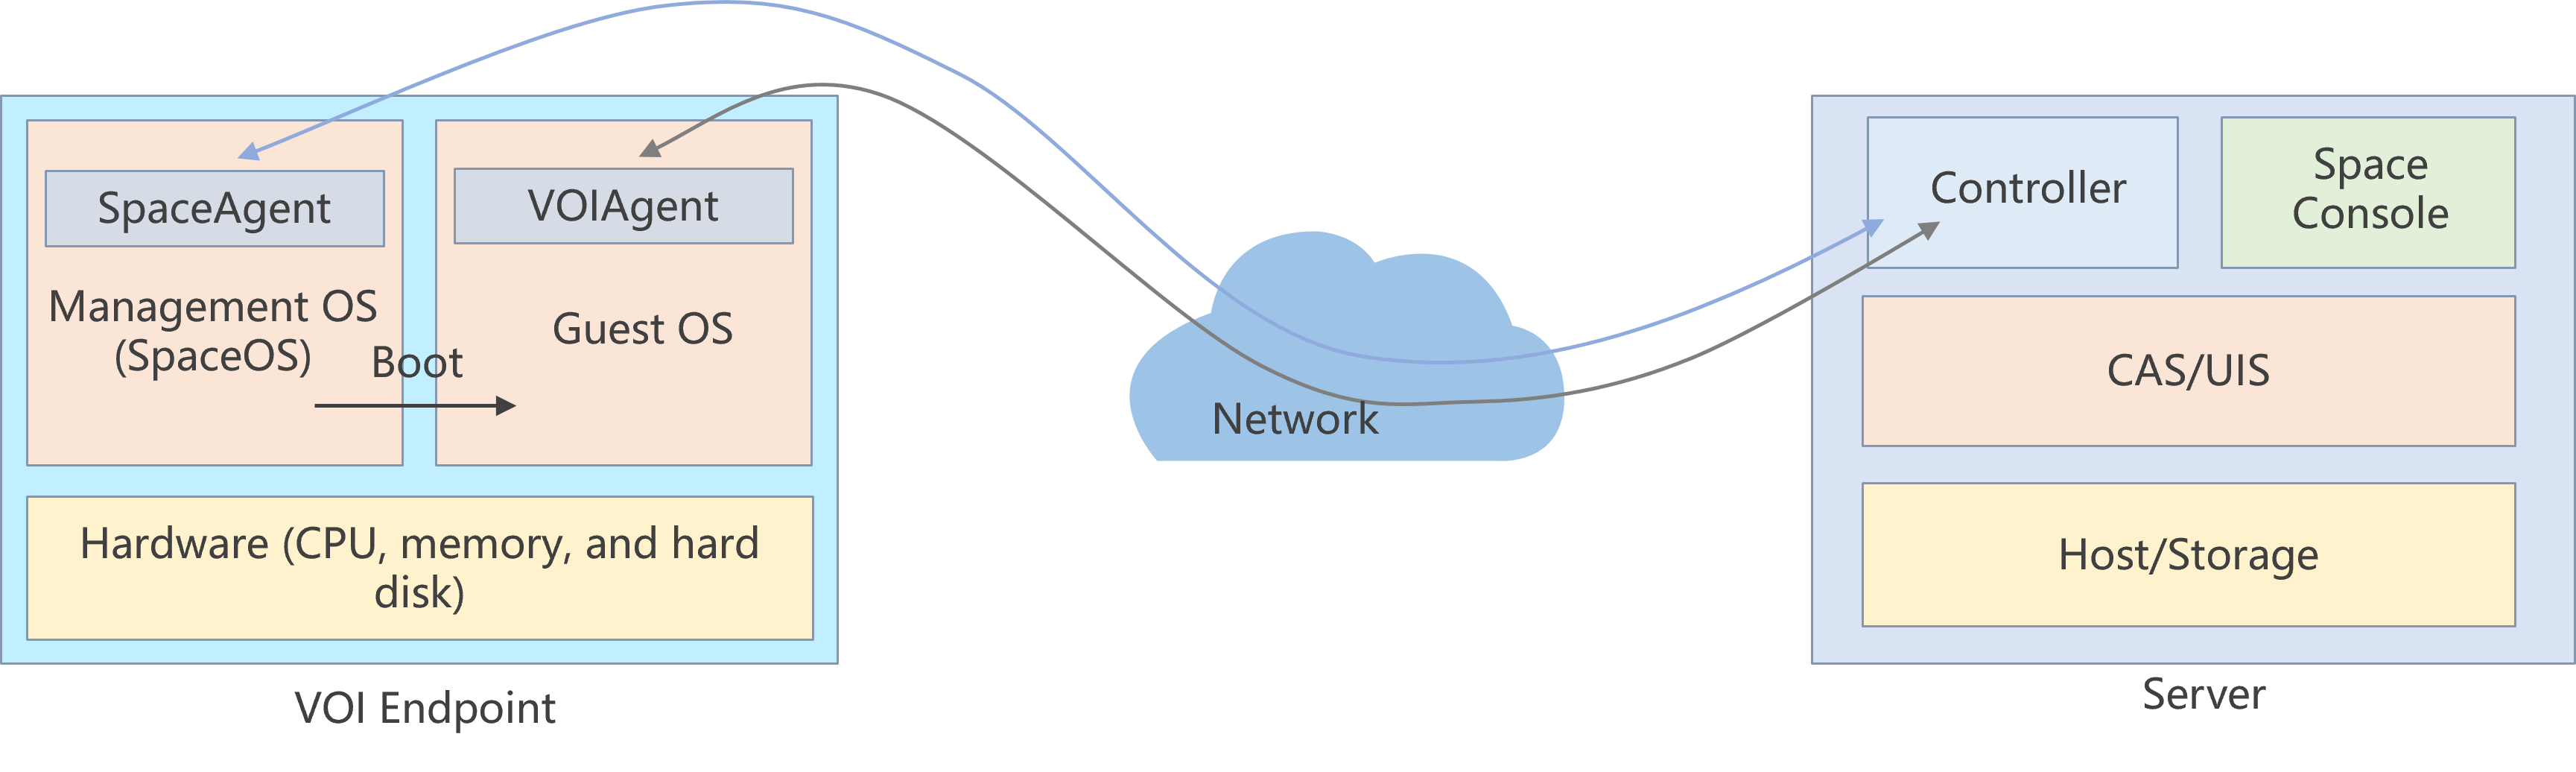
Due to the lack of a virtualization layer in its underlying infrastructure (which can isolate local hardware resources from OS resources), the ability of the user system to operate is influenced by the following factors:
· The endpoint hardware can run this operating system alone. To verify this factor, install a clean OS on the same hardware.
· VOI uses Microsoft's VHD files. For Windows 10, all versions can use VHD disk files. For Windows 7, only Ultimate and Enterprise editions can use VHD disk files.
Software startup sequence
In VOI, the software startup sequence for a power button-triggered startup, system-initiated restart, or network wake-up through WOL is as follows: The management system starts for access control, and then the user system loads. The startup sequence is shown in the following figure.
Figure 124 VOI software startup sequence

Storage usage
The disk usage guideline for a VOI endpoint is shown as follows: The total disk size = operating system size (approximately 10 GB) + data disk size + image VHD file size + system disk size + remaining space. The system disk size and data disk size are configurable. The remaining space is flexible for use. When the VOI endpoint is running the client operating system, the endpoint loads the image VHD file to the system disk. In this case, the system disk size = client image VHD file size + remaining system disk size. The following figure shows the disk usage for the C206V endpoint. The default data disk size, system disk size, and guest VM's image VHD file size for the endpoint are 2 GB, 120 GB, and 15 GB, respectively.
Figure 125 Storage usage
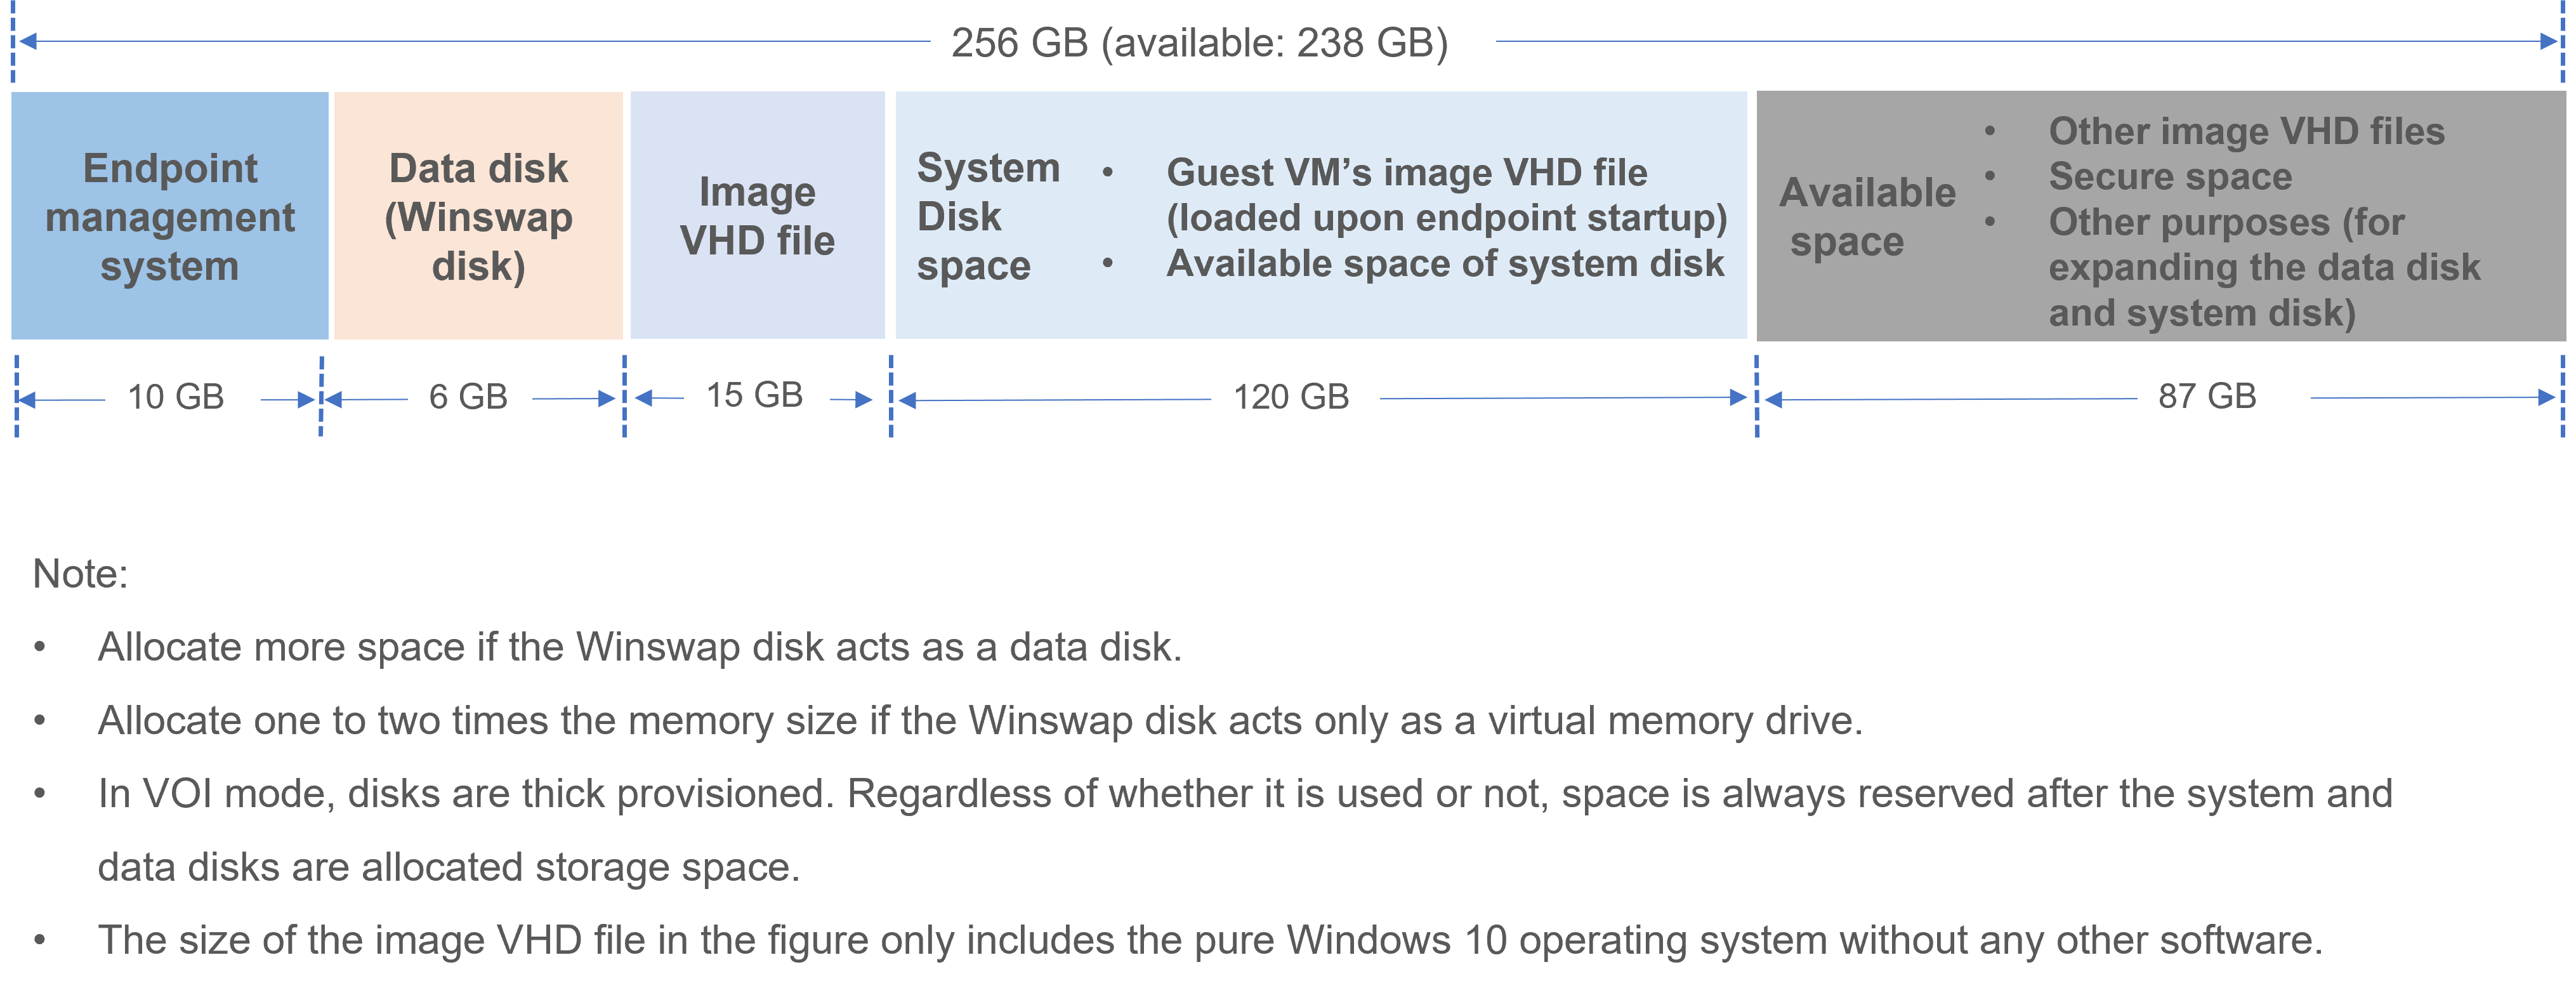
IDV
Intelligent Desktop Virtualization (IDV) runs a single VDI desktop on a local endpoint.
Software technical architecture
The IDV software has a virtualization layer that isolates the correspondence between underlying hardware and the operating system. It enhances the adaptability of the operating system. However, due to the addition of virtualization layer, the IDV adaptability in peripheral use is not as good as VOI. In the VOI system, isolation is achieved between the management system and the user system. In IDV, the management system and the user system are theoretically capable of communicating with each other.
Figure 126 IDV architecture
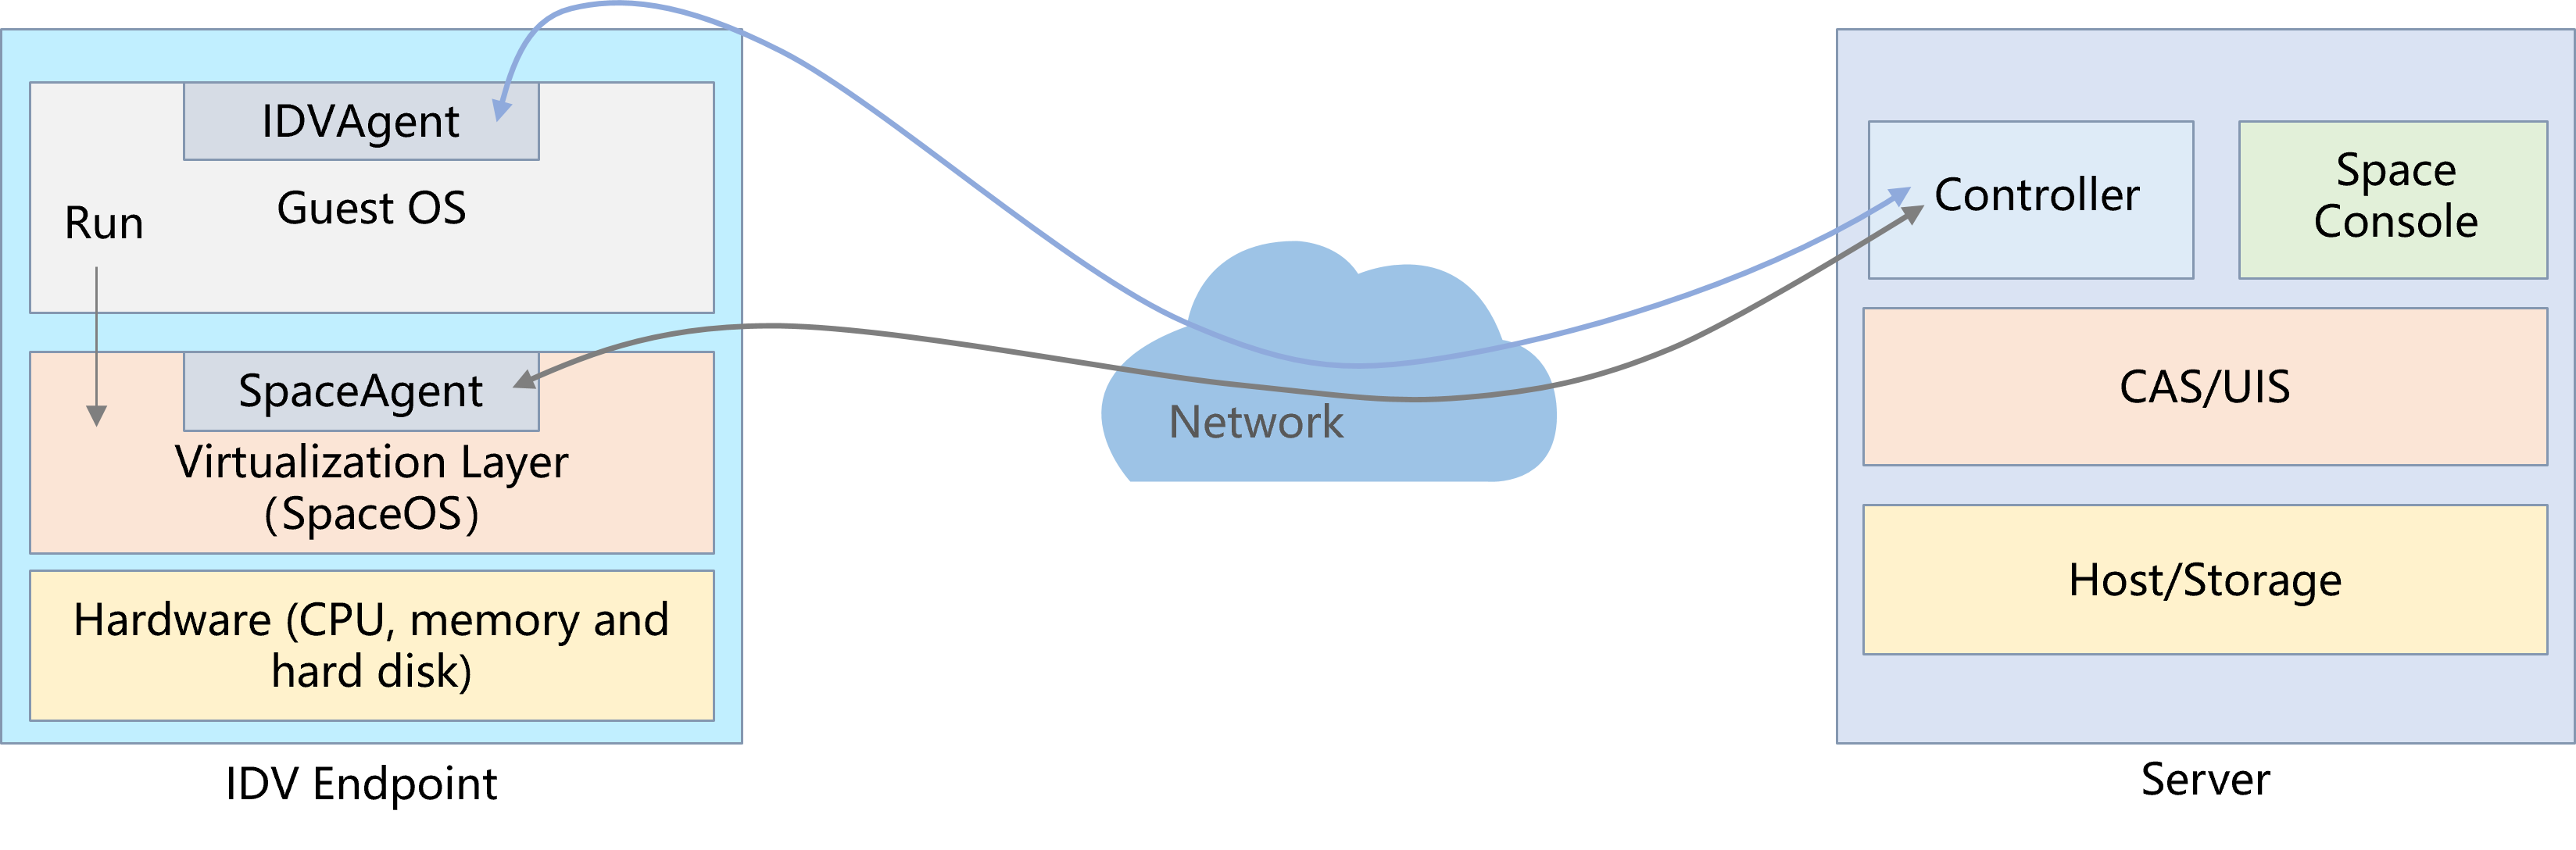
Software startup sequence
The IDV system startup sequence is similar to the VOI startup sequence, except that the management system and user system can coexist.
Figure 127 IDV software startup sequence
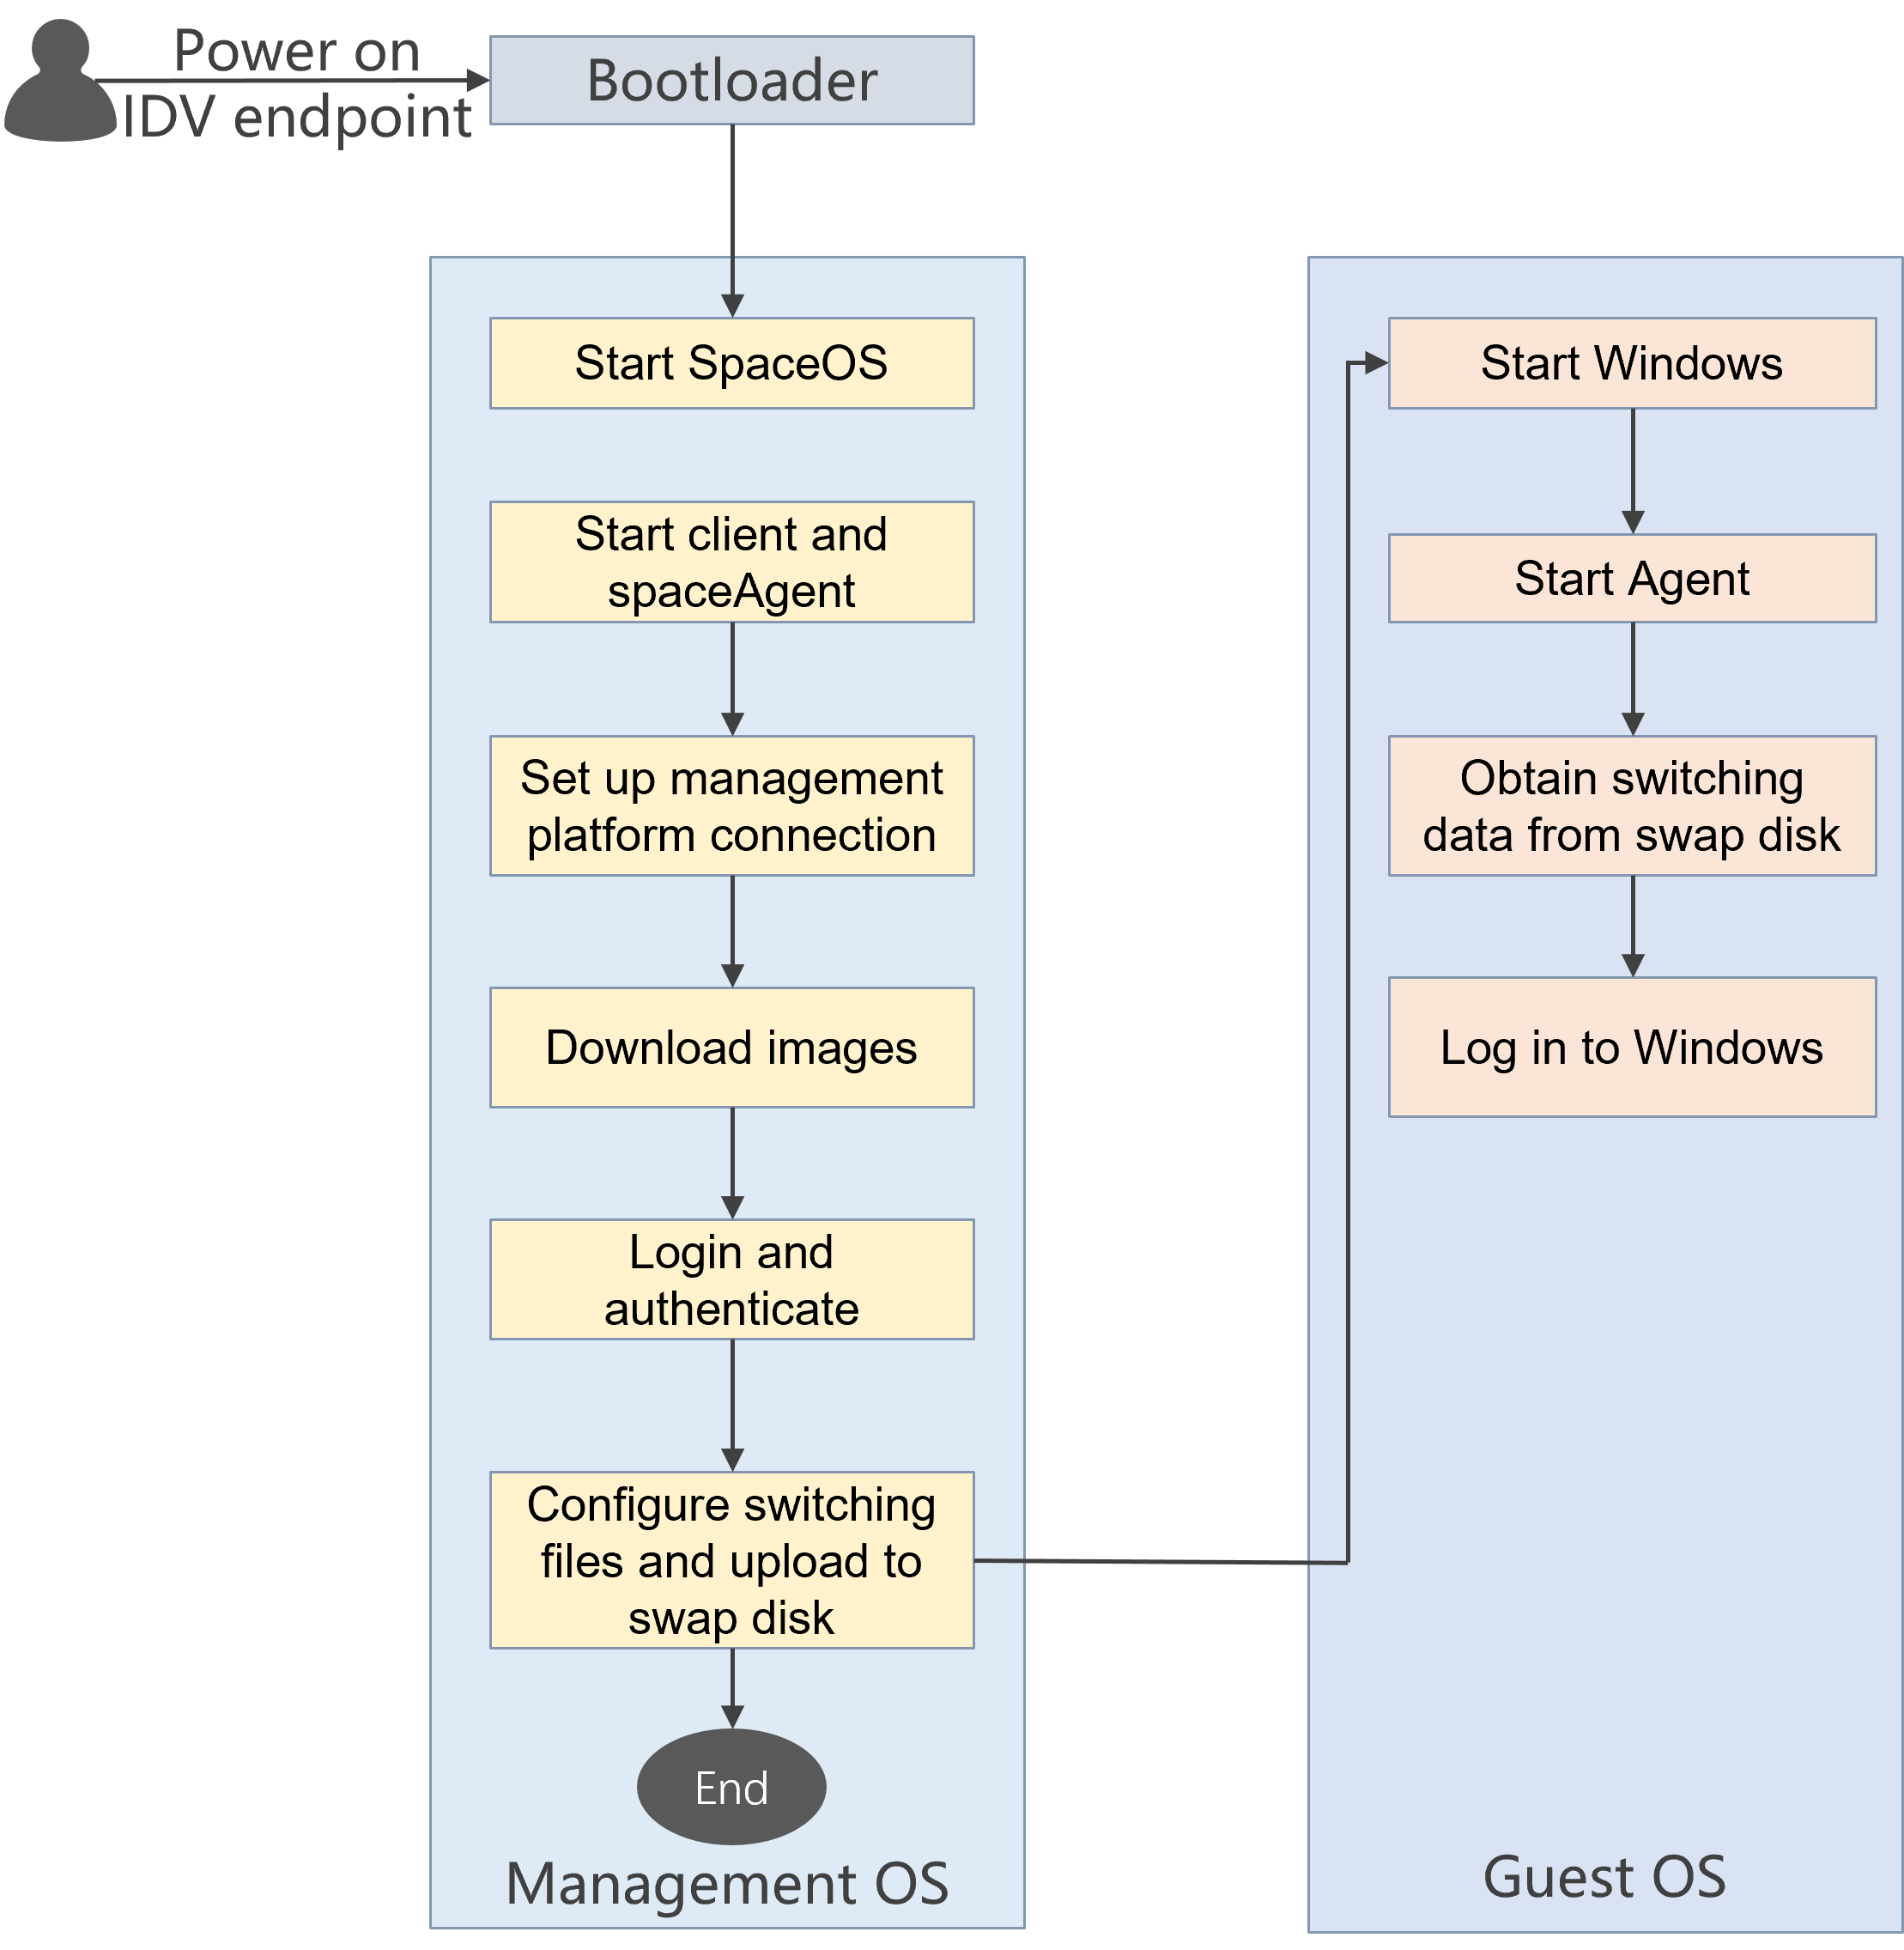
UCC
UCC is a complete solution. UCC incorporates IDV, VOI, and TCI technologies. UCC breaks the constraint that IDV endpoints only support IDV and VOI endpoints only support VOI. The startup method (TCI\VOI\IDV) of an UCC endpoint is determined based on the type of the image or desktop pool.
TCI is a solution provided by Intel, similar to VOI. The main difference between TCI and VOI is as follows:
· H3C VOI operates based on VHD disk files, which differ from regular disk files. TCI uses a disk file based on QCOW2.
· H3C VOI is theoretically compatible with Intel, AMD, or other X86 CPUs, while TCI is only compatible with Intel CPUs.
· For operating system compatibility, H3C VOI supports the Windows 7 Ultimate or Enterprise edition. TCI supports the same versions as the hardware supports.
· In terms of disk file read and write capabilities, QCOW2 has higher efficiency and supports more features.
Troubleshooting flow
Troubleshoot from the management platform to the client.
Figure 128 Troubleshooting flow

1. Clean the cache on the management platform or use the browser's incognito mode.
2. Press F12, perform the operations that trigger the issue, check the backend status code, and troubleshoot the issue.
¡ 200: Normal get/post request. Pay attention to API return information.
¡ 401: No authorization. The token is expired or not passed.
¡ 403: The server has received the request but refuses to respond.
¡ 404: Not forbidden. The front-end and back-end development need to negotiate URL inconsistency.
¡ 502: Backend exception. Check backend service status and logs to locate error message.
3. According to the returned interface, search for the corresponding log.
¡ If the interface request URL is ip:8083/vdi, check the workspace.log file (/var/log/vdi/workspace-server/workspace.log).
¡ If the interface request URL is ip:8083/cas, check the cas.log file (/var/log/tomcat8/cas.log).
¡ If the interface request URL is ip:8083/uis, check the uis.log file (/var/log/uis-core/uis.log).
4. For endpoint issues, first identify whether the management platform sends gRPC messages to the client. View the controller.log file (/var/log/vdi/controller/controller.log) that records the communication services for the platform, clients, CAS, and UIS.
5. For client issues, first identify whether the management platform sends gRPC messages to the client. Check the grpc-client.log file. Then identify whether the client receives the commands from the management platform. Depending on the client type, check the corresponding logs in different directories.
6. For Agent issues, check the grpc.log file.
VOI/IDV service passwords
Table 8 VOI/IDV service passwords
|
Service |
Default password |
Remarks |
|
Management system—Return to the local system |
Versions later than E1007L01: Password@1234 The password can be modified on the advanced settings page of the Space Console |
Super administrator password. You can return to the endpoint system by pressing Ctrl + Alt + T. To switch to the client interface, execute the systemctl start idvclient command. |
|
Management system—Image management |
Versions prior to E1007L01: Workspace@1234 E1007L01 and later versions: account admin, password Cloud@1234. |
Authentication password for creating level-2 images. After the endpoint starts, use the following methods to enter the image creation process: For Learningspace, press Ctrl + Alt + M. For Workspace, press Esc. |
|
Management system—Restore factory defaults |
Offline: workspace.com Online: For versions prior to E1007L01, Workspace@1234 For E1007L01 and later versions, Password@1234 |
The online password can be modified on System > Advanced Settings > System Parameters > Cloud Desktop Parameters > Endpoint Management Password. |
|
Management system—spaceos account |
User@1234 |
N/A |
|
Management system—root account |
User@1234 |
SSH connection is not allowed. You can switch to the root user from the spaceos user. |
|
User system—Agent |
Agent@1234 |
E1007L01 and later. |
|
User system—Return to the local system from the student client |
Offline: workspace.com Online: For versions prior to E1007L01, Workspace@1234 For E1007L01 and later versions, Password@1234 |
Select the VOI type when installing the student client for VOI. |
|
VOI endpoint BIOS |
1qaz@WSX |
Applicable to the C200V, C201V, C106V-C108V, and C206V-C208V endpoints. |
Pre-check items
1. Verify that the versions of the management system client, user system client, and management platform match.
2. Verify that all components are installed correctly and the installation type is correct.
3. Identify whether the voiclient.log file contains any noticeable errors related to the business.
4. If the issue recur regularly, log in to the endpoint backend via SSH and modify the LOG field to 5 in the /voisys/etc/voiclient/setting.ini file.
5. Restart the endpoint, trigger the issue, and then collect the logs.
Table 9 Common maintenance commands for the management system
|
Common maintenance commands for the management system |
Remarks |
|
|
View the management system client version. |
cat /etc/idvclient-version |
|
|
View the SpaceOS version. |
cat /etc/spaceos-version |
|
|
View disks. |
lsblk |
|
|
View the endpoint model. |
dmidecode—type system |grep Product dmidecode | grep Product |
Typically used in specific legacy scenarios. |
|
View configuration information. |
cat /proc/cmdline |
View the IP address and image information of the management platform. |
|
Enter the local image file directory. |
cd /vms/idv/data |
View image files and differential image files. |
|
Identify whether SpaceOS is the UCC version. |
ls –l /etc/os-type |
The OS-type file indicates that the version is UCC. If the file does not exist, the version is VOI1.0. |
|
Identify whether the endpoint type is VOI or TCI. |
cat /etc/os-type VOI: VOI 0001000000000000 VOI_2.0 TCI: VOI 0000000000010000 VOI_2.0 |
Start the VHD format image in VOI mode. Start the QCOW2 format image in TCI mode. |
|
Enter the client log directory. |
VOI1.0: cd /voisys/var/log/voiclient/ UCC: cd /var/log/voi/ |
|
|
Enter the spaceagent log directory. |
VOI1.0: cd /home/spaceos/SpaceAgent/log/ UCC: cd /usr/local/spaceagent/ |
|
|
View the local configuration file. |
VOI: cat /voisys/etc/voiclient/settings.ini UCC: cat /mnt/rsvd/voi/etc/settings.ini |
|
Management platform issues
During VOI desktop image creation, the cloned desktop image cannot be selected in the newly created VOI desktop pool after the image cloning is displayed as completed on the upper right corner of the task panel
In versions prior to E1009, after the completion of image cloning, wait for the subsequent image file processing (converting QCOW2 format to VHD format and performing BT seeding) to be completed before it can be used. You can enter the /var/lib/vdi/Bittorrent directory on the management node backend and use the ./bttorrent.sh status command to identify whether the BT download process for this desktop image already exists to determine that the desktop image has been fully created.
The remaining space of the image pool is larger than the image file during VOI desktop image cloning, and the cloning still fails
During the creation of a VOI desktop image, several intermediate files will be generated. Before cloning, ensure that the remaining space in the image pool is at least three times the size of the image file.
The remote connection prompt Query remote connection information abnormal is displayed for a certain VOI endpoint in a desktop pool
Identify whether the corresponding endpoint has been powered on and entered the operating system.
The remote connection to a VOI endpoint in a desktop pool can be set up but VNC access fails
Check the network rules of the authorization policy to confirm if the IP address of the current endpoint has been added on the firewall.
Agent is correctly configured and the management platform authentication server is also correctly configured, but VMs fail to join domains
1. Log in to the management platform, navigate to the Desktops > Desktop Pools page, select the desktop pool where the endpoint is located, and check the authorization policy for the corresponding endpoint in the VOI client list.
2. Navigate to the Data Center > Policies > Authorization Policies page to find the corresponding authorization policy for the endpoint.
3. Identify whether network rules denied the IP addresses in the related domain. If yes, permit the IP addresses. Assign VMs to domains.
A user or endpoint is added to the denylist during the VOI client operating system startup process, but the user can still log in and is not immediately disconnected
Because the VOI client system startup phase is a transient state, the Agent component is not yet running, and the platform and the endpoint cannot communicate temporarily. When the platform and Agent establish communication, the user will be logged off.
A image or endpoint cannot be selected in a newly created VOI desktop pool
Identify whether the desktop image flavor and endpoint flavor in this desktop pool are completely consistent.
VOI requires driver installation every time the Windows 7 user system in restoration mode is logged in
To resolve this issue, create a level-2 image to complete the driver installation. See H3C Workspace Cloud Desktop Quick Start (Education Scenario) and H3C Workspace Cloud Desktop Quick Deployment Guide (Office Scenario) for level-2 image creation methods.
After creation and optimization of a VOI image on the management platform, single sign-on fails
For image creation on the management platform, manual login is required due to the absence of the endpoint nextcloud file, which causes the single sign-on to fail. This issue does not occur during VOI endpoint login.
Can VOI adds the drive letter D or modify the drive letter for VOI-SWAP
During the installation of the operating system, partitioning can be performed to meet the requirements.
Policies issued for VOI by the management platform do not take effect
1. Identify whether the IP address of the Agent configuration is correct. Navigate to the default installation path of the Agent (64-bit system: C:\Program Files (x86)\H3C\VdiAgent\conf), open the grpc_config.cfg file with a tool like Notepad, and verify correctness of the GrpcAddress parameter configuration. The parameter must be consistent with the management platform IP address. If it is incorrect, find the vdservice service in Task Manager > Services and stop it. Modify the GrpcAddress parameter to the correct management platform IP address and save it. Then, start the vdservice service in Task Manager > Services.
2. Test the network connection between the user system and the management platform. Open the Windows Start menu, enter cmd in the application search box, and press Enter to open the DOS command console. Enter the following command ping {management platform IP}. In the reverse direction, use SSH connect to the management platform server and enter the following command ping {VM IP}. The following figure shows correct communication.
Figure 129 Correct communication
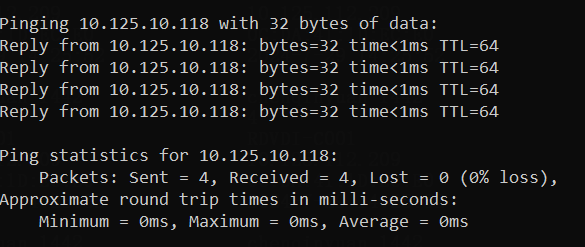
Endpoint issues
VOI initialization fails, and the endpoint fails to connect to the management platform within 30 seconds
1. Identify whether the network cables are functioning correctly and ensure that the management platform IP address is correct.
2. Identify whether the access switch is configured with edge ports (required).
3. Verify that the management platform Controller and other components are functioning correctly. You can use SSH to connect to the management platform backend and run the /opt/vdi_check.sh script.
4. The endpoint management system version is consistent with the management platform version.
Some UCC-IDV endpoints fail to start the image and reports No such file or directory
1. Use SSH to connect to the endpoint backend, and execute the following command to check for a similar error in the idvdaemon.log file:
cat /var/log/idvdaemon/idvdaemon.log //Execute the command
“No such file or directory: /sys/bus/pci/devices/0000:00:02.0/iommu_group/devices // Check for an error message.
2. Enter the following command to access the file path in the previous error message and check for the iommu_group folder in its directory:
cd /sys/bus/pci/devices/0000:00:02.0 //Identify whether the directory contains the iommu_group folder
3. If the iommu_group" folder does not exist, VT-d and IOMMU support in BIOS are not enabled. Execute the following command to verify that VT-x is enabled.
cat /proc/cpuinfo | grep -i vmx // If the command result is empty, VT-x is not enabled.
|
|
NOTE: For certain BIOS, the IOMMU configuration is enabled by default after VT-d is enabled. |
4. After restarting the endpoint, press F2 to enter BIOS. On the ADVANCED tab of the BIOS interface, click the CPU tab and enable Intel Virtualization Technology (VT-x), then enable the VT-d option on the North Bridge tab. Some BIOS models might have it on the Advanced System Agent tab. Save the configuration and restart the endpoint.
The management platform address set in GTK-Spaceagent for initial use of VOI does not take effect on the management system, and the static IP address does not take effect on the user system
GTK is a new component that is used to deploy a VOI endpoint after startup. The network configuration of GTK before E1013 only takes effect during the use of this component and cannot be synchronized to the management system or user system. The management platform address needs to be reconfigured on the management system. E1013 and later versions have been optimized to synchronize the GTK configuration platform address and static network to the management system and user system. This issue still exists in versions prior to E1013.
Solution: Reconfigure the management platform address on the management system. For static IP address configuration, access the network configuration of the management system and repeatedly switch between the static and dynamic IP options, and eventually switch to the static IP option to configure the static IP address. This issue has been fixed in version E1013.
After the IDV system is installed, the endpoint fails to obtain an IP address correctly and initialization fails
Analysis: After the system is installed, the user manually shut down the system before the OVS component finished initialization.
Solution: After reinstall the system, wait for endpoint initialization to complete and the endpoint to shut down.
A VOI endpoint fails to download an image file
|
|
IMPORTANT: After course release in the education scenario, wait for at least 3 minutes before downloading an image file. |
1. Troubleshoot network issues.
a. Verify that network connectivity exist between the endpoint and management platform.
b. Identify whether the endpoint IP address has changed in the /var/log/syslog file.
c. Execute the /bttorrent.sh status command in the /var/lib/vdi/Bittorrent path on the endpoint to verify that the BT service is running correctly.
2. Verify that the seed file is correct.
a. Open the seed file (/vms/idv/iso) and identify whether the content meets the expected requirements.
b. Verify that the management platform IP address in the seed file can be pinged from the endpoint.
c. Use software such as uTorrent or Xunlei to verify that the seed file can be downloaded on a PC on the same subnet.
3. Perform the following tasks:
a. For an endpoint issue, check the VOI endpoint log at /voisys/var/log/voiclient/* and the UCC endpoint log at /var/log/voi/voiclient.*.log for any obvious errors.
b. For a management platform issue, execute the sftp -oPort=22222 idv@platform IP command on the endpoint, enter the password (obtained from Technical Support), and execute the following command to upload the test text (just_test.sh in the following figure) via SFTP to the idv_image directory for testing the upload channel.
Put /voitools/do-monitor-hotplug.sh /idv_image/just_test.sh
Figure 130 Platform-side troubleshooting

A VOI endpoint fails to download a file during image download
If the voiclient log shows HTTPS link download failure, the reason is that gateway is enabled during the management platform registration without any gateway in the environment. VOI can only use HTTPS to download images when accessing servers via a gateway.
Figure 131 Image download via HTTPS fails
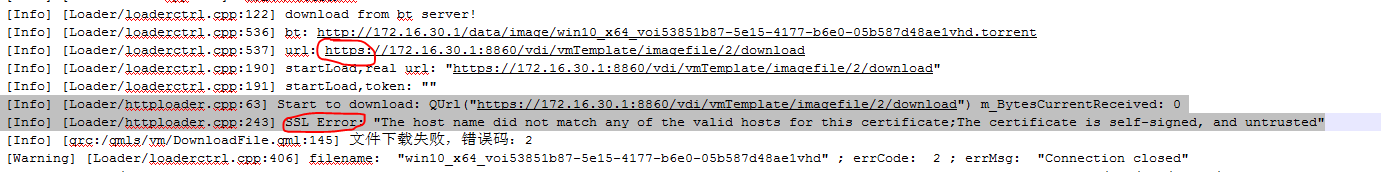
Image download via HTTPS fails on a VOI endpoint because VM image file verification fails
Cause: Download is forbidden by a gateway.
Solution: Execute the gateway proxy -i enable command on the gateway VM to permit image download, restart the gateway VM, and download the image again.
The client fails to download an image
1. If the client is offline, check the network connection.
2. If the platform image source file is missing, check the image cache directory from the management platform backend for the source file.
Client creation fails
The endpoint is running out of disk space or cannot find the parent image for the level-2 image. Check the client logs for any obvious error messages.
The VOI client reports insufficient space
Symptom: The endpoint reports insufficient space when downloading an image.
Analysis: The total size of the system disk, level-1 image, and level-2 image in the endpoint flavor is larger than the total storage size of the endpoint.
Solution: Create the level-1 image again. Install only drivers, VoIP agents, and optimization tools in the level-1 image, and install the necessary software for users in the level-2 image.
Image upload issues on the VOI management system
Analysis: Image upload fails.
Solution:
1. Check the endpoint side.
a. Verify that network connectivity exist between the endpoint and servers.
b. Identify whether the endpoint IP address has changed in the /var/log/syslog file.
c. Check the client logs for any obvious error messages.
d. Enter the endpoint backend, use the ls -lh -R /vms/idv/ command to identify whether the local image source file exists.
2. Identify whether SFTP is functioning correctly.
a. Execute the sftp -oPort=22222 idv@platform IP command on the endpoint, enter the password (obtained from Technical Support), and execute the following command to upload the test text (just_test.sh in the following figure) via SFTP to the idv_image directory for testing the upload channel.
Put /voitools/do-monitor-hotplug.sh /idv_image/just_test.sh
Figure 132 SFTP test
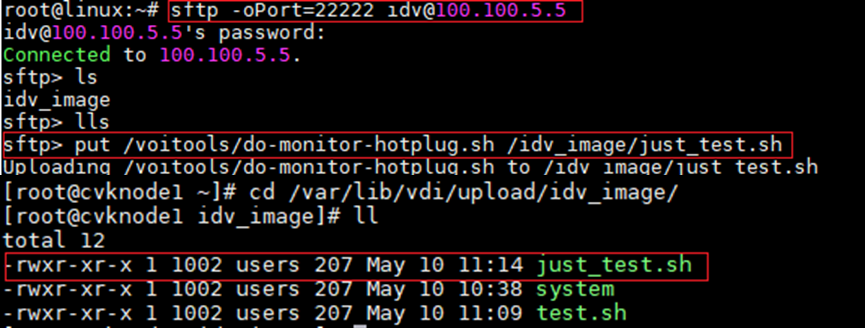
b. Restart the Docker service by using the service docker restart command from the management platform backend.
Figure 133 Restarting the Docker service
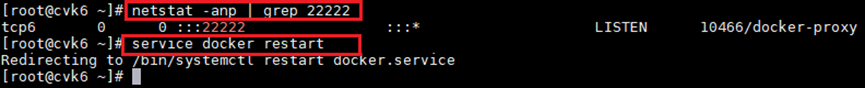
Blue screen issue
Symptom: After downloading an image, the endpoint encounters the Windows system blue screen error and displays INACCESSIBLE BOOT DEVICE.
Solution: Identify whether the downloaded image is correctly installed with agent and other optimization tools within the image source VM.
Figure 134 Windows blue screen
Upgrade issues
1. Verify network connectivity with the management platform.
2. Identify whether the original file of the platform upgrade package is missing.
3. Check the upgrader log for any installation failures for the upgrade package. Compatibility issues caused by a large version gap might exist, resulting in the failure of installing the upgrade package. The log directory for upgrader might differ across different versions. You can access the endpoint backend and globally search for log files by using the find / -name upgrader*.log command.
Noticeable electrical noise occurs during video/audio playing by USB headphones on UCC 10th endpoints in IDV mode
Symptom: The 10th generation of UCC endpoints frequently produces noticeable electrical current noise when playing videos or audio on Windows 7 or Windows 10 systems in IDV mode.
Solution: When a 10th generation endpoint enters the Windows 7 or Windows 10 system, right-click on the sound icon in the lower-right corner, click Playback, right-click the speaker, and select 16-bit, 48000Hz (DVD Quality) for the Properties > Advanced > Default Format parameter.
Level-2 image upload of VOI fails, and the client displays move file failed, source file not exist
1. Access the backend of the management platform and enter the sftp container by using the docker exec -it vdi-sftp bash command.
2. Enter the idv_image directory within the container by using the cd /home/idv/idv_image/ command.
3. Create a temporary file inside the container by using the touch abc.txt command.
4. Exit the container and identify whether the temporary file abc.txt created in the upload/download temporary directory exists. If the file does not exist, resolve the issue by using the following method.
Figure 135 Checking for the temporary file
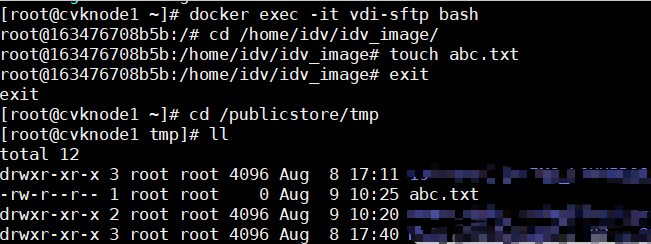
Solution:
1. Access the CLI of Space Console and use the docker ps command to view the CONTAINER ID of the container named vdi-sftp.
2. Restart the sftp container by using the docker restart ID command.
Figure 136 Restarting the sftp container

Can I send a VOI image back to the management platform
Yes. Endpoints later than E1009 support editing level-1 and level-2 images. Within the image creation process, a modified image can be sent back to the platform and distributed to other endpoints for use.
If the disk space is 256 GB, is the maximum size of the system disk also 128 GB
The recommended size for the system disk is half of the partition where the /vms directory is located. The size of a 50GB system disk image is usually smaller than 50 GB. The total size of the image files (level-1 and level-2) and the system disk must be smaller than the size of the partition where /vms is located. This restriction applies to other endpoint models.
In the education scenario, a VOI endpoint displays Requesting desktop pool and authorized user information after startup
In the education scenario, you must move VOI endpoints to a group that matches the client type Learningspace.
In the education scenario, the endpoint stays on the Requesting image information page for a long time after startup
1. Ensure that the VOI endpoint has been moved to the Learningspace group. Then, verify that the endpoint model and course type are consistent.
Figure 137 Viewing the endpoint model
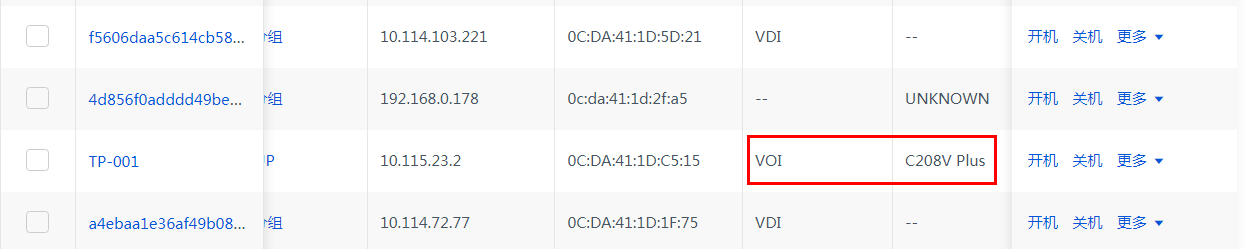
Figure 138 Viewing the course type
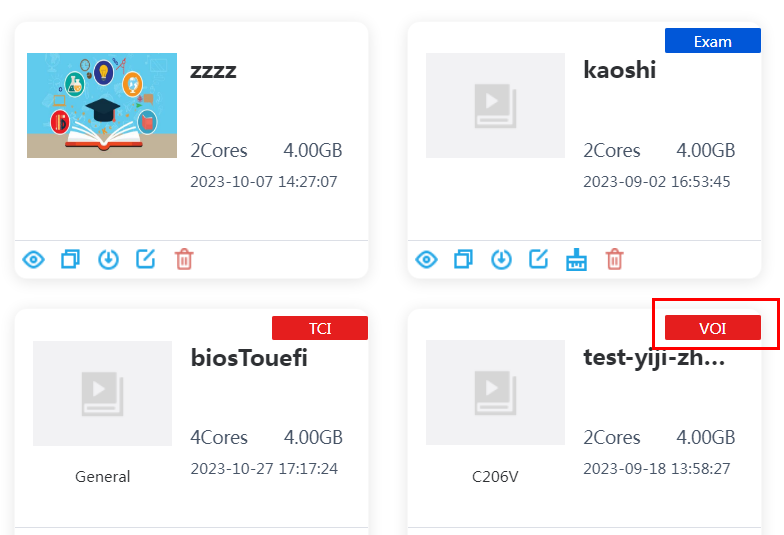
2. If consistency is verified, identify whether the endpoint group associated with the course includes the endpoint's own endpoint group and has users or classrooms specified.
Figure 139 Viewing course information
Offline login fails
This issue occurs when the offline duration exceeds the offline duration configured on the management platform. Reconnect to the management platform to solve this problem.
The VOI endpoint does not respond to class start or dismissal
1. Verify that the client network is normal and can receive platform notifications by pinging the client IP address from the platform and checking the online status in the endpoint list of the management platform. Because firewalls might only allow one-directional traffic, perform both of these tests.
Figure 140 Client online status
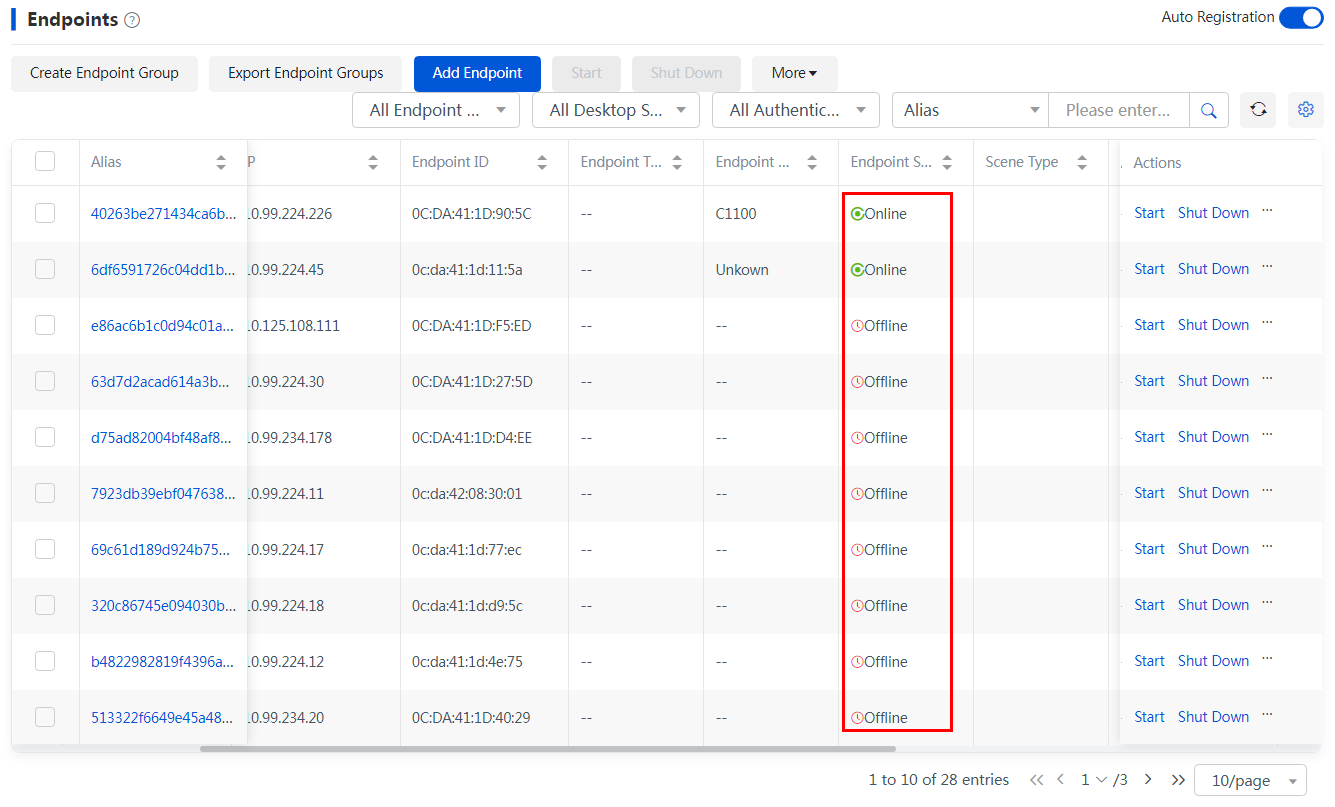
2. Verify that the endpoint model and the endpoint model associated with the classroom are consistent. To view the VOI endpoint model associated with the classroom, access the class list of the management platform. To view the endpoint model, access the endpoint list of the management platform.
Figure 141 Endpoint model associated with the classroom
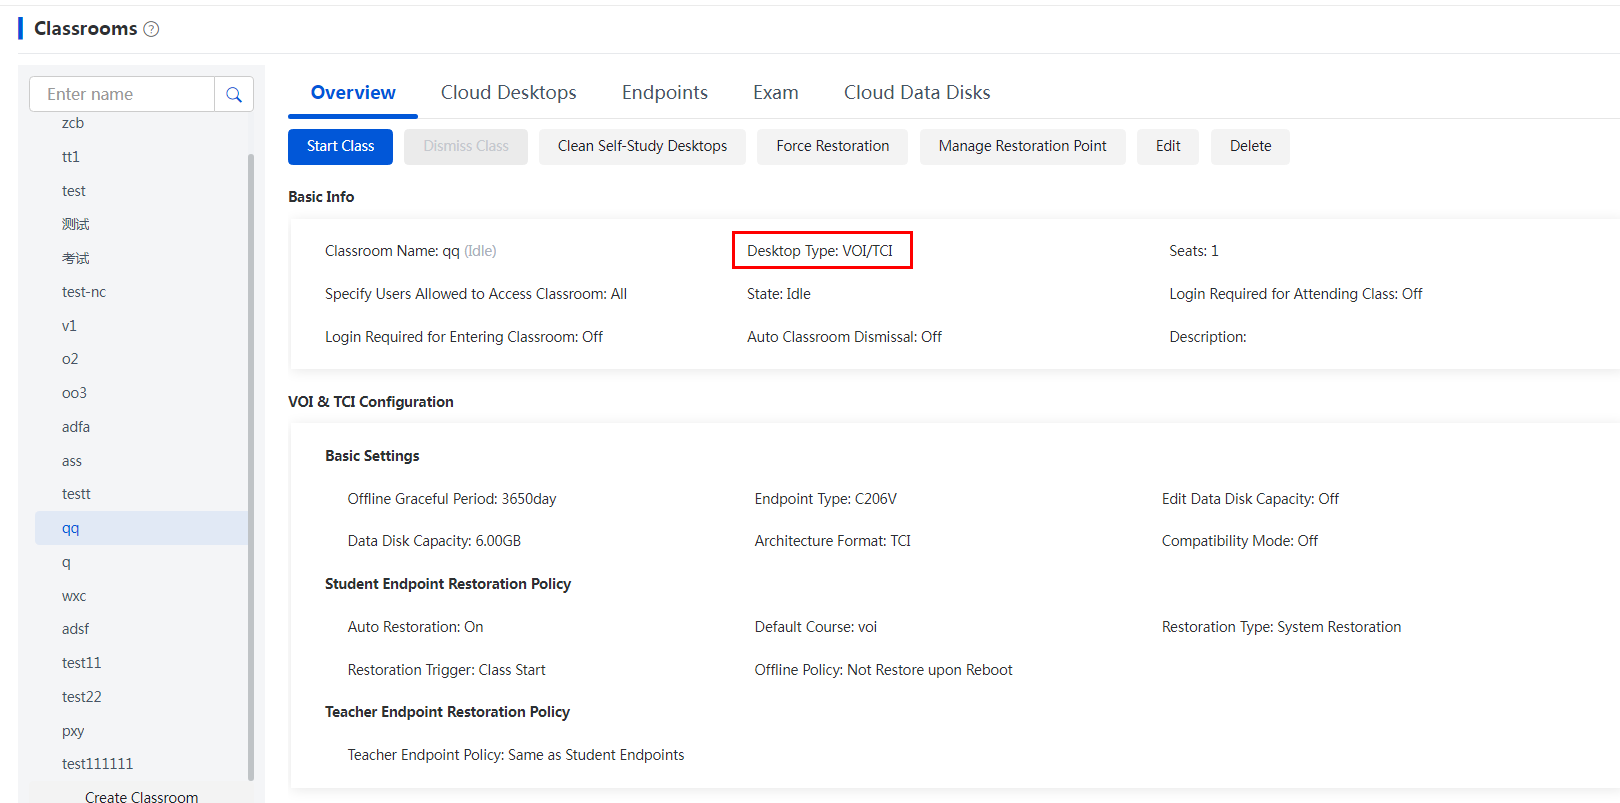
Figure 142 Endpoint model
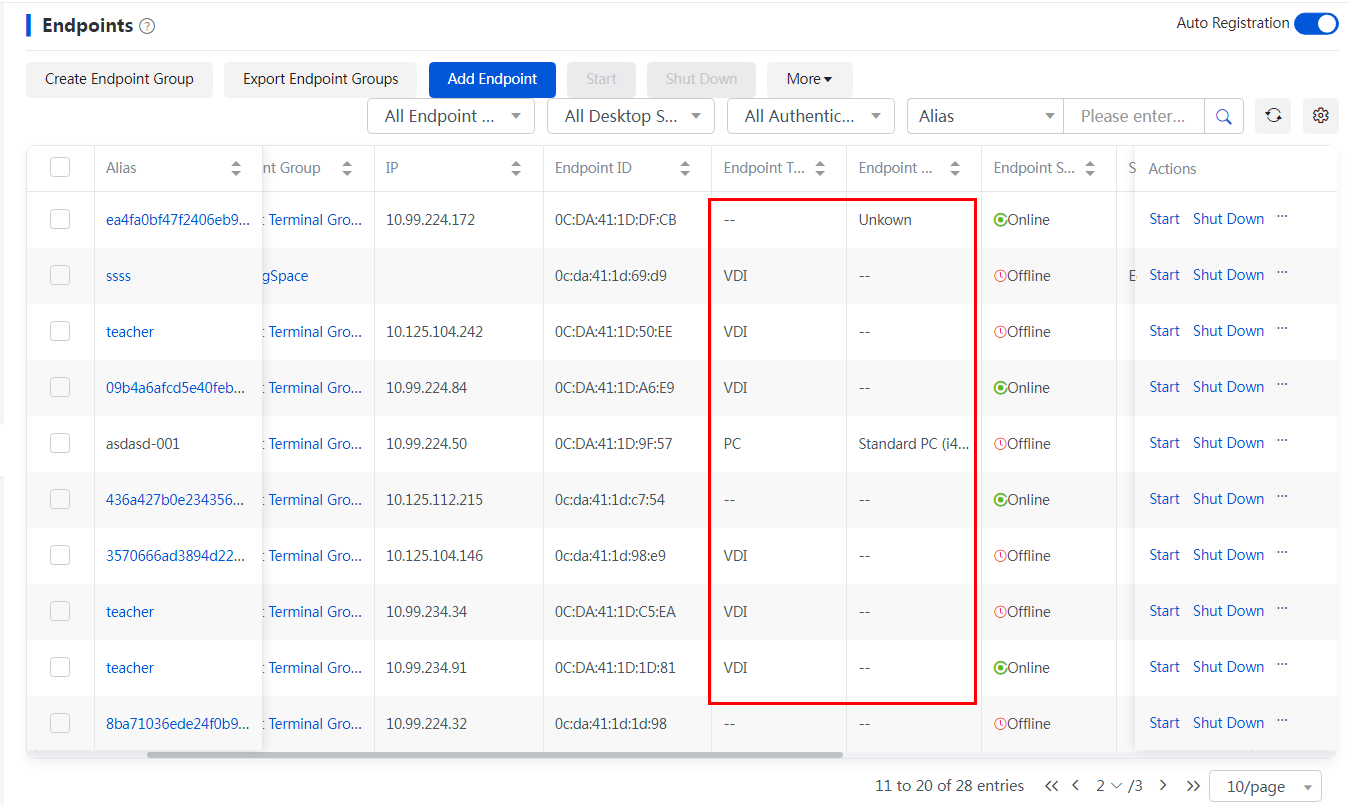
3. If the endpoint type is correct, troubleshoot message distribution of the management platform by checking the logs. After logging into the server backend via SSH, view the following key logs.
Table 10 Key log list
|
Log file |
Log storage path |
Remarks |
|
Workspace log |
/var/log/vdi/workspace-server/workspace.log |
Management platform log |
|
Controller log: |
/var/log/vdi/controller/controller.log |
Middleware service logs for client, Agent, and management platform communication. |
|
gRPC-Client log |
/var/log/vdi/controller/grpc-client.log |
Messages sent to the management platform are typically initiated by the client, and the platform receives and responds accordingly. For example, the class request initiated by the teacher end. |
|
gRPC log |
/var/log/vdi/controller/grpc.log |
Messages other than client messages, including messages exchanged between Agent and the platform, messages actively pushed by the platform to Agent and client. For example, after a class is started from the platform, the platform notifies the student end to switch to the VOI image with messages. |
4. Typically, after class start you can query the message with the ID 50008 in the gRPC log, as shown in the following figure.
Figure 143 Message with ID 50008
![]()
5. You can also search for relevant service logs in the Controller log by searching for the keyword batchNotifyTerminalsBeginClass. The following figure shows the ID list of the pushed endpoints.
Figure 144 Pushed endpoint ID list
![]()
6. On the management platform, go to the endpoint list and enter the endpoint details page. By checking the URL, you can obtain the endpoint ID. If this ID exists in the pushed ID list, the endpoint has been pushed with class information. Then, troubleshoot the client software to find why the class information is not received.
Figure 145 Endpoint IDs
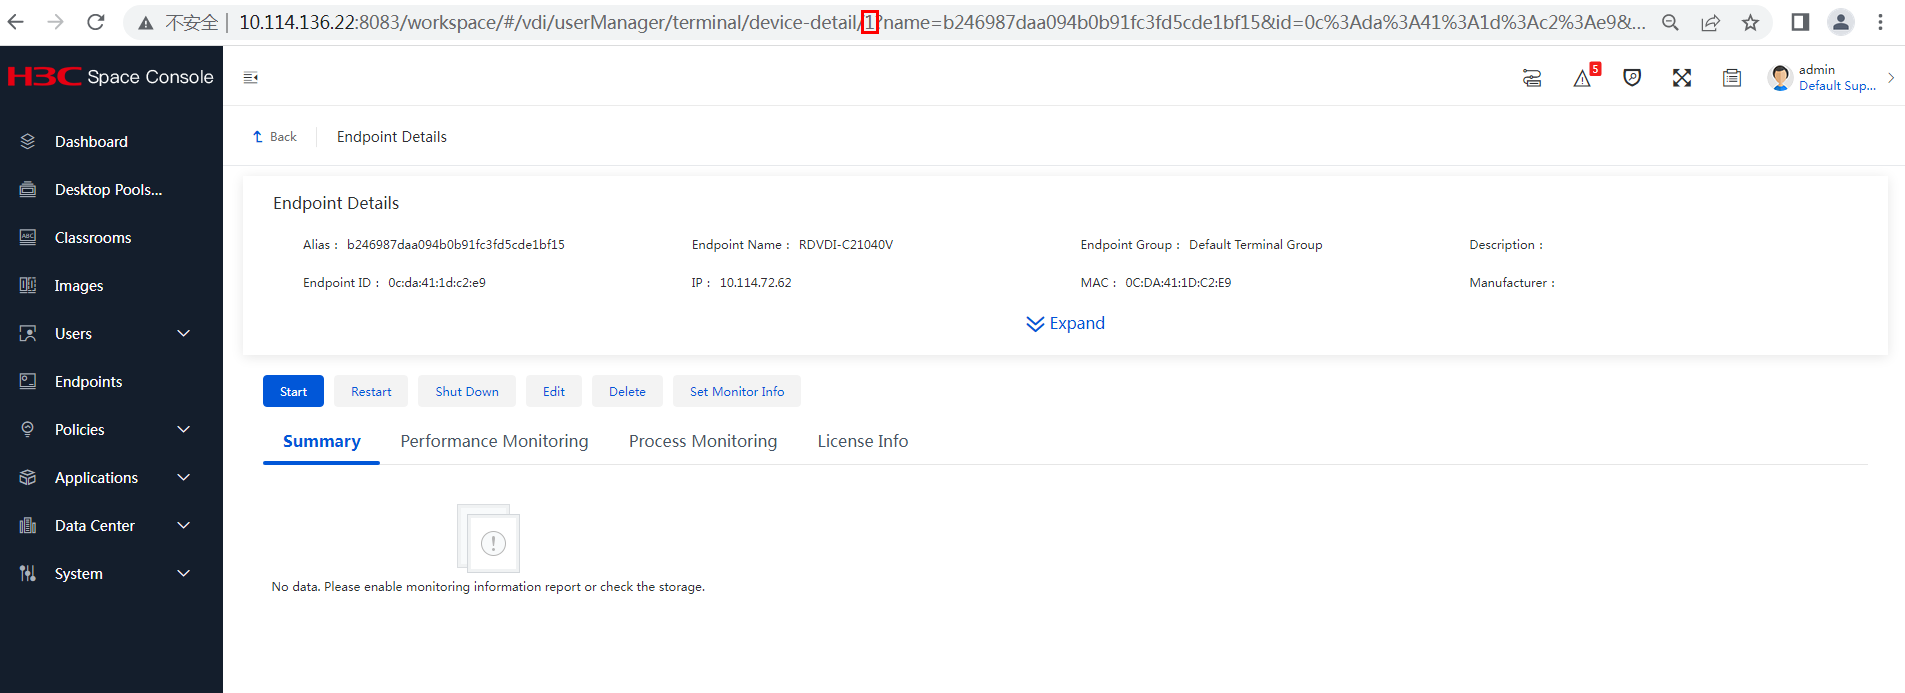
When a level-2 image is send to the management platform, the client reports a secure socket error
Due to the mismatch between the container IP and iptables rules provided by the management platform, the access has failed. The port for uploading the image is not reachable, and the socket connection cannot be established, resulting in a socket error. Solution: Use an SSH tool to log in to the management platform backend and execute the systemctl restart docker.service command.
How to select the correct boot option when installing the system on an endpoint
Perform the following tasks:
· For H3C 102V, H3C 103V, and H3C 105V endpoints:
Press F12 continuously after hearing the beep sound at startup.
· For H3C C106V Pro, H3C C106V, H3C C107V Pro, H3C C107V Plus, H3C C107V, H3C C108V Pro, and H3C C108V Plus endpoints:
Boot up, press F12, and select the boot option. No password is required.
· For H3C C206V, H3C C206V Plus, H3C C207V, H3C C207V Plus, H3C C207V Pro, H3C C208V Plus, and H3C C208V Pro endpoints:
Boot up, and press F8 to enter the password input interface. Enter password 1qaz@WSX.
· For the H3C C201V endpoint:
Boot up, and press F12 to access the password input interface. Enter the password 1qaz@WSX.
Storage maintenance method
ONEStor PG inconsistent recovery method
Recovery process
The recovery process is shown in Figure 148.
Figure 146 Recovery process for PG inconsistent
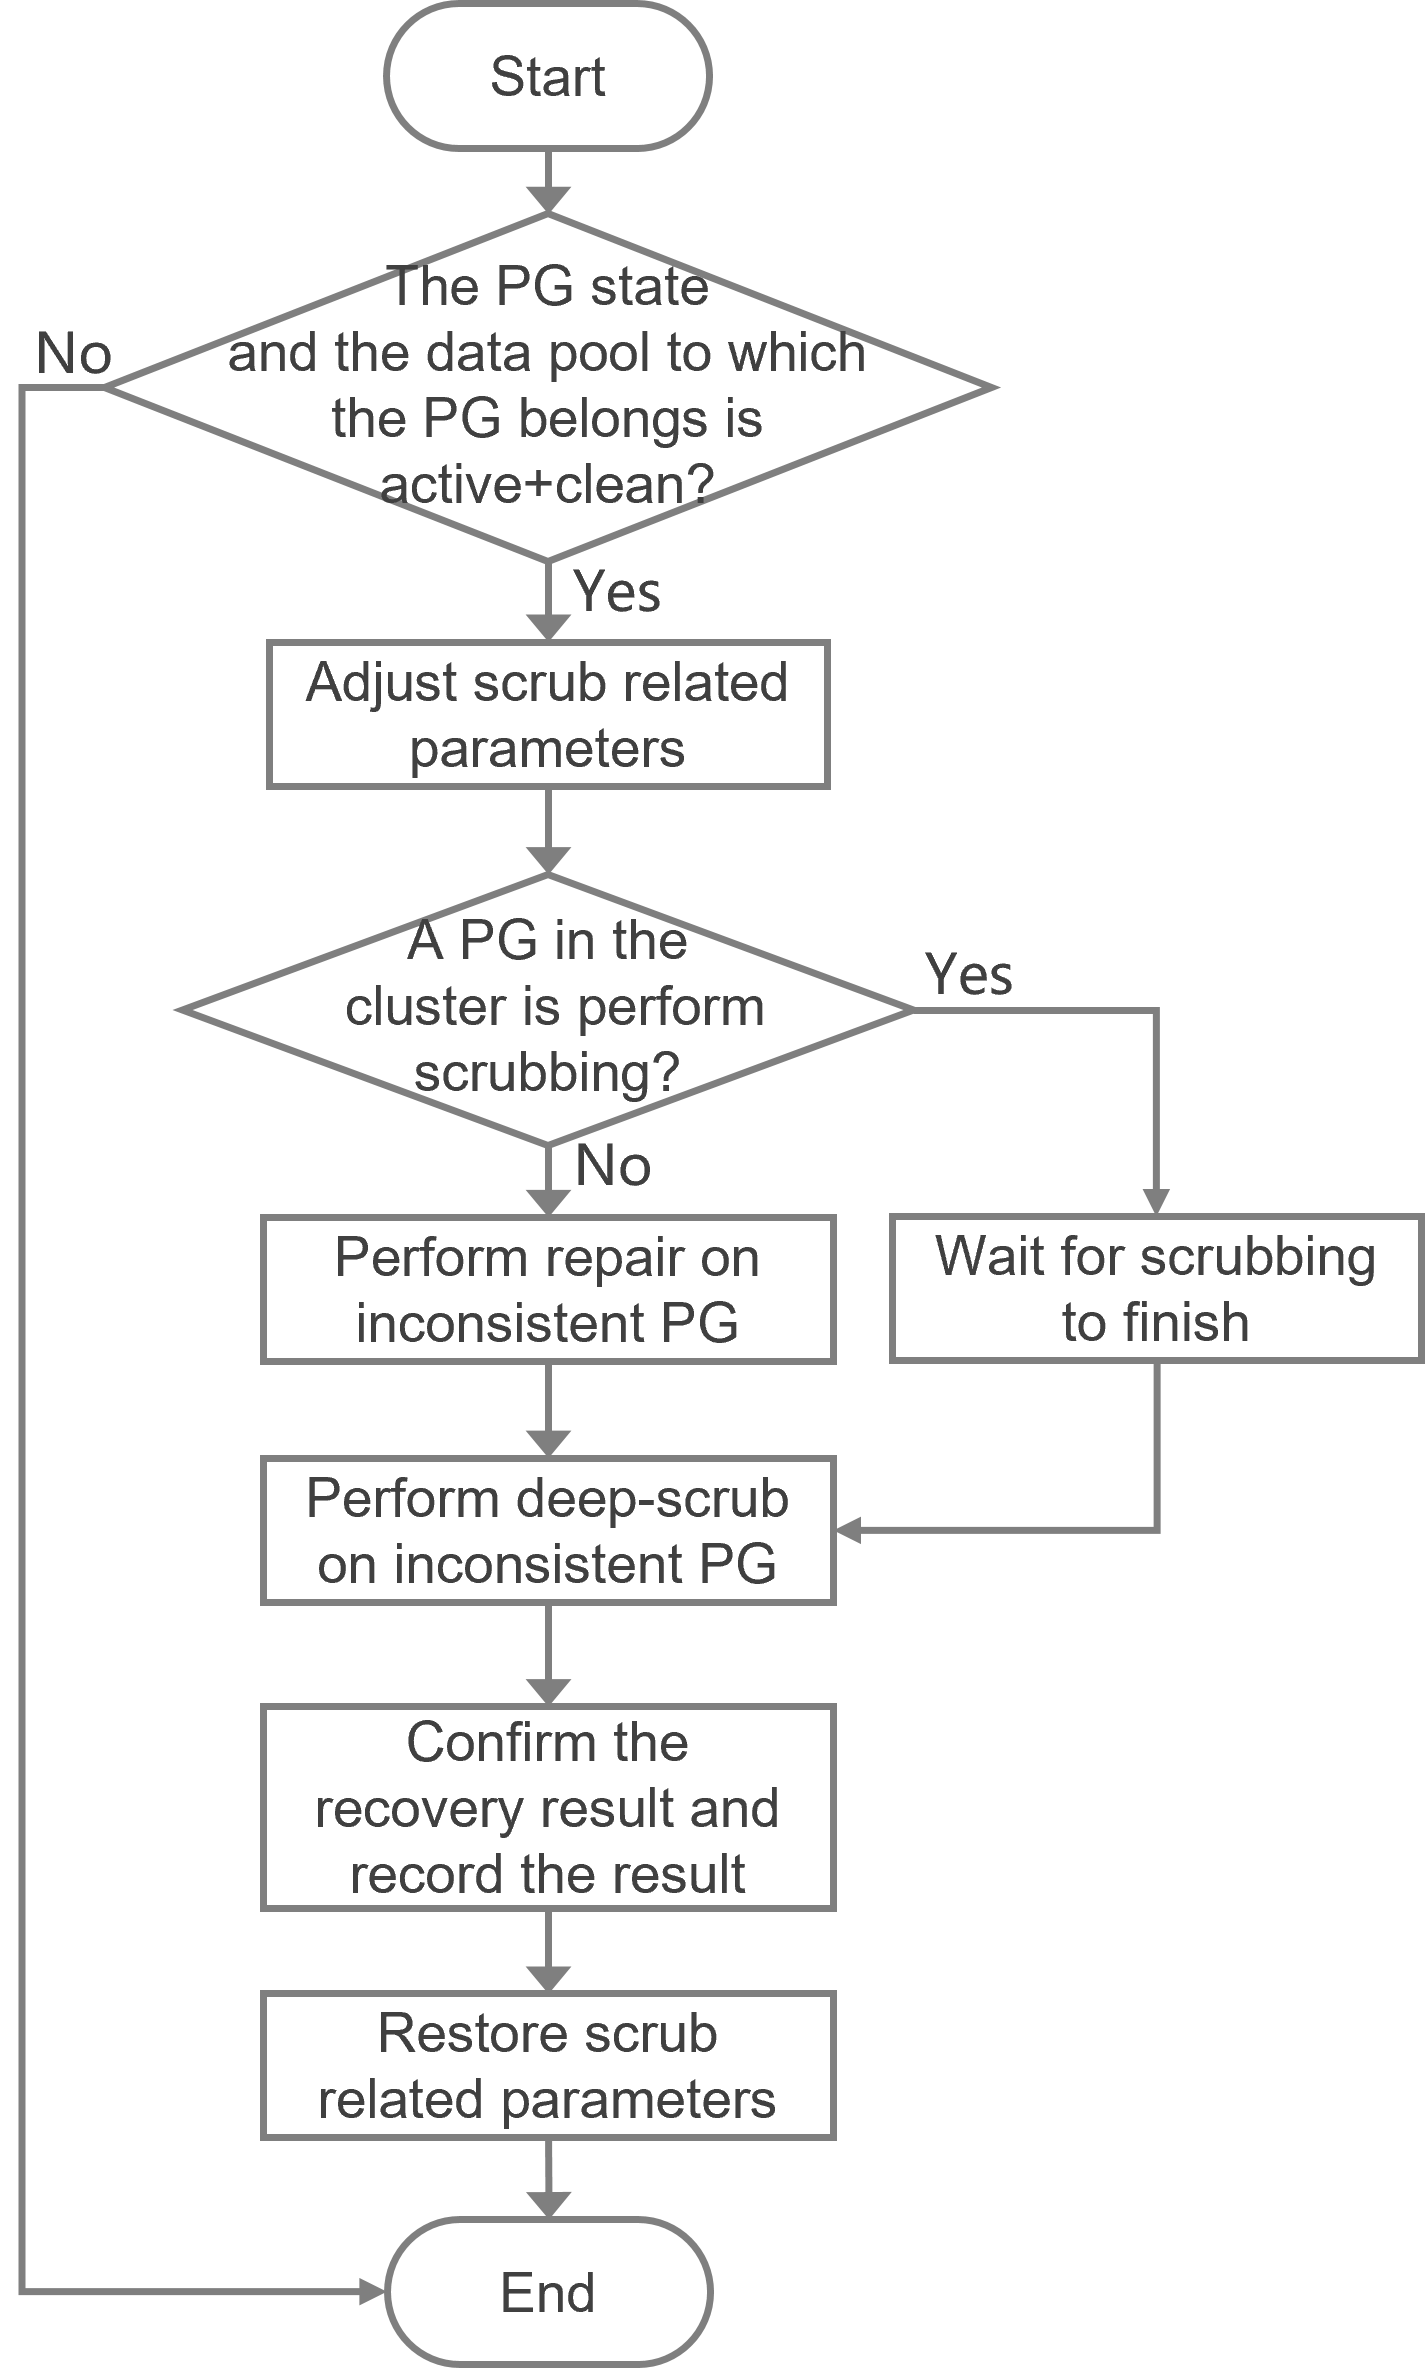
Restrictions and guidelines for PG inconsistent recovery
· Execute the recovery script on the handy node to resolve the inconsistent failure.
· The pool to which the PG in inconsistent state belongs contains PGs that are not active+clean. The PG recovery script will skip the recovery of this PG.
· If a PG is performing scrubbing in the cluster, wait for the scrubbing to complete before you officially enter the recovery process.
· Before executing the PG fault recovery script, temporarily disable the PG automatic balancing function as a best practice to ensure operation success.
· The project script of the PG fault recovery tool provides only the repair solution to recover inconsistent faults. If you cannot use the script to recover the PG with inconsistent errors, carefully analyze and confirm if the inconsistency is due to hyper-redundancy errors. If a hyper-redundancy error is present, contact Technical Support.
If a hyper-redundancy error occurs on an object, you can view the following in the main OSD log of the PG after the repair:
¡ Erasure coding (EC): Similar output for hyper-redundancy quantity segments: be_select_auth_object: error(s) osd 23(3) for obj 2:3eff0af3:::1000000fa49.00000000:head
¡ Erasure coding (EC): Similar output if the suitable object cannot be selected: 2.7c soid 2:3eff0af3:::1000000fa49.00000000:head: failed to pick suitable object info
¡ Replica: Similar output if the suitable object cannot be selected: 4.135 soid 4:acff053d:::100000074f2.00000000:head: failed to pick suitable auth object)
· The hyper-redundancy data is inconsistent because the correct object data cannot be obtained in the cluster. The solution provided in this document can only restore the inconsistent state of the PG and cannot guarantee the correctness of the data after the recovery of inconsistent objects.
· The inconsistent fault recovery solutions provided in this document may not meet all inconsistent fault scenarios. In such cases, contact Technical Support.
· For the inconsistent PG data on the cluster caused by write operations on the bare disks, you can use the project recovery script of the PG fault recovery tool, or you can use a solution with a shorter recovery cycle. Contact Technical Support.
· For the inconsistency of data caused by writing operations on bare disks, contact Technical Support.
Executing a recovery script
|
|
IMPORTANT: · During script execution for recovery, do not perform any down drive operations, especially down drives related to current recovering PGs. If you do so, abnormal interruption to the deep-scrub and repair process may occur, ultimately affecting recovery. · This document does not mention the operations prompted by the PG recovery tool script. It only provides supplementary explanations of these operations and points to be noted. However, all operations in the script must be executed during the actual recovery process. · For the erasure code redundancy strategy, if the size information of the object is incorrect, the read or write operation by the client will trigger an assertion. |
Recovering pg inconsistent
7. On the handy node in the cluster, go to the directory where the PG recovery tool script file is stored: cd /usr/lib/ceph.
8. Execute the recovery script in the /usr/lib/ceph directory: bash pg_recovery_tool.sh to recover data inconsistency faults.
|
|
CAUTION: · Before executing the recovery script to recover PG inconsistent, you can pause the PG automatic balance function to prevent migration of PG during recovery and avoid inconsistent data recovery. · For versions earlier than E1007, the usage of the script may be different. Please strictly follow the precautions mentioned in the script. |
Recovery period status
· The system prompts that the cluster is currently undergoing scrubbing pg.
This situation is because the pg repair tool will automatically set the no-scrub and nodeep-scrub states in the background. After the cluster scrubbing is completed, you can proceed to recover inconsistent pg.
· The system prompts that the pool has unclean pg.
This is because unclean PGs exist in the pool to which the PG belongs. Unclean PGs in the pool will affect the execution of the scrub and repair commands, so the current inconsistent PG recovery will be skipped. Wait for the pool to complete data reconstruction and then execute recovery again when the healthy state is recovered.
· The system prompts that stale PGs exist in the pool.
This situation is due to the existence of stale PGs in the pool to which the PG belongs. Stale PGs in the pool will impact the execution of scrub and repair commands, so the recovery of the current inconsistent PG will be skipped. Wait for the pool to complete data reconstruction and then execute recovery again when the healthy state is recovered.
· The system prompts that the pg osd status is abnormal.
This situation is due to the change in mapping from PG to OSD. The PG state will no longer be active+clean+inconsistent, which will result in recovery failure. Therefore, the current inconsistent PG recovery will be skipped. Wait for the PG to recover clean and try again. If no OSD oscillation occurs, the reason for PG inconsistency is due to encountering bad sectors. When a bad disk triggers automatic repair of the inconsistent PG in the background of disk reliability, the inconsistent PG status will also be changed.
· The system prompts that a repairing/deep-scrubbing process is ongoing.
This indicates that PG is still in the process of recovery. The time required for pg repair/deep-scrub is closely related to the data on the PG. Wait for the process to complete.
· The system prompts that the repair fails.
Check the main OSD log of the PG to see if any excessive redundant data errors occurred. The method of confirmation has been mentioned before. If yes, contact Technical Support. If any other abnormalities occur during the repair process, contact Technical Support.
GlusterFS split-brain clearance method
About GlusterFS split-brain
In GlusterFS, the data is typically replicated across multiple nodes to ensure high availability and redundancy. When servers in the cluster disconnect due to power outages or other reasons, the data blocks with replicas might be independently modified on different servers. Due to network partitions or communication interruptions between servers, the modified data blocks cannot be synchronized, resulting in each partition having its own data version.
When the connection is restored, GlusterFS's automatic file replication (AFR) module cannot automatically determine the latest or correct version of the data. Such data inconsistency is known as split-brain. If the system fails to resolve such data inconsistency, data loss or errors might occur, affecting the system's overall reliability and consistency.
GlusterFS split-brain typically includes the following types:
· Data split-brain—Different replicas of the same file or directory contain different data, causing inconsistencies in file content. This type of brain split usually occurs after a network disruption or node failure, causing multiple replicas to be independently modified and unsynchronized.
· Metadata brain split—Metadata of files or directories including attributes, permissions, ownership, and timestamps, are inconsistent, with different replicas having varying metadata.
· Entry brain-split—If the same file is deleted and recreated on different nodes in a network partition, it may result in different GFIDs or inconsistent file types across nodes.
Detecting GlusterFS split-brain issues
Detection method
1. Execute the following commands to view information about a GlusterFS volume:
¡ gluster volume heal <VOLUME-NAME> info, where <VOLUME-NAME> represents the name of the GlusterFS volume. This command checks self-heal information of a specific volume, including files and directories to be repaired, the overall self-heal status, and self-heal details of specific files.
¡ gluster volume heal <VOLUME-NAME> info split-brain, where <VOLUME-NAME> represents the name of the GlusterFS volume. This command checks and displays information about split-brain files, including the split-brain file list and detailed file information.
|
|
NOTE: The brain-split files may display the following content: · Is in split-brain—Files with data split-brain and metadata split-brain will include this information in the file path or GFID. Files with entry split-brain will show the parent directory path simultaneously. Manually resolve the issue if this information is included. · Is possibly undergoing heal—If you execute the heal info command, every file will be locked. This message appears if the self-heal program is already restoring files. In addition, this message appears if you execute the heal info command multiple times. |
2. To view the split-brain type of a file, execute getfattr -n replica.split-brain-status <path-to-file>, where <path-to-file> represents the file path.
Detection examples
1. Execute the gluster volume info command to view volume information. The volume information is Volume Name: cluster_0-vms-learningstorage-glusterfs-courseImages.
[root@cvknode1 ~] # gluster volume info
Volume Name: cluster_0-vms-learningstorage-glusterfs-courseImages
Type: Replicate
Volume ID: 9a83f16d-32b5-44d2-a392-71d8906cb0c5
Status: Started
Snapshot Count: 0
Number of Bricks: 1 x 2 = 2
Transport-type: tcp
Bricks:
Brick1: 10.10.9.3:/vms/learningstorage/glusterfs/brick
Brick2: 10.10.9.2:/vms/learningstorage/glusterfs/brick
Options Reconfigured:
performance.cache-size: 8GB
performance.md-cache-timeout: 60
cluster.read-hash-mode: 3
performance.read-ahead-page-count: 16
performance.rda-cache-limit: 1GB
performance.readdir-ahead: on
performance.io-thread-count: 64
performance.write-behind-window-size: 1GB
2. Execute the gluster volume heal <VOLUME-NAME> info command to view split-brain information.
[root@cvknode1 ~]# gluster volume heal cluster_0-vms-learningstorage-glusterfs-courseImages info
Brick <hostname:brickpath-courseImage>
<gfid:aaca219f-0e25-4576-8689-3bfd93ca70c2> - Is in split-brain
<gfid:39f301ae-4038-48c2-a889-7dac143e82dd> - Is in split-brain
<gfid:c3c94de2-232d-4083-b534-5da17fc476ac> - Is in split-brain
<gfid:6dc78b20-7eb6-49a3-8edb-087b90142246>
Number of entries: 4
Brick <hostname:brickpath-b2>
/dir/file2
/dir/file1 - Is in split-brain
/dir - Is in split-brain
/dir/file3
/file4 - Is in split-brain
/dir/a
Number of entries: 6
3. Execute the getfattr -n replica.split-brain-status path-to-file command to view the split-brain type of the file. This steps uses file1 as an example. Its split-brain type is metadata split-brain.
[root@cvknode1 ~]# getfattr -n replica.split-brain-status file1
file: file1
replica.split-brain-status="data-split-brain:no metadata-split-brain:yes Choices:test-client-0,test-client-1"
4. Repeat the command to view the split-brain types of file4, which are data split-brain and metadata split-brain.
[root@cvknode1 ~]# getfattr -n replica.split-brain-status file4
file: file4
replica.split-brain-status="data-split-brain:yes metadata-split-brain:yes Choices:test-client-2,test-client-3"
5. Repeat the command to view the split-brain type of directory dir, which is not metadata split-brain or data split-brain.
[root@cvknode1 ~]# getfattr -n replica.split-brain-status dir
file: dir
replica.split-brain-status="The file is not under data or metadata split-brain"
Using GlusterFS built-in commands to resolve split-brain issues
Resolving data/metadata split-brain
Use one of the following methods to resolve a data or metadata split-brain issue:
· Use a larger file as the source to resolve the split-brain issue.
gluster volume heal VOLNAME split-brain bigger-file FILE/GFID
<VOLNAME>: Specifies a GlusterFS volume by its name.
<FILE/GFID>: Specifies the complete file path seen from the root directory of the volume, or the file's associated GFID.
· Use the most recently modified file as the source to resolve the split-brain issue.
gluster volume heal <VOLNAME> split-brain latest-mtime <FILE/GFID>
· Use a specific server's brick as the source to resolve the split-brain issue.
gluster volume heal <VOLNAME> split-brain source-brick <HOSTNAME:BRICKNAME> <FILE/GFID>
<HOSTNAME:BRICKNAME>: Specifies a server name and a brick name.
· Use a specific brick as the source to repair all split-brain files. This is suitable for bulk repair of numerous split-brain files. For example, execute the gluster volume heal <VOLUME-NAME> info command to display only split-brain GFIDs and does not display split-brain directories or files.
gluster volume heal <VOLNAME> split-brain source-brick <HOSTNAME:BRICKNAME>
Resolving GFID split-brain in entry split-brain
The commands to resolve GFID split-brain are similar to the commands to resolve data or metadata split-brain, with the following differences:
· To resolve GFID split-brain, the FILE argument in the above commands can specify only a file path, not a GFID.
· To resolve GFID issues, you must specify a file path. Make sure the FILE argument is specified when you specify the source-brick keyword.
· For distributed replicate volumes, when specifying the source-brick keyword to resolve GFID split-brain, perform repair operations on all sub-volumes.
Resolving file type split-brain in entry split-brain
The file type split-brain cannot be directly fixed with GlusterFS built-in commands. You can confirm the file to be kept on one brick and manually delete the corresponding files on other bricks.
Resolving split-brain through mounting
If split-brain issues cannot be resolved with GlusterFS built-in commands, resolve the issues through mounting.
Procedure
1. To check split-brain information of a GlusterFS volume and list files in a split-brain status, execute gluster volume heal <VOLUME-NAME> info, where <VOLUME-NAME> represents the name of the GlusterFS volume.
2. To view the split-brain type of the file, execute getfattr -n replica.split-brain-status <path-to-file>, where <path-to-file> represents a file path.
3. To specify the target file on a client, execute setfattr -n replica.split-brain-choice -v <client> <FILE>, where the <client> argument represents a client node and the <FILE> argument represents a split-brain file.
Examples
1. Execute the getfattr -n replica.split-brain-status <path-to-file> command to view the split-brain type of file100, file1, file99, dir, and file2. file100 has metadata split-brain, file1 has data split-brain, file99 has both data and metadata split-brains, while dir and file2 do not have any split-brain issues.
[root@cvknode1 ~]# getfattr -n replica.split-brain-status file100
file: file100
replica.split-brain-status="data-split-brain:no metadata-split-brain:yes Choices:test-client-0,test-client-1"
[root@cvknode1 ~]# getfattr -n replica.split-brain-status file1
file: file1
replica.split-brain-status="data-split-brain:yes metadata-split-brain:no Choices:test-client-2,test-client-3"
[root@cvknode1 ~]# getfattr -n replica.split-brain-status file99
file: file99
replica.split-brain-status="data-split-brain:yes metadata-split-brain:yes Choices:test-client-2,test-client-3"
[root@cvknode1 ~]# getfattr -n replica.split-brain-status dir
file: dir
replica.split-brain-status="The file is not under data or metadata split-brain"
[root@cvknode1 ~]# getfattr -n replica.split-brain-status file2
file: file2
replica.split-brain-status="The file is not under data or metadata split-brain"
2. Execute setfattr -n replica.split-brain-choice -v none file1 to access file1. If the access attempt fails, the system prompts Input/output error.
3. Execute setfattr -n replica.split-brain-choice -v <client> <FILE> to repair file1. The split-brain options for file1 include test-client-2 and test-client-3. In this case, replace <client> with test-client-2 or test-client-3. That is, access file1 through test-client-2 or test-client-3. This step uses test-client-2 as an example.
# setfattr -n replica.split-brain-choice -v test-client-2 file1
4. Access file1 again. File file1 has recovered to normal.
# cat file1
xyz
Modification method
Guidelines for data backup before system re-installation
If the on-site environment requires re-installation, back up the following information as a best practice:
· User information—Support import and export.
· System image—Support download and import.
· Desktop image—Only when the platform IP remains unchanged after re-installation, the IP reported by the Agent in the image is correct. The image supports import and export.
· Domain controller information—Must be recorded and reconfigured.
· Desktop pools and desktops—Must be redeployed based on the imported desktop image.
· Endpoint information—No need for backup. The new platform will automatically re-register once set up.
· Strategy information—Must be recorded and reconfigured.
· Cloud storage data—Must be backed up by the user and cannot be restored on the new platform.
· License—Before re-installation, manually disconnect the connection as a best practice.
Changing the system time
See H3C Workspace Cloud Desktop System Time Modification Configuration Guide on the official website.
Modifying host network configuration (after initial deployment)
After the initial deployment of Workspace is completed, you need to edit network settings of the hosts in the cluster in the case of changes in the network planning and the environment.
|
|
CAUTION: To edit only the virtual IP address of the storage network, contact Technical Support. |
The modification method varies by Workspace version as follows:
· For versions E1013P33 and later based on H3Linux1.0, see H3C Workspace Cloud Desktop Management Network Editing Configuration Guide-E1xxx. For more information, visit the official website.
· In versions between E1010 and a version earlier than E1013P33, use scripts at the back end to edit management network settings as described in this section. The following table shows the configuration items that can be edited in E1010 and later:
Table 11 Supported configuration items
|
Configuration item |
Compute virtualization |
HCI |
|
Stateful failover VIP |
√ |
√ |
|
Service network VIP |
√ |
√ |
|
Storage network VIP |
× |
√ |
|
Start network segment of the management network in a cluster |
√ |
√ |
|
Gateway IP of the management network in a cluster |
√ |
√ |
|
IP address of quorum node 1 in the stateful failover system |
√ |
√ |
|
IP address of quorum node 2 in the stateful failover system |
√ |
√ |
|
Host IP |
√ |
√ |
|
Host gateway address |
√ |
√ |
Prerequisites
Before editing host network settings, make sure the following requirements are met:
· Workspace initial deployment is completed.
· Disable all VMs. Make sure all hosts are in maintenance mode.
· Delete all non-local storage on all hosts except RBM storage. Back up the names and paths of all non-local storage on all hosts, except RBD storage, so that you can re-add them as needed.
· Delete non-local image storage and dual-host storage, if any. Back up the names and paths of all non-local storage on all hosts, except RBD storage, so that you can re-add them as needed. If a VOI or IDV image uses this image storage, download the VOI and IDV images for backup before the deletion.
· If the campus space is deployed in the teaching scenario, stop the campus space from the Applications > Campus Space page on Space Console.
· Make sure the management nodes can reach all service nodes (CVK).
· Before editing IP settings, plan the network IP in advance to ensure the connectivity of the new network.
· Make sure the edited management network IP is reachable to third-party components such as the LDAP server, domain server, mail server, shared storage, monitor platform, and license server.
Restrictions and guidelines
When you edit host network settings, follow these restrictions and guidelines:
· Use the script in this section to edit host information only when necessary, especially in a complex production environment. If you fail to do so, services might fail to operate correctly.
· If you edit the IP address of Space Console, the original IP address will become invalid and the server will restart. Therefore, record the new address, and log in to Space Console with the new address after the server restarts.
· During modification of the management network IP, do not perform any other operations.
· Storage back-end and front-end networks in an HCI scenario do not support editing host network settings.
· If the system has a VM with a static IP, manually edit the IP address of the VM after editing the management network IP across network segments.
· If there is a backup history of the management data before the management network IP address is edited, do not perform backup recovery after the modification.
Procedure
This section describes how to edit host network settings in compute virtualization and HCI scenarios
Compute virtualization scenario
1. Use the SSH tool to access the /opt/vdi/ directory on the management node or the primary node of the stateful failover system.
2. Execute the ./modify_hosts_ip.sh command to export all host information to the file named hosts_network_info in the current path.
Figure 147 Exporting all host information
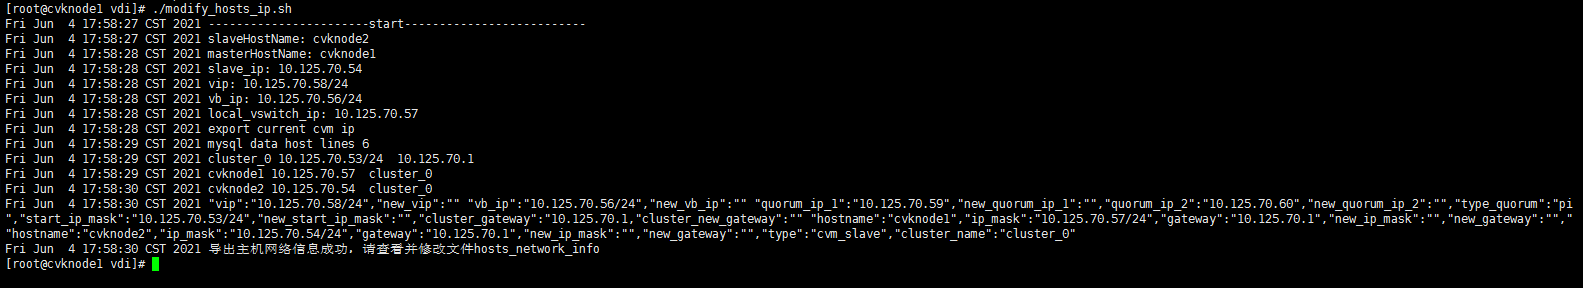
3. Execute the cat hosts_network_info command to view the exported files. This step shows the content of the hosts_network_info file in the stateful failover system as an example:
"vip":"10.125.70.58/24","new_vip":""
"vb_ip":"10.125.70.56/24","new_vb_ip":""
"quorum_ip_1":"10.125.70.59","new_quorum_ip_1":"","quorum_ip_2":"10.125.70.60","new_quorum_ip_2":"","type_quorum":"ping"
"cluster_id":"1","cluster_name":"cluster_0","start_ip_mask":"10.125.70.53/24","new_start_ip_mask":"","cluster_gateway":"10.125.70.1,"cluster_new_gateway":""
"hostname":"cvknode1","ip_mask":"10.125.70.57/24","gateway":"10.125.70.1","new_ip_mask":"","new_gateway":"","type":"cvm_master","cluster_name":"cluster_0"
"hostname":"cvknode2","ip_mask":"10.125.70.54/24","gateway":"10.125.70.1","new_ip_mask":"","new_gateway":"","type":"cvm_slave","cluster_name":"cluster_0"
4. Enter values for the red fields in the previous step as needed. Keep other fields unchanged. The description for each field is as shown in Table 13.
|
Field |
Description |
|
new_vip |
Virtual IP in the format of IP/mask. This field is available in the stateful failover scenario. |
|
new_vb_ip |
Service network virtual IP in the format of IP/mask. |
|
new_quorum_ip_1 |
IP address of quorum node1 for the stateful failover system. This field is available when the Ping quorum mode is specified in the stateful failover scenario. |
|
new_quorum_ip_2 |
IP address of quorum node2 for the stateful failover system. This field is available when the Ping quorum mode is specified in the stateful failover scenario. |
|
new_start_ip_mask |
Start management network segment in the format of IP/mask. |
|
cluster_new_gateway |
IP address of the gateway for the management network. |
|
new_ip_mask |
Host IP in the format of IP/mask. |
|
new_gateway |
Host gateway IP. |
5. Based on the example and field description from the previous step, execute the vim hosts_network_info command and press i to edit the file. After the editing, press Esc to exit the edit mode. Then, enter :wq! and press Enter to save the configuration. The following is an example:
Figure 148 File content before modification

a. Change the VIP to 10.125.70.55/24 by setting the new_vip field to 10.125.70.55/24.
b. Change the IPs of quorum nodes in Ping mode to 10.125.70.51 and 10.125.70.52 by specifying 10.125.70.51 and 10.125.70.52 for the new_quorum_ip_1 and new_quorum_ip_2 fields, respectively.
c. Change the IP address of cvknode1 to 10.125.70.53/24 by specifying 10.125.70.53/24 for the new_ip_mask field.
Figure 149 File content after modification
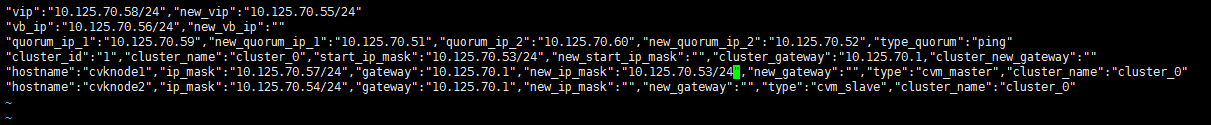
6. Execute the ./modify_hosts_ip.sh hosts_network_info command to implement the modification.
Figure 150 Executing the modification command
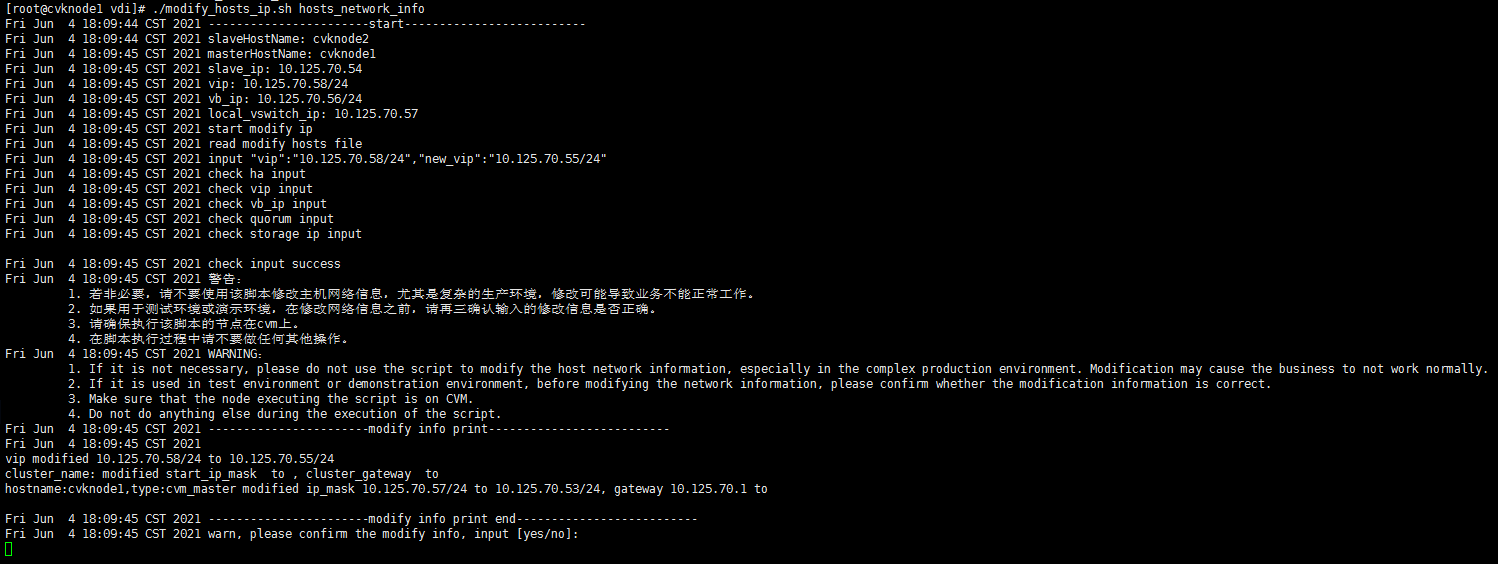
7. The information to be edited is automatically output in the window. Verify the information, and then enter yes as prompted to start the modification. The host restarts automatically after the modification.
Figure 151 Verifying the modification
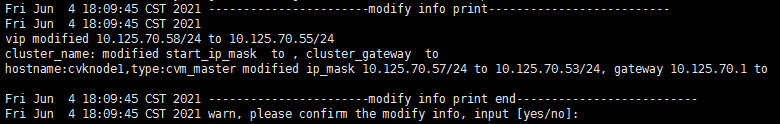
HCI scenario
1. Identify the current worker node of ONEStor. Execute the ip addr command on both primary and backup management nodes in the stateful failover system to identify the host of the storage virtual IP. The host with this IP is the current worker node of ONEStor.
2. Execute the onestor modify modify_ip export command on the current worker node to export the host information to the /opt/h3c/modify_ip/ path.
Figure 152 Exporting host information successfully
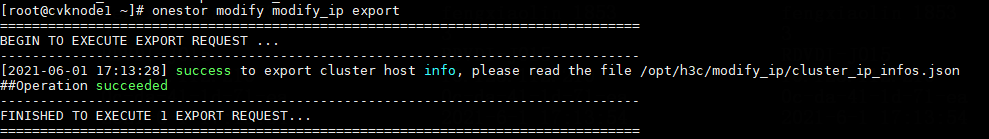
3. Execute the vim /opt/h3c/modify_ip/cluster_ip_infos.json command and press i to edit host information. Add the field information as shown in Table 13 below the original fields. Keep other fields unchanged if they do not require modification. After the modification is completed, execute the :wq! command to save the changes.
|
Field |
Description |
|
new_handy_vip |
Storage VIP. |
|
new_manage_ip |
Host IP. |
|
new_manage_network |
Gateway address in the format of IP/mask. |
Figure 153 Editing host information
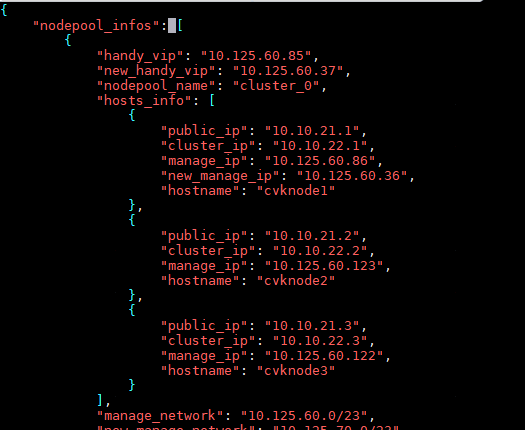
4. Execute the preprocessing command for editing an IP address on the current worker node of ONEStor: onestor modify modify_ip prepare.
Figure 154 Preprocessing operation succeeded
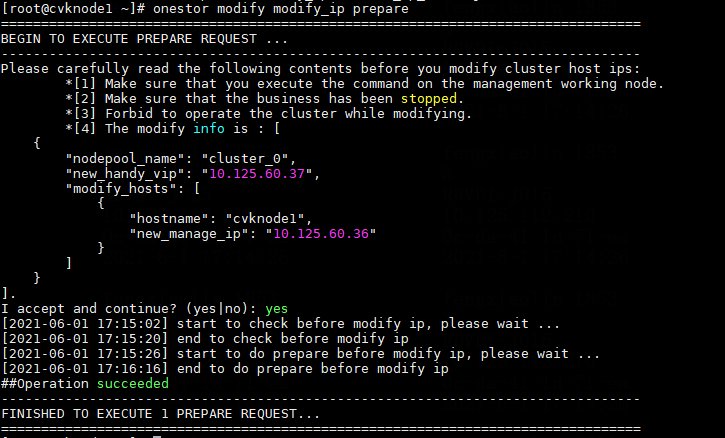
5. Access the /opt/vdi/ directory on the management node or the primary node of the stateful failover system.
6. Execute ./modify_hosts_ip.sh to export all host information to the file named hosts_network_info in the current path.
Figure 155 Exporting host information
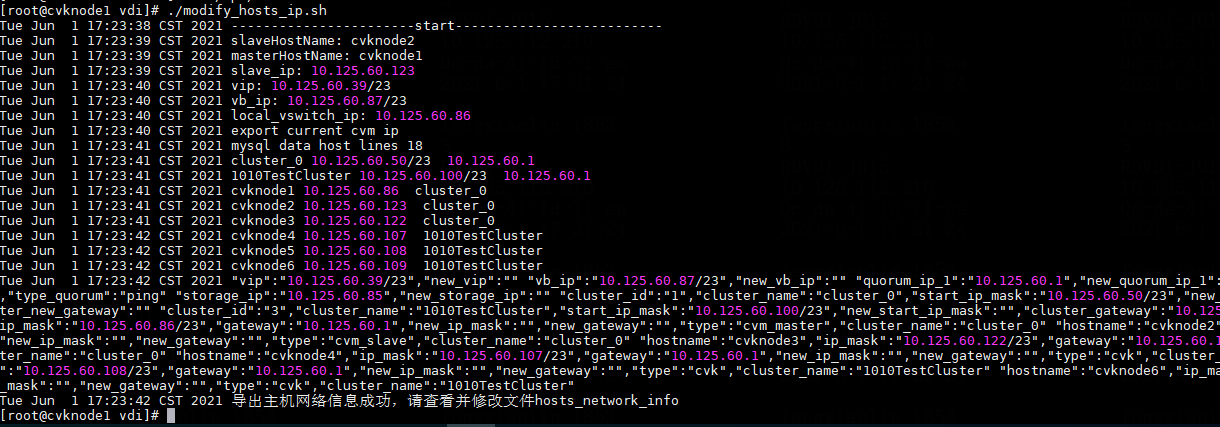
7. Execute the cat hosts_network_info command to view the exported files. This step shows the content of the hosts_network_info file as an example:
"vip":"10.125.60.39/23","new_vip":""
"vb_ip":"10.125.60.87/23","new_vb_ip":""
"quorum_ip_1":"10.125.60.1","new_quorum_ip_1":"","quorum_ip_2":"10.125.112.210","new_quorum_ip_2":"","type_quorum":"ping"
"storage_ip":"10.125.60.85","new_storage_ip":""
"cluster_id":"1","cluster_name":"cluster_0","start_ip_mask":"10.125.60.50/23","new_start_ip_mask":"","cluster_gateway":"10.125.60.1,"cluster_new_gateway":""
"cluster_id":"3","cluster_name":"1010TestCluster","start_ip_mask":"10.125.60.100/23","new_start_ip_mask":"","cluster_gateway":"10.125.60.1,"cluster_new_gateway":""
"hostname":"cvknode1","ip_mask":"10.125.60.86/23","gateway":"10.125.60.1","new_ip_mask":"","new_gateway":"","type":"cvm_master","cluster_name":"cluster_0"
"hostname":"cvknode2","ip_mask":"10.125.60.123/23","gateway":"10.125.60.1","new_ip_mask":"","new_gateway":"","type":"cvm_slave","cluster_name":"cluster_0"
"hostname":"cvknode3","ip_mask":"10.125.60.122/23","gateway":"10.125.60.1","new_ip_mask":"","new_gateway":"","type":"cvk","cluster_name":"cluster_0"
"hostname":"cvknode4","ip_mask":"10.125.60.107/23","gateway":"10.125.60.1","new_ip_mask":"","new_gateway":"","type":"cvk","cluster_name":"1010TestCluster"
"hostname":"cvknode5","ip_mask":"10.125.60.108/23","gateway":"10.125.60.1","new_ip_mask":"","new_gateway":"","type":"cvk","cluster_name":"1010TestCluster"
"hostname":"cvknode6","ip_mask":"10.125.60.109/23","gateway":"10.125.60.1","new_ip_mask":"","new_gateway":"","type":"cvk","cluster_name":"1010TestCluster"
8. Enter values for the fields in red in the previous step as needed. Keep other fields unchanged. The field description is as shown in Table 15.
|
Field |
Description |
|
new_vip |
Virtual IP in the format of IP/mask. This field is available in the stateful failover scenario. |
|
new_vb_ip |
Service network virtual IP in the format of IP/mask. |
|
new_quorum_ip_1 |
IP address of quorum node1 for the stateful failover system. This field is available when the Ping quorum mode is specified in the stateful failover scenario. |
|
new_quorum_ip_2 |
IP address of quorum node2 for the stateful failover system. This field is available when the Ping quorum mode is specified in the stateful failover scenario. |
|
new_storage_ip |
Storage virtual IP. This field is available in the stateful failover scenario. |
|
new_start_ip_mask |
Start management network segment in a cluster in the format of IP/mask. If multiple clusters are configured in the HCI scenario, the file displays this field for each cluster. |
|
cluster_new_gateway |
IP address of the gateway for the management network in a cluster. If multiple clusters are configured in the HCI scenario, the file displays this field for each cluster. |
|
new_ip_mask |
Host IP in the format of IP/mask. |
|
new_gateway |
Host gateway IP. |
9. Based on the example and field description from the previous step, execute the vim hosts_network_info command and press i to edit the file. The following is an example:
Figure 156 File content before modification
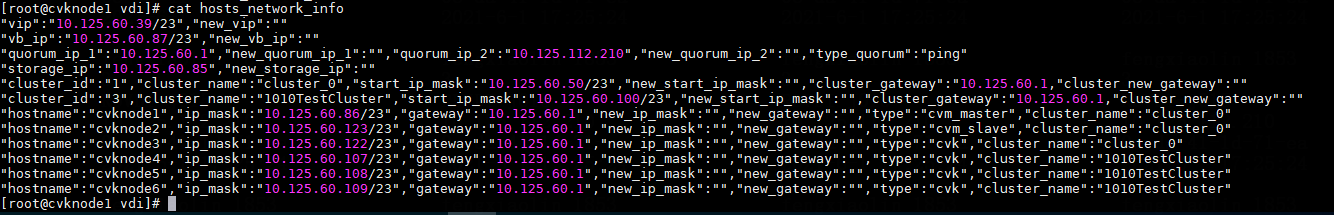
a. Change the service network VIP to 10.125.60.89/23 by specifying 10.125.60.89/23 for the new_vb_vip field.
b. Change the storage VIP to that in step 3 and enter 10.125.60.37 for the new_storage_ip field.
c. Change the IP address of cvknode1 to 10.125.60.36/23 and enter 10.125.12.37/22 for the new_ip_mask field.
d. Edit cvknode5 in the same way as you edit cvknode1.
Figure 157 File content after modification
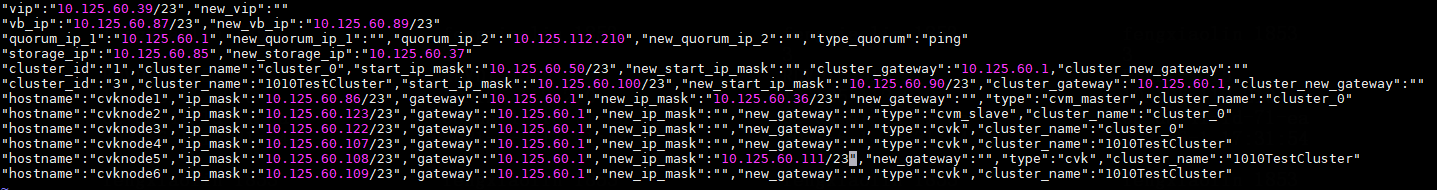
10. After you edit the hosts_network_info file, execute the :wq! command and press Enter to save the changes. Execute the ./modify_hosts_ip.sh hosts_network_info command to implement the modification.
Figure 158 Executing the modification command
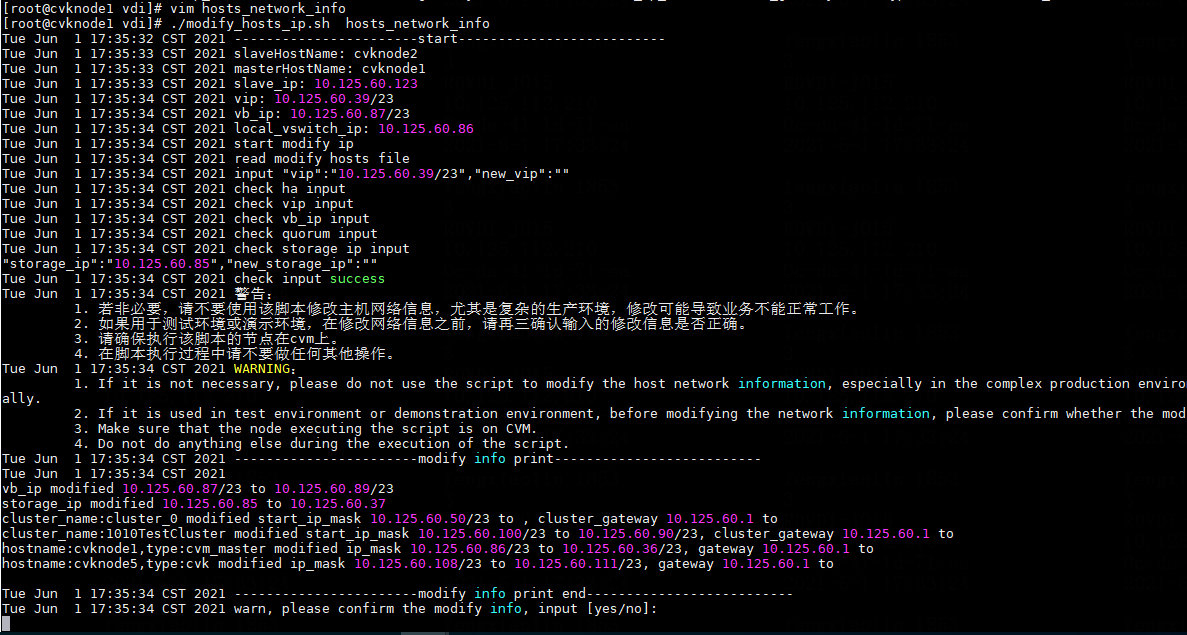
11. The information to be edited is automatically output in the window. Verify the information, and then enter yes as prompted to start the modification. The host restarts automatically after the modification.
Figure 159 Verifying the modification
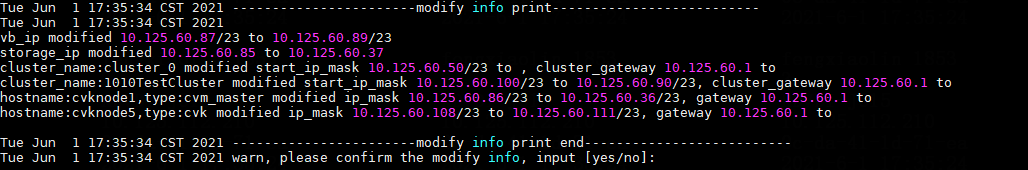
|
|
CAUTION: Make sure the correspondence between nodes and new IPs are the same as the configuration in step 3. |
12. If ONEStor has a monitor node, edit the network information in the /etc/sysconfig/network-scripts/ifcfg-vswitch0 file on the monitor node, and then execute the service network restart command to restart the network.
13. Execute the command for editing the ONEStor IP on the current worker node of ONEStor: onestor modify modify_ip modify.
|
|
NOTE: Execute the onestor modify modify_ip modify command after the network changes are completed |
Figure 160 Editing the ONEStor IP successfully
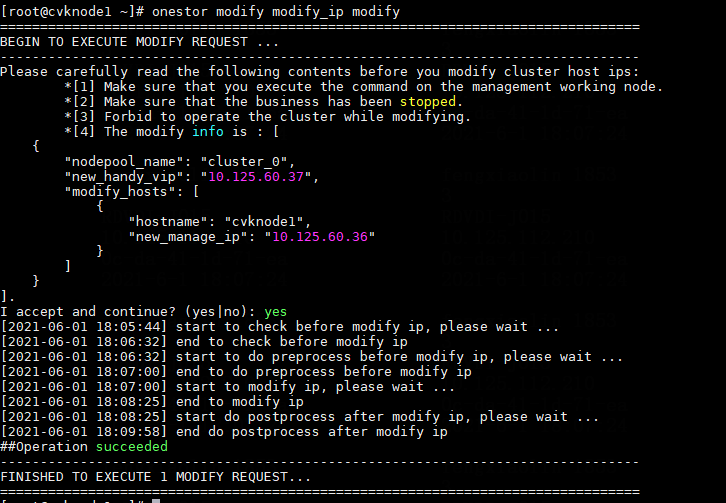
Restoring the environment
1. In the HCI scenario, navigate to Virtualization > Distributed Storage page to edit the handy IP, and then synchronize ONEStor settings.
2. Log in to Space Console. From the left navigation pane, select Data Center > Virtualization > Cluster name. Click More, and then select Connect to All Hosts. Then, click Exit Maintenance Mode on the page of each host.
3. If a host heartbeat alarm occurs on Space Console, execute the service cas_mon restart command on the management node to restore the host heartbeat.
4. Re-add non-local storage and non-local image storage and dual-host storage that have been deleted in "Prerequisites." To add non-local storage, go to the Data Center > Virtualization page on Space Console. To add non-local image storage, go to the Images > Image Pools page on Space Console. To add dual-host storage, go to the System > Failover System Management > Shared Storage page on Space Console.
|
|
NOTE: When you re-add dual-host shared storage, an error message appears indicating that the template storage target path is already in use and you need to change the target path. In this case, rename the original target path at the back end of Space Console to ensure that the target path is unique. |
5. On the System > Advanced Settings > System Parameters > Basic Parameter Settings page, edit the IP address of the BT server.
6. If the campus space is deployed in the teaching scenario, navigate to the Applications > Campus Space page to enable the campus space.
7. If Space Center has managed the Space Console, manage the Space Console again on Space Center.
8. If the security gateway is configured, execute the gateway proxy -c new_ip command on the security gateway, where new_ip represents the new IP address of the Space Console.
Changing the Space Console IP address (before initial deployment)
|
|
NOTE: To access HDM on a PC, you must install the Java environment. |
1. Log in to HDM for the management node host, open the Java console in Remote Services > Remote Console.
The page will prompt you to download the jnlp file. In some versions of the server, the downloaded file is in txt format and must be manually changed to jnlp format.
Figure 161 Downloading the jnlp file

2. In Control Panel > Java > Security, click to edit the site list, as shown in the following figure.
Figure 162 Editing the site list
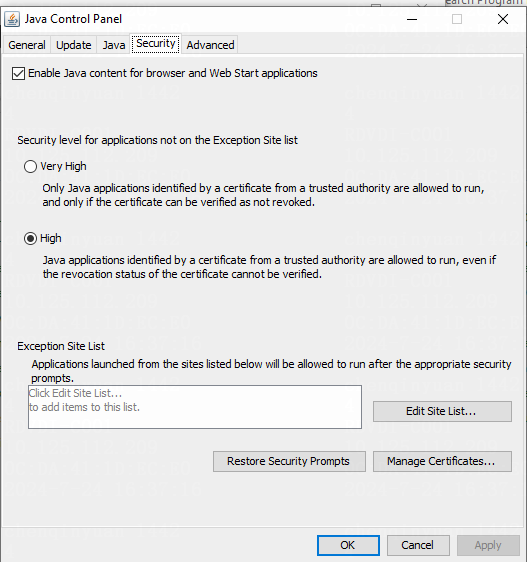
3. Click Add to add the address of the server HDM. Click Apply to make the changes take effect, and then click OK.
Figure 163 Adding the server HDM address to the exception
4. Open the jviewer.jnlp file. For the pop-up security warning, select Continue and Run. Enter the console as shown in the following figure.
Figure 164 Security warning
Figure 165 Security warning
5. Enter the console as shown in the following figure.
Figure 166 Opening the console
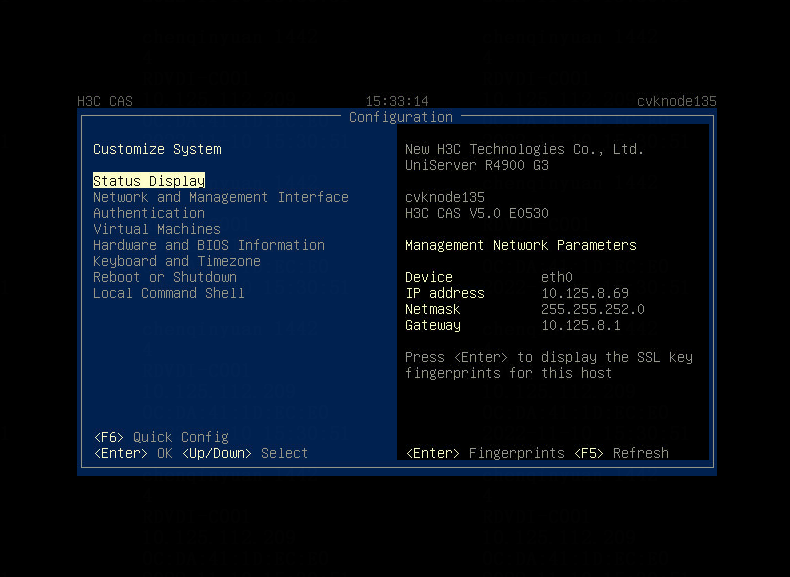
6. Access Network and Management Interface > Configure Management Interface. If the host is not initialized, you will be prompted to enter the account and password. The default account and password for uninitialized servers are root and Sys@1234, respectively.
7. Select the connected interface and modify the Space Console IP.
Changing the Controller IP for client connection
1. The client can automatically discover Space Consoles, as shown in the following figure. The client will list the IP addresses of the discovered Space Consoles, and users can choose the IP address to connect to as needed.
Figure 167 Automatic discovery of Space Console IP addresses
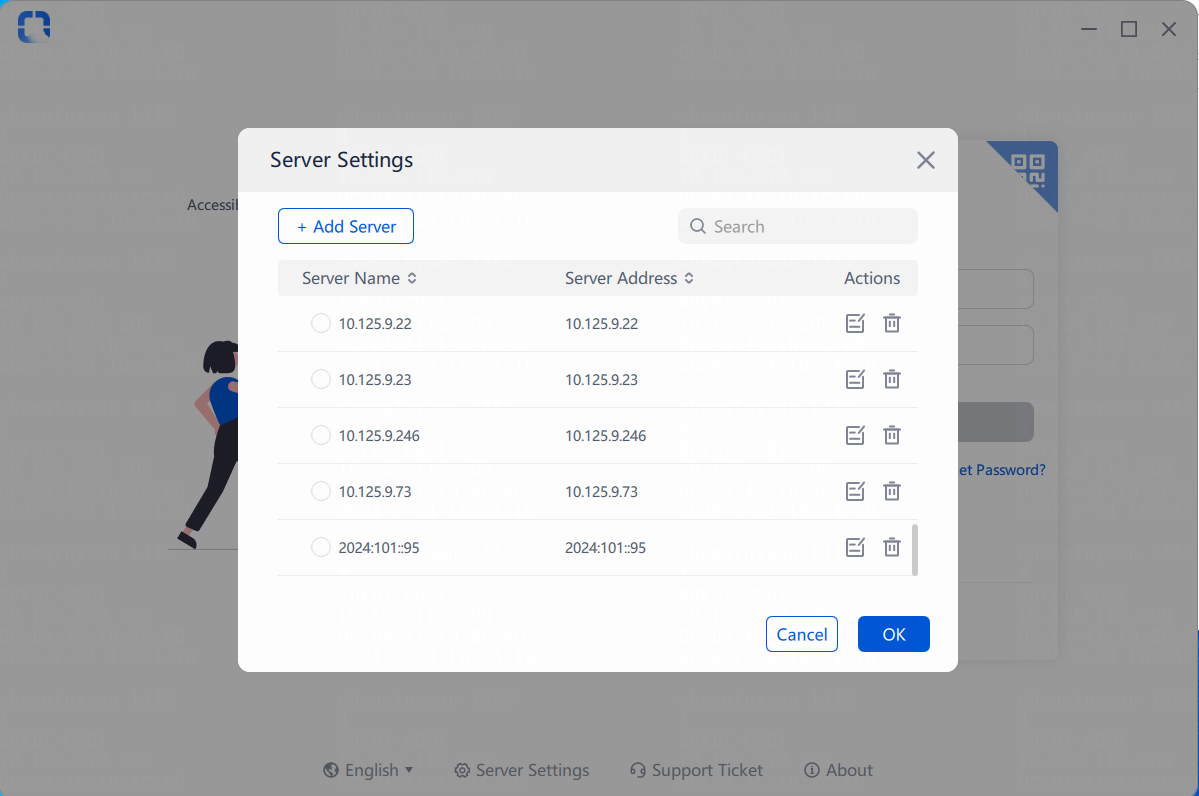
2. If the target Controller IP (the server IP) cannot be found due to a network failure, click Add to add the Controller IP.
Figure 168 Adding a Controller IP
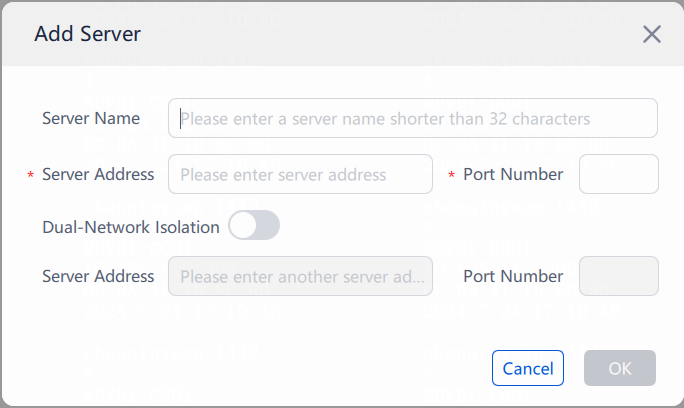
Changing the Controller IP address on the Agent
1. Access the local endpoint and go to the C:\Program Files (x86)\H3C\VdiAgent\conf directory. Find the grpc_config.cfg file in the following directory:
¡ In versions earlier than E2005, the directory varies by desktop type as follows:
- VDI desktops: C:\Program Files (x86)\H3C\VdiAgent\conf
- Physical hosts: C:\Program Files (x86)\H3C\PcAgent\conf
- VOI/TCI desktops: C:\Program Files (x86)\H3C\voiAgent\conf
- IDV desktops: C:\Program Files (x86)\H3C\idvAgent\conf
¡ In E2005 and later: C:\Program Files (x86)\H3C\VmAgent\conf
Figure 169 Accessing the conf directory (VDI desktop)
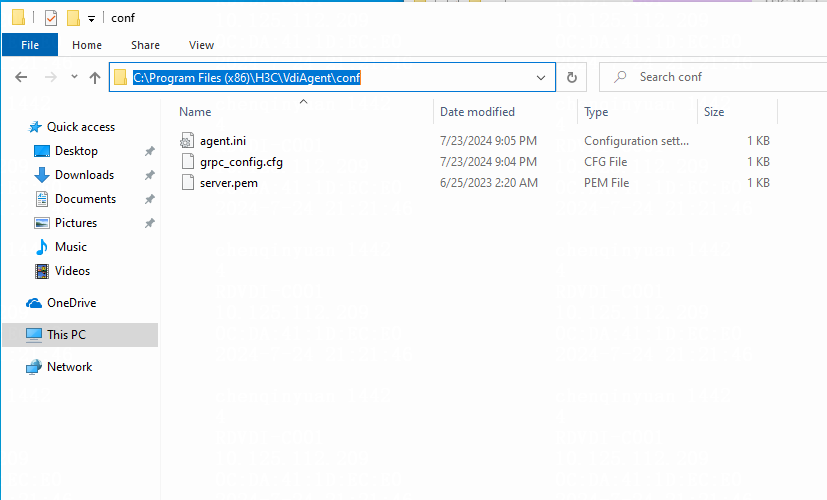
2. Change the value for the GrpcAddress field in the grpc_config.cfg file and save the change.
Figure 170 Changing the GrpcAddress field
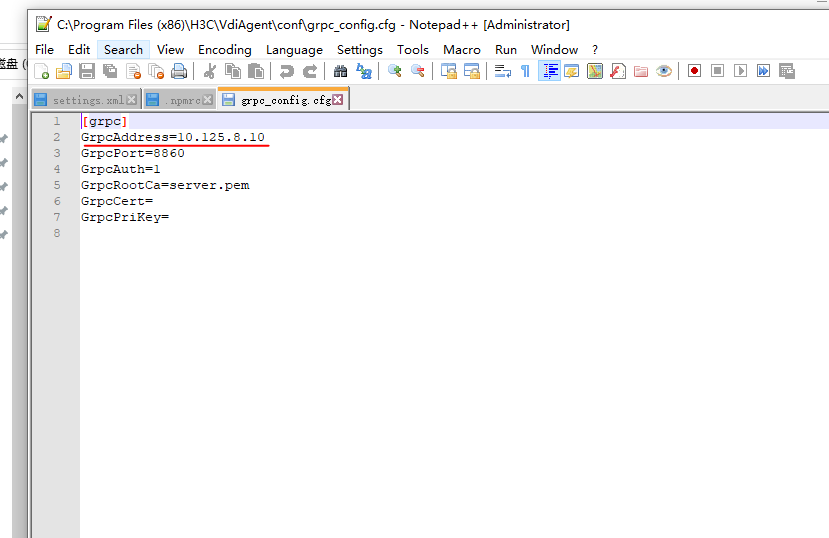
Changing the HDM IP address
1. Log in to the server HDM Web interface. For a new server, the default HDM address is usually 192.168.1.2, which is marked on the server chassis. Make sure the host used to access the HDM Web interface uses an IP address on the same subnet. The default username and password are admin and Password@_, respectively.
Figure 171 Logging in to the HDM
2. On the Network > Dedicated Port > Configure tab, enable IPv4 configuration, disable DHCP, set the gateway and subnet mask according to specific requirements, and click Save.
Figure 172 Configuring the HDM IP address
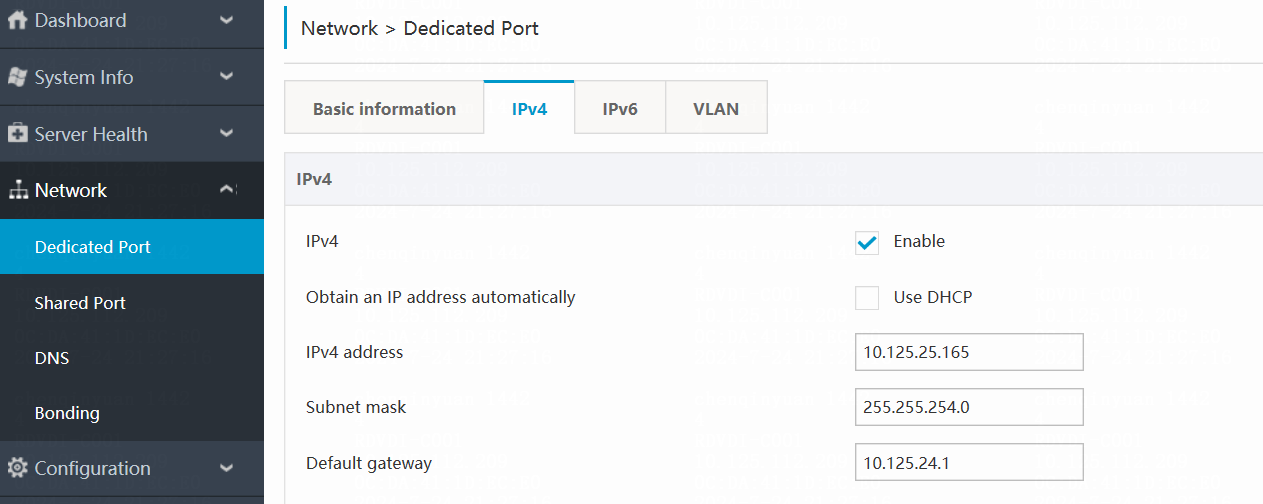
3. The specific operations may vary depending on the server model and version, but the process remains the same.
Editing the Docker subnet
The Docker component in Workspace uses the 172.17.0.0/16 subnet by default. Therefore, avoid using this subnet during network planning to prevent conflicts and deployment failures. If network planning must use the default Docker subnet, use this section to edit the Docker subnet.
Restrictions and guidelines
· The Docker subnet to be modified must be unused in the environment.
· When Space Console is initialized and the Docker subnet is edited, you can add service nodes directly without editing the Docker subnet further. To add a backup management node:
¡ In E1xxx versions, edit the Docker subnet before adding the backup management node in the same way you add the primary management node.
¡ In E2xxx versions, add the Docker subnet on the primary management node, and then execute the related commands to synchronize the Docker subnet on the primary management node to the backup management node.
· A service node does not run the Docker service. You can delete the unused docker0 network interface. To delete the Docker network on a service node, either restart the service node server or execute the following two commands in sequence on the service node:
¡ ifconfig docker0 down
¡ brctl delbr docker0
· If management data is migrated from an E1xxx version to an E2xxx version, the modified Docker subnet in the E1xxx version will restore to 172.17.0.0/16.
E1xxx versions
|
|
CAUTION: · Before Space Console initialization, to edit the Docker subnet, edit it on each server. After Space Console initialization, to edit the Docker subnet, edit it only on the management nodes. · After the stateful failover system is set up, you can edit the Docker subnet only on the primary management node. On the backup management nodes, you only need to add the same SNAT rules as the primary management node, as described in step 4 in this section. · In the stateful failover scenario, before editing the Docker subnet, make sure the /etc/hosts file on the primary management node contains the names and IP addresses of the backup management nodes. |
1. Access the /etc/docker directory at the back end and identify whether daemon.json exists. If daemon.json does not exist, create it.
2. Execute vim daemon.json to edit the file content. Change the subnet to the planned one and save the configuration. This step uses 192.168.0.1/24 as an example. Then, execute cat daemon.json to verify the change.
3. Execute service docker restart to restart the Docker service.
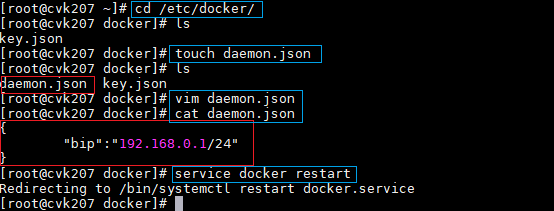
4. Execute iptables-save -c. The output shows a new SNAT rule in addition to the default 172.17.0.0/16 SNAT rule. The new rule is [0:0] -A POSTROUTING -s 192.168.0.0/24 ! -o docker0 -j MASQUERADE. If the new rule is displayed, execute iptables -t nat -A POSTROUTING -s 192.168.0.0/24 ! -o docker0 -j MASQUERADE to add the rule, and execute iptables-save -c again.
|
|
NOTE: In the stateful failover system, you need to add the new rule manually on the backup device. |
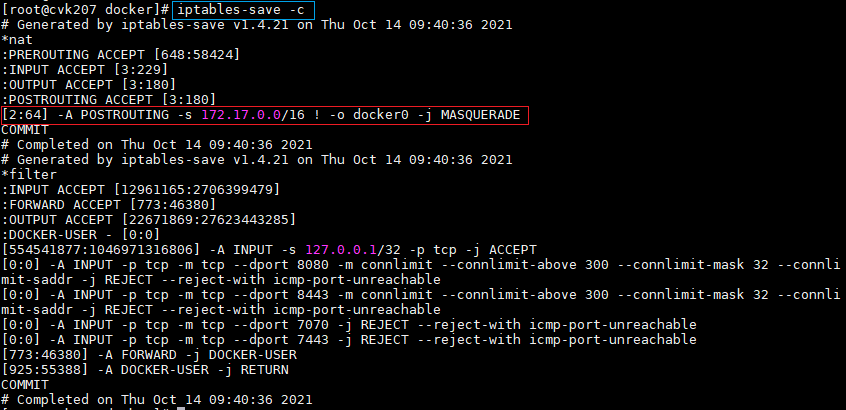
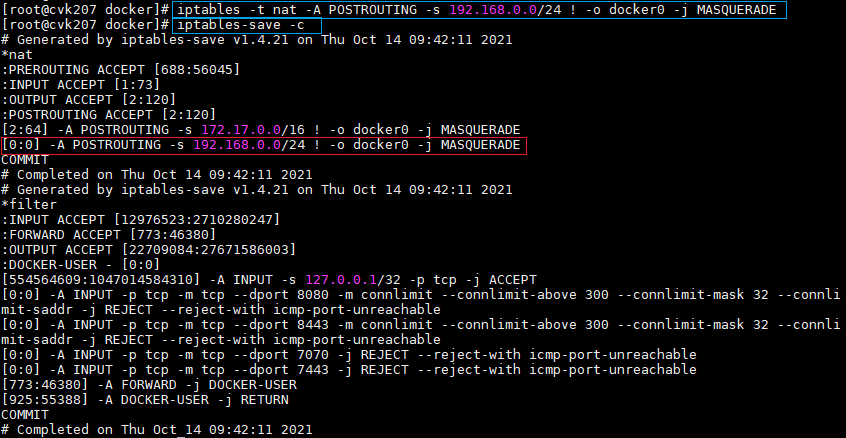
5. Execute vim /etc/cvm/iptables.roles to change the default 172.17.0.0/16 rule in the file to the obtained new rule in step 4.
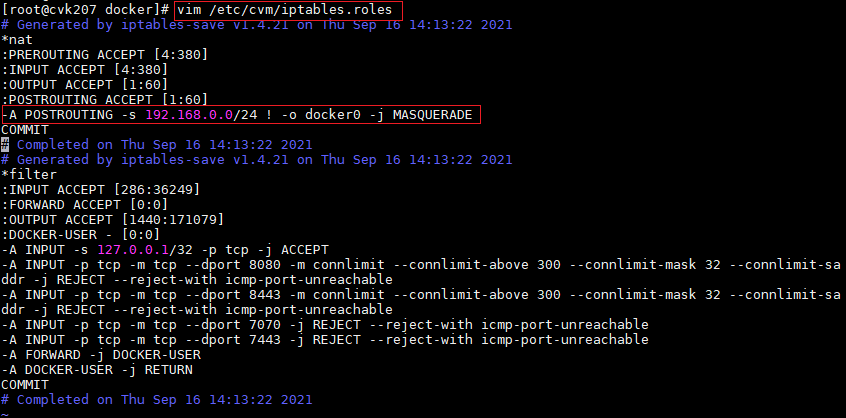
6. Upload the reloadDocker-xxx-X86.tar.gz or reloadDocker-xxx-ARM.tar.gz file to the management node host and execute tar –zxf reloadDocker-xxx.tar.gz to decompress the uploaded file.
|
|
NOTE: Contact Technical Support to obtain the reloadDocker-xxx-X86.tar.gz or reloadDocker-xxx-ARM.tar.gz file, where xxx represents a date. |
7. Access the file decompression path and execute chmod 777 reLoadMain.sh.x to edit the reLoadMain.sh.x file permission.
8. Execute the ./ reLoadMain.sh.x script.
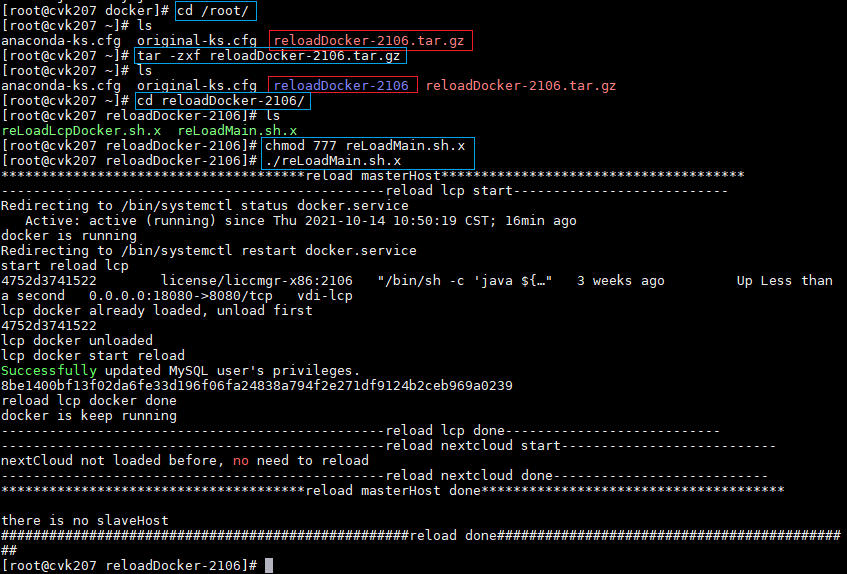
9. Execute ifconfig docker to obtain the Docker IP to identify the subnet in use.
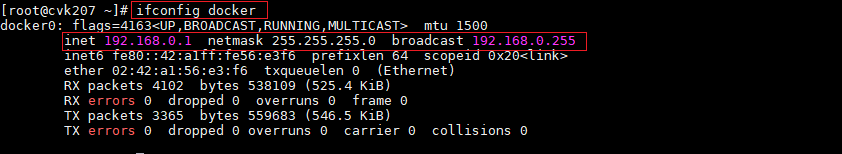
10. Log in to Space Console and connect to the license server. Identify whether licensing is normal and the cloud disk (if enabled) is operating correctly.
E2xxx versions
|
|
CAUTION: You cannot edit the Docker subnet in a version earlier than E2004. |
Editing an IPv4 subnet
You can add a node as a backup management node to set up a stateful failover system. After the setup, perform the following steps on the primary management node to synchronize the Docker subnet changes to the backup management node from the primary management node:
1. Use the SSH tool to access the management node or the primary management node in the stateful failover scenario.
2. Access the /opt/vdi/ directory and execute the ./modify_docker_ip.sh ipv4 192.168.0.1/24 master command. This step changes the Docker subnet to 192.168.0.1/24 as an example.
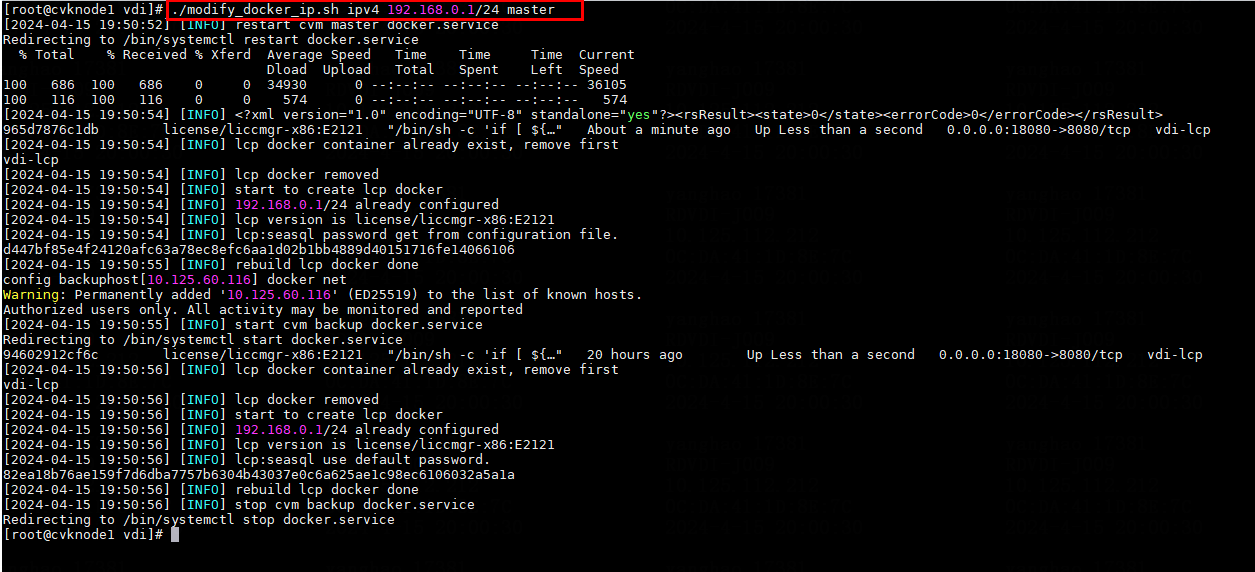
3. Execute cat /etc/docker/daemon.json to verify the change in the Docker configuration file.
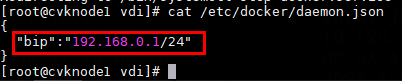
4. Execute docker inspect bridge to identify whether the Docker network settings and container network are correct.
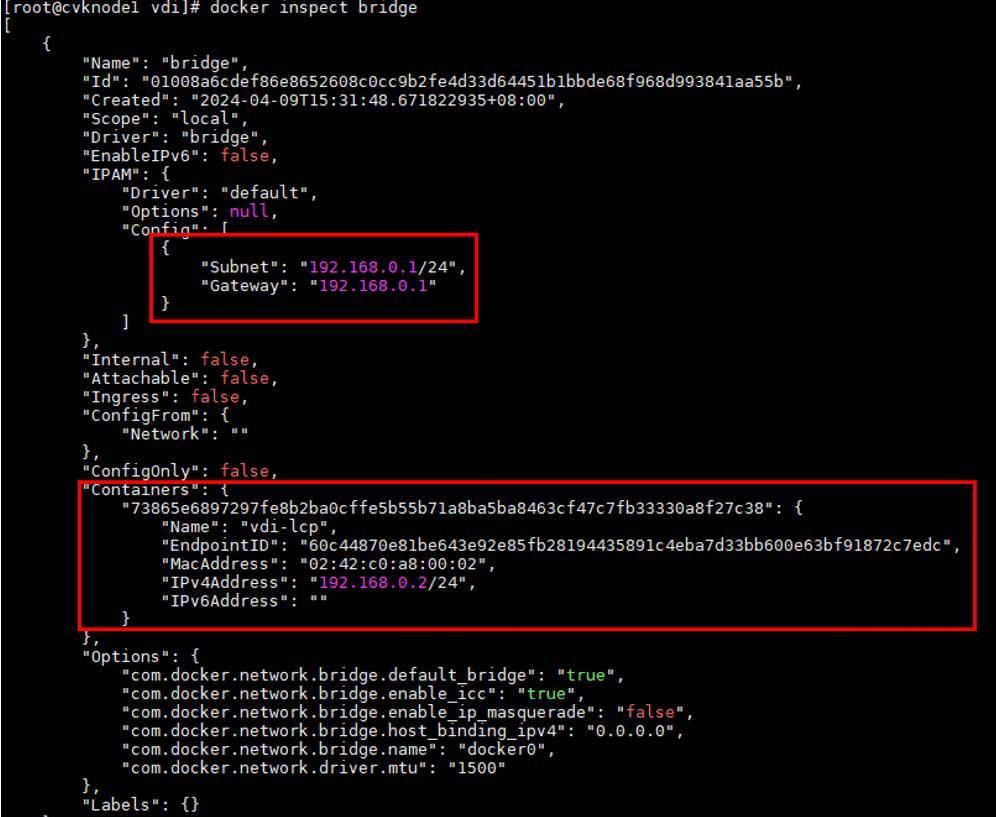
5. Log in to Space Console and connect to the license server. Then, identify whether licensing is normal.
Editing an IPv6 subnet
You can add a node as a backup management node to set up a stateful failover system. After the setup, perform the following steps on the primary management node to synchronize the Docker subnet changes to the backup management node from the primary management node:
1. Use the SSH tool to access the management node or the primary management node in the stateful failover scenario.
2. Access the /opt/vdi/ directory and execute the ./modify_docker_ip.sh ipv6 2024:2024:10::/64 master command. This step changes the Docker subnet to 2024:2024:10::/64 as an example.
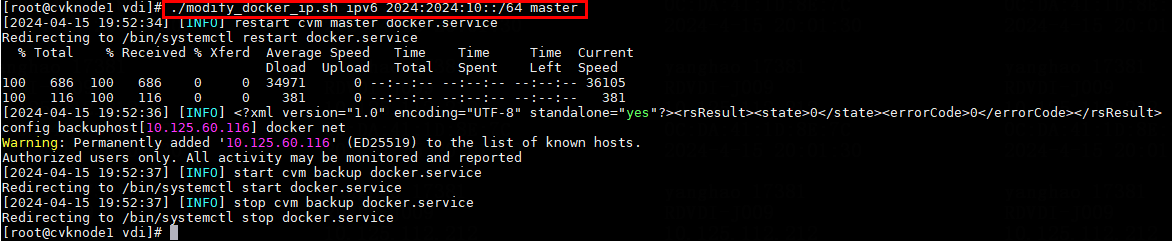
3. Execute cat /etc/docker/daemon.json to verify the change in the Docker configuration file.
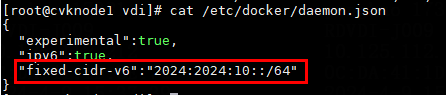
4. Execute docker inspect bridge to identify whether the Docker network settings and container network are correct.
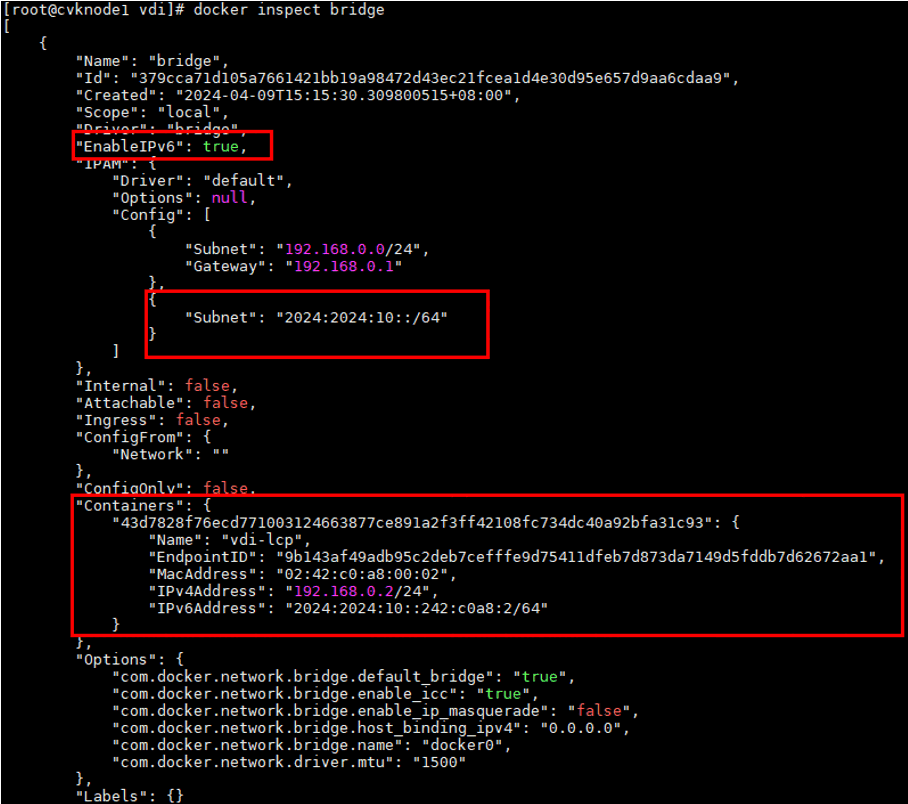
5. Log in to Space Console and connect to the license server. Then, identify whether licensing is normal.
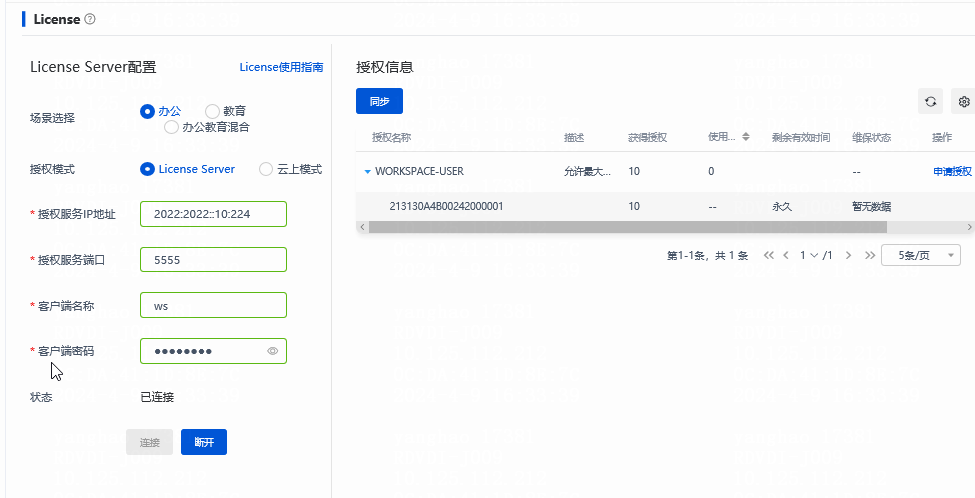
Replacing the Space Console certificate
Versions earlier than E2004
To replace the Space Console certificate, prepare a .crt file (digital certificate) and a .key file (private key) in advance.
1. Access the back end of the management node via SSH and back up source files server.crt and server.key in the /etc/nginx/certificate directory.
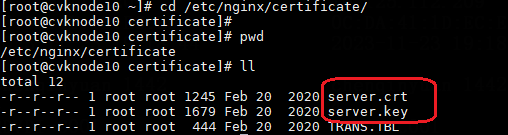
2. Rename the new certificate file and private key file to server.crt and server.key, respectively, and then save them to the /etc/nginx/certificate directory.
3. Execute the service nginx reload command to reload the nginx component.
E2004 and later
Prepare a certificate file suffixed with .pem.crt, or .cer and a private key file suffixed with .pem or .key in advance.
1. Log in to Space Console. From the left navigation pane, select System > Advanced Settings > System Parameters.
2. Click Edit at the lower left corner. Select https for the Access Protocol field, upload the certificate file and private key file, and then click Save.
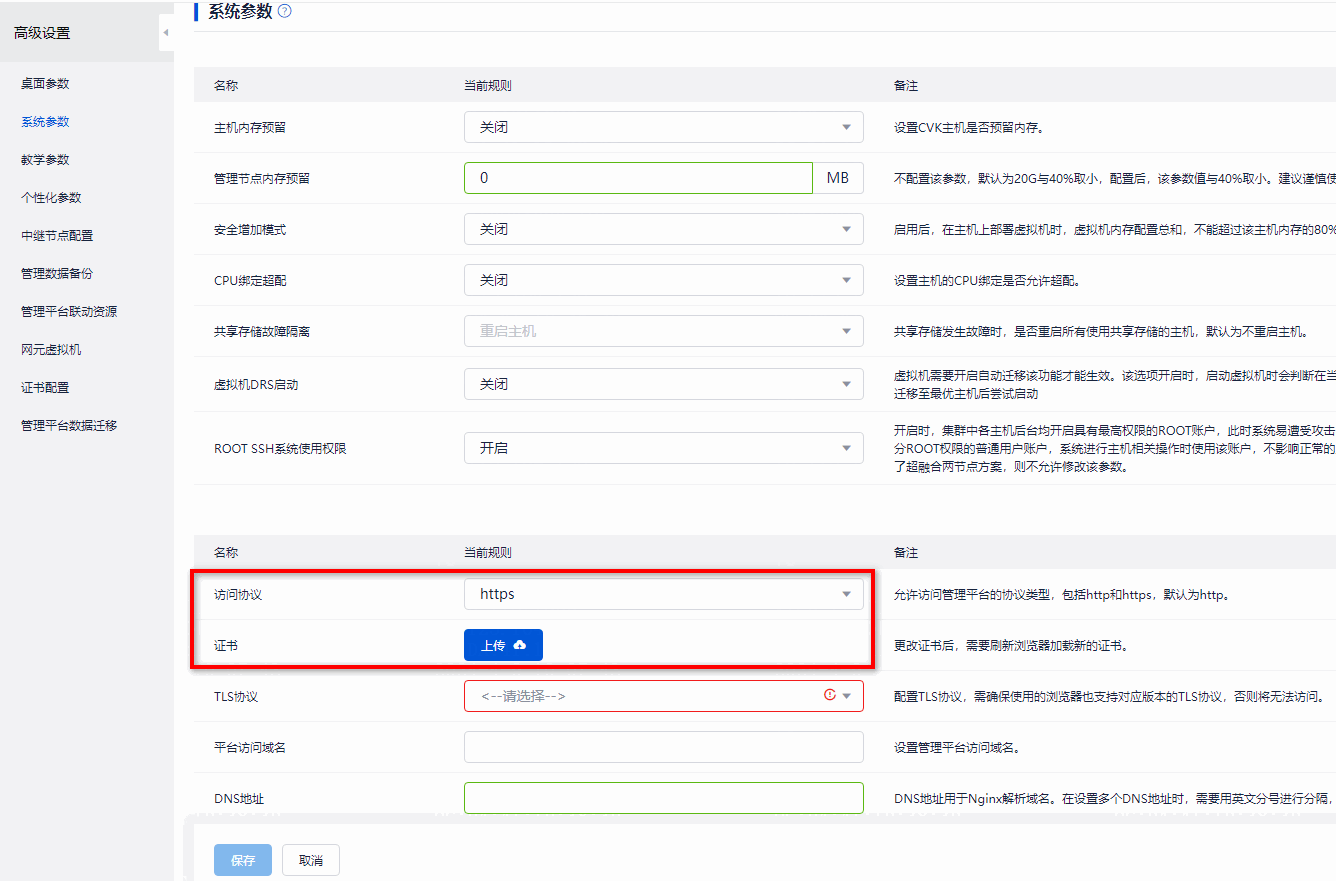
Endpoint replacement
|
|
CAUTION: · Be sure to remind users to back up their data and stop their services before replacing the endpoint. · In the office scenario, record the endpoint group where the old endpoint is located before replacement. · In the education scenario, record the MAC address of the old endpoint before replacement. |
3. Turn off the old endpoint and unplug the network cable.
4. After the new endpoint starts up, check the network connection, and ensure the consistency between SpaceOS system version, client version, and Space Console version.
5. Perform the following operations depending on the scenario:
¡ In the office scenario, if the endpoint group is configured with an IP subnet, the Space Console will automatically assign the endpoint to the corresponding group based on the endpoint's IP address. If the endpoint group is configured with an IP subnet, you must manually add the new endpoint to the group where the old endpoint is located. For VOI or IDV endpoints, you must also add the new endpoint to the corresponding desktop pool and authorize users.
¡ In the education scenario (after class), on the endpoint deployment page of the teacher client, remove an old endpoint based on the MAC address of the old endpoint. Then, search for and add a new endpoint, and click OK to complete the replacement. For VOI endpoints, you must also add the new endpoint to the endpoint group matching client Learningspace on the Space Console's endpoint group page, and then add the endpoint to the corresponding classroom on the classroom page.
¡ In the education scenario (in class), to replace a currently deployed endpoint with a non-deployed endpoint, use the replacement function. In the endpoint list, click Replace in the Actions column for the endpoint to be replaced. A dialog box that opens will show the MAC addresses of both the old and new endpoints. Then, click Finish.
Replacing the teacher endpoint and changing an endpoint classroom (in education scenario)
Replacing a teacher endpoint
1. Make sure the new teacher endpoint and the student endpoints are on the same local area network. The new teacher endpoint is not required to use the same IP address as the old teacher endpoint.
2. Install the Learningspace client on the new teacher endpoint.
3. Open the teacher endpoint, enter the server address in the configuration interface, click to select the classroom, and finally register the classroom.
4. Log in to the teacher portal to access the previously deployed student list. Then, you can proceed with normal operations.
Changing an endpoint classroom
1. Delete the endpoint on the endpoint deployment page of the old teacher endpoint with the endpoint turned on, and click OK. Or, delete the endpoint on the platform classroom page.
2. Make sure the student end is on the deployment waiting page. You can use the reset button on the student end to clear the deployment to ensure that the student end is on the deployment waiting page.
3. Place the endpoint on the same network as the new teacher endpoint and deploy the endpoint through the deployment page of the teacher endpoint.
Replacing a GlusterFS drive (in education scenario)
Restrictions and guidelines
· This section applies to only scenarios where GlusterFS is configured for teaching storage.
· GlusterFS scale-down requires considering the topology type (number of replicas). If it is a 4-server 2-replica setup, scale-down can only be done with two servers together. If the remaining two servers do not have sufficient space, it might cause data loss.
· GlusterFS scale-down requires sufficient space reservation. For example, in a network with four servers and two backups, when you shrink two servers, data loss will occur if the space is insufficient on the remaining two servers.
· During the GlusterFS drive replacement process, make sure no classroom is in session.
· GlusterFS scale-down operation may result in data loss. Back up your data in advance.
Procedure
1. Check the current GlusterFS configuration to confirm its health status.
Figure 173 Viewing the current GlusterFS configuration status
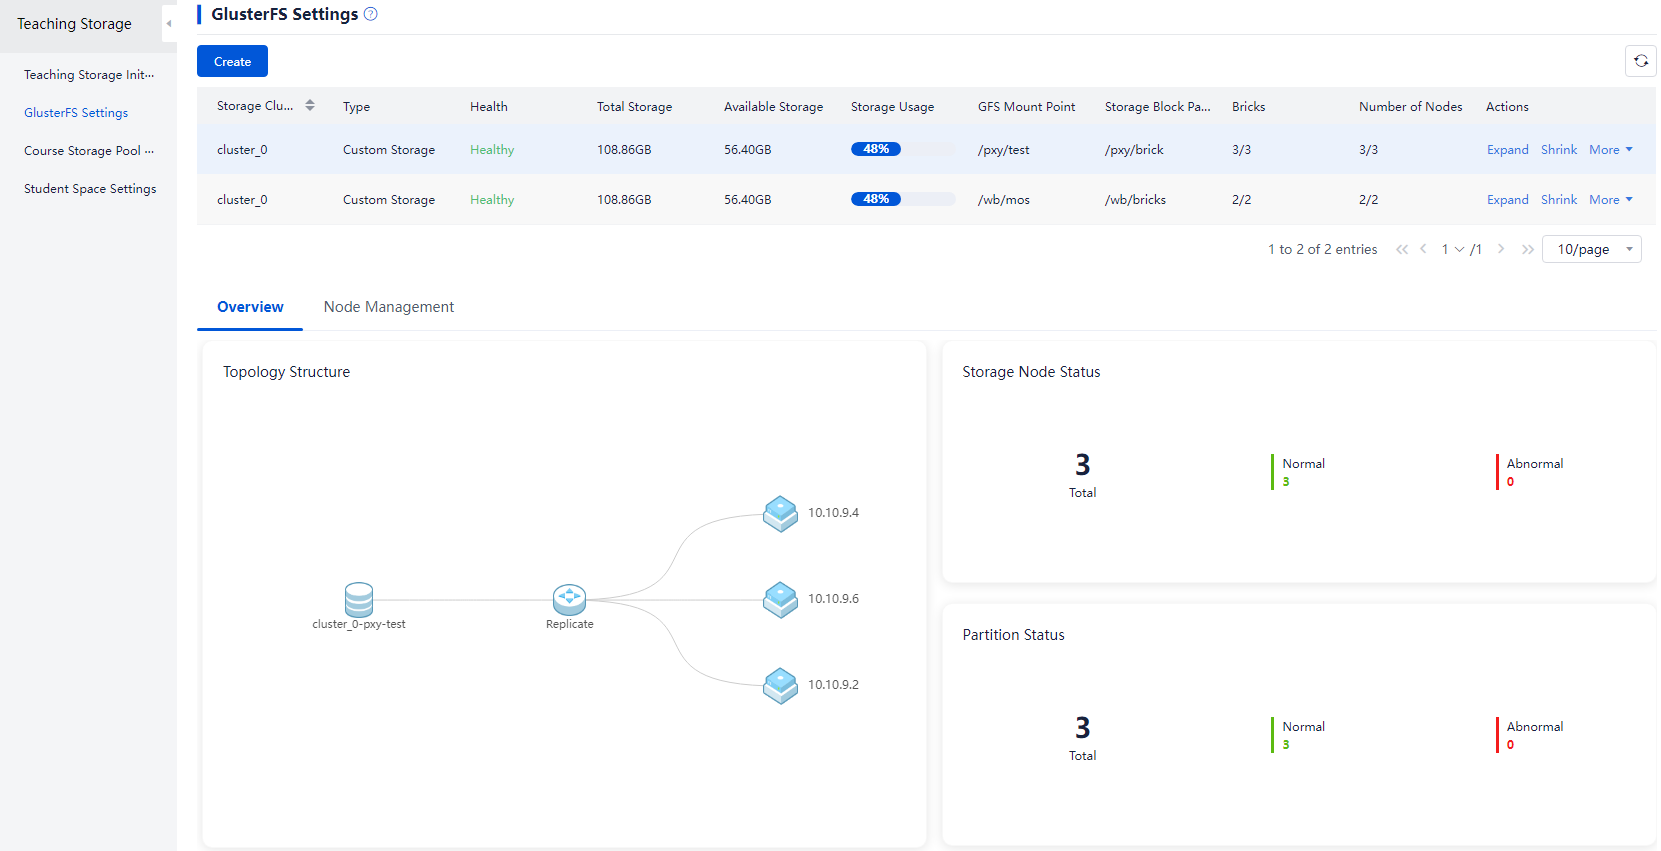
2. View the current teaching image storage configuration to confirm the locations of each storage node in the GlusterFS configuration.
Figure 174 Viewing the current teaching image storage configuration
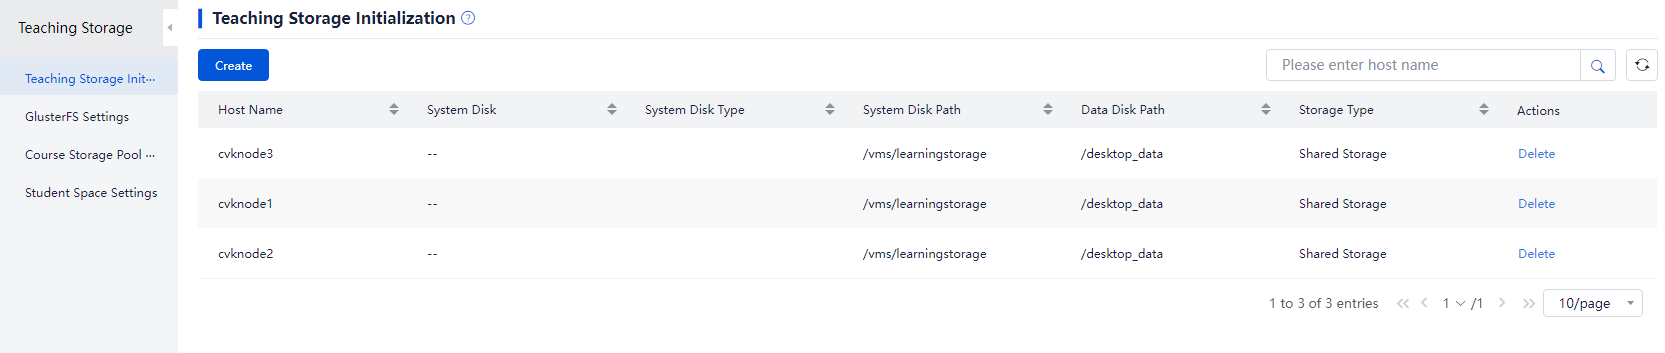
3. Execute the gluster volume info command in the background to check the information of the GlusterFS storage volume, making sure the volume status is normal and data balancing does not exist.
Figure 175 Viewing GlusterFS storage volume information (1)
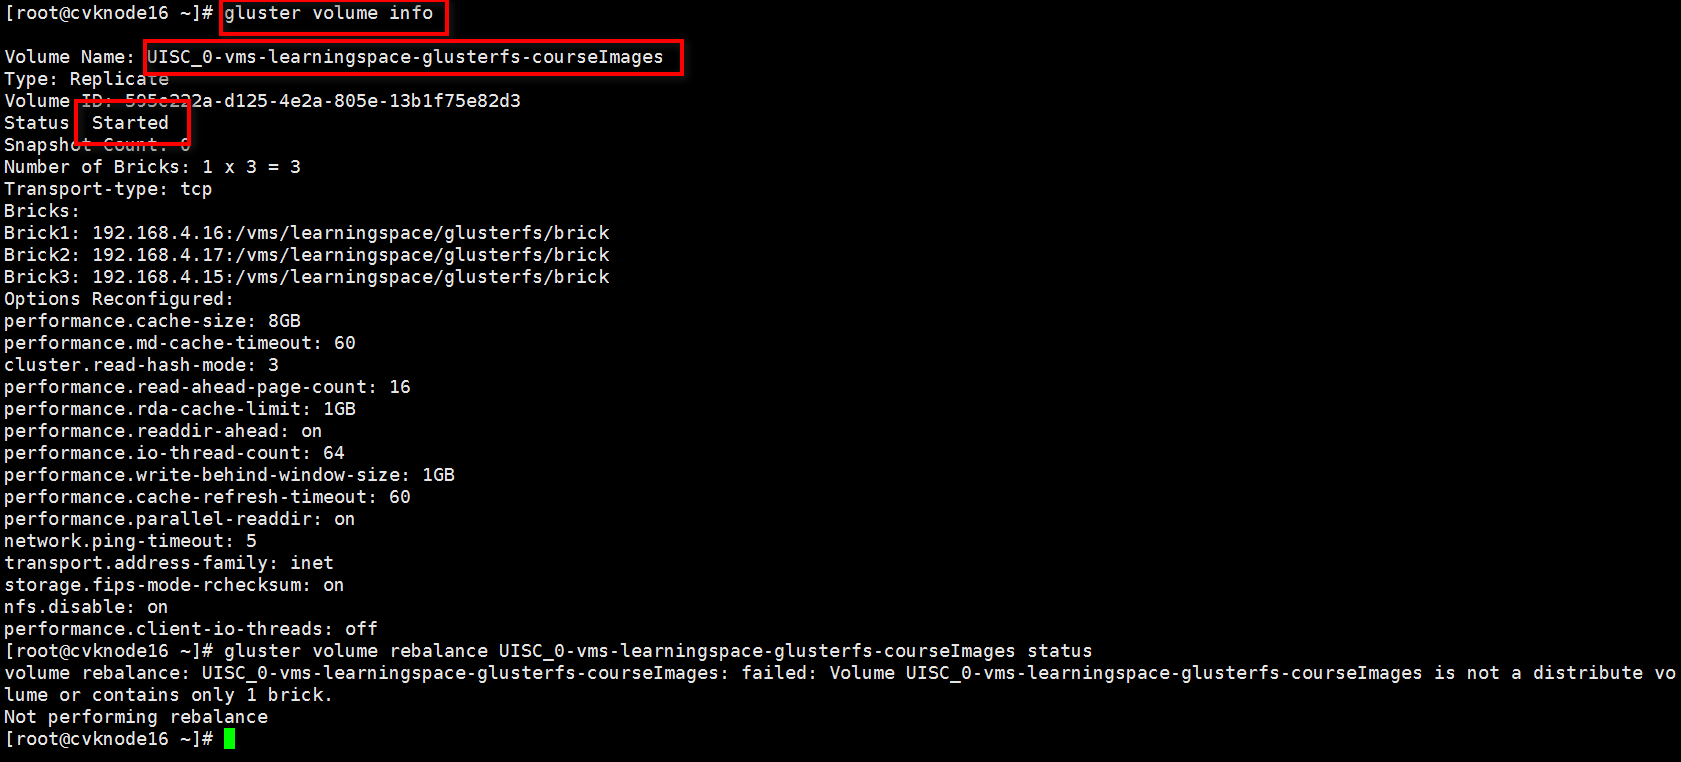
Figure 176 Viewing GlusterFS storage volume information (2)
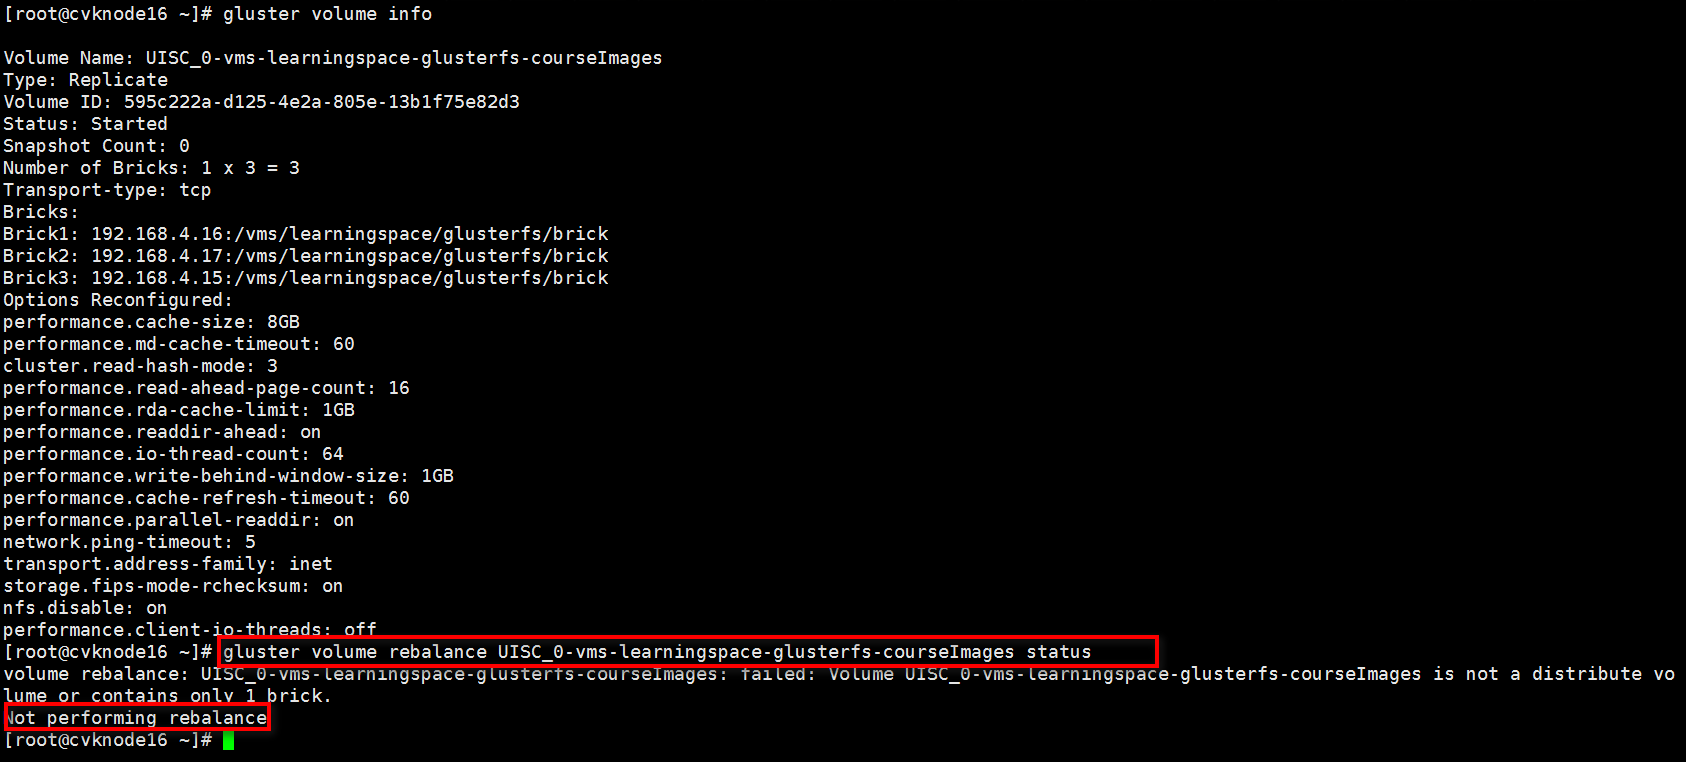
¡ Back up data: Include course images and local disk files on scaled-down hosts.
¡ Back up course images: Enter the course image page, click Download below each course image to download all the course images to your local device.
Figure 177 Downloading course images
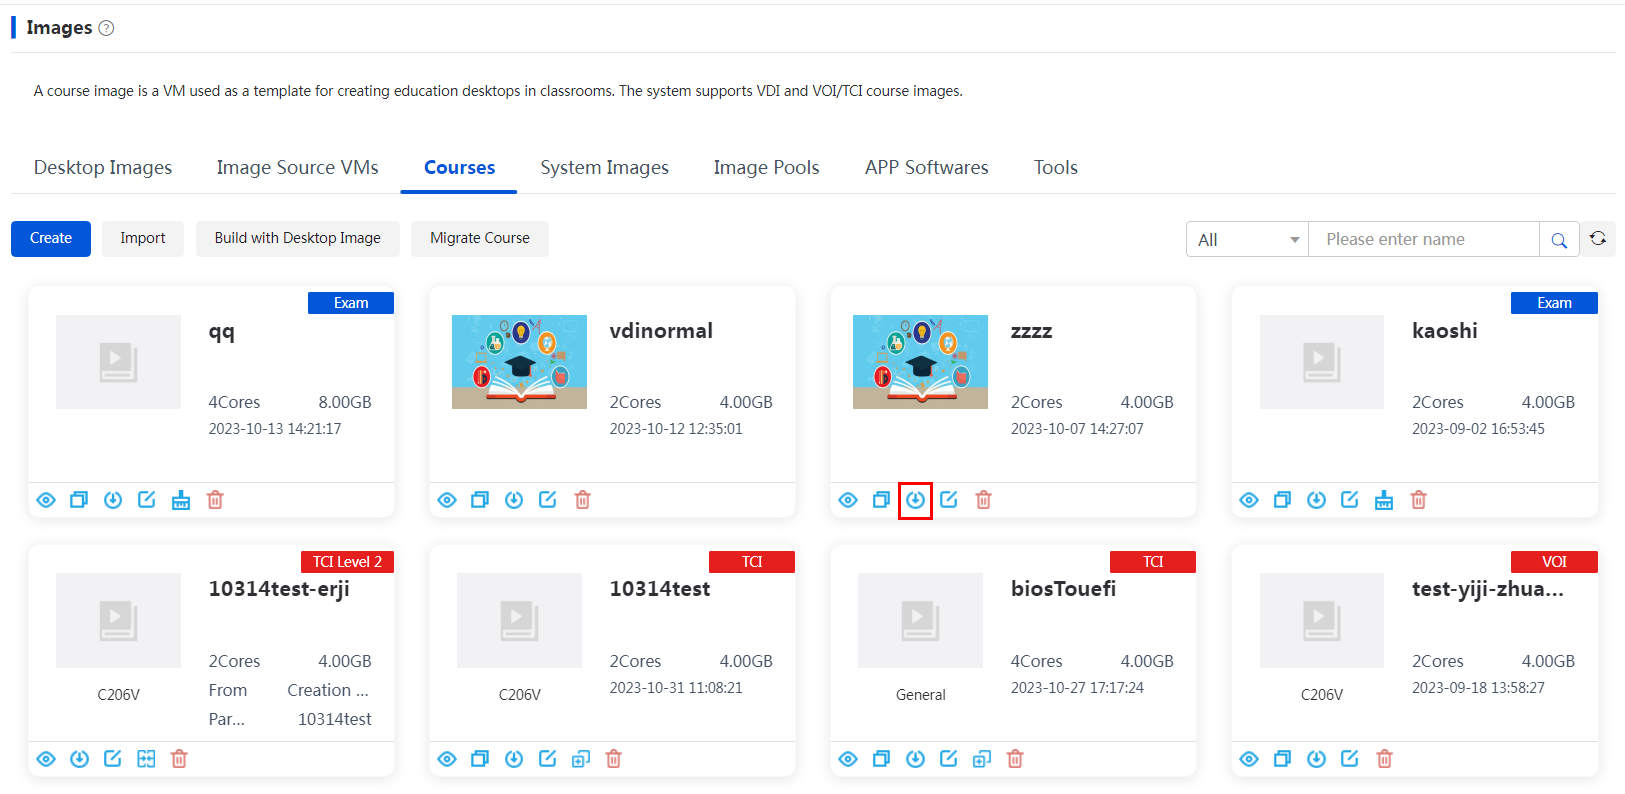
¡ Back up the local disk files on the shinked host (all files mounted under /vms/learningspace/desktop) in foreground or background. The download location for the foreground is shown in the following figure.
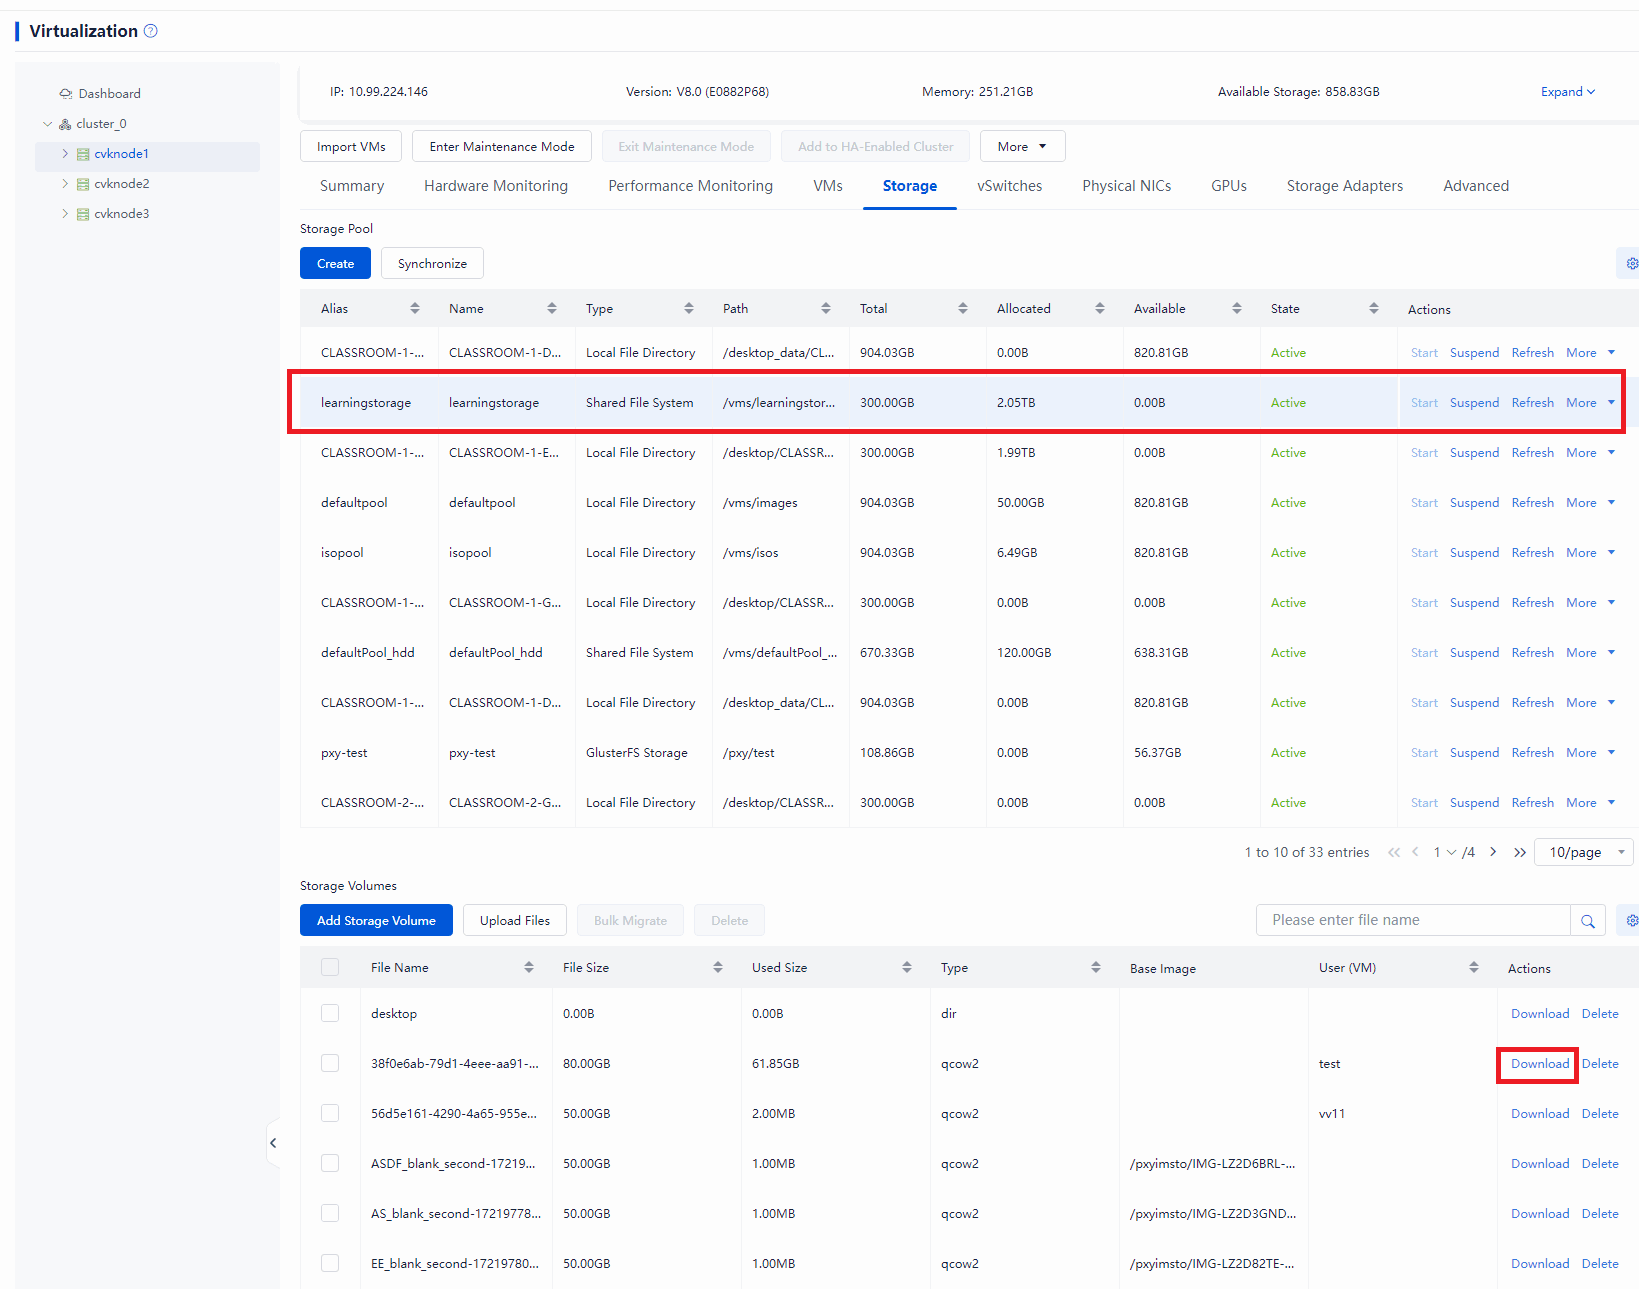
4. Suspend and delete the local storage of the scaled-down host. Log in to Space Console, navigate to Data Center > Virtualization, click the Storage tab under the scaled-down host (cvknode1 in this case), and suspend and delete the storage pool starting with /vms/learningspace in versions earlier than E1015 or delete the storage pool starting with /vms/learningstorage in E1015 and later.
Figure 178 Suspending and deleting local storage of the scaled-down host
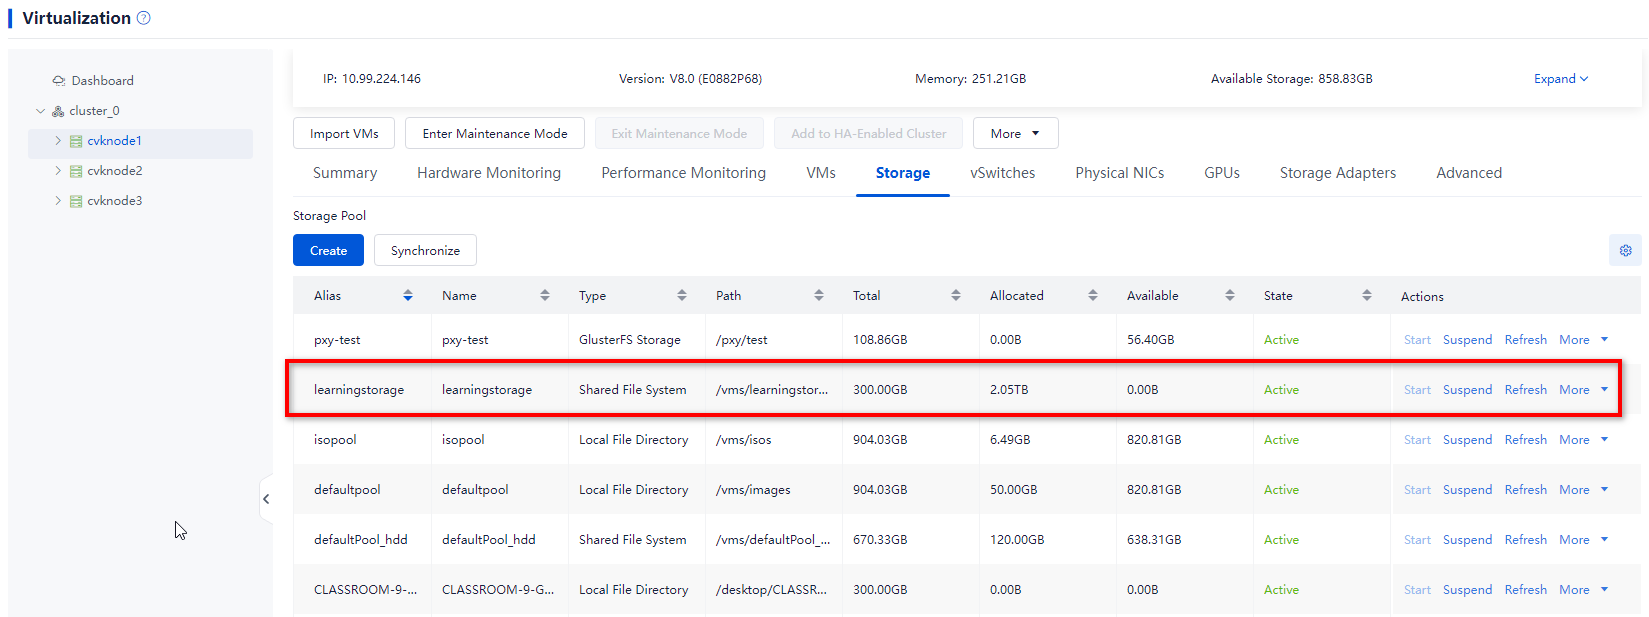
5. Suspend and delete the course_image_local storage pool of the scaled-down host. Log in to the Space Console and navigate to Data Center > Virtualization. Click the Storage tab under the scaled-down host (cvknode1 in this case) and suspend and delete the course_image_local storage pool.
|
|
CAUTION: Before suspending the course_image_local storage pool, confirm that the storage pool is not being used by VMs or other processes. If it is being used, shut down the VMs or exit the relevant processes first. |
Figure 179 Pausing and deleting the course_image_local storage pool of the scaled-down host
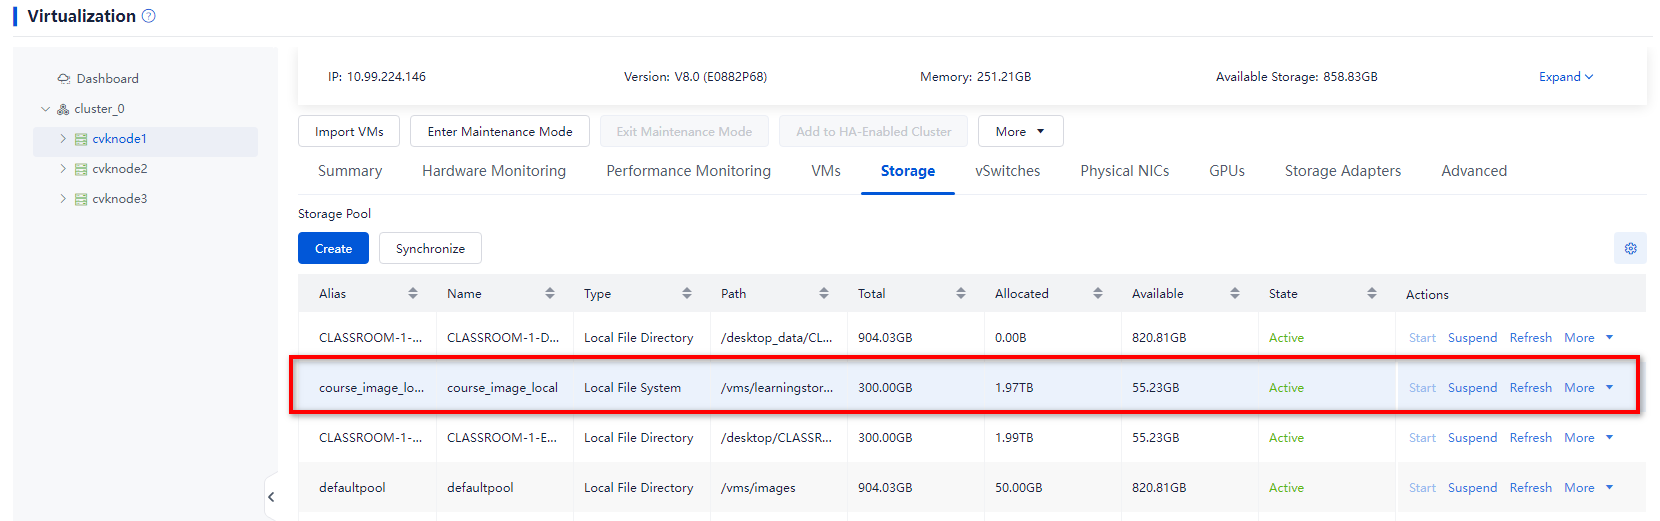
6. Perform appropriate scale-down of GlusterFS storage based on the health status of the storage cluster in the GlusterFS configuration interface.
If the storage cluster is in healthy state, perform the following steps:
a. Log in to the Space Console, select Data Center > Teaching Storage > GlusterFS Settings from the left navigation pane to access the GlusterFS configuration page.
b. Click Shrink in the Actions column of the GlusterFS storage list.
c. Select the storage node host to be deleted and whether to delete the storage pool.
d. Select I am fully aware of the impacts of this operation, enter the current administrator password, and click OK to complete the operation.
Figure 180 Scaling down GlusterFS storage (1)
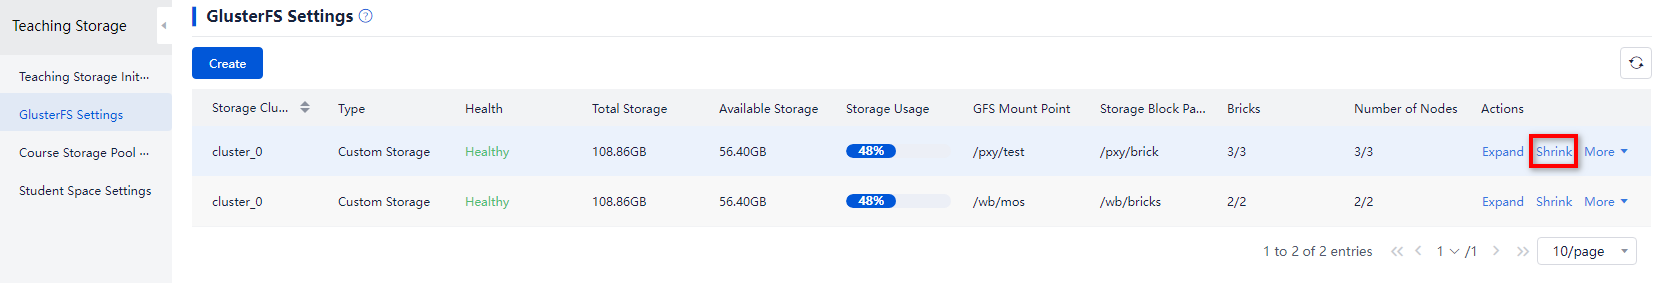
Figure 181 Scaling down GlusterFS storage (2)
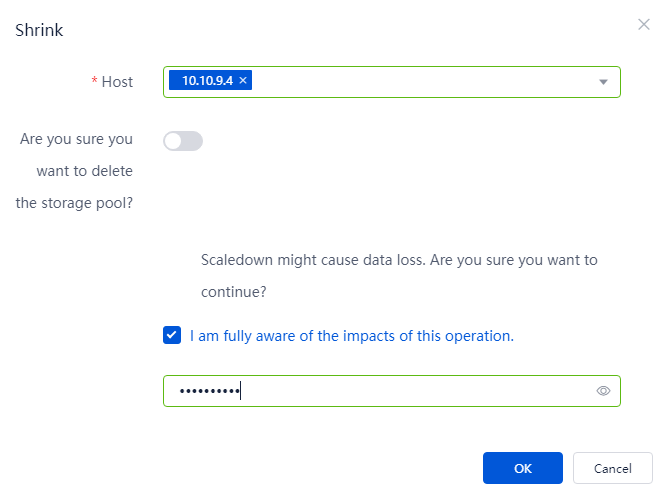
If the storage cluster is in abnormal state:
a. Using the example of a distributed replicated volume for GlusterFS instructional storage with 2 replicas, execute the following command:
gluster volume remove-brick cluster_0-vms-learningstorage-glusterfs-courseImages replica 2 10.10.10.2:/vms/learningstorage/glusterfs/brick 10.10.10.3:/vms/learningstorage/glusterfs/brick force
cluster_0-vms-learningstorage-glusterfs-courseImages is the volume name, 10.10.10.2 and 10.10.10.3 are the IP addresses of the storage nodes to be scaled down, and /vms/learningstorage/glusterfs/brick is the path to the storage block.
Figure 182 Executing the command for scaling down in the background
![]()
Figure 183 Nodes to be scaled down
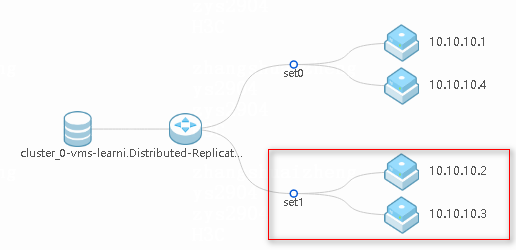
b. After executing the scale-down operation in the background, copy the previously backed up data from the brick directory to the corresponding mount point path.
7. Execute the gluster volume info command in the background to check the information of the GlusterFS storage volume and verify data balancing status to ensure that no data balancing exists.
Figure 184 Viewing information about the GlusterFS storage volume
![]()
8. Delete the teaching image storage of the scaled-down host.
a. Log in to Space Console and select Data Center > Teaching Storage > Teaching Storage Initialization from the left navigation pane to access the teaching image storage configuration page.
b. Click Delete in the Actions column of the teaching image storage list. In the confirmation dialog box that opens, enter DELETE (case-insensitive) and click OK to complete the operation.
Figure 185 Before the teaching image storage of the scaled-down host is deleted
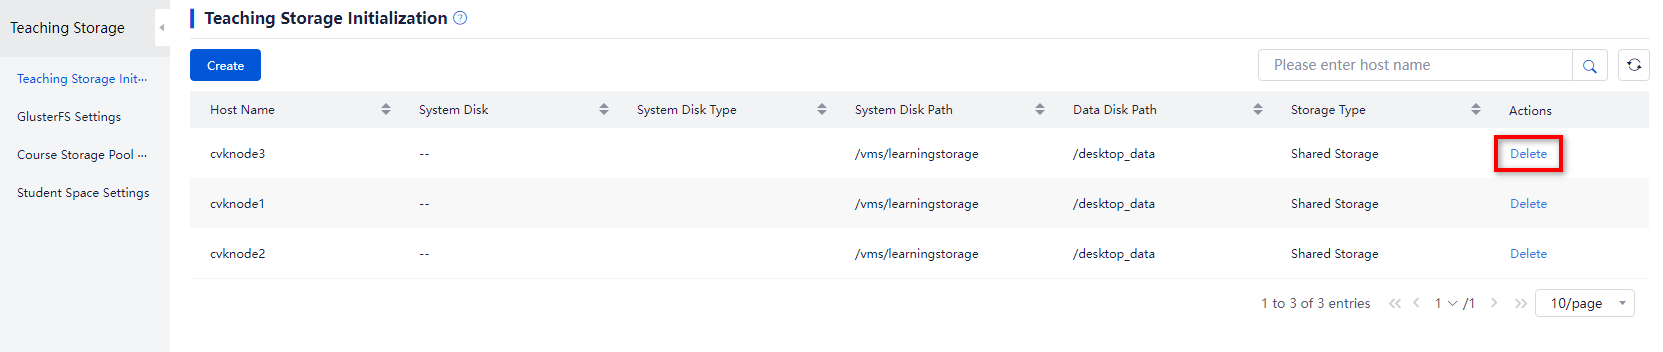
Figure 186 After the teaching image storage of the scaled-down host is deleted
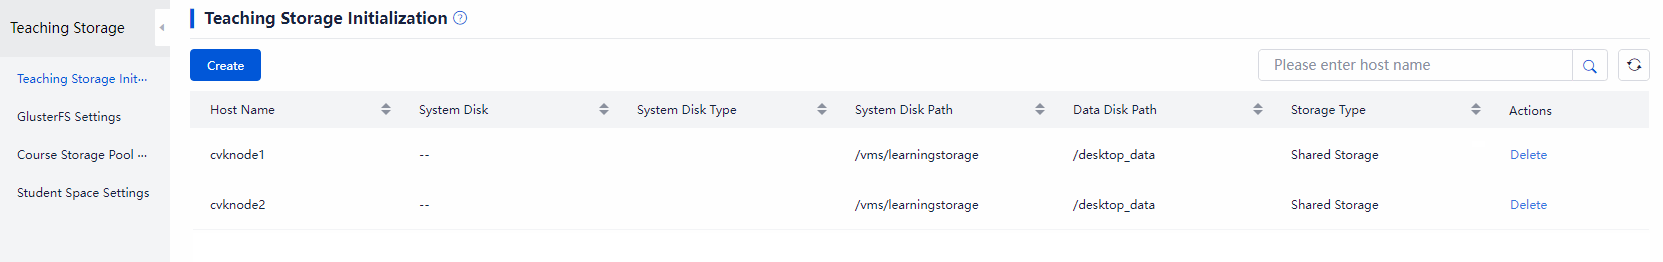
9. Replace the SSD drives of the scaled-down host.
10. Create a new teaching image storage.
a. Log in to Space Console and select Data Center > Teaching Storage > Teaching Storage Initialization from the left navigation pane to access the teaching image storage configuration page.
b. Click Add.
c. Select the storage type (local disk or shared storage) and click Next.
d. Select the host under the storage cluster and click Next.
e. If the storage type is local disk, select the free disk of the selected host, and click OK. Then, enter CONFIRM (case insensitive) in the dialog box that opens and click OK to complete the operation. If the storage type is shared storage, verify the shared storage information, click OK. Then, enter CONFIRM (case-insensitive) in the dialog box that opens, and then click OK to complete the operation.
Figure 187 Create a teaching image storage
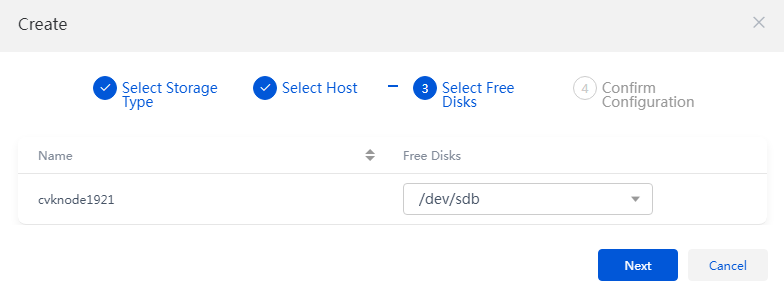
11. Expand the GlusterFS storage.
a. Log in to the Space Console, select Data Center > Teaching Storage > GlusterFS Settings from the left navigation pane to access the GlusterFS configuration page.
b. Click Expand in the Actions column of the GlusterFS storage list.
c. Choose whether to modify the topology type based on specific requirements. If you select not to modify the topology type, the number of available hosts in the cluster must be a multiple of the topology type.
d. Select the available hosts in the cluster and click OK to complete the operation.
Figure 188 Before the GlusterFS storage is expanded
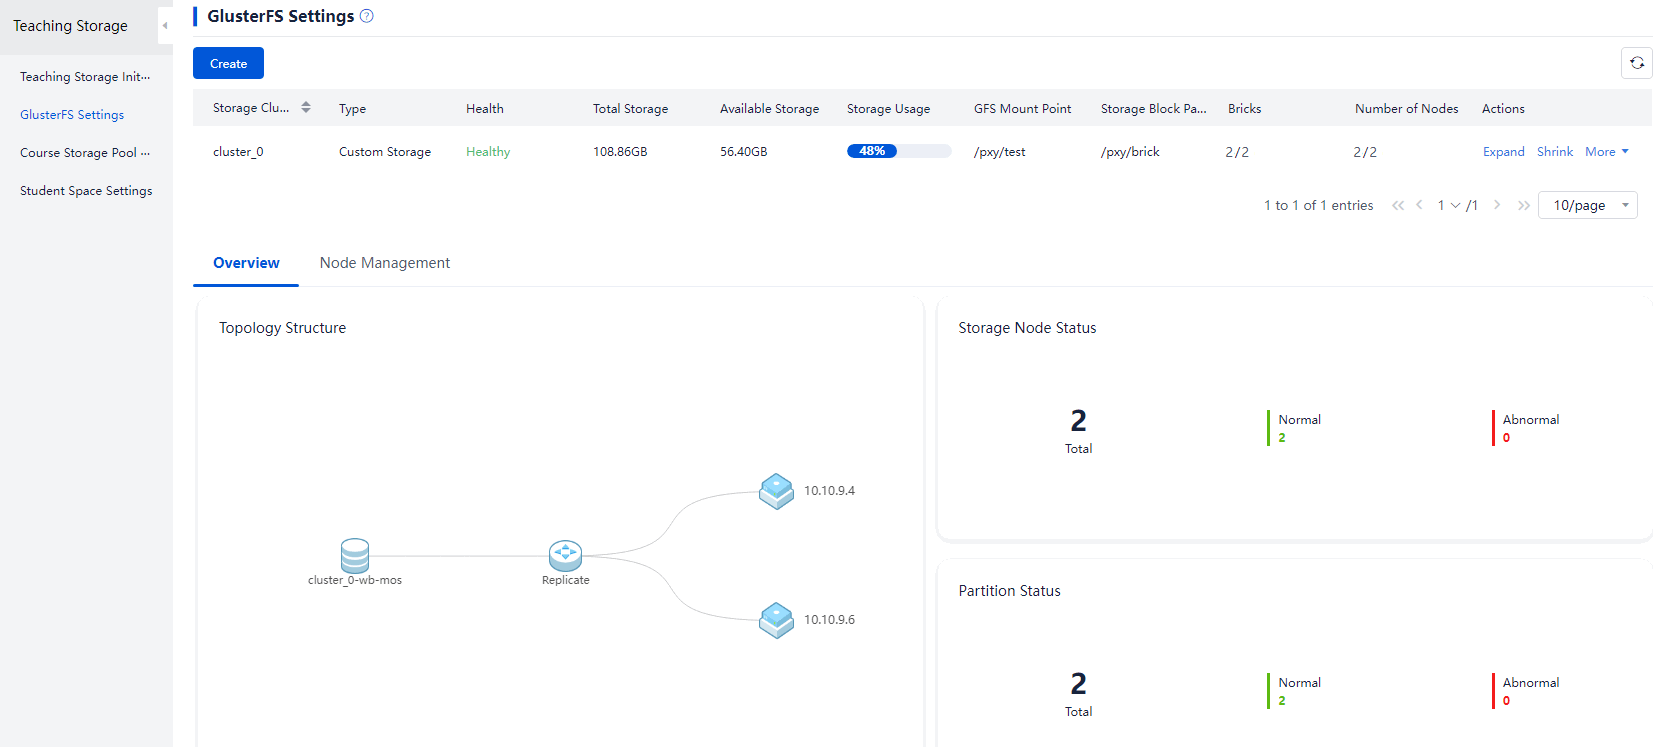
Figure 189 Scaling up the GlusterFS storage
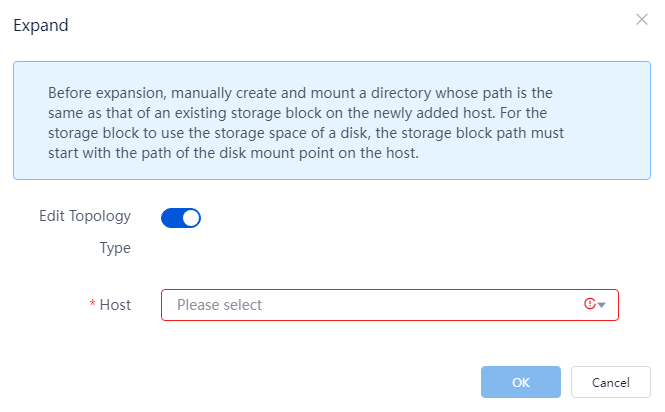
Figure 190 After the GlusterFS storage is scaled down
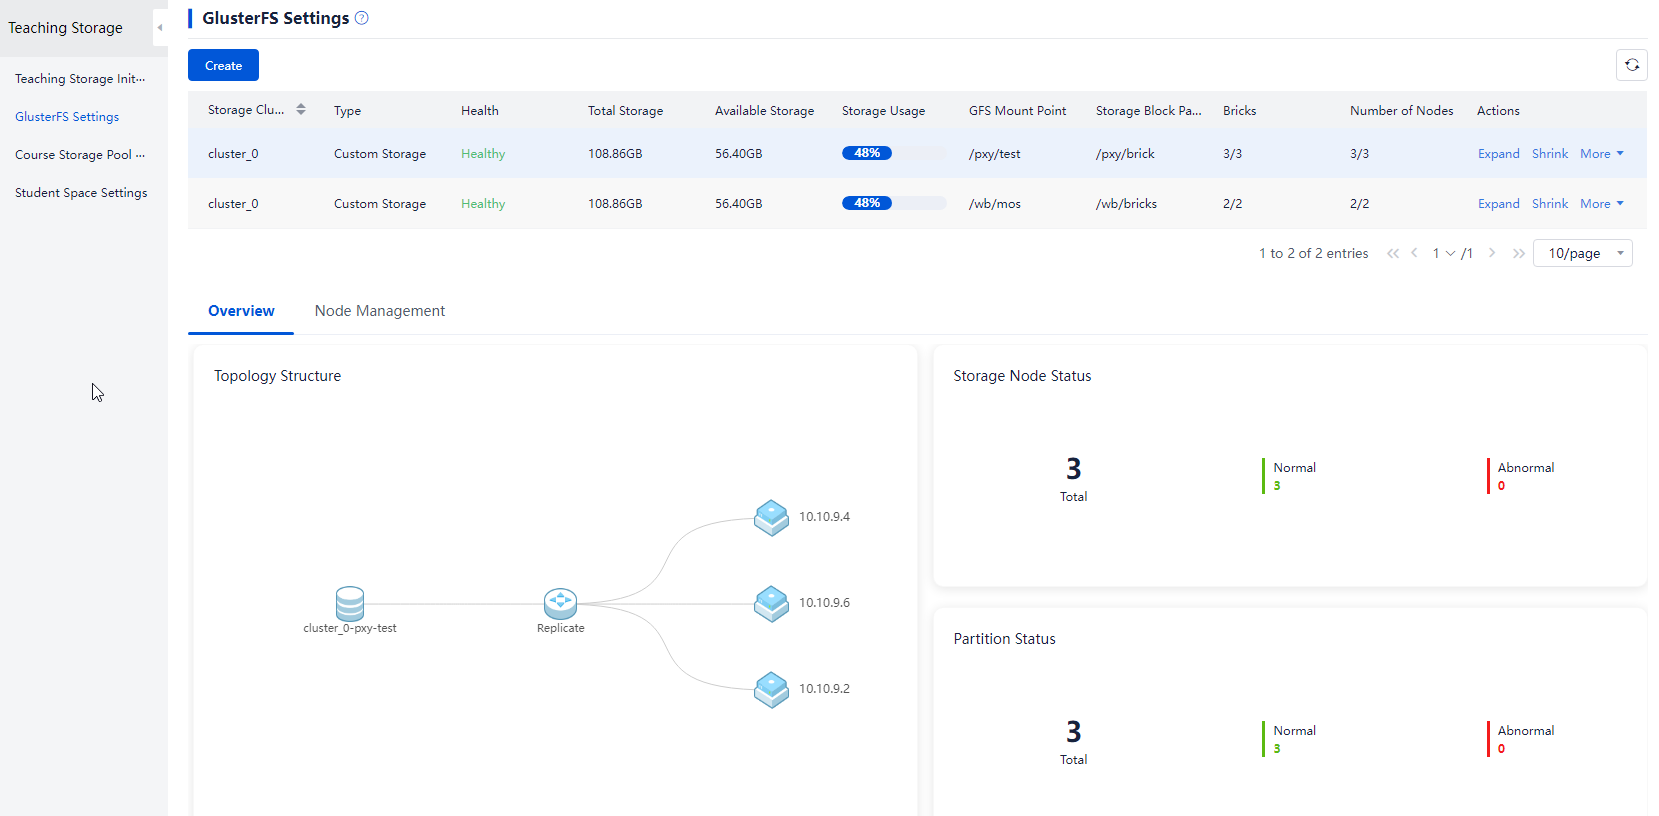
|
|
NOTE: To restore data related to the exam courses, restore all the files in the CLASSROOM-x-EXAM directory within the path /vms/learningspace/desktop (earlier than E1015) or /vms/learningstorage/desktop (E1015 and later) to the corresponding directory of the scaled-down node. |
12. Verify the configuration.
¡ Check the GlusterFS configuration status to confirm it is in healthy state. If GlusterFS is not in healthy state, locate the abnormal host on the node management page and click Repair to fix the storage node.
¡ Identify whether the storage pool deleted in step 6 has been automatically created on the expanded node.
¡ Identify whether the course services are functioning normally, including regular courses and examination courses.
Figure 191 Check the configuration status of GlusterFS
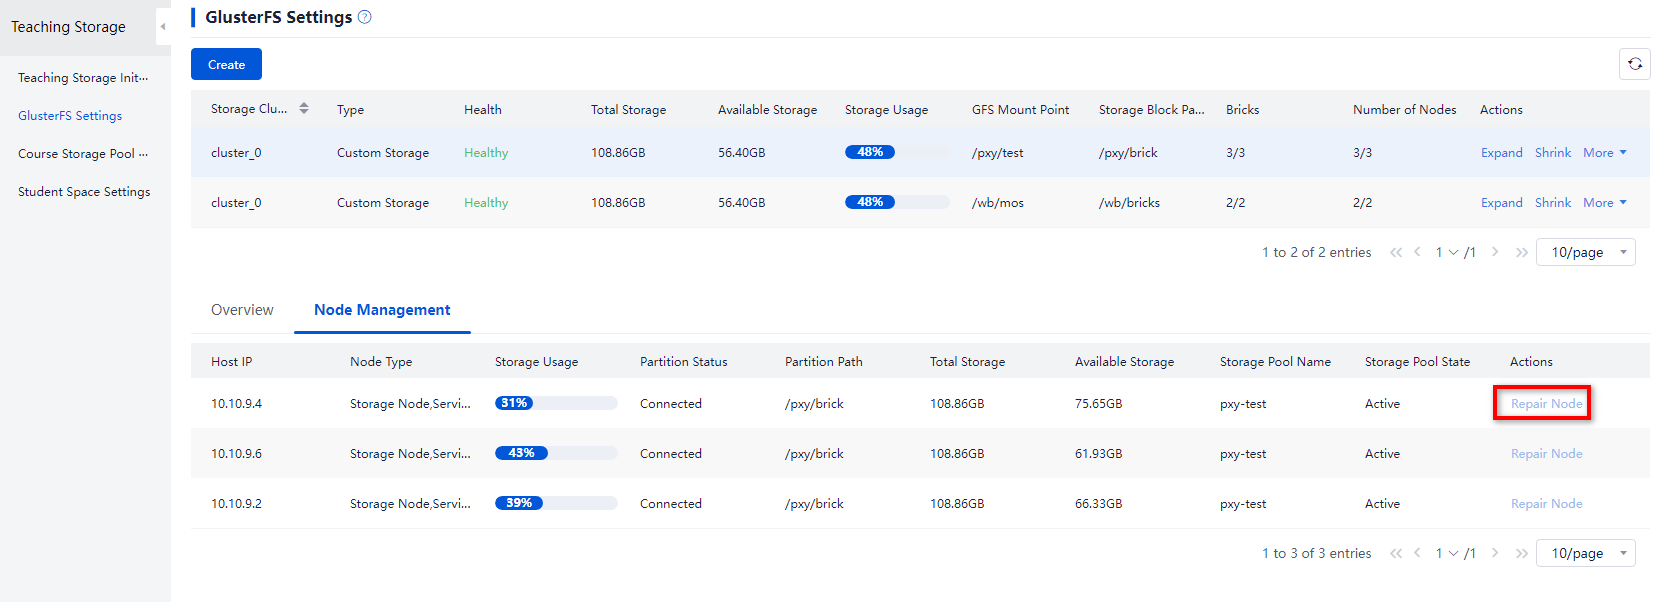
Changing the topology type for GlusterFS storage
Changing the topology type by deleting the existing GlusterFS storage and creating a new one
1. Download and save the courses created using the GlusterFS teaching storage, and back up the data under the GlusterFS mount point path.
2. Deleting GlusterFS storage
3. Recreate the GlusterFS storage, and use the host that was previously a GlusterFS node as a storage node. Make sure that the original GlusterFS storage volume on the host has been completely deleted. For example, the corresponding storage block for the GlusterFS storage volume where the host is to be added is /vms/learningspace/glusterfs/brick (earlier than E1015) or /vms/learningstorage/glusterfs/brick (E1015 and later). Delete this folder on the host before creating it again.
Changing the topology type by scaling down and then scaling up the existing GlusterFS storage
Restrictions and guidelines
· GlusterFS scale-down requires considering the topology type (number of replicas). If it is a 4-node 2-replica setup, scale-down can only be done with two nodes together, meaning scale-down is done collectively for a replica group.
· GlusterFS scale-down requires sufficient space reservation. For example, in a network with four servers and two backups, when you shrink two servers, data loss will occur if the space is insufficient on the remaining two servers.
· GlusterFS scale-down operation may result in data loss. Back up your data in advance.
Procedure
1. Download and save the courses created using the GlusterFS teaching storage, and back up the data under the GlusterFS mount point path.
2. Take the example of changing from 8 hosts and 4 backups to 2 backups (which means modifying 2 volume groups, each with 4 nodes, to 4 volume groups, each with 2 nodes), and shrink the GlusterFS storage until only one volume group remains.
3. Continue to shrink the remaining volume group into 2 nodes.
4. Perform a GlusterFS storage expansion operation. Use a host that was previously used as a GlusterFS node for the GlusterFS storage expansion. Make sure the corresponding storage block of the original GlusterFS storage volume on the host has been completely deleted. For example, if the GlusterFS storage volume corresponding to the host to be added has a storage block as /vms/learningspace/glusterfs/brick (earlier than E1015) or /vms/learningstorage/glusterfs/brick (E1015 and later), delete this folder on the host before expansion.
5. The current topology type is 2 backup. Do not change the topology type during expansion. Select all remaining hosts and perform the expansion. The number of selected hosts must be a multiple of the topology type.