- Table of Contents
- Related Documents
-
| Title | Size | Download |
|---|---|---|
| 01-Hardware Resource Management Troubleshooting Guide | 118.60 KB |
Troubleshooting system management
Hardware resource management issues
High CPU usage
Symptom
If one of the following conditions occurs, the CPU control core usage of the device is high, and you must identify the causes for the high CPU usage:
· During daily inspection of the device, execute the display cpu-usage command repeatedly to view the CPU usage. The CPU usage is significantly higher than the daily average.
# Execute the display cpu-usage summary command to view the average CPU usage during the most recent 5-second, 1-minute, or 5-minute interval.
<Sysname> display cpu-usage summary
Slot CPU Last 5 sec Last 1 min Last 5 min
1 0 5% 5% 4%
# Execute the display cpu-usage history command to view the CPU usage in graphical form for the last 60 samples. The data shows that the CPU usage rate continues to increase or is significantly higher than the daily average value.
· When you log in to the device via Telnet or SSH and execute commands, the device responds slowly and experiences stagnation.
· The device outputs log messages about high CPU usage on the device.
· Alarms on high CPU usage occur on the SNMP manager.
Common causes
The following are the common causes of this type of issue:
· Network attacks.
· Protocol flappings, typically route protocol flappings.
· After flow sampling is configured on the device and the traffic to be processed is too large or the device's sampling frequency is too high, the sampling feature occupies a significant amount of CPU resources.
· The device generates a large number of log messages. Then, abundant resources are occupied for the generation and management of these log messages.
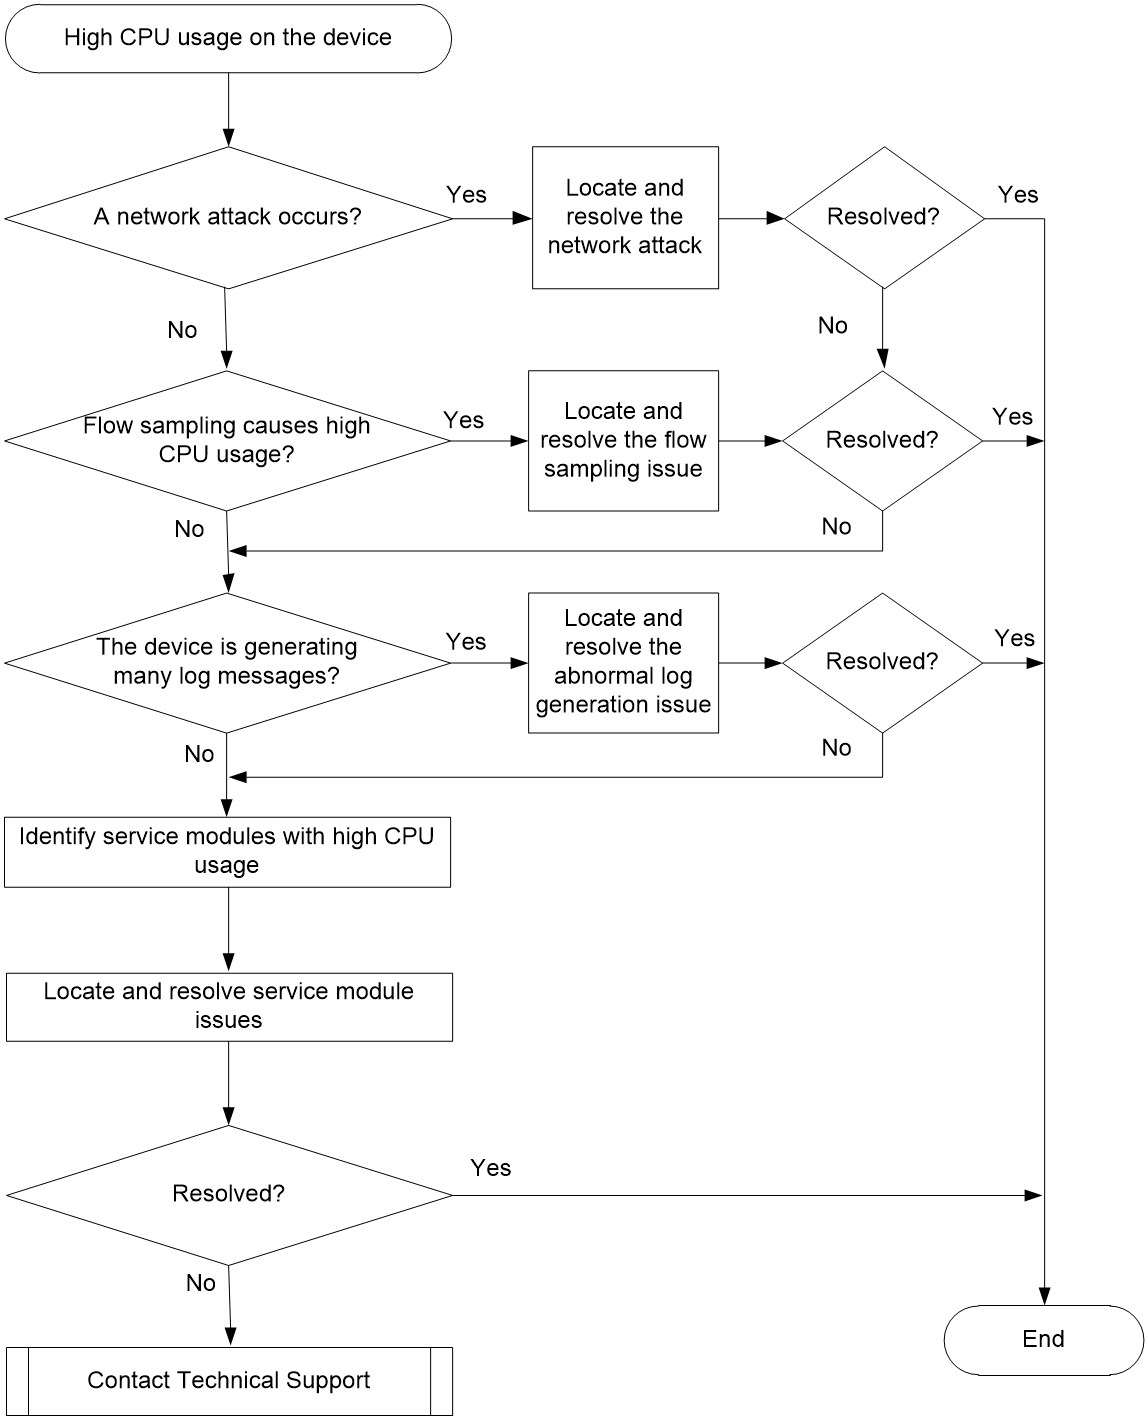
Troubleshooting flow
Figure 1 shows the troubleshooting flowchart.
Figure 1 Flowchart for troubleshooting high CPU usage
Solution
1. Identify whether a network attack occurs.
On a live network, the most common cause of high CPU usage is a network attack. Attackers initiate a large number of abnormal network interactions which hit the device. For example, the attackers transmit a large number request messages for setting up TCP connections or ICMP request messages in a short period. Then, the device is busy processing these attack messages, leading to high CPU usage and subsequently affecting the normal operation of the device.
In probe view, execute the display system internal control-plane statistics command to view statistics of the control plane to check the number of dropped messages. If the current CPU usage is high and the Dropped field value is large, a message attack occurs probably on the device.
<Sysname> display system internal control-plane statistics slot 1
Control plane slot 1
Protocol: Default
Bandwidth: 15360 (pps)
Forwarded: 108926 (Packets), 29780155 (Bytes)
Dropped : 0 (Packets), 0 (Bytes)
Protocol: ARP
Bandwidth: 512 (pps)
Forwarded: 1489284 (Packets), 55318920 (Bytes)
Dropped : 122114 (Packets), 491421 (Bytes)
...
¡ If a network attack occurs, first resolve the network attack issue.
¡ If no network attack occurs, proceed to step 2.
2. Identify whether a protocol flapping occurs on the device.
A protocol flapping can cause continuous processing of protocol messages, topology calculations, and entry updates by the device, resulting in high CPU usage. In practical applications, the most common protocol flappings are OSPF protocol flappings.
¡ For OSPF flappings, execute the display ip routing-table command to view routing information. If route entries for the same network segment are frequently and repeatedly created and deleted in the routing table, a route flapping occurs.
- If a route flapping occurs or the routes do not exist, troubleshoot link-related issues and IGP routing issues.
- If no route flapping occurs, proceed to step 3.
3. Identify whether flow statistics and sampling features are configured and whether the configured parameters are appropriate.
After network traffic monitoring features including NetStream and sFlow are configured on the device, the device will statistically analyze network traffic. If network traffic is high, the CPU usage might be high. In this case, perform the following operations:
¡ Configure filter conditions to precisely filter the traffic, and only analyze the traffic that users care about.
¡ Configure the sampler and adjust the sampling ratio. Then, the statistics collected by NetStream and sFlow can basically reflect the status of the entire network, and can prevent the excessive statistical messages from affecting the forwarding performance of the device.
4. Identify whether the device is generating a large number of log messages.
In certain anomaly situations, for example, when the device is under attack, errors occur during the operation, or a port frequently runs up/down, the device continuously generates diagnostic information or log information. In this case, the system software needs to frequently read and write to the memory, which can increase the CPU usage.
Use the following methods to identify whether the device is generating a large number of log messages:
¡ Log in to the device via Telnet and execute the terminal monitor command to enable log output to the current terminal.
<Sysname> terminal monitor
The current terminal is enabled to display logs.
After you execute this command, if a large number of abnormal log messages or duplicated log messages are output to the CLI, the device is generating a large number of log messages.
¡ Repeatedly execute the display logbuffer summary command. If the total log volume increases obviously, execute the display logbuffer reverse command to view detailed log information to identify whether a large number of abnormal log messages occur or whether a particular log message is repeatedly appearing in large quantities.
<Sysname> display logbuffer summary
Slot EMERG ALERT CRIT ERROR WARN NOTIF INFO DEBUG
1 0 0 2 9 24 12 128 0
5 0 0 0 41 72 8 2 0
97 0 0 42 11 14 7 40 0
<Sysname> display logbuffer reverse
Log buffer: Enabled
Max buffer size: 1024
Actual buffer size: 512
Dropped messages: 0
Overwritten messages: 0
Current messages: 410
%Jan 15 08:17:24:259 2021 Sysname SHELL/6/SHELL_CMD: -Line=vty0-IPAddr=192.168.2.108-User=**; Command is display logbuffer
%Jan 15 08:17:19:743 2021 Sysname SHELL/4/SHELL_CMD_MATCHFAIL: -User=**-IPAddr=192.168.2.108; Command display logfile in view shell failed to be matched.
...
If the device is generating a large number of log messages, use the following methods to reduce log generation:
¡ Disable the log output feature for some service modules.
¡ Execute the info-center logging suppress command to disable log output for a module.
¡ Execute the info-center logging suppress duplicates command to enable duplicate log suppression.
If the device has not generated a large number of log messages, proceed to step 6.
5. Collect CPU usage information, and identify the service modules where the CPU usage is high.
a. Identify the tasks that are consuming high CPU usage.
# Execute the display process cpu to view tasks that occupy most CPU resources within a period. This example displays information about slot 1.
<Sysname> display process cpu slot 1
CPU utilization in 5 secs: 0.4%; 1 min: 0.2%; 5 mins: 0.2%
JID 5Sec 1Min 5Min Name
1 0.0% 0.0% 0.0% scmd
2 5.5% 5.1% 5.0% [kthreadd]
3 0.0% 0.0% 0.0% [ksoftirqd/0]
...
If a process has a CPU usage higher than 3% (for reference only), further location is required for that process.
# Execute the monitor process dumbtty command to view the real-time CPU usage of a process. This example displays information about CPU 0 for slot 1.
<Sysname> system-view
[Sysname] monitor process dumbtty slot 1 cpu 0
206 processes; 342 threads; 5134 fds
Thread states: 4 running, 338 sleeping, 0 stopped, 0 zombie
CPU0: 99.04% idle, 0.00% user, 0.96% kernel, 0.00% interrupt, 0.00% steal
CPU1: 98.06% idle, 0.00% user, 1.94% kernel, 0.00% interrupt, 0.00% steal
CPU2: 0.00% idle, 0.00% user, 100.00% kernel, 0.00% interrupt, 0.00% steal
CPU3: 0.00% idle, 0.00% user, 100.00% kernel, 0.00% interrupt, 0.00% steal
CPU4: 0.00% idle, 0.00% user, 100.00% kernel, 0.00% interrupt, 0.00% steal
Memory: 7940M total, 5273M available, page size 4K
JID PID PRI State FDs MEM HH:MM:SS CPU Name
322 322 115 R 0 0K 01:48:03 20.02% [kdrvfwdd2]
323 323 115 R 0 0K 01:48:03 20.02% [kdrvfwdd3]
324 324 115 R 0 0K 01:48:03 20.02% [kdrvfwdd4]
376 376 120 S 22 159288K 00:00:07 0.37% diagd
1 1 120 S 18 30836K 00:00:02 0.18% scmd
379 379 120 S 22 173492K 00:00:11 0.18% devd
2 2 120 S 0 0K 00:00:00 0.00% [kthreadd]
3 3 120 S 0 0K 00:00:02 0.00% [ksoftirqd/0]
...
- In the output from the monitor process dumbtty command, find the JIDs of processes with CPU usage higher than 3% (for reference only). Then, execute the display process job command for these processes to collect detailed information about the processes, and identify whether the processes are running on the control core.
If the LAST_CPU field value in the output from the display process job command is the ID of the control core (for example, 0 and 1), a process is running on the CPU control core and further location is required. If the LAST_CPU field value is not the ID of the control core, a process is running on the CPU forwarding core, In this case, no action is required and proceed to step 7. Take the pppd process as an example. The output shows that this process contains multiple threads, all of which are running on the control core.
<Sysname> display process name pppd
Job ID: 515
PID: 515
Parent JID: 1
Parent PID: 1
Executable path: /sbin/pppd
Instance: 0
Respawn: ON
Respawn count: 1
Max. spawns per minute: 12
Last started: Wed Nov 3 09:52:00 2021
Process state: sleeping
Max. core: 1
ARGS: --MaxTotalLimit=2000000 --MaxIfLimit=65534 --CmdOption=0x01047fbf --bSaveRunDb --pppoechastenflag=1 --pppoechastennum=6 --pppoechastenperiod=60 --pppoechastenblocktime=300 --pppchastenflag=1 --pppchastennum=6 --pppchastenperiod=60 --pppchastenblocktime=300 --PppoeKChasten --bSoftRateLimit --RateLimitToken=2048
TID LAST_CPU Stack PRI State HH:MM:SS:MSEC Name
515 0 136K 115 S 0:0:0:90 pppd
549 0 136K 115 S 0:0:0:0 ppp_misc
557 0 136K 115 S 0:0:0:10 ppp_chasten
610 0 136K 115 S 0:0:0:0 ppp_work0
611 1 136K 115 S 0:0:0:0 ppp_work1
612 1 136K 115 S 0:0:0:0 ppp_work2
613 1 136K 115 S 0:0:0:0 mp_main
618 1 136K 115 S 0:0:0:110 pppoes_main
619 1 136K 115 S 0:0:0:100 pppoes_mesh
620 1 136K 115 S 0:0:0:120 l2tp_mesh
621 1 136K 115 S 0:0:0:20 l2tp_main
- For a process running on the control core with CPU usage higher than 5%, check the Name field value to identify whether the process is a user-mode process.
If the Name field for a process includes square brackets ([ ]), the process is a kernel thread, and you do not need to execute the monitor thread dumbtty command. If the Name field for a process does not include square brackets ([ ]), the process is a user process and might contain multiple threads. For user processes with multithreading, execute the monitor thread dumbtty command. If the LAST_CPU field of a thread in the output corresponds to the ID of the CPU control core, and the CPU field value is greater than 5%, this thread might cause high CPU core usage. Then, further location is required.
<Sysname> monitor thread dumbtty slot 1 cpu 0
206 processes; 342 threads; 5134 fds
Thread states: 4 running, 338 sleeping, 0 stopped, 0 zombie
CPU0: 98.06% idle, 0.97% user, 0.97% kernel, 0.00% interrupt, 0.00% steal
CPU1: 97.12% idle, 0.96% user, 0.96% kernel, 0.96% interrupt, 0.00% steal
CPU2: 0.00% idle, 0.00% user, 100.00% kernel, 0.00% interrupt, 0.00% steal
CPU3: 0.00% idle, 0.00% user, 100.00% kernel, 0.00% interrupt, 0.00% steal
CPU4: 0.00% idle, 0.00% user, 100.00% kernel, 0.00% interrupt, 0.00% steal
Memory: 7940M total, 5315M available, page size 4K
JID TID LAST_CPU PRI State HH:MM:SS MAX CPU Name
322 322 2 115 R 00:04:21 0 20.15% [kdrvfwdd2]
323 323 3 115 R 00:04:21 0 20.15% [kdrvfwdd3]
324 324 4 115 R 00:04:21 0 20.15% [kdrvfwdd4]
1 1 1 120 S 00:00:02 21 0.19% scmd
376 376 1 120 S 00:00:00 1 0.19% diagd
2 2 0 120 S 00:00:00 0 0.00% [kthreadd]
...
b. Identify the stacks of an abnormal task.
Execute the follow job command in probe view to identify the stacks of an abnormal task. The following takes the pppd process (with process ID 515) in slot 1 on the device as an example.
<Sysname> system-view
[Sysname] probe
[Sysname-probe] follow job 515 slot 1
Attaching to process 515 (pppd)
Iteration 1 of 5
------------------------------
Thread LWP 515:
Switches: 3205
User stack:
#0 0x00007fdc2a3aaa8c in epoll_wait+0x14/0x2e
#1 0x0000000000441745 in ppp_EpollSched+0x35/0x5c
#2 0x0000000000000004 in ??
Kernel stack:
[<ffffffff811f0573>] ep_poll+0x2f3/0x370
[<ffffffff811f06c0>] SyS_epoll_wait+0xd0/0xe0
[<ffffffff814aed79>] system_call_fastpath+0x16/0x1b
[<ffffffffffffffff>] 0xffffffffffffffff
Thread LWP 549:
Switches: 20
User stack:
#0 0x00007fdc2a3aaa8c in epoll_wait+0x14/0x2e
#1 0x00000000004435d4 in ppp_misc_EpollSched+0x44/0x6c
Kernel stack:
[<ffffffffffffffff>] 0xffffffffffffffff
...
c. Identify the task name based on steps a and b, and then find the corresponding service module according to the task name to locate and resolve issues in the service module. For example, if the CPU usage of the snmpd task is high, an SNMP attack might occur, or the NMS frequently accesses the device. Then, further troubleshooting is required for the SNMP service module. If the CPU usage of the nqad task is high, the NQA detection might be performed too frequently. Then, further troubleshooting is required for the NQA service module.
6. If the issue persists, collect the following information and contact Technical Support:
¡ Results of each step.
¡ The configuration files, log messages, and alarm messages.
Related alarm and log messages
Alarm messages
· hh3cEntityExtCpuUsageThresholdNotfication
· hh3cEntityExtCpuUsageThresholdRecover
· hh3cCpuUsageSevereNotification
· hh3cCpuUsageSevereRecoverNotification
· hh3cCpuUsageMinorNotification
· hh3cCpuUsageMinorRecoverNotification
Log messages
· DIAG/5/CPU_MINOR_RECOVERY
· DIAG/4/CPU_MINOR_THRESHOLD
· DIAG/5/CPU_SEVERE_RECOVERY
