- Table of Contents
-
- 11-Network Management and Monitoring Configuration Guide
- 00-Preface
- 01-System maintenance and debugging configuration
- 02-NQA configuration
- 03-NTP configuration
- 04-PTP configuration
- 05-SNMP configuration
- 06-RMON configuration
- 07-Event MIB configuration
- 08-NETCONF configuration
- 09-Puppet configuration
- 10-Chef configuration
- 11-CWMP configuration
- 12-EAA configuration
- 13-Process monitoring and maintenance configuration
- 14-Sampler configuration
- 15-Mirroring configuration
- 16-NetStream configuration
- 17-IPv6 NetStream configuration
- 18-sFlow configuration
- 19-Information center configuration
- 20-GOLD configuration
- 21-Packet capture configuration
- 22-VCF fabric configuration
- 23-Ansible configuration
- 24-iNQA configuration
- 25-Packet trace configuration
- 26-NetAnalysis configuration
- Related Documents
-
| Title | Size | Download |
|---|---|---|
| 24-iNQA configuration | 340.25 KB |
Restrictions and guidelines: iNQA configuration
Instance restrictions and guidelines
Network and target flow requirements
Collaborating with other features
Configuring parameters for a collector
Configuring a collector instance
Enabling packet loss measurement
Configuring parameters for the analyzer
Configuring an analyzer instance
Enabling the measurement functionality
Display and maintenance commands for iNQA collector
Display and maintenance commands for iNQA analyzer
Example: Configuring an end-to-end iNQA packet loss measurement
Example: Configuring an point-to-point iNQA packet loss measurement
Configuring iNQA
About iNQA
Intelligent Network Quality Analyzer (iNQA) is an H3C-proprietary protocol that allows you to measure network performance quickly in large-scale IP networks. iNQA supports measuring packet loss on forward, backward, and bidirectional flows. The packet loss data includes number of lost packets, packet loss rate, number of lost bytes, and byte loss rate. The measurement results help you to know when and where the packet loss occurs and the event severity level.
iNQA benefits
iNQA provides the following benefits:
· True measurement results—iNQA measures the service packets directly to calculate packet loss results, thus reflecting the real network quality.
· Wide application range—Applicable to Layer 2 network and Layer 3 IP network. iNQA supports the network-level and direct link measurement flexibly.
· Fast fault location—iNQA obtains the packet loss time, packet loss location, and number of lost packets in real time.
· Applicable to different applications—You can apply iNQA to multiple scenarios, such as point-to-point, point-to-multipoint, and multipoint-to-multipoint.
Basic concepts
Figure 1 shows the important iNQA concepts including MP, collector, analyzer, and AMS.
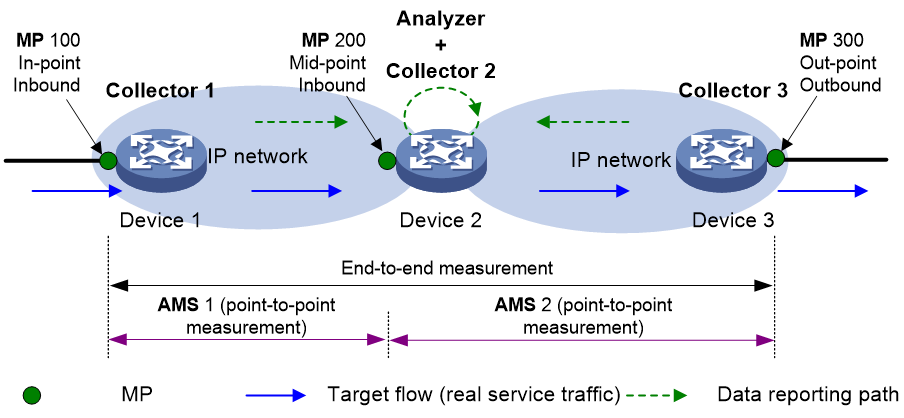
Collector
The collector manages MPs, collects data from MPs, and reports the data to the analyzer.
Analyzer
The analyzer collects the data from collector instances and summarizes the data.
A device supports both the collector and analyzer functionalities. You can enable the collector and analyzer functionalities on different devices or the same device.
Target flow
A target flow is vital for iNQA measurement. You can specify a flow by using any combination of the following items: source IPv4 address/segment, destination IPv4 address/segment, protocol type, source port number, destination port number, and DSCP value. Using more items defines a more explicit flow and generates more accurate analysis data.
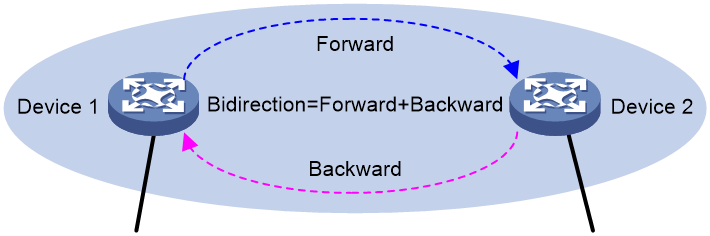
iNQA measures the flow according to the flow direction. After you define a forward flow, the flow in the opposite direction is a backward flow. The bidirectional flows refers to a forward flow and a backward flow. As shown in Figure 2, if you define the flow from Device 1 to Device 2 as the forward flow, then a flow from Device 2 to Device 1 is the backward flow. If you want to measure the packet loss on forward and backward flows between Device 1 and Device 2, you can specify bidirectional flows. The intermediate devices between the ingress and egress devices of the bidirectional flows can be the same or different.
MP
MP is a logical concept. An MP counts statistics and generates data for a flow. To measure packet loss on an interface on a collector, an MP must be bound to the interface.
An MP contains the following attributes:
· Measurement location of the flow.
¡ An ingress point refers to the point that the flow enters the network.
¡ An egress point refers to the point that the flow leaves the network.
¡ A middle point refers to the point between an ingress point and egress point.
· Flow direction on the measurement point.
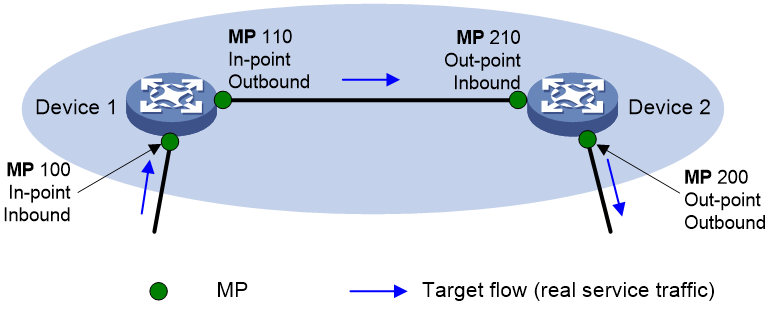
A flow entering the MP is an inbound flow, and a flow leaving the MP is an outbound flow.
¡ As shown in Figure 3, MP 100 is marked as in-point/inbound. MP 100 is the ingress point of the flow and the flow enters MP 100.
¡ As shown in Figure 3, MP 110 is marked as in-point/outbound. MP 110 is the ingress point of the flow and the flow leaves MP 110.
¡ As shown in Figure 3, MP 200 is marked as out-point/outbound. MP 200 is the egress point of the flow and the flow leaves MP 200.
¡ As shown in Figure 3, MP 210 is marked as out-point/inbound. MP 210 is the egress point of the flow and the flow enters MP 210.
AMS
Configured on the analyzer, an AMS defines a measurement span for point-to-point performance measurement. You can configure multiple AMSs for an instance, and each AMS can be bound to MPs on any collector of the same instance. Therefore, iNQA can measure and summarize the data of the forward flow, backward flow, or bidirectional flows in any AMS.
Each AMS has an ingress MP group and egress MP group. The ingress MP group is the set of the ingress MPs in the AMS and the egress MP group is the set of the egress MPs.
As shown in Figure 1:
· To measure the packet loss between MP 100 and MP 300, AMS is not needed.
· If packet loss occurs between MP 100 and MP 300, configure AMS 1 and AMS 2 on the analyzer to locate on which span the packet loss occurs.
¡ Bind MP 100 of collector 1 and MP 200 of collector 2 to AMS 1. Add MP 100 to the ingress MP group of the AMS 1 and MP 200 to the egress MP group of the AMS 1.
¡ Bind MP 200 of collector 2 and MP 300 of collector 3 to AMS 2. Add MP 200 to the ingress MP group of the AMS 2 and MP 300 to the egress MP group of the AMS 2.
Instance
The instance allows measurement on a per-flow basis. In an instance, you can configure the target flow, flow direction, MPs, and measurement interval.
On the collector and analyzer, create an instance of the same ID for the same target flow. An instance can be bound to only one target flow. On the same device, you can configure multiple instances to measure and collect the packet loss rate of different target flows.
Flag bit
Flag bits, also called color bits, are used to distinguish target flows from unintended traffic flows.
iNQA uses ToS field bits 5 to 7 in the IPv4 packet header as the flag bit.
The ToS field consist of a 6-bit (bits 0 to 5) DSCP filed and a 2-bit (bits 6 to 7) ECN field. If bit 5 is used as the flag bit, to avoid inaccurate packet loss statistics, do not use it for DSCP purposes.
Application scenarios
End-to-end packet loss measurement
iNQA measures whether packet loss occurs between the ingress points (where the target flow enters the IP network) and the egress points (where the flow leaves the network).
· Scenario 1: The target flow has only one ingress point and one egress point , and the two points are on the same network, for example, the local area network or the core network.
As shown in Figure 4, to measure packet loss for the flow in the network, deploy iNQA on Device 1 and Device 3.
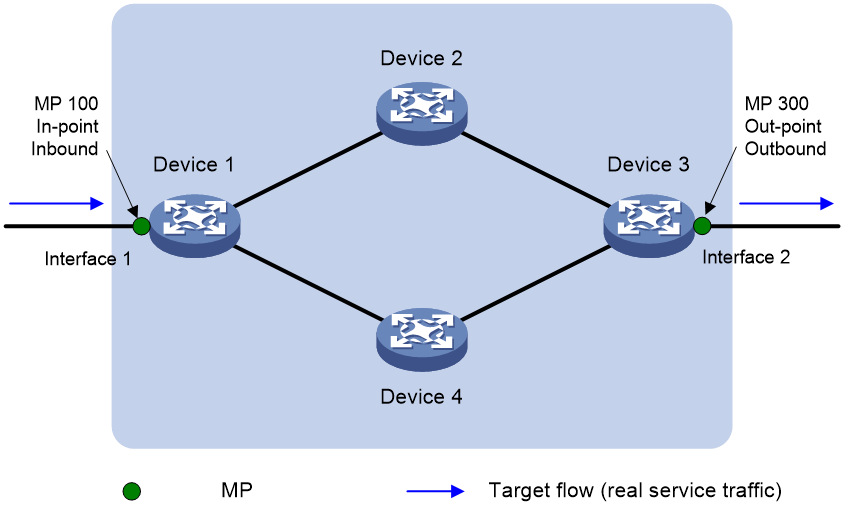
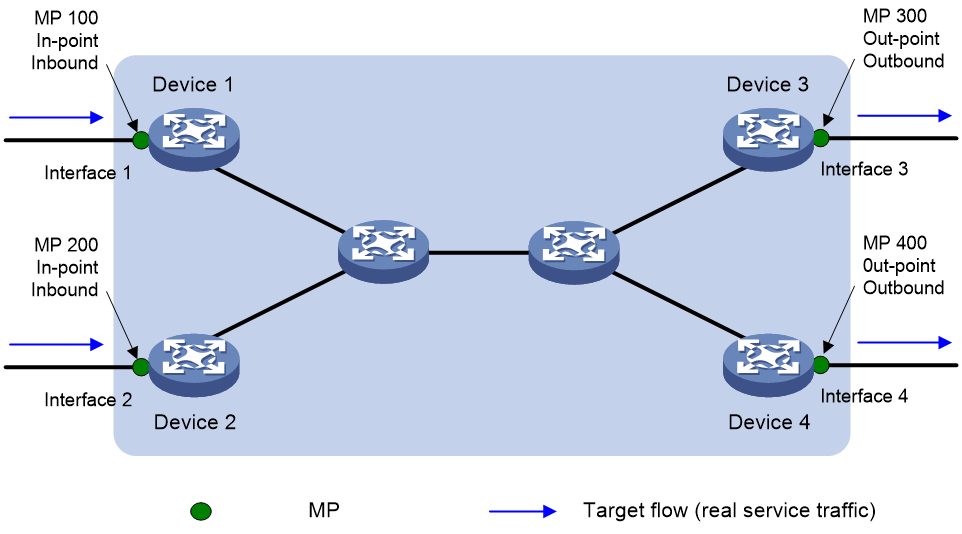
· Scenario 2: The target flow can have multiple ingress points and egress points, and the points are on the same network, for example, the local area network or the core network.
As shown in Figure 5, to measure packet loss for the flow in the network, deploy iNQA on Device 1, Device 2, Device 3, and Device 4.
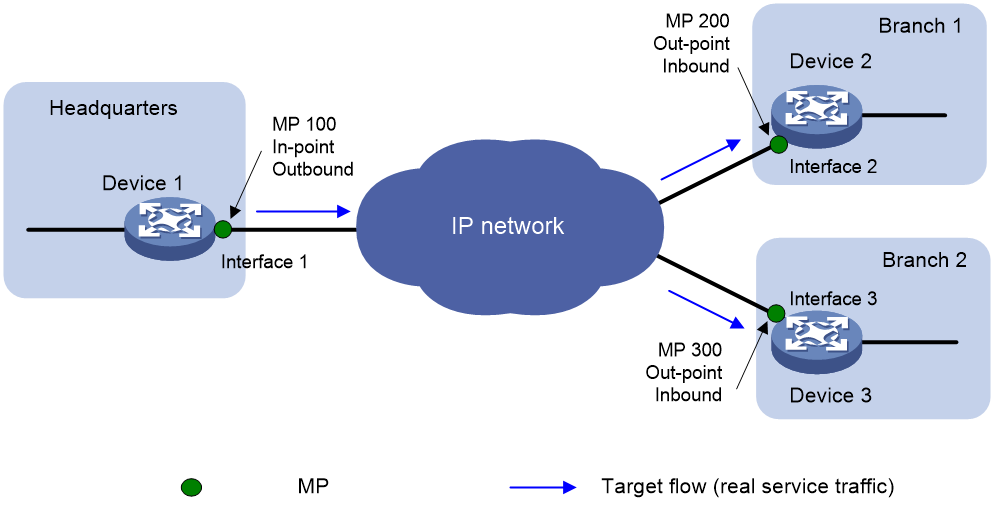
· Scenario 3: The ingress points and the egress points of a target flow are on the different networks.
As shown in Figure 6, to measure whether packet loss occurs when the flow crosses over the IP network, deploy iNQA on the egress devices of the headquarters and branches to measure.
Point-to-point packet loss measurement
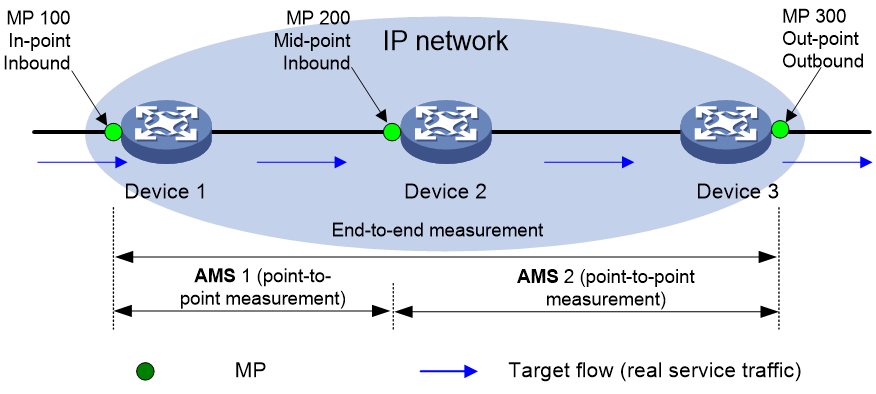
This measurement is based on atomic measurement spans (AMSs), which define smaller ranges than the end-to-end measurement. This method is helpful if you want to find out between which specific devices the packet loss occurs.
As shown in Figure 7, to configure point-to-point measurement, define AMSs, specify the flow direction in each AMS, and configure the ingress MP group and egress MP group for each AMS.
Figure 7 Point-to-point packet loss measurement
Operating mechanism
iNQA uses the model of multi-point collection and single-point calculation. Multiple collectors collect and report the packet data periodically and one analyzer calculates the data periodically.
Before starting the iNQA packet loss measurement, make sure all collectors are time synchronized through NTP or PTP. Therefore, all collectors can use the same measurement interval to color the flow and report the packet statistics to the analyzer. As a best practice, the analyzer and all collectors are time synchronized to facilitate management and maintenance. For more information about NTP, see "Configuring NTP." For more information about PTP, see "Configuring PTP."
The number of incoming packets and that of outgoing packets in a network should be equal within a time period. If they are not equal, packet loss occurs in the network.
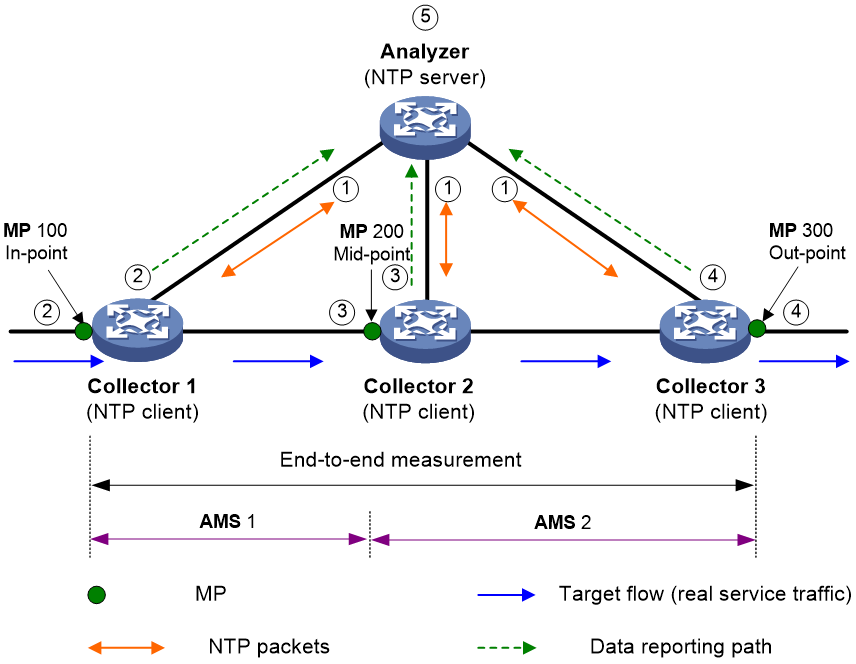
As shown in Figure 8, the flow enters the network from MP 100, passes through MP 200, and leaves the network from MP 300. The devices where the flow passes are collectors and NTP clients, and the aggregation device is the analyzer and NTP server.
The iNQA measurement works as follows:
1. The analyzer synchronizes the time with all collectors through the NTP protocol.
2. The ingress MP on collector 1 identifies the target flow . It colors and decolors the packets in the flow alternatively at intervals, and periodically reports the packet statistics to the analyzer.
3. The middle MP on collector 2 identifies the target flow and reports the packet statistics to the analyzer periodically.
4. The egress MP on collector 3 identifies the target flow. It decolors the colored packets and reports the packet statistics to the analyzer periodically.
5. The analyzer calculates packet loss for the flow of the same period and same instance as follows:
Number of lost packets = Number of incoming packets on the MP – Number of outgoing packets on the MP
Packet loss rate = (Number of incoming packets on the MP – Number of outgoing packets on the MP) / Number of incoming packets on the MP
The analyzer calculates the byte loss in the similar way the packet loss is calculated.
For the end-to-end measurement, the data from the ingress MP and egress MP is used.
For the point-to-point measurement, the analyzer calculates the result on a per-AMS basis.
· In AMS 1: Packet loss = Number of packets at MP 100 – Number of packets at MP 200
· In AMS 2: Packet loss = Number of packets at MP 200 – Number of packets at MP 300
Restrictions and guidelines: iNQA configuration
Instance restrictions and guidelines
If an analyzer instance is not correctly bound to a collector, or the bound collector does not report the data on time, the analyzer will uses 0 to calculate the packet loss rate. For example, if an analyzer instance is bound to only ingress MPs but no egress MPs, the packet loss rate is 100 % because the analyzer uses 0 as the packet count on egress MPs.
A collector is uniquely identified by its ID. For the same collector, the specified collector ID must be the same as the collector ID bound to an analyzer instance on the analyzer. The collector ID is the IPv4 address of the collector, and must be routable from the analyzer. As a best practice, configure the Router ID of the device as the collector ID.
An analyzer is uniquely identified by its ID. For the same analyzer, the specified analyzer ID must be the same as the analyzer ID bound with a collector instance on the collector. The analyzer ID is the IPv4 address of the analyzer, and must be routable from the collector. As a best practice, configure the Router ID of the device as the analyzer ID.
To measure the same flow, configure the same instance ID, the target flow attributes, and measurement interval on the analyzer and collectors.
Network and target flow requirements
· To measure the same target flow, make sure the physical interfaces bound to all MPs are in the same type of networks. For example, the interfaces are all in IP networks or VXLAN networks.
When a flow travels through different networks, the packet header might be modified, making the packet count and byte count for the entire packet different at different MPs. If the packets are encapsulated or decapsulated during the transmission over different networks, iNQA cannot identify the target flow at different MPs for measurement.
· The measured packets are known IPv4 unicast packets. For unknown IP unicast, broadcast, and multicast packets, one packet entering an MP might be copied as multiple packets leaving the MP.
Collaborating with other features
iNQA on an aggregate interface might function incorrectly after a new member port joins the aggregation group and causes insufficient ACL resources. To solve the problem, follow either of the methods:
· Reduce the number of member ports.
· Use the display qos-acl resource command to view the QoS and ACL resource usage. Delete unnecessary settings to release ACL resources and then add a new member port again.
For more information about the display qos-acl resource command, see ACL commands in ACL and QoS Command Reference.
With iNQA enabled on a Layer 2 aggregate interface, do not execute the port s-mlag group command to assign the Layer 2 aggregate interface to an S-MLAG group. For more information about the port s-mlag group command, see Ethernet link aggregation commands in Layer 2—LAN Switching Command Reference.
To specify ToS field bit 6 or 7 as the flag bit, do not enable ECN, and vice versa. For more information about ECN, see congestion avoidance configuration in ACL and QoS Configuration Guide.
You cannot configure iNQA on an interface and specify it as the ingress port on the entry node. For more information about INT, see Telemetry Configuration Guide.
iNQA tasks at a glance
To configure iNQA, perform the following tasks:
¡ Configuring parameters for a collector
¡ Configuring a collector instance
¡ Enabling packet loss measurement
¡ Configuring parameters for the analyzer
¡ Configuring an analyzer instance
No AMSs are required in the end-to-end packet loss measurements. Configure an AMS in the point-to-point packet loss measurements.
¡ Enabling the measurement functionality
Prerequisites
Before configuring iNQA, configure NTP or PTP to synchronize the clock between the analyzer and all collectors. For more information about NTP, see "Configuring NTP." For more information about PTP, see "Configuring PTP."
Configure a collector
Configuring parameters for a collector
1. Enter system view.
system-view
2. Enable the collector functionality and enter its view.
inqa collector
By default, the collector functionality is disabled.
3. Specify a collector ID.
collector id collector-id
By default, no collector ID is specified.
4. Specify a ToS field bit to flag packet loss measurement.
flag loss-measure tos-bit tos-bit
By default, no ToS field bit is specified to flag packet loss measurement.
5. Bind an analyzer to the collector.
analyzer analyzer-id [ udp-port port-number ] [ vpn-instance vpn-instance-name ]
By default, no analyzer is bound to a collector.
An analyzer specified in collector view is bound to all collector instances on the collector.
An analyzer specified in collector instance view is bound to the specified collector instance. The analyzer ID in collector instance view takes precedence over that in collector view. A collector and a collector instance can be bound to only one analyzer. If you execute this command multiple times in the same view, the most recent configuration takes effect.
Configuring a collector instance
Restrictions and guidelines
To collect packet loss statistics on the same target flow passing through multiple collectors, create an instance on the analyzer and each collector, and make sure the instance IDs are the same.
A collector instance can monitor a maximum of two flows. Follow these guidelines when you specify the target flows:
· To monitor only one flow, specify the forward keyword. The collector instance does not support monitoring only one backward flow.
· To monitor two flows:
¡ If the endpoint devices of the two flows are the same, specify the bidirection keyword. In addition, specify both the destination IPv4 address and source IPv4 address.
¡ If the endpoint devices of the two flows are not identical, specify a forward flow and then a backward flow in the collector instance. Alternatively, you can create two collector instances and specify a forward flow for each collector instance.
For the flows to be monitored by different collector instances, the flow attributes must not be identical.
For a forward flow and backward flow monitored by a collector instance, the flow attributes cannot be all identical. If they have the same attributes except the direction, define them as bidirectional flows.
Procedure
1. Enter system view.
system-view
2. Enter collector view.
inqa collector
3. Create a collector instance and enter its view.
instance instance-id
4. Bind the collector instance to an analyzer.
analyzer analyzer-id [ udp-port port-number ] [ vpn-instance vpn-instance-name ]
By default, no analyzer is bound to a collector instance.
An analyzer specified in collector view is bound to all collector instances. An analyzer specified in collector instance view is bound to the specific collector instance. The analyzer ID in collector instance view takes precedence over that in collector view. A collector and a collector instance can be bound to only one analyzer. If you execute this command multiple times in the same view, the most recent configuration takes effect.
5. Specify a flow to be monitored by the collector instance.
flow { backward | bidirection | forward } { destination-ip dest-ip-address [ dest-mask-length ] | dscp dscp-value | protocol { { tcp | udp } { destination-port dest-port-number1 [ to dest-port-number2 ] | source-port src-port-number1 [ to src-port-number2 ] } * | protocol-number } | source-ip src-ip-address [ src-mask-length ] } *
By default, no flow is specified for a collector instance.
6. Specify the measurement interval for the collector instance.
interval interval
By default, the measurement interval for a collector instance is 10 seconds.
Make sure the measurement interval for the same collector instance on all collectors are the same.
To modify the measurement interval for an enabled collector instance, first disable the measurement and then modify the measurement interval for the same collector instance in all collectors.
7. (Optional.) Configure a description for a collector instance.
description text
By default, a collector instance does not have a description.
Configuring an MP
1. Enter system view.
system-view
2. Enter collector view.
inqa collector
3. Create a collector instance and enter its view.
instance instance-id
4. Configure an MP.
mp mp-id { in-point | mid-point | out-point } port-direction { inbound | outbound }
By default, no MP is configured.
5. Return to collector view.
quit
6. Return to system view.
quit
7. Enter interface view.
interface interface-type interface-number
8. Bind an interface to the MP.
inqa mp mp-id
By default, no interface is bound to an MP.
Enabling packet loss measurement
About this task
Enable a packet loss measure for a collector instance as follows:
· Enable the fixed duration packet loss measurement to measure the network performance in a time period or to accurately locate the fault points for packet loss.
· Enable the continual packet loss measurement to avoid unperceived packet loss. Once starting, it does not stop unless you disable it manually.
Restrictions and guidelines
For a collector instance, the fixed duration and continual packet loss measurements cannot be both enabled.
Procedure
1. Enter system view.
system-view
2. Enter collector view.
inqa collector
3. Create a collector instance and enter its view.
instance instance-id
4. Enable the fixed duration packet loss measurement for the collector instance.
loss-measure enable duration [ duration ]
By default, the fixed duration packet loss measurement is disabled.
Enable the fixed duration packet loss measurement on middle points only in the point-to-point performance measurements.
5. Enable continual packet loss measurement for the collector instance.
loss-measure enable continual
By default, the continual packet loss measurement is disabled.
Configure the analyzer
Configuring parameters for the analyzer
1. Enter system view.
system-view
2. Enable the analyzer functionality and enter its view.
inqa analyzer
By default, the analyzer functionality is disabled.
3. Specify an analyzer ID.
analyzer id analyzer-id
By default, no analyzer ID is specified.
4. (Optional.) Specify a UDP port for communication between the analyzer and the collectors.
protocol udp-port port-number
By default, the UDP port number used for communication between the analyzer and collectors is 53312.
Configuring an analyzer instance
1. Enter system view.
system-view
2. Enter analyzer view.
inqa analyzer
3. Create an analyzer instance and enter its view.
instance instance-id
4. (Optional.) Configure a description for an analyzer instance.
description text
By default, an analyzer instance does not have a description.
5. Bind a collector to the analyzer instance.
collector collector-id
By default, no collector is bound to an analyzer instance.
Configuring an AMS
About this task
No AMSs are required in the end-to-end packet loss measurements. Configure an AMS in the point-to-point packet loss measurements.
Procedure
1. Enter system view.
system-view
2. Enter analyzer view.
inqa analyzer
3. Create an analyzer instance and enter its view.
instance instance-id
4. Create an AMS and enter its view.
ams ams-id
5. Specify the flow direction to be measured in the analyzer AMS.
flow { backward | bidirection | forward }
By default, no flow direction is specified to be measured in the analyzer AMS.
6. Add an MP to the ingress MP group for the AMS.
in-group collector collector-id mp mp-id
By default, the ingress MP group for an AMS does not have any MP.
7. Add an MP to the egress MP group for the AMS.
out-group collector collector-id mp mp-id
By default, the egress MP group for an AMS does not have any MP.
Enabling the measurement functionality
1. Enter system view.
system-view
2. Enter analyzer view.
inqa analyzer
3. Create an analyzer instance and enter its view.
instance instance-id
4. Enable the measurement functionality of the analyzer instance.
measure enable
By default, the measurement functionality of an analyzer instance is disabled.
Configuring iNQA logging
About this task
iNQA calculates the packet loss rate periodically, and the analyzer generates a log on five consecutive crossings of a threshold.
· If the packet loss rate exceeds the upper limit for consecutive five measurement intervals, the analyzer sends a log to the information center.
· If the packet loss rate is less than the lower limit for consecutive five measurement intervals, the analyzer sends an event clearing log to the information center.
You can configure the information center to determine whether to output logs and the output destination. For more information about the information center, see "Configuring information center."
Procedure
1. Enter system view.
system-view
2. Enter analyzer view.
inqa analyzer
3. Create an analyzer instance and enter its view.
instance instance-id
4. Configure packet loss logging for the analyzer instance.
loss-measure alarm upper-limit upper-limit lower-limit lower-limit
By default, the packet loss logging is not configured for an analyzer instance and the analyzer will not generate logs for threshold crossing events.
Display and maintenance commands for iNQA collector
Execute display commands in any view.
|
Task |
Command |
|
Display the collector configuration. |
display inqa collector |
|
Display the collector instance configuration. |
display inqa collector instance { instance-id | all } |
Display and maintenance commands for iNQA analyzer
Execute display commands in any view.
|
Task |
Command |
|
Display the analyzer configuration. |
display inqa analyzer |
|
Display the analyzer instance configuration. |
display inqa analyzer instance { instance-id | all } |
|
Display the AMS configuration in an analyzer instance. |
display inqa analyzer instance instance-id ams { ams-id | all } |
|
Display iNQA packet loss statistics. |
display inqa statistics loss instance instance-id [ ams ams-id ] |
iNQA configuration examples
Example: Configuring an end-to-end iNQA packet loss measurement
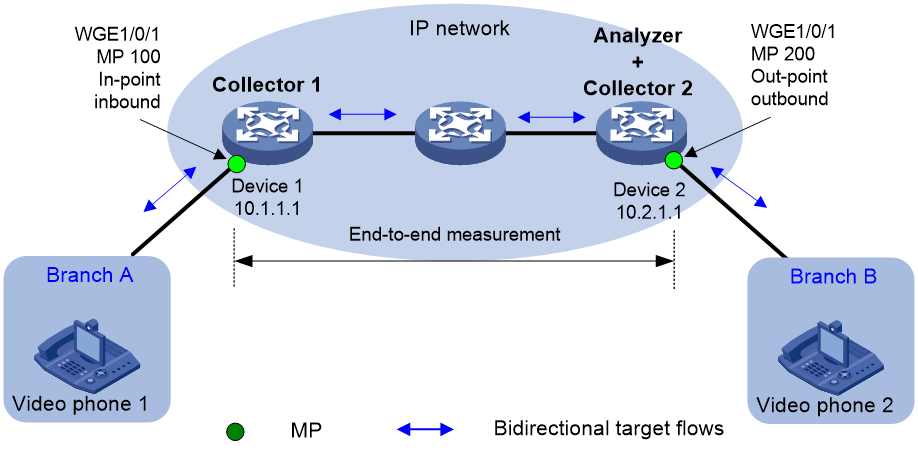
Network configuration
As shown in Figure 9, Video phone 1 sends a video data flow to Video phone 2 through an IP network. The Video phone 2 is experiencing an erratic video display problem.
· Enable the collector functionality on Device 1 and Device 2 and enable the analyzer functionality on Device 2.
· Define the flow from Device 1 to Device 2 as the forward flow.
· Set the packet loss upper limit and packet loss lower limit to 6% and 4%, respectively.
Prerequisites
1. Assign 10.1.1.1 and 10.2.1.1 to Collector 1 and Collector 2, respectively.
2. Configure OSPF in the IP network to make Collector 1 and the analyzer can reach each other. (Details not shown.)
3. Configure NTP or PTP on Collector 1 and Collector 2 for clock synchronization. (Details not shown.)
Procedure
1. Configure Collector 1:
# Specify 10.1.1.1 as the collector ID.
<Collector1> system-view
[Collector1] inqa collector
[Collector1-inqa-collector] collector id 10.1.1.1
# Bind the collector to the analyzer with ID 10.2.1.1.
[Collector1-inqa-collector] analyzer 10.2.1.1
# Specify ToS field bit 6 as the flag bit.
[Collector1-inqa-collector] flag loss-measure tos-bit 6
# Configure collector instance 1 to monitor the bidirectional flows entering the network from Twenty-FiveGigE1/0/1 between 10.1.1.0 and 10.2.1.0.
[Collector1-inqa-collector] instance 1
[Collector1-inqa-collector-instance-1] flow bidirection source-ip 10.1.1.0 24 destination-ip 10.2.1.0 24
[Collector1-inqa-collector-instance-1] mp 100 in-point port-direction inbound
[Collector1-inqa-collector-instance-1] quit
[Collector1-inqa-collector] quit
[Collector1] interface twenty-fivegige 1/0/1
[Collector1-Twenty-FiveGigE1/0/1] inqa mp 100
[Collector1-Twenty-FiveGigE1/0/1] quit
# Enable continual packet loss measurement.
[Collector1] inqa collector
[Collector1-inqa-collector] instance 1
[Collector1-inqa-collector-instance-1] loss-measure enable continual
[Collector1-inqa-collector-instance-1] return
<Collector1>
2. Configure Collector 2 and the analyzer:
# Specify 10.2.1.1 as the collector ID.
<AnalyzerColl2> system-view
[AnalyzerColl2] inqa collector
[AnalyzerColl2-inqa-collector] collector id 10.2.1.1
# Bind the collector to the analyzer with ID 10.2.1.1.
[AnalyzerColl2-inqa-collector] analyzer 10.2.1.1
# Specify ToS field bit 6 as the flag bit.
[AnalyzerColl2-inqa-collector] flag loss-measure tos-bit 6
# Configure collector instance 1 to monitor the bidirectional flows entering the network from Twenty-FiveGigE1/0/1 between 10.1.1.0 and 10.2.1.0.
[AnalyzerColl2-inqa-collector] instance 1
[AnalyzerColl2-inqa-collector-instance-1] flow bidirection source-ip 10.1.1.0 24 destination-ip 10.2.1.0 24
[AnalyzerColl2-inqa-collector-instance-1] mp 200 out-point port-direction outbound
[AnalyzerColl2-inqa-collector-instance-1] quit
[AnalyzerColl2-inqa-collector] quit
[AnalyzerColl2] interface twenty-fivegige 1/0/1
[AnalyzerColl2-Twenty-FiveGigE1/0/1] inqa mp 200
[AnalyzerColl2-Twenty-FiveGigE1/0/1] quit
# Enable continual packet loss measurement.
[AnalyzerColl2] inqa collector
[AnalyzerColl2-inqa-collector] instance 1
[AnalyzerColl2-inqa-collector-instance-1] loss-measure enable continual
[AnalyzerColl2-inqa-collector-instance-1] quit
[AnalyzerColl2-inqa-collector] quit
# Specify 10.2.1.1 as the analyzer ID.
[AnalyzerColl2] inqa analyzer
[AnalyzerColl2-inqa-analyzer] analyzer id 10.2.1.1
# Bind analyzer instance 1 to Collector 1 and Collector 2.
[AnalyzerColl2-inqa-analyzer] instance 1
[AnalyzerColl2-inqa-analyzer-instance-1] collector 10.1.1.1
[AnalyzerColl2-inqa-analyzer-instance-1] collector 10.2.1.1
# Set the packet loss upper limit and lower limit to 6% and 4%, respectively.
[AnalyzerColl2-inqa-analyzer-instance-1] loss-measure alarm upper-limit 6 lower-limit 4
# Enable the measurement functionality of analyzer instance 1.
[AnalyzerColl2-inqa-analyzer-instance-1] measure enable
[AnalyzerColl2-inqa-analyzer-instance-1] return
<AnalyzerColl2>
Verifying the configuration
1. On Collector 1:
# Display the collector configuration.
<Collector1> display inqa collector
Collector ID : 10.1.1.1
Loss-measure flag : 6
Analyzer ID : 10.2.1.1
Analyzer UDP-port : 53312
VPN-instance-name : --
Current instance count : 1
# Display the configuration of collector instance 1.
<Collector1> display inqa collector instance 1
Instance ID : 1
Status : Enabled
Duration : --
Description : --
Analyzer ID : --
Analyzer UDP-port : --
VPN-instance-name : --
Interval : 10 sec
Flow configuration:
flow bidirection source-ip 10.1.1.0 24 destination-ip 10.2.1.0 24
MP configuration:
mp 100 in-point inbound, WGE1/0/1
2. On Collector 2 and the analyzer:
# Display the collector configuration.
<AnalyzerColl2> display inqa collector
Collector ID : 10.2.1.1
Loss-measure flag : 6
Analyzer ID : 10.2.1.1
Analyzer UDP-port : 53312
VPN-instance-name : --
Current instance count : 1
# Display the configuration of collector instance 1.
<AnalyzerColl2> display inqa collector instance 1
Instance ID : 1
Status : Enabled
Duration : --
Description : --
Analyzer ID : --
Analyzer UDP-port : --
VPN-instance-name : --
Interval : 10 sec
Flow configuration:
flow bidirection source-ip 10.1.1.0 24 destination-ip 10.2.1.0 24
MP configuration:
mp 200 out-point outbound, WGE1/0/1
# Display the analyzer configuration.
<AnalyzerColl2> display inqa analyzer
Analyzer ID : 10.2.1.1
Protocol UDP-port : 53312
Current instance count : 1
# Display the configuration of analyzer instance 1.
<AnalyzerColl2> display inqa analyzer instance 1
Instance ID : 1
Status : Enable
Description : --
Alarm upper-limit : 6.000000%
Alarm lower-limit : 4.000000%
Current AMS count : 0
Collectors : 10.1.1.1
10.2.1.1
# Display iNQA packet loss statistics of analyzer instance 1.
<AnalyzerColl2> display inqa statistics loss instance 1
Latest packet loss statistics for forward flow:
Period LostPkts PktLoss% LostBytes ByteLoss%
19122483 15 15.000000% 1500 15.000000%
19122482 15 15.000000% 1500 15.000000%
19122481 15 15.000000% 1500 15.000000%
19122480 15 15.000000% 1500 15.000000%
19122479 15 15.000000% 1500 15.000000%
19122478 15 15.000000% 1500 15.000000%
Latest packet loss statistics for backward flow:
Period LostPkts PktLoss% LostBytes ByteLoss%
19122483 15 15.000000% 1500 15.000000%
19122482 15 15.000000% 1500 15.000000%
19122481 15 15.000000% 1500 15.000000%
19122480 15 15.000000% 1500 15.000000%
19122479 15 15.000000% 1500 15.000000%
19122478 15 15.000000% 1500 15.000000%
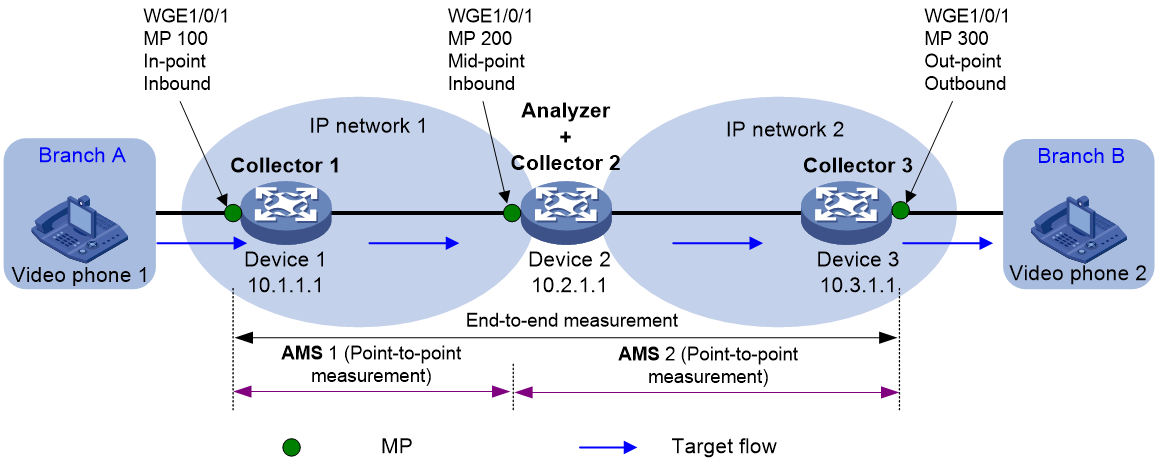
Example: Configuring an point-to-point iNQA packet loss measurement
As shown in Figure 10, Video phone 1 sends a video data flow to Video phone 2 through an IP network. The Video phone 2 is experiencing an erratic video display problem.
· Enable the collector functionality on Device 1, Device 2, and Device 3, and enable the analyzer functionality on Device 2.
· Define the flow from Device 1 to Device 3 as the forward flow.
· Set the packet loss upper limit and packet loss lower limit to 6% and 4%, respectively.
· Run the packet loss measurement for 15 minutes.
Prerequisites
1. Assign 10.1.1.1, 10.2.1.1, and 10.3.1.1 to Collector 1, Collector 2, and Collector 3, respectively.
2. Configure OSPF in the IP network to make sure the analyzer Collector 1, Collector 3, and the analyzer can reach each other. (Details not shown.)
3. Configure NTP or PTP on Collector 1, Collector 2, and Collector 3 for clock synchronization. (Details not shown.)
Procedure
1. Configure Collector 1:
# Specify 10.1.1.1 as the collector ID.
<Collector1> system-view
[Collector1] inqa collector
[Collector1-inqa-collector] collector id 10.1.1.1
# Bind the collector to the analyzer with ID 10.2.1.1.
[Collector1-inqa-collector] analyzer 10.2.1.1
# Specify ToS field bit 6 as the flag bit.
[Collector1-inqa-collector] flag loss-measure tos-bit 6
# Configure collector instance 1 to monitor the forward flow entering the network at Twenty-FiveGigE1/0/1 from 10.1.1.0 and 10.3.1.0.
[Collector1-inqa-collector] instance 1
[Collector1-inqa-collector-instance-1] flow forward source-ip 10.1.1.0 24 destination-ip 10.3.1.0 24
[Collector1-inqa-collector-instance-1] mp 100 in-point port-direction inbound
[Collector1-inqa-collector-instance-1] quit
[Collector1-inqa-collector] quit
[Collector1] interface twenty-fivegige 1/0/1
[Collector1-Twenty-FiveGigE1/0/1] inqa mp 100
[Collector1-Twenty-FiveGigE1/0/1] quit
# Run the packet loss measurement for 15 minutes for collector instance 1.
[Collector1] inqa collector
[Collector1-inqa-collector] instance 1
[Collector1-inqa-collector-instance-1] loss-measure enable duration 15
[Collector1-inqa-collector-instance-1] return
<Collector1>
2. Configure Collector 2 and the analyzer:
# Specify 10.2.1.1 as the collector ID.
<AnalyzerColl2> system-view
[AnalyzerColl2] inqa collector
[AnalyzerColl2-inqa-collector] collector id 10.2.1.1
# Bind the collector to the analyzer with ID 10.2.1.1.
[AnalyzerColl2-inqa-collector] analyzer 10.2.1.1
# Specify ToS field bit 6 as the flag bit.
[AnalyzerColl2-inqa-collector] flag loss-measure tos-bit 6
# Configure collector instance 1 to monitor the forward flow entering the network at Twenty-FiveGigE1/0/1 from 10.1.1.0 and 10.3.1.0.
[AnalyzerColl2-inqa-collector] instance 1
[AnalyzerColl2-inqa-collector-instance-1] flow forward source-ip 10.1.1.0 24 destination-ip 10.3.1.0 24
[AnalyzerColl2-inqa-collector-instance-1] mp 200 mid-point port-direction inbound
[AnalyzerColl2-inqa-collector-instance-1] quit
[AnalyzerColl2-inqa-collector] quit
[AnalyzerColl2] interface twenty-fivegige 1/0/1
[AnalyzerColl2-Twenty-FiveGigE1/0/1] inqa mp 200
[AnalyzerColl2-Twenty-FiveGigE1/0/1] quit
# Run the packet loss measurement for 15 minutes for collector instance 1.
[AnalyzerColl2] inqa collector
[AnalyzerColl2-inqa-collector] instance 1
[AnalyzerColl2-inqa-collector-instance-1] loss-measure enable duration 15
[AnalyzerColl2-inqa-collector-instance-1] quit
[AnalyzerColl2-inqa-collector] quit
# Specify 10.2.1.1 as the analyzer ID.
[AnalyzerColl2] inqa analyzer
[AnalyzerColl2-inqa-analyzer] analyzer id 10.2.1.1
# Bind analyzer instance 1 to Collector 1, Collector 2, and Collector 3.
[AnalyzerColl2-inqa-analyzer] instance 1
[AnalyzerColl2-inqa-analyzer-instance-1] collector 10.1.1.1
[AnalyzerColl2-inqa-analyzer-instance-1] collector 10.2.1.1
[AnalyzerColl2-inqa-analyzer-instance-1] collector 10.3.1.1
# Configure AMS 1 to measure the packet loss rate for the forward flow from MP 100 to MP 200.
[AnalyzerColl2-inqa-analyzer-instance-1] ams 1
[AnalyzerColl2-inqa-analyzer-instance-1-ams-1] flow forward
[AnalyzerColl2-inqa-analyzer-instance-1-ams-1] in-group collector 10.1.1.1 mp 100
[AnalyzerColl2-inqa-analyzer-instance-1-ams-1] out-group collector 10.2.1.1 mp 200
[AnalyzerColl2-inqa-analyzer-instance-1-ams-1] quit
# Configure AMS 2 to measure the packet loss rate for the forward flow from MP 200 to MP 300.
[AnalyzerColl2-inqa-analyzer-instance-1] ams 2
[AnalyzerColl2-inqa-analyzer-instance-1-ams-2] flow forward
[AnalyzerColl2-inqa-analyzer-instance-1-ams-2] in-group collector 10.2.1.1 mp 200
[AnalyzerColl2-inqa-analyzer-instance-1-ams-2] out-group collector 10.3.1.1 mp 300
[AnalyzerColl2-inqa-analyzer-instance-1-ams-2] quit
# Set the packet loss upper limit and lower limit to 6% and 4%, respectively.
[AnalyzerColl2-inqa-analyzer-instance-1] loss-measure alarm upper-limit 6 lower-limit 4
# Enable the measurement functionality of analyzer instance 1.
[AnalyzerColl2-inqa-analyzer-instance-1] measure enable
[AnalyzerColl2-inqa-analyzer-instance-1] return
<AnalyzerColl2>
3. Configure Collector 3:
# Specify 10.3.1.1 as the collector ID.
<Collector3> system-view
[Collector3] inqa collector
[Collector3-inqa-collector] collector id 10.3.1.1
# Bind the collector to the analyzer with ID 10.2.1.1.
[Collector3-inqa-collector] analyzer 10.2.1.1
# Specify ToS field bit 6 as the flag bit.
[Collector3-inqa-collector] flag loss-measure tos-bit 6
# Configure collector instance 1 to monitor the forward flow entering the network at Twenty-FiveGigE1/0/1 from 10.1.1.0 and 10.3.1.0.
[Collector3-inqa-collector] instance 1
[Collector3-inqa-collector-instance-1] flow forward source-ip 10.1.1.0 24 destination-ip 10.3.1.0 24
[Collector3-inqa-collector-instance-1] mp 300 out-point port-direction outbound
[Collector3-inqa-collector-instance-1] quit
[Collector3-inqa-collector] quit
[Collector3] interface twenty-fivegige 1/0/1
[Collector3-Twenty-FiveGigE1/0/1] inqa mp 300
[Collector3-Twenty-FiveGigE1/0/1] quit
# Run the packet loss measurement for 15 minutes for collector instance 1.
[Collector3] inqa collector
[Collector3-inqa-collector] instance 1
[Collector3-inqa-collector-instance-1] loss-measure enable duration 15
[Collector3-inqa-collector-instance-1] return
<Collector3>
Verifying the configuration
1. On Collector 1:
# Display the collector configuration.
<Collector1> display inqa collector
Collector ID : 10.1.1.1
Loss-measure flag : 6
Analyzer ID : 10.2.1.1
Analyzer UDP-port : 53312
VPN-instance-name : --
Current instance count : 1
# Display the configuration of collector instance 1.
<Collector1> display inqa collector instance 1
Instance ID : 1
Status : Enabled
Duration : 15 min (Non mid-point)
Remaining time : 14 min 52 sec
Description : --
Analyzer ID : --
Analyzer UDP-port : --
VPN-instance-name : --
Interval : 10 sec
Flow configuration:
flow forward source-ip 10.1.1.0 24 destination-ip 10.3.1.0 24
MP configuration:
mp 100 in-point inbound, WGE1/0/1
2. On Collector 2 and the analyzer:
# Display the collector configuration.
<AnalyzerColl2> display inqa collector
Collector ID : 10.2.1.1
Loss-measure flag : 6
Analyzer ID : 10.2.1.1
Analyzer UDP-port : 53312
VPN-instance-name : --
Current instance count : 1
# Display the configuration of collector instance 1.
<AnalyzerColl2> display inqa collector instance 1
Instance ID : 1
Status : Enabled
Duration : 15 min (Mid-point)
Remaining time : 14 min 50 sec
Description : --
Analyzer ID : --
Analyzer UDP-port : --
VPN-instance-name : --
Interval : 10 sec
Flow configuration:
flow forward source-ip 10.1.1.0 24 destination-ip 10.3.1.0 24
MP configuration:
mp 200 mid-point inbound, WGE1/0/1
# Display analyzer configuration.
<AnalyzerColl2> display inqa analyzer
Analyzer ID : 10.2.1.1
Protocol UDP-port : 53312
Current instance count : 1
# Display the configuration of analyzer instance 1.
<AnalyzerColl2> display inqa analyzer instance 1
Instance ID : 1
Status : Enabled
Description : --
Alarm upper-limit : 6.000000%
Alarm lower-limit : 4.000000%
Current AMS count : 2
Collectors : 10.1.1.1
10.2.1.1
10.3.1.1
# Display the configuration of all AMSs in analyzer instance 1.
<AnalyzerColl2> display inqa analyzer instance 1 ams all
AMS ID : 1
Flow direction : forward
In-group : collector 10.1.1.1 mp 100
Out-group : collector 10.2.1.1 mp 200
AMS ID : 2
Flow direction : forward
In-group : collector 10.2.1.1 mp 200
Out-group : collector 10.3.1.1 mp 300
# Display iNQA packet loss statistics of analyzer instance 1.
<AnalyzerColl2> display inqa statistics loss instance 1 ams 1
Latest packet loss statistics for forward flow:
Period LostPkts PktLoss% LostBytes ByteLoss%
19122483 15 15.000000% 1500 15.000000%
19122482 15 15.000000% 1500 15.000000%
19122481 15 15.000000% 1500 15.000000%
19122480 15 15.000000% 1500 15.000000%
19122479 15 15.000000% 1500 15.000000%
19122478 15 15.000000% 1500 15.000000%
3. On Collector 3:
# Display the collector configuration.
<Collector3> display inqa collector
Collector ID : 10.3.1.1
Loss-measure flag : 6
Analyzer ID : 10.2.1.1
Analyzer UDP-port : 53312
VPN-instance-name : --
Current instance count : 1
# Display the configuration of collector instance 1.
<Collector3> display inqa collector instance 1
Instance ID : 1
Status : Enabled
Duration : 15 min (Non mid-point)
Remaining time : 14 min 51 sec
Description : --
Analyzer ID : --
Analyzer UDP-port : --
VPN-instance-name : --
Interval : 10 sec
Flow configuration:
flow forward source-ip 10.1.1.0 24 destination-ip 10.3.1.0 24
MP configuration:
mp 300 out-point outbound, WGE1/0/1