- Table of Contents
- Related Documents
-
| Title | Size | Download |
|---|---|---|
| 01-Text | 10.54 MB |
Contents
Application monitor management
Topology and application group management
Application manager perspective
Tenant self maintenance perspective
Viewing the application monitor list
Customizing the application monitor list
Viewing associated applications
Modifying an application monitor
Setting the management status of an application monitor
Viewing the APM server details
Importing/exporting usernames and passwords
Configuring the import template
Viewing a host monitor in host mode
Viewing a host monitor in list mode
Topology and application group management
Topology tools and right-click menu
Viewing an application topology
Viewing the application group list
Viewing the application group details
Modifying an application group
Installing and upgrading an APM agent
Installing an APM agent locally
Installing an APM agent remotely
Upgrading an APM agent locally
Upgrading an APM agent remotely
Viewing the auto discovery result
Viewing the global threshold List
Adding threshold configuration
Modifying global threshold configuration
Deleting monitor indexes from threshold configuration
Configuring a monitor index to use global threshold or custom threshold
Modifying custom threshold configuration
Viewing the baseline configuration list
Modifying baseline configuration
Viewing the application default port list
Modifying the application default port list
Deploying network configuration to probes
APM administrator configuration
Viewing the APM administrator list
Modifying an APM administrator
Viewing the template configuration list
Adding an application template
Modifying an application template
Adding a Windows application monitor
Modifying a Windows application monitor
Viewing the Windows application monitor report
Adding a Windows performance counter application monitor
Modifying a Windows performance counter application monitor
Viewing the Windows performance counter application monitor report
Adding an AIX application monitor
Modifying an AIX application monitor
Viewing the AIX application monitor report
Adding an SCO UNIX application monitor
Modifying an SCO UNIX application monitor
Viewing the SCO UNIX application monitor report
Adding a Solaris application monitor
Modifying a Solaris application monitor
Viewing the Solaris application monitor report
Adding a FreeBSD application monitor
Modifying a FreeBSD application monitor
Viewing the FreeBSD application monitor report
Adding a Mac OS application monitor
Modifying a Mac OS application monitor
Viewing the Mac OS application monitor report
Adding an OpenBSD application monitor
Modifying an OpenBSD application monitor
Viewing the OpenBSD application monitor report
Adding an HP-UX application monitor
Modifying an HP-UX application monitor
Viewing the HP-UX application monitor report
Adding an AS400 application monitor
Modifying an AS400 application monitor
Viewing the AS400 application monitor report
Adding a Linux application monitor
Modifying a Linux application monitor
Viewing the Linux application monitor report
Adding a NeoKylin application monitor
Modifying a NeoKylin application monitor
Viewing the NeoKylin application monitor report
Adding a Rocky application monitor
Modifying a Rocky application monitor
Viewing the Rocky application monitor report
Adding a SQL Server application monitor
Modifying a SQL Server application monitor
Viewing the SQL Server application monitor report
Adding a MySQL application monitor
Modifying a MySQL application monitor
Viewing MySQL application monitor report
Adding an Oracle application monitor
Modifying an Oracle application monitor
Viewing the Oracle application monitor report
Adding a DB2 application monitor
Modifying a DB2 application monitor
Viewing the DB2 application monitor report
Adding a Caché application monitor
Modifying a Caché application monitor
Viewing the Caché application monitor report
Configuring an Informix server
Adding an Informix application monitor
Modifying an Informix application monitor
Viewing the Informix application monitor report
Adding a MemCached application monitor
Modifying a MemCached application monitor
Viewing the MemCached application monitor report
Adding a MongoDB application monitor
Modifying a MongoDB application monitor
Viewing the MongoDB application monitor report
Adding a DM application monitor
Modifying a DM application monitor
Viewing the DM application monitor report
Adding an Oracle ASM application monitor
Modifying an Oracle ASM application monitor
Viewing the Oracle ASM application monitor report
Adding a PostgreSQL application monitor
Modifying a PostgreSQL application monitor
Viewing the PostgreSQL application monitor report
Adding a DBQuery application monitor
Modifying a DBQuery application monitor
Viewing the DBQuery application monitor report
Adding a Sybase application monitor
Modifying a Sybase application monitor
Viewing the Sybase application monitor report
Adding a Xugu application monitor
Modifying a Xugu application monitor
Viewing the Xugu application monitor report
Adding a .NET server application monitor
Modifying a .NET server application monitor
Viewing the .NET server application monitor report
Configuring the JBoss server and the APM server
Adding a JBoss server application monitor
Modifying a JBoss server application monitor
Viewing the JBoss server application monitor report
Configuring the Tomcat server to support JMX monitoring
Adding a Tomcat server application monitor
Modifying a Tomcat server application monitor
Viewing the Tomcat server application monitor report
Adding a Lync Server 2010 application monitor
Modifying a Lync Server 2010 application monitor
Viewing the Lync Server 2010 application monitor report
Adding a Lync Server 2013 application monitor
Modifying a Lync Server 2013 application monitor
Viewing the Lync Server 2013 application monitor report
Adding an Oracle AS application monitor
Modifying an Oracle AS application monitor
Viewing the Oracle AS application monitor report
Copying Weblogic API files to the APM server
Adding a WebLogic server application monitor
Modifying a WebLogic server application monitor
Viewing the WebLogic server application monitor report
Adding a GlassFish server application monitor
Modifying a GlassFish server application monitor
Viewing the GlassFish server application monitor report
Adding a WebSphere server application monitor
Modifying a WebSphere server application monitor
Viewing the WebSphere server application monitor report
Adding a Jetty application monitor
Modifying a Jetty application monitor
Viewing the Jetty application monitor report
Configuring the Lotus Domino server
Adding a Lotus Domino server application monitor
Modifying a Lotus Domino server application monitor
Viewing the Lotus Domino server application monitor report
Configuring the Lotus Domino server
Adding a Domino Server Authentication application monitor
Modifying a Domino Server Authentication application monitor
Viewing the Domino Server Authentication application monitor report
Adding an Apache server application monitor
Modifying an Apache server application monitor
Viewing the Apache server application monitor report
Adding an IIS server application monitor
Modifying an IIS server application monitor
Viewing the IIS server application monitor report
Adding an Nginx server application monitor
Modifying an Nginx server application monitor
Viewing the Nginx server application monitor report
Adding a PHP application monitor
Modifying a PHP application monitor
Viewing the PHP application monitor report
Adding an Exchange Server 2003 application monitor
Modifying an Exchange Server 2003 application monitor
Viewing the Exchange Server 2003 application monitor report
Adding an Exchange Server 2007 application monitor
Modifying an Exchange Server 2007 application monitor
Viewing the Exchange Server 2007 application monitor report
Adding an Exchange Server 2010 application monitor
Modifying an Exchange Server 2010 application monitor
Viewing the Exchange Server 2010 application monitor report
Adding an Exchange Server 2013 application monitor
Modifying an Exchange Server 2013 application monitor
Viewing the Exchange Server 2013 application monitor report
Adding a POP3 application monitor
Modifying a POP3 application monitor
Viewing the POP3 application monitor report
Adding an SMTP application monitor
Modifying an SMTP application monitor
Viewing the SMTP application monitor report
Adding a RESTful Web service application monitor
Modifying a RESTful Web service application monitor
Viewing the RESTful Web service application monitor report
Adding a SOAP-based Web service application monitor
Modifying a SOAP-based Web service application monitor
Viewing the SOAP-based Web service application monitor report
Adding an AD service application monitor
Modifying an AD service application monitor
Viewing the AD service application monitor report
Adding an LDAP service application monitor
Modifying an LDAP service application monitor
Viewing the LDAP service application monitor report
Viewing the file monitor report
Viewing the directory monitor report
Adding an SNMP service application monitor
Modifying an SNMP service application monitor
Viewing the SNMP service application monitor report
Adding a DNS service application monitor
Modifying a DNS service application monitor
Viewing the DNS service application monitor report
Configuring Java Runtime to support RMI access
Adding Java Runtime application monitor
Modifying Java Runtime application monitor
Viewing Java Runtime application monitor report
Adding an FTP service application monitor
Modifying an FTP service application monitor
Viewing the FTP service application monitor report
Adding an SFTP service application monitor
Modifying an SFTP service application monitor
Viewing the SFTP service application monitor report
Adding an IPMI service application monitor
Modifying an IPMI service application monitor
Viewing the IPMI service application monitor report
Adding a ping test service application monitor
Modifying a ping test service application monitor
Viewing the ping test service application monitor report
Adding a TCP Port application monitor
Modifying a TCP Port application monitor
Viewing the TCP Port application monitor report
Adding a Ceph application monitor
Modifying a Ceph application monitor
Viewing the Ceph application monitor report
Adding a Dell CMC application monitor
Modifying a Dell CMC application monitor
Viewing the Dell CMC application monitor report
Adding a Ping Command application monitor
Modifying a Ping Command application monitor
Viewing the Ping Command application monitor report
Adding a Common Application application monitor
Modifying a Common Application application monitor
Viewing the Common Application application monitor report
Adding a URL application monitor
Modifying a URL application monitor
Viewing the URL application monitor report
Adding a URL sequence application monitor
Modifying a URL sequence application monitor
Viewing the URL sequence application monitor report
Adding an Office SharePoint 2007 application monitor
Modifying an Office SharePoint 2007 application monitor
Viewing the Office SharePoint 2007 application monitor report
Adding an Office SharePoint 2010 application monitor
Modifying an Office SharePoint 2010 application monitor
Viewing the Office SharePoint 2010 application monitor report
Adding an Office SharePoint 2013 application monitor
Modifying an Office SharePoint 2013 application monitor
Viewing the Office SharePoint 2013 application monitor report
Adding an ActiveMQ application monitor
Modifying an ActiveMQ application monitor
Viewing the ActiveMQ application monitor report
Adding a Hadoop application monitor
Modifying a Hadoop application monitor
Viewing the Hadoop application monitor report
Adding an Oracle GoldenGate application monitor
Modifying an Oracle GoldenGate application monitor
Viewing the Oracle GoldenGate application monitor report
Adding a RabbitMQ application monitor
Modifying a RabbitMQ application monitor
Viewing the RabbitMQ application monitor report
Adding a TongLINK/Q application monitor
Modifying a TongLINK/Q application monitor
Viewing the TongLINK/Q application monitor report
Adding a WebSphere MQ application monitor
Modifying a WebSphere MQ application monitor
Viewing the WebSphere MQ application monitor report
Adding a SAP application monitor
Modifying a SAP application monitor
Viewing the SAP application monitor report
Adding a Citrix XenServer application monitor
Modifying a Citrix XenServer application monitor
Viewing the Citrix XenServer application monitor report
Adding a Hyper-V application monitor
Modifying a Hyper-V application monitor
Viewing the Hyper-V application monitor report
Adding a KVM application monitor
Modifying a KVM application monitor
Viewing the KVM application monitor report
Adding a CAS application monitor
Modifying a CAS application monitor
Viewing the CAS application monitor report
Adding a PowerCenter application monitor
Modifying a PowerCenter application monitor
Viewing the PowerCenter application monitor report
Adding a VMware ESX application monitor
Modifying a VMware ESX application monitor
Viewing the VMware ESX application monitor report
Adding a VMware vCenter Server application monitor
Modifying a VMware vCenter Server application monitor
Viewing the VMware vCenter Server application monitor report
Adding an HW FusionCompute application monitor
Modifying an HW FusionCompute application monitor
Viewing the HW FusionCompute application monitor report
Common storage device application monitor
Adding a common storage device application monitor
Modifying a common storage device application monitor
Viewing the common storage device application monitor report
EMC CLARiiON application monitor
Adding an EMC CLARiiON application monitor
Modifying an EMC application monitor
Viewing the EMC application monitor report
Adding an HP 3PAR application monitor
Modifying an HP 3PAR application monitor
Viewing the HP 3PAR application monitor report
HP MSA P2000 application monitor
Adding an HP MSA P2000 application monitor
Modifying an HP MSA P2000 application monitor
Viewing the HP MSA P2000 application monitor report
HW OceanStor 18500 V3 application monitor
Adding an HW OceanStor 18500 V3 application monitor
Modifying an 18500 V3 application monitor
Viewing the 18500 V3 application monitor report
HW OceanStor S3900 application monitor
Adding an HW OceanStor S3900 application monitor
Modifying an HW OceanStor S3900 application monitor
Viewing the HW OceanStor S3900 application monitor report
IBM Storwize V5000 application monitor
Adding an IBM Storwize V5000 application monitor
Modifying an IBM Storwize V5000 application monitor
Viewing the IBM Storwize V5000 application monitor report
IBM Storwize V7000 application monitor
Adding an IBM Storwize V7000 application monitor
Modifying an IBM Storwize V7000 application monitor
Viewing the IBM Storwize V7000 application monitor report
Adding a P5730 application monitor
Modifying a P5730 application monitor
Viewing the P5730 application monitor report
Hitachi VSP application monitor
Adding a Hitachi VSP application monitor
Modifying a Hitachi VSP application monitor
Viewing the Hitachi VSP application monitor report
EMC VMAX 100K application monitor
Adding an EMC VMAX 100K application monitor
Modifying an EMC VMAX 100K application monitor
Viewing the EMC VMAX 100K application monitor report
Application Manager overview
Intelligent Management Center (IMC) is a converged network management product that manages resources, users, and services. It provides network management solutions based on the IMC platform and service components.
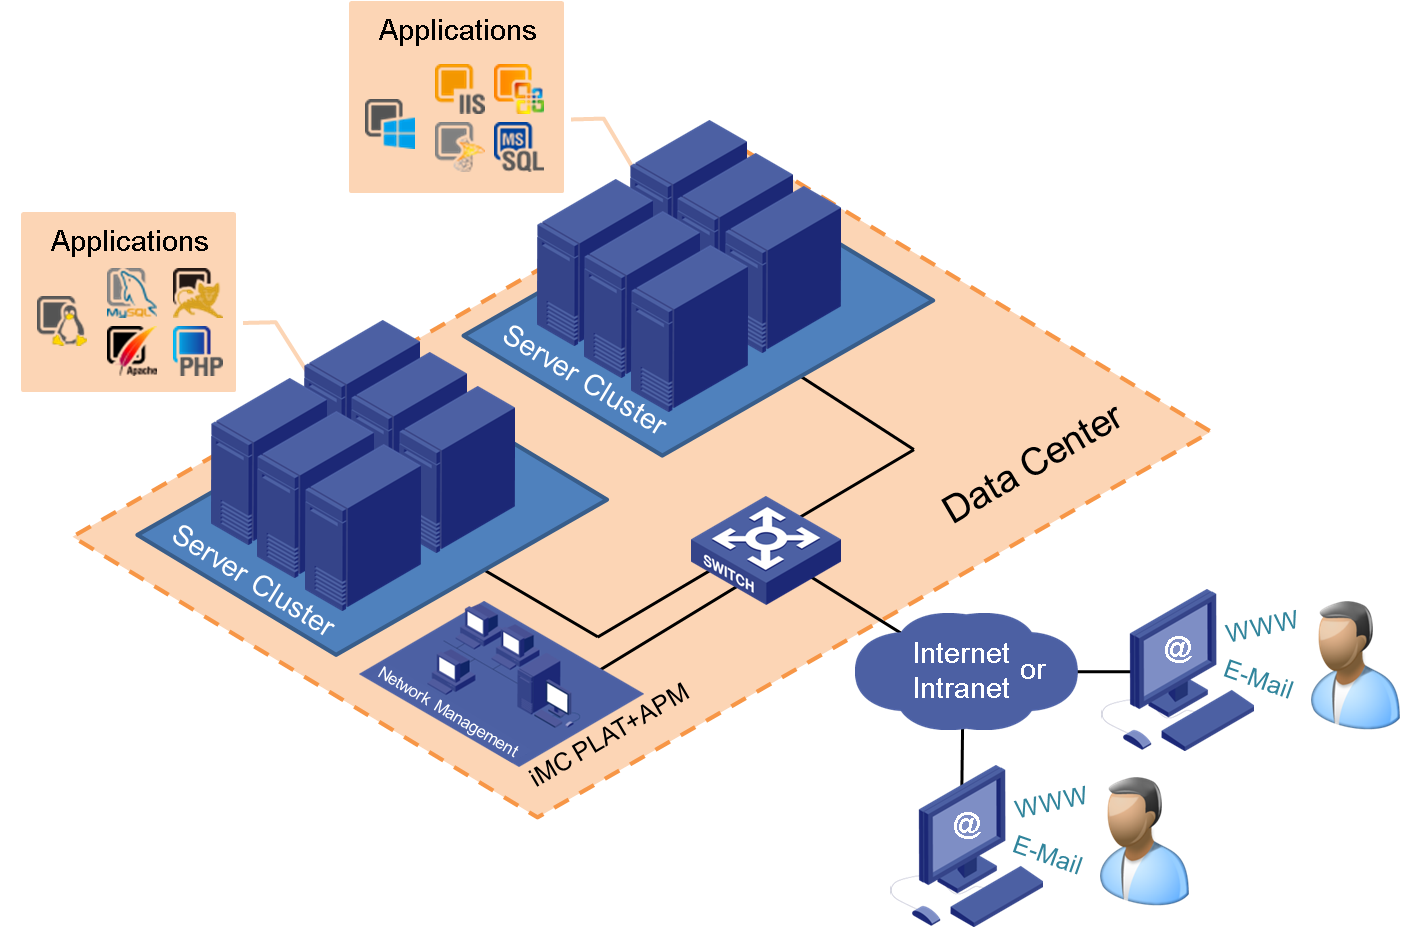
Application Manager (APM) is a resource component of IMC that monitors applications in a data center. During the monitor process, APM collects monitor index data and then generates application monitor reports. You can use the monitor reports to locate application performance bottlenecks and ensure available, reliable, and continuous services. The collected monitor data can also be used for further analysis of other IMC services.
Application scenario
As shown in Figure 1, applications are deployed on each server in the server clusters to provide services to users. APM is located on the network to monitor these applications.
Applications monitored by APM
This section describes applications that can be monitored by APM, common monitor, and specific monitor.
Monitored applications
Table 1 lists applications that can be monitored by APM.
Table 1 Available applications
|
Category |
Application Type |
|
Windows Server |
Windows XP |
|
Windows Server |
|
|
Windows Performance Counter |
|
|
Unix Server |
AIX UNIX |
|
FreeBSD |
|
|
OpenBSD |
|
|
HP-UX |
|
|
Solaris |
|
|
MAC OS |
|
|
SCO Unix |
|
|
AS400 |
|
|
Linux server |
Linux |
|
Kylin |
|
|
Rocky |
|
|
Database server |
MySQL |
|
Oracle |
|
|
MS SQL |
|
|
Sybase |
|
|
IBM DB2 |
|
|
PostgreSQL |
|
|
Informix |
|
|
Oracle ASM |
|
|
DM |
|
|
Cache |
|
|
Database Query |
|
|
xugu |
|
|
MongoDB |
|
|
MemCached |
|
|
Application server |
Microsoft .NET |
|
JBoss |
|
|
Tomcat |
|
|
WebLogic |
|
|
Oracle AS |
|
|
WebSphere |
|
|
GlassFish |
|
|
Lotus Domino |
|
|
Lync 2010 |
|
|
Lync 2013 |
|
|
Jetty |
|
|
Domino Server Authentication Application Monitor |
|
|
Web server |
Apache |
|
IIS |
|
|
Nginx |
|
|
PHP |
|
|
Mail server |
Exchange2003 |
|
Exchange2007 |
|
|
Exchange2010 |
|
|
Exchange2013 |
|
|
SMTP, POP3 mail server |
|
|
Middleware |
Office SharePoint 2007 |
|
Office SharePoint 2010 |
|
|
Office SharePoint 2013 |
|
|
WebSphere MQ |
|
|
Active MQ |
|
|
TongLINK/Q |
|
|
Oracle GoldenGate |
|
|
RabbitMQ |
|
|
HTTP service |
URL monitor |
|
URL Sequence |
|
|
WEB service |
SOAP |
|
REST |
|
|
LDAP service |
ActiveDirectory |
|
Common LDAP |
|
|
File system |
File |
|
Directory |
|
|
Common Services |
SNMP |
|
DNS |
|
|
Ping Test Monitor |
|
|
JVM |
|
|
FTP/SFTP |
|
|
TCP Port |
|
|
Ceph |
|
|
IPMI |
|
|
SAP |
SAP |
|
Virtual Machine |
Hyper-V |
|
KVM |
|
|
VMware ESX |
|
|
CAS |
|
|
Citrix Xen |
|
|
VMware vCenter Server |
|
|
FusionCompute V100R005C00SPC300 |
|
|
Storage |
HP MSA P2000 |
|
IBM V5000 |
|
|
Huawei S3900 |
|
|
IBM V7000 |
|
|
HP 3PAR |
|
|
H3C P5730 |
|
|
EMC CLARiiON |
|
|
HW OceanStor 18500 V3 |
Applications monitored by APM include operating systems, databases, application servers, services, and middleware. These applications provide key services for enterprises and organizations.
After an operator adds applications to APM, APM collects monitor data and evaluates the availability and health status of the applications.
Application monitor includes common monitor and specific monitor based on the application scope. APM can monitor most mainstream network applications by using common monitor and specific monitor.
Common monitor
Use common monitor to monitor the availability and health status of one class of applications based on their common characteristics. For example, you can use POP3 and SMTP application monitors to monitor multiple email systems that provide POP3 service and SMTP service.
Specific monitor
Use specific monitor to monitor the availability and health status of one type of application based on its specific indexes. Specific monitor gets more application index data than common monitor. You can implement in-depth monitoring on applications through specific monitor, such as Exchange 2003 application monitor and Exchange 2007 application monitor.
Application monitor mode
Before APM monitors applications, make sure the APM server and the hosts where applications are deployed can reach each other.
APM monitors applications in local or remote mode.
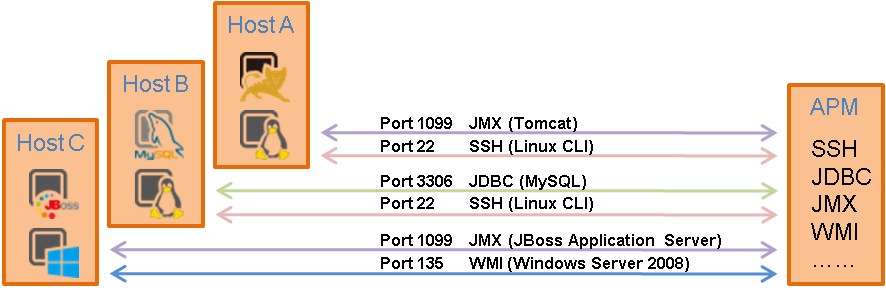
Remote monitor
APM accesses an application to obtain monitor index data by using SSH, Telnet, SNMP, WMI, JMX, API, or JDBC, as shown in Figure 2.
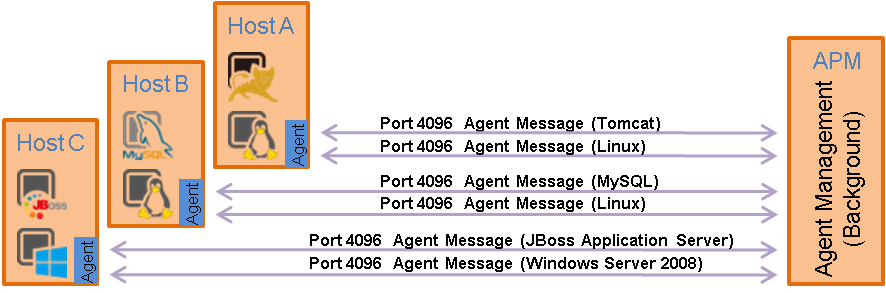
Local monitor
In this mode, you must deploy an APM agent on the host where the application is deployed. The APM agent obtains monitor index data of the application by using SSH, Telnet, SNMP, WMI, JMX, API, or JDBC. APM periodically communicates with the APM agent by using Agent messages to obtain monitor index data.
Figure 3 Local monitor
Local monitor enhances data security and can collect monitor index data that remote monitor cannot (for example, Oracle database error log files). However, local monitor supports monitoring fewer types of applications.
Monitor method
Table 2 Monitor method
|
Monitor method |
Default port |
Description |
|
SSH/Telnet (CLI) |
· TCP 23 (for Telnet) · TCP 22 (for SSH) |
APM accesses the Linux or Unix OS by using Telnet or SSH, and executes commands to obtain monitor index data. |
|
SNMP |
UDP 161 |
Simple Network Management Protocol (SNMP) is supported by most operating systems and network devices. APM uses the SNMP agent deployed on the host to obtain monitor index data of the host. The default listening port cannot be modified. |
|
WMI |
TCP 135 |
Windows Management Instrumentation (WMI) is a core management technology that allows APM to collect monitor indexes from applications such as a Windows, IIS, .NET server, and AD directory. |
|
JMX |
TCP 1099 |
Java Management Extensions (JMX) provides a platform for managing applications, devices, and systems. APM collects Tomcat and JBoss monitor index data by using JMX. |
|
JDBC |
N/A |
Java Database Connectivity (JDBC) is a Java API to execute SQL statements and provide access to multiple types of relation databases. |
|
API |
N/A |
Application Programming Interface (API) includes predefined functions. APM uses the predefined functions to obtain monitor index data of applications. |
APM monitor features
APM provides operators with the functions described in this section to monitor the applications.
Application monitor management
One of the functions that APM uses to monitor applications is through the application monitor management function. Once collected, the information can be displayed in different views based on your needs.
Figure 4 Application monitor and views
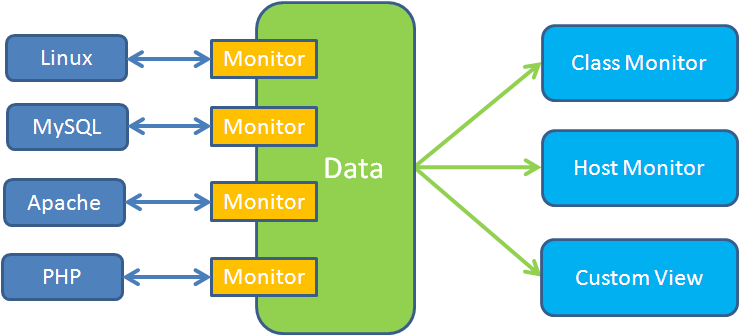
As shown in Figure 4, APM supports the following views:
· Application monitor—Displays the collection of application parameters and background monitor processes. Background monitor processes obtain application indexes by using the application parameters. APM periodically collects application monitor indexes by using application monitors and analyzes data based on host monitor, class monitor, and custom view.
· Host monitor—Analyzes and assesses the availability and health status of the host on which the applications run. APM provides host overview and a host monitor list.
· Class monitor—Displays the health status for each class and each application type which is predefined in APM. An application class includes one or more application types. For more information, see Table 1.
· Custom view—Allows you to customize a view as needed. You can add monitor indexes of different applications to one view to monitor indexes you focus on.
For more information, see "Monitor management."
Topology and application group management
Topology is closely related with application group management in APM.
· Topology
APM displays the physical relationship and logical relationship among applications, access devices, and physical networks in a topology. Also, APM displays the availability and health status of applications in the topology. Typically, directly related applications are used together to provides a single service. For example, a website service can use the following applications: Linux, Apache, MySQL, and PHP. These applications are related to each other and any failure among them can affect the service operation. The topology visualizes the physical relationship and logical relationship among applications, access devices, and physical networks. This is convenient for operators to promptly locate problems and evaluate affected areas to save problem-solving time.
· Application group management
Application group management allows operators to organize application monitors into several groups by function or purpose, and assign management authorities for the application monitor groups to different application administrators. Application group management simplifies the topology by displaying only the applications of the specified group rather than all applications.
For more information, see "Topology and application group management."
Agent management
In local monitor mode, an APM agent collects monitor index data from the host where the agent is deployed. APM periodically communicates with the agent by using Agent messages to obtain monitor index data.
The agent management feature allows you to manage agents deployed on hosts. You can also download, batch install, and upgrade APM agents. For more information, see "APM agent management."
Configuration management
The APM configuration management functions allow you to manage the activated alarm conditions, ports, probes, and system parameters.
· Threshold Management—Allows you to configure index value thresholds that, once reached, trigger a related alarm in the Alarm module of the IMC platform. You can configure the index name, Level-1 thresholds, and Level-2 thresholds.
· Baseline Configuration—Allows you to enable baseline function for an index and configure alarms levels. APM calculates index data in the most recent week of an index to obtain the baseline value. If the baseline function is enabled for an index and the baseline value is reached, APM triggers an alarm in the Alarm module of the IMC platform.
· Port Configuration—Allows you to configure the application monitor port and traffic statistics port of an application. APM uses the application monitor port to monitor an application in remote monitor mode, and uses the traffic statistics port to collect traffic statistics. The traffic statistics port is also used by applications to provide services.
· Probe Configuration—Allows you to configure probes for APM to periodically collect application data and displays the data in monitor reports. Probe refers to a server where the probe application is deployed. Probe analyzes traffic of applications together with the mirroring function based on the application's IP address or the combination of IP address and port. You can configure the IP address and authentication password of a probe.
· Parameter Configuration—Allows you to configure APM system parameters. You can configure the lifetime for various types of data and the color RGB value indicating alarm level.
· Template Configuration—Allows you to configure the agent and application templates. These templates enable you to install agents and add application monitors in a simplified way. You can configure host information used for agent installation in an agent template, and configure application access parameters used for adding an application monitor.
For more information, see "Configuration management."
Widget management
To facilitate administrator use, APM provides the following types of Widget functions:
· Application Topology—Displays applications, hosts, access devices, physical networks, and their relationships in a topology.
· Application Monitor—Monitors application availability and health status based on performance indexes.
· Host Monitor—Monitors operating system availability and health status for the host on which an application runs.
For more information, see "Application data display."
Application management report
IMC can generate reports based on application management report templates provided by APM. APM provides the following templates:
· Health status report—Displays the health status of applications monitored by APM.
· Availability report—Displays the availability statistics of applications monitored by APM.
IMC can generate realtime reports and scheduled reports based on the templates. Realtime reports are available to operators at any time. Scheduled reports can be emailed to operators for archiving. For more information about the report function of the IMC platform, see H3C Intelligent Management Center v7.3 Enterprise and Standard Platform Administrator Guide.
Quick start
When you use APM for the first time, read this chapter to obtain necessary guidelines.
Accessing APM
IMC provides the following APM access modes:
· Classic—Log in to the classic IMC interface (default access mode). You can access APM functions through the navigation menu.
· Desktop—Log in to the Web desktop. You can add APM functions to the Web desktop as applications, and then click the application icons to use APM functions.
You can select the access mode on the IMC login page or on the upper right of an IMC operation page. This guide describes APM functions in classic mode.
Classic mode
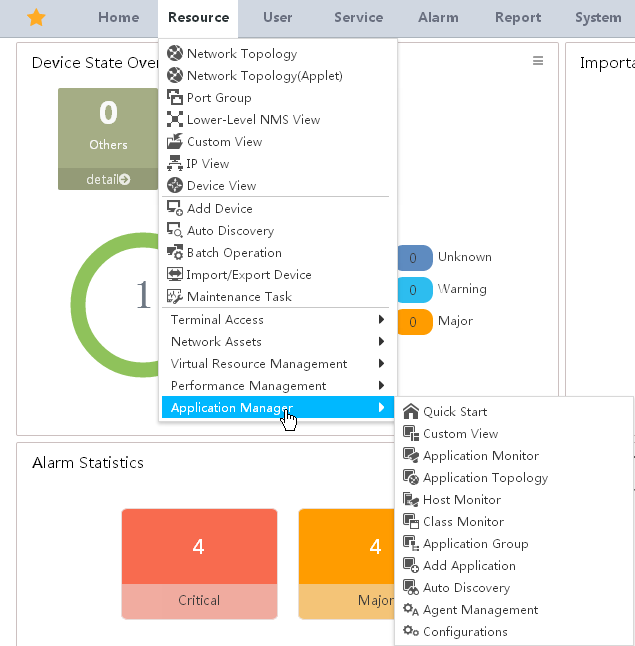
In classic mode, you can access APM functions through the navigation menu. APM provides a breadcrumb navigation menu and a navigation tree, which have the same navigation menu options (see "APM navigation menu options").
· Breadcrumb navigation menu—Point to a menu option to display the submenu.
· Navigation tree—Click a menu option to display the submenu.
Unless otherwise stated, operation procedures in this guide use the navigation tree.
Breadcrumb navigation menu
As shown in Figure 5, the APM breadcrumb navigation menu has two levels.
Figure 5 Breadcrumb navigation menu
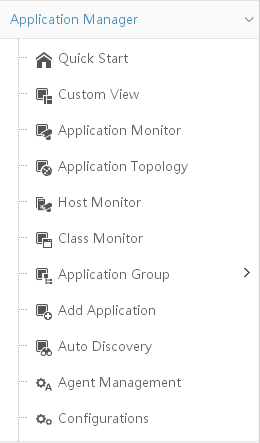
APM navigation tree
Figure 6 shows the APM navigation tree.
To expand the navigation menu:
1. Click the Resource tab.
2. From the navigation tree, click Application Manager.
APM navigation menu options
Table 3 APM navigation menu options
|
Item |
Function |
|
Quick Start |
Displays the quick start page that provides operation links for auto discovery, adding applications, and application monitors. You can click these links to quickly add application monitors. |
|
Custom View |
Displays the custom view page. You can view, add, modify, and delete custom views on the page. Also, you can view custom view reports. |
|
Application Monitor |
Displays the application monitor page. You can query, add, modify, and delete application monitors on the page. Also, you can view application monitor reports. |
|
Application Topology |
Displays the application topology window. You can view the connection relationship between applications, hosts, access devices, and physical networks. Also, you can view dependencies between applications, health status of applications and hosts, and availability of applications and hosts. |
|
Host Monitor |
Displays the host monitor page. This page includes the Host tab and List tab. By default, the Host tab is displayed. · The Host tab displays the health status and availability of applications running on all hosts. · The List tab displays the CPU usage, memory usage, availability, and health status of operating systems on all hosts. |
|
Class Monitor |
Displays the class monitor page. You can view the health status and availability of each application type on this page. An application type includes multiple applications. The health status of an application type is determined by the worst health status of all applications. |
|
Application Group |
Displays the application group page. You
can view, add, modify, and delete application groups on this page. Point to
the Expand icon |
|
Add Application |
Displays the page for adding applications. It is the shortcut menu for adding applications on the application monitor page. |
|
Auto Discovery |
Displays the auto discovery page. Operators who use APM for the first time can quickly add applications by using the auto discovery function. |
|
Agent Management |
Displays the agent management page. You can download, install, and delete APM agents on this page. |
|
Configurations |
Displays the Configurations page. Configuration management includes the following contents: · Threshold Configuration—Allows you to manage the default threshold configuration for application monitor indexes. · Baseline Configuration—Allows you to manage baseline configuration for application monitor indexes. · Port Configuration—Allows you to manage the default mappings between applications and application monitor ports, as well as traffic statistics ports. · Probe Configuration—Allows you to view, add, modify, and remove probes. · Parameter Configuration—Allows you to manage APM service parameters. · Template Configuration—Allows you to manage application templates and APM agent templates. |
Desktop mode
Figure 7 shows the APM desktop version. You can click Add application to add applications to APM.
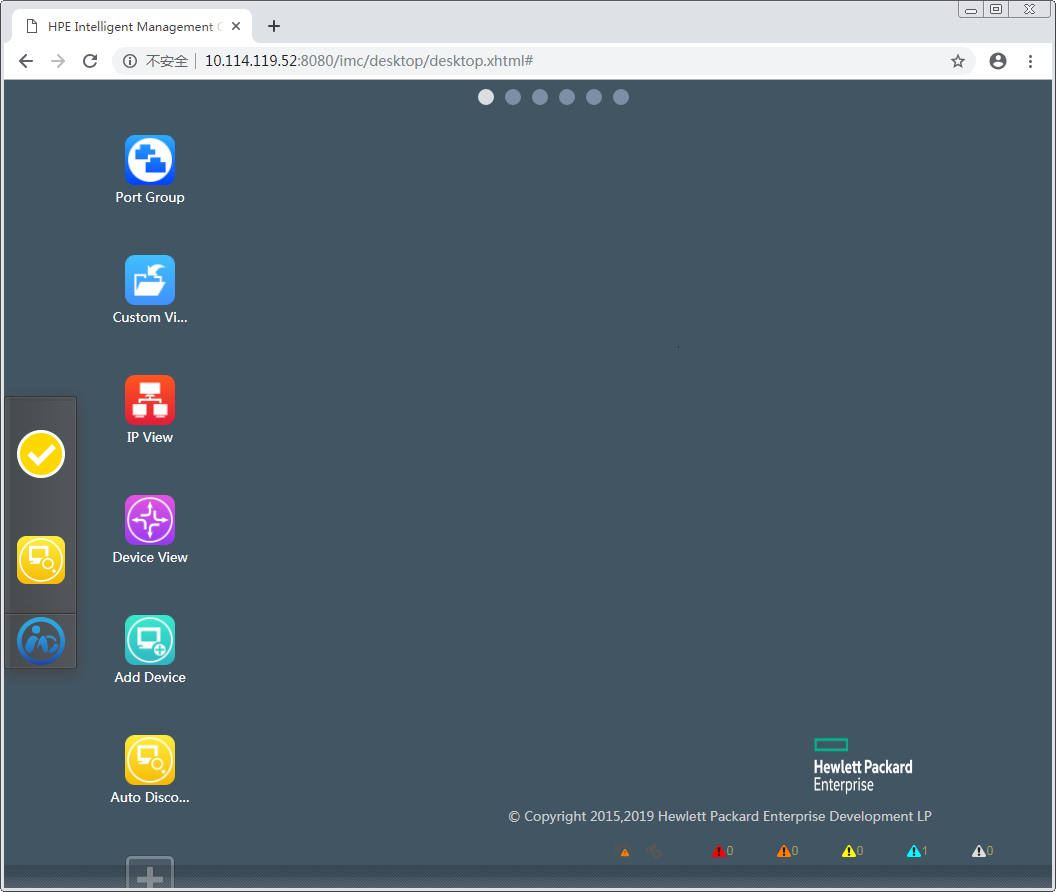
Table 4 shows the supported APM applications.
Table 4 Supported APM applications
|
Item |
Function |
|
Quick Start |
Displays the quick start page that provides operation links for auto discovery, adding applications, and application monitors. You can click these links to quickly add application monitors. |
|
Custom View |
Allows you to view, add, modify, and delete custom views on the page. Also, you can view custom view reports. |
|
Application Monitor |
Allows you to query, add, modify, and delete application monitors. Also, you can view application monitor reports. |
|
Application Topology |
Allows you to view the application topology and perform operations on the topology. |
|
Host Monitor |
Allows you to view host information. This page includes the Host tab and List tab. By default, the Host tab is displayed. · The Host tab displays the health status and availability of applications running on all hosts. · The List tab displays the CPU usage, memory usage, availability, and health status of operating systems on all hosts. |
|
Class Monitor |
Allows you to view the health status and availability of each application type. |
|
Application Group |
Allows you to view, add, modify, and delete application groups. |
|
Add Application |
Allows you to add application monitors. |
|
Auto Discovery |
Automatically discovers applications on the network. |
|
Agent Management |
Allows you to download, install, and delete APM agents. |
|
Configurations |
Configuration management includes the following contents: · Threshold Configuration—Manage the default threshold configuration for application monitor indexes. · Baseline Configuration—Manage baseline configuration for application monitor indexes. · Port Configuration—Manage the default mappings between applications and application monitor ports as well as traffic statistics ports. · Probe Configuration—View, add, modify, and remove probes. · Parameter Configuration—Manage APM service parameters. · Template Configuration—Manage application templates and APM agent templates. |
APM perspectives
You can access APM from the following perspectives:
· Default Perspective—Log in to IMC in classic mode, or select the Default Perspective from the perspectives menu after you log in to IMC. For more information about the classic mode, see Classic mode.
· Desktop View—Log in to IMC in desktop mode, or select the Default Perspective from the perspectives menu after you log in to IMC. For more information about the desktop mode, see Desktop mode.
· Application Manager Perspective—In this perspective, IMC displays only APM related functions, including application management, topology, alarm, device management, and system management functions. Other components and part of the IMC PLAT functions are not displayed.
· Tenant Self Maintenance Perspective—In this perspective, IMC displays functions that are available to tenants according to the configured tenant privileges.
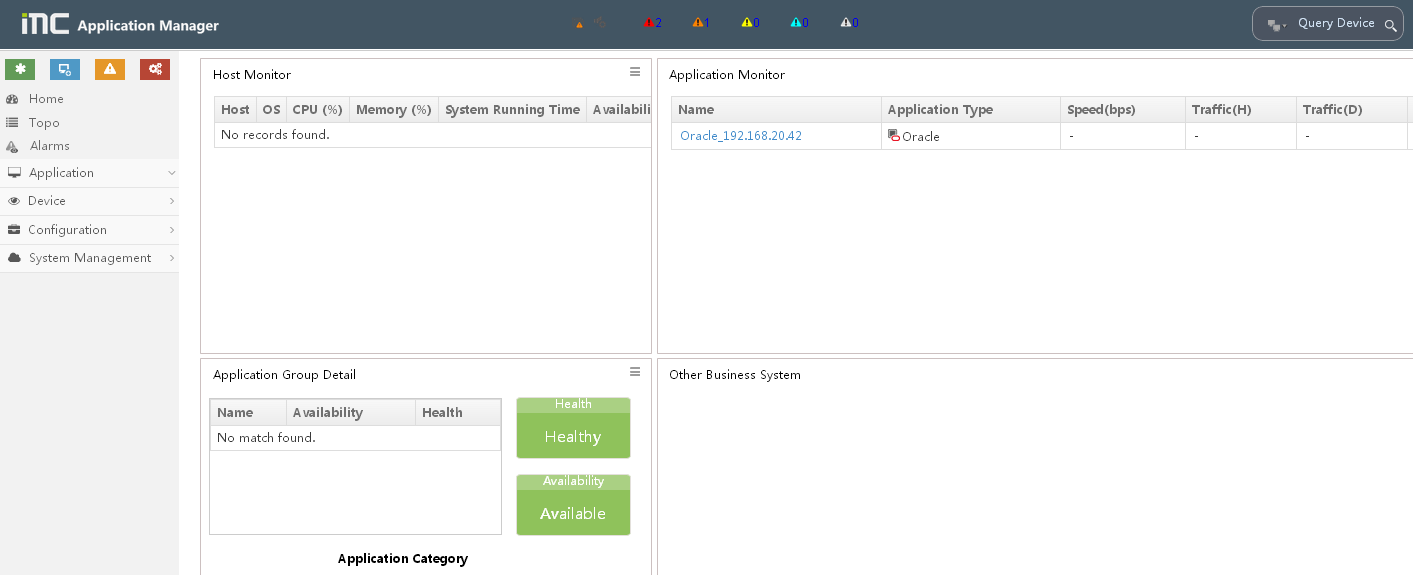
Application manager perspective
To open the application manager perspective:
1. Log in to the classic IMC interface.
2. Click the perspective switching icon , and then select the Application Manager Perspective from the popup menu.
Figure 8 Application manager perspective
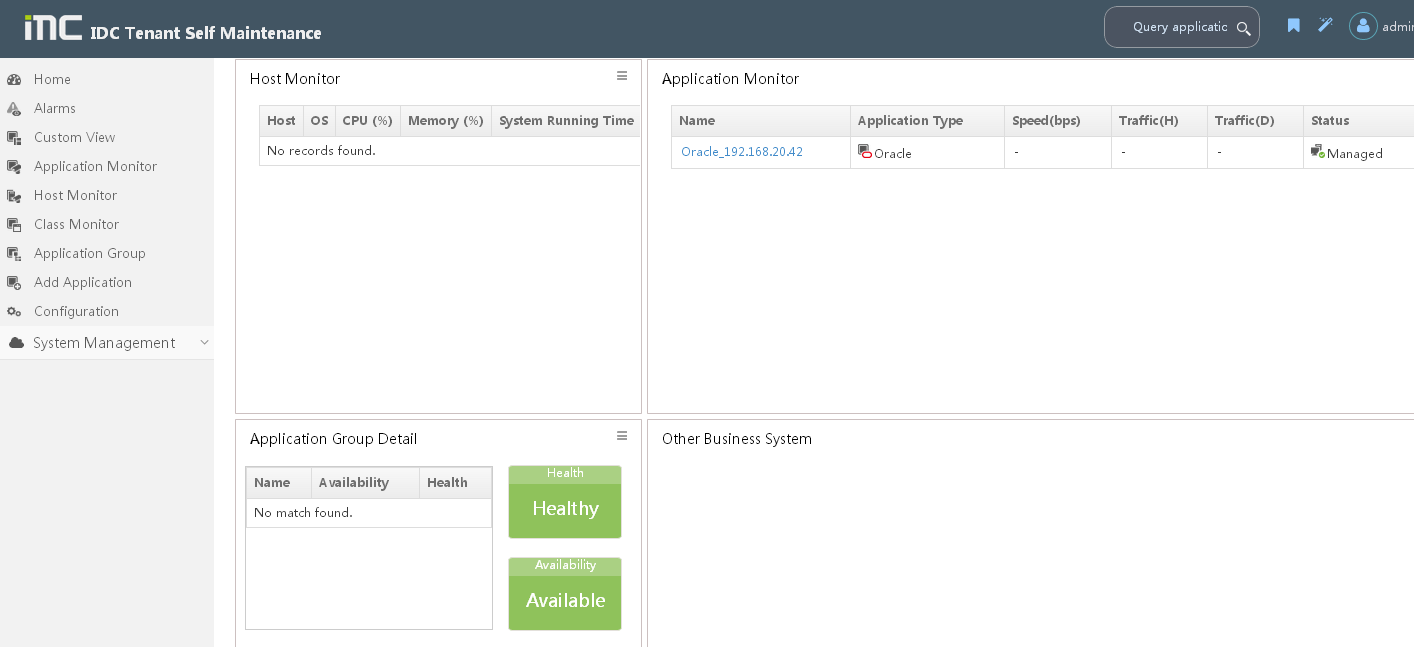
Tenant self maintenance perspective
To open the tenant self maintenance perspective:
1. Log in to the classic IMC interface.
2. Click the perspective switching icon , and then select the Tenant Self Maintenance Perspective from the popup menu.
Figure 9 Tenant self maintenance perspective
Quick start guidelines
APM can monitor applications in remote or local mode.
Remote monitor
To monitor applications in remote mode, APM must access the network to obtain application index data. Operators can use APM to quickly monitor applications on the network by following the flow as shown in Figure 10.
Figure 10 Remote monitor flowchart

Preparations
Before you monitor an application, complete the following tasks:
1. Obtain general information related to the target application. General information includes:
¡ Application type
¡ Host IP address of the application
¡ Dependencies with other applications
¡ Telephone number, email, and other contact information for the administrators who manage the application
2. Add the host on which the target application resides to the IMC platform. For more information, see H3C Intelligent Management Center v7.3 Enterprise and Standard Platform Administrator Guide.
3. Complete necessary configuration if the target application is of any of the following types:
¡ JBoss Server
¡ Apache Server
¡ Tomcat AS Server
¡ WebLogic AS Server (8.1)
¡ Oracle AS Server
¡ Java Runtime
¡ SAP
Auto Discovery
Using Auto Discovery, APM automatically detects applications running on the target hosts and adds application monitors. Adding application monitors through Auto Discovery includes the following phases:
· Application discovery phase—APM detects applications running on the target hosts based on port-to-application mappings.
· Adding application monitor phase—Operators add application monitors to APM based on the auto discovery result.
Not all applications supported by APM can be detected. To monitor an application that cannot be automatically detected, manually add the application to APM (see "Adding an application"). To detect applications correctly, you can modify the mappings between applications and application monitor ports in port configuration (see "Configuration management").
Table 5 provides the applications that can be automatically detected and their default application monitor ports.
Table 5 Applications that can be automatically detected in remote monitor mode
|
Class |
Type |
Application monitor port |
|
Windows Server Monitor |
Windows |
TCP-135 |
|
Unix Server Monitor |
AIX |
· TCP-22 (SSH) · TCP-23 (Telnet) |
|
FreeBSD |
· TCP-22 (SSH) · TCP-23 (Telnet) |
|
|
OpenBSD |
· TCP-22 (SSH) · TCP-23 (Telnet) |
|
|
HP-UX |
· TCP-22 (SSH) · TCP-23 (Telnet) |
|
|
SCO UNIX |
· TCP-22 (SSH) · TCP-23 (Telnet) |
|
|
Solaris |
· TCP-22 (SSH) · TCP-23 (Telnet) |
|
|
Mac OS |
· TCP-22 (SSH) · TCP-23 (Telnet) |
|
|
Linux Server Monitor |
Linux |
· TCP-22 (SSH) · TCP-23 (Telnet) |
|
Database Server Monitor |
SQL Server |
TCP-1433 |
|
MySQL |
TCP-3306 |
|
|
Oracle |
TCP-1521 |
|
|
DB2 |
TCP-50000 |
|
|
DBQuery |
TCP-50000 |
|
|
Informix |
TCP-9088 |
|
|
PostgreSQL |
TCP-5432 |
|
|
Sybase |
TCP-5000 |
|
|
Application Server Monitor |
.NET Server |
TCP-135 |
|
JBoss Server |
TCP-1099 |
|
|
Tomcat Server |
TCP-1099 |
|
|
Lync 2010 Server |
TCP-135 |
|
|
Lync 2013 Server |
TCP-135 |
|
|
Glassfish Server |
TCP-8686 |
|
|
Jetty Server |
TCP-8443 |
|
|
Lotus Domino Server |
TCP-63148 |
|
|
Oracle Application Server |
TCP-8888 |
|
|
WebLogic Server |
TCP-7001 |
|
|
WebSphere Server |
TCP-8880 |
|
|
Web Server Monitor |
Apache Server |
TCP-80 |
|
IIS Server |
TCP-80 |
|
|
PHP |
TCP-80 |
|
|
Mail Server Monitor |
Exchange 2003 |
TCP-135 |
|
Exchange 2007 |
TCP-135 |
|
|
Exchange 2010 |
TCP-135 |
|
|
POP3 |
TCP-110 |
|
|
SMTP |
TCP-25 |
|
|
Middleware Monitor |
Office SharePoint 2007 |
TCP-135 |
|
Office SharePoint 2010 |
TCP-135 |
|
|
Office SharePoint 2013 |
TCP-135 |
|
|
Active MQ |
TCP-1199 |
|
|
WebSphere MQ |
TCP-1414 |
|
|
HTTP Service Monitor |
URL |
TCP-80 |
|
LDAP Service Monitor |
Active Directory |
TCP-135 |
|
LDAP Service |
TCP-389 |
|
|
Service Monitor |
SNMP |
UDP-161 |
|
FTP |
TCP-21 |
|
|
SFTP |
TCP-22 |
|
|
DNS |
TCP-53 |
|
|
Java Runtime |
TCP-1099 |
|
|
Storage device monitor |
HP MSA P2000 |
TCP-5989 |
To use auto discovery to add an application monitor:
1. Click the Resource tab.
2. From the navigation tree, select Application Manager > Auto Discovery.
The Application Discovery page opens.
3. Click Add.
The Select Devices dialog box opens.
You can locate target hosts by clicking the By View or Advanced tab. For information about selecting devices, see "Selecting devices."
4. Click Start on the Application Discovery page.
APM starts detecting the applications running on the selected hosts and displays the detection result list.
It might take a long time if APM detects multiple target hosts. To finish the automatic detection, click End during the application detection.
5. In the detection result list, click Add to Monitor of the application you want to monitor, and then set application monitor parameters.
6. Click OK.
Adding an application
Perform this task to add applications to APM that cannot be detected through auto discovery.
To add an application:
1. Click the Resource tab.
2. From the navigation tree, select Application Manager > Add Application.
3. Click the type link for the target application.
4. Set application monitor parameters.
5. Click OK.
Application monitor
APM obtains application index data at an interval and displays data in a monitor report or custom view report for operators. Operators can set alarm thresholds and enable the data baseline function based on the collected data as needed.
If IMC SHM is also deployed on the APM server, operators can use the index data obtained by APM to generate SLA in SHM.
Local monitor
To monitor applications in local mode, APM must obtain application index data by using an APM agent. Figure 11 shows the local monitor flowchart.
Figure 11 Local monitor flowchart
![]()
Preparations
Before you monitor an application, complete the following tasks:
1. Verify that an APM agent can obtain data of the application to be monitored.
Table 6 Applications that can be monitored by an APM agent
|
Class |
Type |
Remarks |
|
Windows Server Monitor |
Windows |
The following operating systems are supported: · Windows XP · Windows Server 2003 · Windows Server 2008 · Windows Server 2012 |
|
Windows Performance Counter |
N/A |
|
|
Linux Server Monitor |
Linux |
Red Hat |
|
Database Server Monitor |
SQL Server |
SQL Server 2000/2005/2008 |
|
MySQL |
MySQL 5.x |
|
|
Oracle |
Oracle Database 8.x/9i/10g/11g |
|
|
DB2 |
DB2/NT 8.2.0 |
|
|
PostgreSQL |
PostgreSQL 9.3.1 |
|
|
Sybase |
Sybase Adaptive Server Enterprise 12.5.2 and later versions |
|
|
Application Server Monitor |
.NET Server |
All versions |
|
JBoss Server |
JBoss Application Server 4.x/5.0.1 |
|
|
Tomcat Server |
Tomcat 5.x/6.x/7.0 |
|
|
Lync 2010 Server |
Lync Server 2010 |
|
|
Glassfish Server |
GlassFish 3.x |
|
|
Jetty Server |
Jetty 9.0.5 |
|
|
Lotus Domino Server |
Lotus Domino 9.x |
|
|
WebLogic Server |
WebLogic 9.x/10.x |
|
|
Web Server Monitor |
IIS Server |
IIS 6.0 |
|
Mail Server Monitor |
Exchange 2003 |
Exchange 2003 |
|
Exchange 2007 |
Exchange 2007 |
|
|
Exchange 2010 |
Exchange 2010 |
|
|
Middleware Monitor |
Office SharePoint |
Office SharePoint 2007 |
|
Active MQ |
ActiveMQ 5.8.0 |
|
|
LDAP Service Monitor |
Active Directory |
Active directory deployed on Windows Server 2003/2008 |
|
File/Directory Monitor |
File |
N/A |
|
Directory |
N/A |
|
|
Service Monitor |
Java Runtime |
N/A |
|
Virtual Device Monitor |
Hyper-V |
Hyper-V 2012 |
|
KVM |
KVM 0.9.3 |
2. Obtain general information related to the target application. General information includes:
¡ Application type
¡ Host IP address of the application
¡ Dependencies with other applications
¡ Telephone number, email, and other contact information for the administrators who manage the application
3. Complete the necessary configuration if the target application is Tomcat AS Server or Java Runtime.
Installing an APM agent
Operators can install an APM agent on a target host locally or remotely. APM agents can be deployed only on Windows and Linux.
Auto discovery
Auto discovery in local monitor mode takes effect only on hosts where an APM agent is deployed.
The APM agent automatically locates applications when it starts up and reports the discovery result to the APM server.
Adding an application
Operators can view the auto discovery results reported by APM agents and add applications to APM as needed.
Application monitor
APM obtains application index data at an interval and displays data in a monitor report or custom view report for operators. Operators can set alarm thresholds and enable the data baseline function based on the collected data as needed.
If IMC SHM is also deployed on the APM server, operators can use the index data obtained by APM to generate SLA in SHM.
Quick service process
The quick service process provides a quick guide to use APM.
To open the quick service process view:
1. Select Quick Service Process from the View list in the top right corner of the IMC home page.
2. In the Select Template Category area, select Application Manager.
The quick service process view for APM opens, as shown in Figure 12.
Figure 12 Quick service process
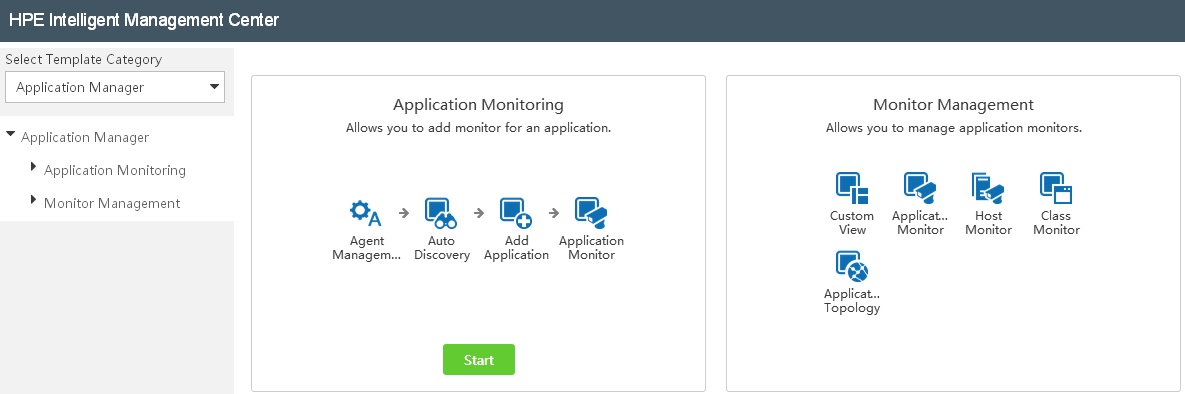
The page includes the following areas:
¡ Application Monitoring—Click Start to monitor an application. You can also click the icons in this area to add an application monitor.
¡ Monitor Management—Click an icon to manage application monitors.
Application monitor report
After adding an application monitor to the monitoring list, APM collects and analyzes the monitored application indexes, and displays the index and performance data in a monitoring report.
Viewing the monitoring report
1. Click the Resource tab.
2. From the navigation tree, select Application Manager > Application Monitor.
All application monitors are displayed on the Application Monitor page.
3. Click the name of the desired application monitor.
APM displays the monitoring report. The report will be updated at the polling interval configured when the application monitor was added.
The following example is a monitoring report of the Windows application monitor. Fields on the monitoring report vary by application type.
Figure 13 Windows application monitor report
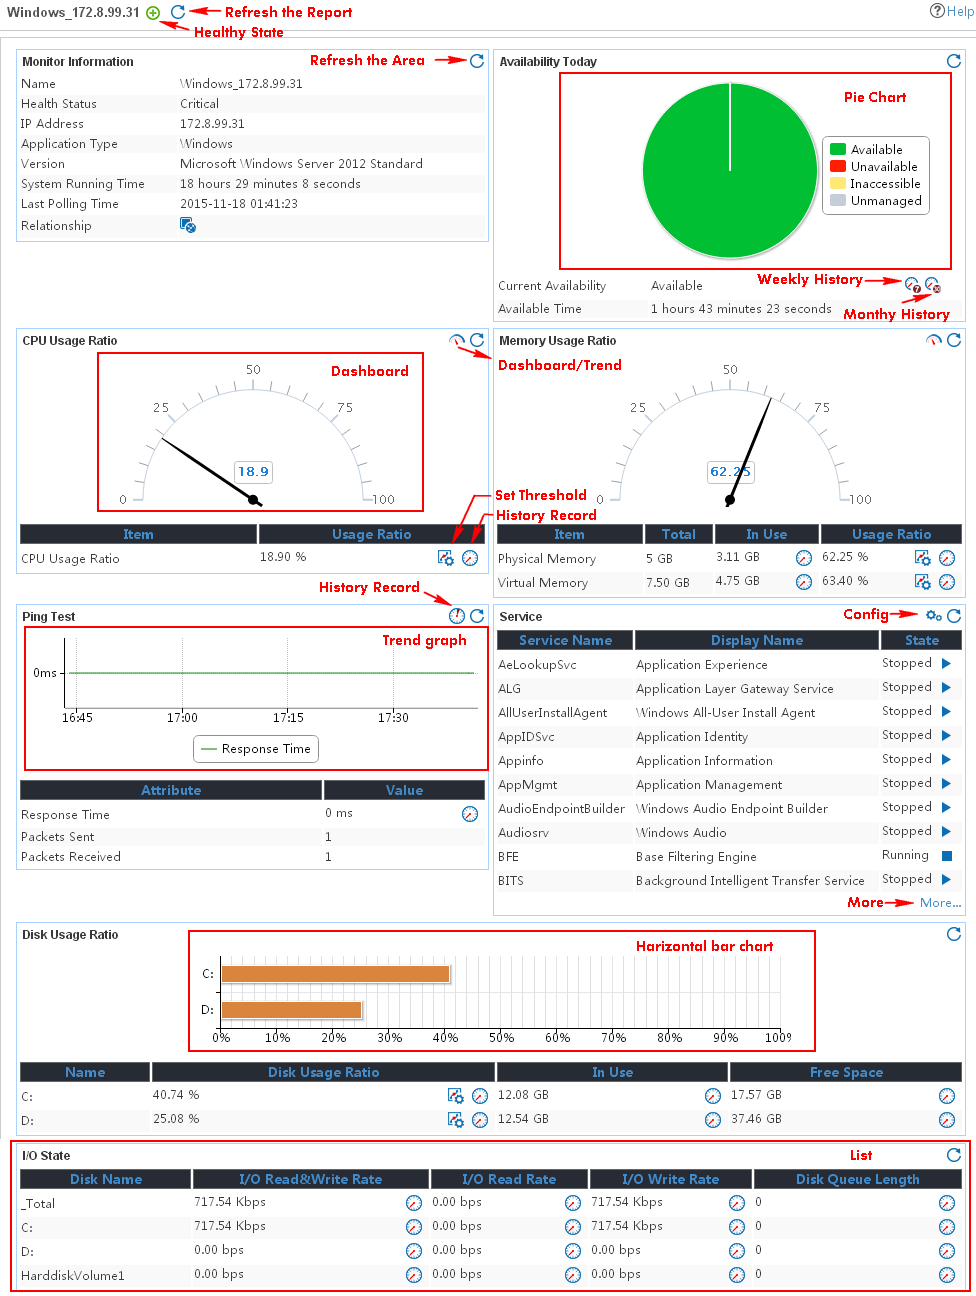
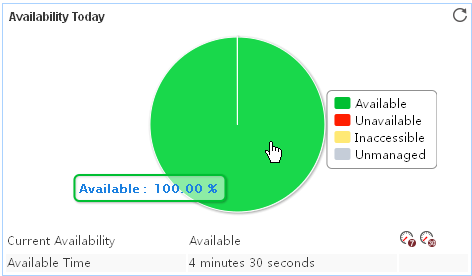
Pie chart
The pie chart shows the proportion of application availability states. Point to a section of the pie chart to view the percentage of each availability state, as shown in Figure 14.
Dashboard
Typically, the dashboard shows CPU or
memory indexes. Data in the middle of the dashboard is collected from the most
recent APM poll of the application, as shown in Figure 15. You
can click the Dashboard icon ![]() to switch to the trend graph.
to switch to the trend graph.
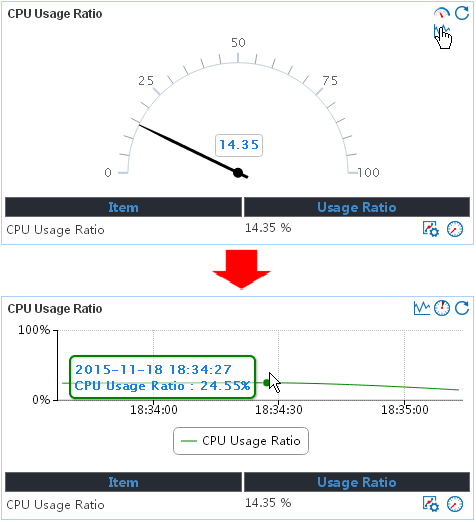
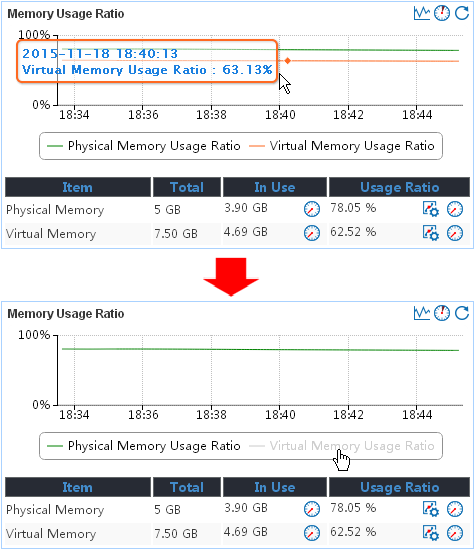
Trend graph
Typically, the trend graph shows the change trend of indexes in the last hour. Point to a time to view the data from that period, as shown in Figure 16. When the trend graph shows the change trend for multiple indexes, you can click an index legend name to hide the change trend for the index.
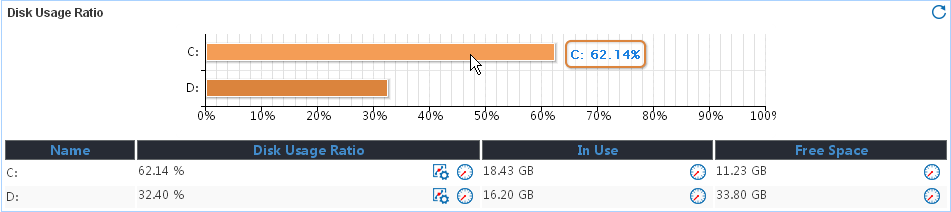
Horizontal bar chart
The horizontal bar chart shows the disk or file system index. Point to the horizontal bar chart to view the disk usage collected when APM most recently polled the application, as shown in Figure 17.
Figure 17 Horizontal bar chart
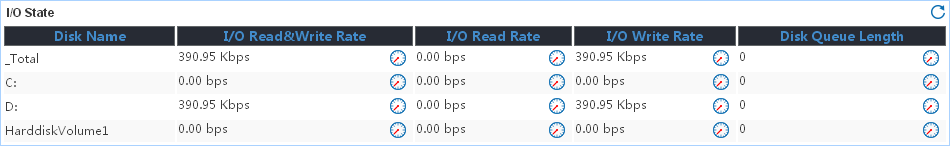
List
The list shows multiple indexes for processes and services. Typically, a maximum of 10 entries are displayed in a list by default. To view more entries, click More, as shown in Figure 18.
Icons
· Refresh
Click the Refresh icon ![]() to refresh data in the report. By default,
the report displays data collected when APM most recently polled the application.
To prevent data from being frequently refreshed, the
icon disappears for several seconds after you click it.
to refresh data in the report. By default,
the report displays data collected when APM most recently polled the application.
To prevent data from being frequently refreshed, the
icon disappears for several seconds after you click it.
· Refresh icon in a specific area
Click the Refresh icon ![]() to refresh data in the area.
to refresh data in the area.
· Health State
Click the Health State icon ![]() to view the health status of the application. By default, the report shows
the health status of the application collected when APM most recently polled
the application. For more information about the health status, see "Monitor management."
to view the health status of the application. By default, the report shows
the health status of the application collected when APM most recently polled
the application. For more information about the health status, see "Monitor management."
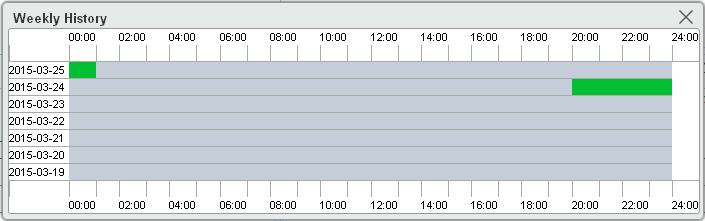
· Weekly History
Click the Weekly History icon ![]() to view availability statistics of the application in the most recent 7 days. The data is collected hourly. You can point to the
chart to view the percentage of availability states for a specific time period.
to view availability statistics of the application in the most recent 7 days. The data is collected hourly. You can point to the
chart to view the percentage of availability states for a specific time period.
Figure 19 Weekly History
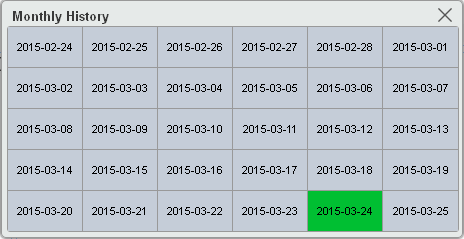
· Monthly History
Click the Monthly History icon ![]() to view availability statistics of the application in the most recent 30 days. The data is collected daily. You can point to
the chart to view the percentage of availability states
on a specific day.
to view availability statistics of the application in the most recent 30 days. The data is collected daily. You can point to
the chart to view the percentage of availability states
on a specific day.
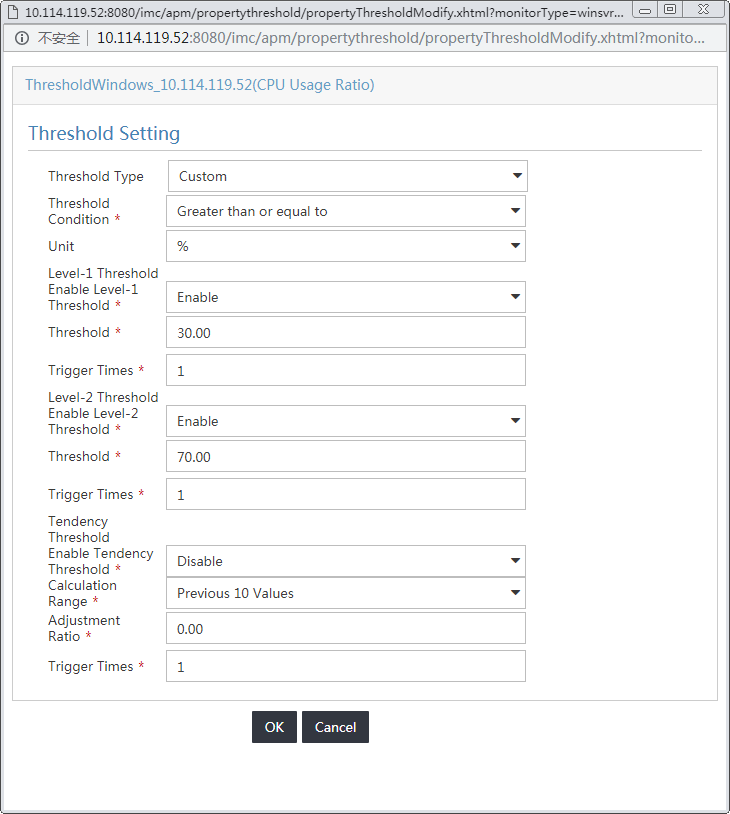
· Set Threshold
Click the Set Threshold icon to set alarm thresholds for the application, as shown in Figure 21. When the specified threshold is reached, APM generates an alarm. For information about configuring alarm thresholds, see "Configuration management."
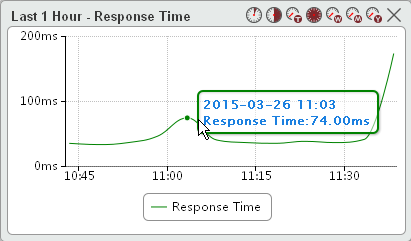
· History Record
Click the History Record icon
to view the history trend of the application in a line graph. The time range can be Last 1 Hour ![]() , Last 6 Hours
, Last 6 Hours ![]() , Today
, Today ![]() , Yesterday
, Yesterday ![]() , This Week
, This Week ![]() , This Month
, This Month ![]() , or This Year
, or This Year ![]() .
.
¡ Data for the last 1 hour, the last 6 hours, and today are collected at the polling interval. Figure 22 shows the trend for the last 1 hour.
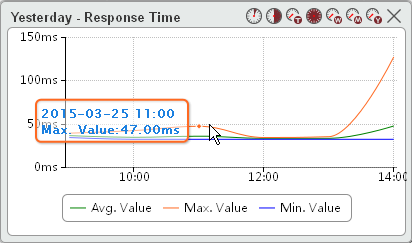
¡ Data for yesterday, this week, and this month are collected hourly. The graph also displays the maximum, minimum, and average values. Figure 23 shows yesterday's trend.
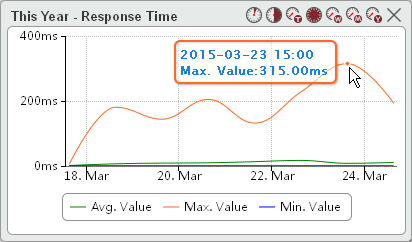
¡ Data for this year is collected daily. The statistics graph also displays the maximum, minimum, and average values. Figure 24 shows this year's trend.
Figure 22 Trend for the last 1 hour
· Time range of the trend graph
To set the time range for the trend graph, click the Last 1 Hour icon ![]() , Last 6 Hours icon
, Last 6 Hours icon ![]() , Today icon
, Today icon ![]() , Yesterday icon
, Yesterday icon ![]() , This Week icon
, This Week icon ![]() , This Month icon
, This Month icon ![]() , or This Year icon
, or This Year icon ![]() .
.
· Dashboard/Trend graph
Click the Dashboard icon ![]() or the Trend Graph icon
or the Trend Graph icon ![]() to display index data in a dashboard or
trend graph.
to display index data in a dashboard or
trend graph.
· Configure
Click the Configure icon to configure indexes to be monitored. APM obtains monitored index data when APM polls the application next time. Typically, the Configure icon is located in the Process or Service area.
Common operations
Common APM operations include the following:
· Selecting devices
· Sorting a list
These operations are also applicable to other IMC components.
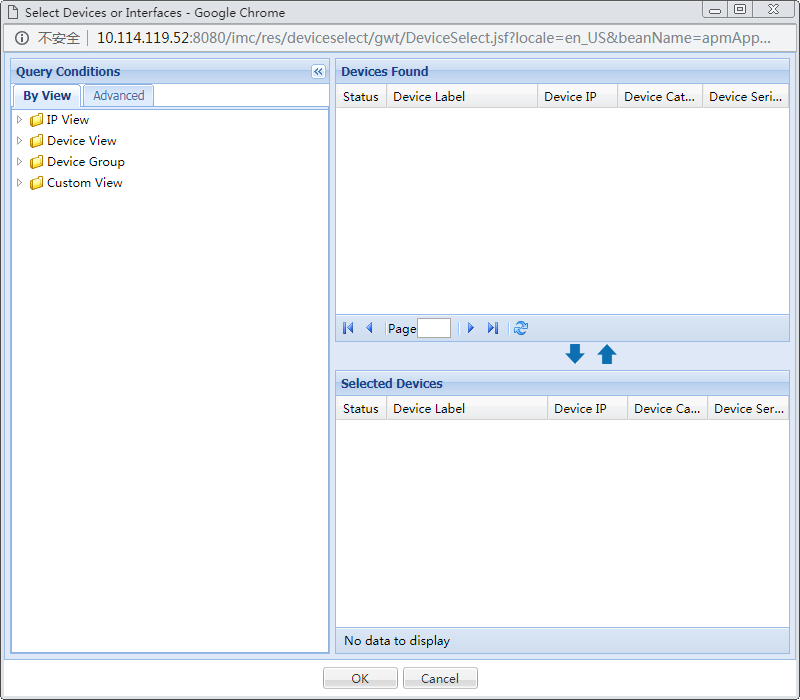
Selecting devices
Use this function to select hosts running applications so that APM can perform auto discovery and add application monitors. From the Select Devices window, you can filter hosts by view or advanced query.
Figure 25 Selecting devices
Filtering devices by view
1. In the Query Conditions area, click the By View tab.
2. Click the Expand icon ![]() to the left
of the IP view, device view, or custom view, and then select a subview.
to the left
of the IP view, device view, or custom view, and then select a subview.
All devices in the subview are displayed in the Devices Found area.
Filtering devices by advanced query
1. In the Query Conditions area, click the Advanced tab.
2. Specify one or more of the following query criteria:
¡ Device IP—Enter an IPv4 or IPv6 address of the device.
If Exact Query is selected, enter a complete IPv4 or IPv6 address.
If Exact Query is not selected, enter a partial or complete IPv4 or IPv6 address. For example, if you enter 192.168, all devices whose IP addresses contain 192.168 are queried.
¡ Device IP List—Specify multiple IP addresses to be queried.
Click the Device IP List Configuration icon ![]() . The Device IP List Configuration window opens. Enter one or multiple device IP addresses in the Input Device IP
field, and then click Add to add the
entered IP addresses to the Device
IP List field. (To enter multiple IP addresses,
enter one IP address on each line.) Repeat the steps above to add all device IP addresses to be queried.
To delete an IP address in the Device
IP List field, select the IP address and then click
Delete. Click OK to complete the operation. Make sure the device IP addresses to be queried
have been added to the Device IP
List field. To clear the Device IP List
field, click the Clear icon
. The Device IP List Configuration window opens. Enter one or multiple device IP addresses in the Input Device IP
field, and then click Add to add the
entered IP addresses to the Device
IP List field. (To enter multiple IP addresses,
enter one IP address on each line.) Repeat the steps above to add all device IP addresses to be queried.
To delete an IP address in the Device
IP List field, select the IP address and then click
Delete. Click OK to complete the operation. Make sure the device IP addresses to be queried
have been added to the Device IP
List field. To clear the Device IP List
field, click the Clear icon ![]() .
.
¡ Device Label—Enter a partial or complete device label. For example, if you enter db, all devices with device labels that contain db are queried.
¡ Device Status—Select a device state from the list.
¡ Device Category—Select a device type from the list.
¡ Device Series—Select a device series from the list.
¡ Contact—Enter partial or complete contact information for the devices. For example, if you enter Bob, all devices with contact information that contains Bob are queried.
¡ Location—Enter partial or complete location information for the devices. For example, if you enter lab, all devices with location information that contains lab are queried.
¡ Device Reachability—Select a reachability state from the list: Reachable or Unreachable.
Empty fields are ignored.
3. Click Query.
All matching devices are displayed in the Devices Found area.
Selecting devices
1. Add devices to the Selected Devices area.
¡ To
add one or more devices, select the devices in the Devices
Found area, and then click the Add icon ![]() .
.
¡ To
add all devices, click the Add all icon ![]() .
.
2. Remove undesired devices from the Selected Devices area.
¡ To
remove one or more devices, select the devices in the Selected
Devices area, and then click the Remove icon
![]() .
.
¡ To
remove all devices, click the Remove all icon ![]() .
.
3. Click OK.
|
|
NOTE: If only one device is found,
the window does not include the Add all icon |
Sorting a list
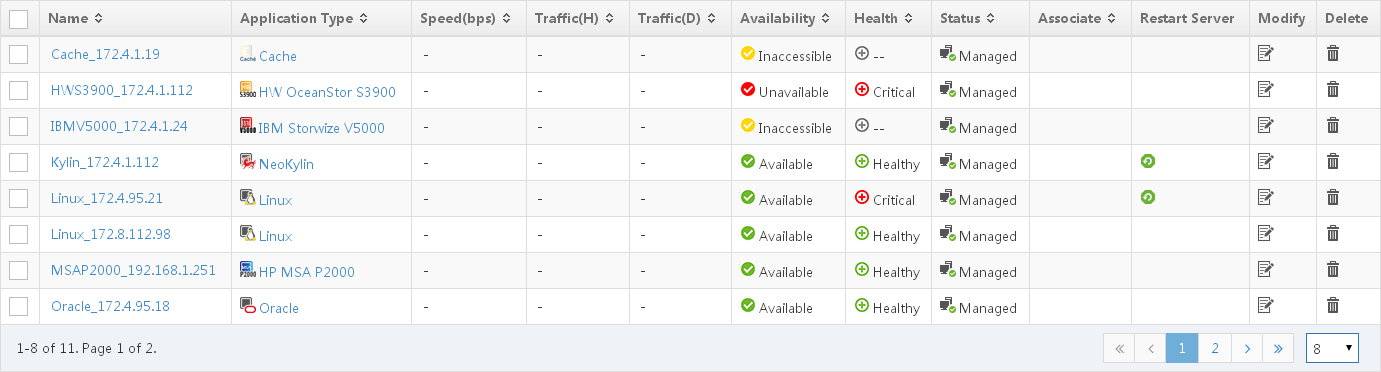
If a list contains a large number of items (as shown in Figure 26), use the following aids to navigate the list:
· Select 8, 15, 50, 100, or 200 at the lower right of the list to set the number of items you want to display per page.
· Click the Next Page
icon ![]() to page forward in the list.
to page forward in the list.
· Click the Last Page
icon ![]() to page forward to the end of the list.
to page forward to the end of the list.
· Click the Previous Page
icon ![]() to page backward in the list.
to page backward in the list.
· Click the First Page
icon ![]() to page
backward to the beginning of
the list.
to page
backward to the beginning of
the list.
· Click a page number to display the specified page.
If the list contains more than 10 pages, click a large page number to display the remaining page numbers. For example, click page 8 to display page 11 and the rest.
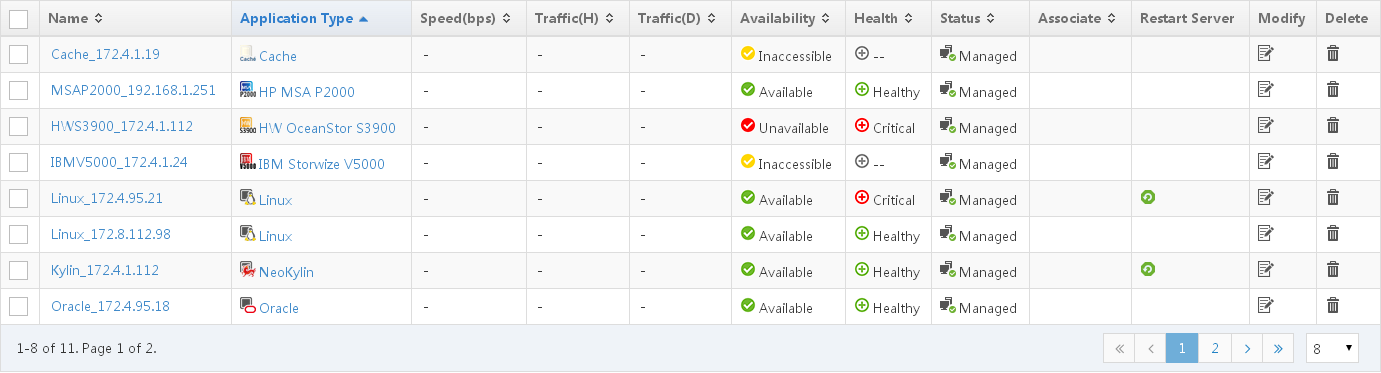
Figure 26 Application monitor list
If a list contains a large number of fields
(as shown in Figure 27), you can sort a list by every field that contains a Sort icon ![]() in the
column label:
in the
column label:
· When the list is sorted by a field in ascending
order, the column label of the selected field is blue and contains an Ascending icon ![]() .
.
· When the list is sorted by a field in descending
order, the column label of the selected field is blue and contains a Descending icon ![]() .
.
Figure 27 Sorting an application monitor list
Monitor management
Monitor management in APM allows you to collect performance indexes, health statuses, and availability of applications, and provides analysis and statistics reports based on this information in various views. Important concepts and terms in monitor management include:
· Monitor—Employs a background program to collect application index data by using a set of access parameters and to analyze the health status and availability for the application.
· Host monitor—Organizes applications by host and displays the availability and the health status of each application.
· Class monitor—Organizes applications by class and type and displays the health status of each application type.
· Custom View—Displays the performance and health status of monitored applications.
Application monitor
All monitors in APM are defined as application monitors. APM provides the ability to query, add, modify, and delete the application monitors, as well as the ability to customize the application monitor list, manage/unmanage an application monitor, poll the monitored applications, and view associated applications and root cause analysis.
You can view the management status, availability, health status, and traffic statistics of applications through the application monitor list.
An application monitor has the following statuses:
· Management status—Whether APM attempts to collect monitor indexes from the target application. The state can be Managed or Unmanaged. For applications in Managed state, APM attempts to collect their monitor indexes in each polling period. For applications in Unmanaged state, APM does not collect their monitor indexes. By default, the management status of an application is Managed.
· Availability—State of the connection between the target application and APM. States include:
¡ Available—APM can connect with the target application and collect the specified monitored indexes.
¡ Inaccessible—APM can connect with the target application but cannot collect the specified monitored indexes. This status can trigger a critical alarm.
¡ Unavailable—APM cannot connect with the target application. This status can trigger a critical alarm.
¡ Unmanaged—The target application is not monitored by APM. If the management state is Unmanaged, the availability of the application also becomes Unmanaged.
· Health Status—Evaluation result of the target application. By default, the states include:
¡ Healthy—The application is available and all indexes collected by APM do not meet the condition of a Level-1 threshold.
¡ Minor—The application is available but APM cannot collect partial monitored indexes. This health status can trigger a minor alarm.
¡ Major—The application is available and the monitored indexes collected by APM meet the condition of a Level-1 threshold. This health status can trigger a major alarm.
¡ Critical—The application is available and the monitored indexes collected by APM meet the condition of a Level-2 threshold, or the application is unavailable. This health status can trigger a critical alarm.
¡ Unknown—The application is inaccessible or unmanaged. This health status is represented by two consecutive hyphens (--) in APM.
You can modify the alarm severity level for the Level-1 Threshold Alarm of Application Management and Level-1 Threshold Alarm of Application Management traps. APM will send related alarms and calculate the health status according to the modified alarm severity levels. To modify the alarm severity level, navigate to Trap Management > Trap Definition of the IMC PLAT. For more information, see H3C Intelligent Management Center v7.3 Enterprise and Standard Platform Administrator Guide.
Table 7 Relationship among management state, availability, and health status
|
Management status |
Availability |
Health status |
|
|
Managed |
|
|
|
|
|
|
||
|
|
|
||
|
|
|||
|
|
|
||
|
|
|
|
|
|
Unmanaged |
|
|
Viewing the application monitor list
1. Click the Resource tab.
2. From the navigation tree, select Application Manager > Application Monitor.
The application monitor list page displays all application monitors. Information on the list was obtained when APM last polled the monitored applications.
Application monitor list contents
¡ Name—Name of the application monitor. Click the name to view the monitoring report for the monitored application.
¡ Application Type—Type of the monitored application. Click the link for the application type to filter out other types of monitored applications. For more information about application type management, see "Application Manager overview."
¡ Host—IP address of the host on which the monitored application resides. This field is not displayed by default.
¡ Agent Collection—Use the APM agent to collect application index data. This field is not displayed by default.
¡ Speed (bps)—Total receiving and sending rate of the application, in bps. Point to the icon to view the historical records of Rx (bps) and Tx (bps). This field is displayed only when probes are configured for APM. For information about configuring probes, see "Configuration management."
¡ Rx (bps)—Receiving rate of the application, in bps. This field is not displayed by default.
¡ Tx (bps)—Sending rate of the application, in bps. This field is not displayed by default.
¡ Traffic (H)—Total traffic received and sent by the application in the last hour. This field is not displayed by default.
¡ In Traffic (H)—Traffic received by the application in the last hour. This field is not displayed by default.
¡ Out Traffic (H)—Traffic sent by the application in the last hour. This field is not displayed by default.
¡ Traffic (D)—Total traffic received and sent by the application today. This field is not displayed by default.
¡ In Traffic (D)—Traffic received by the application today. This field is not displayed by default.
¡ Out Traffic (D)—Traffic sent by the application today. This field is not displayed by default.
¡ Description—Description about the application monitor.
¡ Availability—Availability of the
application. The availability can be ![]() (Available),
(Available),
![]() (Unavailable),
(Unavailable), ![]() (Inaccessible),
or
(Inaccessible),
or ![]() (Unmanaged).
Point to the icon to view the
application availability represented by different colors for the last hour.
(Unmanaged).
Point to the icon to view the
application availability represented by different colors for the last hour.
¡ Health—Health status of the
application. The health status can be ![]() (Healthy),
(Healthy), ![]() (Minor),
(Minor), ![]() (Major),
(Major), ![]() (Critical), or
(Critical), or ![]() (Unknown). Point to the icon to view the application
health status represented by different colors in the last hour.
(Unknown). Point to the icon to view the application
health status represented by different colors in the last hour.
¡ Dependency Topology—Click the Dependency
Topology icon ![]() to view dependencies
between the application and other applications in a topology view. This field
is not displayed by default. For more information about the dependency
topology, see "Topology and application group management."
to view dependencies
between the application and other applications in a topology view. This field
is not displayed by default. For more information about the dependency
topology, see "Topology and application group management."
¡ Status—Management status of the application, which can be Managed or Unmanaged.
¡ Association—Click the Association icon
![]() to view applications associated with the application monitor. This
field is displayed only when the application is a Windows operating system that
is monitored through WMI. For more information, see "Viewing associated applications."
to view applications associated with the application monitor. This
field is displayed only when the application is a Windows operating system that
is monitored through WMI. For more information, see "Viewing associated applications."
¡ Analyze—Click
the Analyze icon ![]() to view the causes for the unhealthy status of an application. For
more information about root cause analysis, see "Viewing root cause analysis."
to view the causes for the unhealthy status of an application. For
more information about root cause analysis, see "Viewing root cause analysis."
¡ Contact—Contact information of the application administrator. This field is not displayed by default.
¡ Restart Server—Click the Restart Server icon ![]() to restart the server where the monitored application resides. For
more information, see "Restarting a server."
to restart the server where the monitored application resides. For
more information, see "Restarting a server."
¡ Alarm—If the application has unrecovered alarms, this field displays the alarm icon that represents the highest severity level of the alarms. Click the alarm icon to view the alarm list for the application.
¡ Modify—Click
the Modify icon ![]() to modify the parameters of the application monitor.
to modify the parameters of the application monitor.
¡ Delete—Click
the Delete icon ![]() to delete the application monitor.
to delete the application monitor.
3. Click Refresh to update the content of the application monitor view list.
Restarting a server
APM supports manual or automatic restarting of Linux, NeoKylin, or Windows servers. To restart a server in auto mode, APM must work with the Intelligent Policy Center module of the IMC platform.
Restarting a server in manual mode
1. Click the Resource tab.
2. From the navigation tree, select Application Manager > Application Monitor.
The application monitor list page displays all application monitors.
3. Click the Restart Server icon ![]() for an application monitor.
for an application monitor.
4. In the confirmation dialog box, click OK.
Restarting a server in auto mode
1. Click the Service tab.
2. From the navigation tree, select Intelligent Policy Center > Event Configuration.
The Event Configuration page opens.
3. Add an event:
a. Click Add on the Event Configuration page.
The Add Event Configuration page opens.
b. Select Device Alarm from the Type list.
c. Click Select Alarms to select an alarm on the page that opens. In this example, select an alarm named Level-2 Threshold Alarm of Application Management.
d. Use the default value of other parameters.
4. Add a policy for the event:
a. Access the page for adding a policy. (Details not shown.)
b. Select Auto from the Execution Type list.
c. Select Restart Server as the action.
d. Click the Alarm
Parameter icon ![]() and configure a mapping between the action parameter (srcIp) and the alarm parameter (<%Device IP%>).
and configure a mapping between the action parameter (srcIp) and the alarm parameter (<%Device IP%>).
For more information about adding a policy, see H3C Intelligent Management Center v7.3 Enterprise and Standard Platform Administrator Guide.
When a threshold alarm is generated for a monitored Linux, NeoKylin, or Windows application, the server where the application resides is restarted.
Customizing the application monitor list
1. Click the Resource tab.
2. From the navigation tree, select Application Manager > Application Monitor.
The application monitor list page displays all application monitors.
3. Click Custom Page.
The Custom Column page opens.
Customizable columns include:
¡ Name (Default)
¡ Type of application (Default)
¡ Host
¡ Agent Collection (Default)
¡ Speed (bps) (Default)
¡ Rx (bps)
¡ Tx (bps)
¡ Traffic (H) (Default)
¡ In Traffic (H)
¡ Out Traffic (H)
¡ Traffic (D) (Default)
¡ In Traffic (D)
¡ Out Traffic (D)
¡ Description
¡ Availability (Default)
¡ Health (Default)
¡ Dependency Topology
¡ Status (Default)
¡ Associate (Default)
¡ Analysis
¡ Contact
The speed, Rx, Tx, and traffic columns are displayed only when probes are configured for APM. For information about configuring probes, see "Configuration management."
4. Select the columns you want to display in the application monitor list.
5. Click the Move Up icon ![]() or Move Down icon
or Move Down icon ![]() to modify the
rank of the columns in the application monitor list.
to modify the
rank of the columns in the application monitor list.
6. Click Reset if you want to restore the default columns and rank of the application monitor list.
7. Click OK.
Viewing associated applications
When a Windows application is monitored through WMI or by using an APM agent, APM automatically detects all unmonitored applications that are deployed on the Windows application. Operators can view these associated applications for the Windows application monitor.
To view associates applications:
1. Click the Resource tab.
2. From the navigation tree, select Application Manager > Application Monitor.
The application monitor list page displays all application monitors.
3. Click the Association icon ![]() for the Windows application monitor for
which you want to view the associated applications.
for the Windows application monitor for
which you want to view the associated applications.
The Result list page displays all unmonitored applications that are associated with the Windows application monitor.
Result list contents
¡ Device—IP address of the host on which the monitored Windows application is located.
¡ Device Name—Host name of the Windows OS.
¡ Application Type—Type of the application that is associated with the monitored Windows application and not monitored by APM.
¡ Application Monitor Port—Port through which the Auto Discovery function detects the application.
¡ Add to Monitor—Click Add to Monitor to add an application monitor for the associated application.
4. Click Back to return to the application monitor list page.
Viewing root cause analysis
APM provides the root cause analysis function to analyze the health status of applications based on application monitor indexes. The root cause analysis function is available only to applications that are not healthy.
To view root cause analysis:
1. Click the Resource tab.
2. From the navigation tree, select Application Manager > Application Monitor.
The Application Monitor list page displays all application monitors.
3. Click the Analyze icon ![]() for the
target application monitor.
for the
target application monitor.
The root cause analysis page opens, as shown in Figure 28.
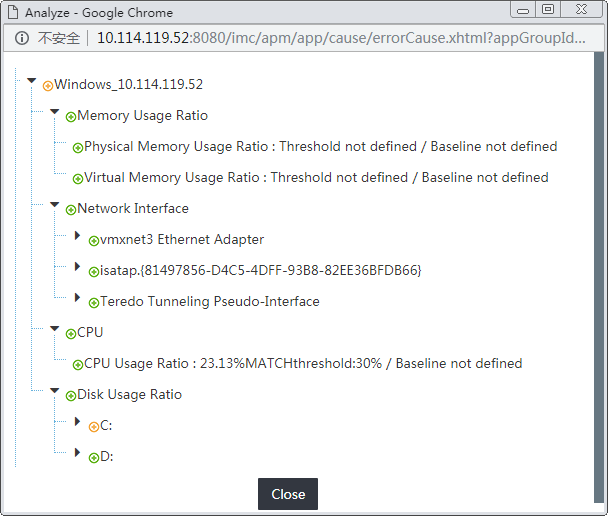
4. Expand application index nodes to view the causes.
5. Click Close.
Querying application monitors
1. Click the Resource tab.
2. From the navigation tree, select Application Manager > Application Monitor.
The application monitor list page displays all application monitors.
3. Enter the complete
or part of the application monitor name in the query area,
and then click the Query icon ![]() located to the right of the
query area.
located to the right of the
query area.
All matching application monitors are
displayed. To filter application monitors by using more filter criteria, click
the Expand icon ![]() to expand the query criteria panel.
to expand the query criteria panel.
4. Set the appropriate query criteria:
¡ Name (supports fuzzy querying)
¡ Application type
¡ Availability
¡ Health status
¡ Application group
¡ Host (host IP address)
¡ Agent Collection
5. Click Query.
All application monitors that match the query condition are displayed in the application monitor list. You can click an application type on the list to filter that type of monitored applications.
6. To restore the complete application monitor list, click Reset.
Adding an application monitor
APM detects most applications through auto-discovery, except file and directory applications and those using different listening ports than most applications of the same type. To monitor undetected applications, you can manually add application monitors for them.
To add an application monitor manually:
1. Click the Resource tab.
2. From the navigation tree, select Application Manager > Application Monitor.
The application monitor list page displays all application monitors.
3. Click Add, and then select the type of the application you want to monitor.
4. Set the parameters of the application monitor, which vary with application types.
For information about setting the application monitor parameters, see the description of adding an application monitor for each type of applications.
5. Click OK.
Modifying an application monitor
1. Click the Resource tab.
2. From the navigation tree, select Application Manager > Application Monitor.
The application monitor list page displays all application monitors.
3. Click the Modify
icon ![]() for the application
monitor you want to modify.
for the application
monitor you want to modify.
4. Modify the parameters of the application monitor, which vary with application types.
For more information about modifying the application monitor parameters, see the description of modifying an application monitor for each type of application. You cannot modify the application type or the IP address.
5. Click OK.
Deleting application monitors
When an application monitor is deleted, all of the associated monitor index data for that application monitor instance is deleted. You can delete any of the application monitors in APM with the exception of those referenced by custom views.
To delete one or more application monitors:
1. Click the Resource tab.
2. From the navigation tree, select Application Manager > Application Monitor.
The application monitor list page displays all application monitors.
3. Click the Delete icon ![]() for every application
monitor you want to delete. Or select target application monitors, click Delete, and confirm your operation.
for every application
monitor you want to delete. Or select target application monitors, click Delete, and confirm your operation.
Setting the management status of an application monitor
1. Click the Resource tab.
2. From the navigation tree, select Application Manager > Application Monitor.
The application monitor list page displays all application monitors.
3. Select the application monitors with the management status you want to change.
4. Click Unmanage to stop monitoring the selected applications or click Manage to start collecting monitor indexes from the selected applications, depending on your needs.
Start polling
If an application is set to Manage state in APM, the application monitor collects application monitor index data at the interval polling time. If the application is set to Unmanaged state, the application monitor does not collect application monitor index data at the interval polling time. The start polling function can order APM to collect the application monitor index immediately, regardless of the management status.
To start polling:
1. Click the Resource tab.
2. From the navigation tree, select Application Manager > Application Monitor.
The application monitor list page displays all application monitors.
3. Select the application monitors with the management status you want to change.
4. Select the application monitor for which you want to start polling.
5. Click Start Polling.
Viewing the APM server details
APM supports monitoring applications by using multiple APM servers. Specify the APM server when you add an application monitor.
To view the APM server details:
1. Click the Resource tab.
2. From the navigation tree, select Application Manager > Application Monitor.
The application monitor list page displays all application monitors.
3. Click APM Server.
The page displays the following contents:
¡ IP—IP address of the APM server.
¡ Total—Total number of applications monitored by the APM server.
¡ WMI—Number of applications monitored by the APM server through WMI.
¡ CLI—Number of applications monitored by the APM server through CLI.
¡ SNMP—Number of applications monitored by the APM server through SNMP.
¡ Agent—Number of applications monitored by the APM server by using the agent.
¡ Other—Number of applications monitored by the APM server by using other methods.
4. Click a number.
The list displays the corresponding application monitors.
Importing/exporting usernames and passwords
To manage usernames and passwords of different application monitors in batches, APM supports exporting usernames and passwords to an Excel file. If the usernames and passwords in the file are changed, you can import the new usernames and passwords to APM.
Exporting usernames and passwords
1. Click the Resource tab.
2. From the navigation tree, select Application Manager > Application Monitor.
The application monitor list page displays all application monitors.
3. Select application monitors for which you want to export the usernames and passwords.
4. Click Export Password.
The usernames and passwords are exported to an Excel file.
You can change the usernames and passwords in the Excel file, and then save them locally.
|
|
NOTE: · In the Excel file, you can change only usernames and passwords, as well as the key and super password if an application monitor has. Modifying other contents in the file results in import failure. · If the application monitor does not have a username or password, the Excel file is empty. |
Importing use names and passwords
1. Click the Resource tab.
2. From the navigation tree, select Application Manager > Application Monitor.
The application monitor list page displays all application monitors.
3. Click Import Password.
The Upload Username and Password File page opens.
4. Click Select File to select an Excel file exported by using the password export function.
5. Click Upload File.
The settings to be imported are displayed.
6. Verify the settings.
7. Click Import.
|
|
NOTE: To view the most recent import result, click View Import Result on the Import Password page. The import result is cleared when IMC restarts or you log off. |
Exporting application data
APM supports exporting the application monitoring data to an Excel file.
To export application data:
1. Click the Resource tab.
2. From the navigation tree, select Application Manager > Application Monitor.
The application monitor list page opens.
3. Perform one of the following tasks:
¡ To export data from specific application monitors, select the application monitors, and then click Export Selected.
¡ To export data from all application monitors, click Export All.
4. Save the Excel file locally.
Importing applications
This feature allows you to batch import applications of the same type. Unsupported application types are URL Sequence, Lync 2010 server, Lync 2013 server, Exchange 2003, Exchange 2007, Exchange 2010, and Exchange 2013.
To import applications, perform the following tasks:
1. Export an import template.
2. Configure the import template.
3. Import applications.
Exporting an import template
1. Click the Resource tab.
2. From the navigation tree, select Application Manager > Import Application.
The Batch Import Application page opens.
3. Click Select next to the Application Type field.
All available application types are displayed.
4. Select an application type, and then click OK.
The Application Category and Application Type fields are automatically populated.
5. Click Export to export an import template for the selected application type and save it locally.
Configuring the import template
1. Open the locally saved import template file.
2. Configure the application information to be imported.
Each line represents an application monitor.
Table 8 contains information specific to setting configuration items in an import template for bulk adding application monitors. For more information about setting the configuration items for an application monitor, see the procedure for adding that application monitor in this document.
Some configuration items are not available in an import template, and they are configurable only when you add application monitors one by one.
Table 8 Restrictions and guidelines about configuration items
|
Configuration item |
Remarks |
|
Use Template |
The import template does not include this item. The value for this item is Disable by default. |
|
Related Applications |
The import template does not contain this item. After applications are imported, you can navigate to Application Manager > Application Monitor to configure related applications for an application. |
|
Detect Application |
The import template does not contain this item. Application detection is enabled by default. |
|
Monitor type template |
The import template does not contain this item. |
|
Monitor types of SSH, Telnet, and SNMP |
To set the monitor type of SNMP, Telnet, or SSH in the import template: 1. Configure the access parameters in the SNMP, Telnet, or SSH sheet. 2. Copy the SNMP ID, Telnet ID, or SSH ID to the corresponding column of the app Config sheet. |
|
Monitor type of SSH |
The public key authentication method is not supported in the import template. After applications are imported, you can navigate to Application Manager > Application Monitor to configure the public key authentication method for an application. |
|
Use IPMI |
The import template does not contain this item. IPMI monitoring is disabled by default. |
|
Windows application |
When the monitor type is set to VMI, the import template does not support enabling event logging. After the application is imported, you can navigate to Application Manager > Application Monitor to configure event logging for the application. |
|
FTP service application |
The import template automatically sets the Whether to Download File and Whether to Upload File configuration items to Yes for the FTP service application. After the FTP service application is imported, you can navigate to Application Manager > Application Monitor to modify these configuration items for the application. |
|
Windows performance counter applications |
APM does not support batch importing Windows performance counter applications when it is deployed on Linux. |
Importing applications
1. Open the Batch Import Application page.
2. Click Select next to the Application Type field.
All available application types are displayed.
3. Select an application type, and then click OK.
The Application Category and Application Type fields are automatically populated.
4. Click Select File to select a configured import template file.
5. Click Upload to upload the import template file.
The applications to be imported are displayed in a list.
6. Click Import All to import all applications in the list.
To stop importing the applications, click Stop All.
To clear the application list, click Clear All.
Host monitoring
Host monitoring focuses on the availability and the health status of applications on each host. You can view a host monitor in either Host mode or in List mode.
Viewing a host monitor in host mode
1. Click the Resource tab.
2. From the navigation tree, select Application Manager > Host Monitor.
The Host Monitor page displays all host monitors in the default Host mode, as shown in Figure 29. The Host mode organizes application monitors based on hosts. The background color of each monitored application stands for the health status of that application. The availability icon to the left of each application monitor name stands for the availability status of that application. For more information about the availability and health status, see "Application monitor."
3. For a host managed by IMC, click the device label of the host to view its details. For more information about viewing host details, see H3C Intelligent Management Center v7.3 Enterprise and Standard Platform Administrator Guide.
4. Click an application monitor name to view the monitoring report for that application. The report contents vary with application types and will be described in subsequent chapters.
Figure 29 Host tab on the Host Monitor page
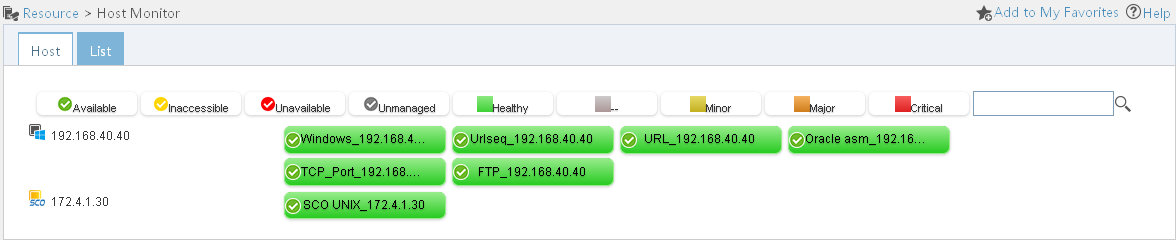
Viewing a host monitor in list mode
1. Click the Resource tab.
2. From the navigation tree, select Application Manager > Host Monitor.
The Host Monitor page displays all host monitors in the default Host mode.
3. Click the List tab.
The Host Monitor List opens, as shown in Figure 30.
Host monitor list contents
¡ Host—Device label of the host machine. For a host managed by the IMC platform, click the device label to view its details. For more information about viewing host details, see H3C Intelligent Management Center v7.3 Enterprise and Standard Platform Administrator Guide.
¡ OS—Operation system used in the host machine.
¡ CPU—CPU usage of the operating
system. Click the History Record icon ![]() to view the history CPU usage trend graph. Options are Last 1 Hour icon
to view the history CPU usage trend graph. Options are Last 1 Hour icon ![]() , Last 6 Hours icon
, Last 6 Hours icon ![]() , Today icon
, Today icon ![]() , Yesterday icon
, Yesterday icon ![]() , This Week icon
, This Week icon ![]() , This Month icon
, This Month icon ![]() ,
and This Year icon
,
and This Year icon ![]() .
.
¡ Memory—Memory usage of the operating
system. Click the History Record icon ![]() to view the history memory usage trend graph. Options are Last 1 Hour icon
to view the history memory usage trend graph. Options are Last 1 Hour icon ![]() , Last 6 Hours icon
, Last 6 Hours icon ![]() , Today icon
, Today icon ![]() , Yesterday icon
, Yesterday icon ![]() , This Week icon
, This Week icon ![]() , This Month icon
, This Month icon ![]() ,
and This Year icon
,
and This Year icon ![]() .
.
¡ System Running Time—Duration from the time when the OS started up to the time when APM most recently polled the OS.
¡ Availability—Availability of the
operating system of the host for the last poll query. The
availability is ![]() (Available),
(Available), ![]() (Unavailable),
(Unavailable), ![]() (Inaccessible), or
(Inaccessible), or ![]() (Unmanaged). Point to the icon to view the
availability represented by different colors for the last hour.
(Unmanaged). Point to the icon to view the
availability represented by different colors for the last hour.
¡ Health—Health status of the operating
system on the host for the last poll query. The health
status is ![]() (Healthy),
(Healthy), ![]() (Minor),
(Minor), ![]() (Major),
(Major), ![]() (Critical), or
(Critical), or ![]() (Unknown). Point to the icon to view the health status represented by different
colors in the last hour.
(Unknown). Point to the icon to view the health status represented by different
colors in the last hour.
¡ Host Topology—Click the Host Topology icon to view the host and related monitored applications in a topology view. For more information about the host topology, see "Topology and application group management."
¡ Analyze—Click the Analyze icon to view the root cause analysis for the application. For more information, see "Viewing root cause analysis."
¡ Application—Monitored applications on the host, except the operating system. Click an application icon to view the monitoring report for the application.
4. Click Refresh to update the content of the Host Monitor List.
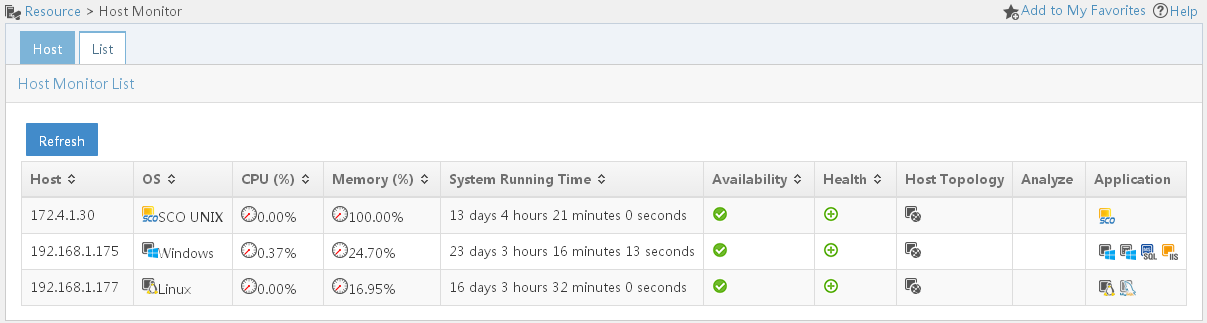
Class monitoring
Class monitoring focuses on the health status of applications. Application types are defined in APM. Every application type can have more than one application and the health status of the application depends on the worst health status.
To view application monitors by class:
1. Click the Resource tab.
2. From the navigation tree, select Application Manager > Class Monitor.
The Class Monitor page displays all application monitors based on their classes and types, as shown in Figure 31. The leftmost column displays the monitor classes and other columns are application types sorted by class. The background colors stand for the health status of the application types. The overall health status depends on the worst health status.
3. Click an application class name to view the list of all application types in that class.
The numbers next to the application class name represents the number of applications in healthy state out of the total number of applications for that class.
4. Click an application type name to view the list of all applications for that type.
The numbers next to the application class name represents the number of applications in healthy state out of the total number of applications for that type.
5. Point to an application type name to view the details of the health status. For example, Healthy: 1, Critical: 0, Major: 0, Minor: 0, --: 0.
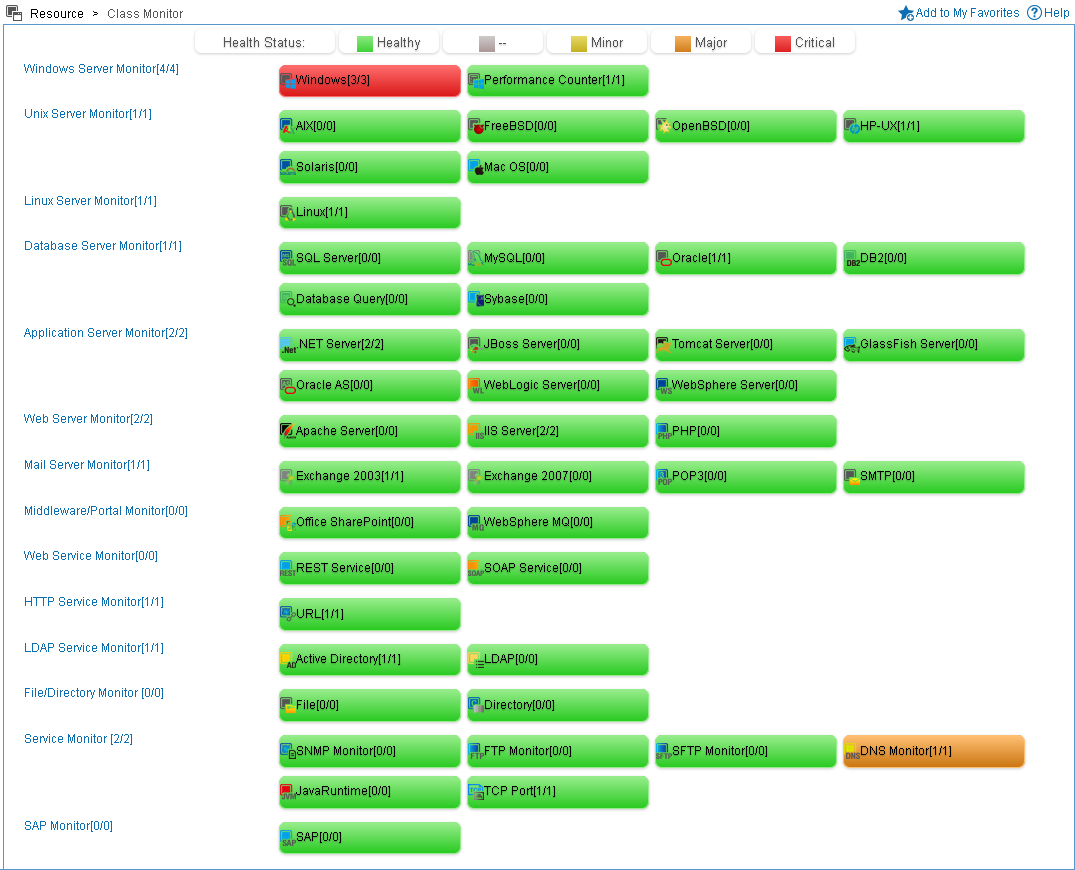
Custom views
APM allows operators to combine concerned indexes of different applications into one custom page to supply the support for the whole service performance and health status.
Viewing the custom view list
1. Click the Resource tab.
2. From the navigation tree, select Application Manager > Custom View.
The Custom View List page displays all custom views.
Custom view list contents
¡ Name—Name of the custom view.
¡ Description—Details of the custom view.
¡ Monitor Report—Click the Monitor Report
icon ![]() to view the custom report.
to view the custom report.
¡ Modify—Click the Modify icon ![]() to modify the custom view.
to modify the custom view.
¡ Delete—Click the Delete icon ![]() to delete the custom view.
to delete the custom view.
3. Click Refresh to update the content of the custom view list.
Viewing custom view details
1. Click the Resource tab.
2. From the navigation tree, select Application Manager > Custom View.
The Custom View List page displays all custom views.
3. Click the name of a custom view to view its details.
Custom view details
¡ Name—Name of the custom view.
¡ Description—Description of the custom view.
¡ Application Index List—Entire application monitor indexes for the custom view.
¡ Application Index—Application index name used by the custom view.
¡ Application Name—Name of the application to which the monitor index belongs.
¡ Application type—Type of the application to which the monitor index belongs.
3. Click Back to return to the Custom View List page.
Adding a custom view
1. Click the Resource tab.
2. From the navigation tree, select Application Manager > Custom View.
The Custom View List page displays all custom views.
3. Click Add.
The Add Custom View page opens.
4. Enter the name and description of the custom view. Description is helpful for managing and maintaining the custom view.
5. Click Add in the application index list.
The Select Application Index dialog box opens.
a. Click the Unfold
icon ![]() or Fold icon
or Fold icon ![]() to expand or
collapse an application type/application monitor index. One application type can contain one or more applications under
the selected type.
to expand or
collapse an application type/application monitor index. One application type can contain one or more applications under
the selected type.
b. Select the appropriate application indexes for the custom view.
c. Click OK.
The selected indexes are displayed in the application index list.
6. Click the Move Up
icon ![]() or Move Down icon
or Move Down icon ![]() to change the arrangement of the monitor indexes that display in
the custom report.
to change the arrangement of the monitor indexes that display in
the custom report.
7. Click OK.
Modifying a custom view
1. Click the Resource tab.
2. From the navigation tree, select Application Manager > Custom View.
The Custom View List page displays all custom views.
3. Click the Modify
icon ![]() for the
custom view you want to modify.
for the
custom view you want to modify.
The Add Custom View page opens.
4. Modify the description of the custom view. Description is helpful for managing and maintaining the custom view. You cannot modify the name of the custom view.
5. Click Add in the application index list.
The Select Application Index dialog box opens.
a. Click the Unfold
icon ![]() or Fold icon
or Fold icon ![]() to expand or collapse an application type/application monitor index. One application type can contain one or more applications under the selected type.
to expand or collapse an application type/application monitor index. One application type can contain one or more applications under the selected type.
b. Select the appropriate application indexes for the custom view.
c. Click OK.
6. Click the Delete icon ![]() for the application index that you do not want to display in the
custom report, and then click OK
to confirm the deletion.
for the application index that you do not want to display in the
custom report, and then click OK
to confirm the deletion.
7. Click the Move Up
icon ![]() or Move Down icon
or Move Down icon ![]() to change the arrangement of the monitor indexes that display in
the custom report.
to change the arrangement of the monitor indexes that display in
the custom report.
8. Click OK.
Deleting a custom view
When you delete a custom view, the associated application monitor indexes and data are not deleted, and you can view the application monitor indexes and data for a deleted custom view through the monitor reports.
To delete a custom view:
1. Click the Resource tab.
2. From the navigation tree, select Application Manager > Custom View.
The Custom View List page displays all custom views.
3. Click the Delete
icon ![]() for the
custom view you want to delete.
for the
custom view you want to delete.
4. Click OK to confirm the deletion.
Viewing a custom view report
1. Click the Resource tab.
2. From the navigation tree, select Application Manager > Custom View.
The Custom View List page displays all custom views.
3. Click the Report icon ![]() for the custom view for which you want to
view the monitoring report.
for the custom view for which you want to
view the monitoring report.
The custom view reports display different contents with each different monitor index. Different custom reports will be described in subsequent chapters.
The monitor index can set the same threshold value as that in the application monitor report. If you modify the threshold value in the custom view report, the threshold value in the application monitor report is also changed. For more information about threshold setting, see "Configuration management."
Topology and application group management
APM offers flexible topology and application group management functions:
· Topology—APM displays the physical relationship and logical relationship among applications, access devices, and physical network in a topology. Also, APM displays the availability and health status of applications in the topology.
· Application group management—Application group management allows operators to organize applications monitors into several groups by function or purpose and assign management authorities for the application monitor groups to different application administrators. Application group management simplifies the topology by displaying only the applications of the specified group rather than all applications.
Topology management
APM provides the following topology types:
· Application topology
· Dependency topology
· Host topology
· Group topology
· Converged topology
Topologies present applications, hosts, access devices, physical network, and their relationships in a graphical way to improve management efficiency.
Topology tools and right-click menu
In APM, all topologies share the same tools and provide one or more right-click menu options for the monitored applications.
Except the bird's-eye view, all tools are located on top of a topology to provide viewing aids.
Table 9 Topology tools
|
Tool |
Description |
|
|
Enters the select mode, in which operators can select and drag nodes on the topology. This is the default mode when you enter the topology. |
|
|
Changes the mouse cursor to a magnifier to enlarge specific parts of the topology. |
|
|
Enables or disables the bird's-eye view of the application. |
|
|
Zooms in the topology. |
|
|
Zooms out the topology. |
|
|
Restores the original size of the topology. |
|
|
Fits the topology to the window. |
|
|
Generates the snapshot picture of the topology. |
|
|
Updates the topology layout. |
|
|
Hides or displays alarms of the nodes on the topology. |
|
|
Hides or displays interface numbers of the nodes on the topology. |
|
|
Saves the topology after adjustment. |
|
|
Displays the topology in a bird's-eye view, from which operators can quickly understand the general layout of the topology and locate the current screen of topology in the whole topology map. Operators can click |
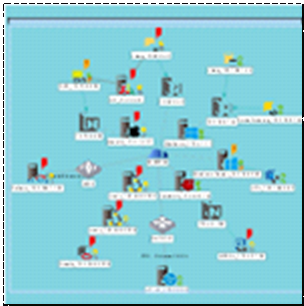
You can quickly navigate to related
functions of a monitored application by using the right-click menu options on
the topology. On the application topology, the right-click menu options of an application
icon also apply to hosts icons attached with an operating system logo (such as ![]() ).
).
Right-click menu options:
· Application Monitor—Select this option to view the monitoring report of the monitored application.
· Host Topology—Select this option to view the host topology. This option is available only for the host icon.
· Dependency Topology—Select this option to view the dependency topology of the monitored application.
· Query Alarm—Select this option to query alarms generated by the monitored application. This option is available only when the applications have alarms generated.
· Traffic Trends—Select this option to view the trends of the rates at which the monitored application received and sent traffic in the last hour.
Dependency topologies, host topologies, and group topologies support only the Monitor Application option.
Viewing an application topology
The application topology displays the physical relationship and logical relationship among applications, hosts, access devices, and physical network.
Physical relationship includes the connection relationship between access devices and the physical network, the connection relationship between hosts and access devices, and the relationship between OS applications and hosts.
Logical relationship includes the dependencies between non-OS applications and the OS and the dependencies between applications.
To view the application topology:
1. Click the Resource tab.
2. From the navigation tree, select Application Manager > Application Topology.
The application topology window opens, as shown in Figure 32. The topology shows all applications that the current operator has the management privileges to and the relationships among the applications, related hosts, access devices, and the physical network.
Figure 32 Application topology window
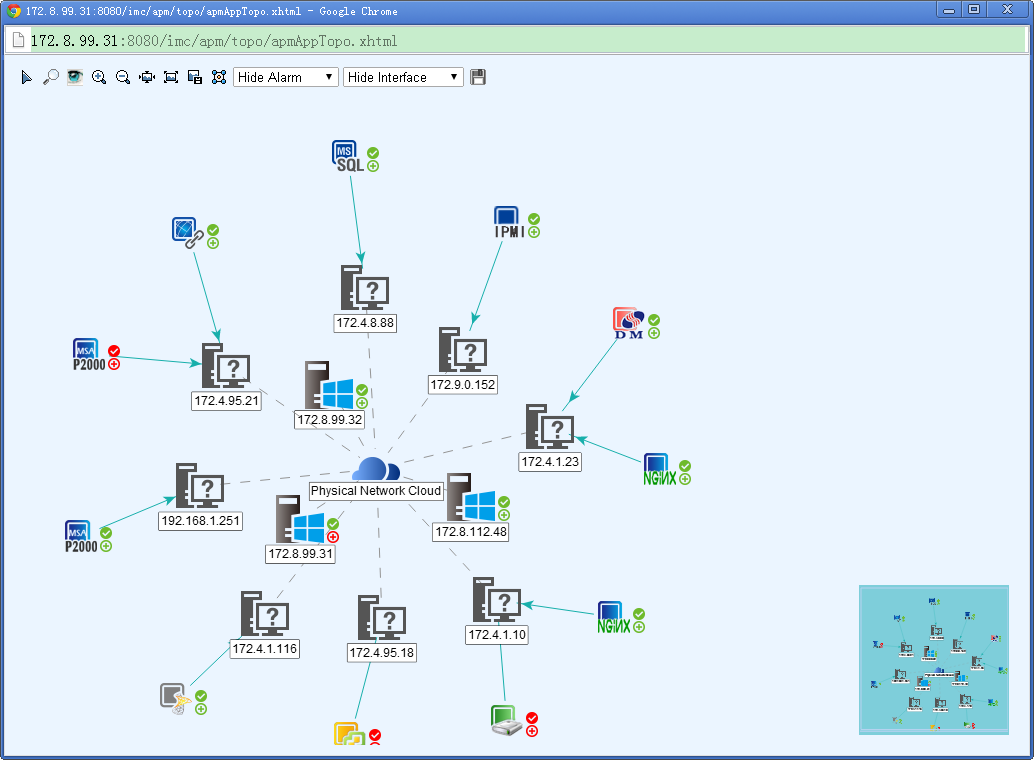
Table 10 Application topology icons
|
Icon |
Description |
|
|
Represents a host for which APM does not monitor the operating system. |
|
|
Represents a host for which APM is monitoring the operating system. The logo attached to the host icon varies with operating systems. |
|
|
Represents an application monitored by APM. The icon varies with the application type. This icon indicates an Active Directory application. |
|
|
This icon contains the following information: · Alarm—Number and highest severity of unrecovered alarms for an application. This icon is not displayed if no unrecovered alarm exists for the application. · Availability—Availability of an application for the last polling query. The icon varies with the availability. For more information, see "Monitor management." · Health status—Health status of an application for the last polling query. The icon varies with the health status. For more information, see "Monitor management." |
|
|
Represents a device that provides network access for applications. To display such devices on the topology, make sure you have added them to the IMC platform as access devices. |
|
|
Represents the physical network to which an access device is connected. |
|
|
Represents dependencies between two applications that use the same IP address. A dashed line represents indirect dependencies between the applications. Indirect dependencies are generated when the current operator has no management privileges to one or more intermediate applications. |
|
|
Represents dependencies between two applications that use different IP addresses. A dashed line represents indirect dependencies between the applications. Indirect dependencies are generated when the current operator has no management privileges to one or more intermediate applications. |
|
|
Represents the connection between a host and an access device or between an access device and the physical network. For a host-to-access device connection, the port that connects the host to the access device is also displayed. A dashed line represents an indirect connection between a host and the physical network. An indirect connection is displayed when the access device is not added to the IMC platform. For information about adding devices to IMC, see H3C Intelligent Management Center v7.3 Enterprise and Standard Platform Administrator Guide. |
Viewing a dependency topology
A dependency topology focuses on a single application and displays its dependencies with other applications, directly or indirectly.
You can view a dependency topology by using one of the following methods:
Method 1
1. Click the Resource tab.
2. From the navigation tree, select Application Manager > Application Monitor.
The application monitor list page displays all application monitors.
3. Click the Dependency
Topology icon ![]() for
the application for which you want to view the dependency topology.
for
the application for which you want to view the dependency topology.
Method 2
1. Click the Resource tab.
2. From the navigation tree, select Application Manager > Application Monitor.
The application monitor list page displays all application monitors.
3. Click the name of the application monitor.
The application monitor report page opens.
4. Click the Relationship
icon ![]() located in
the Monitor Information area for the target application.
located in
the Monitor Information area for the target application.
Method 3
1. Click the Resource tab.
2. From the navigation tree, select Application Manager > Application Topology.
The application topology window opens.
3. Right-click the application icon, and then select Dependency Topology from the popup menu.
The dependency topology window opens, as shown in Figure 33. The dependency topology contains only application icons and lines. For the icon description, see Table 10.
Figure 33 Dependency topology window
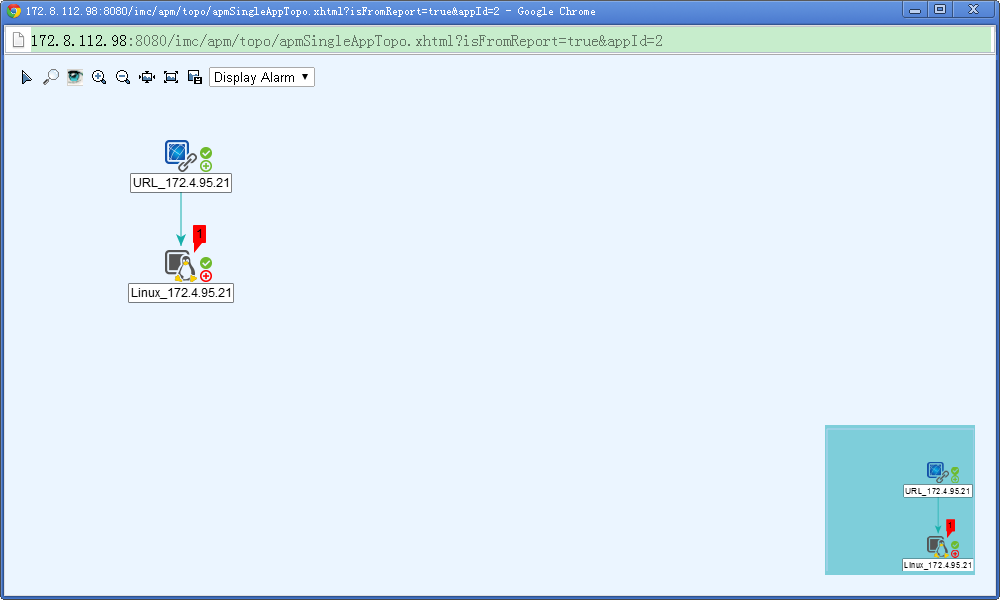
Viewing a host topology
A host topology focuses on a single host and displays dependencies of the operating system that runs on it with other applications.
To view a host topology:
1. Click the Resource tab.
2. From the navigation tree, select Application Manager > Host Monitor.
The Host Monitor page displays all host monitors in the default Host mode.
3. Click the Host tab.
The Host Monitor List is displayed.
4. Click the Host Topology
icon ![]() for the
host for which you want to view the host topology.
for the
host for which you want to view the host topology.
The host topology window opens, as shown in Figure 34. The host topology filters out physical networks and hosts for which APM does not monitor the operating system. For the icon description, see Table 10.
Figure 34 Host topology window
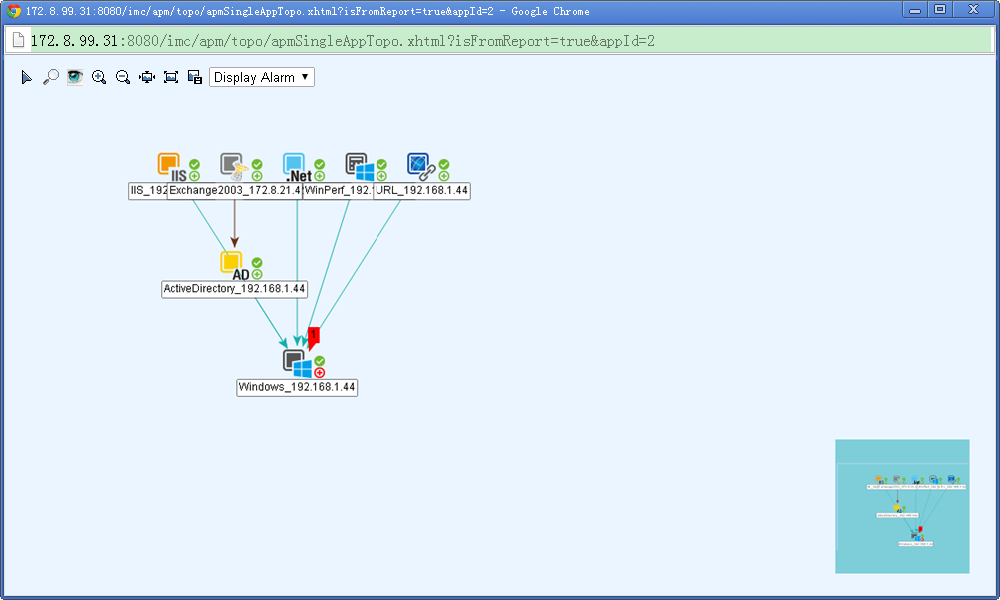
Viewing a group topology
Group topologies include logical group topology and physical group topology:
· Logical group topology—With a selected application group as the root, displays all its subgroups, applications in each subgroup, and logical relationship between the subgroups.
· Physical group topology—Displays the physical relationship and logical relationship between applications, access devices, and the physical network in a group (excluding subgroups).
Viewing a logical group topology
1. Click the Resource tab.
2. From the navigation tree, select Application Manager > Application Group.
The application group list page displays all application groups.
3. Click the Group
Topology icon ![]() for
the target application group.
for
the target application group.
The logical group topology window opens.
Figure 35 Logical group topology window
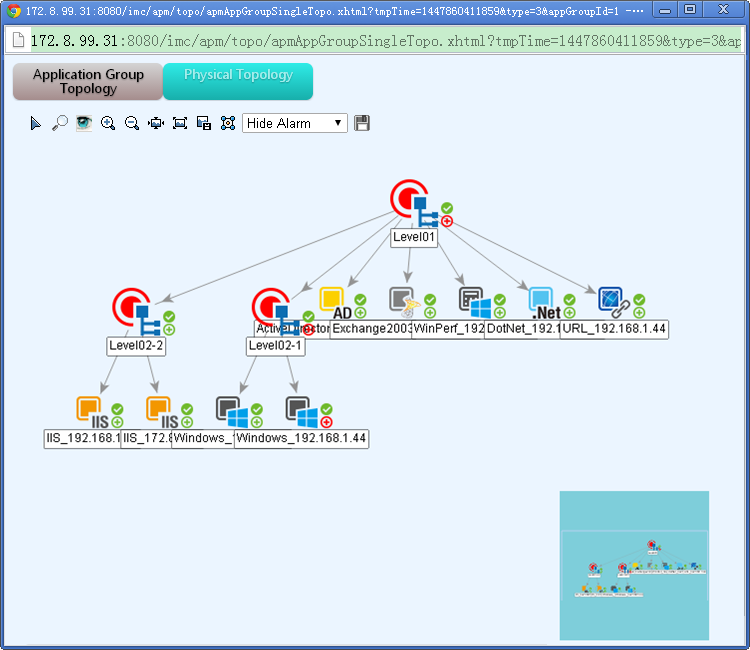
Table 11 Logical group topology icons
|
Icon |
Description |
|
|
Represents an application monitored by APM. The icon varies with the application type. This icon indicates a Windows application. |
|
|
Represents an application group. The operator with the management authority for the application group can view all applications of the application group in the topology. For more information about application group, see "Application group management" |
|
|
The alarm icon represents the number and highest severity of unrecovered alarms for an application. This icon is not displayed if no unrecovered alarm exists for the application. |
|
The availability icon represents the availability of an application or application group for the last polling query. The availability of an application group is determined by the application with the worst availability in the group or its subgroup. For information about the icon to display, see "Monitor management." |
|
|
The health status icon represents the health status of an application for the last polling query. The health status of an application group is determined by the application with the worst health status in the group or its subgroup. For more information about the icon to display, see "Monitor management." |
|
|
|
The availability icon represents the availability of an application group. The availability of an application group is determined by the application with the worst availability in the group or its subgroup. |
|
The health status icon represents the health status of an application group. The health status of an application group is determined by the application with the worst health status in the group or its subgroup. |
|
|
|
Points to a subgroup or application that an application group contains. |
Application group enables operators to manage applications by group based on the granted authorities. If an operator does not have the management authority for an application group, the operator cannot view applications of the application group in the logical group topology.
Viewing a physical group topology
1. Click the Resource tab.
2. From the navigation tree, select Application Manager > Application Group.
The application group list page displays all application groups.
3. Click the Physical
Topology icon ![]() for
the target application group. You can also click the Phy Topology tab
on the Logic Topology page.
for
the target application group. You can also click the Phy Topology tab
on the Logic Topology page.
The physical group topology window opens.
Figure 36 Physical group topology
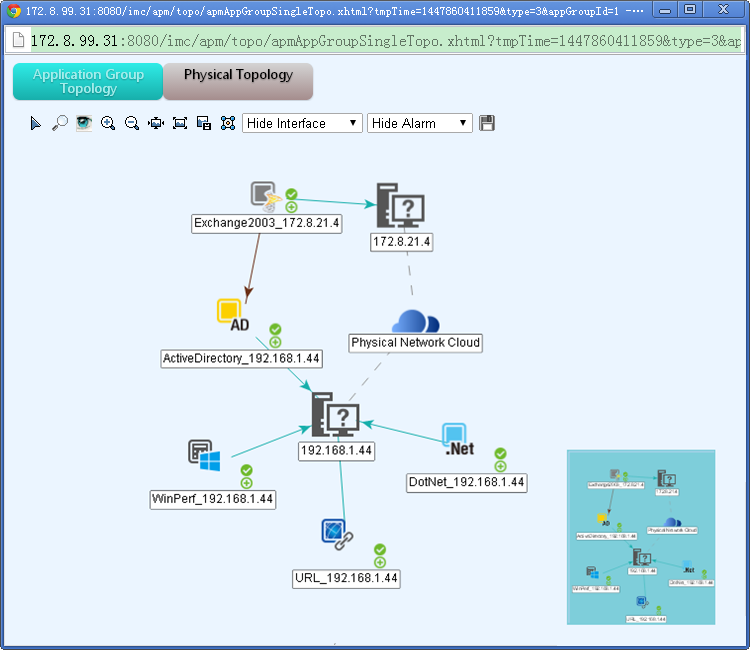
The application topology displays all applications on the network. The physical group topology displays the applications of an application group. Icons in the group topology are similar to those in the application topology. For more information about the icons, see Table 10.
The right-click menu of physical group topology includes only the Application Monitor option for you to display the application monitor report.
Viewing a converged topology
A converged topology converges multiple types of topologies into one topology. For more converged topology information, see H3C Intelligent Management Center v7.3 Enterprise and Standard Platform Administrator Guide.
To view a converged topology:
1. Click the Resource tab.
2. From the navigation tree, select View Management > Network Topology.
The topology page opens.
3. From the topology navigation tree, select Converged Topology.
Figure 37 Converged topology window
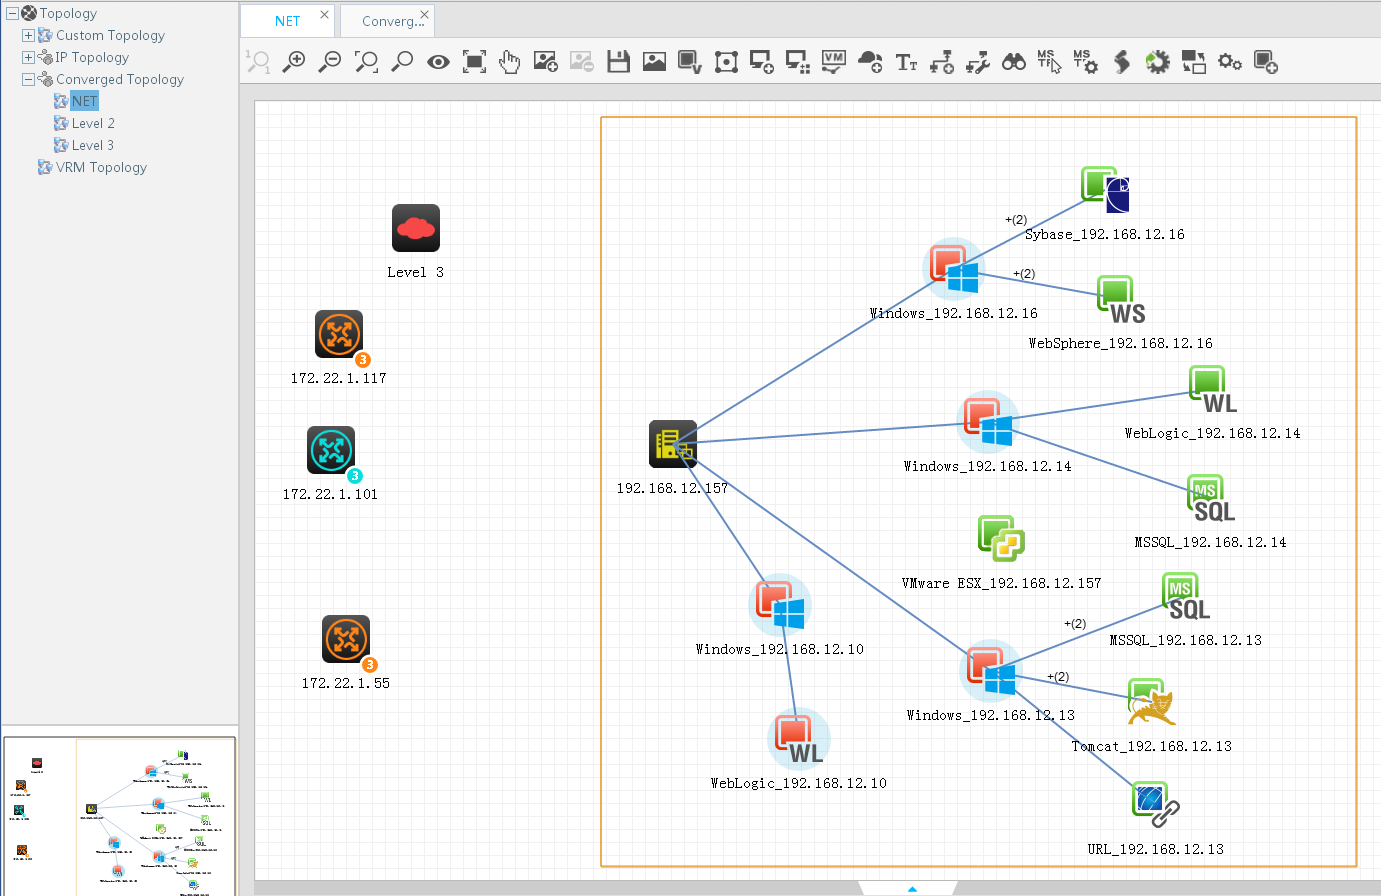
Adding an application topology into a converged topology
1. On the converged topology, right-click the blank space.
2. Select Add Application from the right-click menu.
3. On the popup window, select one or more applications, and then click OK to add the applications to the converged topology.
On the converged topology that includes applications:
· If an application does not have unrecovered alarms, the color of the application icon is green. If an application has unrecovered alarms, the application icon shows a color that corresponds to the highest alarm severity level, and the background of the application icon flashes.
· Click an application icon on the converged topology to display the key monitoring indexes of the application. Different applications have different key monitoring indexes. Common monitoring indexes for applications include:
¡ Availability—Availability of the application in the last polling of APM.
¡ Health—Health of the application in the last polling of APM.
¡ Monitor Report—Click the Monitor Report link to view the application's monitor report.
· Right-click an application icon on the converged topology to open the operation menu of the application.
¡ Add Link—Click this item. On the opened window, select a node and click OK. A link will be added between the application and the node.
¡ Add to subview—Click this item. On the opened window, select a subview and click OK to add the application to the subview.
¡ Modify Label—Click this item. On the opened window, modify the application label and click OK. This operation modifies only the application label displayed on the converged topology.
¡ Delete—Click this item to delete the application from the converged topology.
Application group management
APM allows you to manage monitored applications in groups. By default, all monitored applications belong to the system default group named ungrouped and all operators can manage applications in ungrouped. Once a monitored application is assigned to an application group, the application can be managed only by operators who are granted privileges to manage that application group.
You can add four hierarchy subgroups under a parent group and there is no inheritance relationship between them. You can view, add, modify, and delete applications.
Viewing the application group list
You can view all application groups in the Application Group List.
To view the application group list:
1. Click the Resource tab.
2. From the navigation tree, select Application Manager > Application Group.
The application group list page displays all application groups.
Application group list contents
¡ Name—Name of the application group. Click the name to view all monitored applications in the group.
¡ Availability—Availability of the application group. It is determined by the application with the worst availability in the group or its subgroup. The field value is Available when the application group does not include any applications.
¡ Health Status—Health status of the application group. It is determined by the application with the worst health status in the group or its subgroup. The field value is Healthy when the application group does not include any applications.
¡ Application Group Topology—Click the Application Group Topology icon ![]() to view the logical group
topology. For more information about the group topology, see "Viewing a logical group topology."
to view the logical group
topology. For more information about the group topology, see "Viewing a logical group topology."
¡ Physical Topology—Click the Physical Topology icon ![]() to view the physical
group topology. For more information about the group topology, see "Viewing a physical group topology."
to view the physical
group topology. For more information about the group topology, see "Viewing a physical group topology."
¡ Analyze—Click the Analyze icon ![]() to analyze the root cause for the alarms generated by applications
in the group or subgroups.
to analyze the root cause for the alarms generated by applications
in the group or subgroups.
Figure 38 Root cause analysis
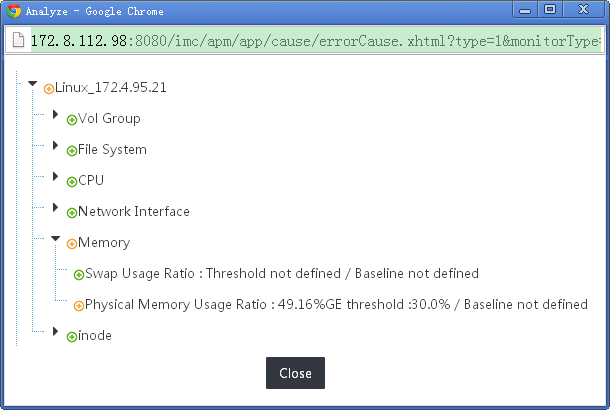
¡ Details—Click the Details icon ![]() to view detailed
information about the application group.
to view detailed
information about the application group.
¡ Modify—Click
the Modify icon ![]() to modify the application group.
to modify the application group.
¡ Delete—Click
the Delete icon ![]() to delete the
application group.
to delete the
application group.
3. Click Refresh.
|
|
NOTE: You can sort the application group list by name, availability, or health status by clicking the appropriate list label. |
Viewing the application group details
1. Click the Resource tab.
2. From the navigation tree, select Application Manager > Application Group.
The application group list page displays all application groups.
3. Click the Details
icon ![]() for the application group for which you
want to view its details.
for the application group for which you
want to view its details.
Application group details
¡ Name—Name of the application group.
¡ Description—Description of the application group.
¡ Operator Group—Names of the operator groups to manage the application group and applications in the application group. For information about viewing operators in the group, see H3C Intelligent Management Center v7.3 Enterprise and Standard Platform Administrator Guide.
¡ Application—All applications that belong to the application group.
¡ Parent Group—Application group's parent group. An application group can belong to only one parent group.
4. Click Back to go back to the application list page.
Adding an application group
1. Click the Resource tab.
2. From the navigation tree, select Application Manager > Application Group.
The application group list page displays all application groups.
3. Click Add.
The Add page opens.
4. Specify a unique application group name.
5. Describe the application group details in the Description field.
6. Select groups of operators who are permitted to manage the application group and its member applications:
a. Click Add. The Select Operator Group window opens.
b. Select one or more operator groups as needed.
c. Click OK.
All selected operator groups are displayed in the Operator Group box.
7. Add applications to the application group:
a. Click Add. The Select Application window opens.
b. Select one or more applications as needed.
c. Click OK.
All selected applications are displayed in the Application box.
8. Select a parent group for the application group from the Parent Group list. If no parent relationship exists, leave this option blank.
9. To send alarm notifications for monitored applications:
a. Select enable from the Alarm Notification list.
b. On the Mail Setting tab, enter an IP address in the Destination IP Address field, and then click Add.
c. On the SMS Setting tab, enter a phone number in the Mobile Phone Number field, and then click Add.
d. Select an alarm level from the Concerned Alarm Levels list.
e. Select All Alarms or Selected Alarms from the Concerned Alarms list.
If Selected Alarms is selected, click Select, select alarm types to be included, and then click OK.
f. Set the time range for alarm notifications in the Time Ranges field. The time range is set by week in hh:mm-hh:mm format.
10. Click OK.
Modifying an application group
1. Click the Resource tab.
2. From the navigation tree, select Application Manager > Application Group.
The application group list page displays all application groups.
3. Click the Modify
icon ![]() for the
application group you want to modify.
for the
application group you want to modify.
4. Enter a unique new name for the application in the Name field.
5. Modify the description of the application group in the Description field.
6. Modify the groups of operator who are permitted to manage the operator group and its member applications:
a. Click Add.
The Select Operator Group page opens.
b. Select one or more operator groups as needed.
c. Click OK.
All selected operator groups are displayed in the Operator Group box.
d. Select one or multiple operator groups that you no longer permit to manage the application group and its members in the Operator Group box.
e. Click Delete.
Each selected operator group is removed from the Operator Group box.
7. Modify applications in the group:
a. Click Add.
The Select Application page opens.
b. Select one or more applications as needed.
c. Click OK.
All selected applications are displayed in the Application box.
d. Select one or more applications you want to remove from the application group in the Application box.
e. Click Delete.
f. Click OK.
Each selected operator group is removed from the Application box.
8. Select a new parent group from the Parent Group list. If no parent relationship exists, select the blank option from the list.
9. To send alarm notifications for monitored applications:
a. Select enable from the Alarm Notification list.
b. On the Mail Setting tab, enter an IP address in the Destination IP Address field, and then click Add.
c. On the SMS Setting tab, enter a phone number in the Mobile Phone Number field, and then click Add.
d. Select an alarm level from the Concerned Alarm Levels list.
e. Select All Alarms or Selected Alarms from the Concerned Alarms list.
If Selected Alarms is selected, click Select, select alarm types to be included, and then click OK.
f. Set the time range for alarm notifications in the Time Ranges field. The time range is set by week in hh:mm-hh:mm format.
10. Click OK.
Deleting an application group
Use caution when deleting an application group because this action simultaneously deletes any associated subgroups. Further, once an application group is deleted, applications in the deleted group are moved to ungrouped if they do not belong to any other application groups.
To delete an application group:
1. Click the Resource tab.
2. From the navigation tree, select Application Manager > Application Group.
The application group list page displays all application groups.
3. Click the Delete
icon ![]() for the
application group you want to delete.
for the
application group you want to delete.
4. Click OK.
APM agent management
An APM agent collects application index data from a target host in local monitor mode. Using an agent to collect data can secure the OS privileges and obtain data that cannot be obtained in remote monitor mode.
Installing and upgrading an APM agent
Make sure the APM agent has the same version as APM. You can install and upgrade an APM agent locally and remotely.
Installing an APM agent locally
To install an APM agent locally, operators must download the installation package (for Windows or Linux) to the local directory by using agent management.
To install an APM agent locally:
1. Click the Resource tab.
2. From the navigation tree, select Application Manager > Agent Management.
3. Click Download.
4. Select Agent Package (Windows) or Agent Package (Linux) as needed.
The installation package is saved to the local directory.
5. Copy the installation package to the destination host by using FTP, file sharing, or SCP, and decompress it.
6. Double-click the install.bat script and enter the IP address of the IMC server as prompted.
If IMC is deployed in distributed mode, enter the IP address of the master server.
7. Click OK.
Installing an APM agent remotely
This function uses WMI (Windows) or SSH (Linux) on the destination host. To install an APM agent remotely, you must obtain the IP address of the destination host and administrator username and password.
To install an APM agent remotely:
1. Click the Resource tab.
2. From the navigation tree, select Application Manager > Agent Management.
3. Click Install.
4. Configure the following parameters:
¡ Destination Host IP—Enter the IP address of the destination host, and then click Add. The IP address is added to the Host List area.
¡ Host List—Displays the hosts on which the agent is remotely installed. To remove an IP address from the Host List area, select the IP address, and then click Delete.
¡ Host Type—Select a host type, Windows or Linux. If you click Select Template, this field is automatically populated.
¡ Installation Path—Enter the absolute agent installation path. In this example, enter D:\agent for Windows and /home/agent for Linux. If you click Select Template, this field is automatically populated.
¡ Username/Password—Enter the username and the password used for connecting to the destination host. If you click Select Template, this field is automatically populated.
- For Windows, the username must have the administrator rights.
- For Linux, the username must have the root rights and the rights to execute the installation file.
¡ Description—Enter a description of the installation task.
5. Click Install.
Figure 39 Installing the APM agent remotely
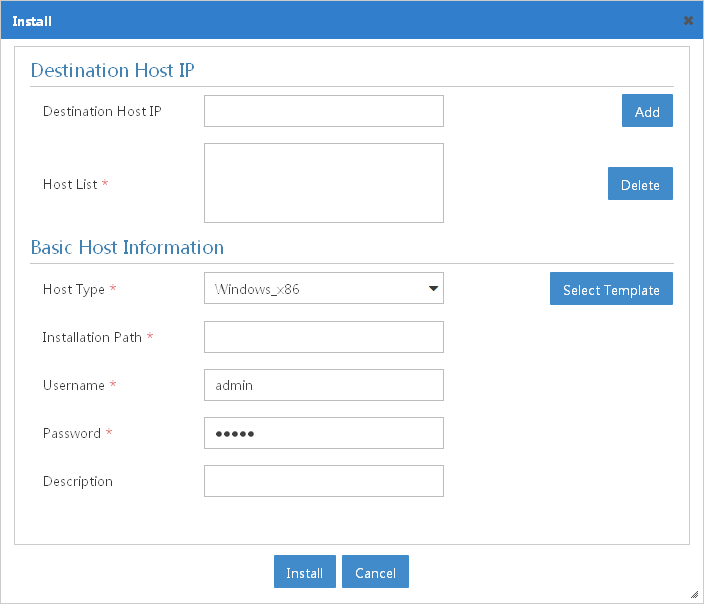
|
|
NOTE: To use an agent template, you must add the template to APM first. For information about adding an agent template, see "Configuration management." |
Upgrading an APM agent locally
To upgrade an APM agent locally, operators must obtain the upgrade package (for Windows or Linux) by using agent management.
To upgrade an APM agent locally:
1. Click the Resource tab.
2. From the navigation tree, select Application Manager > Agent Management.
3. Click Download.
4. Select Agent Upgrade Package (Windows) or Agent Upgrade Package (Linux) as needed.
The upgrade package is saved to the local directory.
5. Copy the upgrade package to the Agent directory of the agent installation path.
6. Extract the compressed files from the upgrade package into the current directory.
7. Run update.bat in the AgentUpdate directory.
Upgrading an APM agent remotely
This function uses WMI (Windows) or SSH (Linux) on the destination host. To upgrade an APM agent remotely, make sure WMI or SSH is enabled.
After APM is upgraded, it automatically detects all managed APM agents and pushes upgrade packages for agent upgrade. If an APM agent fails to be upgraded remotely, upgrade the agent locally. For more information, see "Upgrading an APM agent locally."
Managing APM agents
You can use agent management to install, delete, start, or stop APM agents, or automatically detect applications.
Viewing the APM agent list
1. Click the Resource tab.
2. From the navigation tree, select Application Manager > Agent Management.
The agent list is displayed.
Agent list contents
¡ Destination Host IP—IP address of the host where the APM agent is deployed. Click the IP address to view agent details.
¡ Version—Version of the APM agent.
¡ Installation Time—Time when the APM agent was installed.
¡ Upgrade Time—Time when the APM agent was most recently upgraded.
¡ Description—Descriptive information about the APM agent.
¡ Status—Current state of the APM agent.
¡ Operation—Operations that can be performed on the APM agent.
¡ Auto Discovery—The APM agent automatically detects all applications running on the destination host after installation completion. Click Result to view the auto discovery result.
¡ Managed Application—Applications monitored by the APM agent on the destination host.
¡ Delete—Click the Delete icon ![]() to delete APM
agents in incorrect status due to authentication error or connection failure.
to delete APM
agents in incorrect status due to authentication error or connection failure.
Viewing agent details
1. Click the Resource tab.
2. From the navigation tree, select Application Manager > Agent Management.
The agent list is displayed.
3. Click the IP address of an APM agent to view its details.
¡ Destination Host IP—IP address of the host where the APM agent is deployed.
¡ Host Type—OS of the destination host, Windows or Linux.
¡ Installation Path—Absolute APM agent installation path. For example, D:\agent on Windows and /home/agent on Linux.
¡ Description—Descriptive information about the APM agent.
4. Click Back.
Starting an APM agent
1. Click the Resource tab.
2. From the navigation tree, select Application Manager > Agent Management.
The agent list is displayed.
3. Click the Start icon ![]() for an APM
agent.
for an APM
agent.
The APM agent status becomes Starting. The Start icon is displayed only for APM agents in Stopped state.
4. Click Refresh.
Stopping an APM agent
1. Click the Resource tab.
2. From the navigation tree, select Application Manager > Agent Management.
The agent list is displayed.
3. Click the Stop icon ![]() for an APM
agent.
for an APM
agent.
The APM agent status becomes Stopping. The Stop icon is displayed only for APM agents in Started state.
4. Click Refresh.
Viewing the auto discovery result
1. Click the Resource tab.
2. From the navigation tree, select Application Manager > Agent Management.
The agent list is displayed.
3. Click Result in the Auto Discovery column for an APM agent.
The Auto Discovery Result page opens.
¡ Device—IP address of the host where the APM agent is deployed.
¡ Application Type—Type of the application.
¡ Application Monitor Port—Port used to monitor the application.
¡ Add to Monitor—Click Add to Monitor for an unmonitored application to add monitor for the application. Click Add the same type of application for a monitored application to add monitor for the same type of applications.
Adding an application monitor
You can click Add to Monitor or Add the same type of application on the Auto Discovery Result page to add an application monitor.
1. Click the Resource tab.
2. From the navigation tree, select Application Manager > Agent Management.
The agent list is displayed.
3. Click Result in the Auto Discovery column for an APM agent.
The auto discovery result page opens.
4. Click Add to Monitor or Add the same type of application.
5. On the page that opens, configure the application monitor parameters.
The Enable Agent Collection parameter is displayed only for application that can be monitored by an APM agent.
6. Click OK.
Deleting an APM agent
This function deletes APM agents in incorrect status due to authentication error or connection failure.
1. Click the Resource tab.
2. From the navigation tree, select Application Manager > Agent Management.
The agent list is displayed.
3. Click the Delete icon ![]() for an APM agent.
for an APM agent.
4. Click OK.
Configuration management
APM provides the following additional configuration management functions:
· Threshold Management—Sets threshold alarm conditions for the monitoring application indexes. If the collected indexes meet the threshold alarm conditions, APM sends a corresponding alarm through the alarm function of the IMC platform. If the alarm notification and forwarding configuration is set correctly, operators can receive alarm information sent by APM through emails or short messages.
· Baseline Configuration—Enables or disables the baseline function for application indexes. When you enable the baseline function for an application index, APM performs the following operations:
¡ Collects the index data.
¡ Generates initial baseline data after seven days.
¡ Generates stable baseline data after five weeks.
APM determines the index state according to the baseline data. Alarms are generated when the baseline data is in an abnormal state. If the alarm notification and forwarding configuration is set correctly, operators can receive alarm information sent by APM through emails or SMS messages.
· Port Configuration—Sets default application monitor and traffic collection ports for applications. Through ports, APM can identify different applications in Auto Discovery and traffic collection.
· Probe Configuration—Manages a list of probes. A probe is a server where the probe application is installed. Operators can collect the network traffic of applications by mirroring network traffic to the probe.
· Parameter Configuration—Sets APM system parameters, including the monitor data retention periods and data background colors.
· Template Configuration—Provides application templates for application monitors and agent templates for remotely installed agents. Using templates simplifies the configuration and reduces the chances of making mistakes.
Threshold management
APM predefines multiple monitor indexes for each type of applications, and sets the threshold alarm conditions for certain key monitor indexes. Operators can view application monitor indexes configured with the threshold alarm function and their threshold configurations. To enable the threshold alarm function for other application monitor indexes, use the monitor index adding function in threshold configuration.
By default, when application monitor indexes meet Level-1 threshold conditions, APM sends major alarms. When application monitor indexes meet Level-2 threshold conditions, APM sends critical alarms. You can modify the alarm severity level for the Level-1 Threshold Alarm of Application Management and Level-2 Threshold Alarm of Application Management traps. APM will send related alarms and calculate the health status according to the modified alarm severity levels. To modify the alarm severity level, navigate to Trap Management > Trap Definition of the IMC PLAT. For more information, see H3C Intelligent Management Center v7.3 Enterprise and Standard Platform Administrator Guide.
Application monitor thresholds can be global or custom, depending on the effective range. You can set a global threshold for a monitor index only in threshold configuration. You can set a custom threshold in the application monitor report or custom view report. By default, monitor indexes enabled with the threshold alarm function use global thresholds.
· Global threshold—Applies to a specific widely deployed application type. The same application type has the same global threshold.
· Custom threshold—Monitors a single application. With custom thresholds, applications of the same type can use different thresholds. You can enable and modify custom thresholds for a monitor index only after you add a global threshold for the monitor index.
This section describes how to query, add, modify, and delete alarm indexes, and how to configure monitor indexes to use global thresholds or custom thresholds in reports.
Viewing the global threshold List
1. Click the Resource tab.
2. From the navigation tree, select Application Manager > Configurations.
The Configurations page opens.
3. Click Threshold Configuration.
The Global Threshold List displays all monitor indexes enabled with the threshold alarm function and the global threshold of each index.
4. Click an application category to view monitor indexes for this application category.
The Application Type field also refreshes.
To view baseline configurations for all application categories, click Unlimited next to Application Category.
5. Click an application type to view monitor indexes for this application type.
To view baseline configurations for all application types of an application category, click the application category, and then click Unlimited next to Application Type.
Global Threshold List contents
¡ Application Type—Type of the application.
¡ Application Unit—Name of the application unit to which the monitor index belongs. Each application unit corresponds to an independent area in the application monitor report.
¡ Index—Name of the application monitor index enabled with the threshold alarm function.
¡ Threshold Condition—Threshold condition, which can be Greater than or equal to (≥), Less than or equal to (≤), Include, or Exclude.
¡ Enable Level-1 Threshold—Displays whether the Level-1 threshold for the monitor index has been set.
¡ Level-1 Threshold—Level-1 threshold value of the monitor index.
¡ Trigger Times—Number of times that the monitor index meets the Level-1 threshold to trigger an alarm.
¡ Enable Level-2 Threshold—Displays whether the Level-2 threshold for the monitor index has been set.
¡ Level-2 Threshold—Level-2 threshold value of the monitor index.
¡ Trigger Times—Number of times that the monitor index meets the Level-2 threshold to trigger an alarm.
¡ Modify—Click the Modify icon ![]() to modify the
predefined or user-defined global threshold values.
to modify the
predefined or user-defined global threshold values.
¡ Delete—Click the Delete icon ![]() to delete the predefined or user-defined global threshold values.
to delete the predefined or user-defined global threshold values.
6. Click Refresh to refresh the global threshold list.
7. Click Back to return to the Configurations page.
Adding threshold configuration
With this function, operators can manually enable the threshold alarm function and set thresholds for monitor indexes. In addition, operators can configure monitor indexes to use global thresholds or custom thresholds in the application monitor report or custom view report.
To add threshold configuration for a monitor index:
1. Click the Resource tab.
2. From the navigation tree, select Application Manager > Configurations.
The Configurations page opens.
3. Click Threshold Configuration.
The Global Threshold List is displayed.
4. Click Add.
The Add Threshold page opens.
5. Configure the following parameters for the monitor index:
¡ Application Type—Click Select, and then select an application type from the popup window. The selected application type name automatically populates the Application Type field.
¡ Application Unit/Index/Threshold Type—Click Select, and then select an application monitor index from the popup window (options vary with application type), and then click OK. The name, type, and application unit of the selected monitor index automatically populate the Index, Threshold Type, and Application Unit fields.
¡ Threshold Condition—Select a threshold condition from the list (options vary with the monitor index type). For the Value type, options are Greater than or equal to and Less than or equal to. For the String type, options are Include and Exclude.
¡ Unit—Select a unit type of the monitor index from the list. The value depends on the monitor index type. Some indexes do not contain a unit type, such as the physical thread count of a .NET server.
6. Configure the Level-1 threshold parameters for the monitor index.
APM generates a major alarm when the monitor index meets the Level-1 threshold. If you enable the Level-2 threshold, APM generates a major alarm when the monitor index meets the Level-1 threshold but does not meet the Level-2 threshold.
¡ Enable Level-1 Threshold—Configure the Level-1 threshold setting for the monitor index.
¡ Threshold—If you enable the Level-1 threshold, set a Level-1 threshold value in the Threshold field.
¡ Trigger Times—If you enable the Level-1 threshold, set an alarm trigger frequency in the Trigger Times field. When the monitor index meets the Level-1 threshold once, the field value increases by one. APM generates a Level-1 threshold alarm if the monitor index meets the Level-1 threshold for the number of times specified by Trigger Times.
7. Configure the Level-2 threshold parameters for the monitor index.
APM generates a critical alarm when the monitor index meets the Level-2 threshold.
¡ Enable Level-2 Threshold—Configure the Level-2 threshold setting for the monitor index. If you enable the Level-2 threshold, set a Level-2 threshold value in the Threshold field. APM activates a critical alarm when the monitor index meets the threshold.
¡ Threshold—If you enable the Level-2 threshold, set a Level-2 threshold value in the Threshold field.
¡ Trigger Times—If you enable the Level-2 threshold, set an alarm trigger frequency in the Trigger Times field. When the monitor index meets the Level-2 threshold once, the field value increases by one. APM generates a Level-2 threshold alarm if the monitor index meets the Level-2 threshold for the number of times specified by Trigger Times.
8. Click OK.
Modifying global threshold configuration
To modify global threshold configuration of a monitor index:
1. Click the Resource tab.
2. From the navigation tree, select Application Manager > Configurations.
The Configurations page opens.
3. Click Threshold Configuration.
The Global Threshold List is displayed.
4. Click the Modify icon ![]() for the threshold you want to modify.
for the threshold you want to modify.
The Modify Threshold page opens.
5. Modify basic parameters of the monitor index as needed:
¡ Application Type—Cannot be modified.
¡ Application Unit—Cannot be modified.
¡ Index—Cannot be modified.
¡ Threshold Type—Cannot be modified.
¡ Threshold Condition—Modify the threshold condition. Options vary with the monitor index type. For the Value type, options are Greater than or equal to and Less than or equal to. For the String type, options are Include and Exclude.
¡ Unit—Modify the threshold unit type. The value depends on the monitor index type. Some indexes do not contain a unit type, such as the physical thread count of a .NET server.
You cannot modify the application type, application unit, index, and threshold type.
6. Modify the Level-1 threshold parameters for the monitor index.
APM generates a major alarm when the monitor index meets the Level-1 threshold. If you enable the Level-2 threshold, APM generates a major alarm when the monitor index meets the Level-1 threshold but does not meet the Level-2 threshold.
¡ Enable Level-1 Threshold—Modify the Level-1 threshold setting for the monitor index. You can modify the Level-1 threshold value or disable the Level-1 threshold as needed.
¡ Threshold—If you enable the Level-1 threshold, set a Level-1 threshold value in the Threshold field.
¡ Trigger Times—If you enable the Level-1 threshold, set an alarm trigger frequency in the Trigger Times field. When the monitor index meets the Level-1 threshold once, the field value increases by one. APM generates a Level-1 threshold alarm if the monitor index meets the Level-1 threshold for the number of times specified by Trigger Times.
7. Modify the Level-2 threshold parameters for the monitor index.
APM generates a critical alarm when the monitor index meets the Level-2 threshold.
¡ Enable Level-2 Threshold—Modify the Level-2 threshold setting for the monitor index. You can modify the Level-2 threshold value or disable the Level-2 threshold as needed.
¡ Threshold—If you enable the Level-2 threshold, set a Level-2 threshold value in the Threshold field.
¡ Trigger Times—If you enable the Level-2 threshold, set an alarm trigger frequency in the Trigger Times field. When the monitor index meets the Level-2 threshold once, the field value increases by one. APM generates a Level-2 threshold alarm if the monitor index meets the Level-2 threshold for the number of times specified by Trigger Times.
8. Click OK.
Deleting monitor indexes from threshold configuration
You can delete only the monitor indexes for which the threshold alarm function is manually enabled. After a monitor index is deleted, operators cannot set thresholds for the monitor index on the Threshold Setting page navigated from an application monitor report page or a custom application monitor report page.
To delete a monitor index:
1. Click the Resource tab.
2. From the navigation tree, select Application Manager > Configurations.
The Configurations page opens.
3. Click Threshold Configuration.
The Global Threshold List opens.
4. Click the Delete icon ![]() for the monitor index you want to delete.
for the monitor index you want to delete.
5. Click OK.
Configuring a monitor index to use global threshold or custom threshold
You can configure a monitor index to use a global threshold or custom threshold in the application monitor report or custom view report. By default, monitor indexes enabled with the threshold alarm function use global threshold.
To configure a monitor index to use global threshold or custom threshold:
1. Click the Resource tab.
2. Use one of the following methods to open the Threshold Setting page:
Method 1
a. From the navigation tree, click Application Manager > Application Monitor.
b. Click the target application name on the application monitor list.
c. Click the Set Threshold
icon ![]() for the
target monitor index on the application monitor report page.
for the
target monitor index on the application monitor report page.
For a monitor index not enabled with the threshold alarm function, enable the threshold alarm function for the monitor index. For more information, see "Adding threshold configuration."
Method 2
a. From the navigation tree, click Application Management > Custom View to open the custom monitor list.
b. Click the Monitor Report
icon ![]() for the target
custom monitor on the custom monitor list.
for the target
custom monitor on the custom monitor list.
c. Click the Set Threshold icon ![]() for the target
monitor index on the custom monitor report page.
for the target
monitor index on the custom monitor report page.
For a monitor index not enabled with the threshold alarm function, enable the threshold alarm function for the monitor index. For more information, see "Adding threshold configuration."
|
|
NOTE: The threshold you set for a monitor index on the application monitor report page also applies to the same monitor index on the custom monitor page. The threshold you set for a monitor index on the custom monitor page also applies to the same monitor index on the application monitor report page. |
3. Select Custom or Global for Threshold Type.
¡ If you select Custom for the Threshold Type field, set a custom threshold for the monitor index. For more information, see "Modifying global threshold configuration."
¡ If you select Global for the Threshold Type field, the monitor index uses the global threshold set in the threshold configuration.
4. Click OK.
Exporting custom thresholds
1. Click the Resource tab.
2. From the navigation tree, select Application Management > Configurations.
3. Click Threshold Config.
4. Click Custom Thresholds.
5. Perform one of the following tasks:
¡ To export specific custom thresholds, select the thresholds, and then click Export.
¡ To export all custom thresholds, click Export All.
A dialog box opens.
6. Specify a path to save the exported file.
Modifying custom threshold configuration
To modify custom threshold configuration of a monitor index:
1. Click the Resource tab.
2. From the navigation tree, select Application Manager > Configurations.
The Configurations page opens.
3. Click Threshold Configuration.
4. Click the Custom Threshold tab.
5. Click the Modify icon ![]() for the threshold you want to modify.
for the threshold you want to modify.
The Modify Threshold page opens.
6. Modify basic parameters of the monitor index as needed:
¡ Threshold Type—Select the Custom type.
¡ Threshold Condition—Modify the threshold condition. Options vary with the monitor index type. For the Value type, options are Greater than or equal to and Less than or equal to. For the String type, options are Include and Exclude.
¡ Unit—Modify the threshold unit type. The value depends on the monitor index type. Some indexes do not have a unit, such as the physical thread count of a .NET server.
7. Modify the Level-1 threshold parameters for the monitor index.
APM generates a major alarm when the monitor index meets the Level-1 threshold. If you enable the Level-2 threshold, APM generates a major alarm when the monitor index meets the Level-1 threshold but does not meet the Level-2 threshold.
¡ Enable Level-1 Threshold—Modify the Level-1 threshold setting for the monitor index. You can modify the Level-1 threshold value or disable the Level-1 threshold as needed.
¡ Threshold—If you enable the Level-1 threshold, set a Level-1 threshold value in the Threshold field.
¡ Trigger Times—If you enable the Level-1 threshold, set an alarm trigger frequency in the Trigger Times field. APM generates a Level-1 threshold alarm if the monitor index meets the Level-1 threshold for the number of times specified by Trigger Times.
8. Modify the Level-2 threshold parameters for the monitor index.
APM generates a critical alarm when the monitor index meets the Level-2 threshold.
¡ Enable Level-2 Threshold—Modify the Level-2 threshold setting for the monitor index. You can modify the Level-2 threshold value or disable the Level-2 threshold as needed.
¡ Threshold—If you enable the Level-2 threshold, set a Level-2 threshold value in the Threshold field.
¡ Trigger Times—If you enable the Level-2 threshold, set an alarm trigger frequency in the Trigger Times field. APM generates a Level-2 threshold alarm if the monitor index meets the Level-2 threshold for the number of times specified by Trigger Times.
9. Click OK.
Baseline configuration
The baseline function of an application index can only be enabled or disabled globally. When you enable the baseline function for an application index, specify a baseline alarm level for the index.
Viewing the baseline configuration list
1. Click the Resource tab.
2. From the navigation tree, select Application Manager > Configurations.
The Configurations page opens.
3. Click Baseline Configuration.
The baseline configuration list displays all application monitor indexes that can be enabled with the baseline function.
4. Click an application category to view monitor indexes for this application category.
The Application Type field also refreshes.
To view baseline configurations for all application categories, click Unlimited next to Application Category.
5. Click an application type to view the monitor indexes for this application type.
To view baseline configurations for all application types of an application category, click the application category, and then click Unlimited next to Application Type.
Baseline configuration list contents
¡ Application Type—Type of the application.
¡ Application Unit—Name of the application unit to which the baseline configuration belongs. Each application unit corresponds to an independent area in the application monitor report.
¡ Index—Name of the application monitor index that is enabled with the baseline function.
¡ Enabled—Displays whether the baseline function for the monitor index has been enabled.
¡ Shield Times—Interval for generating baseline alarms of the monitor index.
¡ Alarm Level—Level of the baseline alarm. Options are Critical, Major, and Minor.
¡ Modify—Click the Modify icon ![]() to modify the baseline configuration of the
monitor index.
to modify the baseline configuration of the
monitor index.
6. Click Refresh to refresh the baseline configuration list.
7. Click Back to return to the Configurations page.
Modifying baseline configuration
1. Click the Resource tab.
2. From the navigation tree, select Application Manager > Configurations.
The Configurations page opens.
3. Click Baseline Configuration.
4. Click the Modify icon ![]() for the baseline configuration you want to
modify.
for the baseline configuration you want to
modify.
The Modify Baseline page opens.
5. Modify the following baseline configuration parameters:
¡ Application Type—Cannot be modified.
¡ Application Unit—Cannot be modified.
¡ Index—Cannot be modified.
¡ Enabled—Select whether to enable the baseline function for the index.
¡ Shield Times—Set an interval for generating baseline alarms of the index.
¡ Alarm Level—Select a baseline alarm level.
6. Click OK.
Port configuration
An application can listen to data and provide services through multiple ports. With these ports, APM finds applications running on the host and reads monitor indexes to calculate traffic statistics.
Port configuration allows operators to modify the settings of default application monitor port and traffic collection port for applications.
· Application Monitor Port—The Auto Discovery function scans the applications installed or deployed on a host through this type of ports.
· Traffic Collection Port—Applications use this type of port to provide services. Through these ports, APM can identify traffic of different application types running on the same IP address.
The following table displays the default port settings preloaded in APM. If an application does not have a default application monitor port, APM cannot detect the application through Auto Discovery. If an application does not have a default traffic collection port and the application is not an operating system, APM does not monitor its traffic. Operating system applications do not have default traffic collection ports, including Windows, AIX, SCO UNIX, FreeBSD, OpenBSD, HP-UX, Solaris, Mac OS, and Linux. APM identifies their traffic by IP address.
Table 12 Application default port list
|
Application type |
Application monitor port |
Traffic collection port |
|
Windows Performance Counter |
TCP 135 |
N/A |
|
AIX FreeBSD HP-UX Linux Mac OS OpenBSD Solaris |
TCP 23 (through Telnet) TCP 22 (through SSH) |
N/A |
|
SQL Server |
TCP 1433 |
TCP 1433 |
|
MySQL |
TCP 3306 |
TCP 3306 |
|
Oracle |
TCP 1521 |
TCP 1521 |
|
DB2 |
TCP 50000 |
TCP 50000 |
|
DBQuery |
N/A |
N/A |
|
Sybase |
TCP 5000 |
TCP 5000 |
|
.NET Server |
TCP 135 |
TCP 135 |
|
JBoss Server Tomcat Server |
TCP 1099 |
TCP 1099 |
|
Oracle Application Server |
TCP 8888 |
TCP 8888 |
|
WebLogic Server |
TCP 7001 |
TCP 7001 |
|
Glassfish Server |
TCP 8686 |
TCP 8686 |
|
WebSphere Server |
TCP 8080 |
TCP 8080 |
|
Apache IIS Server PHP |
TCP 80 |
TCP 80 |
|
Exchange 2003 Exchange 2007 |
TCP 135 |
TCP 135 |
|
POP3 |
TCP 110 |
TCP 110 |
|
SMTP |
TCP 25 |
TCP 25 |
|
Office SharePoint |
TCP 135 |
N/A |
|
WebSphere MQ |
TCP 1414 |
TCP 1414 |
|
REST Service SOAP Service |
N/A |
N/A |
|
URL |
TCP 80 |
N/A |
|
Active Directory |
TCP 135 |
TCP 135 |
|
LDAP Service |
TCP 389 |
N/A |
|
File Directory |
N/A |
N/A |
|
SNMP Service |
UDP 161 |
UDP 161 |
|
FTP Service |
TCP 21 |
TCP 21 |
|
SFTP Service |
TCP 22 |
TCP 22 |
|
DNS Service |
TCP 53 |
TCP 53 |
|
Java Runtime |
TCP 1099 |
TCP 1099 |
Viewing the application default port list
1. Click the Resource tab.
2. From the navigation tree, select Application Manager > Configurations.
The Configurations page opens.
3. Click Port Configuration.
The Default Configuration list is displayed.
Default configuration list contents
¡ Application Type—Name of the application type.
¡ Application Monitor Port—Default port value that identifies the type of applications in Auto Discovery.
¡ Traffic Collection Port—Default port value for data traffic collection.
¡ Modify—Click the Modify icon ![]() to modify default port settings for the application type.
to modify default port settings for the application type.
4. Click Refresh to refresh the application default port list.
5. Click Back to return to the Configurations page.
Modifying the application default port list
1. Click the Resource tab.
2. From the navigation tree, select Application Manager > Configurations.
The Configurations page opens.
3. Click Port Configuration.
The Default Configuration list is displayed.
4. Click the Modify icon ![]() for the
application type for which you want to modify the default ports.
for the
application type for which you want to modify the default ports.
5. Modify the following parameters:
¡ Application Type—Cannot be modified.
¡ Application Monitor Port—Modify the default port value that identifies the application type in Auto Discovery.
¡ Traffic Collection Port—Modify the default port value for traffic collection. For information about the application types for which you can modify the default traffic collection ports, see Table 12.
6. Click OK.
The modification has no effect on the applications already monitored.
Probe configuration
To collect traffic of applications, you must configure probes for APM to use. When no probes are configured or all probes are deleted, APM stops collecting application traffic and all application monitor reports no longer contain the application traffic area.
For operating system applications, probes identify their traffic by IP address. For other applications, probes identify their traffic by the combination of IP address and traffic collection port.
Probes must be installed and run on Linux. For more information about installing and configuring probes, see Probe Installation Guide.
Viewing the probe list
1. Click the Resource tab.
2. From the navigation tree, select Application Manager > Configurations.
The Configurations page opens.
3. Click Probe Configuration.
The Probe List is displayed.
Probe list contents
¡ Name—Name of the probe. Click the name to view its details.
¡ IP Address—IP address of the probe.
¡ Description—Description of the probe.
¡ Modify—Click the Modify icon ![]() to modify the probe
settings.
to modify the probe
settings.
¡ Delete—Click the Delete icon ![]() to delete the probe.
to delete the probe.
4. Click Refresh to refresh the probe list.
Viewing the probe details
1. Click the Resource tab.
2. From the navigation tree, select Application Manager > Configurations.
The Configurations page opens.
3. Click Probe Configuration.
The Probe List is displayed.
4. Click the name of the probe whose details you want to view.
Probe details
¡ Name—Name of the probe.
¡ IP Address—IP address of the probe.
¡ Description—Description of the probe.
5. Click Back to return to the probe list.
Adding a probe
1. Click the Resource tab.
2. From the navigation tree, select Application Manager > Configurations.
The Configurations page opens.
3. Click Probe Configuration.
The Probe List is displayed.
4. Click Add.
5. Configure the following parameters:
¡ Name—Enter the name of the probe. The name must be unique in APM.
¡ IP Address—Enter the IP address of the probe.
¡ Description—Enter a description of the probe.
¡ Password—Enter the password of the probe. The value must be the same as that configured on the probe.
6. Click OK.
Modifying a probe
1. Click the Resource tab.
2. From the navigation tree, select Application Manager > Configurations.
The Configurations page opens.
3. Click Probe Configuration.
The Probe List is displayed.
4. Click the Modify icon ![]() for the probe you want
to modify.
for the probe you want
to modify.
5. Configure the following parameters:
¡ Name—Modify the name of the probe. The name must be unique in APM.
¡ IP Address—Cannot be modified.
¡ Description—Modify the description of the probe.
6. Click OK.
Deleting a probe
1. Click the Resource tab.
2. From the navigation tree, select Application Manager > Configurations.
The Configurations page opens.
3. Click Probe Configuration.
The Probe List is displayed.
4. Click the Delete
icon ![]() for the probe you want to delete.
for the probe you want to delete.
A confirmation dialog box opens.
5. Click OK.
Deploying network configuration to probes
When you add an application monitor, APM automatically sends the network configuration (IP address or IP-to-port combination) of the monitored application to probes. If the network configuration failed to be delivered, troubleshoot the communication failure and manually deploy the network configuration to probes.
To deploy the network configuration of monitored applications to probes:
1. Click the Resource tab.
2. From the navigation tree, select Application Manager > Configurations.
The Configurations page opens.
3. Click Probe Configuration.
The Probe List is displayed.
4. Click Deploy.
APM deploys the network configuration of monitored applications to all probes on the list.
Parameter configuration
APM operating parameters include the monitor data retention periods and data background colors.
To modify APM operating parameters:
1. Click the Resource tab.
2. From the navigation tree, select Application Manager > Configurations.
The Configurations page opens.
3. Click Parameter Configuration.
4. Configure the following parameters as needed:
¡ Original Data Retention Time (Day)—Enter how many days APM will keep the original data collected from applications.
¡ Hourly Data Retention Time (Month)—Enter how many months APM will keep the hourly application data that is aggregated from the original data.
¡ Daily Data Retention Time (Year)—Enter how many years APM will keep the daily application data that is aggregated from the original data.
¡ Threshold-1 Color—Enter the RGB value of the background color for the monitor index data that meets the threshold-1 condition. Or you can click the box to select a color from the popup color panel. The default setting is RGB FFD200, representing orange.
¡ Threshold-2 Color—Enter the RGB value of the background color for the monitor index data that meets the threshold-2 condition. Or you can click the box to select a color from the popup color panel. The default setting is RGB FF0000, representing red.
¡ Whether IDC Environment—Select Yes or No from the list. If you select Yes, you switch to the IDC cloud tenant environment, where the system displays functions according to your privileges, and you cannot switch back to non-IDC environment.
5. Click OK next to each parameter you have configured.
6. Click Back to return to the Configurations page.
APM administrator configuration
This feature is available only in IDC environment. Use this feature to configure the APM administrator privileges for an operator in the IMC system. For information about adding an operator to IMC, see H3C Intelligent Management Center v7.3 Enterprise and Standard Platform Administrator Guide.
Viewing the APM administrator list
1. Click the Resource tab.
2. From the navigation tree, select Application Manager > Configurations.
The Configurations page opens.
3. Click APM Administrator Configuration.
The APM Administrator Configuration page opens.
APM Administrator configuration list contents
¡ Operator Name—Name used by the operator to log in to IMC.
¡ Operator Full Name—Full name of the operator.
¡ Type—Operator type. Options are System and Tenant. The System administrator has super administrator privileges.
¡ APM Server—APM server that can be managed by the operator.
¡ Modify—Click
the Modify icon ![]() to modify the operator configuration.
to modify the operator configuration.
¡ Delete—Click the Delete icon ![]() to delete the operator.
to delete the operator.
4. Click Refresh to refresh the APM administrator list.
Adding an APM administrator
1. Click the Resource tab.
2. From the navigation tree, select Application Manager > Configurations.
The Configurations page opens.
3. Click APM Administrator Configuration.
The APM Administrator Configuration page opens.
4. Click Add.
The Add page opens.
5. Configure the following basic information:
¡ Operator—Select an operator from the list.
¡ Type—Select the operator type. Options are System and Tenant.
¡ APM Server—Select the APM server that can be managed by the operator. The server 127.0.0.1 represents a centralized APM server or the primary server of a distributed APM server system. A System administrator can manage all servers by default.
6. Click OK.
Modifying an APM administrator
1. Click the Resource tab.
2. From the navigation tree, select Application Manager > Configurations.
The Configurations page opens.
3. Click APM Administrator Configuration.
The APM Administrator Configuration page opens.
4. Click the Modify icon ![]() for the APM administrator you want to modify.
for the APM administrator you want to modify.
5. The Modify page opens.
6. Configure the following basic information:
¡ Operator—Select an operator from the list.
¡ Type—Select the operator type. Options are System and Tenant.
¡ APM Server—Select the APM server that can be managed by the operator. The server 127.0.0.1 represents a centralized APM server or the primary server of a distributed APM server system. A System administrator can manage all servers by default.
7. Click OK.
Deleting a template
1. Click the Resource tab.
2. From the navigation tree, select Application Manager > Configurations.
The Configurations page opens.
3. Click APM Administrator Configuration.
The APM Administrator Configuration page opens.
4. Click the Delete icon ![]() for the APM administrator you want to delete.
for the APM administrator you want to delete.
A confirmation dialog box opens.
5. Click OK.
Template configuration
APM provides application and agent templates. When you add application monitors or install agents remotely, use correct templates for them to simplify the configuration.
Viewing the template configuration list
1. Click the Resource tab.
2. From the navigation tree, select Application Manager > Configurations.
The Configurations page opens.
3. Click Template Configuration.
The Template Configuration page opens.
Template configuration list contents
¡ Template Name—Name of the template.
¡ Type—Type of the template. Options are Application Template (Application type), Agent Template(Windows), and Template(Linux).
¡ Description—Description of the template.
¡ Modify—Click
the Modify icon ![]() to modify the template configuration.
to modify the template configuration.
¡ Delete—Click the Delete icon ![]() to delete the template.
to delete the template.
4. Click Refresh to refresh the template configuration list.
Adding an agent template
1. Click the Resource tab.
2. From the navigation tree, select Application Manager > Configurations.
The Configurations page opens.
3. Click Template Configuration.
The Template Configuration page opens.
4. Click Add Template.
The Select Template Type window opens.
5. Select Agent Template.
6. Click OK.
The Add Agent Template page opens.
7. Configure the following basic host information:
¡ Template Name—Enter a name for the template.
¡ Host Type—Select the host type that is compatible with the template. Options are Windows and Linux.
¡ Installation Path—Enter the absolute path used in the agent installation on the target host.
¡ Username—Enter the name of the user that has the administrator's privileges on the target host.
¡ Password—Enter the password for the user that has the administrator's privileges on the target host.
¡ Description—Enter a description for the template.
8. Click OK.
Adding an application template
1. Click the Resource tab.
2. From the navigation tree, select Application Manager > Configurations.
The Configurations page opens.
3. Click Template Configuration.
The Template Configuration page opens.
4. Click Add Template.
The Select Template Type window opens.
5. Select Application Template.
6. Select an application type from the Application Type list.
7. Click OK.
The page for adding an application template for the selected application type opens.
8. Configure the application monitoring parameters.
Different application types require different monitoring parameters. For more information, see the sections about adding application monitors for different application types.
9. Click OK.
Modifying an agent template
1. Click the Resource tab.
2. From the navigation tree, select Application Manager > Configurations.
The Configurations page opens.
3. Click Template Configuration.
The Template Configuration page opens.
4. Click the Modify icon ![]() for the agent
template you want to modify.
for the agent
template you want to modify.
The Modify Agent Template page opens.
5. Modify the following basic host information:
¡ Template Name—Cannot be modified.
¡ Host Type—Enter the host type that is compatible with the template. Options are Windows and Linux.
¡ Installation Path—Enter the absolute path used in the agent installation on the target host.
¡ Username—Enter the name of the user that has the administrator's privileges on the target host.
¡ Password—Enter the password for the user that has the administrator's privileges on the target host.
¡ Description—Enter a description of the template.
6. Click OK.
Modifying an application template
1. Click the Resource tab.
2. From the navigation tree, select Application Manager > Configurations.
The Configurations page opens.
3. Click Template Configuration.
The Template Configuration page opens.
4. Click the Modify icon ![]() for the application
template you want to modify.
for the application
template you want to modify.
The Modify Application Template page opens.
5. Modify application monitoring parameters.
Different application types require different monitoring parameters. For more information, see the sections about adding application monitors for different application types.
6. Click OK.
Deleting a template
Deleting templates does not affect existing applications and agents.
To delete a template:
1. Click the Resource tab.
2. From the navigation tree, select Application Manager > Configurations.
The Configurations page opens.
3. Click Template Configuration.
The Template Configuration page opens.
4. Click the Delete icon ![]() for the template you want to delete.
for the template you want to delete.
A confirmation dialog box opens.
5. Click OK.
Application data display
APM displays application data by using widgets and a dashboard. You can custom the IMC home page or configure the dashboard to display data. For more information about the IMC home page and the dashboard, see H3C Intelligent Management Center v7.3 Enterprise and Standard Platform Administrator Guide.
Widgets
You can custom widgets on the IMC home page. APM supports the Application Topology widget, Application Monitor widget, and Host Monitor widget.
Application Topology widget
Figure 40 shows the Application Topology widget. In the widget, you can view the availability and health states of applications, how applications and hosts are related to each other, and how the hosts are connected to the access devices and the physical network. The widget supports the same functions and operations as the application topology does. For more information, see "Topology and application group management."
Figure 40 Application Topology widget
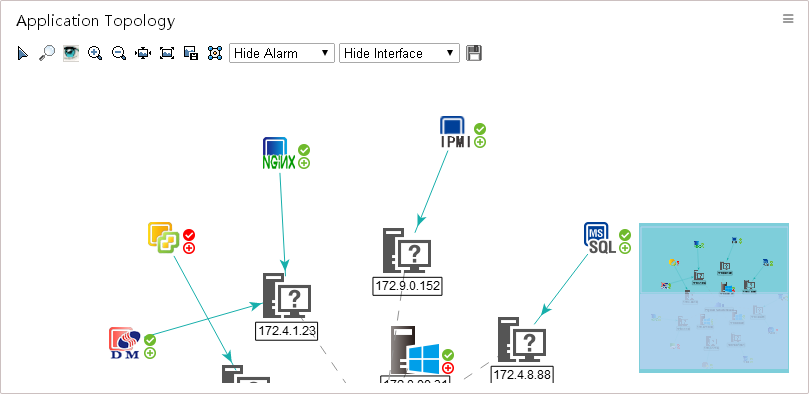
By default, APM refreshes the Application Topology widget every 10 minutes.
To set the refresh interval for the Application Topology widget:
1. Log in to IMC and add the Application Topology widget to the home page.
2. Click the Set icon ![]() in the right
top corner of the Application Topology widget.
in the right
top corner of the Application Topology widget.
3. Click Refresh Interval to open the Setting page.
4. Select an interval from
the list. Options are No Refresh, 1, 5, 10 and 30, in minutes.
If you select No Refresh, click the Refresh icon ![]() in the right top corner of the
widget to view the latest topology.
in the right top corner of the
widget to view the latest topology.
5. Click OK.
Application Monitor widget
Figure 41 shows an Application Monitor widget. The contents displayed in the widget are the same as those in the application monitor list. Operators can control the displayed contents by customizing the application monitor list. For more information about customizing the application monitor list, see "Monitor management."
Figure 41 Application Monitor widget
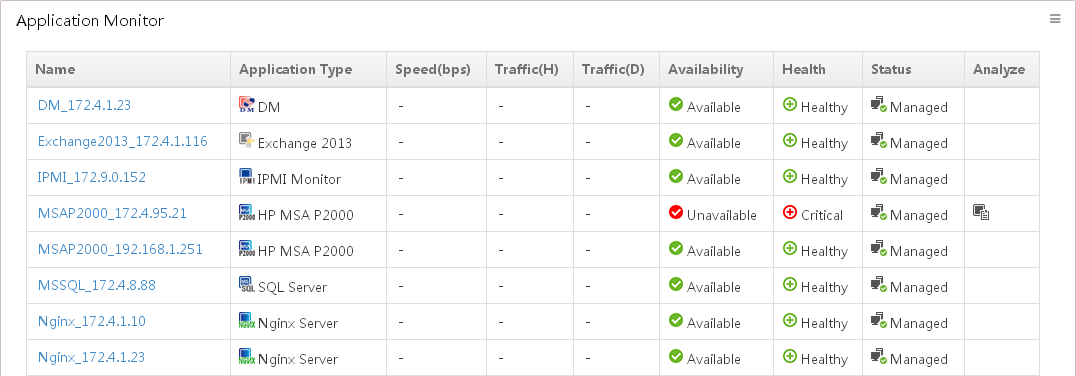
Some contents of an application monitor widget might not be displayed due to the home page layout of IMC and browser window size. You can click the Move Left or Move Right icon on the title bar of the widget to view the contents that are not displayed.
By default, APM refreshes the Application Monitor widget every 10 minutes. You can modify the refresh interval and specify which applications to display.
Setting the filter conditions
The IMC home page can contain multiple Application Monitor widgets, each of which focuses on a group of applications filtered by application type, availability, or health state.
To set the filter conditions:
1. Log in to IMC and add an Application Monitor widget to the home page.
2. Click the Set icon ![]() in the right
top corner of the Application Monitor widget.
in the right
top corner of the Application Monitor widget.
3. Click Settings to open the Setting page.
4. Specify the following parameters to filter applications to display in the widget:
¡ Name—Enter the name of the application monitor.
¡ Application Type—Select an application type from the list. For information about the options, see "Application Manager overview."
¡ Availability—Select availability from the list. Options are Unlimited, Available, Inaccessible, Unavailable, and Unmanaged.
¡ Health State—Select a health state from the list. Options are Unlimited, Healthy, Minor, Major, Critical, and --. The two consecutive hyphens (--) indicates that the application is inaccessible or unmanaged.
5. Click Query. The widget displays the target applications.
6. Click Reset. The widget displays all applications.
Setting the refresh interval
To set the refresh interval for an application monitor widget:
1. Log in to IMC and add an Application Monitor widget to the home page.
2. Click the Set icon ![]() in the right
top corner of the Application Monitor widget.
in the right
top corner of the Application Monitor widget.
3. Click Refresh Interval to open the Setting page.
4. Select an interval from
the list. Options are No Refresh, 1, 5, 10, and 30, in minutes.
If you select No Refresh, click the Refresh icon ![]() in the right top corner of the
widget to view the latest data.
in the right top corner of the
widget to view the latest data.
5. Click OK.
Host Monitor widget
Figure 42 illustrates the Host Monitor widget. In the widget, you can monitor the OS, CPU usage, content usage, availability, and health state of each host directly. You can open the operating system monitor report by clicking its name.
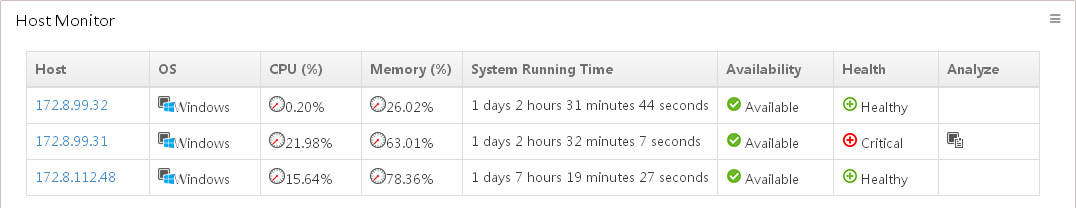
Setting the refresh interval
By default, APM refreshes the Host Monitor widget every 10 minutes.
To set the refresh interval for the widget:
1. Log in to IMC and add the Host Monitor widget to the home page.
2. Click the Set icon ![]() in the right
top corner of the Host Monitor widget.
in the right
top corner of the Host Monitor widget.
3. Click Refresh Interval to open the Setting page.
4. Select an interval from the list. Options
are No Refresh, 1, 5, 10, and 30, in minutes.
If you select No Refresh, the widget does not automatically refresh. To view the latest
data, you must click the Refresh icon ![]() in the right top
corner of the widget.
in the right top
corner of the widget.
5. Click OK.
Dashboard
APM can display application data in the dashboard. The following information describes the widgets supported by the dashboard.
Application List widget
The Application List widget displays application monitor parameters, as shown in Figure 43. For more information about the application monitor list, see "Monitor management."
Figure 43 Application List widget
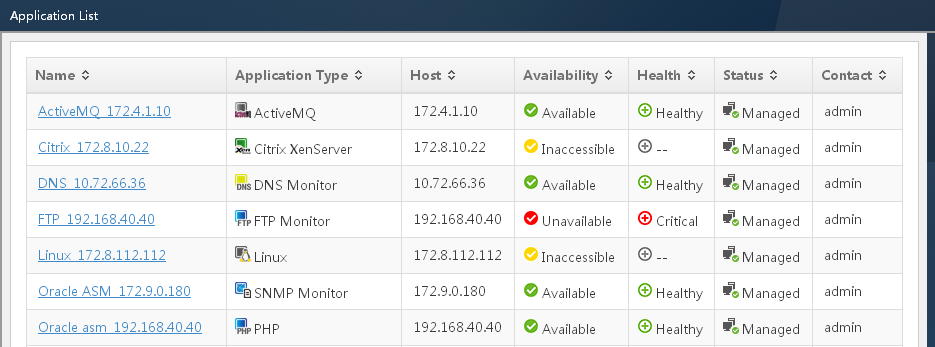
To configure the Application List widget:
1. Point to the My Favorites icon ![]() .
.
2. From the menu that opens, select Dashboard > Configuration.
The dashboard configuration window opens.
3. In the widget area, select the Application List
widget icon ![]() and drag it to the panel below.
and drag it to the panel below.
To change the widget size, drag the widget frames.
4. Click the Save icon ![]() .
.
An informational dialog box opens.
5. Click OK.
Server-Memory widget
The Server-Memory widget displays the memory usage trend of servers in the most recent 1 hour, as shown in Figure 44.
Figure 44 Server-Memory widget
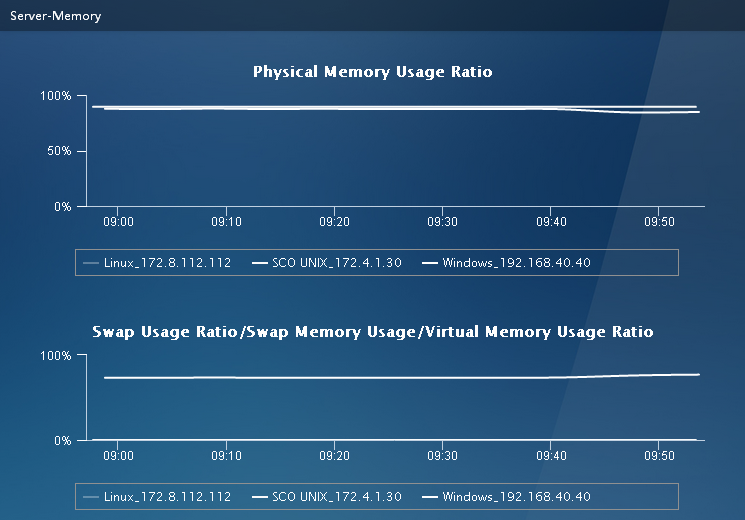
To configure the Server-Memory widget:
1. Point to the My Favorites icon ![]() .
.
2. From the menu that opens, select Dashboard > Configuration.
The dashboard configuration window opens.
3. In the widget area, select the Server-Memory
widget icon ![]() and drag it to the panel below.
and drag it to the panel below.
To change the widget size, drag the widget frames.
4. Right-click the Server Memory Usage area and select Configure Parameters.
5. Select servers, and then click OK.
6. Click the Save icon ![]() .
.
An informational dialog box opens.
7. Click OK.
Application Group widget
The Application Group widget has the same functions and operations as the group topology. For information about the functions and operations of the widget, see "Topology and application group management."
Figure 45 Application Group widget
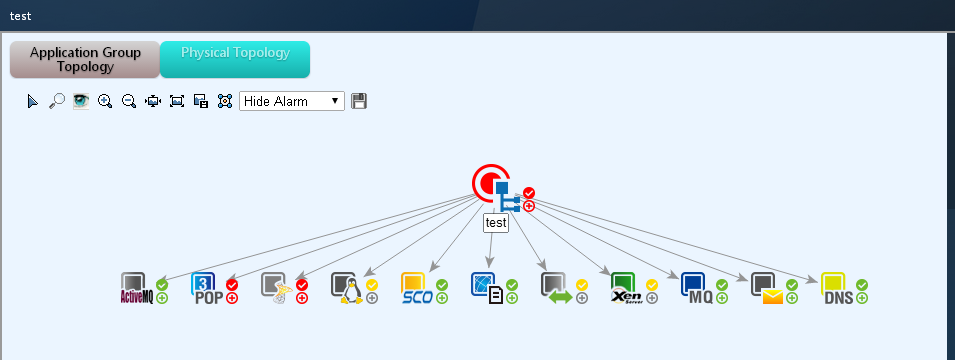
To configure the Application Group widget:
1. Point to the My Favorites icon![]() .
.
2. From the menu that opens, select Dashboard > Configuration.
The dashboard configuration window opens.
3. In the widget area, select the Application
Group widget icon ![]() and drag it to the panel below.
and drag it to the panel below.
To change the widget size, drag the widget frames.
4. Right-click the Application Group area and select Configure Parameters.
5. Select an application, and then click OK.
6. Click the Save icon ![]() .
.
An informational dialog box opens.
7. Click OK.
Server-CPU widget
The Server-CPU widget displays the CPU usage trend of servers in the most recent 1 hour, as shown in Figure 46.
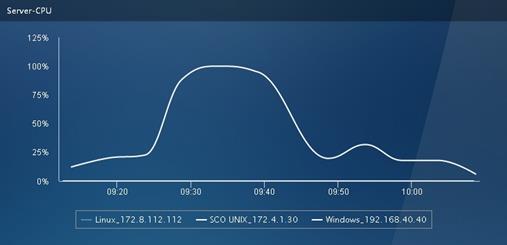
To configure the Server-CPU widget:
1. Point to the My Favorites icon![]() .
.
2. From the menu that opens, select Dashboard > Configuration.
The dashboard configuration window opens.
3. In the widget area, select the Server-CPU
widget icon ![]() and drag it to the panel below.
and drag it to the panel below.
To change the widget size, drag the widget frames.
4. Right-click the Server CPU Usage area and select Configure Parameters.
5. Select servers, and then click OK.
6. Click the Save icon ![]() .
.
An informational dialog box opens.
7. Click OK.
Server-Flux widget
The Server-Flux widget displays the receive traffic (Rx) and send traffic (Tx) of servers in the most recent 1 hour, as shown in Figure 47.
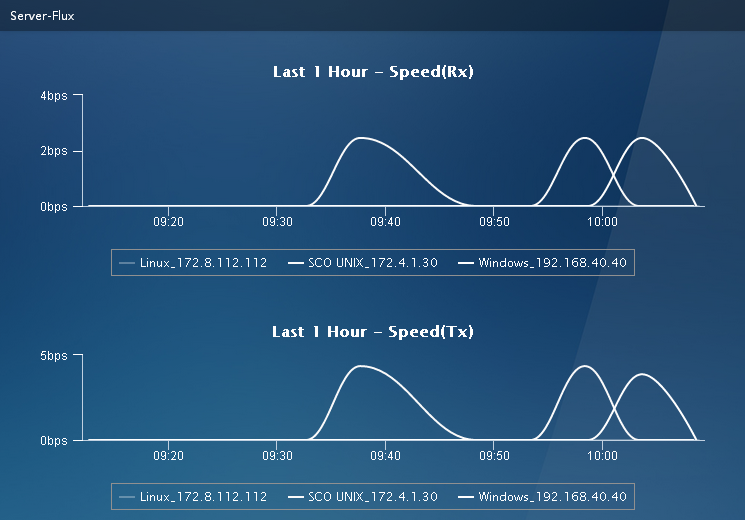
To configure the Server-Flux widget:
1. Point to the My Favorites icon![]() .
.
2. From the menu that opens, select Dashboard > Configuration.
The dashboard configuration window opens.
3. In the widget area, select the Server-Flux
widget icon ![]() and drag it to the panel below.
and drag it to the panel below.
To change the widget size, drag the widget frames.
4. Right-click the Server Traffic area and select Configure Parameters.
5. Select servers, and then click OK.
6. Click the Save icon ![]() .
.
An informational dialog box opens.
7. Click OK.
Server-Disk widget
The Server-Disk widget displays the disk usage of servers, as shown in Figure 48.
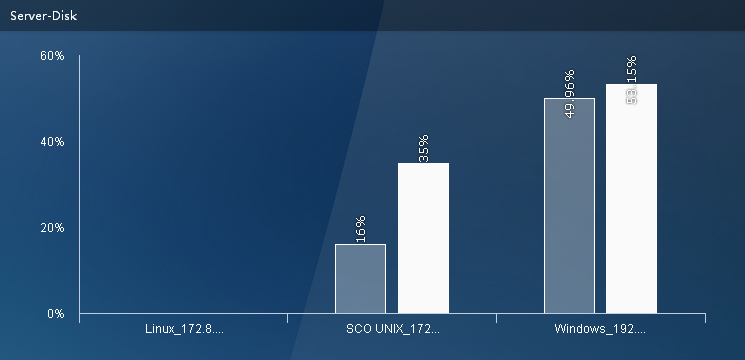
To configure the Server-Disk widget:
1. Point to the My Favorites icon![]() .
.
2. From the menu that opens, select Dashboard > Configuration.
The dashboard configuration window opens.
3. In the widget area, select the Server-Disk
widget icon ![]() and drag it to the panel below.
and drag it to the panel below.
To change the widget size, drag the widget frames.
4. Right-click the Server Disk Usage area and select Configure Parameters.
5. Select servers, and then click OK.
6. Click the Save icon ![]() .
.
An informational dialog box opens.
7. Click OK.
URL Sequence widget
The URL Sequence widget displays the status of a URL sequence, whose content is the same as the URL sequence monitor report. For more information, see "HTTP service monitor."
Figure 49 URL Sequence widget
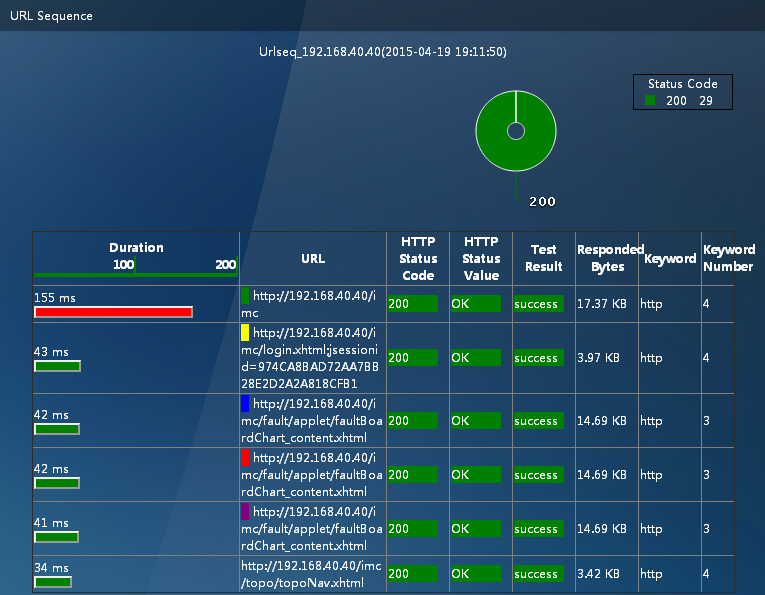
To configure the URL Sequence widget:
1. Point to the My Favorites icon![]() .
.
2. From the menu that opens, select Dashboard > Configuration.
The dashboard configuration window opens.
3. In the widget area, select the URL Sequence
widget icon ![]() and drag it to the panel below.
and drag it to the panel below.
To change the widget size, drag the widget frames.
4. Right-click the URL Sequence area and select Configure Parameters.
5. Select a URL sequence application, and then click OK.
6. Click the Save icon ![]() .
.
An informational dialog box opens.
7. Click OK.
Application Topology widget
The application topology widget has the same functions and operations as the application topology. For more information, see "Topology and application group management."
Figure 50 Application Topology widget
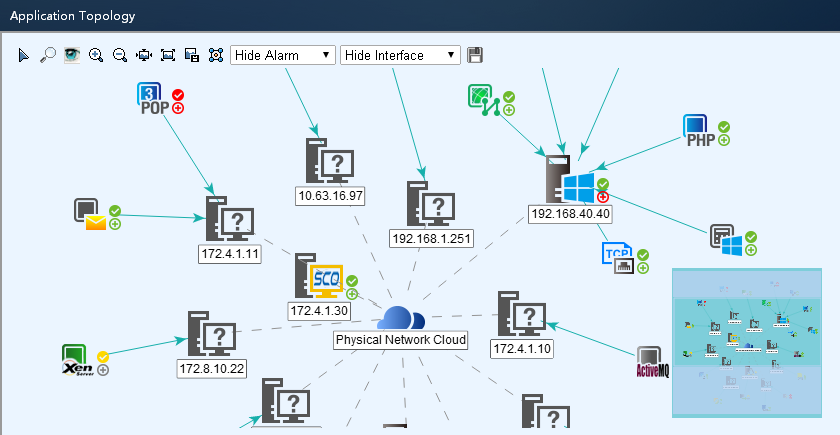
To configure the Application Topology widget:
1. Point to the My Favorites icon![]() .
.
2. From the menu that opens, select Dashboard > Configuration.
The dashboard configuration window opens.
3. In the widget area, select the Application
Topology widget icon ![]() and drag it to the panel below.
and drag it to the panel below.
To change the widget size, drag the widget frames.
4. Click the Save icon ![]() .
.
An informational dialog box opens.
5. Click OK.
Windows OS monitor
APM monitors the following Windows OS applications:
· Windows
· Windows performance counters
This chapter describes how to add and modify Windows OS application monitors, and helps you view relevant monitor reports.
Windows
Windows operating systems provide a base platform for a variety of desktop-oriented applications. To ensure service quality, its performance and stability must be guaranteed.
Adding a Windows application monitor
APM can locally or remotely monitor Windows operating systems through WMI or SNMP. When you add Windows application monitors, follow these guidelines:
· To monitor a Windows operating system through an agent, deploy the agent on the host on which the Windows operating system is installed. For more information about agents, see "APM agent management."
· To monitor a Windows operating system through WMI:
¡ Enable and configure WMI for the host on which the Windows operating system is installed. For more information about enabling WMI on Windows, see the Microsoft Windows online help.
¡ Obtain the username and password of the user who has the Windows administrator's privileges.
· To monitor a Windows operating system through SNMP:
¡ Enable and configure SNMP for the host on which the Windows operating system is installed. For more information about enabling SNMP on Windows, see the Microsoft Windows online help.
¡ Obtain the read-only and read-write community strings.
· Add the Windows hosts to the IMC platform so that APM can obtain and display network connections of the hosts and their access devices in the application topology. For more information about adding hosts to the IMC platform, see H3C Intelligent Management Center v7.3 Enterprise and Standard Platform Administrator Guide.
· To view traffic statistics in the monitor report of the Window operating system application, make sure at least one probe is configured in APM. After a Windows application monitor is added, APM sends the IP address of the monitored Windows operating system application to the probes for traffic collection.
The following task is performed in remote monitor mode. When the local monitor mode is used, you need to configure only part of the parameters that are required for the remote monitor mode.
To add a Windows application monitor:
1. Click the Resource tab.
2. Open the Add Application page by using one of the following methods:
¡ From the navigation tree, select Application Management > Add Application.
The page displays all application types that can be monitored by APM.
¡ From the navigation tree, select Application Manager > Application Monitor, and then click Add on the application monitor list page.
3. Click Windows of the Windows Server Monitor class.
The page for adding a Windows application monitor opens.
4. Configure the following parameters for the application monitor:
¡ IP Address—Enter the IP address of the host where the Window operating system to be monitored is installed. APM automatically checks the specified IP address and associates the application monitor with the host managed in the IMC platform. If the host is already added to the IMC platform, you can also click Select, and then select the host from the Select Devices window. For information about selecting a host, see "Quick start."
¡ Name—Enter a unique application monitor name. As a best practice, name the application monitor as application type_host IP address.
¡ Use Template—Select Enable or Disable from the list.
¡ Template—Click
the Configure icon ![]() next to the Template field to select an existing template. The Template field
is automatically populated with the name of the selected template. For more
information about configuring application templates, see "Configuration management." This field is displayed only when you select Enable from the Use
Template list.
next to the Template field to select an existing template. The Template field
is automatically populated with the name of the selected template. For more
information about configuring application templates, see "Configuration management." This field is displayed only when you select Enable from the Use
Template list.
¡ Description—Enter a description for the application monitor.
¡ Polling Interval (min)—Select a polling interval for the application monitor. Options are 1, 2, 3, 4, 5, 10, 20, and 30. The default polling interval is 5 minutes. A shorter polling interval improves real-time data accuracy at the expense of system resources. This field is available only when you select Disable from the Use Template list.
¡ Monitor Type—Select the protocol (SNMP
or WMI) through which APM monitors the application, and
then click the Configure icon ![]() to configure related
parameters. This field is available only when you
select Disable from the Use Template list.
to configure related
parameters. This field is available only when you
select Disable from the Use Template list.
When SNMP is selected, configure the following parameters:
- Edit SNMP Parameters—Select this option if you want to manually configure SNMP parameters for APM. Make sure the SNMP settings are the same as those on the Windows host.
- Select an Existing Template—Select this option if you want to select an existing SNMP template for APM. For information about setting SNMP parameter templates, see H3C Intelligent Management Center v7.3 Enterprise and Standard Platform Administrator Guide.
- Parameter Type—Select the SNMP parameter type. Options are SNMPv1, SNMPv2c, and SNMPv3 Template. The SNMPv3 Template option is available only when Select an Existing Template is selected.
- Read-Only Community String—Enter the SNMP read-only community string, with which APM can read MIB variables from the Windows host.
- Read-Write Community String—Enter the read-write SNMP community string, with which APM can read MIB variables from or write MIB variables to the Windows host.
- Timeout (1-60 seconds)—Enter the maximum time period that APM waits for an SNMP response from the Windows host. The value range is 1 to 60 seconds and the default is 4 seconds. If no SNMP response is received from the Windows host within the timeout time, APM considers the interaction a failure.
- Retries (1-20)—Enter how many times APM retries to send SNMP packets to the Windows host.
When WMI is selected, configure the following parameters:
- Username—Enter the username of the Windows administrator.
If the administrator is a domain user, use domain name\username.
If the administrator is a local user, use host name\username, IP address\username, or username.
- Password—Enter the password of the administrator.
- Enable Event Logging—Select Enable or Disable from the list. If you select Enable, configure the event logging threshold and type. The event logging type can be Error, Warning, Information, Security Audit Success, or Security Audit Failure.
¡ Contact—Enter contact information, such as the name, email address, and telephone number. The default is the username of the operator who created the application monitor. This field is available only when you select Disable from the Use Template list.
¡ Use IPMI—Select Enable or Disable from the list. If you select Enable, configure the following parameters:
- Host IP—Enter the IP address of the BMC for IPMI monitoring.
- Username/Password—Enter the username and password of the BMC for IPMI monitoring.
¡ APM Server—Select an APM server to monitor the application. The options are in server-address (application-type:n/N) format. The letter n indicates the number of Windows applications monitored on the APM server. The letter N indicates the total number of applications monitored on the APM server. Server address 127.0.0.1 indicates that APM and the IMC platform are deployed on the same server.
¡ Related Applications—Click Add next to this field. On the Select Application window, enter a partial or complete name to filter applications, select the applications that Windows depends on, and then click OK.
Operating system applications cannot be selected. Operators can view all dependencies of the application in the dependency topology.
¡ Application Group—Specify an application group for the Windows application.
- To specify an existing application group, click Add, select an application group, and then click OK.
- To specify a new application group, click Add Application Group, configure the application group settings, and then click OK.
¡ Detect Application—Select this parameter if you want to enable application detection. Application detection enables APM to verify connection to the application by using the previous parameter settings, and to determine whether to add the application monitor based on the verification result. APM adds the application monitor only when it can connect to the application. When this parameter is not specified, APM adds the application monitor without verifying the connection.
5. Click OK.
Modifying a Windows application monitor
Authorized users can modify all parameters except the IP address and the APM server for a Windows application monitor. When the IP address of a Windows host changes, operators must add a new application monitor for the host. The new application monitor cannot inherit the history data from the previous application monitor.
To modify a Windows application monitor:
1. Click the Resource tab.
2. From the navigation tree, select Application Manager > Application Monitor.
The application monitor list page displays all application monitors.
3. Click the Modify
icon ![]() for the Windows application monitor you want to modify.
for the Windows application monitor you want to modify.
The page for modifying the Windows application monitor opens.
4. Modify the parameters as needed, except the IP address and the APM server.
For more information about parameter settings, see "Adding a Windows application monitor."
5. Click OK.
Viewing the Windows application monitor report
After adding a Windows operating system application monitor, APM collects application index data to calculate its availability and health status. You can obtain monitor indexes for the Windows operating system by viewing the monitor report.
To view the Windows application monitor report:
1. Click the Resource tab.
2. From the navigation tree, select Application Manager > Application Monitor.
The application monitor list page displays all application monitors.
3. Click the name of a Windows application monitor to display the report.
Figure 51 shows part of a Windows application monitor report.
Figure 51 Part of a Windows application monitor report
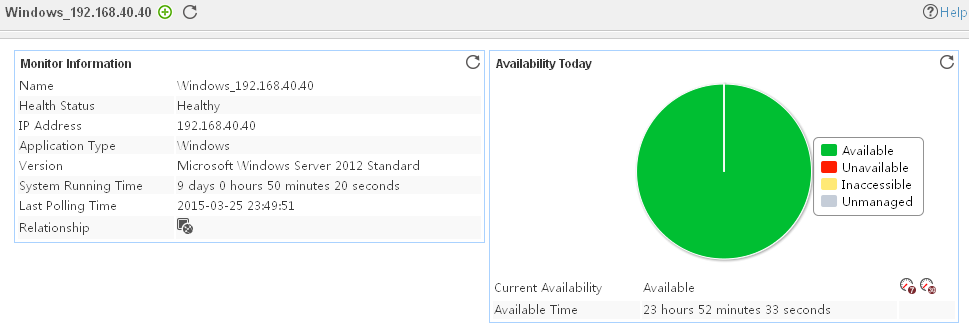
Monitor Information
The Monitor Information area contains the following fields:
· Name—Application monitor name.
· Health Status—Health status of the Windows operating system.
· IP Address—Windows host IP address.
· Application Type—Type of the monitored application, which is always Windows.
· Version—Version of the Windows operating system.
· System Running Time—Duration since the startup of the Windows application to the time when APM last polled the Windows application.
· Last Polling Time—Time when APM last polled the Windows operating system.
· Relationship—Click the Relationship icon ![]() to view dependencies between the Windows application
and other applications in a dependency topology view. For more information about dependency topologies, see "Topology and application group management."
to view dependencies between the Windows application
and other applications in a dependency topology view. For more information about dependency topologies, see "Topology and application group management."
· Top5 Unrecovered Alarms—Latest five unrecovered alarms on the Windows operating system. This field is not displayed if no alarm is generated by the Windows operating system.
Availability Today
The Availability Today area contains the following fields:
· Current Availability—Availability of the Windows operating system in the last polling interval.
¡ Click
the Weekly History icon ![]() to view the availability of the Windows operating system in the
last 7 days.
to view the availability of the Windows operating system in the
last 7 days.
¡ Click
the Monthly History icon ![]() to view the availability of the Windows operating system in the
last 30 days.
to view the availability of the Windows operating system in the
last 30 days.
· Available Time—Total amount of time that the Windows operating system was available after 00:00 today.
· Unavailable Time—Total amount of time that the Windows operating system was unavailable after 00:00 today.
· Inaccessible Time—Total amount of time that the Windows operating system was unavailable after 00:00 today.
· Unmanaged Time—Total amount of time that the Windows operating system was unmanaged after 00:00 today.
The statistics collection started when the application monitor was added. An availability time field is not displayed if its value is 0.
CPU Usage Ratio
The CPU Usage Ratio area contains the following field:
· CPU Usage Ratio—CPU usage of the Windows operating system in the last polling interval.
¡ Click
the Set Threshold icon ![]() to set the CPU
usage alarm thresholds for the Windows operating system.
to set the CPU
usage alarm thresholds for the Windows operating system.
¡ Click
the History Record icon ![]() to view statistics of the history graph of
the CPU usage for the Windows operating system.
to view statistics of the history graph of
the CPU usage for the Windows operating system.
Memory Usage Ratio
The Memory Usage Ratio area displays information about physical memory and swap memory.
The Memory Usage Ratio area contains the following fields:
· Physical Memory—Physical memory of the Windows application, which corresponds to the physical memory bar.
· Swap—Swap memory of the Windows application, which corresponds to a disk space.
· Total—Total amount of the physical or swap memory.
· In Use—Size of the physical or swap memory that is being used. Click the History Record icon ![]() to view the history
graph of the physical or swap memory that is being used.
to view the history
graph of the physical or swap memory that is being used.
· Usage Ratio—Physical or swap memory usage ratio. The usage ratio is calculated by using the formula: Usage ratio = Memory in use/Total memory x 100%.
¡ Click
the Set Threshold icon ![]() to set alarm thresholds for the physical or
swap memory.
to set alarm thresholds for the physical or
swap memory.
¡ Click the History Record
icon ![]() to view the history graph of the physical or swap memory usage.
to view the history graph of the physical or swap memory usage.
CPU Performance
The CPU Performance area contains the following fields:
· CPU Name—Name of the Windows server CPU.
· Privileged Time—Percentage of the privileged time to the total running time of the system.
· Processor Time—CPU usage ratio of the system.
· User Time—Percentage of the CPU user time to the total running time of the system.
· Interrupt Time—Percentage of the CPU interrupts time to the total running time of the system.
· Interrupts Rate—Number of CPU interrupts per second.
You can click the History
Record icon ![]() to
view the history graph of a monitor index.
to
view the history graph of a monitor index.
Paging
The Paging area contains the following fields:
· Cache—Total cache capacity for paging.
· Page Faults Rate—Number of page faults per second.
· Page Reads Rate—Number of page reads per second.
· Page Writes Rate—Number of page writes per second.
· Pages Input Rate—Number of page inputs per second.
· Pages Output Rate—Number of page outputs per second.
You can click the History
Record icon ![]() to
view the history graph of a monitor index.
to
view the history graph of a monitor index.
Ping Test
APM pings the Windows host every polling interval. In a ping test, APM sends up to three ICMP packets to the host. When APM receives a response, it considers the ping test a success and records the response time. When APM receives no response after three tries, it considers the ping test a failure.
The Ping Test area contains the following fields:
· Response Time—Ping response time in the last ping test. Click the History Record icon ![]() to view the history
graph of the response time.
to view the history
graph of the response time.
· Packets Sent—Number of ICMP packets sent in the last ping test. The maximum value is 3. Click
the History Record icon ![]() to view the history graph of the sent packets.
to view the history graph of the sent packets.
· Packets Received—Number of ICMP responses received by APM in the last ping test. The
value is 0
or 1. Click the History Record icon ![]() to view the history
graph of the received packets.
to view the history
graph of the received packets.
Service
By default, APM does not monitor any service, and the service list is empty. APM collects state information of services after they are selected.
The Service area contains the following fields:
· Config—Click the Config icon ![]() to populate the Application Instance List with all detected services running on the Windows operating system. Select the desired services, and then click OK.
APM collects state information about the selected services in the next polling interval.
to populate the Application Instance List with all detected services running on the Windows operating system. Select the desired services, and then click OK.
APM collects state information about the selected services in the next polling interval.
· Service Name—Original name of the service.
· Display Name—Service name or alias displayed on the Windows service console. For example, on the Windows service console, the DHCP client service uses the alias DHCP Client Service rather than the original name Dhcp. Typically, the display name identifies a service more clearly.
· State—State of the service in the last polling interval. Click the Start
Service icon ![]() or Stop Service icon
or Stop Service icon ![]() to start
or stop a service. This function is available only for Windows operating
systems monitored through WMI on IMC installed on a Windows server
to start
or stop a service. This function is available only for Windows operating
systems monitored through WMI on IMC installed on a Windows server
Disk Usage Ratio
Use the Disk Usage Ratio area layout to view how data is allocated on each root disk (physical disk, partition, or logical volume).
The Disk Usage Ratio area contains the following fields:
· Disk—Drive letter of the disk, which can be a physical drive, a partition, or a logical volume.
· Usage Ratio—Disk space usage.
¡ Click
the Set Threshold icon ![]() for a disk to set space usage alarm
thresholds for it.
for a disk to set space usage alarm
thresholds for it.
¡ Click
the History Record icon ![]() for a disk to view statistics of the history graph of the
space usage of the disk.
for a disk to view statistics of the history graph of the
space usage of the disk.
· In Use—Used space of the
disk. Click the History Record icon ![]() to view the history
graph of the used disk space.
to view the history
graph of the used disk space.
· Free Space—Free space of the disk. Click the History Record icon ![]() to view the history
graph of the free disk space.
to view the history
graph of the free disk space.
Share Disk
The Share Disk area contains the following fields:
· Share Disk Name—Name of a share disk on the Windows server.
· Share Disk Usage Ratio—Usage ratio of the share disk.
· Share Disk In Use—Used space of the share disk.
· Share Disk Size—Total space of the share disk.
· Share Disk Incremental—Incremental between two successive collections.
· Share Disk Path—Share path of the share disk.
You can click the History
Record icon ![]() to
view the history graph of a monitor index.
to
view the history graph of a monitor index.
I/O State
The I/O State area contains the following fields:
· Disk Name—Name of a disk on the Windows server.
· I/O Read&Write Rate—Rate at which bytes are transferred to or from the disk during write or read operations.
· I/O Read Rate—Rate at which bytes are transferred from the disk during read operations.
· I/O Write Rate—Rate at which bytes are transferred to the disk during write operations.
· Disk Queue Length—Number of requests outstanding on the disk at the time the performance data is collected.
· Disk Read Time—Percentage of disk read time.
· Disk Write Time—Percentage of disk write time.
· Disk Reads Rate—Number of disk reads per second.
· Disk Writes Rate—Number of disk writes per second.
You can click the History
Record icon ![]() to
view the history graph of a monitor index.
to
view the history graph of a monitor index.
Application Traffic
APM collects traffic statistics for the Windows operating system based on the IP address of the Windows host when probes are added to APM.
The Application Traffic area contains the following fields:
· Last Hour's Traffic—Total traffic sent and received by the Windows operating system over the last 1 hour.
· Today's Traffic—Total traffic sent and received by the Windows operating system since 00:00 today.
Network Interface
The Network Interface area contains the following fields:
· Interface Name—Name of the network interface card (NIC). APM monitors both physical and virtual (logical) network interface cards.
· Bandwidth—Maximum bandwidth of the NIC.
· Receive Rate—Receive rate of the NIC in the last polling interval.
¡ Click
the Set Threshold icon ![]() for the NIC to set
alarm thresholds for the
receive rate.
for the NIC to set
alarm thresholds for the
receive rate.
¡ Click
the History Record icon ![]() to view the history
graph of the receive rate.
to view the history
graph of the receive rate.
· Send Rate—Send rate of the NIC in the last polling interval.
· Input Error Packet Rate—Number of inbound erroneous packets per second on the NIC in the last polling interval.
· Output Error Packet Rate—Number of outbound erroneous packets per second on the NIC in the last polling interval.
TCP Connections
The TCP Connections area contains the following fields:
· Active Connections Rate—Number of active connections per second.
· Passive Connections Rate—Number of passive connections per second.
· Failed Connections Rate—Number of failed connections per second.
· Reset Connections Rate—Number of reset connections per second.
· Established Connections—Number of established connections.
· Received Segments Rate—Number of received segments per second.
· Sent Segments Rate—Number of sent segments per second.
· Retransmitted Segments Rate—Number of retransmitted segments per second.
Click the History
Record icon ![]() to
view the history graph of a monitor index.
to
view the history graph of a monitor index.
Adapter
The Adapter area contains the following fields:
· Adapter ID—Device ID of the adapter.
· Adapter Type—Type of the adapter.
· Max Speed—Maximum transmission speed of the adapter.
· Net Connection Status—Network connection status of the adapter. Values include:
¡ Disconnect
¡ Connecting
¡ Connected
¡ Disconnecting
¡ Hardware Not Present
¡ Hardware Disabled
¡ Hardware Malfunction
¡ Media Disconnected
¡ Authenticating
¡ Authentication Succeeded
¡ Authentication Failed
¡ Invalid address
¡ Credentials Required
· Last Reset Time—Last reset time of the adapter.
· MAC Address—MAC address of the adapter.
· Adapter Description—Description of the adapter.
Process
By default, APM does not monitor any process, and the process list is empty. APM collects CPU and memory usages of selected processes.
The Process area contains the following fields:
· Config—Click the Config icon ![]() to quickly
populate the Application Instance List with all detected processes running on the
Windows operating system. Select the desired processes, and then click OK. APM collects CPU and memory usages of the selected processes in the next polling interval.
to quickly
populate the Application Instance List with all detected processes running on the
Windows operating system. Select the desired processes, and then click OK. APM collects CPU and memory usages of the selected processes in the next polling interval.
· Process Name—Name of the process.
· CLI—Command line used to start the process.
· CPU Usage—CPU usage of the process in the last polling interval.
¡ Click
the Set Threshold icon ![]() for a process to set CPU usage alarm thresholds for the process.
for a process to set CPU usage alarm thresholds for the process.
¡ Click
the History Record icon ![]() for a process to view the CPU usage history graph for the process.
for a process to view the CPU usage history graph for the process.
· Memory Usage—Memory usage of the
process in the last polling interval. Click the History
Record icon ![]() for a process to view the memory usage history graph for the process.
for a process to view the memory usage history graph for the process.
Process Number
The Process Number area contains the following field:
Process Number—Number of processes on the Windows server.
Thread Number
The Thread Number area contains the following field:
Thread Number—Number of threads on the Windows server.
Event
To monitor Windows events in APM, ensure the Monitor Type is set to WMI and the Enable Event Logging option is selected for the Windows application monitor.
The Event area contains the following fields:
· Generation Time—Time when the event occurred.
· Event Type—Type of the event. When adding Windows application monitors, you can specify event types. Options are Error, Warning, Information, Security Audit Success, and Security Audit Failure.
· Log File—File that records the event.
· Event Code—Event ID that is defined by Windows.
· Source Name—Source of the event.
· Event Category—Category of the event.
· Description—Description of the event.
Memory Info
The Memory Info area contains the following fields:
· Tag—Memory card tag on the Windows server.
· Capacity—Capacity of memory.
· Device Locator—Position of the memory card on the Windows server.
CPU Info
The CPU Info area contains the following fields:
· CPU DeviceID—Device ID of the CPU.
· Cores—Number of CPU cores.
· Logical Processors—Number of logical processors of the CPU.
· CPU Name—Name of the CPU.
· Manufacturer—Manufacturer of the CPU.
· Clock Speed—Clock speed of the CPU.
Base Board
The Base Board area contains the following fields:
· Serial Number—Serial number of the base board.
· Manufacturer—Manufacturer of the base board.
· Product—Model of the base board.
· Status—Status of the base board.
Fan Info
The Fan Info area contains the following fields:
· Fan Name—Name of the fan.
· Fan Status—Status of the fan.
Host
The Host area contains the following fields:
· Manufacturer—Manufacturer of the host.
· Model—Model of the host.
· Host Name—Name of the host.
Memory
The Memory area displays memory information for the server where the OS is located. To monitor the memory, make sure the BMC is installed on the server.
The Memory area contains the following fields:
· Component Name—Name of the component.
· Status—State of the component.
Power Supply
The Power Supply area displays power supply information for the server where the OS is located. To monitor the power supply, make sure the BMC is installed on the server.
The Power Supply area contains the following fields:
· Component Name—Name of the component.
· Status—State of the component.
Temperature
The Temperature area displays temperature information for the server where the OS is located. To monitor the temperature, make sure the BMC is installed on the server.
The Temperature area contains the following fields:
· Component Name—Name of the component.
· Status—State of the component.
· Value—Temperature of the component.
Fan
The Fan area displays fan information for the server where the OS is located. To monitor the fans, make sure the BMC is installed on the server.
The Fan area contains the following fields:
· Component Name—Name of the component.
· Status—State of the component.
Board
The Board area displays board information about the server where the OS is located. To monitor the board, make sure the BMC is installed on the server.
The Board area contains the following fields:
· Manufacturer—Manufacturer of the board.
· Product Name—Name and model of the product that the board applies to.
· Production Date—Production date of the board.
· Part Number—Part number of the board.
· Serial Number—Serial number of the board.
· System GUID—GUID of the board.
Chassis
The Chassis area displays chassis information for the server where the OS is located. To monitor the chassis, make sure the BMC is installed on the server.
The Chassis area contains the following fields:
· BMC Version—Version of the BMC.
· IPMI Driver Type—Type of the IPMI driver.
· Self-Check Result—Self-check result of the server.
· Power Supply Status—State of the power supply for the chassis.
· Chassis Intrusion—Whether the chassis is open or has been opened before.
· Front Panel—Whether the front panel is open.
· Cooling Fan Fault—Whether the cooling fans operate correctly.
· Disk Fault—Whether the disks operate correctly.
· Power-On Hours—Hours since the chassis was started.
Windows performance counters
Microsoft Windows performance counters monitor the performance data of various Microsoft products. Windows performance counters monitor belongs to the common monitor. APM can read the values of the performance counters to help you monitor Microsoft products.
Adding a Windows performance counter application monitor
APM can locally or remotely monitor Windows performance counters through WMI. When you add Windows performance counters application monitors, follow these guidelines:
· To monitor a Windows operating system through an agent, deploy the agent on the host on which the Windows operating system is installed. For more information about agents, see "APM agent management."
· To monitor a Windows operating system through WMI:
¡ Enable and configure WMI for the host on which the Windows operating system is installed. For more information about enabling WMI on Windows, see the Microsoft Windows online help.
¡ Obtain the username and password of the user who has the Windows administrator's privileges.
· Add the Windows hosts to the IMC platform so APM can obtain and display network connections of the hosts and their access devices in the application topology. For more information about adding hosts to the IMC platform, see H3C Intelligent Management Center v7.3 Enterprise and Standard Platform Administrator Guide.
· One application monitor can monitor at most 20 performance counters on an operating system. To monitor more performance counters, add more application monitors for the operating system.
The following task is performed in remote monitor mode. When the local monitor mode is used, you need to configure only part of the parameters that are required for the remote monitor mode.
To add a Windows performance counter application monitor:
1. Click the Resource tab.
2. Open the Add Application page by using one of the following methods:
¡ From the navigation tree, select Application Management > Add Application.
The page displays all application types that can be monitored by APM.
¡ From the navigation tree, select Application Manager > Application Monitor, and then click Add on the application monitor list page.
3. Click Performance Counter of the Windows Server Monitor class.
The page for adding a Windows performance counter application monitor opens.
4. Configure the following parameters for the application monitor:
¡ IP Address—Enter the IP address of the host where the Window operating system hosting the performance counters to be monitored is installed. If the host is already added to the IMC platform, you can also click Select, and then select the host from the Select Devices window. For information about selecting a host, see "Quick start." APM automatically checks the specified IP address and associates the application monitor with the host in the IMC platform.
¡ Name—Enter a unique application monitor name. As a best practice, name the application monitor as application type_host IP address.
¡ Use Template—Select Enable or Disable from the list.
¡ Template—Click
the Configure icon ![]() next to the Template field to select an existing template. The Template field
is automatically populated with the name of the selected template. For more
information about configuring application templates, see "Configuration management." This field is displayed only when you select Enable from the Use
Template list.
next to the Template field to select an existing template. The Template field
is automatically populated with the name of the selected template. For more
information about configuring application templates, see "Configuration management." This field is displayed only when you select Enable from the Use
Template list.
¡ Description—Enter a description for the application monitor.
¡ Polling Interval (min)—Select a polling interval for the application monitor. Options are 1, 2, 3, 4, 5, 10, 20, and 30. The default polling interval is 5 minutes. A shorter polling interval improves real-time data accuracy at the expense of system resources. This field is available only when you select Disable from the Use Template list.
¡ Username—Enter the username of the Windows administrator. This field is available only when you select Disable from the Use Template list.
- If the administrator is a domain user, use domain name\username.
- If the administrator is a local user, use host name\username, IP address\username, or username.
¡ Password—Enter the password of the administrator. This field is available only when you select Disable from the Use Template list.
¡ Contact—Enter contact information, such as the name, email address, and telephone number. The default is the username of the operator who created the application monitor. This field is available only when you select Disable from the Use Template list.
¡ APM Server—Select an APM server to monitor the application. The options are in server-address (application-type:n/N) format. The letter n indicates the number of Windows performance applications monitored on the APM server. The letter N indicates the total number of applications monitored on the APM server. Server address 127.0.0.1 indicates that APM and the IMC platform are deployed on the same server.
¡ Related Applications—Click Add next to this field. On the Select Application window, enter a partial or complete name to filter applications, select the applications that the Windows performance counter depends on, and then click OK.
Operating system applications cannot be selected. Operators can view all dependencies of the application in the dependency topology. APM automatically adds the dependencies between the Windows performance counter and operating system applications by IP address and displays their dependencies in the application topology.
¡ Application Group—Specify an application group for the Windows performance counter application.
- To specify an existing application group, click Add, select an application group, and then click OK.
- To specify a new application group, click Add Application Group, configure the application group settings, and then click OK.
¡ Detect Application—Select this parameter if you want to enable application detection. Application detection enables APM to verify connection to the application by using the previous parameter settings, and to determine whether to add the application monitor based on the verification result. APM adds the application monitor only when it can connect to the application. When this parameter is not specified, APM adds the application monitor without verifying the connection.
5. Click OK.
|
|
NOTE: The performance counters to be monitored are configured in the monitor report of the Windows performance counter application. You do not need to specify them when adding the application monitor. |
Modifying a Windows performance counter application monitor
Authorized users can modify all parameters except the IP address and the APM server for a Windows performance counter application monitor. When the IP address of a Windows performance counter host changes, operators must add a new application monitor for the host. The new application monitor cannot inherit the history data from the previous application monitor.
To modify a Windows performance counter application monitor:
1. Click the Resource tab.
2. From the navigation tree, select Application Manager > Application Monitor.
The application monitor list page displays all application monitors.
3. Click the Modify
icon ![]() for the Windows performance counter application monitor you want to
modify.
for the Windows performance counter application monitor you want to
modify.
The page for modifying the Windows performance counter application monitor opens.
4. Modify the parameters as needed, except the IP address and the APM server.
For more information about parameter settings, see "Adding a Windows performance counter application monitor."
5. Click OK.
Viewing the Windows performance counter application monitor report
After adding a Windows performance counter application monitor, operators must specify in the monitor report which performance counters are to be monitored. APM collects the index data of the specified performance counters to calculate their availability and health status. You can obtain monitor indexes for the performance counters by viewing the monitor report.
To view the Windows performance counter application monitor report:
1. Click the Resource tab.
2. From the navigation tree, select Application Manager > Application Monitor.
The application monitor list page displays all application monitors.
3. Click the name of a Windows performance counter application monitor to display the report.
Figure 52 shows part of a Windows application monitor report.
Figure 52 Part of a Windows performance counter application monitor report
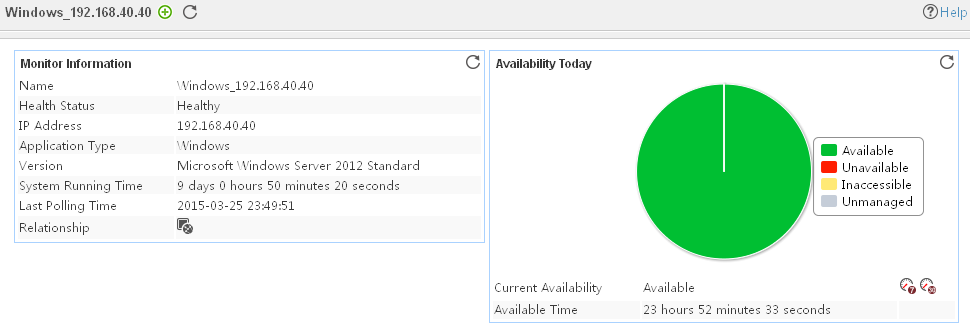
Monitor Information
The Monitor Information area contains the following fields:
· Name—Application monitor name.
· Health Status—Health status of the Windows performance counter.
· IP Address—IP address of the host running the Windows operating system.
· Application Type—Type of the monitored application, which is always Performance Counter.
· Last Polling Time—Time when APM last polled the Windows performance counter.
· Relationship—Click the Relationship icon ![]() to view dependencies between the Windows performance counter and other applications in a dependency topology view. For
more information about dependency topologies, see "Topology and application group management."
to view dependencies between the Windows performance counter and other applications in a dependency topology view. For
more information about dependency topologies, see "Topology and application group management."
· Top5 Unrecovered Alarms—Latest five unrecovered alarms on the Windows performance counter. This field is not displayed if no alarm is generated by the Windows performance counter.
Availability Today
The Availability Today area contains the following fields:
· Current Availability—Availability of the Windows performance counter in the last polling interval.
¡ Click
the Weekly History icon ![]() to view
the availability of Windows performance counter in the last 7 days.
to view
the availability of Windows performance counter in the last 7 days.
¡ Click
the Monthly History icon ![]() to view
the availability of the Windows performance counter in the last 30 days.
to view
the availability of the Windows performance counter in the last 30 days.
· Available Time—Total amount of time that the Windows performance counter was available after 00:00 today.
· Unavailable Time—Total amount of time that the Windows performance counter was unavailable after 00:00 today.
· Inaccessible Time—Total amount of time that the Windows performance counter was inaccessible after 00:00 today.
· Unmanaged Time—Total amount of time that the Windows performance counter was unmanaged after 00:00 today.
The statistics collection started when the application monitor was added. An availability time field is not displayed if its value is 0.
Ping Test
APM pings the host where the Windows performance counters are located at every polling interval. In a ping test, APM sends out a maximum of three ICMP packets to the host. When it receives a response, APM considers the ping test a success and records the response time. If it does not receive a response after sending three ICMP packets, APM considers the ping test a failure.
The Ping Test area contains the following fields:
· Response Time—Ping response time in the last ping test. Click the History Record icon ![]() to view the history
graph of the response time.
to view the history
graph of the response time.
· Packets Sent—Number of ICMP packets sent in the last ping test. The maximum value is 3. Click
the History Record icon ![]() to view the history graph of the sent packets.
to view the history graph of the sent packets.
· Packets Received—Number of ICMP responses received by APM in the last ping test. The
value is 0
or 1. Click the History Record icon ![]() to view the history
graph of the received packets.
to view the history
graph of the received packets.
Performance Counter
By default, the performance counter list is empty. APM collects the index data of the selected performance counters. You can monitor up to 20 performance counters in one application monitor.
The Performance Counter area contains the following fields:
· Config—Click the Config icon ![]() to populate the Application
Instance List with all detected performance
counters on the Windows operating system. Select the desired performance
counters, and then click OK. APM collects index
data of the selected performance counters in the next polling interval.
to populate the Application
Instance List with all detected performance
counters on the Windows operating system. Select the desired performance
counters, and then click OK. APM collects index
data of the selected performance counters in the next polling interval.
· Category—Category of the performance counter. The performance counter category corresponds to the Level-1 menu item in the left navigation tree of the Application Instance List window.
· Instance—Instance of the performance counter category. For example, the Win32_PerfFormattedData_PerfOS_Processor category contains four instances, 1, 2, 3, 4, and _Total, which in turn represent CPU cores 1, 2, 3, 4, and the total CPU. The instance corresponds to the Level--2 menu item in the left navigation tree of the Application Instance List window.
· Attribute/Value—Performance counter name and data.
Detailed information about performance counter
This area displays detailed information of each monitored performance counter.
The Detailed information area contains the following fields:
· Catalog/Instance—Category and instance name of the performance counter.
· Attribute/Value—Attribute and value collected for the performance counter in the last polling interval.
UNIX server monitor
AIX
AIX can be installed on various types of IBM servers. The performance and stability of AIX greatly affects the performance of applications running on it.
Adding an AIX application monitor
APM monitors AIX applications through CLI. When you add AIX application monitors, follow these guidelines:
· Enable Telnet or SSH on AIX. For more information, see the AIX configuration guide.
· Obtain the username and password of the Telnet or SSH user who has the AIX administrator's privileges.
· Add AIX hosts to the IMC platform so that APM can obtain and display network connections of the hosts and their access devices in the application topology. For more information about adding hosts to the IMC platform, see H3C Intelligent Management Center v7.3 Enterprise and Standard Platform Administrator Guide.
· To view traffic statistics in the monitor report of the AIX application, make sure at least one probe is configured in APM. After an AIX application monitor is added, APM sends the IP address of the monitored AIX application to the probes for traffic collection.
To add an AIX application monitor:
1. Click the Resource tab.
2. Open the Add Application page by using one of the following methods:
¡ From the navigation tree, select Application Manager > Add Application.
¡ From the navigation tree, select Application Manager > Application Monitor. In the application monitor list, click Add.
The Add Application page displays all application types that can be monitored by APM.
3. Click AIX of the UNIX Server Monitor class.
The page for adding an AIX application monitor opens.
4. Configure the following parameters:
¡ IP Address—Enter the IP address of the host on which the AIX application to be monitored is installed. APM automatically checks the IP address and associates the application monitor with the host managed in the IMC platform. If the host is already added to the IMC platform, you can also click Select, and then select the host in the Select Devices window. For information about selecting a host, see "Quick start."
¡ Name—Enter a unique application monitor name. As a best practice, name the application monitor as application type_host IP address.
¡ Use Template—Select Enable or Disable from the list.
¡ Template—Click
the Configure icon ![]() next to the Template field to select an existing template. The Template field
is automatically populated with the name of the selected template. For more
information about configuring application templates, see "Configuration management." This field is displayed only when you select Enable from the Use
Template list.
next to the Template field to select an existing template. The Template field
is automatically populated with the name of the selected template. For more
information about configuring application templates, see "Configuration management." This field is displayed only when you select Enable from the Use
Template list.
¡ Description—Enter a description for the application monitor.
¡ Polling Interval (min)—Select a polling interval for the application monitor. Options are 1, 2, 3, 4, 5, 10, 20, and 30. The default polling interval is 5 minutes. A shorter polling interval improves real-time data accuracy at the expense of system resources. This field is available only when you select Disable from the Use Template list.
¡ Monitor Type—Select the protocol (SSH or Telnet) through which APM monitors the AIX application, and then click the Configure icon ![]() to configure related parameters. This field is available only when you select Disable from the
Use Template list.
to configure related parameters. This field is available only when you select Disable from the
Use Template list.
When SSH is selected, configure the following parameters:
- Edit SSH Parameters—Select this option if you want to manually configure SSH parameters for APM. Make sure the SSH settings are the same as those on AIX.
- Select an Existing Template—Select this option if you want to select an existing SSH template for APM. For information about setting SSH parameter templates, see H3C Intelligent Management Center v7.3 Enterprise and Standard Platform Administrator Guide.
- Authentication Mode—Select the authentication mode for SSH users. Options are Password, Private Key, Password + Private Key, Password + Super Password, Private Key + Super Password, and Password + Private Key + Super Password. The following parameters to be configured vary with authentication modes.
- Username—Enter the SSH username. The user must have the AIX administrator's privilege.
- Password—Enter the password of the SSH user.
- Private Key File—Enter the directory of the SSH private key file or browse to the file.
- Private Key Password—Enter the password to decrypt the SSH private key file.
- Super Password—Enter the super password with which an SSH user can elevate privileges after login.
- Port—Enter the SSH port on AIX.
- Timeout (1-120 seconds)—Enter the maximum time period that APM waits for an SSH response from AIX. The value range is 1 to 120 seconds and the default is 10 seconds. If no SSH response is received from AIX within the timeout time, APM considers that the interaction has failed.
- Retries (1-5)—Enter how many times APM retries to send SSH packets to the AIX host.
When Telnet is selected, configure the following parameters:
- Edit Telnet Parameters—Select this option if you want to manually configure Telnet parameters for APM. Make sure the Telnet settings are the same as those on AIX.
- Select an Existing Template—Select this option if you want to select an existing Telnet template for APM. For information about setting Telnet parameter templates, see H3C Intelligent Management Center v7.3 Enterprise and Standard Platform Administrator Guide.
- Authentication Mode—Select the authentication mode for Telnet users. Options are Password (No Operator or Super/Manager), Username + Password, Super/Manager Password, Password + Super/Manager Password (No Operator), Username + Password + Super/Manager Password, No Username + No Password, and Username + No Password. The following parameters to be configured vary with authentication modes.
- Username—Enter the Telnet username. The user must have the AIX administrator's privilege.
- Password—Enter the password of the Telnet user.
- Super Password—Enter the super password with which a Telnet user can elevate privileges after login.
- Timeout (1-60 seconds)—Enter the maximum time period that APM waits for a Telnet response from AIX. The value range is 1 to 60 seconds and the default is 4 seconds. If no Telnet response is received from AIX within the timeout time, APM considers that the interaction has failed.
¡ Contact—Enter user contact information, such as the name, email address, and telephone number. The default is the username of the operator who created the application monitor. This field is available only when you select Disable from the Use Template list.
¡ Use IPMI—Select Enable or Disable from the list. If you select Enable, configure the following parameters:
- Host IP—Enter the IP address of the BMC for IPMI monitoring.
- Username/Password—Enter the username and password of the BMC for IPMI monitoring.
¡ APM Server—Select an APM server to monitor the application. The options are in server-address (application-type:n/N) format. The letter n indicates the number of AIX applications monitored on the APM server. The letter N indicates the total number of applications monitored on the APM server. Server address 127.0.0.1 indicates that APM and the IMC platform are deployed on the same server.
¡ Related Applications—Click Add next to this field. On the Select Application window, enter a partial or complete name to filter applications, select the applications that AIX depends on, and then click OK.
Operating system applications cannot be selected. Operators can view all dependencies of the application in the dependency topology.
¡ Application Group—Specify an application group for the AIX application.
- To specify an existing application group, click Add, select an application group, and then click OK.
- To specify a new application group, click Add Application Group, configure the application group settings, and then click OK.
¡ Detect Application—Select this parameter if you want to enable application detection. APM verifies the application connectivity by using the previous parameter settings, and adds the application monitor only when it can connect to the application. If you do not select this parameter, APM adds the application monitor without verifying the application connectivity.
5. Click OK.
Modifying an AIX application monitor
Authorized users can modify all parameters except the IP address and the APM server for an AIX application monitor. When the IP address of a monitored AIX host changes, operators must add a new application monitor for the host. The new application monitor cannot inherit the history data from the previous application monitor.
To modify an AIX application monitor:
1. Click the Resource tab.
2. From the navigation tree, select Application Manager > Application Monitor.
The application monitor list page opens.
3. Click AIX of the UNIX Server Monitor class.
4. Click the Modify
icon ![]() for the AIX application
monitor you want to modify.
for the AIX application
monitor you want to modify.
The page for modifying the AIX application monitor opens.
5. Modify the parameters as needed, except the IP address and the APM server.
For more information about parameter settings, see "Adding an AIX application monitor."
6. Click OK.
Viewing the AIX application monitor report
After an AIX application monitor is added, APM collects index data of the application, and calculates its availability and health status. You can obtain monitor indexes for AIX by viewing the monitor report.
To access the AIX application monitor report:
1. Click the Resource tab.
2. From the navigation tree, select Application Manager > Application Monitor.
The application monitor list page displays all application monitors.
3. Click the name of an AIX application monitor to display the report.
Figure 53 shows part of an AIX monitor report.
Figure 53 Part of an AIX application monitor report
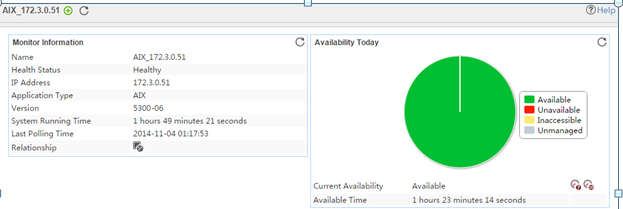
Monitor Information
The Monitor Information area contains the following fields:
· Name—Application monitor name.
· Health Status—Health status of the monitored AIX application.
· IP Address—IP address of the AIX host.
· Application Type—Type of the monitored application, which is always AIX.
· Version—Version of the AIX operating system.
· System Running Time—Duration since the startup of the AIX application to the time when APM last polled the AIX application.
· Last Polling Time—Time when APM last polled the AIX application.
· Relationship—Click the Relationship icon ![]() to view
dependencies between the AIX application and other applications in a dependency topology view. For
more information about dependency topologies, see "Topology and application group management."
to view
dependencies between the AIX application and other applications in a dependency topology view. For
more information about dependency topologies, see "Topology and application group management."
· Top5 Unrecovered Alarms—Latest five unrecovered alarms on the AIX host. If no alarm is generated by AIX, this field is not displayed.
Availability Today
The Availability Today area contains the following fields:
· Current Availability—Availability of the AIX application in the last polling period.
¡ Click the Weekly History icon ![]() to view the availability of the AIX
application in the last 7 days.
to view the availability of the AIX
application in the last 7 days.
¡ Click the Monthly
History icon ![]() to view the availability of the AIX
application in the last 30 days.
to view the availability of the AIX
application in the last 30 days.
· Available Time—Total amount of time that the AIX application was available after 00:00 today.
· Unavailable Time—Total amount of time that the AIX application was unavailable after 00:00 today.
· Inaccessible Time—Total amount of time that the AIX application was inaccessible after 00:00 today.
· Unmanaged Time—Total amount of time that the AIX application was unmanaged after 00:00 today.
The statistics collection started when the application monitor was added. An availability time field is not displayed if its value is 0.
CPU Usage Ratio
The CPU Usage Ratio area contains the following field:
· CPU Usage Ratio—CPU usage ratio of the AIX application in the last polling interval.
¡ Click
the Set Threshold icon ![]() to set alarm thresholds for the CPU usage.
to set alarm thresholds for the CPU usage.
¡ Click the History
Record icon ![]() to view the history graph of the CPU usage.
to view the history graph of the CPU usage.
Memory Usage Ratio
The Memory Usage Ratio area displays information about physical memory and swap memory.
The Memory Usage Ratio area contains the following fields:
· Physical Memory—Physical memory of the AIX application, which corresponds to the physical memory bar.
· Swap—Swap memory of the AIX application, which corresponds to the disk space.
· Total—Total amount of the physical or swap memory.
· In Use—Size of the physical or swap memory that is being used. Click the History Record icon ![]() to view the history
graph of the physical or swap memory that is being used.
to view the history
graph of the physical or swap memory that is being used.
· Usage Ratio—Physical or swap memory usage ratio. The usage ratio is calculated by using the formula: Usage ratio = Memory in use/Total memory x 100%.
¡ Click
the Set Threshold icon ![]() to set alarm thresholds for the memory (including the physical memory and swap
memory) usage.
to set alarm thresholds for the memory (including the physical memory and swap
memory) usage.
¡ Click the History Record icon ![]() to view the history
graph of the physical or swap memory usage.
to view the history
graph of the physical or swap memory usage.
CPU Performance
The CPU Performance area contains the following fields:
· CPU Name—Name of the AIX server CPU.
· Load Percentage—Percentage of the load time.
· User Percentage—Percentage of the user time.
· System Percentage—Percentage of the system time.
· I/O Wait Percentage—Percentage of the I/O wait time.
· Idle Percentage—Percentage of the idle time.
Paging
The Paging area contains the following fields:
· Paging In—Number pages that are paged in during the interval.
· Paging Out—Number pages that are paged out during the interval.
Connection State
· Established Connections—Number of established TCP connections.
· CLOSE_WAIT—Number of connections in CLOSE_WAIT state.
· TIME_WAIT—Number of connections in TIME_WAIT state.
Ping Test
When the polling interval expires, APM pings the AIX host by sending up to three ICMP packets. If APM receives a response packet, the ping succeeds and APM records the response time. If APM does not receive a response after sending out three ICMP packets, APM considers that the ping test has failed.
The Ping Test area contains the following fields:
· Response Time—Round trip response time of the AIX application in the last ping
operation. Click the History
Record icon ![]() to view the history graph of the response
time.
to view the history graph of the response
time.
· Packets Sent—Number of ICMP packets that APM sent in the last ping operation. The maximum value is 3. Click the History Record icon ![]() to view the history
graph of the packets sent.
to view the history
graph of the packets sent.
· Packets Received—Number
of ICMP response packets that APM received in the last ping operation. The
value is 0 or 1. Click
the History Record icon ![]() to view the history graph of the packets
received.
to view the history graph of the packets
received.
System Load
APM analyzes and displays the system load average for the monitored AIX in 1 minute, 5 minutes, and 15 minutes. System load average is the average number of processes running on the AIX system during a specific time period. Excessive system load can cause performance problems. The thresholds of system load vary by CPU type.
The System Load area contains the following fields:
· System Load/Min—Average
system load over the last 1 minute. Click the History Record icon ![]() to view the history
graph of the average system
load over the last 1 minute.
to view the history
graph of the average system
load over the last 1 minute.
· System Load/5 Min—Average
system load over the last 5 minutes. Click the History Record icon ![]() to view the history
graph of the average system
load over the last 5 minutes.
to view the history
graph of the average system
load over the last 5 minutes.
· System Load/15 Min—Average
system load over the last 15 minutes. Click the History Record icon ![]() to view the history
graph of the average system
load over the last 15 minutes.
to view the history
graph of the average system
load over the last 15 minutes.
System Call
The System Call area contains the following field:
· System Calls—Number of AIX system calls per second.
Process Count
The Process Count area contains the following fields:
· Active Process Count—Number of active processes in the AIX system.
· Non-Root Process—Number of non-root user processes.
· Await Resource Process—Number of processes that wait for resources.
File System Usage Ratio
The AIX file directory structure contains one root directory and multiple subdirectories. File systems are mounted to the root directory or subdirectories under the root directory. Each file system matches a physical disk partition or logical volume. The AIX application writes data to or reads data from the physical disk partition or logical volume by using the matching directory.
The File System Usage Ratio area contains the following fields:
· Name—Mount point of the file system in the AIX directory structure.
· File System Usage Ratio—Space usage ratio of the AIX file system.
¡ Click
the Set Threshold icon ![]() to set alarm thresholds for the file system usage.
to set alarm thresholds for the file system usage.
¡ Click the History
Record icon ![]() to view the history graph of the file system
usage ratio.
to view the history graph of the file system
usage ratio.
· In Use—Used space of the file system. Click the History
Record icon ![]() to view the history graph of the used file
system space.
to view the history graph of the used file
system space.
· Free Space—Free
space of the partition or logical volume. Click the History Record icon ![]() to view the history
graph of the free file system space.
to view the history
graph of the free file system space.
Zombie Process Number
The Zombie Process Number area contains the following field:
· Zombie Process Number—Number of zombie processes in the last polling interval. Click the History Record icon ![]() to view the history graph of the zombie process number.
to view the history graph of the zombie process number.
Zombie Process
The Zombie Process area contains the following fields:
· Process Name—Name of the zombie process in the last polling interval. Zombie processes in AIX do not have process names.
· ID—Unique identifier of the zombie process on the OS.
· Parent ID—ID of the parent process for the zombie process.
· CPU Usage—CPU usage of the zombie process in the last polling interval.
¡ Click
the Set Threshold icon ![]() to set alarm thresholds for the CPU usage of the zombie process.
to set alarm thresholds for the CPU usage of the zombie process.
¡ Click
the History Record icon
![]() to view the history graph of the CPU usage.
to view the history graph of the CPU usage.
· Memory Usage—Memory usage of the zombie process in the last polling interval. Click
the History Record icon
![]() to view the history graph of the memory usage of the zombie
process.
to view the history graph of the memory usage of the zombie
process.
· CPU Time—Duration that the zombie process occupies the CPU in the last polling interval.
Application Traffic
APM collects AIX traffic based on the IP address of the host where the application resides.
The Application Traffic area contains the following fields:
· Last Hour's Traffic—Total traffic sent and received by AIX over the last 1 hour.
· Today's Traffic—Total traffic sent and received by AIX since 00:00 today.
Network Interface
The Network Interface area contains the following fields:
· Interface Name—Identifier of the network interface card in AIX. APM monitors both physical and virtual (logical) network interface cards.
· Receive Rate—Receive rate of the network interface card in the last polling interval.
Click the Set Threshold icon ![]() to set alarm thresholds for the receive rate of AIX network
interface cards.
to set alarm thresholds for the receive rate of AIX network
interface cards.
· Send Rate—Send rate of the network interface card in the last polling interval.
· Input Error Packet Rate—Number of inbound erroneous packets per second on the network interface card in the last polling interval.
· Output Error Packet Rate—Number of outbound erroneous packets per second on the network interface card in the last polling interval.
Error Log
APM examines the AIX error logs when APM polls AIX applications and displays the first 10 error logs obtained in the AIX application monitor report.
The Error Log area contains the following fields:
· Time—Time when the error occurred in the last polling interval.
· Log—Content of the error log in the last polling interval.
· More—Click More to view all error logs occurred in the last polling interval.
Process
By default, the list does not contain any
processes. To monitor a process on AIX, click the Configuration
icon ![]() to select the processes to be monitored.
APM collects the index data including CPU usage and memory usage for the
monitored processes when APM polls applications next time.
to select the processes to be monitored.
APM collects the index data including CPU usage and memory usage for the
monitored processes when APM polls applications next time.
The Process area contains the following fields:
· Config—Click the Config icon ![]() to select the processes to be monitored
in the monitor list window.
to select the processes to be monitored
in the monitor list window.
· Name—Name of the monitored process. APM can respectively collect index data for the processes that have the same name but different Process Identifiers (PIDs). You cannot view the history graph of index data for the processes that have the same name.
· ID—Unique identifier of the process on the OS.
· Parent ID—ID of the parent process of the process.
· CPU Usage—CPU usage ratio of the monitored process in the last polling interval.
¡ Click
the Set Threshold icon ![]() to set alarm thresholds
of the CPU usage ratio for the monitored process.
to set alarm thresholds
of the CPU usage ratio for the monitored process.
¡ Click the History
Record icon ![]() to view the history
graph of the CPU usage ratio of the monitored process.
to view the history
graph of the CPU usage ratio of the monitored process.
· Memory Usage—Memory usage ratio
of the monitored process in the last polling interval. Click the History
Record icon ![]() to view the history graph of the memory usage ratio of the monitored process.
to view the history graph of the memory usage ratio of the monitored process.
· CPU Time—Duration that the process occupies the CPU in the last polling interval.
I/O State
APM can monitor the I/O status of the disk drivers in the AIX system.
The I/O State area contains the following fields:
· Device Name—Name of the disk drivers in the AIX system.
· I/O Rate—Size of the input/output data in the disk driver per second in the last polling interval.
· I/Os/Sec—Number of transfer times in the disk driver per second in the last polling interval. A transfer is an I/O request to the physical disk. Multiple logical requests can be integrated into a single I/O request to the disk. The size of the transferred data in each transfer is not fixed.
inode
An index node is called inode for short. The inodes are required when you create a file or directory in the AIX file system. If the inodes are used up, you cannot create a file or directory in the file system.
The inode area contains the following fields:
· File System—File system of the AIX application.
· Total—Total number of available inodes in the file system in the last polling interval. Click the History
Record icon ![]() to view the history graph of the total number of inodes
in the file system.
to view the history graph of the total number of inodes
in the file system.
· Free—Number of inodes that are not used in the file system in the last polling interval. Click the History
Record icon ![]() to view the history graph of the number of idle inodes
in the file system.
to view the history graph of the number of idle inodes
in the file system.
· In Use—Number of inodes that have been used in the file system in the last polling interval. Click the History
Record icon ![]() to view the history graph of the number of used inodes
in the file system.
to view the history graph of the number of used inodes
in the file system.
· inode Usage Ratio—Usage of inodes in the file system in the last polling interval.
¡ Click the Set
Threshold icon ![]() to set alarm thresholds of the inode usage ratio in the file system.
to set alarm thresholds of the inode usage ratio in the file system.
¡ Click
the History Record icon ![]() to view the history graph of inode usage in the file system.
to view the history graph of inode usage in the file system.
Session Information
The Session Information area displays AIX session login information.
The Session Information area contains the following fields:
· User Name—User logging in to the AIX application in the last polling interval.
· TTY—TTY used by the user.
· Login Time—Time when the user logged in to the AIX application.
· Idle—Idle time after the user logged in to the AIX application.
· Command—Most recently executed command after the user logged in to the AIX application.
Disk Mount
The Disk Mount area displays AIX disk mount information.
The Disk Mount area contains the following fields:
· Disk Name—Name of the disk.
· Disk State—Mount status of the disk.
· Disk Location—Location where the disk is mounted.
· Disk Description—Description of the disk.
Adapter
The Adapter area displays AIX adapter mount information.
The Adapter area contains the following fields:
· Adapter Name—Name of the adapter.
· Adapter State—Mount status of the adapter.
· Adapter Location—Location where the adapter is mounted.
· Adapter Description—Description of the adapter.
Cluster Information
The Cluster Information area displays AIX cluster information.
The Cluster Information area contains the following fields:
· Group Name—Name of the group to which each node in the cluster belongs.
· Status—Status of each node in the cluster.
· Node Name—Name of each node in the cluster.
MPIO
The MPIO area displays AIX MPIO information.
The MPIO area contains the following fields:
· MPIO State—Status of the MPIO.
· MPIO Device—Name of the destination device of the MPIO.
· MPIO Parent—Name of the source device of the MPIO.
Error Device Information
The Error Device Information area displays error information for the physical device where the OS is located.
The Error Device Information area contains the following fields:
· Identifier—ID of the error.
· Time—Time when the error occurred.
· Type—Severity of the error. Options are:
¡ P—The error might be caused by loss of devices or functional components, performance degradation, or corruption of hardware or software.
¡ T—The error is temporary and has been eliminated after retries.
¡ I—The message is an informational message. No error occurred.
¡ U—The severity of the error is unknown.
· Class—Source of the error. Options are:
¡ H—Hardware or media failure.
¡ S—Software failure.
¡ O—Human error.
¡ U—Unknown.
· Resource Name—Name of the resource where the error occurred.
· Description—Description of the error.
Memory Info
The Memory Info area contains the following fields:
· Memory Serial Number—Serial number of the memory card on the AIX server.
· Memory Size—Size of the memory.
· Location—Memory card position on the server.
Thermal
The Thermal area contains the following fields:
· Thermal Sensor—Name of the thermal sensor on the AIX server.
· Degrees—Temperature of the server, in degrees Celsius.
· Status—Temperature status of the server.
· Location—Thermal sensor position on the server.
Fan Speed
The Fan Speed area contains the following fields:
· Fan Sensor—Name of the fan sensor on the AIX server.
· Fan Speed—Fan speed of the server
· Status—Fan status of the server.
· Location—Fan sensor position on the server.
Processor Info
The Processor Info area contains the following fields:
· Processor Name—Name of the CPU processor on the AIX server.
· Processor State—Status of the CPU processor.
· Position—CPU processor position on the server.
· Description—Description of the CPU processor.
Memory
The Memory area displays memory information for the server where the OS is located. To monitor the memory, make sure the BMC is installed on the server.
The Memory area contains the following fields:
· Component Name—Name of the component.
· Status—State of the component.
Power Supply
The Power Supply area displays power supply information for the server where the OS is located. To monitor the power supply, make sure the BMC is installed on the server.
The Power Supply area contains the following fields:
· Component Name—Name of the component.
· Status—State of the component.
Temperature
The Temperature area displays temperature information for the server where the OS is located. To monitor the temperature, make sure the BMC is installed on the server.
The Temperature area contains the following fields:
· Component Name—Name of the component.
· Status—State of the component.
· Value—Temperature of the component.
Fan
The Fan area displays fan information for the server where the OS is located. To monitor the fans, make sure the BMC is installed on the server.
The Fan area contains the following fields:
· Component Name—Name of the component.
· Status—State of the component.
Board
The Board area displays board information about the server where the OS is located. To monitor the board, make sure the BMC is installed on the server.
The Board area contains the following fields:
· Manufacturer—Manufacturer of the board.
· Product Name—Name and model of the product that the board applies to.
· Production Date—Production date of the board.
· Part Number—Part number of the board.
· Serial Number—Serial number of the board.
· System GUID—GUID of the board.
Chassis
The Chassis area displays chassis information for the server where the OS is located. To monitor the chassis, make sure the BMC is installed on the server.
The Chassis area contains the following fields:
· BMC Version—Version of the BMC.
· IPMI Driver Type—Type of the IPMI driver.
· Self-Check Result—Self-check result of the server.
· Power Supply Status—State of the power supply for the chassis.
· Chassis Intrusion—Whether the chassis is open or has been opened before.
· Front Panel—Whether the front panel is open.
· Cooling Fan Fault—Whether the cooling fans operate correctly.
· Disk Fault—Whether the disks operate correctly.
· Power-On Hours—Hours since the chassis was started.
SCO UNIX
SCO UNIX is a UNIX operating system developed by SCO.
Adding an SCO UNIX application monitor
APM can monitor SCO UNIX through CLI. When you add application monitors for SCO UNIX, follow these guidelines:
· Enable and configure Telnet or SSH on SCO UNIX. For information about enabling Telnet or SSH on SCO UNIX, see the SCO UNIX configuration guide.
· Obtain the username and password of the Telnet or SSH user who has the SCO UNIX administrator's privileges.
· Add SCO UNIX hosts to the IMC platform so that APM can obtain and display network connections of the hosts and their access devices in the application topology. For more information about adding hosts to the IMC platform, see H3C Intelligent Management Center v7.3 Enterprise and Standard Platform Administrator Guide.
· To view traffic statistics in the monitor report of the SCO UNIX application, make sure at least one probe is configured in APM. After an SCO UNIX application monitor is added, APM sends the IP address of the monitored SCO UNIX application to the probes for traffic collection.
To add an SCO UNIX application monitor:
1. Click the Resource tab.
2. Open the Add Application page by using one of the following methods:
¡ From the navigation tree, select Application Manager > Add Application.
¡ From the navigation tree, select Application Manager > Application Monitor. In the application monitor list, click Add.
The Add Application page displays all application types that can be monitored by APM.
3. Click SCO UNIX of the UNIX Server Monitor class.
The page for adding an SCO UNIX application monitor opens.
4. Configure the following parameters:
¡ IP Address—Enter the IP address of the host on which the SCO UNIX application to be monitored is installed. APM automatically checks the IP address and associates the application monitor with the host managed in the IMC platform. If the host is already added to the IMC platform, you can also click Select, and then select the host in the Select Devices window. For information about selecting a host, see "Quick start."
¡ Name—Enter a unique application monitor name. As a best practice, name the application monitor as application type_host IP address.
¡ Use Template—Select Enable or Disable from the list.
¡ Template—Click the Configure icon
![]() next to the Template field
to select an existing template. The Template field is automatically
populated with the name of the selected template. For more information about
configuring application templates, see "Configuration management." This
field is displayed only when you select Enable from the Use Template
list.
next to the Template field
to select an existing template. The Template field is automatically
populated with the name of the selected template. For more information about
configuring application templates, see "Configuration management." This
field is displayed only when you select Enable from the Use Template
list.
¡ Description—Enter a description for the application monitor.
¡ Polling Interval (min)—Select a polling interval for the application monitor. Options are 1, 2, 3, 4, 5, 10, 20, and 30. The default polling interval is 5 minutes. A shorter polling interval improves real-time data accuracy at the expense of system resources. This field is available only when you select Disable from the Use Template list.
¡ Monitor Type—Select the protocol (SSH or Telnet) through
which APM monitors the SCO UNIX application, and then
click the Configure icon ![]() to configure related parameters. This field is available only when you select Disable from the
Use Template list.
to configure related parameters. This field is available only when you select Disable from the
Use Template list.
When SSH is selected, configure the following parameters:
- Edit SSH Parameters—Select this option if you want to manually configure SSH parameters for APM. Make sure the SSH settings are the same as those on SCO UNIX.
- Select an Existing Template—Select this option if you want to select an existing SSH template for APM. For information about setting SSH parameter templates, see H3C Intelligent Management Center v7.3 Enterprise and Standard Platform Administrator Guide.
- Authentication Mode—Select the authentication mode for SSH users. Options are Password, Private Key, Password + Private Key, Password + Super Password, Private Key + Super Password, and Password + Private Key + Super Password. The following parameters to be configured vary with authentication modes.
- Username—Enter the SSH username. The user must have the SCO UNIX administrator's privilege.
- Password—Enter the password of the SSH user.
- Private Key File—Enter the directory of the SSH private key file or browse to the file.
- Private Key Password—Enter the password to decrypt the SSH private key file.
- Super Password—Enter the super password with which an SSH user can elevate privileges after login.
- Port—Enter the SSH port on SCO UNIX.
- Timeout (1-120 seconds)—Enter the maximum time period that APM waits for an SSH response from SCO UNIX. The value range is 1 to 120 seconds and the default is 10 seconds. If no SSH response is received from SCO UNIX within the timeout time, APM considers that the interaction has failed.
- Retries (1-5)—Enter how many times APM retries to send SSH packets to the SCO UNIX host.
When Telnet is selected, configure the following parameters:
- Edit Telnet Parameters—Select this option if you want to manually configure Telnet parameters for APM. Make sure the Telnet settings are the same as those on SCO UNIX.
- Select an Existing Template—Select this option if you want to select an existing Telnet template for APM. For information about setting Telnet parameter templates, see H3C Intelligent Management Center v7.3 Enterprise and Standard Platform Administrator Guide.
- Authentication Mode—Select the authentication mode for Telnet users. Options are Password (No Operator or Super/Manager), Username + Password, Super/Manager Password, Password + Super/Manager Password (No Operator), Username + Password + Super/Manager Password, No Username + No Password, and Username + No Password. The following parameters to be configured vary with authentication modes.
- Username—Enter the Telnet username. The user must have the SCO UNIX administrator's privilege.
- Password—Enter the password of the Telnet user.
- Super Password—Enter the super password with which a Telnet user can elevate privileges after login.
- Timeout (1-60 seconds)—Enter the maximum time period that APM waits for a Telnet response from Solaris. The value range is 1 to 60 seconds and the default is 4 seconds. If no Telnet response is received from SCO UNIX within the timeout time, APM considers that the interaction has failed.
¡ Contact—Enter the contact information, such as the name, email address, and telephone number. The default is the username of the operator who created the application monitor. This field is available only when you select Disable from the Use Template list.
¡ Use IPMI—Select Enable or Disable from the list. If you select Enable, configure the following parameters:
- Host IP—Enter the IP address of the BMC for IPMI monitoring.
- Username/Password—Enter the username and password of the BMC for IPMI monitoring.
¡ APM Server—Select an APM server to monitor the application. The options are in server-address (application-type:n/N) format. The letter n indicates the number of SCO UNIX applications monitored on the APM server. The letter N indicates the total number of applications monitored on the APM server. Server address 127.0.0.1 indicates that APM and the IMC platform are deployed on the same server.
¡ Related Applications—Click Add next to this field. On the Select Application window, enter a partial or complete name to filter applications, select the applications that SCO UNIX depends on, and then click OK.
Operating system applications cannot be selected. Operators can view all dependencies of the application in the dependency topology.
¡ Application Group—Specify an application group for the SCO UNIX application.
- To specify an existing application group, click Add, select an application group, and then click OK.
- To specify a new application group, click Add Application Group, configure the application group settings, and then click OK.
¡ Detect Application—Select this parameter if you want to enable application detection. APM verifies the application connectivity by using the previous parameter settings, and adds the application monitor only when it can connect to the application. If you do not select this parameter, APM adds the application monitor without verifying the application connectivity.
5. Click OK.
Modifying an SCO UNIX application monitor
Authorized users can modify all parameters except the IP address and the APM server for an SCO UNIX application monitor. When the IP address of a monitored SCO UNIX host changes, operators must add a new application monitor for the host. The new application monitor cannot inherit the history data from the previous application monitor.
To modify an SCO UNIX application monitor:
1. Click the Resource tab.
2. From the navigation tree, select Application Manager > Application Monitor.
The application monitor list page displays all application monitors.
3. Click the Modify
icon ![]() for the SCO UNIX application monitor
you want to modify.
for the SCO UNIX application monitor
you want to modify.
The page for modifying the SCO UNIX application monitor opens.
4. Modify the parameters as needed, except the IP address and the APM server.
For more information about parameter settings, see "Adding an SCO UNIX application monitor."
5. Click OK.
Viewing the SCO UNIX application monitor report
After an SCO UNIX application monitor is added, APM collects index data of the application, and calculates its availability and health status. You can obtain monitor indexes for SCO UNIX by viewing the monitor report.
To access the SCO UNIX application monitor report:
1. Click the Resource tab.
2. From the navigation tree, select Application Manager > Application Monitor.
The application monitor list page displays all application monitors.
3. Click the name of an SCO UNIX application monitor to display the report.
Figure 54 shows part of an SCO UNIX monitor report.
Figure 54 Part of an SCO UNIX application monitor report
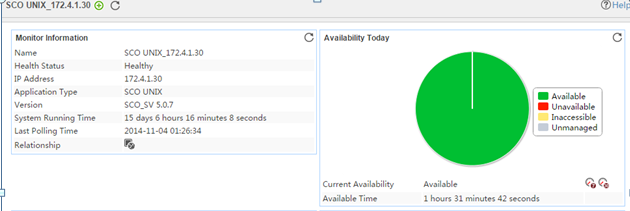
Monitor Information
The Monitor Information area contains the following fields:
· Name—Application monitor name.
· Health Status—Health status of the monitored SCO UNIX application.
· IP Address—IP address of the SCO UNIX host.
· Application Type—Type of the monitored application, -which is always SCO UNIX.
· Version—Version of the SCO UNIX operating system.
· System Running Time—Duration since the startup of the SCO UNIX application to the time when APM last polled the SCO UNIX application.
· Last Polling Time—Time when APM last polled the SCO UNIX application.
· Relationship—Click the Relationship icon ![]() to view
dependencies between the SCO UNIX application and other applications in a dependency topology view. For
more information about dependency topologies, see "Topology and application group management."
to view
dependencies between the SCO UNIX application and other applications in a dependency topology view. For
more information about dependency topologies, see "Topology and application group management."
· Top5 Unrecovered Alarms—Latest five unrecovered alarms on the SCO UNIX host. If no alarm is generated by the SCO UNIX application, this field is not displayed.
Availability Today
The Availability Today area contains the following fields:
· Current Availability—Availability of the SCO UNIX application in the last polling interval.
¡ Click the Weekly History icon ![]() to view the availability of the SCO UNIX
application in the last 7 days.
to view the availability of the SCO UNIX
application in the last 7 days.
¡ Click the Monthly
History icon ![]() to view the availability of the SCO UNIX
application in the last 30 days.
to view the availability of the SCO UNIX
application in the last 30 days.
· Available Time—Total amount of time that the SCO UNIX application was available after 00:00 today.
· Unavailable Time—Total amount of time that the SCO UNIX application was unavailable after 00:00 today.
· Inaccessible Time—Total amount of time that the SCO UNIX application was inaccessible after 00:00 today.
· Unmanaged Time—Total amount of time that the SCO UNIX application was unmanaged after 00:00 today.
The statistics collection started when the application monitor was added. An availability time field is not displayed if its value is 0.
CPU Usage Ratio
The CPU Usage Ratio area contains the following field:
· CPU Usage—CPU usage ratio of the SCO UNIX application in the last polling interval.
¡ Click
the Set Threshold icon ![]() to set alarm thresholds for the CPU usage.
to set alarm thresholds for the CPU usage.
¡ Click the History
Record icon ![]() to view the history graph of the CPU usage.
to view the history graph of the CPU usage.
Memory Usage Ratio
The Memory Usage Ratio area displays information about physical memory and swap memory.
The Memory Usage Ratio area contains the following fields:
· Physical memory—Physical memory of the SCO UNIX application, which corresponds to the physical memory bar.
· Swap—Swap memory of the SCO UNIX application, which corresponds to the disk space.
· Total—Total amount of the physical or swap memory.
· In Use—Amount of the physical or swap memory that is being used. Click the History Record icon ![]() to view the history
graph of the physical or swap memory that is being used.
to view the history
graph of the physical or swap memory that is being used.
· Usage Ratio—Physical or swap memory usage ratio. The usage ratio is calculated by using the formula: Usage ratio = Memory in use/Total memory x 100%.
¡ Click
the Set Threshold icon ![]() to set alarm thresholds for the memory (including physical memory and swap
memory) usage.
to set alarm thresholds for the memory (including physical memory and swap
memory) usage.
¡ Click the History Record icon ![]() to view the history
graph of the physical or swap memory usage.
to view the history
graph of the physical or swap memory usage.
Ping Test
When the polling interval expires, APM pings the SCO UNIX host by sending up to three ICMP packets. If APM receives a response packet, the ping succeeds and APM records the response time. If APM does not receive a response after sending out three ICMP packets, APM considers that the ping test has failed.
The Ping Test area contains the following fields:
· Response Time—Round trip response time of the AIX application in the last ping
operation. Click the History
Record icon ![]() to view the history graph of the response
time.
to view the history graph of the response
time.
· Packets Sent—Number of ICMP packets that APM sent in the last ping operation. The maximum value is 3. Click the History Record icon ![]() to view the history
graph of the packets sent.
to view the history
graph of the packets sent.
· Packets Received—Number
of ICMP response packets that APM received in the last ping operation. The
value is 0 or 1. Click
the History Record icon ![]() to view the history graph of the packets
received.
to view the history graph of the packets
received.
System Load
APM analyzes and displays the system load average for the monitored SCO UNIX application in 1 minute, 5 minutes, and 15 minutes. System load average is the average number of processes running on the SCO UNIX system during a specific time period. Excessive system load can cause performance problems. The thresholds of system load vary by CPU type.
The System Load area contains the following fields:
· System Load/Min—Average
system load over the last 1 minute. Click the History
Record icon ![]() to view the history graph of the system load over the last 1 minute.
to view the history graph of the system load over the last 1 minute.
· System Load/5 Min—Average
system load over the last 5 minutes. Click the History
Record icon ![]() to view the history graph of the system load over the last 5
minutes.
to view the history graph of the system load over the last 5
minutes.
· System Load/15 Min—Average
system load over the last 15 minutes. Click the History
Record icon ![]() to view the history graph of the system load over the last 15
minutes.
to view the history graph of the system load over the last 15
minutes.
File System Usage Ratio
The File System Usage Ratio area contains the following fields:
· Name—Mount point of the file system in the SCO UNIX directory structure.
· File System Usage—Space usage of the SCO UNIX file system.
¡ Click
the Set Threshold icon ![]() to set alarm thresholds for the file system usage.
to set alarm thresholds for the file system usage.
¡ Click the History
Record icon ![]() to view the history graph of the file system
usage ratio.
to view the history graph of the file system
usage ratio.
· Used Space—Used space of the file system. Click the History Record icon ![]() to view the history
graph of the used file system space.
to view the history
graph of the used file system space.
· Free Space—Free
space of the partition or logical volume. Click the History Record icon ![]() to view the history
graph of the free file system space.
to view the history
graph of the free file system space.
Zombie Process Number
The Zombie Process Number area contains the following field:
· Zombie Process Number—Number of zombie processes in the last polling interval. Click the History Record icon ![]() to view the history graph of the zombie process number.
to view the history graph of the zombie process number.
Zombie Process
The Zombie Process area contains the following fields:
· Process Name—Name of the zombie process in the last polling interval. Zombie processes in SCO UNIX do not have process names.
· Process ID—Unique identifier of the zombie process on the OS.
· Parent ID—ID of the parent process for the zombie process.
· CPU Usage—CPU usage of the zombie process in the last polling interval.
¡ Click
the Set Threshold icon ![]() to set alarm thresholds for the CPU usage of the zombie process.
to set alarm thresholds for the CPU usage of the zombie process.
¡ Click
the History Record icon
![]() to view the history graph of the CPU usage.
to view the history graph of the CPU usage.
· CPU Time—Duration that the zombie process occupies the CPU in the last polling interval.
Application Traffic
APM collects SCO UNIX traffic based on the IP address of the host where the application is located.
The Application Traffic area contains the following fields:
· Last Hour's Traffic—Total traffic sent and received by SCO UNIX over the last 1 hour.
· Today's Traffic—Total traffic sent and received by SCO UNIX since 00:00 today.
Network Interface
The Network Interface area contains the following fields:
· Interface Name—Identifier of the network interface card in SCO UNIX.
· Receive Rate—Receive rate of the network interface card in the last polling interval.
Click the Set Threshold icon ![]() to set alarm thresholds for the receive rate of SCO UNIX network interface cards.
to set alarm thresholds for the receive rate of SCO UNIX network interface cards.
· Send Rate—Send rate of the network interface card in the last polling interval.
· Error Packet Receive Rate—Number of inbound erroneous packets per second on the network interface card in the last polling interval.
· Error Packet Send Rate—Number of outbound erroneous packets per second on the network interface card in the last polling interval.
inode
Index nodes (inodes) are required when you create a file or directory in the SCO UNIX file system. If the inodes are used up, you cannot create a file or directory in the file system.
The inode area contains the following fields:
· File System—File system of the SCO UNIX application.
· Total inodes—Total
number of available inodes in the file system in the last polling interval. Click
the History Record icon ![]() to view the history graph of the total number of inodes in the file system.
to view the history graph of the total number of inodes in the file system.
· Free inodes—Number
of inodes that are not used in the file system in the last polling interval. Click
the History Record icon ![]() to view the history graph of the number of idle inodes in the file system.
to view the history graph of the number of idle inodes in the file system.
· Used inodes—Number of inodes that have been used in the file system in the last polling interval. Click the History
Record icon ![]() to view the history graph of the number of used inodes
in the file system.
to view the history graph of the number of used inodes
in the file system.
· Usage—Usage of inodes in the file system in the last polling interval.
¡ Click the Set
Threshold icon ![]() to set alarm thresholds of the inode usage in the file system.
to set alarm thresholds of the inode usage in the file system.
¡ Click
the History Record icon ![]() to view the history graph of the inode usage
in the file system.
to view the history graph of the inode usage
in the file system.
Process
By default, the list does not contain any
processes. To monitor a process on SCO UNIX, click the Configuration
icon ![]() to select the processes to be monitored.
APM collects the index data including CPU usage for the monitored processes when
APM polls applications next time.
to select the processes to be monitored.
APM collects the index data including CPU usage for the monitored processes when
APM polls applications next time.
The Process area contains the following fields:
· Config—Click the Config icon ![]() to select the processes to be monitored
in the monitor list window.
to select the processes to be monitored
in the monitor list window.
· Process Name—Name of the monitored process. APM can respectively collect CPU usage and memory usage for the processes that have the same name but different PIDs.
· Process ID—Unique identifier of the monitored process on the OS.
· Parent ID—ID of the parent process of the monitored process.
· CPU Usage—CPU usage ratio of the monitored process in the last polling interval.
¡ Click
the Set Threshold icon ![]() to set alarm thresholds
of the CPU usage ratio for the monitored process.
to set alarm thresholds
of the CPU usage ratio for the monitored process.
¡ Click the History
Record icon ![]() to view the history
graph of the CPU usage ratio of the monitored process.
to view the history
graph of the CPU usage ratio of the monitored process.
· CPU Time—Duration that the process occupies the CPU in the last polling interval.
Session Information
The Session Information area displays SCO UNIX session login information.
The Session Information area contains the following fields:
· Username—User logging in to the SCO UNIX application in the last polling interval.
· TTY—TTY used by the user.
· Login Time—Time when the user logged in to the SCO UNIX application.
· Login IP—Client IP address used when the user logged in to SCO UNIX.
· Idle—Idle time after the user logged in to the SCO UNIX application.
· Command—Most recently executed command after the user logged in to the SCO UNIX application.
Memory
The Memory area displays memory information for the server where the OS is located. To monitor the memory, make sure the BMC is installed on the server.
The Memory area contains the following fields:
· Component Name—Name of the component.
· Status—State of the component.
Power Supply
The Power Supply area displays power supply information for the server where the OS is located. To monitor the power supply, make sure the BMC is installed on the server.
The Power Supply area contains the following fields:
· Component Name—Name of the component.
· Status—State of the component.
Temperature
The Temperature area displays temperature information for the server where the OS is located. To monitor the temperature, make sure the BMC is installed on the server.
The Temperature area contains the following fields:
· Component Name—Name of the component.
· Status—State of the component.
· Value—Temperature of the component.
Fan
The Fan area displays fan information for the server where the OS is located. To monitor the fans, make sure the BMC is installed on the server.
The Fan area contains the following fields:
· Component Name—Name of the component.
· Status—State of the component.
Board
The Board area displays board information about the server where the OS is located. To monitor the board, make sure the BMC is installed on the server.
The Board area contains the following fields:
· Manufacturer—Manufacturer of the board.
· Product Name—Name and model of the product to which the board applies.
· Production Date—Production date of the board.
· Part Number—Part number of the board.
· Serial Number—Serial number of the board.
· System GUID—GUID of the board.
Chassis
The Chassis area displays chassis information for the server where the OS is located. To monitor the chassis, make sure the BMC is installed on the server.
The Chassis area contains the following fields:
· BMC Version—Version of the BMC.
· IPMI Driver Type—Type of the IPMI driver.
· Self-Check Result—Self-check result of the server.
· Power Supply Status—State of the power supply for the chassis.
· Chassis Intrusion—Whether the chassis is open or has been opened before.
· Front Panel—Whether the front panel is open.
· Cooling Fan Fault—Whether the cooling fans operate correctly.
· Disk Fault—Whether the disks operate correctly.
· Power-On Hours—Hours since the chassis was started.
Solaris
Solaris can be installed on the servers with x86 or SPARC processors. The performance and stability of Solaris greatly affects the performance of applications or services running on it.
Adding a Solaris application monitor
APM monitors Solaris applications through SNMP or CLI. When you add Solaris application monitors, follow these guidelines:
· To monitor Solaris applications through SNMP, enable SNMP on Solaris and obtain read-only and read-write community strings. For information about enabling SNMP on Solaris, see the Solaris online help.
· To monitor Solaris applications through CLI, enable Telnet or SSH on Solaris and obtain the username and password of the Telnet or SSH user who has the Solaris administrator's privileges. For information about enabling Telnet or SSH on Solaris, see the Solaris configuration guide.
· Add Solaris hosts to the IMC platform so that APM can obtain and display network connections of the hosts and their access devices in the application topology. For more information about adding hosts to the IMC platform, see H3C Intelligent Management Center v7.3 Enterprise and Standard Platform Administrator Guide.
· To view traffic statistics in the monitor report of the Solaris application, make sure at least one probe is configured in APM. After a Solaris application monitor is added, APM sends the IP address of the monitored Solaris application to the probes for traffic collection.
To add a Solaris application monitor:
1. Click the Resource tab.
2. Open the Add Application page by using one of the following methods:
¡ From the navigation tree, select Application Manager > Add Application.
¡ From the navigation tree, select Application Manager > Application Monitor. In the application monitor list, click Add.
The Add Application page displays all application types that can be monitored by APM.
3. Click Solaris of the UNIX Server Monitor class.
The page for adding a Solaris application monitor opens.
4. Configure the following parameters:
¡ IP Address—Enter the IP address of the host on which the Solaris application to be monitored is installed. APM automatically checks the IP address and associates the application monitor with the host managed in the IMC platform. If the host is already added to the IMC platform, you can also click Select, and then select the host in the Select Devices window. For information about selecting a host, see "Quick start."
¡ Name—Enter a unique application monitor name. As a best practice, name the application monitor as application type_host IP address.
¡ Use Template—Select Enable or Disable from the list.
¡ Template—Click
the Configure icon ![]() next to the Template field to select an existing template. The Template field
is automatically populated with the name of the selected template. For more
information about configuring application templates, see "Configuration management." This field is displayed only when you select Enable from the Use
Template list.
next to the Template field to select an existing template. The Template field
is automatically populated with the name of the selected template. For more
information about configuring application templates, see "Configuration management." This field is displayed only when you select Enable from the Use
Template list.
¡ Description—Enter a description for the application monitor.
¡ Polling Interval (min)—Select a polling interval for the application monitor. Options are 1, 2, 3, 4, 5, 10, 20, and 30. The default polling interval is 5 minutes. A shorter polling interval improves real-time data accuracy at the expense of system resources. This field is available only when you select Disable from the Use Template list.
¡ Monitor Type—Select the protocol (SSH, Telnet, or SNMP) through which APM monitors the Solaris application, and then click the Configure icon ![]() to configure related parameters. This field is available only when you select Disable from the
Use Template list.
to configure related parameters. This field is available only when you select Disable from the
Use Template list.
When SNMP is selected, configure the following parameters:
- Edit SNMP Parameters—Select this option if you want to manually configure SNMP parameters for APM. Make sure the SNMP settings are the same as those on Solaris.
- Select an Existing Template—Select this option if you want to select an existing SNMP template for APM. For information about setting SNMP parameter templates, see H3C Intelligent Management Center v7.3 Enterprise and Standard Platform Administrator Guide.
- Parameter Type—Select the SNMP parameter type. Options are SNMPv1, SNMPv2c, and SNMPv3 Template. The SNMPv3 Template option is available only when Select an Existing Template is selected.
- Read-Only Community String—Enter the SNMP read-only community string, with which APM can read MIB variables from the Solaris host.
- Read-Write Community String—Enter the read-write SNMP community string, with which APM can read MIB variables from or write MIB variables to the Solaris host.
- Timeout (1-60 seconds)—Enter the maximum time period that APM waits for an SNMP response from Solaris. The value range is 1 to 60 seconds and the default is 4 seconds. If no SNMP response is received from Solaris within the timeout period, APM considers that the interaction has failed.
- Retries (1-20)—Enter how many times APM retries to send SNMP packets to the Solaris host.
When SSH is selected, configure the following parameters:
- Edit SSH Parameters—Select this option if you want to manually configure SSH parameters for APM. Make sure the SSH settings are the same as those on Solaris.
- Select an Existing Template—Select this option if you want to select an existing SSH template for APM. For information about setting SSH parameter templates, see H3C Intelligent Management Center v7.3 Enterprise and Standard Platform Administrator Guide.
- Authentication Mode—Select the authentication mode for SSH users. Options are Password, Private Key, Password + Private Key, Password + Super Password, Private Key + Super Password, and Password + Private Key + Super Password. The following parameters to be configured vary with authentication modes.
- Username—Enter the SSH username. The user must have the Solaris administrator's privileges.
- Password—Enter the password of the SSH user.
- Private Key File—Enter the directory of the SSH private key file or browse to the file.
- Private Key Password—Enter the password to decrypt the SSH private key file.
- Super Password—Enter the super password with which an SSH user can elevate privileges after login.
- Port—Enter the SSH port on Solaris.
- Timeout (1-120 seconds)—Enter the maximum time period that APM waits for an SSH response from Solaris. The value range is 1 to 120 seconds and the default is 10 seconds. If no SSH response is received from Solaris within the timeout time, APM considers that the interaction has failed.
- Retries (1-5)—Enter how many times APM retries to send SSH packets to the Solaris host.
When Telnet is selected, configure the following parameters:
- Edit Telnet Parameters—Select this option if you want to manually configure Telnet parameters for APM. Make sure the Telnet settings are the same as those on Solaris.
- Select an Existing Template—Select this option if you want to select an existing Telnet template for APM. For information about setting Telnet parameter templates, see H3C Intelligent Management Center v7.3 Enterprise and Standard Platform Administrator Guide.
- Authentication Mode—Select the authentication mode for Telnet users. Options are Password (No Operator or Super/Manager), Username + Password, Super/Manager Password, Password + Super/Manager Password (No Operator), Username + Password + Super/Manager Password, No Username + No Password, and Username + No Password. The following parameters to be configured vary with authentication modes.
- Username—Enter the Telnet username. The user must have the Solaris administrator's privilege.
- Password—Enter the password of the Telnet user.
- Super Password—Enter the super password with which a Telnet user can elevate privileges after login.
- Timeout (1-60 seconds)—Enter the maximum time period that APM waits for a Telnet response from Solaris. The value range is 1 to 60 seconds and the default is 4 seconds. If no Telnet response is received from Solaris within the timeout time, APM considers that the interaction has failed.
¡ Contact—Enter user contact information, such as the name, email address, and telephone number. The default is the username of the operator who created the application monitor.
¡ Use IPMI—Select Enable or Disable from the list. If you select Enable, configure the following parameters:
- Host IP—Enter the IP address of the BMC for IPMI monitoring.
- Username/Password—Enter the username and password of the BMC for IPMI monitoring.
¡ APM Server—Select an APM server to monitor the application. The options are in server-address (application-type:n/N) format. The letter n indicates the number of Solaris applications monitored on the APM server. The letter N indicates the total number of applications monitored on the APM server. Server address 127.0.0.1 indicates that APM and the IMC platform are deployed on the same server.
¡ Related Applications—Click Add next to this field. On the Select Application window, enter a partial or complete name to filter applications, select the applications that Solaris depends on, and then click OK.
Operating system applications cannot be selected. Operators can view all dependencies of the application in the dependency topology.
¡ Application Group—Specify an application group for the Solaris application.
- To specify an existing application group, click Add, select an application group, and then click OK.
- To specify a new application group, click Add Application Group, configure the application group settings, and then click OK.
¡ Detect Application—Select this parameter if you want to enable application detection. APM verifies the application connectivity by using the previous parameter settings, and adds the application monitor only when it can connect to the application. If you do not select this parameter, APM adds the application monitor without verifying the application connectivity.
5. Click OK.
Modifying a Solaris application monitor
Authorized users can modify all parameters except the IP address and the APM server for a Solaris application monitor. When the IP address of a monitored Solaris host changes, operators must add a new application monitor for the host. The new application monitor cannot inherit the history data from the previous application monitor.
To modify a Solaris application monitor:
1. Click the Resource tab.
2. From the navigation tree, select Application Manager > Application Monitor.
The application monitor list page opens.
3. Click the Modify
icon ![]() for the Solaris application monitor
you want to modify.
for the Solaris application monitor
you want to modify.
The page for modifying the Solaris application monitor opens.
4. Modify the parameters as needed, except the IP address and the APM server.
For more information about parameter settings, see "Adding a Solaris application monitor."
5. Click OK.
Viewing the Solaris application monitor report
After a Solaris monitor is added, APM collects index data of the application, and calculates its availability and health status. You can obtain monitor indexes for Solaris by viewing the monitor report.
To access the Solaris application monitor report:
1. Click the Resource tab.
2. From the navigation tree, select Application Manager > Application Monitor.
The application monitor list page displays all application monitors.
3. Click the name of a Solaris application monitor to display the report.
Figure 55 shows part of a Solaris monitor report.
Figure 55 Part of a Solaris application monitor report
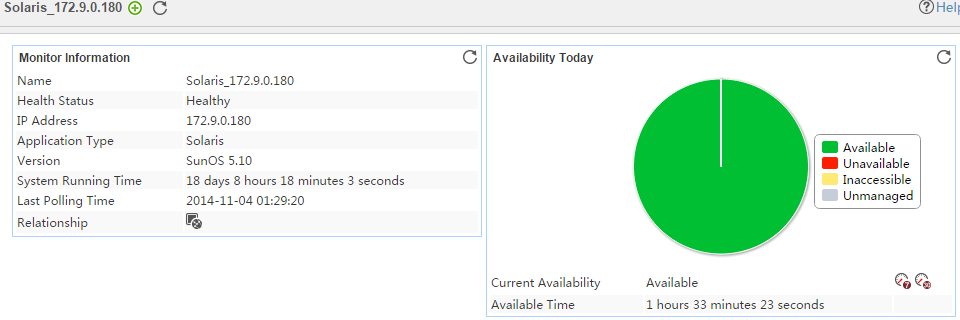
Monitor Information
The Monitor Information area contains the following fields:
· Name—Application monitor name.
· Health Status—Health status of the monitored Solaris application.
· IP Address—IP address of the Solaris host.
· Application Type—Type of the monitored application, which is always Solaris.
· Version—Version of the Solaris operating system.
· System Running Time—Duration since the startup of the Solaris application to the time when APM last polled the Solaris application.
· Last Polling Time—Time when APM last polled the Solaris application.
· Relationship—Click the Relationship icon ![]() to view
dependencies between the Solaris application and other applications in a dependency topology view. For
more information about dependency topologies, see "Topology and application group management."
to view
dependencies between the Solaris application and other applications in a dependency topology view. For
more information about dependency topologies, see "Topology and application group management."
· Top5 Unrecovered Alarms—Latest five unrecovered alarms on the Solaris host. If no alarm is generated by Solaris, this field is not displayed.
Availability Today
The Availability Today area contains the following fields:
· Current Availability—Availability of the Solaris application in the last polling interval.
¡ Click the Weekly History icon ![]() to view the availability of the Solaris
application in the last 7 days.
to view the availability of the Solaris
application in the last 7 days.
¡ Click the Monthly
History icon ![]() to view the availability of the Solaris application in the last 30 days.
to view the availability of the Solaris application in the last 30 days.
· Available Time—Total amount of time that the Solaris application was available after 00:00 today.
· Unavailable Time—Total amount of time that the Solaris application was unavailable after 00:00 today.
· Inaccessible Time—Total amount of time that the Solaris application was inaccessible after 00:00 today.
· Unmanaged Time—Total amount of time that the Solaris application was unmanaged after 00:00 today.
The statistics collection started when the application monitor was added. An availability time field is not displayed if its value is 0.
CPU Usage Ratio
The CPU Usage Ratio area contains the following field:
· CPU Usage Ratio—CPU usage ratio of the Solaris application in the last APM polling interval.
¡ Click
the Set Threshold icon ![]() to set alarm thresholds for the CPU usage.
to set alarm thresholds for the CPU usage.
¡ Click the History Record icon ![]() to view the history
graph of the CPU usage.
to view the history
graph of the CPU usage.
Memory Usage Ratio
The Memory Usage Ratio area displays information about physical memory and swap memory.
The Memory Usage Ratio area contains the following fields:
· Physical Memory—Physical memory of the Solaris application, which corresponds to the physical memory bar.
· Swap—Swap memory of the Solaris application, which corresponds to a disk space.
· Total—Total amount of the physical or swap memory.
· In Use—Size of the physical or swap memory that is being used. Click the History Record icon ![]() to view the history
graph of the physical or swap memory that is being used.
to view the history
graph of the physical or swap memory that is being used.
· Usage Ratio—Physical or swap memory usage ratio. The usage ratio is calculated by using the formula: Usage ratio = Memory in use/Total memory x 100%.
¡ Click
the Set Threshold icon ![]() to set alarm thresholds for the physical or
swap memory.
to set alarm thresholds for the physical or
swap memory.
¡ Click the History
Record icon ![]() to view the history graph of the physical or
swap memory usage.
to view the history graph of the physical or
swap memory usage.
Ping Test
When the polling interval expires, APM pings the Solaris host by sending up to three ICMP packets. If APM receives a response packet, the ping succeeds and APM records the response time. If APM does not receive a response after sending out three ICMP packets, APM considers that the ping test has failed.
The Ping Test area contains the following fields:
· Response Time—Round trip response time of the Solaris application in the last
ping operation. Click the History Record icon ![]() to view the history graph of the response
time.
to view the history graph of the response
time.
· Packets Sent—Number of ICMP packets that APM sent in the last ping operation. The maximum value is 3. Click the History Record icon ![]() to view the history
graph of the sent packets.
to view the history
graph of the sent packets.
· Packets Received—Number
of ICMP response packets that APM received in the last ping operation. The
value is 0 or 1. Click the History Record icon ![]() to view the history
graph of the received packets.
to view the history
graph of the received packets.
System Load
APM analyzes and displays the system load average for the monitored Solaris application in 1 minute, 5 minutes, and 15 minutes. System load average is the average number of processes running on the Solaris system during a specific time period. Excessive system load can cause performance problems. The thresholds of system load vary by CPU type.
The System Load area contains the following fields:
· System Load/Min—Average
system load over the last 1 minute. Click the History
Record icon ![]() to view the history
graph of the average system load in 1 minute.
to view the history
graph of the average system load in 1 minute.
· System Load/5 Min—Average
system load over the last 5 minutes. Click the History
Record icon ![]() to view the history
graph of the average system load in 5 minutes.
to view the history
graph of the average system load in 5 minutes.
· System Load/15 Min—Average
system load over the last 15 minutes. Click the History
Record icon ![]() to view the history
graph of the average system load in 15 minutes.
to view the history
graph of the average system load in 15 minutes.
File System Usage Ratio
The Solaris file directory structure contains one root directory and multiple subdirectories. File systems are mounted to the root directory or subdirectories under the root directory. Each file system corresponds to a physical disk partition or logical volume. The Solaris application writes data to or reads data from the physical disk partition or logical volume by using the corresponding directory.
The File System Usage Ratio area contains the following fields:
· Name—Mount point of the file system in the Solaris directory structure.
· File System Usage Ratio—Space usage ratio of the Solaris file system.
¡ Click
the Set Threshold icon ![]() to set alarm thresholds for the file system usage.
to set alarm thresholds for the file system usage.
¡ Click the History
Record icon ![]() to view the history graph of the file system
usage ratio.
to view the history graph of the file system
usage ratio.
· In Use—Used space of the file system. Click the History
Record icon ![]() to view the history graph of the used file
system space.
to view the history graph of the used file
system space.
· Free Space—Free
space of the file system partition or logical volume. Click
the History Record icon ![]() to view the history
graph of the free file system space.
to view the history
graph of the free file system space.
Zombie Process Number
The Zombie Process Number area contains the following field:
· Zombie Process Number—Number of zombie processes in the last polling interval. Click the History Record icon ![]() to view the history graph of the zombie process number.
to view the history graph of the zombie process number.
Zombie Process
The Zombie Process area contains the following fields:
· Process Name—Name of the zombie process in the last polling interval.
· ID—ID of the zombie process in the last polling interval.
· Parent ID—ID of the parent process for the zombie process in the last polling interval.
· CPU Usage—CPU usage of the zombie process in the last polling interval.
¡ Click
the Set Threshold icon ![]() to set alarm thresholds for the CPU usage of the zombie process.
to set alarm thresholds for the CPU usage of the zombie process.
¡ Click
the History Record icon
![]() to view the history graph of the CPU usage of the zombie process.
to view the history graph of the CPU usage of the zombie process.
· Memory Usage—Memory usage of the zombie process in the last polling interval. Click
the History Record icon
![]() to view the history graph of the memory usage of the zombie
process.
to view the history graph of the memory usage of the zombie
process.
· CPU Time—Duration that the zombie process occupies the CPU in the last polling interval.
Application Traffic
The Application Traffic area contains the following fields:
· Last Hour's Traffic—Total traffic sent and received by Solaris over the last 1 hour.
· Today's Traffic—Total traffic sent and received by Solaris since 00:00 today.
Network Interface
The Network Interface area contains the following fields:
· Interface Name—Identifier of the network interface card in Solaris. APM monitors both physical and virtual (logical) network interface cards.
· Receive Rate—Receive rate of the network interface card in the last polling interval.
Click the Set Threshold icon ![]() to set alarm thresholds for the receive rate of Solaris network
interface cards.
to set alarm thresholds for the receive rate of Solaris network
interface cards.
· Send Rate—Send rate of the network interface card in the last APM polling interval.
· Input Error Packet Rate—Number of inbound erroneous packets per second on the network interface card in the last polling interval
· Output Error Packet Rate—Number of outbound erroneous packets per second on the network interface card in the last polling interval.
Session Information
The Session Information area displays Solaris session login information.
The Session Information area contains the following fields:
· User Name—User logging in to Solaris in the last interval.
· TTY—TTY used by the user.
· Login IP—Client IP address used when the user logged in to Solaris.
· Login Time—Time when the user logged in to Solaris.
· Idle—Idle time after the user logged in to Solaris.
· Command—Most recently executed command after the user logged in to Solaris.
Process
By default, the list does not contain any
processes. To monitor processes on Solaris, click the Configuration
icon ![]() to select the processes to be monitored.
APM collects the index data for the monitored processes when APM polls applications
next time, including the CPU usage ratio and memory usage ratio.
to select the processes to be monitored.
APM collects the index data for the monitored processes when APM polls applications
next time, including the CPU usage ratio and memory usage ratio.
The Process area contains the following fields:
· Config—Click the Config icon ![]() to select the processes to be
monitored in the monitor list window.
to select the processes to be
monitored in the monitor list window.
· Process Name—Name of the monitored process. APM can separately collect index data for the processes that have the same name but different Process Identifiers (PIDs).
· ID—Unique identifier of the process on the OS.
· Parent ID—ID of the parent process of the process.
· CPU Usage—CPU usage ratio of the monitored process in the last polling interval.
¡ Click
the Threshold setting icon ![]() to set alarm thresholds
of the CPU usage ratio for the monitored process.
to set alarm thresholds
of the CPU usage ratio for the monitored process.
¡ Click the History
Record icon ![]() to view the history
graph of the CPU usage ratio of the monitored process.
to view the history
graph of the CPU usage ratio of the monitored process.
· Memory Usage—Memory usage ratio
of the monitored process in the last APM polling interval.
Click the History Record icon ![]() to view the history graph of the memory usage ratio of the monitored process.
to view the history graph of the memory usage ratio of the monitored process.
· CPU Time—Duration that the process occupies the CPU in the last polling interval.
I/O State
APM can monitor the I/O status of the disk drivers in the Solaris system.
The I/O State area contains the following fields:
· Device Name—Name of the disk drivers in the Solaris system.
· I/O Read Rate—Size of the output data in the disk driver per second in the last polling interval.
· I/O Write Rate—Size of the input data in the disk driver per second in the last polling interval.
Memory
The Memory area displays memory information for the server where the OS is located. To monitor the memory, make sure the BMC is installed on the server.
The Memory area contains the following fields:
· Component Name—Name of the component.
· Status—State of the component.
Power Supply
The Power Supply area displays power supply information for the server where the OS is located. To monitor the power supply, make sure the BMC is installed on the server.
The Power Supply area contains the following fields:
· Component Name—Name of the component.
· Status—State of the component.
Temperature
The Temperature area displays temperature information for the server where the OS is located. To monitor the temperature, make sure the BMC is installed on the server.
The Temperature area contains the following fields:
· Component Name—Name of the component.
· Status—State of the component.
· Value—Temperature of the component.
Fan
The Fan area displays fan information for the server where the OS is located. To monitor the fans, make sure the BMC is installed on the server.
The Fan area contains the following fields:
· Component Name—Name of the component.
· Status—State of the component.
Board
The Board area displays board information about the server where the OS is located. To monitor the board, make sure the BMC is installed on the server.
The Board area contains the following fields:
· Manufacturer—Manufacturer of the board.
· Product Name—Name and model of the product to which the board applies.
· Production Date—Production date of the board.
· Part Number—Part number of the board.
· Serial Number—Serial number of the board.
· System GUID—GUID of the board.
Chassis
The Chassis area displays chassis information for the server where the OS is located. To monitor the chassis, make sure the BMC is installed on the server.
The Chassis area contains the following fields:
· BMC Version—Version of the BMC.
· IPMI Driver Type—Type of the IPMI driver.
· Self-Check Result—Self-check result of the server.
· Power Supply Status—State of the power supply for the chassis.
· Chassis Intrusion—Whether the chassis is open or has been opened before.
· Front Panel—Whether the front panel is open.
· Cooling Fan Fault—Whether the cooling fans operate correctly.
· Disk Fault—Whether the disks operate correctly.
· Power-On Hours—Hours since the chassis was started.
FreeBSD
FreeBSD's performance and stability can greatly affect the performance of applications or services running on it.
Adding a FreeBSD application monitor
APM monitors FreeBSD applications through CLI. When you add FreeBSD application monitors, follow these guidelines:
· Enable Telnet or SSH on FreeBSD. For more information enabling Telnet or SSH on FreeBSD, see the FreeBSD configuration guide.
· Obtain the username and password of the Telnet or SSH user who has the FreeBSD administrator's privileges
· Add FreeBSD hosts to the IMC platform so that APM can obtain and display network connections of the hosts and their access devices in the application topology. For more information about adding hosts to the IMC platform, see H3C Intelligent Management Center v7.3 Enterprise and Standard Platform Administrator Guide.
· To view traffic statistics in the monitor report of the FreeBSD application, make sure at least one probe is configured in APM. After a FreeBSD application monitor is added, APM sends the IP address of the monitored FreeBSD application to the probes for traffic collection.
To add a FreeBSD application monitor:
1. Click the Resource tab.
2. Open the Add Application page by using one of the following methods:
¡ From the navigation tree, select Application Manager > Add Application.
¡ From the navigation tree, select Application Manager > Application Monitor. In the application monitor list, click Add.
The Add Application page displays all application types that can be monitored by APM.
3. Click FreeBSD of the UNIX Server Monitor class.
The page for adding a FreeBSD application monitor opens.
4. Configure the following parameters:
¡ IP Address—Enter the IP address of the host on which the FreeBSD application to be monitored is installed. APM automatically checks the IP address and associates the application monitor with the host managed in the IMC platform. If the host is already added to the IMC platform, you can also click Select, and then select the host in the Select Devices window. For information about selecting a host, see "Quick start."
¡ Name—Enter a unique application monitor name. As a best practice, name the application monitor as application type_host IP address.
¡ Use Template—Select Enable or Disable from the list.
¡ Template—Click the Configure icon
![]() next to the Template field
to select an existing template. The Template field is automatically
populated with the name of the selected template. For more information about
configuring application templates, see "Configuration management." This field is displayed only when you select Enable from the Use
Template list.
next to the Template field
to select an existing template. The Template field is automatically
populated with the name of the selected template. For more information about
configuring application templates, see "Configuration management." This field is displayed only when you select Enable from the Use
Template list.
¡ Description—Enter a description for the application monitor to aid maintenance.
¡ Polling Interval (min)—Select a polling interval for the application monitor. Options are 1, 2, 3, 4, 5, 10, 20, and 30. The default polling interval is 5 minutes. A shorter polling interval improves real-time data accuracy at the expense of system resources. This field is available only when you select Disable from the Use Template list.
¡ Monitor Type—Select the protocol (SSH or Telnet) through which APM monitors the FreeBSD
application, and then click the Configure icon ![]() to
configure related parameters. This
field is available only when you select Disable from the Use Template
list.
to
configure related parameters. This
field is available only when you select Disable from the Use Template
list.
When SSH is selected, configure the following parameters:
- Edit SSH Parameters—Select this option if you want to manually configure SSH parameters for APM. Make sure the SSH settings are the same as those on FreeBSD.
- Select an Existing Template—Select this option if you want to select an existing SSH template for APM. For information about setting SSH parameter templates, see H3C Intelligent Management Center v7.3 Enterprise and Standard Platform Administrator Guide.
- Authentication Mode—Select the authentication mode for SSH users. Options are Password, Private Key, Password + Private Key, Password + Super Password, Private Key + Super Password, and Password + Private Key + Super Password. The following parameters to be configured vary with authentication modes.
- Username—Enter the SSH username. The user must have the FreeBSD administrator's privilege.
- Password—Enter the password of the SSH user.
- Private Key File—Enter the directory of the SSH private key file or browse to the file.
- Private Key Password—Enter the password to decrypt the SSH private key file.
- Super Password—Enter the super password with which an SSH user can elevate privileges after login.
- Port—Enter the SSH port on FreeBSD.
- Timeout (1-120 seconds)—Enter the maximum time period that APM waits for an SSH response from FreeBSD. The value range is 1 to 120 seconds and the default is 10 seconds. If no SSH response is received from FreeBSD within the timeout time, APM considers that the interaction has failed.
- Retries (1-5)—Enter how many times APM retries to send SSH packets to the FreeBSD host.
When Telnet is selected, configure the following parameters:
- Edit Telnet Parameters—Select this option if you want to manually configure Telnet parameters for APM. Make sure the Telnet settings are the same as those on FreeBSD.
- Select an Existing Template—Select this option if you want to select an existing Telnet template for APM. For information about setting Telnet parameter templates, see H3C Intelligent Management Center v7.3 Enterprise and Standard Platform Administrator Guide.
- Authentication Mode—Select the authentication mode for Telnet users. Options are Password (No Operator or Super/Manager), Username + Password, Super/Manager Password, Password + Super/Manager Password (No Operator), Username + Password + Super/Manager Password, No Username + No Password, and Username + No Password. The following parameters to be configured vary with authentication modes.
- Username—Enter the Telnet username. The user must have the FreeBSD administrator's privilege.
- Password—Enter the password of the Telnet user.
- Super Password—Enter the super password with which a Telnet user can elevate privileges after login.
- Timeout (1-60 seconds)—Enter the maximum time period that APM waits for a Telnet response from FreeBSD. The value range is 1 to 60 seconds and the default is 4 seconds. If no Telnet response is received from FreeBSD within the timeout time, APM considers that the interaction has failed.
¡ Contact—Enter user contact information, such as the name, email address, and telephone number. The default is the username of the operator who created the application monitor.
¡ Use IPMI—Select Enable or Disable from the list. If you select Enable, configure the following parameters:
- Host IP—Enter the IP address of the BMC for IPMI monitoring.
- Username/Password—Enter the username and password of the BMC for IPMI monitoring.
¡ APM Server—Select an APM server to monitor the application. The options are in server-address (application-type:n/N) format. The letter n indicates the number of FreeBSD applications monitored on the APM server. The letter N indicates the total number of applications monitored on the APM server. Server address 127.0.0.1 indicates that APM and the IMC platform are deployed on the same server.
¡ Related Applications—Click Add next to this field. On the Select Application window, enter a partial or complete name to filter applications, select the applications that FreeBSD depends on, and then click OK.
Operating system applications cannot be selected. Operators can view all dependencies of the application in the dependency topology.
¡ Application Group—Specify an application group for the FreeBSD application.
- To specify an existing application group, click Add, select an application group, and then click OK.
- To specify a new application group, click Add Application Group, configure the application group settings, and then click OK.
¡ Detect Application—Select this parameter if you want to enable application detection. APM verifies the application connectivity by using the previous parameter settings, and adds the application monitor only when it can connect to the application. If you do not select this parameter, APM adds the application monitor without verifying the application connectivity.
5. Click OK.
Modifying a FreeBSD application monitor
Authorized users can modify all parameters except the IP address and the APM server for a FreeBSD application monitor. When the IP address of a monitored FreeBSD host changes, operators must add a new application monitor for the host. The new application monitor cannot inherit the history data from the previous application monitor.
To modify a FreeBSD application monitor:
1. Click the Resource tab.
2. From the navigation tree, select Application Manager > Application Monitor.
The application monitor list page opens.
3. Click the Modify
icon ![]() for the FreeBSD application monitor you want to modify.
for the FreeBSD application monitor you want to modify.
The page for modifying the FreeBSD application monitor opens.
4. Modify the parameters as needed, except the IP address and the APM server.
For more information about parameter settings, see "Adding a FreeBSD application monitor."
5. Click OK.
Viewing the FreeBSD application monitor report
After a FreeBSD application monitor is added, APM collects index data of the application, and calculates its availability and health status. You can obtain monitor indexes for FreeBSD by viewing the monitor report.
To access the FreeBSD application monitor report:
1. Click the Resource tab.
2. From the navigation tree, select Application Manager > Application Monitor.
The application monitor list page displays all application monitors.
3. Click the name of a FreeBSD application monitor to display the report.
Figure 56 shows part of a FreeBSD monitor report.
Figure 56 Part of a FreeBSD application monitor report
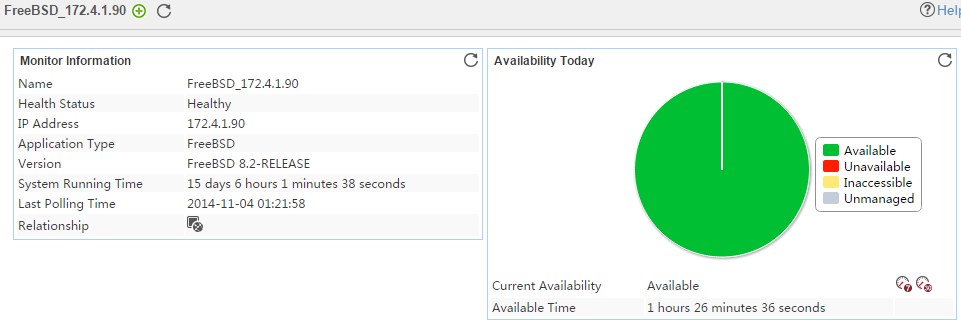
Monitor Information
The Monitor Information area contains the following fields:
· Name—Application monitor name.
· Health Status—Health status of the monitored FreeBSD application.
· IP Address—IP address of the FreeBSD host.
· Application Type—Type of the monitored application, which is always FreeBSD.
· Version—Version of the FreeBSD operating system.
· System Running Time—Duration since the startup of the FreeBSD application to the time when APM last polled the FreeBSD application.
· Last Polling Time—Time when APM last polled the FreeBSD application.
· Relationship—Click the Relationship icon ![]() to view
dependencies between the FreeBSD application and other applications in a dependency topology view. For
more information about dependency topologies, see "Topology and application group management."
to view
dependencies between the FreeBSD application and other applications in a dependency topology view. For
more information about dependency topologies, see "Topology and application group management."
· Top5 Unrecovered Alarms—Latest five unrecovered alarms on the FreeBSD host. If no alarm is generated by FreeBSD, this field is not displayed.
Availability Today
The Availability Today area contains the following fields:
· Current Availability—Availability of the FreeBSD application in the last polling interval.
¡ Click
the Weekly History icon ![]() to view the availability of the FreeBSD application in the last 7 days.
to view the availability of the FreeBSD application in the last 7 days.
¡ Click
the Monthly History icon ![]() to view the availability of the FreeBSD application in the last 30 days.
to view the availability of the FreeBSD application in the last 30 days.
· Available Time—Total amount of time that the FreeBSD application was available after 00:00 today.
· Unavailable Time—Total amount of time that the FreeBSD application was unavailable after 00:00 today.
· Inaccessible Time—Total amount of time that the FreeBSD application was inaccessible after 00:00 today.
· Unmanaged Time—Total amount of time that the FreeBSD application was unmanaged after 00:00 today.
The statistics collection started when the application monitor was added. An availability time field is not displayed if its value is 0.
CPU Usage Ratio
The CPU Usage Ratio area contains the following field:
· CPU Usage Ratio—CPU usage ratio of the FreeBSD application in the last APM polling interval.
¡ Click
the Set Threshold icon ![]() to set alarm thresholds for the CPU usage.
to set alarm thresholds for the CPU usage.
¡ Click the History
Record icon ![]() to view the history graph of the CPU usage.
to view the history graph of the CPU usage.
Memory Usage Ratio
The Memory Usage Ratio area displays information about physical memory and swap memory.
The Memory Usage Ratio area contains the following fields:
· Physical Memory—Physical memory of the FreeBSD application, which corresponds to the physical memory bar.
· Swap—Swap memory of the FreeBSD application, which corresponds to a disk space.
· Total—Total amount of the physical or swap memory.
· In Use—Size of the physical or swap memory that is being used. Click the History Record icon ![]() to view the history
graph of the physical or swap memory that is being used.
to view the history
graph of the physical or swap memory that is being used.
· Usage Ratio—Physical or swap memory usage ratio. The usage ratio is calculated by using the formula: Usage ratio = Memory in use/Total memory x 100%.
¡ Click
the Set Threshold icon ![]() to set alarm thresholds for the physical or
swap memory.
to set alarm thresholds for the physical or
swap memory.
¡ Click the History Record
icon ![]() to view the history graph of the physical or swap memory usage.
to view the history graph of the physical or swap memory usage.
Ping Test
When the polling interval expires, APM pings the FreeBSD host by sending up to three ICMP packets. If APM receives a response packet, the ping succeeds and APM records the response time. If APM does not receive a response after sending out three ICMP packets, APM considers that the ping test has failed.
The Ping Test area contains the following fields:
· Response Time—Round trip response time of the FreeBSD application in the last
ping operation. Click the History
Record icon ![]() to view the history graph of the response
time.
to view the history graph of the response
time.
· Packets Sent—Number of ICMP packets that are sent in the last ping operation. The
maximum value is 3. Click
the History Record icon ![]() to view the history graph of the sent packets.
to view the history graph of the sent packets.
· Packets Received—Number
of ICMP response packets that are received in the last ping operation. The value is 0 or 1. Click the History Record icon ![]() to view the history graph
of the received packets.
to view the history graph
of the received packets.
System Load
APM analyzes and displays the system load average for the monitored FreeBSD application in 1 minute, 5 minutes, and 15 minutes. System load average is the average number of processes running on the FreeBSD system during a specific time period. Excessive system load can cause performance problems. The thresholds of system load vary by CPU type.
The System Load area contains the following fields:
· System Load/Min—Average
system load over the last 1
minute. Click the History Record icon ![]() to view the history graph of the average system load in 1 minute.
to view the history graph of the average system load in 1 minute.
· System Load/5 Min—Average
system load over the last 5
minutes. Click the History
Record icon ![]() to view the history
graph of the average system load in 5 minutes.
to view the history
graph of the average system load in 5 minutes.
· System Load/15 Min—Average
system load over the last 15
minutes. Click the History
Record icon ![]() to view the history
graph of the average system load in 15 minutes.
to view the history
graph of the average system load in 15 minutes.
File System Usage Ratio
The FreeBSD file directory structure contains one root directory and multiple subdirectories. File systems are mounted to the root directory or subdirectories under the root directory. Each file system corresponds to a physical disk partition or logical volume. The FreeBSD application writes data to or reads data from the physical disk partition or logical volume by using the corresponding directory.
The File System Usage Ratio area contains the following fields:
· Name—Mount point of the file system in the FreeBSD directory structure.
· File System Usage Ratio—Space usage ratio of the FreeBSD file system.
¡ Click
the Set Threshold icon ![]() to set alarm thresholds for the file system usage.
to set alarm thresholds for the file system usage.
¡ Click the History
Record icon ![]() to view the history
graph of the file system usage ratio.
to view the history
graph of the file system usage ratio.
· In Use—Used space of the file system in the last
polling interval. Click the History
Record icon ![]() to view the history
graph of the used file system space.
to view the history
graph of the used file system space.
· Free Space—Free
space of the file system partition or logical volume in the last polling
interval. Click the History Record icon ![]() to view the history graph of the free file
system space.
to view the history graph of the free file
system space.
Zombie Process Number
The Zombie Process Number area contains the following field:
· Zombie Process Number—Number of zombie processes in the last polling interval. Click the History Record
icon ![]() to view the change trend of the zombie process number.
to view the change trend of the zombie process number.
Zombie Process
The Zombie Process area contains the following fields:
· Process Name—Name of the zombie process in the last polling interval.
· ID—ID of the zombie process in the last polling interval.
· Parent ID—ID of the parent process for the zombie process in the last polling interval.
· CPU Usage—CPU usage of the zombie process in the last polling interval.
¡ Click
the Set Threshold icon ![]() to set alarm thresholds for the CPU usage of the zombie process.
to set alarm thresholds for the CPU usage of the zombie process.
¡ Click
the History Record icon
![]() to view the history graph of the CPU usage of the zombie process.
to view the history graph of the CPU usage of the zombie process.
· Memory Usage—Memory usage of the zombie process in the last polling interval. Click
the History Record icon
![]() to view the history graph of the memory usage of the zombie
process.
to view the history graph of the memory usage of the zombie
process.
· CPU Time—Duration that the zombie process occupies the CPU in the last polling interval.
Application Traffic
The Application Traffic area contains the following fields:
· Last Hour's Traffic—Total traffic sent and received by FreeBSD over the last 1 hour.
· Today's Traffic—Total traffic sent and received by FreeBSD since 00:00 today.
Network Interface
The Network Interface area contains the following fields:
· Interface Name—Identifier of the network interface card in FreeBSD. APM monitors both physical and virtual (logical) network interface cards.
· Receive Rate—Receive rate of the network interface card in the last polling interval.
Click the Set Threshold icon ![]() to set alarm thresholds for the receive rate of FreeBSD network
interface cards.
to set alarm thresholds for the receive rate of FreeBSD network
interface cards.
· Send Rate—Send rate of a network interface card in the last polling interval.
· Input Error Packet Rate—Number of inbound erroneous packets per second on the network interface card in the last polling interval.
· Output Error Packet Rate—Number of outbound erroneous packets per second on the network interface card in the last polling interval.
inode
Index nodes (inodes) are required when you create a file or directory in the FreeBSD file system. If the inodes are used up, you cannot create a file or directory in the file system.
The inode area contains the following fields:
· File System—File system on the FreeBSD server.
· Total—Total number of available inodes in the file system in the last polling interval. Click the History
Record icon ![]() to view the history graph of the total number of inodes
in the file system.
to view the history graph of the total number of inodes
in the file system.
· Free—Number of inodes that are not used in the file system in the last polling interval. Click the History
Record icon ![]() to view the history graph of the number of idle inodes
in the file system.
to view the history graph of the number of idle inodes
in the file system.
· In Use—Number of inodes that have been used in the file system in the last polling interval. Click the History
Record icon ![]() to view the history graph of the number of used inodes
in the file system.
to view the history graph of the number of used inodes
in the file system.
· inode Usage Ratio—Usage of inodes in the file system in the last polling interval.
¡ Click the Set
Threshold icon ![]() to set alarm thresholds of the inode usage in the file system.
to set alarm thresholds of the inode usage in the file system.
¡ Click
the History Record icon ![]() to view the history graph of inode usage in the file system.
to view the history graph of inode usage in the file system.
Process
By default, the list does not contain any
processes. To monitor a process on FreeBSD, click the Configuration
icon ![]() to select the processes to be monitored.
APM collects the index data for the monitored processes when APM polls applications
next time, including the CPU usage ratio and memory usage ratio.
to select the processes to be monitored.
APM collects the index data for the monitored processes when APM polls applications
next time, including the CPU usage ratio and memory usage ratio.
The Process area contains the following fields:
· Config—Click the Config icon ![]() to select the processes to be monitored
in the monitor list window.
to select the processes to be monitored
in the monitor list window.
· Process—Name of the monitored process. APM can respectively collect monitored data for the processes that have the same name but different Process Identifiers (PIDs).
· ID—Unique identifier of the process on the OS.
· Parent ID—ID of the parent process of the process.
· CPU Usage—CPU usage ratio of the monitored process in the last polling interval.
¡ Click
the Threshold setting icon ![]() to set alarm thresholds
of the CPU usage ratio for the monitored process.
to set alarm thresholds
of the CPU usage ratio for the monitored process.
¡ Click the History
Record icon ![]() to view the history graph of the CPU usage ratio of the monitored process.
to view the history graph of the CPU usage ratio of the monitored process.
· Memory Usage—Memory usage ratio
of the monitored process in the last polling interval. Click the History
Record icon ![]() to view the history graph of the memory usage ratio of the monitored process.
to view the history graph of the memory usage ratio of the monitored process.
· CPU Time—Duration that the process occupies the CPU in the last polling interval.
I/O State
APM can monitor the I/O status of the disk drivers in the FreeBSD system.
The I/O State area contains the following fields:
· Device Name—Name of the disk drivers in the FreeBSD system.
· I/O Read Rate—Size of the output data in the disk driver per second in the last polling interval.
· I/O Write Rate—Size of the input data in the disk driver per second in the last polling interval.
Session Information
The Session Information area displays FreeBSD session login information.
The Session Information area contains the following fields:
· User Name—User logging in to FreeBSD in the last polling interval.
· TTY—TTY used by the user.
· Login IP—Client IP address used when the user logged in to FreeBSD.
· Login Time—Time when the user logged in to FreeBSD.
· Idle—Idle time after the user logged in to FreeBSD.
· Command—Most recently executed command after the user logged in to FreeBSD.
Memory
The Memory area displays memory information for the server where the OS is located. To monitor the memory, make sure the BMC is installed on the server.
The Memory area contains the following fields:
· Component Name—Name of the component.
· Status—State of the component.
Power Supply
The Power Supply area displays power supply information for the server where the OS is located. To monitor the power supply, make sure the BMC is installed on the server.
The Power Supply area contains the following fields:
· Component Name—Name of the component.
· Status—State of the component.
Temperature
The Temperature area displays temperature information for the server where the OS is located. To monitor the temperature, make sure the BMC is installed on the server.
The Temperature area contains the following fields:
· Component Name—Name of the component.
· Status—State of the component.
· Value—Temperature of the component.
Fan
The Fan area displays fan information for the server where the OS is located. To monitor the fans, make sure the BMC is installed on the server.
The Fan area contains the following fields:
· Component Name—Name of the component.
· Status—State of the component.
Board
The Board area displays board information about the server where the OS is located. To monitor the board, make sure the BMC is installed on the server.
The Board area contains the following fields:
· Manufacturer—Manufacturer of the board.
· Product Name—Name and model of the product to which the board applies.
· Production Date—Production date of the board.
· Part Number—Part number of the board.
· Serial Number—Serial number of the board.
· System GUID—GUID of the board.
Chassis
The Chassis area displays chassis information for the server where the OS is located. To monitor the chassis, make sure the BMC is installed on the server.
The Chassis area contains the following fields:
· BMC Version—Version of the BMC.
· IPMI Driver Type—Type of the IPMI driver.
· Self-Check Result—Self-check result of the server.
· Power Supply Status—State of the power supply for the chassis.
· Chassis Intrusion—Whether the chassis is open or has been opened before.
· Front Panel—Whether the front panel is open.
· Cooling Fan Fault—Whether the cooling fans operate correctly.
· Disk Fault—Whether the disks operate correctly.
· Power-On Hours—Hours since the chassis was started.
Mac OS
The performance and stability of Apple's Mac OS can greatly affect the performance of applications or services running on it.
Adding a Mac OS application monitor
APM monitors Mac OS applications through SNMP or CLI. When you add Mac OS application monitors, follow these guidelines:
· To monitor the Mac OS application through SNMP, enable SNMP on Mac OS and obtain read-only and read-write community strings. For information about enabling SNMP on Mac OS, see the Mac OS online help.
· To monitor the Mac OS application through CLI, enable Telnet or SSH on Mac OS and obtain the username and password of the Telnet or SSH user who has the Mac OS administrator's privileges. For information about enabling Telnet or SSH on Mac OS, see the Mac OS configuration guide.
· Add Mac OS hosts to the IMC platform so that APM can obtain and display network connections of the hosts and their access devices in the application topology. For more information about adding hosts to the IMC platform, see H3C Intelligent Management Center v7.3 Enterprise and Standard Platform Administrator Guide.
· To view traffic statistics in the monitor report of the Mac OS application, make sure at least one probe is configured in APM. After a Mac OS application monitor is added, APM sends the IP address of the monitored Mac OS application to the probes for traffic collection.
To add a Mac OS application monitor:
1. Click the Resource tab.
2. Open the Add Application page by using one of the following methods:
¡ From the navigation tree, select Application Manager > Add Application.
The page displays all application types that can be monitored by APM.
¡ From the navigation tree, select Application Manager > Application Monitor, and then click Add on the application monitor list page.
3. Click Mac OS of the UNIX Server Monitor class.
The page for adding a Mac OS application monitor opens.
4. Configure the following parameters:
¡ IP Address—Enter the IP address of the host on which the Mac OS application to be monitored is installed. APM automatically checks the specified IP address and associates the application monitor with the host managed in the IMC platform. If the host is already added to the IMC platform, you can also click Select, and then select the host in the Select Devices window. For information about selecting a host, see "Quick start."
¡ Name—Enter a unique application monitor name. As a best practice, name the application monitor as application type_host IP address.
¡ Use Template—Select Enable or Disable from the list.
¡ Template—Click
the Configure icon ![]() next to the Template field to select an existing template. The Template field
is automatically populated with the name of the selected template. For more
information about configuring application templates, see "Configuration management." This field is displayed only when you select Enable from the Use
Template list.
next to the Template field to select an existing template. The Template field
is automatically populated with the name of the selected template. For more
information about configuring application templates, see "Configuration management." This field is displayed only when you select Enable from the Use
Template list.
¡ Description—Enter a description for the application monitor to aid maintenance.
¡ Polling Interval (min)—Select a polling interval for the application monitor. Options are 1, 2, 3, 4, 5, 10, 20, and 30. The default polling interval is 5 minutes. A shorter polling interval provides more accurate realtime data, but consumes more system resources. This field is available only when you select Disable from the Use Template list.
¡ Monitor Type—Select the protocol (SSH, Telnet, or SNMP) through which APM monitors the Mac OS application, and then click the Configure icon ![]() to configure related parameters. This field is available only when you select Disable from the
Use Template list.
to configure related parameters. This field is available only when you select Disable from the
Use Template list.
When SNMP is selected, configure the following parameters:
- Edit SNMP Parameters—Select this option if you want to manually configure SNMP parameters for APM. Make sure the SNMP settings are the same as those on Mac OS.
- Select an Existing Template—Select this option if you want to select an existing SNMP template for APM. For information about setting SNMP parameter templates, see H3C Intelligent Management Center v7.3 Enterprise and Standard Platform Administrator Guide.
- Parameter Type—Select the SNMP parameter type. Options are SNMPv1, SNMPv2c, and SNMPv3 Template. The SNMPv3 Template option is available only when Select an Existing Template is selected.
- Read-Only Community String—Enter the SNMP read-only community string, with which APM can read MIB variables from the Mac OS host.
- Read-Write Community String—Enter the read-write SNMP community string, with which APM can read MIB variables from or write MIB variables to the Mac OS host.
- Timeout (1-60 seconds)—Enter the maximum time period that APM waits for an SNMP response from Mac OS. The value range is 1 to 60 seconds and the default is 4 seconds. If no SNMP response is received from Mac OS within the timeout time, APM considers that the interaction has failed.
- Retries (1-20)—Enter how many times APM retries to send SNMP packets to the Mac OS host.
When SSH is selected, configure the following parameters:
- Edit SSH Parameters—Select this option if you want to manually configure SSH parameters for APM. Make sure the SSH settings are the same as those on Mac OS.
- Select an Existing Template—Select this option if you want to select an existing SSH template for APM. For information about setting SSH parameter templates, see H3C Intelligent Management Center v7.3 Enterprise and Standard Platform Administrator Guide.
- Authentication Mode—Select the authentication mode for SSH users. Options are Password, Private Key, Password + Private Key, Password + Super Password, Private Key + Super Password, and Password + Private Key + Super Password. The following parameters to be configured vary with authentication modes.
- Username—Enter the SSH username. The user must have the Mac OS administrator's privilege.
- Password—Enter the password of the SSH user.
- Private Key File—Enter the directory of the SSH private key file or browse to the file.
- Private Key Password—Enter the password to decrypt the SSH private key file.
- Super Password—Enter the super password with which an SSH user can elevate privileges after login.
- Port—Enter the SSH port on Mac OS.
- Timeout (1-120 seconds)—Enter the maximum time period that APM waits for an SSH response from Mac OS. The value range is 1 to 120 seconds and the default is 10 seconds. If no SSH response is received from Mac OS within the timeout time, APM considers that the interaction has failed.
- Retries (1-5)—Enter how many times APM retries to send SSH packets to the Mac OS host.
When Telnet is selected, configure the following parameters:
- Edit Telnet Parameters—Select this option if you want to manually configure Telnet parameters for APM. Make sure the Telnet settings are the same as those on Mac OS.
- Select an Existing Template—Select this option if you want to select an existing Telnet template for APM. For information about setting Telnet parameter templates, see H3C Intelligent Management Center v7.3 Enterprise and Standard Platform Administrator Guide.
- Authentication Mode—Select the authentication mode for Telnet users. Options are Password (No Operator or Super/Manager), Username + Password, Super/Manager Password, Password + Super/Manager Password (No Operator), Username + Password + Super/Manager Password, No Username + No Password, and Username + No Password. The following parameters to be configured vary with authentication modes.
- Username—Enter the Telnet username. The user must have the Mac OS administrator's privilege.
- Password—Enter the password of the Telnet user.
- Super Password—Enter the super password with which a Telnet user can elevate privileges after login.
- Timeout (1-60 seconds)—Enter the maximum time period that APM waits for a Telnet response from Mac OS. The value range is 1 to 60 seconds and the default is 4 seconds. If no Telnet response is received from Mac OS within the timeout time, APM considers that the interaction has failed.
¡ Contact—Enter user contact information, such as the name, email address, and telephone number. The default is the username of the operator who created the application monitor.
¡ Use IPMI—Select Enable or Disable from the list. If you select Enable, configure the following parameters:
- Host IP—Enter the IP address of the BMC for IPMI monitoring.
- Username/Password—Enter the username and password of the BMC for IPMI monitoring.
¡ APM Server—Select an APM server to monitor the application. The options are in server-address (application-type:n/N) format. The letter n indicates the number of Mac OS applications monitored on the APM server. The letter N indicates the total number of applications monitored on the APM server. Server address 127.0.0.1 indicates that APM and the IMC platform are deployed on the same server.
¡ Related Applications—Click Add next to this field. On the Select Application window, enter a partial or complete name to filter applications, select the applications that Mac OS depends on, and then click OK.
Operating system applications cannot be selected. Operators can view all dependencies of the application in the dependency topology.
¡ Application Group—Specify an application group for the Mac OS application.
- To specify an existing application group, click Add, select an application group, and then click OK.
- To specify a new application group, click Add Application Group, configure the application group settings, and then click OK.
¡ Detect Application—Select this parameter if you want to enable application detection. Application detection enables APM to verify connection to the application by using the previous parameter settings, and to determine whether to add the application monitor based on the verification result. APM adds the application monitor only when it can connect to the application. When this parameter is not selected, APM adds the application monitor without verifying the connection.
5. Click OK.
Modifying a Mac OS application monitor
Authorized users can modify all parameters except the IP address and the APM server for a Mac OS application monitor. When the IP address of a monitored Mac OS host changes, operators must add a new application monitor for the host. The new application monitor cannot inherit the history data from the previous application monitor.
To modify a Mac OS application monitor:
1. Click the Resource tab.
2. From the navigation tree, select Application Manager > Application Monitor.
The application monitor list page opens.
3. Click the Modify
icon ![]() for the Mac OS application monitor
you want to modify.
for the Mac OS application monitor
you want to modify.
The page for modifying the Mac OS application monitor opens.
4. Modify the parameters as needed, except the IP address and the APM server.
For more information about parameter settings, see "Adding a Mac OS application monitor."
5. Click OK.
Viewing the Mac OS application monitor report
After a Mac OS application monitor is added, APM collects index data of the application, and calculates its availability and health status. You can obtain monitor indexes for Mac OS by viewing the monitor report.
To access the Mac OS application monitor report:
1. Click the Resource tab.
2. From the navigation tree, select Application Manager > Application Monitor.
The application monitor list page displays all application monitors.
3. Click the name of a Mac OS application monitor to display the report.
Figure 57 shows part of a Mac OS monitor report.
Figure 57 Part of a Mac OS application monitor report

Monitor Information
The Monitor Information area contains the following fields:
· Name—Application monitor name.
· Health Status—Health status of the monitored Mac OS application.
· IP Address—IP address of the Mac OS host.
· Application Type—Type of the monitored application, which is always Mac OS.
· Version—Version of the Mac OS application.
· System Running Time—Duration since the startup of the Mac OS application to the time when APM last polled the Mac OS application.
· Last Polling Time—Time when APM last polled the Mac OS application.
· Relationship—Click the Relationship icon ![]() to view
dependencies between the Mac OS application and other applications in a dependency topology view. For
more information about dependency topologies, see "Topology and application group management."
to view
dependencies between the Mac OS application and other applications in a dependency topology view. For
more information about dependency topologies, see "Topology and application group management."
· Top5 Unrecovered Alarms—Latest five unrecovered alarms on the Mac OS host. If no alarm is generated by Mac OS, this field is not displayed.
Availability Today
The Availability Today area contains the following fields:
· Current Availability—Availability of the Mac OS application in the last polling interval.
¡ Click
the Weekly History icon ![]() to view the availability of the Mac OS application in the last 7 days.
to view the availability of the Mac OS application in the last 7 days.
¡ Click
the Monthly History icon ![]() to view the availability of the Mac OS application in the last 30 days.
to view the availability of the Mac OS application in the last 30 days.
· Available Time—Total amount of time that the Mac OS application was available after 00:00 today.
· Unavailable Time—Total amount of time that the Mac OS application was unavailable after 00:00 today.
· Inaccessible Time—Total amount of time that the Mac OS application was inaccessible after 00:00 today.
· Unmanaged Time—Total amount of time that the Mac OS application was unmanaged after 00:00 today.
The statistics collection started when the application monitor was added. An availability time field is not displayed if its value is 0.
CPU Usage Ratio
The CPU Usage Ratio area contains the following field:
· CPU Usage Ratio—CPU usage ratio of the Mac OS application in the last APM polling interval.
¡ Click
the Set Threshold icon ![]() to set alarm thresholds for the CPU usage.
to set alarm thresholds for the CPU usage.
¡ Click the History
Record icon ![]() to view the history graph of the CPU usage.
to view the history graph of the CPU usage.
Memory Usage Ratio
The Memory Usage Ratio area displays information about physical memory and swap memory.
The Memory Usage Ratio area contains the following fields:
· Physical Memory—Physical memory of the Mac OS application, which corresponds to the physical memory bar.
· Swap—Swap memory of the Mac OS application, which corresponds to a disk space.
· Total—Total amount of the physical or swap memory.
· In Use—Size of the physical or swap memory that is being used. Click the History Record icon ![]() to view the history
graph of the physical or swap memory that is being used.
to view the history
graph of the physical or swap memory that is being used.
· Usage Ratio—Physical or swap memory usage ratio. The usage ratio is calculated by using the formula: Usage ratio = Memory in use/Total memory x 100%.
¡ Click
the Set Threshold icon ![]() to set alarm thresholds for the physical or
swap memory.
to set alarm thresholds for the physical or
swap memory.
¡ Click the History
Record icon ![]() to view the history graph of the physical or
swap memory usage.
to view the history graph of the physical or
swap memory usage.
Ping Test
When the polling interval expires, APM pings the Mac OS host by sending up to three ICMP packets. If APM receives a response packet, the ping succeeds and APM records the response time. If APM does not receive a response after sending out three ICMP packets, APM considers that the ping test has failed.
The Ping Test area contains the following fields:
· Response Time—Round trip response time of the Mac OS application in the last ping
operation. Click the History
Record icon ![]() to view the history graph of the response
time.
to view the history graph of the response
time.
· Packets Sent—Number of ICMP packets that are sent in the last ping operation. The
maximum value is 3. Click
the History Record icon ![]() to view the history graph of the sent packets.
to view the history graph of the sent packets.
· Packets Received—Number
of ICMP response packets that are received in the last ping operation. The value is 0 or 1. Click the History Record icon ![]() to view the history
graph of the received packets.
to view the history
graph of the received packets.
System Load
APM analyzes and displays the system load average for the monitored Mac OS application in 1 minute, 5 minutes, and 15 minutes. System load average is the average number of processes running on the Mac OS system during a specific time period. Excessive system load can cause performance problems. The thresholds of system load vary by CPU type.
The System Load area contains the following fields:
· System Load/Min—Average
system load over the last 1
minute. Click the History Record icon ![]() to view the history graph of the average system load in 1 minute.
to view the history graph of the average system load in 1 minute.
· System Load/5 Min—Average
system load over the last 5
minutes. Click the History
Record icon ![]() to view the history
graph of the average system load in 5 minutes.
to view the history
graph of the average system load in 5 minutes.
· System Load/15 Min—Average
system load over the last 15
minutes. Click the History
Record icon ![]() to view the history
graph of the average system load in 15 minutes.
to view the history
graph of the average system load in 15 minutes.
File System Usage Ratio
The Mac OS file directory structure contains one root directory and multiple subdirectories. File systems are mounted to the root directory or subdirectories under the root directory. Each file system corresponds to a physical disk partition or logical volume. The Mac OS application writes data to or reads data from the physical disk partition or logical volume by using the corresponding directory.
The File System Usage Ratio area contains the following fields:
· Name—Mount point of the file system in the Mac OS directory structure.
· File System Usage Ratio—Space usage ratio of the file system.
¡ Click
the Set Threshold icon ![]() to set alarm thresholds for the file system usage.
to set alarm thresholds for the file system usage.
¡ Click the History
Record icon ![]() to view the history
graph of the file system usage ratio.
to view the history
graph of the file system usage ratio.
· In Use—Used space of the file system. Click the History
Record icon ![]() to view the history graph of the used file system
space.
to view the history graph of the used file system
space.
· Free Space—Free
space of the file system partition or logical volume. Click
the History Record icon ![]() to view the history
graph of the free file system space.
to view the history
graph of the free file system space.
Zombie Process Number
The Zombie Process Number area contains the following field:
· Zombie Process Number—Number of zombie processes in the last polling interval. Click the History
Record icon ![]() to view the change
trend of the zombie process number.
to view the change
trend of the zombie process number.
Zombie Process
The Zombie Process area contains the following fields:
· Process Name—Name of the zombie process in the last polling interval.
· ID—ID of the zombie process in the last polling interval.
· Parent ID—ID of the parent process for the zombie process in the last polling interval.
· CPU Usage—CPU usage of the zombie process in the last polling interval.
¡ Click
the Set Threshold icon ![]() to set alarm thresholds for the CPU usage of the zombie process.
to set alarm thresholds for the CPU usage of the zombie process.
¡ Click
the History Record icon
![]() to view the history graph of the CPU usage of the zombie process.
to view the history graph of the CPU usage of the zombie process.
· Memory Usage—Memory usage of the zombie process in the last polling interval. Click
the History Record icon
![]() to view the history graph of the memory usage of the zombie
process.
to view the history graph of the memory usage of the zombie
process.
· CPU Time—Duration that the zombie process occupies the CPU in the last polling interval.
Application Traffic
The Application Traffic area contains the following fields:
· Last Hour's Traffic—Total traffic sent and received by Mac OS over the last 1 hour.
· Today's Traffic—Total traffic sent and received by Mac OS since 00:00 today.
Network Interface
The Network Interface area contains the following fields:
· Interface Name—Identifier of the network interface card in Mac OS. APM monitors both physical and virtual (logical) network interface cards.
· Receive Rate—Receive rate of the network interface card in the last polling interval.
Click the Set Threshold icon ![]() to set alarm thresholds for the receive rate of Mac OS network
interface cards.
to set alarm thresholds for the receive rate of Mac OS network
interface cards.
· Send Rate—Send rate of the network interface card in the last polling interval.
· Input Error Packet Rate—Number of inbound erroneous packets per second on the network interface card in the last polling interval.
· Output Error Packet Rate—Number of outbound erroneous packets per second on the network interface card in the last polling interval.
inode
Index nodes (inodes) are required when you create a file or directory in the Mac OS file system. If inodes are used up, you cannot create a file or directory in the file system.
The inode area contains the following fields:
· File System—File system on the Mac OS server.
· Total—Total number of available inodes in the file system in the last polling interval. Click the History
Record icon ![]() to view the history graph of the total number of inodes
in the file system.
to view the history graph of the total number of inodes
in the file system.
· Free—Number of inodes that are not used in the file system in the last polling interval. Click the History
Record icon ![]() to view the history graph of the number of idle inodes
in the file system.
to view the history graph of the number of idle inodes
in the file system.
· In Use—Number of inodes that have been used in the file system in the last polling interval. Click the History
Record icon ![]() to view the history graph of the number of used inodes
in the file system.
to view the history graph of the number of used inodes
in the file system.
· inode Usage Ratio—Usage of inodes in the file system in the last polling interval.
¡ Click the Set
Threshold icon ![]() to set alarm thresholds of the inode usage in the file system.
to set alarm thresholds of the inode usage in the file system.
¡ Click
the History Record icon ![]() to view the history graph of inode usage in the file system.
to view the history graph of inode usage in the file system.
Process
By default, the list does not contain any
processes. To monitor a process on Mac OS, click the Configuration
icon ![]() to select the processes to be monitored.
APM collects the index data for the monitored processes when APM polls applications
next time, including the CPU usage ratio and memory usage ratio.
to select the processes to be monitored.
APM collects the index data for the monitored processes when APM polls applications
next time, including the CPU usage ratio and memory usage ratio.
The Process area contains the following fields:
· Config—Click the Config icon ![]() to select the processes to be monitored
in the monitor list window.
to select the processes to be monitored
in the monitor list window.
· Process—Name of the monitored process. APM can separately collect monitored data for the processes that have the same name but different Process Identifiers (PIDs).
· ID—Unique identifier of the process on the OS.
· Parent ID—ID of the parent process of the process.
· CPU Usage—CPU usage ratio of the monitored process in the last polling interval.
¡ Click
the Threshold setting icon ![]() to set alarm thresholds
of the CPU usage ratio for the monitored process.
to set alarm thresholds
of the CPU usage ratio for the monitored process.
¡ Click the History
Record icon ![]() to view the history graph of the CPU usage ratio of the monitored process.
to view the history graph of the CPU usage ratio of the monitored process.
· Memory Usage—Memory usage ratio
of the monitored process in the last polling interval.
Click the History Record icon ![]() to view the history graph of the memory usage ratio of the monitored process.
to view the history graph of the memory usage ratio of the monitored process.
· CPU Time—Duration that the process occupies the CPU in the last polling interval.
I/O State
APM can monitor the I/O status of the disk drivers in the Mac OS system.
The I/O State area contains the following fields:
· Device Name—Name of the disk driver in the Mac OS system.
· I/O Rate—Size of the input/output data in the disk driver per second in the last polling interval.
· Transfers/Sec—Number of transfer times in the disk driver per second in the last polling interval. A transfer is represented by an I/O request to the physical disk. Multiple logical requests can be integrated into a single I/O request to the disk. The size of the transferred data in each transfer is not fixed.
Session Information
The Session Information area displays Mac OS session login information.
The Session Information area contains the following fields:
· User Name—User logging in to Mac OS in the last polling interval.
· TTY—TTY used by the user.
· Login IP—Client IP address used when the user logged in to Mac OS.
· Login Time—Time when the user logged in to Mac OS.
· Idle—Idle time after the user logged in to Mac OS.
· Command—Most recently executed command after the user logged in to Mac OS.
Memory
The Memory area displays memory information for the server where the OS is located. To monitor the memory, make sure the BMC is installed on the server.
The Memory area contains the following fields:
· Component Name—Name of the component.
· Status—State of the component.
Power Supply
The Power Supply area displays power supply information for the server where the OS is located. To monitor the power supply, make sure the BMC is installed on the server.
The Power Supply area contains the following fields:
· Component Name—Name of the component.
· Status—State of the component.
Temperature
The Temperature area displays temperature information for the server where the OS is located. To monitor the temperature, make sure the BMC is installed on the server.
The Temperature area contains the following fields:
· Component Name—Name of the component.
· Status—State of the component.
· Value—Temperature of the component.
Fan
The Fan area displays fan information for the server where the OS is located. To monitor the fans, make sure the BMC is installed on the server.
The Fan area contains the following fields:
· Component Name—Name of the component.
· Status—State of the component.
Board
The Board area displays board information about the server where the OS is located. To monitor the board, make sure the BMC is installed on the server.
The Board area contains the following fields:
· Manufacturer—Manufacturer of the board.
· Product Name—Name and model of the product to which the board applies.
· Production Date—Production date of the board.
· Part Number—Part number of the board.
· Serial Number—Serial number of the board.
· System GUID—GUID of the board.
Chassis
The Chassis area displays chassis information for the server where the OS is located. To monitor the chassis, make sure the BMC is installed on the server.
The Chassis area contains the following fields:
· BMC Version—Version of the BMC.
· IPMI Driver Type—Type of the IPMI driver.
· Self-Check Result—Self-check result of the server.
· Power Supply Status—State of the power supply for the chassis.
· Chassis Intrusion—Whether the chassis is open or has been opened before.
· Front Panel—Whether the front panel is open.
· Cooling Fan Fault—Whether the cooling fans operate correctly.
· Disk Fault—Whether the disks operate correctly.
· Power-On Hours—Hours since the chassis was started.
OpenBSD
OpenBSD's performance and stability greatly affects the performance of applications running on it.
Adding an OpenBSD application monitor
APM monitors OpenBSD applications through CLI. When you add OpenBSD application monitors, follow these guidelines:
· Enable Telnet or SSH on OpenBSD. For more information about enabling Telnet or SSH on OpenBSD, see the OpenBSD configuration guide.
· Obtain the username and password of the Telnet or SSH user who has the OpenBSD administrator's privileges.
· Add OpenBSD hosts to the IMC platform so that APM can obtain and display network connections of the hosts and their access devices in the application topology. For more information about adding hosts to the IMC platform, see H3C Intelligent Management Center v7.3 Enterprise and Standard Platform Administrator Guide.
· To view traffic statistics in the monitor report of the OpenBSD application, make sure at least one probe is configured in APM. After an OpenBSD application monitor is added, APM sends the IP address of the monitored OpenBSD application to the probes for traffic collection.
To add an OpenBSD application monitor:
1. Click the Resource tab.
2. Open the Add Application page by using one of the following methods:
¡ From the navigation tree, select Application Manager > Add Application.
The page displays all application types that can be monitored by APM.
¡ From the navigation tree, select Application Manager > Application Monitor, and then click Add on the application monitor list page.
3. Click OpenBSD of the UNIX Server Monitor class.
The page for adding an OpenBSD application monitor opens.
4. Configure the following parameters:
¡ IP Address—Enter the IP address of the host on which the OpenBSD application to be monitored is installed. APM automatically checks the specified IP address and associates the application monitor with the host managed in the IMC platform. If the host is already added to the IMC platform, you can also click Select, and then select the host in the Select Devices window. For information about selecting a host, see "Quick start."
¡ Name—Enter a unique application monitor name. As a best practice, name the application monitor as application type_host IP address.
¡ Use Template—Select Enable or Disable from the list.
¡ Template—Click
the Configure icon ![]() next to the Template field to select an existing template. The Template field
is automatically populated with the name of the selected template. For more
information about configuring application templates, see "Configuration management." This field is displayed only when you select Enable from the Use
Template list.
next to the Template field to select an existing template. The Template field
is automatically populated with the name of the selected template. For more
information about configuring application templates, see "Configuration management." This field is displayed only when you select Enable from the Use
Template list.
¡ Description—Enter a description for the application monitor to aid maintenance.
¡ Polling Interval (min)—Select a polling interval for the application monitor. Options are 1, 2, 3, 4, 5, 10, 20, and 30. The default polling interval is 5 minutes. A shorter polling interval provides more accurate realtime data, but consumes more system resources. This field is available only when you select Disable from the Use Template list.
¡ Monitor Type—Select the protocol (SSH or Telnet) through which APM monitors the OpenBSD
application, and then click the Configure icon ![]() to configure
related parameters. This field
is available only when you select Disable from the Use Template list.
to configure
related parameters. This field
is available only when you select Disable from the Use Template list.
When SSH is selected, configure the following parameters:
- Edit SSH Parameters—Select this option if you want to manually configure SSH parameters for APM. Make sure the SSH settings are the same as those on OpenBSD.
- Select an Existing Template—Select this option if you want to select an existing SSH template for APM. For information about setting SSH parameter templates, see H3C Intelligent Management Center v7.3 Enterprise and Standard Platform Administrator Guide.
- Authentication Mode—Select the authentication mode for SSH users. Options are Password, Private Key, Password + Private Key, Password + Super Password, Private Key + Super Password, and Password + Private Key + Super Password. The following parameters to be configured vary with authentication modes.
- Username—Enter the SSH username. The user must have the OpenBSD administrator's privilege.
- Password—Enter the password of the SSH user.
- Private Key File—Enter the directory of the SSH private key file or browse to the file.
- Private Key Password—Enter the password to decrypt the SSH private key file.
- Super Password—Enter the super password with which an SSH user can elevate privileges after login.
- Port—Enter the SSH port on OpenBSD.
- Timeout (1-120 seconds)—Enter the maximum time period that APM waits for an SSH response from OpenBSD. The value range is 1 to 120 seconds and the default is 10 seconds. If no SSH response is received from OpenBSD within the timeout time, APM considers that the interaction has failed.
- Retries (1-5)—Enter how many times APM retries to send SSH packets to the OpenBSD host.
When Telnet is selected, configure the following parameters:
- Edit Telnet Parameters—Select this option if you want to manually configure Telnet parameters for APM. Make sure the Telnet settings are the same as those on OpenBSD.
- Select an Existing Template—Select this option if you want to select an existing Telnet template for APM. For information about setting Telnet parameter templates, see H3C Intelligent Management Center v7.3 Enterprise and Standard Platform Administrator Guide.
- Authentication Mode—Select the authentication mode for Telnet users. Options are Password (No Operator or Super/Manager), Username + Password, Super/Manager Password, Password + Super/Manager Password (No Operator), Username + Password + Super/Manager Password, No Username + No Password, and Username + No Password. The following parameters to be configured vary with authentication modes.
- Username—Enter the Telnet username. The user must have the OpenBSD administrator's privilege.
- Password—Enter the password of the Telnet user.
- Super Password—Enter the super password with which a Telnet user can elevate privileges after login.
- Timeout (1-60 seconds)—Enter the maximum time period that APM waits for a Telnet response from OpenBSD. The value range is 1 to 60 seconds and the default is 4 seconds. If no Telnet response is received from OpenBSD within the timeout time, APM considers that the interaction has failed.
¡ Contact—Enter user contact information, such as the name, email address, and telephone number. The default is the username of the operator who created the application monitor.
¡ Use IPMI—Select Enable or Disable from the list. If you select Enable, configure the following parameters:
- Host IP—Enter the IP address of the BMC for IPMI monitoring.
- Username/Password—Enter the username and password of the BMC for IPMI monitoring.
¡ APM Server—Select an APM server to monitor the application. The options are in server-address (application-type:n/N) format. The letter n indicates the number of OpenBSD applications monitored on the APM server. The letter N indicates the total number of applications monitored on the APM server. Server address 127.0.0.1 indicates that APM and the IMC platform are deployed on the same server.
¡ Related Applications—Click Add next to this field. On the Select Application window, enter a partial or complete name to filter applications, select the applications that OpenBSD depends on, and then click OK.
Operating system applications cannot be selected. Operators can view all dependencies of the application in the dependency topology.
¡ Application Group—Specify an application group for the OpenBSD application.
- To specify an existing application group, click Add, select an application group, and then click OK.
- To specify a new application group, click Add Application Group, configure the application group settings, and then click OK.
¡ Detect Application—Select this parameter if you want to enable application detection. Application detection enables APM to verify connection to the application by using the previous parameter settings, and to determine whether to add the application monitor based on the verification result. APM adds the application monitor only when it can connect to the application. When this parameter is not selected, APM adds the application monitor without verifying the connection.
5. Click OK.
Modifying an OpenBSD application monitor
Authorized users can modify all parameters except the IP address and the APM server for an OpenBSD application monitor. When the IP address of a monitored OpenBSD host changes, operators must add a new application monitor for the host. The new application monitor cannot inherit the history data from the previous application monitor.
To modify an OpenBSD application monitor:
1. Click the Resource tab.
2. From the navigation tree, select Application Manager > Application Monitor.
The application monitor list page opens.
3. Click the Modify
icon ![]() for the OpenBSD application monitor you want to modify.
for the OpenBSD application monitor you want to modify.
The page for modifying the OpenBSD application monitor opens.
4. Modify the parameters as needed, except the IP address and the APM server.
For more information about parameter settings, see "Adding an OpenBSD application monitor."
5. Click OK.
Viewing the OpenBSD application monitor report
After an OpenBSD application monitor is added, APM collects index data of the application, and calculates its availability and health status. You can obtain monitor indexes for OpenBSD by viewing the monitor report.
To access the OpenBSD application monitor report:
1. Click the Resource tab.
2. From the navigation tree, select Application Manager > Application Monitor.
The application monitor list page displays all application monitors.
3. Click the name of an OpenBSD application monitor to display the report.
Figure 58 shows part of an OpenBSD monitor report.
Figure 58 Part of an OpenBSD application monitor report
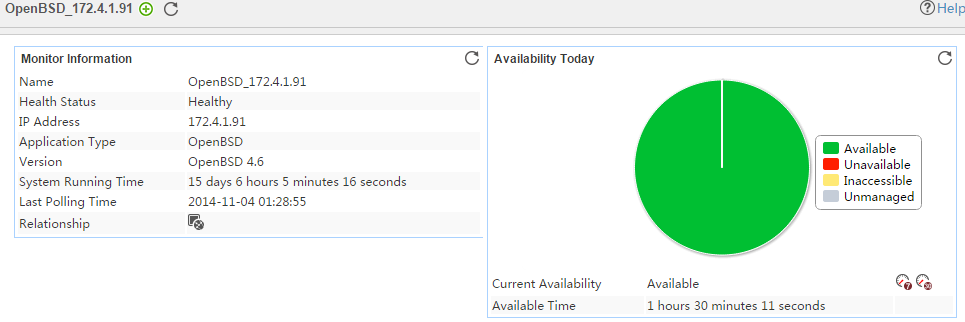
Monitor Information
The Monitor Information area contains the following fields:
· Name—Application monitor name.
· Health Status—Health status of the monitored OpenBSD application.
· IP Address—IP address of the OpenBSD host.
· Application Type—Type of the monitored application, which is always OpenBSD.
· Version—Version of the OpenBSD application.
· System Running Time—Duration since the startup of the OpenBSD application to the time when APM last polled the OpenBSD application.
· Last Polling Time—Time when APM last polled the OpenBSD application.
· Relationship—Click the Relationship icon ![]() to view
dependencies between the OpenBSD application and other applications in a dependency topology view. For
more information about dependency topologies, see "Topology and application group management."
to view
dependencies between the OpenBSD application and other applications in a dependency topology view. For
more information about dependency topologies, see "Topology and application group management."
· Top5 Unrecovered Alarms—Latest five unrecovered alarms on the OpenBSD host. If no alarm is generated by OpenBSD, this field is not displayed.
Availability Today
The Availability Today area contains the following fields:
· Current Availability—Availability of the OpenBSD application in the last polling interval.
¡ Click
the Weekly History icon ![]() to view the availability of the OpenBSD application in the last 7 days.
to view the availability of the OpenBSD application in the last 7 days.
¡ Click
the Monthly History icon ![]() to view the availability of the OpenBSD application in the last 30 days.
to view the availability of the OpenBSD application in the last 30 days.
· Available Time—Total amount of time that the OpenBSD application was available after 00:00 today.
· Unavailable Time—Total amount of time that the OpenBSD application was unavailable after 00:00 today.
· Inaccessible Time—Total amount of time that the OpenBSD application was inaccessible after 00:00 today.
· Unmanaged Time—Total amount of time that the OpenBSD application was unmanaged after 00:00 today.
The statistics collection started when the application monitor was added. An availability time field is not displayed if its value is 0.
CPU Usage Ratio
The CPU Usage Ratio area contains the following field:
· CPU Usage Ratio—CPU usage ratio of the OpenBSD application in the last APM polling interval.
¡ Click
the Set Threshold icon ![]() to set alarm thresholds for the CPU usage.
to set alarm thresholds for the CPU usage.
¡ Click the History
Record icon ![]() to view the history graph of the CPU usage.
to view the history graph of the CPU usage.
Memory Usage Ratio
The Memory Usage Ratio area displays information about physical memory and swap memory.
The Memory Usage Ratio area contains the following fields:
· Physical Memory—Physical memory of the OpenBSD application, which corresponds to the physical memory bar.
· Swap—Swap memory of the OpenBSD application, which corresponds to a disk space.
· Total—Total amount of the physical or swap memory.
· In Use—Size of the physical or swap memory that is being used. Click the History Record icon ![]() to view the history
graph of the physical or swap memory that is being used.
to view the history
graph of the physical or swap memory that is being used.
· Usage Ratio—Physical or swap memory usage ratio. The usage ratio is calculated by using the formula: Usage ratio = Memory in use/Total memory x 100%.
¡ Click
the Set Threshold icon ![]() to set alarm thresholds for the physical or
swap memory.
to set alarm thresholds for the physical or
swap memory.
¡ Click the History
Record icon ![]() to view the history graph of the physical or
swap memory usage.
to view the history graph of the physical or
swap memory usage.
Ping Test
When the polling interval expires, APM pings the OpenBSD host by sending up to three ICMP packets. If APM receives a response packet, the ping succeeds and APM records the response time. If APM does not receive a response after sending out three ICMP packets, APM considers that the ping test has failed.
The Ping Test area contains the following fields:
· Response Time—Round trip response time of the OpenBSD application in the last
ping operation. Click the History
Record icon ![]() to view the history graph of the response
time.
to view the history graph of the response
time.
· Packets Sent—Number of ICMP packets that are sent in the last ping operation. The
maximum value is 3. Click
the History Record icon ![]() to view the history graph of the sent packets.
to view the history graph of the sent packets.
· Packets Received—Number
of ICMP response packets that are received in the last ping operation. The value is 0 or 1. Click the History Record icon ![]() to view the history
graph of the received packets.
to view the history
graph of the received packets.
System Load
APM analyzes and displays the system load average for the monitored OpenBSD application in 1 minute, 5 minutes, and 15 minutes. System load average is the average number of processes running on the OpenBSD system during a specific time period. Excessive system load can cause performance problems. The thresholds of system load vary by CPU type.
The System Load area contains the following fields:
· System Load/Min—Average
system load over the last 1
minute. Click the History Record icon ![]() to view the history graph of the average system load in 1 minute.
to view the history graph of the average system load in 1 minute.
· System Load/5 Min—Average
system load over the last 5
minutes. Click the History
Record icon ![]() to view the history
graph of the average system load in 5 minutes.
to view the history
graph of the average system load in 5 minutes.
· System Load/15 Min—Average
system load over the last 15
minutes. Click the History
Record icon ![]() to view the history
graph of the average system load in 15 minutes.
to view the history
graph of the average system load in 15 minutes.
File System Usage Ratio
The OpenBSD file directory structure contains one root directory and multiple subdirectories. File systems are mounted to the root directory or subdirectories under the root directory. Each file system corresponds to a physical disk partition or logical volume. The OpenBSD application writes data to or reads data from the physical disk partition or logical volume by using the corresponding directory.
The File System Usage Ratio area contains the following fields:
· Name—Mount point of the file system in the OpenBSD directory structure.
· File System Usage Ratio—Space usage ratio of the file system.
¡ Click
the Set Threshold icon ![]() to set alarm thresholds for the file system usage.
to set alarm thresholds for the file system usage.
¡ Click the History
Record icon ![]() to view the history
graph of the file system usage ratio.
to view the history
graph of the file system usage ratio.
· In Use—Used space of the file system. Click the History
Record icon ![]() to view the history graph of the used file
system space.
to view the history graph of the used file
system space.
· Free Space—Free
space of the file system partition or logical volume. Click
the History Record icon ![]() to view the history
graph of the free file system space.
to view the history
graph of the free file system space.
Zombie Process Number
The Zombie Process Number area contains the following field:
· Zombie Process Number—Number of zombie processes in the last polling interval. Click the History
Record icon ![]() to view the change
trend of the zombie process number.
to view the change
trend of the zombie process number.
Zombie Process
The Zombie Process area contains the following fields:
· Process Name—Name of the zombie process in the last polling interval.
· ID—ID of the zombie process in the last polling interval.
· Parent ID—ID of the parent process for the zombie process in the last polling interval.
· CPU Usage—CPU usage of the zombie process in the last polling interval.
¡ Click
the Set Threshold icon ![]() to set alarm thresholds for the CPU usage of the zombie process.
to set alarm thresholds for the CPU usage of the zombie process.
¡ Click
the History Record icon
![]() to view the history graph of the CPU usage of the zombie process.
to view the history graph of the CPU usage of the zombie process.
· Memory Usage—Memory usage of the zombie process in the last polling interval. Click
the History Record icon
![]() to view the history graph of the memory usage of the zombie
process.
to view the history graph of the memory usage of the zombie
process.
· CPU Time—Duration that the zombie process occupies the CPU in the last polling interval.
Application Traffic
The Application Traffic area contains the following fields:
· Last Hour's Traffic—Total traffic sent and received by OpenBSD over the last 1 hour.
· Today's Traffic—Total traffic sent and received by OpenBSD since 00:00 today.
Network Interface
The Network Interface area contains the following fields:
· Interface Name—Identifier of the network interface card in OpenBSD. APM monitors both physical and virtual (logical) network interface cards.
· Receive Rate—Receive rate of the network interface card in the last polling interval.
Click the Set Threshold icon ![]() to set alarm thresholds for the receive rate of OpenBSD network
interface cards.
to set alarm thresholds for the receive rate of OpenBSD network
interface cards.
· Send Rate—Send rate of a network interface card in the last polling interval.
· Input Error Packet Rate—Number of inbound erroneous packets per second on the network interface card in the last polling interval.
· Output Error Packet Rate—Number of outbound erroneous packets per second on the network interface card in the last polling interval.
inode
Index nodes (inodes) are required when you create a file or directory in the OpenBSD file system. If the inodes are used up, you cannot create a file or directory in the file system.
The inode area contains the following fields:
· File System—File system on the OpenBSD server.
· Total—Total number of available inodes in the file system in the last polling interval. Click the History
Record icon ![]() to view the history graph of the total number of inodes
in the file system.
to view the history graph of the total number of inodes
in the file system.
· Free—Number of inodes that are not used in the file system in the last polling interval. Click the History
Record icon ![]() to view the history graph of the number of idle inodes
in the file system.
to view the history graph of the number of idle inodes
in the file system.
· In Use—Number of inodes that have been used in the file system in the last polling interval. Click the History
Record icon ![]() to view the history graph of the number of used inodes
in the file system.
to view the history graph of the number of used inodes
in the file system.
· inode Usage Ratio—Usage of inodes in the file system in the last polling interval.
¡ Click the Set
Threshold icon ![]() to set alarm thresholds of the inode usage in the file system.
to set alarm thresholds of the inode usage in the file system.
¡ Click
the History Record icon ![]() to view the history graph of inode usage in the file system.
to view the history graph of inode usage in the file system.
Process
By default, the list does not contain any
processes. To monitor a process on OpenBSD, click the Configuration
icon ![]() to select the processes to be monitored.
APM collects the index data for the monitored processes when APM polls applications
next time, including the CPU usage ratio and memory usage ratio.
to select the processes to be monitored.
APM collects the index data for the monitored processes when APM polls applications
next time, including the CPU usage ratio and memory usage ratio.
The Process area contains the following fields:
· Config—Click the Config icon ![]() to select the processes to be monitored
in the monitor list window.
to select the processes to be monitored
in the monitor list window.
· Process—Name of the monitored process. APM can respectively collect monitored data for the processes that have the same name but different Process Identifiers (PIDs).
· ID—Unique identifier of the process on the OS.
· Parent ID—ID of the parent process of the process.
· CPU Usage—CPU usage ratio of the monitored process in the last polling interval.
¡ Click
the Threshold setting icon ![]() to set alarm thresholds
of the CPU usage ratio for the monitored process.
to set alarm thresholds
of the CPU usage ratio for the monitored process.
¡ Click the History
Record icon ![]() to view the history graph of the CPU usage ratio of the monitored process.
to view the history graph of the CPU usage ratio of the monitored process.
· Memory Usage—Memory usage ratio
of the monitored process in the last polling interval.
Click the History Record icon ![]() to view the history graph of the memory usage ratio of the monitored process.
to view the history graph of the memory usage ratio of the monitored process.
· CPU Time—Duration that the process occupies the CPU in the last polling interval.
I/O State
APM can monitor the I/O status of the disk drivers in the OpenBSD system.
The I/O State area contains the following fields:
· Device Name—Name of the disk drivers in the OpenBSD system.
· I/O Rate—Size of the input/output data in the disk driver per second in the last polling interval.
· Transfers/Sec—Number of transfer times in the disk driver per second in the last polling interval. A transfer is an I/O request to the physical disk. Multiple logical requests can be integrated into a single I/O request to the disk. The size of the transferred data in each transfer is not fixed.
Session Information
The Session Information area displays OpenBSD session login information.
The Session Information area contains the following fields:
· User Name—User logging in to OpenBSD in the last polling interval.
· TTY—TTY used by the user.
· Login IP—Client IP address used when the user logged in to OpenBSD.
· Login Time—Time when the user logged in to OpenBSD.
· Idle—Idle time after the user logged in to OpenBSD.
· Command—Most recently executed command after the user logged in to OpenBSD.
Memory
The Memory area displays memory information for the server where the OS is located. To monitor the memory, make sure the BMC is installed on the server.
The Memory area contains the following fields:
· Component Name—Name of the component.
· Status—State of the component.
Power Supply
The Power Supply area displays power supply information for the server where the OS is located. To monitor the power supply, make sure the BMC is installed on the server.
The Power Supply area contains the following fields:
· Component Name—Name of the component.
· Status—State of the component.
Temperature
The Temperature area displays temperature information for the server where the OS is located. To monitor the temperature, make sure the BMC is installed on the server.
The Temperature area contains the following fields:
· Component Name—Name of the component.
· Status—State of the component.
· Value—Temperature of the component.
Fan
The Fan area displays fan information for the server where the OS is located. To monitor the fans, make sure the BMC is installed on the server.
The Fan area contains the following fields:
· Component Name—Name of the component.
· Status—State of the component.
Board
The Board area displays board information about the server where the OS is located. To monitor the board, make sure the BMC is installed on the server.
The Board area contains the following fields:
· Manufacturer—Manufacturer of the board.
· Product Name—Name and model of the product to which the board applies.
· Production Date—Production date of the board.
· Part Number—Part number of the board.
· Serial Number—Serial number of the board.
· System GUID—GUID of the board.
Chassis
The Chassis area displays chassis information for the server where the OS is located. To monitor the chassis, make sure the BMC is installed on the server.
The Chassis area contains the following fields:
· BMC Version—Version of the BMC.
· IPMI Driver Type—Type of the IPMI driver.
· Self-Check Result—Self-check result of the server.
· Power Supply Status—State of the power supply for the chassis.
· Chassis Intrusion—Whether the chassis is open or has been opened before.
· Front Panel—Whether the front panel is open.
· Cooling Fan Fault—Whether the cooling fans operate correctly.
· Disk Fault—Whether the disks operate correctly.
· Power-On Hours—Hours since the chassis was started.
HP-UX
HP-UX's performance and stability affects the performance of applications running on it. APM provides the ability to monitor HP-UX 11.00 or later versions of the operating system.
Adding an HP-UX application monitor
APM monitors HP-UX applications through CLI. When you add HP-UX application monitors, follow these guidelines:
· Enable Telnet or SSH on HP-UX. For more information about enabling Telnet or SSH on HP-UX, see the HP-UX configuration guide.
· Obtain the username and password of the Telnet or SSH user who has the HP-UX administrator's privileges.
· Add HP-UX hosts to the IMC platform so that APM can obtain and display network connections of the hosts and their access devices in the application topology. For more information about adding hosts to the IMC platform, see H3C Intelligent Management Center v7.3 Enterprise and Standard Platform Administrator Guide.
· To view traffic statistics in the monitor report of the HP-UX application, make sure at least one probe is configured in APM. After an HP-UX application monitor is added, APM sends the IP address of the monitored HP-UX application to the probes for traffic collection.
To add an HP-UX application monitor:
1. Click the Resource tab.
2. Open the Add Application page by using one of the following methods:
¡ From the navigation tree, select Application Manager > Add Application.
The page displays all application types that can be monitored by APM.
¡ From the navigation tree, select Application Manager > Application Monitor, and then click Add on the application monitor list page.
3. Click HP-UX of the UNIX Server Monitor class.
The page for adding an HP-UX application monitor opens.
4. Configure the following parameters:
¡ IP Address—Enter the IP address of the host on which the HP-UX application to be monitored is installed. APM automatically checks the specified IP address and associates the application monitor with the host managed in the IMC platform. If the host is already added to the IMC platform, you can also click Select, and then select the host in the Select Devices window. For information about selecting a host, see "Quick start."
¡ Name—Enter a unique application monitor name. As a best practice, name the application monitor as application type_host IP address.
¡ Use Template—Select Enable or Disable from the list.
¡ Template—Click
the Configure icon ![]() next to the Template field to select an existing template. The Template field
is automatically populated with the name of the selected template. For more
information about configuring application templates, see "Configuration management." This field is displayed only when you select Enable from the Use
Template list.
next to the Template field to select an existing template. The Template field
is automatically populated with the name of the selected template. For more
information about configuring application templates, see "Configuration management." This field is displayed only when you select Enable from the Use
Template list.
¡ Description—Enter a description for the application monitor to aid maintenance.
¡ Polling Interval (min)—Select a polling interval for the application monitor. Options are 1, 2, 3, 4, 5, 10, 20, and 30. The default polling interval is 5 minutes. A shorter polling interval provides more accurate realtime data, but consumes more system resources. This field is available only when you select Disable from the Use Template list.
¡ Monitor Type—Select the protocol (SSH or Telnet) through which
APM monitors the HP-UX application, and then click the Configure icon ![]() to
configure related parameters. This
field is available only when you select Disable from the Use Template
list.
to
configure related parameters. This
field is available only when you select Disable from the Use Template
list.
When SSH is selected, configure the following parameters:
- Edit SSH Parameters—Select this option if you want to manually configure SSH parameters for APM. Make sure the SSH settings are the same as those on HP-UX.
- Select an Existing Template—Select this option if you want to select an existing SSH template for APM. For information about setting SSH parameter templates, see H3C Intelligent Management Center v7.3 Enterprise and Standard Platform Administrator Guide.
- Authentication Mode—Select the authentication mode for SSH users. Options are Password, Private Key, Password + Private Key, Password + Super Password, Private Key + Super Password, and Password + Private Key + Super Password. The following parameters to be configured vary with authentication modes.
- Username—Enter the SSH username. The user must have the HP-UX administrator's privilege.
- Password—Enter the password of the SSH user.
- Private Key File—Enter the directory of the SSH private key file or browse to the file.
- Private Key Password—Enter the password to decrypt the SSH private key file.
- Super Password—Enter the super password with which an SSH user can elevate privileges after login.
- Port—Enter the SSH port on HP-UX.
- Timeout (1-120 seconds)—Enter the maximum time period that APM waits for an SSH response from HP-UX. The value range is 1 to 120 seconds and the default is 10 seconds. If no SSH response is received from HP-UX within the timeout time, APM considers that the interaction has failed.
- Retries (1-5)—Enter how many times APM retries to send SSH packets to the HP-UX host.
When Telnet is selected, configure the following parameters:
- Edit Telnet Parameters—Select this option if you want to manually configure Telnet parameters for APM. Make sure the Telnet settings are the same as those on HP-UX.
- Select an Existing Template—Select this option if you want to select an existing Telnet template for APM. For information about setting Telnet parameter templates, see H3C Intelligent Management Center v7.3 Enterprise and Standard Platform Administrator Guide.
- Authentication Mode—Select the authentication mode for Telnet users. Options are Password (No Operator or Super/Manager), Username + Password, Super/Manager Password, Password + Super/Manager Password (No Operator), Username + Password + Super/Manager Password, No Username + No Password, and Username + No Password. The following parameters to be configured vary with authentication modes.
- Username—Enter the Telnet username. The user must have the HP-UX administrator's privilege.
- Password—Enter the password of the Telnet user.
- Super Password—Enter the super password with which a Telnet user can elevate privileges after login.
- Timeout (1-60 seconds)—Enter the maximum time period that APM waits for a Telnet response from HP-UX. The value range is 1 to 60 seconds and the default is 4 seconds. If no Telnet response is received from HP-UX within the timeout time, APM considers that the interaction has failed.
¡ Contact—Enter user contact information, such as the name, email address, and telephone number. The default is the username of the operator who created the application monitor.
¡ Use IPMI—Select Enable or Disable from the list. If you select Enable, configure the following parameters:
- Host IP—Enter the IP address of the BMC for IPMI monitoring.
- Username/Password—Enter the username and password of the BMC for IPMI monitoring.
¡ APM Server—Select an APM server to monitor the application. The options are in server-address (application-type:n/N) format. The letter n indicates the number of HP-UX applications monitored on the APM server. The letter N indicates the total number of applications monitored on the APM server. Server address 127.0.0.1 indicates that APM and the IMC platform are deployed on the same server.
¡ Related Applications—Click Add next to this field. On the Select Application window, enter a partial or complete name to filter applications, select the applications that HP-UX depends on, and then click OK.
Operating system applications cannot be selected. Operators can view all dependencies of the application in the dependency topology.
¡ Application Group—Specify an application group for the HP-UX application.
- To specify an existing application group, click Add, select an application group, and then click OK.
- To specify a new application group, click Add Application Group, configure the application group settings, and then click OK.
¡ Detect Application—Select this parameter if you want to enable application detection. Application detection enables APM to verify connection to the application by using the previous parameter settings, and to determine whether to add the application monitor based on the verification result. APM adds the application monitor only when it can connect to the application. When this parameter is not selected, APM adds the application monitor without verifying the connection.
5. Click OK.
Modifying an HP-UX application monitor
Authorized users can modify all parameters except the IP address and the APM server for an HP-UX application monitor. When the IP address of a monitored HP-UX host changes, operators must add a new application monitor for the host. The new application monitor cannot inherit the history data from the previous application monitor.
To modify an HP-UX application monitor:
1. Click the Resource tab.
2. From the navigation tree, select Application Manager > Application Monitor.
The application monitor list page opens.
3. Click the Modify
icon ![]() for the HP-UX application monitor you want to modify.
for the HP-UX application monitor you want to modify.
The page for modifying the HP-UX application monitor opens.
4. Modify the parameters as needed, except the IP address and the APM server.
For more information about parameter settings, see "Adding an HP-UX application monitor."
5. Click OK.
Viewing the HP-UX application monitor report
After an HP-UX application monitor is added, APM collects index data of the application, and calculates its availability and health status. You can obtain monitor indexes for HP-UX by viewing the monitor report.
To access the HP-UX application monitor report:
1. Click the Resource tab.
2. From the navigation tree, select Application Manager > Application Monitor.
The application monitor list page displays all application monitors.
3. Click the name of an HP-UX application monitor to display the report.
Figure 59 shows part of an HP-UX monitor report.
Figure 59 Part of an HP-UX application monitor report
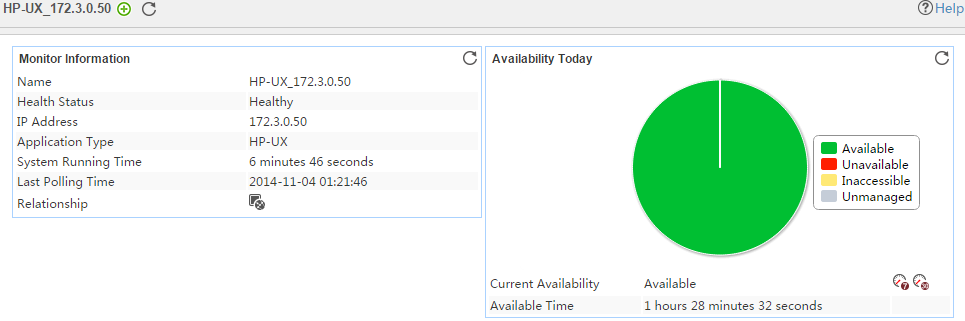
Monitor Information
The Monitor Information area contains the following fields:
· Name—Application monitor name.
· Health Status—Health status of the monitored HP-UX application.
· IP Address—IP address of the HP-UX host.
· Application Type—Type of the monitored application, which is always HP-UX.
· Version—Version of the HP-UX application.
· System Running Time—Duration since the startup of the HP-UX application to the time when APM last polled the HP-UX application.
· Last Polling Time—Time when APM last polled the HP-UX application.
· Relationship—Click the Relationship icon ![]() to view
dependencies between the HP-UX application and other applications in a dependency topology view. For
more information about dependency topologies, see "Topology and application group management."
to view
dependencies between the HP-UX application and other applications in a dependency topology view. For
more information about dependency topologies, see "Topology and application group management."
· Top5 Unrecovered Alarms—Latest five unrecovered alarms on the HP-UX host. If no alarm is generated by HP-UX, this field is not displayed.
Availability Today
The Availability Today area contains the following fields:
· Current Availability—Availability of the HP-UX application in the last polling interval.
¡ Click
the Weekly History icon ![]() to view the availability of the HP-UX application in the last 7 days.
to view the availability of the HP-UX application in the last 7 days.
¡ Click
the Monthly History icon ![]() to view the availability of the HP-UX application in the last 30 days.
to view the availability of the HP-UX application in the last 30 days.
· Available Time—Total amount of time that the HP-UX application was available after 00:00 today.
· Unavailable Time—Total amount of time that the HP-UX application was unavailable after 00:00 today.
· Inaccessible Time—Total amount of time that the HP-UX application was inaccessible after 00:00 today.
· Unmanaged Time—Total amount of time that the HP-UX application was unmanaged after 00:00 today.
The statistics collection started when the application monitor was added. An availability time field is not displayed if its value is 0.
CPU Usage Ratio
The CPU Usage Ratio area contains the following field:
· CPU Usage Ratio—CPU usage ratio of the HP-UX application in the last APM polling interval.
¡ Click
the Set Threshold icon ![]() to set alarm thresholds for the CPU usage.
to set alarm thresholds for the CPU usage.
¡ Click the History
Record icon ![]() to view the history graph of the CPU usage.
to view the history graph of the CPU usage.
Memory Usage Ratio
The Memory Usage Ratio area displays information about physical memory and swap memory.
The Memory Usage Ratio area contains the following fields:
· Physical Memory—Physical memory of the HP-UX application, which corresponds to the physical memory bar.
· Swap—Swap memory of the HP-UX application, which corresponds to a disk space.
· Total—Total amount of the physical or swap memory.
· In Use—Size of the physical or swap memory that is being used. Click the History Record icon ![]() to view the history
graph of the physical or swap memory that is being used.
to view the history
graph of the physical or swap memory that is being used.
· Usage Ratio—Physical or swap memory usage ratio. The usage ratio is calculated by using the formula: Usage ratio = Memory in use/Total memory x 100%.
¡ Click
the Set Threshold icon ![]() to set alarm thresholds for the physical or
swap memory.
to set alarm thresholds for the physical or
swap memory.
¡ Click the History
Record icon ![]() to view the history graph of the physical or
swap memory usage.
to view the history graph of the physical or
swap memory usage.
Ping Test
When the polling interval expires, APM pings the HP-UX host by sending up to three ICMP packets. If APM receives a response packet, the ping succeeds and APM records the response time. If APM does not receive a response after sending out three ICMP packets, APM considers that the ping test has failed.
The Ping Test area contains the following fields:
· Response Time—Round trip response time of the HP-UX application in the last ping
operation. Click the History Record icon ![]() to view the history graph of the response
time.
to view the history graph of the response
time.
· Packets Sent—Number of ICMP packets that are sent in the last ping operation. The
maximum value is 3. Click
the History Record icon ![]() to view the history graph of the sent packets.
to view the history graph of the sent packets.
· Packets Received—Number
of ICMP response packets that are received in the last ping operation. The value is 0 or 1. Click the History Record icon ![]() to view the history
graph of the received packets.
to view the history
graph of the received packets.
System Load
APM analyzes and displays the system load average for the monitored HP-UX application in 1 minute, 5 minutes, and 15 minutes. System load average is the average number of processes running on the HP-UX system during a specific time period. Excessive system load can cause performance problems. The thresholds of system load vary by CPU type.
The System Load area contains the following fields:
· System Load/Min—Average
system load over the last 1
minute. Click the History Record icon ![]() to view the history graph of the average system load in 1 minute.
to view the history graph of the average system load in 1 minute.
· System Load/5 Min—Average
system load over the last 5
minutes. Click the History
Record icon ![]() to view the history
graph of the average system load in 5 minutes.
to view the history
graph of the average system load in 5 minutes.
· System Load/15 Min—Average
system load over the last 15
minutes. Click the History
Record icon ![]() to view the history
graph of the average system load in 15 minutes.
to view the history
graph of the average system load in 15 minutes.
File System Usage Ratio
The HP-UX file directory structure contains one root directory and multiple subdirectories. File systems are mounted to the root directory or subdirectories under the root directory. Each file system corresponds to a physical disk partition or logical volume. The HP-UX application writes data to or reads data from the physical disk partition or logical volume by using the corresponding directory.
The File System Usage Ratio area contains the following fields:
· Name—Mount point of the file system in the HP-UX directory structure.
· File System Usage Ratio—Space usage ratio of the HP-UX file system.
¡ Click
the Set Threshold icon ![]() to set alarm thresholds for the file system usage.
to set alarm thresholds for the file system usage.
¡ Click the History
Record icon ![]() to view the history
graph of the file system usage ratio.
to view the history
graph of the file system usage ratio.
· In Use—Used space of the file system. Click the History
Record icon ![]() to view the history graph of the used file system
space.
to view the history graph of the used file system
space.
· Free Space—Free
space of the file system partition or logical volume. Click
the History Record icon ![]() to view the history
graph of the free file system space.
to view the history
graph of the free file system space.
Zombie Process Number
The Zombie Process Number area contains the following field:
· Zombie Process Number—Number of zombie processes in the last polling interval. Click the History
Record icon ![]() to view the change
trend of the zombie process number.
to view the change
trend of the zombie process number.
Zombie Process
The Zombie Process area contains the following fields:
· Process Name—Name of the zombie process in the last polling interval.
· ID—ID of the zombie process in the last polling interval.
· Parent ID—ID of the parent process for the zombie process in the last polling interval.
· CPU Usage—CPU usage of the zombie process in the last polling interval.
¡ Click
the Set Threshold icon ![]() to set alarm thresholds for the CPU usage of the zombie process.
to set alarm thresholds for the CPU usage of the zombie process.
¡ Click
the History Record icon
![]() to view the history graph of the CPU usage of the zombie process.
to view the history graph of the CPU usage of the zombie process.
· Memory Usage—Memory usage of the zombie process in the last polling interval. Click
the History Record icon
![]() to view the history graph of the memory usage of the zombie
process.
to view the history graph of the memory usage of the zombie
process.
· CPU Time—Duration that the zombie process occupies the CPU in the last polling interval.
Application Traffic
The Application Traffic area contains the following fields:
· Last Hour's Traffic—Total traffic sent and received by HP-UX over the last 1 hour.
· Today's Traffic—Total traffic sent and received by HP-UX since 00:00 today.
Network Interface
The Network Interface area contains the following fields:
· Interface Name—Identifier of the network interface card in HP-UX. APM monitors both physical and virtual (logical) network interface cards.
· Receive Rate—Receive rate of the network interface card in the last polling interval.
Click the Set Threshold icon ![]() to set alarm thresholds for the receive rate of HP-UX network
interface cards.
to set alarm thresholds for the receive rate of HP-UX network
interface cards.
· Send Rate—Send rate of a network interface card in the last polling interval.
Error Log
APM examines the HP-UX error logs during polling and displays the first 10 error logs obtained in the HP-UX application monitor report. Click More to view all error logs if the monitor report has more than 10 error logs.
The Error Log area contains the following fields:
· Time—Time when the error occurred in the last polling interval.
· Log—Content of the error log.
Process
By default, the list does not contain any
processes. To monitor a process on HP-UX, click the Configuration
icon ![]() to select the processes to be monitored.
APM collects the index data for the monitored processes when APM polls applications
next time, including the CPU usage ratio and memory usage ratio.
to select the processes to be monitored.
APM collects the index data for the monitored processes when APM polls applications
next time, including the CPU usage ratio and memory usage ratio.
The Process area contains the following fields:
· Config—Click the Config icon ![]() to select the processes to be monitored
in the monitor list window.
to select the processes to be monitored
in the monitor list window.
· Process—Name of the monitored process. APM can respectively collect monitored data for the processes that have the same name but different Process Identifiers (PIDs).
· ID—Unique identifier of the process on the OS.
· Parent ID—ID of the parent process of the process.
· CPU Usage—CPU usage ratio of the monitored process in the last polling interval.
¡ Click
the Threshold setting icon ![]() to set alarm thresholds
of the CPU usage ratio for the monitored process.
to set alarm thresholds
of the CPU usage ratio for the monitored process.
¡ Click the History
Record icon ![]() to view the history graph of the CPU usage ratio of the monitored process.
to view the history graph of the CPU usage ratio of the monitored process.
· Memory Usage—Memory usage ratio
of the monitored process in the last polling interval.
Click the History Record icon ![]() to view the history graph of the memory usage ratio of the monitored process.
to view the history graph of the memory usage ratio of the monitored process.
· CPU Time—Duration that the process occupies the CPU in the last polling interval.
I/O State
APM can monitor the I/O status of the disk drivers in the HP-UX system.
The I/O State area contains the following fields:
· Device Name—Name of the disk drivers in the HP-UX system.
· I/O Rate—Size of the input/output data in the disk driver per second in the last polling interval.
· Searches/Sec—Number of search times in the disk driver per second in the last polling interval.
Session Information
The Session Information area displays HP-UX session login information.
The Session Information area contains the following fields:
· User Name—User logging in to HP-UX in the last polling interval.
· TTY—TTY used by the user.
· Login IP—Client IP address used when the user logged in to HP-UX.
· Login Time—Time when the user logged in to HP-UX.
· Idle—Idle time after the user logged in to HP-UX.
· Command—Most recently executed command after the user logged in to HP-UX.
inode
Index nodes (inodes) are required when you create a file or directory in the HP-UX file system. If the inodes are used up, you cannot create a file or directory in the file system.
The inode area contains the following fields:
· File System—File system on the HP-UX server.
· Total—Total number of available inodes in the file system in the last polling interval. Click the History
Record icon ![]() to view the history graph of the total number of inodes
in the file system.
to view the history graph of the total number of inodes
in the file system.
· Free—Number of inodes that are not used in the file system in the last polling interval. Click the History
Record icon ![]() to view the history graph of the number of idle inodes
in the file system.
to view the history graph of the number of idle inodes
in the file system.
· In Use—Number of inodes that have been used in the file system in the last polling interval. Click the History
Record icon ![]() to view the history graph of the number of used inodes
in the file system.
to view the history graph of the number of used inodes
in the file system.
· inode Usage Ratio—Usage of inodes in the file system in the last polling interval.
¡ Click the Set
Threshold icon ![]() to set alarm thresholds of the inode usage in the file system.
to set alarm thresholds of the inode usage in the file system.
¡ Click
the History Record icon ![]() to view the history graph of inode usage in the file system.
to view the history graph of inode usage in the file system.
Memory
The Memory area displays memory information for the server where the OS is located. To monitor the memory, make sure the BMC is installed on the server.
The Memory area contains the following fields:
· Component Name—Name of the component.
· Status—State of the component.
Power Supply
The Power Supply area displays power supply information for the server where the OS is located. To monitor the power supply, make sure the BMC is installed on the server.
The Power Supply area contains the following fields:
· Component Name—Name of the component.
· Status—State of the component.
Temperature
The Temperature area displays temperature information for the server where the OS is located. To monitor the temperature, make sure the BMC is installed on the server.
The Temperature area contains the following fields:
· Component Name—Name of the component.
· Status—State of the component.
· Value—Temperature of the component.
Fan
The Fan area displays fan information for the server where the OS is located. To monitor the fans, make sure the BMC is installed on the server.
The Fan area contains the following fields:
· Component Name—Name of the component.
· Status—State of the component.
Board
The Board area displays board information about the server where the OS is located. To monitor the board, make sure the BMC is installed on the server.
The Board area contains the following fields:
· Manufacturer—Manufacturer of the board.
· Product Name—Name and model of the product to which the board applies.
· Production Date—Production date of the board.
· Part Number—Part number of the board.
· Serial Number—Serial number of the board.
· System GUID—GUID of the board.
Chassis
The Chassis area displays chassis information for the server where the OS is located. To monitor the chassis, make sure the BMC is installed on the server.
The Chassis area contains the following fields:
· BMC Version—Version of the BMC.
· IPMI Driver Type—Type of the IPMI driver.
· Self-Check Result—Self-check result of the server.
· Power Supply Status—State of the power supply for the chassis.
· Chassis Intrusion—Whether the chassis is open or has been opened before.
· Front Panel—Whether the front panel is open.
· Cooling Fan Fault—Whether the cooling fans operate correctly.
· Disk Fault—Whether the disks operate correctly.
· Power-On Hours—Hours since the chassis was started.
AS400
AS400 is a small-sized to medium-sized multiuser commercial operating system developed by IBM. Its performance and stability determines the performance of applications running on it. APM provides the ability to monitor the AS400 V6R1M0 version.
Adding an AS400 application monitor
APM monitors AS400 applications through class libraries provided by AS400. When you add an AS400 application monitor, follow these guidelines:
· Contact the AS400 administrator to obtain the username and password of AS400. As a best practice, use an AS400 account with the QSECOFR permission. If you use an AS400 account with the USER permission, make sure the account has the following permissions:
¡ Permission to access the QMPGDATA or QPFRDATA library.
¡ ALLOBJ, SAVSYS, JOBCTL, and SPLCTL permissions.
· Add AS400 servers to the IMC platform so that APM can obtain and display network connections of the servers and their access devices in the application topology. For more information about adding servers to the IMC platform, see H3C Intelligent Management Center v7.3 Enterprise and Standard Platform Administrator Guide.
· To contain traffic statistics in the monitor report about an AS400 application, configure a minimum of one probe in APM. After an AS400 application monitor is added, APM sends the IP address of the monitored AS400 application to the probes for traffic collection.
To add an AS400 application monitor:
1. Click the Resource tab.
2. Open the Add Application page by using one of the following methods:
¡ From the navigation tree, select Application Manager > Add Application.
The page displays all application types that can be monitored by APM.
¡ From the navigation tree, select Application Manager > Application Monitor, and then click Add on the application monitor list page.
3. Click AS400 of the UNIX Server Monitor class.
The page for adding an AS400 application monitor opens.
4. Configure the following parameters:
¡ IP Address—Enter the IP address of the server on which the AS400 application to be monitored is installed. APM automatically checks the specified IP address and associates the application monitor with the server managed in the IMC platform. If the server is already added to the IMC platform, you can also click Select and then select the server in the Select Devices window. For information about selecting a host, see "Quick start."
¡ Name—Enter a unique application monitor name. As a best practice, use the application type_host IP address name format.
¡ Use Template—Select Enable or Disable from the list.
¡ Template—Click
the Configure icon ![]() next to the Template field to select an existing template. The Template field
is automatically populated with the name of the selected template. For more
information about configuring application templates, see "Configuration management." This field is displayed only when you select Enable from the Use
Template list.
next to the Template field to select an existing template. The Template field
is automatically populated with the name of the selected template. For more
information about configuring application templates, see "Configuration management." This field is displayed only when you select Enable from the Use
Template list.
¡ Description—Enter a description for the application monitor.
¡ Polling Interval (min)—Select a polling interval for the application monitor. Options are 1, 2, 3, 4, 5, 10, 20, and 30. The default polling interval is 5 minutes. A shorter polling interval improves real-time data accuracy at the expense of system resources. This field is available only when you select Disable from the Use Template list.
¡ Username/Password—Enter the AS400 username and password.
¡ Contact—Enter user contact information, such as the name, email address, and telephone number. The default is the username of the operator who created the application monitor.
¡ APM Server—Select an APM server to monitor the application. The options are in server-address (application-type:n/N) format. The letter n indicates the number of AS400 applications monitored on the APM server. The letter N indicates the total number of applications monitored on the APM server. Server address 127.0.0.1 indicates that APM and the IMC platform are deployed on the same server.
¡ Related Applications—Click Add next to this field. On the Select Application window, enter a partial or complete name to filter applications, select the applications that AS400 depends on, and then click OK.
Operating system applications cannot be selected. Operators can view all dependencies of the application in the dependency topology.
¡ Application Group—Specify an application group for the AS400 application.
- To specify an existing application group, click Add, select an application group, and then click OK.
- To specify a new application group, click Add Application Group, configure the application group settings, and then click OK.
¡ Detect Application—Select this parameter if you want to enable application detection. Application detection enables APM to verify the connectivity to the application by using the previous parameter settings. APM adds the application monitor only when it can connect to the application. When this parameter is not selected, APM adds the application monitor without verifying the application connectivity.
5. Click OK.
Modifying an AS400 application monitor
Authorized users can modify all parameters except the IP address and the APM server for an AS400 application monitor. When the IP address of a monitored AS400 server changes, operators must add a new application monitor for the server. The new application monitor cannot inherit the history data from the previous application monitor.
To modify an AS400 application monitor:
1. Click the Resource tab.
2. From the navigation tree, select Application Manager > Application Monitor.
The application monitor list page opens.
3. Click the Modify
icon ![]() for the AS400 application monitor you want to modify.
for the AS400 application monitor you want to modify.
The page for modifying the AS400 application monitor opens.
4. Modify the parameters as needed, except the IP address and the APM server.
For more information about parameter settings, see "Adding an AS400 application monitor."
5. Click OK.
Viewing the AS400 application monitor report
After an AS400 application monitor is added, APM collects index data for the application, and calculates its availability and health status. You can obtain monitor indexes for AS400 by viewing the monitor report.
To access the AS400 application monitor report:
1. Click the Resource tab.
2. From the navigation tree, select Application Manager > Application Monitor.
The application monitor list page displays all application monitors.
3. Click the name of an AS400 application monitor to display the report.
Figure 60 shows only a small part of an AS400 monitor report.
Figure 60 Part of an AS400 application monitor report
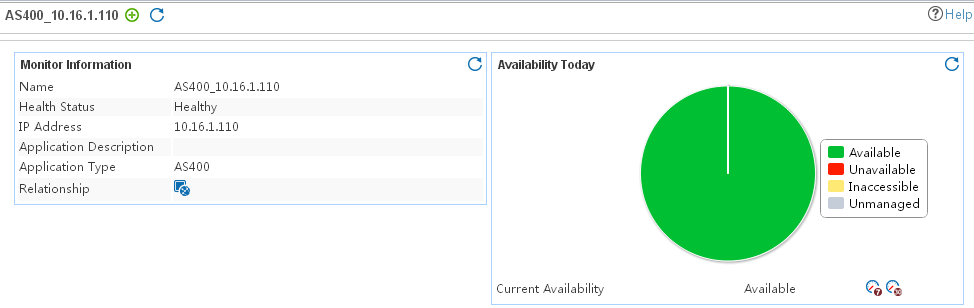
Monitor Information
The Monitor Information area contains the following fields:
· Name—Application monitor name.
· Health Status—Health status of the monitored AS400 application.
· IP Address—IP address of the AS400 server.
· Application Description—Description of the monitored application.
· Application Type—Type of the monitored application, which is always AS400.
· Relationship—Click the Relationship icon ![]() to view
dependencies between the AS400 application and other applications in a dependency topology view. For
more information about dependency topologies, see "Topology and application group management."
to view
dependencies between the AS400 application and other applications in a dependency topology view. For
more information about dependency topologies, see "Topology and application group management."
· Top5 Unrecovered Alarms—Latest five unrecovered alarms on the AS400 server. If AS400 did not generate alarms, this field is not displayed.
Availability Today
The Availability Today area contains the following fields:
· Current Availability—Availability of the AS400 application in the most recent polling interval.
¡ Click
the Weekly History icon ![]() to view the availability of the AS400 application in the most recent 7 days.
to view the availability of the AS400 application in the most recent 7 days.
¡ Click
the Monthly History icon ![]() to view the availability of the AS400 application in the most recent 30 days.
to view the availability of the AS400 application in the most recent 30 days.
· Available Time—Total amount of time that the AS400 application was available after 00:00 today.
· Unavailable Time—Total amount of time that the AS400 application was unavailable after 00:00 today.
· Inaccessible Time—Total amount of time that the AS400 application was inaccessible after 00:00 today.
· Unmanaged Time—Total amount of time that the AS400 application was in unmanaged state after 00:00 today.
The statistics collection started when the application monitor was added. An availability time field is not displayed if its value is 0.
System Status
The System Status area contains the following fields:
· Main Memory—Size of the main memory of AS400.
· Processing Unit Count—Number of AS400 processing units.
· Running Job Count—Total number of AS400 running system jobs.
· Waiting Job Count—Number of jobs that are waiting to run on AS400.
CPU Usage
The CPU Usage area contains the following field:
· CPU Usage Ratio—CPU usage of the AS400 application. Click the History Record icon ![]() to view the history
graph of the CPU usage.
to view the history
graph of the CPU usage.
iASP
The iASP area contains the following field:
· iASP—Independent auxiliary storage pools (iASP) of the AS400 application. Click the History Record icon ![]() to view the history
graph of the iASP.
to view the history
graph of the iASP.
System ASP
The System ASP area contains the following fields:
· System ASP Usage—Ratio of the available disk space size to
the total disk space size in the system. Click the History Record icon ![]() to view the history
graph of the system ASP usage.
to view the history
graph of the system ASP usage.
· System ASP—Available disk space size in the system. Click the History
Record icon ![]() to view the history graph of the system ASP.
to view the history graph of the system ASP.
Subsystem
The Subsystem area contains the following fields:
· Name—Name of the subsystem, which is specified on the Start Subsystem (STRSBS) command.
· Library—Name of the library to which the subsystem belongs.
· Current Active Jobs—Number of active jobs in the subsystem. Multiple interactive jobs started from the same work station are counted as only one job.
· Maximum Active Jobs—Maximum number of active jobs allowed in the subsystem.
· Status—Status of the subsystem. Options are:
¡ ACTIVE
¡ END (in the process of ending)
¡ RSTD (the controlling subsystem is in the restricted condition)
Message Queue
The Message Queue area contains the following fields:
· Message ID—ID of the message.
· Severity—A two-digit value in the range of 00 through 99. A higher value indicates a severer level.
· Type—Type of message. Options are:
¡ Completion—Indicates the completion of work.
¡ Diagnostic—Indicates errors in a system function, application, or input data.
¡ Informational—Provides general non-error-related information.
¡ Inquiry—Conveys information and asks for a reply.
¡ Sender Copy—Contains a copy of an Inquiry or Notify message that is kept in the sender message queue.
¡ Request—Contains a command for processing by a request processor, for example, a command entry.
¡ Request_With_Prompting—Contains a request with prompting.
¡ Notify—Indicates that a program requires a corrective action or a reply.
¡ Escape—Indicates that a program must be terminated abnormally.
¡ Reply_not_Validity_Checked—Contains a reply to an Inquiry or Notify message. The message validity is not checked.
¡ Reply_Validity_Checked—Contains a reply to an Inquiry or Notify message. The message validity is checked.
¡ Reply_Message_Default_Used—Contains a reply to an Inquiry or Notify message. The message is used by default.
¡ Reply_System_Default_Used—Contains a reply to an Inquiry or Notify message. The system is used by default.
¡ Reply_from_System_Reply_List—Contains a reply to an Inquiry or Notify message. The reply is from the system reply list.
· Date—Date when the message was sent.
· Job ID—ID of the job that generates the message.
· Message—Content of the message.
Job
The Job area contains the following fields:
· Job Name—Job name identified by AS400.
· User—The username is the same as the user profile name. The username can come from different sources, depending on the type of job.
· ID—Job number assigned by the system.
· Type—Type of active job. Options are:
¡ ASJ—Autostart.
¡ BCH—Batch.
¡ BCI—Batch immediate.
¡ EVK—Started by a procedure start request.
¡ INT—Interaction.
¡ M36—Advanced 36 server job.
¡ MRT—Multiple request terminal.
¡ PJ—Prestart job.
¡ PDJ—Print drive job.
¡ RDR—Reader.
¡ SBS—Subsystem monitor.
¡ SYS—System.
¡ WTR—Writer Status.
· Status—Status of the initial thread of the job. If initial thread is in transition, this field is empty.
· I/O Operation Count—Number of I/O operations during intermission.
· Response Time—Average interaction response time of the job during intermission.
System Log
The System Log area contains the following fields:
· Message ID—ID of the message.
· Severity—A two-digit value in the range of 00 through 99. A higher value indicates a severer level.
· Type—Type of the log. Options are:
¡ 1—Completion. It indicates the completion of work.
¡ 2—Diagnostic. It indicates errors in a system function, errors in an application, or errors in input data.
¡ 4—Informational. It provides general non-error-related information.
¡ 5—Inquiry. It conveys information and asks for a reply.
¡ 6—Sender Copy. It contains a copy of an Inquiry or Notify message that is kept in the sender message queue.
¡ 8—Request. It contains a command for processing by a request processor, for example, a command entry.
¡ 10—Request_With_Prompting. Contains a request with prompting.
¡ 14—Notify. It indicates that a program requires a corrective action or a reply.
¡ 15—Escape. It indicates that a program must be terminated abnormally.
¡ 21—Reply_not_Validity_Checked. It contains a reply to an Inquiry or Notify message. The message validity is not checked.
¡ 22—Reply_Validity_Checked. It contains a reply to an Inquiry or Notify message. The message validity is checked.
¡ 23—Reply_Message_Default_Used. It contains a reply to an Inquiry or Notify message. The message is used by default.
¡ 24—Reply_System_Default_Used. It contains a reply to an Inquiry or Notify message. The system is used by default.
¡ 25—Reply_from_System_Reply_List. It contains a reply to an Inquiry or Notify message. The reply is from the system reply list.
· Message—Content of the message.
· Date—Date when the log was sent.
Hardware Resource
The Hardware Resources area contains the following fields:
· Resource Name—Name of the hardware resource.
· Resource Status—Status of the hardware resource.
· Resource Type—Type of the hardware resource.
· Resource Serial Number—Serial number of the hardware resource.
Application Traffic
The Application Traffic area contains the following fields:
· Last Hour's Traffic—Total traffic sent and received by AS400 over the last 1 hour.
· Today's Traffic—Total traffic sent and received by AS400 since 00:00 today.
Linux server monitor
This chapter describes how to add and modify monitors for Linux servers, and how to view the monitor reports.
Linux
Linux is a popular open source operating system that has multiple release versions. By monitoring Linux, operators can view how the operating performance of a Linux server affects network applications on the system.
Adding a Linux application monitor
APM monitors Linux applications through agents, SNMP, or CLI. When you add Linux application monitors, follow these guidelines:
· To monitor a Linux application through an agent, deploy the agent on the host on which the Linux operating system is installed. For more information about agents, see "APM agent management."
· To monitor a Linux application through SNMP:
¡ Enable and configure SNMP for the host on which the Linux operating system is installed. For more information about enabling SNMP on Linux, see the Linux help.
¡ Obtain the read-only and read-write community strings.
· To monitor a Linux application through CLI:
¡ Enable and configure Telnet or SSH on Linux. For more information about enabling Telnet or SSH on Linux, see the Linux configuration guide.
¡ Obtain the username and password of the Telnet or SSH user who has the Linux administrator's privileges.
· Add the Linux hosts to the IMC platform so APM can obtain and display network connections of the hosts and their access devices in the application topology. For more information about adding hosts to the IMC platform, see H3C Intelligent Management Center v7.3 Enterprise and Standard Platform Administrator Guide.
· To view traffic statistics in the monitor report of the Linux application, make sure at least one probe is configured in APM. After a Linux application monitor is added, APM sends the IP address of the monitored Linux application to the probes for traffic collection.
The following task is performed in remote monitor mode. When the local monitor mode is used, you need to configure only part of the parameters that are required for the remote monitor mode.
To add a Linux application monitor:
1. Click the Resource tab.
2. Open the Add Application page by using one of the following methods:
¡ From the navigation tree, select Application Manager > Add Application.
The page displays all application types that can be monitored by APM.
¡ From the navigation tree, select Application Manager > Application Monitor, and then click Add on the application monitor list page.
3. Click Linux of the Linux Server Monitor class.
The page for adding a Linux application monitor opens.
4. Configure the following parameters:
¡ IP Address—Enter the IP address of the host on which the Linux application to be monitored is installed. If the host is already added to the IMC platform, you can also click Select, and then select the host in the Select Devices window. For information about selecting a host, see "Quick start." APM automatically checks the specified IP address and associates the application monitor with the host managed in the IMC platform.
¡ Name—Enter a unique application monitor name. As a best practice, name the application monitor as application type_host IP address.
¡ Use Template—Select Enable or Disable from the list.
¡ Template—Click
the Configure icon ![]() next to the Template field to select an existing template. The Template field
is automatically populated with the name of the selected template. For more
information about configuring application templates, see "Configuration management." This field is displayed only when you select Enable from the Use
Template list.
next to the Template field to select an existing template. The Template field
is automatically populated with the name of the selected template. For more
information about configuring application templates, see "Configuration management." This field is displayed only when you select Enable from the Use
Template list.
¡ Description—Enter a description for the application monitor.
¡ Polling Interval (min)—Select a polling interval for the application monitor. Options are 1, 2, 3, 4, 5, 10, 20, and 30. The default polling interval is 5 minutes. A shorter polling interval provides more accurate realtime data, but consumes more system resources. This field is available only when you select Disable from the Use Template list.
¡ Monitor Type—Select the protocol (SSH, SNMP, or Telnet) through
which APM monitors the Linux application, and then
click the Configure icon ![]() to configure related parameters. This field
is available only when you select Disable from the Use Template list.
to configure related parameters. This field
is available only when you select Disable from the Use Template list.
When SNMP is selected, configure the following parameters:
- Edit SNMP Parameters—Select this option if you want to manually configure SNMP parameters for APM. Make sure the SNMP settings are the same as those on Linux.
- Select an Existing Template—Select this option if you want to select an existing SNMP template for APM. For information about setting SNMP parameter templates, see H3C Intelligent Management Center v7.3 Enterprise and Standard Platform Administrator Guide.
- Parameter Type—Select the SNMP parameter type. Options are SNMPv1, SNMPv2c, and SNMPv3 Template. The SNMPv3 Template option is available only when Select an Existing Template is selected.
- Read-Only Community String—Enter the SNMP read-only community string, with which APM can read MIB variables from the Linux host.
- Read-Write Community String—Enter the read-write SNMP community string, with which APM can read MIB variables from or write MIB variables to the Linux host.
- Timeout (1-60 seconds)—Enter the maximum time period that APM waits for an SNMP response from Linux. The value range is 1 to 60 seconds and the default is 4 seconds. If no SNMP response is received from Linux within the timeout time, APM considers that the interaction has failed.
- Retries (1-20)—Enter how many times APM retries to send SNMP packets to the Linux host.
When SSH is selected, configure the following parameters:
- Edit SSH Parameters—Select this option if you want to manually configure SSH parameters for APM. Make sure the SSH settings are the same as those on Linux.
- Select an Existing Template—Select this option if you want to select an existing SSH template for APM. For information about setting SSH parameter templates, see H3C Intelligent Management Center v7.3 Enterprise and Standard Platform Administrator Guide.
- Authentication Mode—Select the authentication mode for SSH users. Options are Password, Private Key, Password + Private Key, Password + Super Password, Private Key + Super Password, and Password + Private Key + Super Password. The following parameters to be configured vary with authentication modes.
- Username—Enter the SSH username. The user must have the Linux administrator's privilege.
- Password—Enter the password of the SSH user.
- Private Key File—Enter the directory of the SSH private key file or browse to the file.
- Private Key Password—Enter the password to decrypt the SSH private key file.
- Super Password—Enter the super password with which an SSH user can elevate privileges after login.
- Port—Enter the SSH port on Linux.
- Timeout (1-120 seconds)—Enter the maximum time period that APM waits for an SSH response from Linux. The value range is 1 to 120 seconds and the default is 10 seconds. If no SSH response is received from Linux within the timeout time, APM considers that the interaction has failed.
- Retries (1-5)—Enter how many times APM retries to send SSH packets to the Linux host.
When Telnet is selected, configure the following parameters:
- Edit Telnet Parameters—Select this option if you want to manually configure Telnet parameters for APM. Make sure the Telnet settings are the same as those on Linux.
- Select an Existing Template—Select this option if you want to select an existing Telnet template for APM. For information about setting Telnet parameter templates, see H3C Intelligent Management Center v7.3 Enterprise and Standard Platform Administrator Guide.
- Authentication Mode—Select the authentication mode for Telnet users. Options are Password (No Operator or Super/Manager), Username + Password, Super/Manager Password, Password + Super/Manager Password (No Operator), Username + Password + Super/Manager Password, No Username + No Password, and Username + No Password. The following parameters to be configured vary with authentication modes.
- Username—Enter the Telnet username. The user must have the Linux administrator's privilege.
- Password—Enter the password of the Telnet user.
- Super Password—Enter the super password with which a Telnet user can elevate privileges after login.
- Timeout (1-60 seconds)—Enter the maximum time period that APM waits for a Telnet response from Linux. The value range is 1 to 60 seconds and the default is 4 seconds. If no Telnet response is received from Linux within the timeout time, APM considers that the interaction has failed.
¡ Contact—Enter the contact information, such as the name, email address, and telephone number. The default is the username of the operator who created the application monitor. This field is available only when you select Disable from the Use Template list.
¡ Use IPMI—Select Enable or Disable from the list. If you select Enable, configure the following parameters:
- Host IP—Enter the IP address of the BMC for IPMI monitoring.
- Username/Password—Enter the username and password of the BMC for IPMI monitoring.
¡ APM Server—Select an APM server to monitor the application. The options are in server-address (application-type:n/N) format. The letter n indicates the number of Linux applications monitored on the APM server. The letter N indicates the total number of applications monitored on the APM server. Server address 127.0.0.1 indicates that APM and the IMC platform are deployed on the same server.
¡ Related Applications—Click Add next to this field. On the Select Application window, enter a partial or complete name to filter applications, select the applications that Linux depends on, and then click OK.
Operating system applications cannot be selected. Operators can view all dependencies of the application in the dependency topology.
¡ Application Group—Specify an application group for the Linux application.
- To specify an existing application group, click Add, select an application group, and then click OK.
- To specify a new application group, click Add Application Group, configure the application group settings, and then click OK.
¡ Detect Application—Select this parameter if you want to enable application detection. Application detection enables APM to verify connection to the application by using the previous parameter settings, and to determine whether to add the application monitor based on the verification result. APM adds the application monitor only when it can connect to the application. When this parameter is not selected, APM adds the application monitor without verifying the connection.
5. Click OK.
Modifying a Linux application monitor
Authorized users can modify all parameters except the IP address and the APM server for a Linux application monitor. When the IP address of a monitored Linux host changes, operators must add a new application monitor for the host. The new application monitor cannot inherit the history data from the previous application monitor.
To modify a Linux application monitor:
1. Click the Resource tab.
2. From the navigation tree, select Application Manager > Application Monitor.
The page displays all application types that can be monitored by APM.
3. Click the Modify icon ![]() for the
Linux application monitor you want to modify.
for the
Linux application monitor you want to modify.
The page for modifying the Linux application monitor opens.
4. Modify the parameters as needed, except the IP address and the APM server.
For more information about parameter settings, see "Adding a Linux application monitor."
5. Click OK.
Viewing the Linux application monitor report
After adding the Linux application monitor, APM collects application index data to calculate its availability and health status. You can obtain monitor indexes for Linux by viewing the monitor report.
To access the Linux application monitor report:
1. Click the Resource tab.
2. From the navigation tree, select Application Manager > Application Monitor.
The application monitor list page displays all application monitors.
3. Click the name of a Linux application monitor to display the report.
Figure 61 shows part of a Linux application monitor report.
Figure 61 Part of a Linux application monitor report
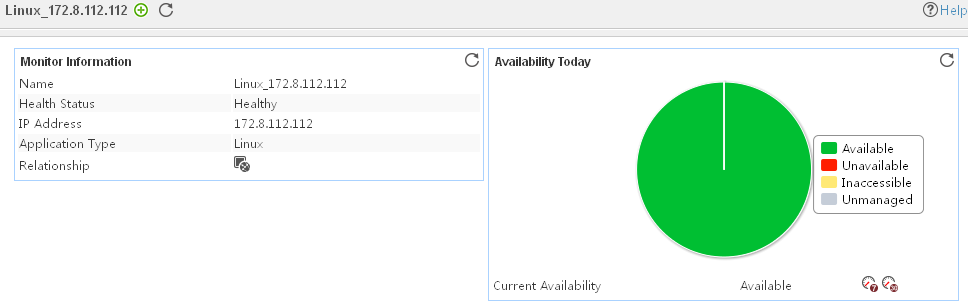
Monitor Information
The Monitor Information area contains the following fields:
· Name—Application monitor name.
· Health Status—Health status of the Linux application.
· IP Address—IP address of the Linux host.
· Application Type—Type of the monitored application, which is always Linux.
· Version—Version of the Linux operating system.
· Last Polling Time—Time when APM last polled the Linux application.
· System Running Time—Duration since the startup of the Linux application to the time when APM last polled the Linux application.
· Relationship—Click the Related Applications icon ![]() to view dependencies between the Linux application and other applications in a dependency topology view. For more information
about dependency topologies, see "Topology and application group management."
to view dependencies between the Linux application and other applications in a dependency topology view. For more information
about dependency topologies, see "Topology and application group management."
· Top5 Unrecovered Alarm—Latest five unrecovered alarms on the Linux host. This field is not displayed if no alarm is generated by the Linux application.
Availability Today
The Availability Today area contains the following fields:
· Current Availability—Availability of the Linux application in the last polling interval.
¡ Click
the Weekly History icon ![]() to view the availability of the Linux
application in the last 7 days.
to view the availability of the Linux
application in the last 7 days.
¡ Click
the Monthly History icon ![]() to view the availability of the Linux
application in the last 30 days.
to view the availability of the Linux
application in the last 30 days.
· Available Time—Total amount of time that the Linux application was available after 00:00 today.
· Unavailable Time—Total amount of time that the Linux application was unavailable after 00:00 today.
· Inaccessible Time—Total amount of time that the Linux application was inaccessible after 00:00 today.
· Unmanaged Time—Total amount of time that the Linux application was unmanaged after 00:00 today.
The statistics collection started when the application monitor was added. An availability time field is not displayed when its value is 0.
CPU Usage Ratio
The CPU Usage Ratio area contains the following field:
· CPU Usage Ratio—CPU usage ratio of the Linux application in the last polling interval.
¡ Click
the Set Threshold icon ![]() to set alarm thresholds for the CPU usage.
to set alarm thresholds for the CPU usage.
¡ History Record—Click the History
Record icon ![]() to view the history graph of the CPU usage
ratio.
to view the history graph of the CPU usage
ratio.
Memory Usage Ratio
The Memory Usage Ratio area displays information about physical memory and swap memory.
The Memory Usage Ratio area contains the following fields:
· Physical Memory—Physical memory of the Linux application, which corresponds to the physical memory bar.
· Swap—Swap memory of the Linux application, which corresponds to a disk space.
· Total—Total amount of the physical or swap memory.
· In Use—Size of the physical or swap memory being used. Click the History Record icon ![]() to view the history
graph of the physical or swap memory being used.
to view the history
graph of the physical or swap memory being used.
· Usage Ratio—Physical or swap memory usage ratio. The usage ratio is calculated by using the formula: Usage ratio = Memory in use/Total memory x 100%.
¡ Click
the Set Threshold icon ![]() to set alarm thresholds for the physical or
swap memory.
to set alarm thresholds for the physical or
swap memory.
¡ Click the History Record
icon ![]() to view the history graph of the physical or swap memory usage.
to view the history graph of the physical or swap memory usage.
CPU Performance
The CPU Performance area contains the following fields:
· CPU Name—Name of the CPU.
· Nice CPU—Time taken by the processes whose priorities were modified by using the Nice command.
· Load Percentage—Percentage of the load time.
· User Percentage—Percentage of the user time.
· System Percentage—Percentage of the system time.
· I/O Wait Percentage—Percentage of the I/O wait time.
· Idle Percentage—Percentage of the idle time.
You can click the History
Record icon ![]() to
view the history graph of a monitor index.
to
view the history graph of a monitor index.
Paging
The Paging area contains the following fields:
· Paging In—Number of pages that were paged in.
· Paging Out—Number of pages that were paged out.
· Paging Total—Total number of pages that were paged in and out.
· Paging In Rate—Number of pages that were paged in per second.
· Paging Out Rate—Number of pages that were paged out per second.
· Paging Rate—Number of pages that were paged in and out per second.
You can click the History
Record icon ![]() to
view the history graph of a monitor index.
to
view the history graph of a monitor index.
Ping Test
The Ping Test area contains the following fields:
· Response Time—Round trip response time of the Linux application in the last ping operation. Click the History Record icon ![]() to view the history
graph of the response time.
to view the history
graph of the response time.
· Packets Sent—Number of ICMP packets that are sent in the last ping operation. The
maximum value is 3. Click
the History Record icon ![]() to view the history graph of the sent packets.
to view the history graph of the sent packets.
· Packets Received—Number
of ICMP response packets that are received in the last ping operation. The value is 0 or 1. Click the History Record icon ![]() to view the history
graph of the received packets.
to view the history
graph of the received packets.
System Load
APM counts the average system load over 1 minute, 5 minutes, and 15 minutes. The average system load records the average number of processes in the run queue over a specific time interval. An overloaded system results in severe performance issues. The load threshold value varies by CPU model.
The System Load area contains the following fields:
· System Load/Min—Average
system load over the last 1 minute. Click the History
Record icon ![]() to view the history graph of the system load over the last 1 minute.
to view the history graph of the system load over the last 1 minute.
· System Load/5 Min—Average
system load over the last 5 minutes. Click the History
Record icon ![]() to view the history graph of the system load over the last 5
minutes.
to view the history graph of the system load over the last 5
minutes.
· System Load/15 Min—Average
system load over the last 15 minutes. Click the History
Record icon ![]() to view the history graph of the system load over the last 15
minutes.
to view the history graph of the system load over the last 15
minutes.
File System Usage Ratio
The Linux file directory structure contains one root directory and multiple subdirectories. File systems are mounted to the root directory or subdirectories under the root directory. Each file system corresponds to a physical disk partition or logical volume. Use the File System Usage Ratio area to display how the available disk space is used.
The File System Usage Ratio area contains the following fields:
· Name—Mount point of the file system in the Linux directory structure.
· File System Usage Ratio—Space usage ratio of the Linux file system.
¡ Click
the Set Threshold icon ![]() to set alarm thresholds for the file system usage.
to set alarm thresholds for the file system usage.
¡ Click the History Record icon ![]() to view the history
graph of the file system usage ratio.
to view the history
graph of the file system usage ratio.
· In Use—Used space of the file system. Click the History
Record icon ![]() to view the history graph of the used file
system space.
to view the history graph of the used file
system space.
· Free Space—Free
space of the file system. Click the History Record icon ![]() to view the history
graph of the free file system space.
to view the history
graph of the free file system space.
I/O Response
The I/O Response area contains the following fields:
· Disk Name—Name of a Linux server disk.
· Response—Average time (in milliseconds) for I/O requests issued to the disk.
· Average Queue—Average queue length of the requests that were issued to the disk.
· Transfer Time—Percentage of CPU time during which I/O requests were issued to the disk.
Adapter
The Adapter area contains the following fields:
· Adapter Name—Name of the adapter installed on the Linux server.
· Adapter Status—Status of the adapter, UP or DOWN.
Zombie Process Number
The Zombie Process Number area contains the following field:
· Zombie Process Number—Number of zombie processes in the last polling interval. Click the History
Record icon ![]() to view the history graph of the zombie process number.
to view the history graph of the zombie process number.
Zombie Process
The Zombie Process area contains the following fields:
· Process Name—Name of the zombie process in the last polling interval.
· ID—ID of the zombie process in the last polling interval.
· Parent ID—ID of the parent process for the zombie process in the last polling interval.
· CPU Usage—CPU usage of the zombie process in the last polling interval.
¡ Click
the Set Threshold icon ![]() to set alarm thresholds for the CPU usage of the zombie process.
to set alarm thresholds for the CPU usage of the zombie process.
¡ Click
the History Record icon
![]() to view the history graph of the CPU usage of the zombie process.
to view the history graph of the CPU usage of the zombie process.
· Memory usage—Memory usage of the zombie process in the last polling interval. Click the History
Record icon ![]() to view the history
graph of the memory usage of the zombie process.
to view the history
graph of the memory usage of the zombie process.
· CPU Time—Duration that the zombie process occupies the CPU in the last polling interval.
Application Traffic
The Application Traffic area contains the following fields:
· Last Hour's Traffic—Total traffic sent and received by the Linux application over the last 1 hour.
· Today's Traffic—Total traffic sent and received by the Linux application since 00:00 today.
Network Interface
The Network Interface area contains the following fields:
· Interface Name—Identifier of a network interface card in Linux. APM monitors both physical and virtual (logical) network interface cards.
· Receive Rate—Receive rate of a network interface card in the last polling
interval. Click the Set Threshold icon ![]() to set alarm thresholds for the receive rate of Linux network
interface cards
to set alarm thresholds for the receive rate of Linux network
interface cards
· Send Rate—Send rate of a network interface card in the last polling interval.
· Input Error Packet Rate—Number of inbound erroneous packets per second on a network interface card in the last polling interval.
· Output Error Packet Rate—Number of outbound erroneous packets per second on a network interface card in the last polling interval.
Error Log
APM examines the Linux error logs during polling and displays the first 10 error logs obtained in the polling in the Linux application monitor report. Click More to view all error logs in the last polling interval if the report has more than 10 error logs.
The Error Log area contains the following fields:
· Time—Time when the error occurred.
· Log—Content of the error log.
TCP Connections
The TCP Connections area contains the following fields:
· Active Connections Rate—Number of active connections per second.
· Passive Connections Rate—Number of passive connections per second.
· Failed Connections Rate—Number of failed connections per second.
· Reset Connections Rate—Number of reset connections per second.
· Established Connections—Number of established connections.
· Received Segments Rate—Number of received segments per second.
· Sent Segments Rate—Number of sent segments per second.
· Retransmitted Segments Rate—Number of retransmitted segments per second.
Process Number
The Process Number area contains the following field:
Process Number—Number of processes on the Linux server.
I/O State
APM can monitor the I/O status of disks, partitions, or logical volumes in Linux.
The I/O State area contains the following fields:
· Device Name—Name of the disk, partition, or logical volume in Linux.
· I/O Read Rate—Data output rate of the disk, partition, or logical volume in Linux.
· I/O Write Rate—Data input rate of the disk, partition, or logical volume in Linux.
Process
By default, the list does not contain any
processes. To monitor processes on Linux, click the Configuration
icon ![]() to select the processes to be monitored.
APM collects the index data for the monitored processes when APM polls applications
next time, including the CPU usage ratio and memory usage ratio.
to select the processes to be monitored.
APM collects the index data for the monitored processes when APM polls applications
next time, including the CPU usage ratio and memory usage ratio.
The Process area contains the following fields:
· Config—Click the Config icon ![]() to select processes to be monitored in
the monitor list window.
to select processes to be monitored in
the monitor list window.
· Process Name—Name of the monitored process. For processes with the same name but different Process Identifiers (PIDs), APM collects the CPU usage ratio and the memory usage ratio for each process. For example, the application may generate a lot of httpd processes, and APM collects the CPU usage ratio and the memory usage ratio for each httpd process selected.
· ID—Unique identifier of the process on the OS.
· Parent ID—ID of the parent process for the process.
· CPU Usage—CPU usage ratio of the process.
¡ Click
the Set Threshold icon ![]() to set alarm thresholds for the CPU usage.
to set alarm thresholds for the CPU usage.
¡ Click the History Record icon ![]() to view the history
graph of the CPU usage.
to view the history
graph of the CPU usage.
· Memory Usage—Memory usage ratio of the process. Click the History
Record icon ![]() to view the history graph of the memory usage.
to view the history graph of the memory usage.
· CPU Time—Duration that the process occupies the CPU.
· Arguments—Arguments of a process on the Linux server.
inode
The inodes are required when you create a file or directory in the Linux file system. If inodes are used up, you cannot create a file or directory in the file system.
The inode area contains the following fields:
· File System—File system on the Linux server.
· Total—Total number of available inodes in the file system. Click the History
Record icon ![]() to view the change
trend of the total number of inodes in the file system.
to view the change
trend of the total number of inodes in the file system.
· Free—Number of inodes that are not used in the file system. Click the History
Record icon ![]() to view the change
trend of the number of idle inodes in the file system.
to view the change
trend of the number of idle inodes in the file system.
· In Use—Number of inodes that have been used in the file system. Click the History
Record icon ![]() to view the change
trend of the number of used inodes in the file system.
to view the change
trend of the number of used inodes in the file system.
· inode Usage Ratio—Usage of inodes in the file system.
¡ Click
the Set Threshold icon ![]() to set alarm thresholds for the file system inode
usage.
to set alarm thresholds for the file system inode
usage.
¡ Click
the History Record icon ![]() to view the history graph of inode usage in the file system.
to view the history graph of inode usage in the file system.
Vol Group
Logical volume management manages disk partitions in the Linux operating system. It combines one or more physical disks to a volume group and creates a logical volume for the volume group. One logical volume equals a disk partition.
The Vol Group area contains the following fields:
· Name—Name of the volume group.
· Size—Size of the volume group. Click the History Record icon ![]() to view the history graph of the volume group size.
to view the history graph of the volume group size.
· In Use—Volume group space that is used in the last polling interval. Click the History
Record icon ![]() to view the change
trend of the used volume group space.
to view the change
trend of the used volume group space.
· Free Space—Volume group space that are not used in the last polling interval. Click the History
Record icon ![]() to view the history graph of the volume group space.
to view the history graph of the volume group space.
· Usage Ratio—Usage of the volume group space in the last polling interval.
¡ Click
the Set Threshold icon ![]() to set alarm
thresholds for the space usage of the volume group.
to set alarm
thresholds for the space usage of the volume group.
¡ Click
the History Record icon ![]() to view the history
graph of the space usage of the volume group.
to view the history
graph of the space usage of the volume group.
Session Information
The Session Information area displays Linux session login information.
The Session Information area contains the following fields:
· User Name—User logging in to Linux in the last polling interval.
· TTY—TTY used by the user.
· Login IP—Client IP address used when the user logs in to Linux. The value of :0 indicates that the user logs in to Linux through the console.
· Login Time—Time when the user logged in to Linux.
· Idle—Idle time after the user logged in to Linux.
· Command—Most recently executed command after the user logged in to Linux.
Memory Info
The Memory Info area contains the following fields:
· Locator—Position of the memory card on the server.
· Memory Size—Size of the memory.
CPU Info
The CPU Info area contains the following fields:
· Locator—Position of the CPU on the server.
· Cores—Number of CPU cores.
· Logic Processors—Number of CPU logic processors.
· CPU Model—Model of the CPU.
Base Board
The Base Board area contains the following fields:
· Manufacturer—Manufacturer of the base board.
· Product Name—Model of the base board.
· Serial Number—Serial number of base board.
Chassis
The Chassis area contains the following fields:
· Manufacturer—Manufacturer of the chassis.
· Power Supply State—State of the chassis power supply.
· Serial Number—Serial number of the chassis.
Memory
The Memory area displays memory information for the server where the OS is located. To monitor the memory, make sure the BMC is installed on the server.
The Memory area contains the following fields:
· Component Name—Name of the component.
· Status—State of the component.
Power Supply
The Power Supply area displays power supply information for the server where the OS is located. To monitor the power supply, make sure the BMC is installed on the server.
The Power Supply area contains the following fields:
· Component Name—Name of the component.
· Status—State of the component.
Temperature
The Temperature area displays temperature information for the server where the OS is located. To monitor the temperature, make sure the BMC is installed on the server.
The Temperature area contains the following fields:
· Component Name—Name of the component.
· Status—State of the component.
· Value—Temperature of the component.
Fan
The Fan area displays fan information for the server where the OS is located. To monitor the fans, make sure the BMC is installed on the server.
The Fan area contains the following fields:
· Component Name—Name of the component.
· Status—State of the component.
Board
The Board area displays board information about the server where the OS is located. To monitor the board, make sure the BMC is installed on the server.
The Board area contains the following fields:
· Manufacturer—Manufacturer of the board.
· Product Name—Name and model of the product to which the board applies.
· Production Date—Production date of the board.
· Part Number—Part number of the board.
· Serial Number—Serial number of the board.
· System GUID—GUID of the board.
Chassis
The Chassis area displays chassis information for the server where the OS is located. To monitor the chassis, make sure the BMC is installed on the server.
The Chassis area contains the following fields:
· BMC Version—Version of the BMC.
· IPMI Driver Type—Type of the IPMI driver.
· Self-Check Result—Self-check result of the server.
· Power Supply Status—State of the power supply for the chassis.
· Chassis Intrusion—Whether the chassis is open or has been opened before.
· Front Panel—Whether the front panel is open.
· Cooling Fan Fault—Whether the cooling fans operate correctly.
· Disk Fault—Whether the disks operate correctly.
· Power-On Hours—Hours since the chassis was started.
NeoKylin
NeoKylin is an operating system that uses Linux kernels. By monitoring NeoKylin, operators can view how the operating performance of a NeoKylin server affects network applications on the system. APM supports monitoring NeoKylin V6.0.
Adding a NeoKylin application monitor
APM monitors NeoKylin applications through SNMP, CLI, or agents. When you add NeoKylin application monitors, follow these guidelines:
· To monitor a NeoKylin application through an agent, deploy the agent on the host where the NeoKylin operating system is installed. For more information about agents, see "APM agent management."
· To monitor a NeoKylin application through SNMP:
¡ Enable and configure SNMP for the host on which the NeoKylin operating system is installed. For more information about enabling SNMP on NeoKylin, see the NeoKylin online help.
¡ Obtain the read-only and read-write community strings.
· To monitor a NeoKylin application through CLI:
¡ Enable and configure Telnet or SSH on NeoKylin. For more information about enabling Telnet or SSH on NeoKylin, see the NeoKylin configuration guide.
¡ Obtain the username and password of the Telnet or SSH user who has the NeoKylin administrator's privileges.
· Add the NeoKylin hosts to the IMC platform so that APM can obtain and display network connections of the hosts and their access devices in the application topology. For more information about adding hosts to the IMC platform, see H3C Intelligent Management Center v7.3 Enterprise and Standard Platform Administrator Guide.
· To view traffic statistics in the monitor report of the NeoKylin application, make sure at least one probe is configured in APM. After a NeoKylin application monitor is added, APM sends the IP address of the monitored NeoKylin application to the probes for traffic collection.
To add a NeoKylin application monitor:
1. Click the Resource tab.
2. Open the Add Application page by using one of the following methods:
¡ From the navigation tree, select Application Manager > Add Application.
The page displays all application types that can be monitored by APM.
¡ From the navigation tree, select Application Manager > Application Monitor, and then click Add on the application monitor list page.
3. Click NeoKylin of the Linux Server Monitor class.
The page for adding a NeoKylin application monitor opens.
Configure the following parameters:
¡ IP Address—Enter the IP address of the host on which the NeoKylin application to be monitored is installed. If the host is already added to the IMC platform, you can also click Select, and then select the host in the Select Devices window. For information about selecting a host, see "Quick start." APM automatically checks the specified IP address and associates the application monitor with the host managed in the IMC platform.
¡ Name—Enter a unique application monitor name. As a best practice, name the application monitor as application type_host IP address.
¡ Use Template—Select Enable or Disable from the list.
¡ Template—Click the Configure icon ![]() next to the Template field to select an existing template. The Template field
is automatically populated with the name of the selected template. For more
information about configuring application templates, see "Configuration management." This field is displayed only when you select Enable from the Use
Template list.
next to the Template field to select an existing template. The Template field
is automatically populated with the name of the selected template. For more
information about configuring application templates, see "Configuration management." This field is displayed only when you select Enable from the Use
Template list.
¡ Description—Enter a description for the application monitor.
¡ Polling Interval (min)—Select a polling interval for the application monitor. Options are 1, 2, 3, 4, 5, 10, 20, and 30. The default polling interval is 5 minutes. A shorter polling interval provides more accurate realtime data, but consumes more system resources. This field is available only when you select Disable from the Use Template list.
¡ Monitor Type—Select the protocol (SSH, SNMP, or Telnet) through
which APM monitors the NeoKylin
application, and then click the Configure icon ![]() to configure
related parameters. This field is available only when
you select Disable from the Use Template list.
to configure
related parameters. This field is available only when
you select Disable from the Use Template list.
When SNMP is selected, configure the following parameters:
- Edit SNMP Parameters—Select this option if you want to manually configure SNMP parameters for APM. Make sure the SNMP settings are the same as those on NeoKylin.
- Select an Existing Template—Select this option if you want to select an existing SNMP template for APM. For information about setting SNMP parameter templates, see H3C Intelligent Management Center v7.3 Enterprise and Standard Platform Administrator Guide.
- Parameter Type—Select the SNMP parameter type. Options are SNMPv1, SNMPv2c, and SNMPv3 Template. The SNMPv3 Template option is available only when Select an Existing Template is selected.
- Read-Only Community String—Enter the SNMP read-only community string, with which APM can read MIB variables from the NeoKylin host.
- Read-Write Community String—Enter the read-write SNMP community string, with which APM can read MIB variables from or write MIB variables to the NeoKylin host.
- Timeout (1-60 seconds)—Enter the maximum time period that APM waits for an SNMP response from NeoKylin. The value range is 1 to 60 seconds and the default is 4 seconds. If no SNMP response is received from NeoKylin within the timeout time, APM considers that the interaction has failed.
- Retries (1-20)—Enter how many times APM retries to send SNMP packets to the NeoKylin host.
When SSH is selected, configure the following parameters:
- Edit SSH Parameters—Select this option if you want to manually configure SSH parameters for APM. Make sure the SSH settings are the same as those on NeoKylin.
- Select an Existing Template—Select this option if you want to select an existing SSH template for APM. For information about setting SSH parameter templates, see H3C Intelligent Management Center v7.3 Enterprise and Standard Platform Administrator Guide.
- Authentication Mode—Select the authentication mode for SSH users. Options are Password, Private Key, Password + Private Key, Password + Super Password, Private Key + Super Password, and Password + Private Key + Super Password. The following parameters to be configured vary with authentication modes.
- Username—Enter the SSH username. The user must have the NeoKylin administrator's privilege.
- Password—Enter the password of the SSH user.
- Private Key File—Enter the directory of the SSH private key file or browse to the file.
- Private Key Password—Enter the password to decrypt the SSH private key file.
- Super Password—Enter the super password with which an SSH user can elevate privileges after login.
- Port—Enter the SSH port on NeoKylin.
- Timeout (1-120 seconds)—Enter the maximum time period that APM waits for an SSH response from NeoKylin. The value range is 1 to 120 seconds and the default is 10 seconds. If no SSH response is received from NeoKylin within the timeout time, APM considers that the interaction has failed.
- Retries (1-5)—Enter how many times APM retries to send SSH packets to the NeoKylin host.
When Telnet is selected, configure the following parameters:
- Edit Telnet Parameters—Select this option if you want to manually configure Telnet parameters for APM. Make sure the Telnet settings are the same as those on NeoKylin.
- Select an Existing Template—Select this option if you want to select an existing Telnet template for APM. For information about setting Telnet parameter templates, see H3C Intelligent Management Center v7.3 Enterprise and Standard Platform Administrator Guide.
- Authentication Mode—Select the authentication mode for Telnet users. Options are Password (No Operator or Super/Manager), Username + Password, Super/Manager Password, Password + Super/Manager Password (No Operator), Username + Password + Super/Manager Password, No Username + No Password, and Username + No Password. The following parameters to be configured vary with authentication modes.
- Username—Enter the Telnet username. The user must have the NeoKylin administrator's privilege.
- Password—Enter the password of the Telnet user.
- Super Password—Enter the super password with which a Telnet user can elevate privileges after login.
- Timeout (1-60 seconds)—Enter the maximum time period that APM waits for a Telnet response from NeoKylin. The value range is 1 to 60 seconds and the default is 4 seconds. If no Telnet response is received from NeoKylin within the timeout time, APM considers that the interaction has failed.
¡ Contact—Enter the contact information, such as the name, email address, and telephone number. The default is the username of the operator who created the application monitor. This field is available only when you select Disable from the Use Template list.
¡ Use IPMI—Select Enable or Disable from the list. If you select Enable, configure the following parameters:
- Host IP—Enter the IP address of the BMC for IPMI monitoring.
- Username/Password—Enter the username and password of the BMC for IPMI monitoring.
¡ APM Server—Select an APM server to monitor the application. The options are in server-address (application-type:n/N) format. The letter n indicates the number of NeoKylin applications monitored on the APM server. The letter N indicates the total number of applications monitored on the APM server. Server address 127.0.0.1 indicates that APM and the IMC platform are deployed on the same server.
¡ Related Applications—Click Add next to this field. On the Select Application window, enter a partial or complete name to filter applications, select the applications that NeoKylin depends on, and then click OK.
Operating system applications cannot be selected. Operators can view all dependencies of the application in the dependency topology.
¡ Application Group—Specify an application group for the NeoKylin application.
- To specify an existing application group, click Add, select an application group, and then click OK.
- To specify a new application group, click Add Application Group, configure the application group settings, and then click OK.
¡ Detect Application—Select this parameter if you want to enable application detection. Application detection enables APM to verify connection to the application by using the previous parameter settings, and to determine whether to add the application monitor based on the verification result. APM adds the application monitor only when it can connect to the application. When this parameter is not selected, APM adds the application monitor without verifying the connection.
4. Click OK.
Modifying a NeoKylin application monitor
Authorized users can modify all parameters except the IP address and the APM server for a NeoKylin application monitor. When the IP address of a monitored NeoKylin host changes, operators must add a new application monitor for the host. The new application monitor cannot inherit the history data from the previous application monitor.
To modify a NeoKylin application monitor:
1. Click the Resource tab.
2. From the navigation tree, select Application Manager > Application Monitor.
The page displays all application types that can be monitored by APM.
3. Click the Modify icon ![]() for the NeoKylin application monitor you want to
modify.
for the NeoKylin application monitor you want to
modify.
The page for modifying the NeoKylin application monitor opens.
4. Modify the parameters as needed, except the IP address and the APM server.
For more information about parameter settings, see "Adding a NeoKylin application monitor."
5. Click OK.
Viewing the NeoKylin application monitor report
After a NeoKylin application monitor is added, APM collects application index data, evaluates the availability and health status, and updates the monitor report. The report shows the index values obtained from the most recent polling of the application.
To access the NeoKylin application monitor report:
1. Click the Resource tab.
2. From the navigation tree, select Application Manager > Application Monitor.
The application monitor list page displays all application monitors.
3. Click the name of a NeoKylin application monitor to display the report.
Figure 62 shows part of a NeoKylin application monitor report.
Figure 62 Part of a NeoKylin application monitor report
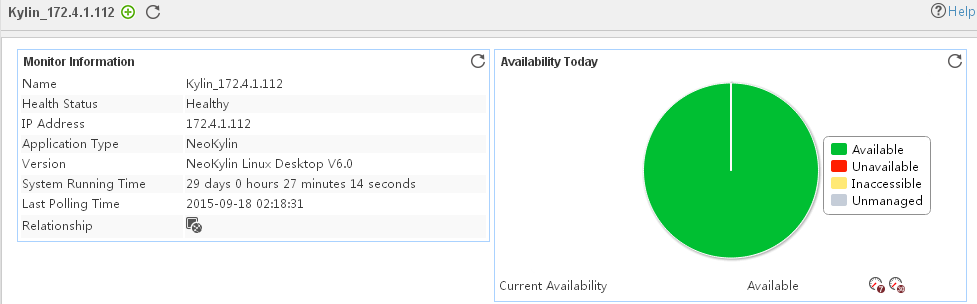
Monitor Information
The Monitor Information area contains the following fields:
· Name—Application monitor name.
· Health Status—Health status of the NeoKylin application.
· IP Address—IP address of the NeoKylin host.
· Application Type—Type of the monitored application, which is always NeoKylin.
· Version—Version of the NeoKylin operating system.
· System Running Time—Duration since the startup of the NeoKylin application to the time when APM last polled the NeoKylin application.
· Last Polling Time—Time when APM last polled the NeoKylin application.
· Relationship—Click the Related Applications icon ![]() to view dependencies between the NeoKylin application and
other applications in a dependency topology view. For more information about dependency topologies, see "Topology and application group management."
to view dependencies between the NeoKylin application and
other applications in a dependency topology view. For more information about dependency topologies, see "Topology and application group management."
· Top5 Unrecovered Alarm—Latest five unrecovered alarms on the NeoKylin host. This field is not displayed if no alarm is generated by the NeoKylin application.
Availability Today
The Availability Today area contains the following fields:
· Current Availability—Availability of the NeoKylin application.
¡ Click
the Weekly History icon ![]() to view the availability of the NeoKylin application in the last 7 days.
to view the availability of the NeoKylin application in the last 7 days.
¡ Click
the Monthly History icon ![]() to view the availability of the NeoKylin application in the last 30 days.
to view the availability of the NeoKylin application in the last 30 days.
· Available Time—Total amount of time that the NeoKylin application was available after 00:00 today.
· Unavailable Time—Total amount of time that the NeoKylin application was unavailable after 00:00 today.
· Inaccessible Time—Total amount of time that the NeoKylin application was inaccessible after 00:00 today.
· Unmanaged Time—Total amount of time that the NeoKylin application was unmanaged after 00:00 today.
The statistics collection started when the application monitor was added. An availability time field is not displayed when its value is 0.
CPU Usage Ratio
The CPU Usage Ratio area contains the following field:
· CPU Usage Ratio—CPU usage ratio of the NeoKylin application.
¡ Click
the Set Threshold icon ![]() to set alarm thresholds for the CPU usage.
to set alarm thresholds for the CPU usage.
¡ Click the History Record icon ![]() to view the history
graph of the CPU usage ratio.
to view the history
graph of the CPU usage ratio.
Memory Usage Ratio
The Memory Usage Ratio area displays information about physical memory and swap memory.
The Memory Usage Ratio area contains the following fields:
· Physical Memory—Physical memory of the NeoKylin application, which corresponds to the physical memory bar.
· Swap—Swap memory of the NeoKylin application, which corresponds to a disk space.
· Total—Total amount of the physical or swap memory.
· In Use—Size of the physical or swap memory being used. Click the History Record icon ![]() to view the history
graph of the physical or swap memory being used.
to view the history
graph of the physical or swap memory being used.
· Usage Ratio—Physical or swap memory usage ratio. The usage ratio is calculated by using the formula: Usage ratio = Memory in use/Total memory x 100%.
¡ Click
the Set Threshold icon ![]() to set alarm thresholds for the physical or
swap memory.
to set alarm thresholds for the physical or
swap memory.
¡ Click
the History Record icon
![]() to view the history graph of the physical or swap memory usage.
to view the history graph of the physical or swap memory usage.
Ping Test
When the polling interval expires, APM pings the NeoKylin host by sending up to three ICMP packets. When APM receives a response, it considers the ping test a success and records the response time. When APM receives no response after three tries, it considers the ping test a failure.
The Ping Test area contains the following fields:
· Response Time—Round trip response time of the NeoKylin application in the last ping operation. Click the History Record icon ![]() to view the history
graph of the response time.
to view the history
graph of the response time.
· Packets Sent—Number of ICMP packets that are sent in the last ping operation. The
maximum value is 3. Click
the History Record icon ![]() to view the history graph of the sent packets.
to view the history graph of the sent packets.
· Packets Received—Number of
ICMP response packets that are received in the last ping operation. The value is 0 or 1. Click the History Record icon ![]() to view the history
graph of the received packets.
to view the history
graph of the received packets.
System Load
APM counts the average system load over 1 minute, 5 minutes, and 15 minutes. The average system load records the average number of processes in the run queue over a specific time interval. An overloaded system results in severe performance issues. The load threshold value varies by CPU model.
The System Load area contains the following fields:
· System Load/Min—Average
system load over the last 1 minute. Click the History
Record icon ![]() to view the history graph of the system load over the last 1 minute.
to view the history graph of the system load over the last 1 minute.
· System Load/5 Min—Average
system load over the last 5 minutes. Click the History
Record icon ![]() to view the history graph of the system load over the last 5
minutes.
to view the history graph of the system load over the last 5
minutes.
· System Load/15 Min—Average system load over the last 15 minutes. Click the History Record icon ![]() to view the history graph of the system load over the last 15
minutes.
to view the history graph of the system load over the last 15
minutes.
File System Usage Ratio
The NeoKylin file directory structure contains one root directory and multiple subdirectories. File systems are mounted to the root directory or subdirectories under the root directory. Each file system corresponds to a physical disk partition or logical volume. Use the File System Usage Ratio area to display how the available disk space is used.
The File System Usage Ratio area contains the following fields:
· Name—Mount point of the file system in the NeoKylin directory structure.
· File System Usage Ratio—Space usage ratio of the NeoKylin file system.
¡ Click
the Set Threshold icon ![]() to set alarm thresholds for the file system usage.
to set alarm thresholds for the file system usage.
¡ Click the History Record icon ![]() to view the history
graph of the file system usage ratio.
to view the history
graph of the file system usage ratio.
· In Use—Used space of the file system. Click the History
Record icon ![]() to view the history graph of the used file
system space.
to view the history graph of the used file
system space.
· Free Space—Free space of the file system.
Click the History Record
icon ![]() to view the history graph of the free file system space.
to view the history graph of the free file system space.
Zombie Process Number
The Zombie Process Number area contains the following field:
· Zombie Process Number—Number of zombie processes. Click the History Record
icon ![]() to view the
history graph of the zombie process number.
to view the
history graph of the zombie process number.
Zombie Process
The Zombie Process area contains the following fields:
· Process Name—Name of the zombie process.
· ID—ID of the zombie process.
· Parent ID—ID of the parent process for the zombie process.
· CPU Usage—CPU usage of the zombie process.
¡ Click
the Set Threshold icon ![]() to set alarm thresholds for the CPU usage of the zombie process.
to set alarm thresholds for the CPU usage of the zombie process.
¡ Click
the History Record icon
![]() to view the history graph of the CPU usage of the zombie process.
to view the history graph of the CPU usage of the zombie process.
· Memory usage—Memory usage of the zombie process. Click the History Record
icon ![]() to view the history graph of the memory usage of the zombie
process.
to view the history graph of the memory usage of the zombie
process.
· CPU Time—Duration that the zombie process occupies the CPU.
Application Traffic
The Application Traffic area contains the following fields:
· Last Hour's Traffic—Total traffic sent and received by the NeoKylin application over the last 1 hour.
· Today's Traffic—Total traffic sent and received by the NeoKylin application since 00:00 today.
Network Interface
The Network Interface area contains the following fields:
· Interface Name—Identifier of a network interface card in NeoKylin. APM monitors both physical and virtual (logical) network interface cards.
· Receive Rate—Receive rate of a network interface card. Click the Set Threshold icon ![]() to set alarm thresholds for the receive rate of NeoKylin network interface cards
to set alarm thresholds for the receive rate of NeoKylin network interface cards
· Send Rate—Send rate of a network interface card.
· Input Error Packet Rate—Number of inbound erroneous packets per second on a network interface card.
· Output Error Packet Rate—Number of outbound erroneous packets per second on a network interface card.
Error Log
APM examines the NeoKylin error logs during polling and displays the first 10 error logs obtained in the polling in the NeoKylin application monitor report. Click More to view all error logs in the last polling interval if the report has more than 10 error logs.
The Error Log area contains the following fields:
· Time—Time when the error occurred.
· Log—Content of the error log.
Process
By default, the list does not contain any
processes. To monitor processes on NeoKylin, click the Configuration icon ![]() to select the processes to be monitored.
APM collects the index data for the monitored processes when APM polls applications
next time, including the CPU usage ratio and memory usage ratio.
to select the processes to be monitored.
APM collects the index data for the monitored processes when APM polls applications
next time, including the CPU usage ratio and memory usage ratio.
The Process area contains the following fields:
· Config—Click the Config icon ![]() to select processes to be monitored in
the monitor list window.
to select processes to be monitored in
the monitor list window.
· Process Name—Name of the monitored process. For processes with the same name but different Process Identifiers (PIDs), APM collects the CPU usage ratio and the memory usage ratio for each process. For example, the application may generate a lot of httpd processes, and APM collects the CPU usage ratio and the memory usage ratio for each httpd process selected.
· ID—Unique identifier of the process on the OS.
· Parent ID—ID of the parent process for the process.
· CPU Usage—CPU usage ratio of the process.
¡ Click
the Set Threshold icon ![]() to set alarm thresholds for the NeoKylin process CPU usage.
to set alarm thresholds for the NeoKylin process CPU usage.
¡ Click the History Record icon ![]() to view the history
graph of the CPU usage.
to view the history
graph of the CPU usage.
· Memory Usage—Memory usage ratio of the process. Click the History
Record icon ![]() to view the history graph of the memory usage.
to view the history graph of the memory usage.
· CPU Time—Duration that the process occupies the CPU.
I/O State
APM can monitor the I/O status of disks, partitions, or logical volumes in NeoKylin.
The I/O State area contains the following fields:
· Device Name—Name of the disk, partition, or logical volume in NeoKylin.
· I/O Read Rate—Data output rate of the disk, partition, or logical volume in NeoKylin.
· I/O Write Rate—Data input rate of the disk, partition, or logical volume in NeoKylin.
inode
Index nodes (inodes) are required when you create a file or directory in the NeoKylin file system. If the inodes are used up, you cannot create a file or directory in the file system.
The inode area contains the following fields:
· File System—File system of the NeoKylin system.
· Total—Total number of available inodes in the file system. Click the History Record icon ![]() to view the change
trend of the total number of inodes in the file system.
to view the change
trend of the total number of inodes in the file system.
· Free—Number of inodes that are not used in the file system. Click the History Record icon ![]() to view the change
trend of the number of idle inodes in the file system.
to view the change
trend of the number of idle inodes in the file system.
· In Use—Number of inodes that have been used in the file system. Click the History Record icon ![]() to view the change
trend of the number of used inodes in the file system.
to view the change
trend of the number of used inodes in the file system.
· inode Usage Ratio—Usage of inodes in the file system.
¡ Click
the Set Threshold icon ![]() to set alarm thresholds for the file system inode
usage.
to set alarm thresholds for the file system inode
usage.
¡ Click
the History Record icon ![]() to view the history graph of inode usage in the file system.
to view the history graph of inode usage in the file system.
Vol Group
Logical volume management manages disk partitions in the NeoKylin operating system. It combines one or more physical disks to a volume group and creates a logical volume for the volume group. One logical volume equals a disk partition.
The Vol Group area contains the following fields:
· Name—Name of the volume group.
· Size—Size of the volume group. Click the History
Record icon ![]() to view the history
graph of the volume group size.
to view the history
graph of the volume group size.
· In Use—Volume group space that is used. Click the History
Record icon ![]() to view the change
trend of the used volume group space.
to view the change
trend of the used volume group space.
· Free Space—Volume group space that are not used. Click the History Record icon ![]() to view the history
graph of the volume group space.
to view the history
graph of the volume group space.
· Usage Ratio—Usage of the volume group space.
¡ Click
the Set Threshold icon ![]() to set alarm
thresholds for the space usage of the volume group.
to set alarm
thresholds for the space usage of the volume group.
¡ Click
the History Record icon
![]() to view the history graph of the space usage of the volume group.
to view the history graph of the space usage of the volume group.
Session Information
The Session Information area displays NeoKylin session login information and contains the following fields:
· User Name—User logging in to NeoKylin.
· TTY—TTY used by the user.
· Login IP—Client IP address used when the user logs in to NeoKylin. The value of :0 indicates that the user logs in to NeoKylin through the console.
· Login Time—Time when the user logged in to NeoKylin.
· Idle—Idle time after the user logged in to NeoKylin.
· Command—Most recently executed command after the user logged in to NeoKylin.
Memory
The Memory area displays memory information for the server where the OS is located. To monitor the memory, make sure the BMC is installed on the server.
The Memory area contains the following fields:
· Component Name—Name of the component.
· Status—State of the component.
Power Supply
The Power Supply area displays power supply information for the server where the OS is located. To monitor the power supply, make sure the BMC is installed on the server.
The Power Supply area contains the following fields:
· Component Name—Name of the component.
· Status—State of the component.
Temperature
The Temperature area displays temperature information for the server where the OS is located. To monitor the temperature, make sure the BMC is installed on the server.
The Temperature area contains the following fields:
· Component Name—Name of the component.
· Status—State of the component.
· Value—Temperature of the component.
Fan
The Fan area displays fan information for the server where the OS is located. To monitor the fans, make sure the BMC is installed on the server.
The Fan area contains the following fields:
· Component Name—Name of the component.
· Status—State of the component.
Board
The Board area displays board information about the server where the OS is located. To monitor the board, make sure the BMC is installed on the server.
The Board area contains the following fields:
· Manufacturer—Manufacturer of the board.
· Product Name—Name and model of the product to which the board applies.
· Production Date—Production date of the board.
· Part Number—Part number of the board.
· Serial Number—Serial number of the board.
· System GUID—GUID of the board.
Chassis
The Chassis area displays chassis information for the server where the OS is located. To monitor the chassis, make sure the BMC is installed on the server.
The Chassis area contains the following fields:
· BMC Version—Version of the BMC.
· IPMI Driver Type—Type of the IPMI driver.
· Self-Check Result—Self-check result of the server.
· Power Supply Status—State of the power supply for the chassis.
· Chassis Intrusion—Whether the chassis is open or has been opened before.
· Front Panel—Whether the front panel is open.
· Cooling Fan Fault—Whether the cooling fans operate correctly.
· Disk Fault—Whether the disks operate correctly.
· Power-On Hours—Hours since the chassis was started.
Rocky
Rocky is an operating system that uses Linux kernels. By monitoring Rocky, operators can view how the operating performance of a Rocky server affects network applications on the system.
Adding a Rocky application monitor
APM monitors Rocky applications through SNMP, CLI, or agents. When you add Rocky application monitors, follow these guidelines:
· To monitor a Rocky application through an agent, deploy the agent on the host where the Rocky operating system is installed. For more information about agents, see "APM agent management."
· To monitor a Rocky application through SNMP:
¡ Enable and configure SNMP for the host on which the Rocky operating system is installed. For more information about enabling SNMP on Rocky, see the Rocky administrator guide.
¡ Obtain the read-only and read-write community strings.
· To monitor a Rocky application through CLI:
¡ Enable and configure Telnet or SSH on Rocky. For more information about enabling Telnet or SSH on Rocky, see the Rocky administrator guide.
¡ Obtain the username and password of the Telnet or SSH user who has the Rocky administrator's privileges.
· Add the Rocky hosts to the IMC platform so that APM can obtain and display network connections of the hosts and their access devices in the application topology. For more information about adding hosts to the IMC platform, see H3C Intelligent Management Center v7.3 Enterprise and Standard Platform Administrator Guide.
· To view traffic statistics in the monitor report of the Rocky application, make sure at least one probe is configured in APM. After a Rocky application monitor is added, APM sends the IP address of the monitored Rocky application to the probes for traffic collection.
To add a Rocky application monitor:
1. Click the Resource tab.
2. Open the Add Application page by using one of the following methods:
¡ From the navigation tree, select Application Manager > Add Application.
The page displays all application types that can be monitored by APM.
¡ From the navigation tree, select Application Manager > Application Monitor, and then click Add on the application monitor list page.
3. Click Rocky of the Linux Server Monitor class.
The page for adding a Rocky application monitor opens.
Configure the following parameters:
¡ IP Address—Enter the IP address of the host on which the Rocky application to be monitored is installed. If the host is already added to the IMC platform, you can also click Select, and then select the host in the Select Devices window. For information about selecting a host, see "Quick start." APM automatically checks the specified IP address and associates the application monitor with the host managed in the IMC platform.
¡ Name—Enter a unique application monitor name. As a best practice, name the application monitor as application type_host IP address.
¡ Use Template—Select Enable or Disable from the list.
¡ Template—Click the Configure icon ![]() next to the Template field to select an existing template. The Template field
is automatically populated with the name of the selected template. For more
information about configuring application templates, see "Configuration management." This field is displayed only when you select Enable from the Use
Template list.
next to the Template field to select an existing template. The Template field
is automatically populated with the name of the selected template. For more
information about configuring application templates, see "Configuration management." This field is displayed only when you select Enable from the Use
Template list.
¡ Description—Enter a description for the application monitor.
¡ Polling Interval (min)—Select a polling interval for the application monitor. Options are 1, 2, 3, 4, 5, 10, 20, and 30. The default polling interval is 5 minutes. A shorter polling interval provides more accurate realtime data, but consumes more system resources. This field is available only when you select Disable from the Use Template list.
¡ Monitor Type—Select the protocol (SSH, SNMP, or Telnet) through
which APM monitors the Rocky
application, and then click the Configure icon ![]() to configure
related parameters. This field is available only when
you select Disable from the Use Template list.
to configure
related parameters. This field is available only when
you select Disable from the Use Template list.
When SNMP is selected, configure the following parameters:
- Edit SNMP Parameters—Select this option if you want to manually configure SNMP parameters for APM. Make sure the SNMP settings are the same as those on Rocky.
- Select an Existing Template—Select this option if you want to select an existing SNMP template for APM. For information about setting SNMP parameter templates, see H3C Intelligent Management Center v7.3 Enterprise and Standard Platform Administrator Guide.
- Parameter Type—Select the SNMP parameter type. Options are SNMPv1, SNMPv2c, and SNMPv3 Template. The SNMPv3 Template option is available only when Select an Existing Template is selected.
- Read-Only Community String—Enter the SNMP read-only community string, with which APM can read MIB variables from the Rocky host.
- Read-Write Community String—Enter the read-write SNMP community string, with which APM can read MIB variables from, or write MIB variables to, the Rocky host.
- Timeout (1-60 seconds)—Enter the maximum time period that APM waits for an SNMP response from Rocky. The value range is 1 to 60 seconds and the default is 4 seconds. If no SNMP response is received from Rocky within the timeout time, APM considers that the interaction has failed.
- Retries (1-20)—Enter how many times APM retries to send SNMP packets to the Rocky host.
When SSH is selected, configure the following parameters:
- Edit SSH Parameters—Select this option if you want to manually configure SSH parameters for APM. Make sure the SSH settings are the same as those on Rocky.
- Select an Existing Template—Select this option if you want to select an existing SSH template for APM. For information about setting SSH parameter templates, see H3C Intelligent Management Center v7.3 Enterprise and Standard Platform Administrator Guide.
- Authentication Mode—Select the authentication mode for SSH users. Options are Password, Private Key, Password + Private Key, Password + Super Password, Private Key + Super Password, and Password + Private Key + Super Password.
The following parameters to be configured vary with authentication modes:
Username—Enter the SSH username. The user must have the Rocky administrator's privilege.
Password—Enter the password of the SSH user.
Private Key File—Enter the directory of the SSH private key file or browse to the file.
Private Key Password—Enter the password to decrypt the SSH private key file.
Super Password—Enter the super password with which an SSH user can elevate privileges after login.
- Port—Enter the SSH port on Rocky.
- Timeout (1-120 seconds)—Enter the maximum time period that APM waits for an SSH response from Rocky. The value range is 1 to 120 seconds and the default is 10 seconds. If no SSH response is received from Rocky within the timeout time, APM considers that the interaction has failed.
- Retries (1-5)—Enter how many times APM retries to send SSH packets to the Rocky host.
When Telnet is selected, configure the following parameters:
- Edit Telnet Parameters—Select this option if you want to manually configure Telnet parameters for APM. Make sure the Telnet settings are the same as those on Rocky.
- Select an Existing Template—Select this option if you want to select an existing Telnet template for APM. For information about setting Telnet parameter templates, see H3C Intelligent Management Center v7.3 Enterprise and Standard Platform Administrator Guide.
- Authentication Mode—Select the authentication mode for Telnet users. Options are Password (No Operator or Super/Manager), Username + Password, Super/Manager Password, Password + Super/Manager Password (No Operator), Username + Password + Super/Manager Password, No Username + No Password, and Username + No Password.
The following parameters to be configured vary with authentication modes:
Username—Enter the Telnet username. The user must have the Rocky administrator's privilege.
Password—Enter the password of the Telnet user.
Super Password—Enter the super password with which a Telnet user can elevate privileges after login.
- Timeout (1-60 seconds)—Enter the maximum time period that APM waits for a Telnet response from Rocky. The value range is 1 to 60 seconds and the default is 4 seconds. If no Telnet response is received from Rocky within the timeout time, APM considers that the interaction has failed.
¡ Contact—Enter the contact information, such as the name, email address, and telephone number. The default is the username of the operator who created the application monitor. This field is available only when you select Disable from the Use Template list.
¡ APM Server—Select an APM server to monitor the application. The options are in server-address (application-type:n/N) format. The letter n indicates the number of Rocky applications monitored on the APM server. The letter N indicates the total number of applications monitored on the APM server. Server address 127.0.0.1 indicates that APM and the IMC platform are deployed on the same server.
¡ Related Applications—Click Add next to this field. On the Select Application window, enter a partial or complete name to filter applications, select the applications that Rocky depends on, and then click OK.
Operating system applications cannot be selected. Operators can view all dependencies of the application in the dependency topology.
¡ Application Group—Specify an application group for the Rocky application.
- To specify an existing application group, click Add, select an application group, and then click OK.
- To specify a new application group, click Add Application Group, configure the application group settings, and then click OK.
¡ Detect Application—Select this parameter if you want to enable application detection. Application detection enables APM to verify connection to the application by using the previous parameter settings, and to determine whether to add the application monitor based on the verification result. APM adds the application monitor only when it can connect to the application. When this parameter is not selected, APM adds the application monitor without verifying the connection.
4. Click OK.
Modifying a Rocky application monitor
Authorized users can modify all parameters except the IP address and the APM server for a Rocky application monitor. When the IP address of a monitored Rocky host changes, operators must add a new application monitor for the host. The new application monitor cannot inherit the history data from the previous application monitor.
To modify a Rocky application monitor:
1. Click the Resource tab.
2. From the navigation tree, select Application Manager > Application Monitor.
The page displays all application types that can be monitored by APM.
3. Click the Modify icon ![]() for the Rocky application monitor you want to modify.
for the Rocky application monitor you want to modify.
The page for modifying the Rocky application monitor opens.
4. Modify the parameters as needed, except the IP address and the APM server.
For more information about parameter settings, see "Adding a Rocky application monitor."
5. Click OK.
Viewing the Rocky application monitor report
After a Rocky application monitor is added, APM collects application index data, evaluates the availability and health status, and updates the monitor report. The report shows the index values obtained from the most recent polling of the application.
To access the Rocky application monitor report:
1. Click the Resource tab.
2. From the navigation tree, select Application Manager > Application Monitor.
The application monitor list page displays all application monitors.
3. Click the name of a Rocky application monitor to display the report.
Figure 63 shows part of a Rocky application monitor report.
Figure 63 Part of a Rocky application monitor report
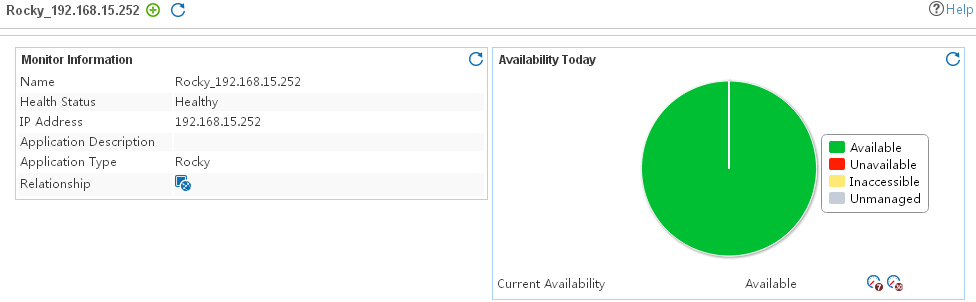
Monitor Information
The Monitor Information area contains the following fields:
· Name—Application monitor name.
· Health Status—Health status of the Rocky application.
· IP Address—IP address of the Rocky host.
· Application Type—Type of the monitored application, which is always Rocky.
· Version—Version of the Rocky operating system.
· System Running Time—Duration since the startup of the Rocky application to the time when APM last polled the Rocky application.
· Last Polling Time—Time when APM last polled the Rocky application.
· Relationship—Click the Related Applications icon ![]() to view dependencies between the Rocky application and
other applications in a dependency topology view. For more information about dependency topologies, see "Topology and application group management."
to view dependencies between the Rocky application and
other applications in a dependency topology view. For more information about dependency topologies, see "Topology and application group management."
· Top5 Unrecovered Alarm—Latest five unrecovered alarms on the Rocky host. This field is not displayed if no alarm is generated by the Rocky application.
Availability Today
The Availability Today area contains the following fields:
· Current Availability—Availability of the Rocky application.
¡ Click
the Weekly History icon ![]() to view the availability of the Rocky application in the last 7 days.
to view the availability of the Rocky application in the last 7 days.
¡ Click
the Monthly History icon ![]() to view the availability of the Rocky application in the last 30 days.
to view the availability of the Rocky application in the last 30 days.
· Available Time—Total amount of time that the Rocky application was available after 00:00 today.
· Unavailable Time—Total amount of time that the Rocky application was unavailable after 00:00 today.
· Inaccessible Time—Total amount of time that the Rocky application was inaccessible after 00:00 today.
· Unmanaged Time—Total amount of time that the Rocky application was unmanaged after 00:00 today.
The statistics collection started when the application monitor was added. An availability time field is not displayed when its value is 0.
CPU Usage Ratio
The CPU Usage Ratio area contains the following field:
· CPU Usage Ratio—CPU usage ratio of the Rocky application.
¡ Click
the Set Threshold icon ![]() to set alarm thresholds for the CPU usage
ratio.
to set alarm thresholds for the CPU usage
ratio.
¡ Click the History Record icon ![]() to view the history
graph of the CPU usage ratio.
to view the history
graph of the CPU usage ratio.
Memory Usage Ratio
The Memory Usage Ratio area displays information about physical memory and swap memory.
The Memory Usage Ratio area contains the following fields:
· Physical Memory—Physical memory of the Rocky application, which corresponds to the physical memory bar.
· Swap—Swap memory of the Rocky application, which corresponds to a disk space.
· Total—Total amount of the physical or swap memory.
· In Use—Size of the physical or swap memory being used. Click the History Record icon ![]() to view the history
graph of the physical or swap memory being used.
to view the history
graph of the physical or swap memory being used.
· Usage Ratio—Physical or swap memory usage ratio. The usage ratio is calculated by using the following formula: Usage ratio = Memory in use/Total memory x 100%.
¡ Click
the Set Threshold icon ![]() to set alarm thresholds for the physical or
swap memory.
to set alarm thresholds for the physical or
swap memory.
¡ Click
the History Record icon
![]() to view the history graph of the physical or swap memory usage.
to view the history graph of the physical or swap memory usage.
Ping Test
When the polling interval expires, APM pings the Rocky host by sending up to three ICMP packets. If APM receives a response, it considers the ping test a success and records the response time. If APM receives no response after three tries, it considers the ping test a failure.
The Ping Test area contains the following fields:
· Response Time—Round trip response time of the Rocky application in the last ping operation. Click the History Record icon ![]() to view the history
graph of the response time.
to view the history
graph of the response time.
· Packets Sent—Number of ICMP packets that are sent in the last ping operation. The
maximum value is 3. Click
the History Record icon ![]() to view the history graph of the sent packets.
to view the history graph of the sent packets.
· Packets Received—Number
of ICMP response packets that are received in the last ping operation. The value is 0 or 1. Click the History Record icon ![]() to view the history
graph of the received packets.
to view the history
graph of the received packets.
System Load
APM counts the average system load over 1 minute, 5 minutes, and 15 minutes. The average system load records the average number of processes in the run queue over a specific time interval. An overloaded system results in severe performance issues. The load threshold value varies by CPU model.
The System Load area contains the following fields:
· System Load/Min—Average
system load over the last 1 minute. Click the History
Record icon ![]() to view the history graph of the system load over the last 1 minute.
to view the history graph of the system load over the last 1 minute.
· System Loads/5 Min—Average
system load over the last 5 minutes. Click the History
Record icon ![]() to view the history graph of the system load over the last 5
minutes.
to view the history graph of the system load over the last 5
minutes.
· System Loads/15 Min—Average system load over the last 15 minutes. Click the History Record icon ![]() to view the history graph of the system load over the last 15
minutes.
to view the history graph of the system load over the last 15
minutes.
File System Usage Ratio
The Rocky file directory structure contains one root directory and multiple subdirectories. File systems are mounted to the root directory or subdirectories under the root directory. Each file system corresponds to a physical disk partition or a logical volume. Use the File System Usage Ratio area to display how the available disk space is used.
The File System Usage Ratio area contains the following fields:
· Name—Mount point of the file system in the Rocky directory structure.
· File System Usage Ratio—Space usage ratio of the Rocky file system.
¡ Click
the Set Threshold icon ![]() to set alarm thresholds for the file system usage.
to set alarm thresholds for the file system usage.
¡ Click the History Record icon ![]() to view the history
graph of the file system usage ratio.
to view the history
graph of the file system usage ratio.
· In Use—Used space of the file system. Click the History
Record icon ![]() to view the history graph of the used file system
space.
to view the history graph of the used file system
space.
· Free Space—Free space of the file system.
Click the History Record
icon ![]() to view the history graph of the free file system space.
to view the history graph of the free file system space.
Zombie Process Number
The Zombie Process Number area contains the following field:
· Zombie Process Number—Number of zombie processes. Click the History Record
icon ![]() to view the
history graph of the zombie process number.
to view the
history graph of the zombie process number.
Zombie Process
The Zombie Process area contains the following fields:
· Process Name—Name of the zombie process.
· ID—ID of the zombie process.
· Parent ID—ID of the parent process for the zombie process.
· CPU Usage—CPU usage of the zombie process.
¡ Click
the Set Threshold icon ![]() to set alarm thresholds for the CPU usage of the zombie process.
to set alarm thresholds for the CPU usage of the zombie process.
¡ Click
the History Record icon
![]() to view the history graph of the CPU usage of the zombie process.
to view the history graph of the CPU usage of the zombie process.
· Memory usage—Memory usage of the zombie process. Click the History Record
icon ![]() to view the history graph of the memory usage of the zombie
process.
to view the history graph of the memory usage of the zombie
process.
· CPU Time—Duration that the zombie process occupies the CPU.
Application Traffic
The Application Traffic area contains the following fields:
· Last Hour's Traffic—Total traffic sent and received by the Rocky application over the last 1 hour.
· Today's Traffic—Total traffic sent and received by the Rocky application since 00:00 today.
Network Interface
The Network Interface area contains the following fields:
· Interface Name—Identifier of a network interface card in Rocky. APM monitors both physical and virtual (logical) network interface cards.
· Receive Rate—Receive rate of a network interface card. Click the Set Threshold icon ![]() to set alarm thresholds for the receive rate of Rocky network interface cards
to set alarm thresholds for the receive rate of Rocky network interface cards
· Send Rate—Send rate of a network interface card.
· Input Error Packet Rate—Number of inbound erroneous packets per second on a network interface card.
· Output Error Packet Rate—Number of outbound erroneous packets per second on a network interface card.
Error Log
APM examines the Rocky error log messages during polling and displays the first 10 error log messages obtained in the polling in the Rocky application monitor report. Click More to view all error log messages in the last polling interval if the report has more than 10 error logs.
The Error Log area contains the following fields:
· Time—Time when the error occurred.
· Log—Content of the error log message.
Process
By default, the list does not contain any
processes. To monitor processes on Rocky, click the Configuration icon ![]() to select the processes to be monitored.
APM collects the index data for the monitored processes when APM polls applications
next time, including the CPU usage ratio and memory usage ratio.
to select the processes to be monitored.
APM collects the index data for the monitored processes when APM polls applications
next time, including the CPU usage ratio and memory usage ratio.
The Process area contains the following fields:
· Config—Click the Config icon ![]() to select processes to be monitored in
the monitor list window.
to select processes to be monitored in
the monitor list window.
· Process Name—Name of the monitored process. For processes with the same name but different process identifiers (PIDs), APM collects the CPU usage ratio and the memory usage ratio for each process. For example, the application may generate a lot of httpd processes, and APM collects the CPU usage ratio and the memory usage ratio for each httpd process selected.
· ID—Unique identifier of the process on the OS.
· Parent ID—ID of the parent process for the process.
· CPU Usage—CPU usage ratio of the process.
¡ Click
the Set Threshold icon ![]() to set alarm thresholds for the Rocky process CPU usage.
to set alarm thresholds for the Rocky process CPU usage.
¡ Click the History Record icon ![]() to view the history
graph of the CPU usage.
to view the history
graph of the CPU usage.
· Memory Usage—Memory usage ratio of the process. Click the History
Record icon ![]() to view the history graph of the memory usage.
to view the history graph of the memory usage.
· CPU Time—Duration that the process occupies the CPU.
I/O State
APM can monitor the I/O status of disks, partitions, and logical volumes in Rocky.
The I/O State area contains the following fields:
· Device Name—Name of the disk, partition, or logical volume in Rocky.
· I/O Read Rate—Data output rate of the disk, partition, or logical volume in Rocky.
· I/O Write Rate—Data input rate of the disk, partition, or logical volume in Rocky.
inode
Index nodes (inodes) are required when you create files or directories in the Rocky file system. If the inodes are used up, you cannot create a file or directory in the file system.
The inode area contains the following fields:
· File System—File system of the Rocky system.
· Total—Total number of available inodes in the file system. Click the History Record icon ![]() to view the change
trend of the total number of inodes in the file system.
to view the change
trend of the total number of inodes in the file system.
· Free—Number of inodes that are not used in the file system. Click the History Record icon ![]() to view the change
trend of the number of idle inodes in the file system.
to view the change
trend of the number of idle inodes in the file system.
· In Use—Number of inodes that have been used in the file system. Click the History Record icon ![]() to view the change
trend of the number of used inodes in the file system.
to view the change
trend of the number of used inodes in the file system.
· inode Usage Ratio—Usage of inodes in the file system.
¡ Click
the Set Threshold icon ![]() to set alarm thresholds the inode usage.
to set alarm thresholds the inode usage.
¡ Click
the History Record icon ![]() to view the history graph of inode usage.
to view the history graph of inode usage.
Vol Group
Logical volume management manages disk partitions in the Rocky operating system. It combines one or more physical disks to form a volume group, and allows you to create logical volumes on the volume group. One logical volume equals a disk partition.
The Vol Group area contains the following fields:
· Name—Name of the volume group.
· Size—Size of the volume group. Click the History
Record icon ![]() to view the history
graph of the volume group size.
to view the history
graph of the volume group size.
· In Use—Volume group space that is used. Click the History
Record icon ![]() to view the change
trend of the used volume group space.
to view the change
trend of the used volume group space.
· Free Space—Volume group space that is not used. Click the History Record icon
![]() to view the history graph of the volume group space that is not used.
to view the history graph of the volume group space that is not used.
· Usage Ratio—Usage of the volume group space.
¡ Click
the Set Threshold icon ![]() to set alarm
thresholds of the space usage
of the volume group.
to set alarm
thresholds of the space usage
of the volume group.
¡ Click
the History Record icon
![]() to view the history graph of the space usage of the volume group.
to view the history graph of the space usage of the volume group.
Session Information
The Session Information area displays Rocky session login information and contains the following fields:
· User Name—User logged in to Rocky.
· TTY—TTY line used by the user.
· Login IP—Client IP address used by the user at login. The value of :0 indicates that the user logged in to Rocky through the console.
· Login Time—Time when the user logged in to Rocky.
· Idle—Idle time after the user logged in to Rocky.
· Command—Most recently executed command after the user logged in to Rocky.
Database server monitor
This chapter describes how to add and modify monitors for database servers, and how to view the monitor reports.
SQL Server
SQL Server is a Database Management System (DBMS) developed by Microsoft. The database performance and stability affects the operation of service applications. APM supports monitoring SQL Server applications.
Adding a SQL Server application monitor
APM can locally or remotely monitor SQL Server applications through JDBC. When you add SQL Server application monitors, follow these guidelines:
· To locally monitor SQL Server applications, install agents on the hosts where SQL Server applications are deployed. For more information about installing agents, see "APM agent management."
· Obtain the username and password of the user who has the SQL Server administrator's privileges and the authentication type.
· Obtain the instance names for SQL Server applications if the default instance name is not used.
· Add SQL Server hosts to the IMC platform so that APM can obtain and display network connections of the hosts and their access devices in the application topology. For more information about adding hosts to the IMC platform, see H3C Intelligent Management Center v7.3 Enterprise and Standard Platform Administrator Guide.
· To view traffic statistics in the monitor report of the SQL Server application, make sure at least one probe is configured in APM. After a SQL Server application monitor is added, APM sends the IP address and service port of the monitored SQL Server application to the probes for traffic collection.
To add a SQL Server application monitor:
1. Click the Resource tab.
2. Open the Add Application page by using one of the following methods:
¡ From the navigation tree, select Application Management > Add Application.
The page displays all application types that can be monitored by APM.
¡ From the navigation tree, select Application Manager > Application Monitor, and then click Add on the application monitor list page.
3. Click SQL Server of the Database Server Monitor class.
The page for adding a SQL Server application monitor opens.
4. Configure the following parameters:
¡ IP Address—Enter the IP address of the host on which the SQL Server application to be monitored is installed. APM automatically checks the IP address and associates the application monitor with the host managed in the IMC platform. If the host is already added to the IMC platform, you can also click Select, and then select the host from the Select Devices window. For information about selecting a host, see "Quick start."
¡ Name—Enter a unique application monitor name. As a best practice, name the application monitor as application type_host IP address.
¡ Use Template—Select Enable or Disable from the list.
¡ Template—Click
the Configure icon ![]() next to the Template field to select an existing template. The Template field
is automatically populated with the name of the selected template. For more
information about configuring application templates, see "Configuration management." This field is displayed only when you select Enable from the Use
Template list.
next to the Template field to select an existing template. The Template field
is automatically populated with the name of the selected template. For more
information about configuring application templates, see "Configuration management." This field is displayed only when you select Enable from the Use
Template list.
¡ Description—Enter a description for the application monitor.
¡ Application Monitor Port—Enter the service port number for the SQL Server application, 1433 by default. This field is available only when you select Disable from the Use Template list.
¡ Traffic Collection Port—Enter the service port number for the SQL Server application. This field is displayed only when at least one probe is configured for APM and when you select Enable from the Use Template list.
¡ Polling Interval (min)—Select a polling interval for the application monitor. Options are 1, 2, 3, 4, 5, 10, 20, and 30. The default polling interval is 5 minutes. A shorter polling interval improves real-time data accuracy at the expense of system resources. This field is available only when you select Disable from the Use Template list.
¡ Authentication Type—Select an authentication type for the SQL Server application. Options are Windows authentication and SQL Server authentication. This field is available only when you select Disable from the Use Template list.
¡ Username—Enter the username of the SQL Server administrator. This field is available only when you select Disable from the Use Template list.
¡ Password—Enter the password of the SQL Server administrator. This field is available only when you select Disable from the Use Template list.
¡ Instance Name—Enter the SQL Server instance name that is the same as the name configured when the SQL Server was installed. Keep this field empty if the default instance name is used. This field is available only when you select Disable from the Use Template list.
¡ Contact—Enter contact information, such as the name, email address, and telephone number. The default is the username of the operator who created the application monitor. This field is available only when you select Disable from the Use Template list.
¡ APM Server—Select an APM server to monitor the application. The options are in server-address (application-type:n/N) format. The letter n indicates the number of SQL Server applications monitored on the APM server. The letter N indicates the total number of applications monitored on the APM server. Server address 127.0.0.1 indicates that APM and the IMC platform are deployed on the same server.
¡ Related Applications—Click Add next to this field. On the Select Application window, enter a partial or complete name to filter applications, select the applications that SQL Server depends on, and then click OK.
Operating system applications cannot be selected. Operators can view all dependencies of the application in the dependency topology. APM automatically adds the dependencies between SQL Server and operating system applications by IP address and displays their dependencies in the application topology.
¡ Application Group—Specify an application group for the SQL Server application.
- To specify an existing application group, click Add, select an application group, and then click OK.
- To specify a new application group, click Add Application Group, configure the application group settings, and then click OK.
¡ Detect Application—Select this parameter if you want to enable application detection. Application detection enables APM to verify connection to the application by using the previous parameter settings, and to determine whether to add the application monitor based on the verification result. APM adds the application monitor only when it can connect to the application. When this parameter is not selected, APM adds the application monitor without verifying the connection.
5. Click OK.
Modifying a SQL Server application monitor
Authorized users can modify all parameters except the IP address and the APM server for a SQL Server application monitor. When the IP address of the SQL Server host changes, operators must add a new application monitor for the host. The new application monitor cannot inherit the history data from the previous application monitor.
To modify a SQL Server application monitor:
1. Click the Resource tab.
2. From the navigation tree, select Application Manager > Application Monitor.
The application monitor list page opens.
3. Click the Modify icon ![]() for the SQL
Server application monitor you want to modify.
for the SQL
Server application monitor you want to modify.
The page for modifying the SQL Server application monitor opens.
4. Modify the parameters as needed, except the IP address and the APM server.
For more information about parameter settings, see "Adding a SQL Server application monitor."
5. Click OK.
Viewing the SQL Server application monitor report
After a SQL Server application monitor is added, APM collects index data of the application, and calculates its availability and health status. You can obtain monitor indexes for the SQL Server application by viewing the monitor report.
To access a SQL Server application monitor report:
1. Click the Resource tab.
2. From the navigation tree, select Application Manager > Application Monitor.
The application monitor list page displays all application monitors.
3. Click the name of a SQL Server application monitor to display the report.
Figure 64 shows part of a SQL Server application monitor report.
Figure 64 Part of a SQL Server application monitor report
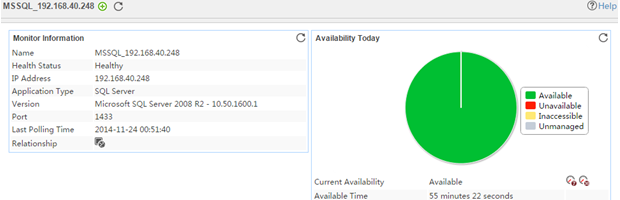
Monitor Information
The Monitor Information area contains the following fields:
· Name—Application monitor name.
· Health Status—Health status of the SQL Server application.
· IP Address—IP address of the SQL Server host.
· Application Type—Type of the monitored application, which is always SQL Server.
· Version—Version of the SQL Server application.
· Port—Service port of the SQL Server application.
· Last Polling Time—Time when APM last polled the SQL Server application.
· Relationship—Click the Relationship icon ![]() to view dependencies between the SQL Server application and other applications in the dependency topology. For more information about
dependency topologies, see "Topology and application group
management."
to view dependencies between the SQL Server application and other applications in the dependency topology. For more information about
dependency topologies, see "Topology and application group
management."
· Top5 Unrecovered Alarm—Latest five unrecovered alarms on SQL Server host. The alarm level is identified by color: yellow for minor alarms, orange for major alarms, and red for critical alarms. This field is not displayed if no alarm is generated by the SQL Server application.
Availability Today
The Availability Today area contains the following fields:
· Current Availability—Availability of the SQL Server application in the last polling interval.
¡ Click
the Weekly History icon![]() to view the availability of the SQL Server application in the last 7
days.
to view the availability of the SQL Server application in the last 7
days.
¡ Click
the Monthly History icon![]() to view the availability of the SQL Server application in the last 30
days.
to view the availability of the SQL Server application in the last 30
days.
· Available Time—Total amount of time that the SQL Server application was available after 00:00 today.
· Unavailable Time—Total amount of time that the SQL Server application was unavailable after 00:00 today.
· Inaccessible Time—Total amount of time that the SQL Server application was inaccessible after 00:00 today.
· Unmanaged Time—Total amount of time that the SQL Server application was unmanaged after 00:00 today.
The statistics collection started when the application monitor was added. An availability time field is not displayed when its value is 0.
Memory Usage
The Memory Usage area contains the following fields:
· Total Memory—Total size of the dynamic memory used by the SQL Server application in the last polling interval.
· SQL Buffer—Size of the dynamic memory used by the SQL Server application for SQL cache in the last polling interval. Click the History
Record icon ![]() to view the history graph of the SQL buffer.
to view the history graph of the SQL buffer.
· Optimizer Memory—Size of the dynamic
memory used by the SQL Server application to query optimization in the last polling
interval. Click the History Record
icon ![]() to view the
history graph of the optimizer memory.
to view the
history graph of the optimizer memory.
· Lock Memory—Size of the dynamic
memory used by the SQL Server application for locks in the last polling interval. Click the History Record icon ![]() to view the
history graph of the lock memory.
to view the
history graph of the lock memory.
· Connection Memory—Size of the dynamic
memory used by the SQL Server application to maintain connections in the last polling
interval. Click the History Record
icon ![]() to view the
history graph of the connection memory.
to view the
history graph of the connection memory.
· Granted Workspace Memory—Size of the dynamic memory that the SQL Server application allocated for processes to perform operations, such as hashing, sorting, copying, and creating indexes in the last polling interval.
· Undetermined Memory—Number of processes that were waiting for the permissions to use the workspace memory in the last polling interval.
· Memory Grants Outstanding—Number of processes that were permitted to use the workspace memory in the last polling interval.
Buffer Management
The Buffer Management area contains the following fields:
· Buffer Hit Ratio—How often the required pages have been found in the buffer pool without reading from the disk in the last polling interval.
¡ Click
the Set Threshold icon ![]() to set alarm thresholds for the buffer hit
ratio.
to set alarm thresholds for the buffer hit
ratio.
¡ Click the History
Record icon ![]() to view the history graph of the buffer hit
ratio.
to view the history graph of the buffer hit
ratio.
· Page Lookups/Min—Number of requests to search for pages in the buffer pool per minute in the last polling interval. Click the History Record icon ![]() to view the history graph of the page lookups
per minute.
to view the history graph of the page lookups
per minute.
· Page Reads/Min—Number of database pages that were read from the disk per minute in the last polling interval. Click the History Record icon ![]() to view the history graph of the page reads
per minute.
to view the history graph of the page reads
per minute.
· Page Writes/Min—Number of database pages that were written to the disk per minute in the last polling interval. Click the History Record icon ![]() to view the history graph of the page writes
per minute.
to view the history graph of the page writes
per minute.
· Total Pages—Total number of pages in the SQL Server buffer, including stolen pages, available pages, and database pages in the last polling interval.
· Database Pages—Number of database pages in the buffer pool in the last polling interval.
· Free Pages—Available pages in the buffer pool in the last polling interval.
· Disk Reads—Total number of disk reads since the connection started.
· Disk Writes—Total number of disk writes since the connection started.
Connection Statistics
The Connection Statistics area contains the following fields:
· Connection Time—Time consumed when APM established the connection with the SQL Server application in the last polling interval.
¡ Click
the Set Threshold icon ![]() to set alarm thresholds for the connection
time.
to set alarm thresholds for the connection
time.
¡ Click the History
Record icon ![]() to view the history graph of the connection
time.
to view the history graph of the connection
time.
· Active Connections—Number of connections between
the SQL Server application and
its users in the last polling interval. Click the History Record icon ![]() to view the history
graph of active connections.
to view the history
graph of active connections.
· Logins/sec—Number of newly established connections per second in the last polling interval. Click the History Record icon ![]() to view the history graph of logins per
second.
to view the history graph of logins per
second.
· Logouts/sec—Number of terminated connections per second
in the last polling interval. Click the History
Record icon ![]() to view the history graph of logouts per
second.
to view the history graph of logouts per
second.
· Sessions—Number of sessions of the SQL Server.
· Running Sessions—Number of running sessions of the SQL Server.
Buffer Details
The Buffer Details area contains the following fields:
· Cache Hit Ratio—How often the required data has been found in the cache in the last polling interval.
¡ Click
the Set Threshold icon ![]() to set alarm thresholds for the cache hit
ratio.
to set alarm thresholds for the cache hit
ratio.
¡ Click the History
Record icon ![]() to view the history graph of the cache hit
ratio.
to view the history graph of the cache hit
ratio.
· Cache Objects in Use—Number of cache objects that were being used in the last polling interval. Click the History Record icon ![]() to view the history graph of the cache
objects being used.
to view the history graph of the cache
objects being used.
· Cache Object Counts—Number of cache objects in the cache in the
last polling interval. Click the History
Record icon ![]() to view the history graph of the cache object
count.
to view the history graph of the cache object
count.
· Cache Pages—Number of pages that the cache objects were using in the last polling interval. The size of
each page is 8K. Click the History Record icon ![]() to view the history
graph of cache pages.
to view the history
graph of cache pages.
Lock Details
The Lock Details area contains the following fields:
· Lock Requests/sec—Number of lock requests and the lock conversions received by the SQL Server application per second in the last polling interval.
¡ Click
the Set Threshold icon ![]() to set alarm thresholds for the lock
requests per second.
to set alarm thresholds for the lock
requests per second.
¡ Click the History
Record icon ![]() to view the history graph of the lock
requests per second.
to view the history graph of the lock
requests per second.
· Lock Waits/sec—Number of waiting lock requests per second in the last polling interval.
¡ Click
the Set Threshold icon ![]() to set alarm thresholds for the lock waits
per second.
to set alarm thresholds for the lock waits
per second.
¡ Click the History
Record icon ![]() to view the history graph of the lock waits
per second.
to view the history graph of the lock waits
per second.
· Lock Timeouts/sec—Number of lock requests that timed out per second in the last polling interval.
¡ Click
the Set Threshold icon ![]() to set alarm thresholds for the lock
timeouts per second.
to set alarm thresholds for the lock
timeouts per second.
¡ Click the History
Record icon ![]() to view the history graph of the lock
timeouts per second.
to view the history graph of the lock
timeouts per second.
· Number of Deadlocks/sec—Number of lock requests that resulted in deadlocks per second in the last polling interval.
¡ Click
the Set Threshold icon ![]() to set alarm thresholds for the number of
deadlocks per second.
to set alarm thresholds for the number of
deadlocks per second.
¡ Click the History
Record icon ![]() to view the history graph of the number of
deadlocks per second.
to view the history graph of the number of
deadlocks per second.
· Average Wait Time—Average waiting time for each lock request in the last polling interval.
¡ Click
the Set Threshold icon ![]() to set alarm thresholds for the average wait
time.
to set alarm thresholds for the average wait
time.
¡ Click the History
Record icon ![]() to view the history graph of the average wait
time.
to view the history graph of the average wait
time.
· Locks—Total number of locks.
· Deadlocks—Number of deadlocks.
· Lock TimeOut—Lock timeout time. The value of -1 indicates that the lock never times out.
· Table Locks—Number of table locks.
SQL Statistics
The SQL Statistics area contains the following fields:
· Batch Requests/Min—Number of Transact-SQL command batches that the SQL Server application received per minute in the last polling interval. A high value of this index indicates good
throughput. Click the History Record icon ![]() to view the history
graph of the batch requests per minute.
to view the history
graph of the batch requests per minute.
· SQL Compilations/Min—Times of SQL compilations per minute in the
last polling interval. This value is in steady state
after the activity of the SQL Server user becomes stable. Click the History Record icon ![]() to view the history graph of the SQL
compilations per minute.
to view the history graph of the SQL
compilations per minute.
· SQL Recompilations/Min—Times of SQL recompilations per minute in
the last polling interval. Click the History
Record icon ![]() to view the history graph of the SQL
recompilations per minute.
to view the history graph of the SQL
recompilations per minute.
· Auto Param Attempts/Min—Times of
the auto-parameterization attempts per minute in the
last polling interval. The auto-parameterization
attempt progress happens whenever the SQL Server instance tries to replace some
characters with the parameters to parameterize Transact-SQL requests. To the similar
requests, this progress can reuse the operation plan saved in the cache. Click the History Record icon ![]() to view the history graph of the auto
parameter attempts per minute.
to view the history graph of the auto
parameter attempts per minute.
· Auto Param Failures/Min—Times of the failed auto-parameterization attempts per minute in the last polling interval. The value
should be small. Click the History Record icon ![]() to view the history
graph of the auto parameter failures per minute.
to view the history
graph of the auto parameter failures per minute.
Latch Details
The Latch Details area contains the following fields:
· Latch Waits/Min—Number of waiting latch requests per second
in the last polling interval. Click the History
Record icon ![]() to view the history graph of the latch waits
per minute.
to view the history graph of the latch waits
per minute.
· Average Latch Wait Time—Average waiting time (in millisecond) for latch requests in the last polling interval. Click the History Record icon ![]() to view the history graph of the average
latch wait time.
to view the history graph of the average
latch wait time.
Access Method Details
The Access Method Details area contains the following fields:
· Full Scans/Min—Times of unrestricted base-table or full-index scans per minute in the last polling interval. Click the History Record icon ![]() to view the history graph of the full scans
per minute.
to view the history graph of the full scans
per minute.
· Range Scans/Min—Times of range scans by using indexes per minute in the last polling interval. Click the History Record icon ![]() to view the history graph of the range scans
per minute.
to view the history graph of the range scans
per minute.
· Probe Scans/Min—Number of probe scans to directly find at most one single qualified
row in an index or base table per second in the last
polling interval. Click the History
Record icon ![]() to view the history graph of the probe scans
per minute.
to view the history graph of the probe scans
per minute.
Waiting Tasks
The Waiting Tasks area contains the following field:
· Waiting Tasks—Number of tasks that are waiting for processor, I/O, or memory
resources. Click the History Record icon ![]() to view the history
data for waiting tasks.
to view the history
data for waiting tasks.
Database I/O
The Database I/O area contains the following field:
Database I/O—Transfer rate, in megabytes per second, of data from memory to disk, disk to memory, or disk to disk.
Resource Waits
The Resource Waits area contains the following fields:
· Wait Category—Categories that accumulate wait type statistics.
· Wait Time (ms/sec)—Wait time in milliseconds per second for all tasks that are waiting for one or more resources in the wait category since the last update interval.
· Average Waiter Count—Number of tasks that are waiting for one or more resources in the wait category at a typical moment during the last sample interval.
· Cumulative Wait Time—Total amount of time that tasks have waited.
Data File I/O
The Data File I/O area contains the following fields:
· Database—Name of the database.
· File Name—Name of the database file.
· MB/sec Read—Most recent read activity, in megabytes per second, for the database file.
· MB/sec Written—Most recent write activity, in megabytes per second, for the database file.
· Size—Size of the database file.
· Response Time—Average response time, in milliseconds, of the most recent read-and-write activity to the database file.
% Processor Time
The % Processor Time area contains the following field:
% Processor Time—Percentage of the time that the processor spends to execute
non-idle threads for the instance across all CPUs. Click the History Record icon ![]() to view the
history data for the processor time.
to view the
history data for the processor time.
Blocked Process Number
The Blocked Process Number area contains the following field:
· Blocked Process Number—Number of blocked processes.
Application Traffic
APM collects SQL Server traffic based on the IP address of the host and the traffic collection port used by the application.
The Application Traffic area contains the following fields:
· Last Hour's Traffic—Total traffic sent and received by the SQL Server application over the last 1 hour in the last polling interval.
· Today's Traffic—Total traffic sent and received by the SQL Server application since 00:00 today in the last polling interval.
Activity User Tasks
The Activity User Tasks area contains the following fields:
· Session ID—Unique integer assigned to a user connection when the connection is established.
· User Process—Displays 0 for a system process and 1 for a user process.
· Login—SQL Server login name under which the session is currently executing.
· Database—Name of the database.
· Task State—State of the task.
· Command—The kind of command.
· Application—Name of the application program that created the connection.
· Wait Time—Time, in milliseconds, in which this task is waiting for a resource. When the task is not waiting, the wait time is 0.
· Wait Type—Name of the wait type.
· Wait Resource—Name of the resource that is needed.
· Blocked By—ID of the session that is blocking the task.
· Memory Use (KB)—Amount of memory, in kilobytes, that is being used by the task.
· Host Name—Name of the computer that made the connection to the instance of SQL Server.
· Workload Group—Name of the Resource Governor workload group for the session.
Job Details
The Job Details area contains the following fields:
· Name—Name of the job that has or has not run in the last polling interval.
· Enabled—Indicates whether the job is enabled.
· Result—Result of the job. An en dash (-) indicates that the job has never run.
· Date—Date when the job started running.
· Time—Time when the job started running.
· Duration—Running duration of the job.
Database Status
The Database Status area contains the following fields:
· Database—Database name.
· Database Status—Status of the database.
· Database Create Date—Date when the database was created.
Database Details
The Database Details area contains the following fields:
· Database—Name of the running database in the SQL server application. "_Total" indicates statistics for all databases.
· Size—Disk space for the database.
· Used Size—Size of the database space that is used.
· Free Size—Size of the database space that is not used.
· Database Usage Ratio—Percentage of the used database space to the total database space.
· Data File Size—Size of the data file.
· Data File Path—Path where the data file is located.
· Data File Number—Number of the data files.
· Transactions—Number of transactions that the database started per minute.
· Active Transactions—Number of active transactions of the database.
You can click the History
Record icon ![]() to view the history graph of a monitor index.
to view the history graph of a monitor index.
Database Log Details
The Database Log Details contains the following fields:
· Database—Name of the database that the SQL server application runs. The value Total indicates that information about all databases is collected.
· Log File—Disk space occupied by database log files.
· Log Files Used—Size of used log files in the database.
· Log File Usage Ratio—Usage ratio of the log files in the database. Log Files Usage Ratio = Log Files Used/Log Files x 100%.
· Log Writes—Times of writing the log to the log file per minute.
· Log Write Waits—Number of logs that were waiting to be written to the log files.
· Log Write Wait Time—Total waiting time before the log was written to the log file.
You can click the History
Record icon ![]() to view the history graph of a monitor index,
and click the Set Threshold icon
to view the history graph of a monitor index,
and click the Set Threshold icon ![]() to set alarm thresholds for a
monitor index.
to set alarm thresholds for a
monitor index.
Top 10 SQL by Execution Durations
The Top 10 SQL by Execution Durations area displays top 10 SQL statements by accumulated execution duration.
The Top 10 SQL by Execution Durations area contains the following fields:
· SQL—SQL statement.
· Cumulative Execution Duration—Total duration used for parsing and executing the SQL statement.
· Cumulative CPU Time—Duration that parsing and executing the SQL statement occupies the CPU.
· Logical Reads—Number of logical reads of the SQL statement.
· Physical Reads—Number of physical reads of the SQL statement.
· Executions—Number of times that the SQL statement is executed.
Top 10 SQL by Logical Reads
The Top 10 SQL by Logical Reads area contains the following fields:
· SQL—Top 10 SQL statements by logic read.
· Cumulative Execution Duration—Total duration used for parsing and executing the SQL statement.
· Cumulative CPU Time—Duration that parsing and executing the SQL statement occupies the CPU.
· Logical Reads—Number of times for logical reads of the SQL statement.
· Physical Reads—Number of physical reads of the SQL statement.
· Executions—Number of times that the SQL statement is executed.
Top 10 SQL by Physical Reads
The Top 10 SQL by Physical Reads area contains the following fields:
· SQL—Top 10 SQL statements by physical read.
· Cumulative Execution Duration—Total duration used for parsing and executing the SQL statement.
· Cumulative CPU Time—Duration that parsing and executing the SQL statement occupies the CPU.
· Logical Reads—Number of logical reads of the SQL statement.
· Physical Reads—Number of physical reads of the SQL statement.
· Executions—Number of times that the SQL statement is executed.
Top 10 SQL By Cumulative CPU Time
The Top 10 SQL By Cumulative CPU Time area contains the following fields:
· SQL—SQL statement.
· Cumulative Execution Duration—Time taken to parse and execute the SQL statement.
· Cumulative CPU Time—CPU time taken to parse and execute the SQL statement.
· Logical Reads—Number of times for which the SQL statement has been logically read.
· Physical Reads—Number of times for which the SQL statement has been physically read.
· Executions—Number of times for which the SQL statement has been executed.
MySQL
MySQL is an open source DBMS that directly impacts the service performance. APM supports monitoring MySQL applications.
Adding a MySQL application monitor
APM can locally or remotely monitor MySQL applications through JDBC. When you add MySQL application monitors, follow these guidelines:
· To locally monitor SQL Server applications, install agents on the hosts where MySQL applications are deployed. For more information about installing agents, see "APM agent management."
· Obtain the username and password of the user who has the MySQL administrator's privileges.
· Add MySQL hosts to the IMC platform so that APM can obtain and display network connections of the hosts and their access devices in the application topology. For more information about adding hosts to the IMC platform, see H3C Intelligent Management Center v7.3 Enterprise and Standard Platform Administrator Guide.
· To view traffic statistics in the monitor report of the MySQL application, make sure at least one probe is configured in APM. After a MySQL application monitor is added, APM sends the IP address and service port of the monitored MySQL application to the probes for traffic collection.
To add a MySQL application monitor:
1. Click the Resource tab.
2. Open the Add Application page by using one of the following methods:
¡ From the navigation tree, select Application Management > Add Application.
The page displays all application types that can be monitored by APM.
¡ From the navigation tree, select Application Manager > Application Monitor, and then click Add on the application monitor list page.
3. Click MySQL of the Database Server Monitor class.
The page for adding a MySQL application monitor opens.
4. Configure the following parameters:
¡ IP Address—Enter the IP address of the host on which the MySQL application to be monitored is installed. APM automatically checks the specified IP address and associates the application monitor with the host managed in the IMC platform. If the host is already added to the IMC platform, you can also click Select, and then select the host from the Select Devices window. For information about selecting a host, see "Quick start."
¡ Name—Enter a unique application monitor name. As a best practice, name the application monitor as application type_host IP address.
¡ Use Template—Select Enable or Disable from the list.
¡ Template—Click
the Configure icon ![]() next to the Template field to select an existing template. The Template field
is automatically populated with the name of the selected template. For more
information about configuring application templates, see "Configuration management." This field is displayed only when you select Enable from the Use
Template list.
next to the Template field to select an existing template. The Template field
is automatically populated with the name of the selected template. For more
information about configuring application templates, see "Configuration management." This field is displayed only when you select Enable from the Use
Template list.
¡ Description—Enter a description for the application monitor.
¡ Application Monitor Port—Enter the service port number for MySQL, 3306 by default. This field is available only when you select Disable from the Use Template list.
¡ Traffic Collection Port—Enter the service port number for MySQL. This field is displayed only when at least one probe is configured for APM and when you select Enable from the Use Template list.
¡ Polling Interval (min)—Select a polling interval for the application monitor. Options are 1, 2, 3, 4, 5, 10, 20, and 30. The default polling interval is 5 minutes. A shorter polling interval improves real-time data accuracy at the expense of system resources. This field is available only when you select Disable from the Use Template list.
¡ Username—Enter the username of the MySQL administrator. This field is available only when you select Disable from the Use Template list.
¡ Password—Enter the password of the MySQL administrator. This field is available only when you select Disable from the Use Template list.
¡ Contact—Enter contact information, such as the name, email address, and telephone number. The default is the username of the operator who created the application monitor. This field is available only when you select Disable from the Use Template list.
¡ APM Server—Select an APM server to monitor the application. The options are in server-address (application-type:n/N) format. The letter n indicates the number of MySQL applications monitored on the APM server. The letter N indicates the total number of applications monitored on the APM server. Server address 127.0.0.1 indicates that APM and the IMC platform are deployed on the same server.
¡ APM Server—Select an APM server to monitor the application. The option is in server-address (application-type:n/N) format. The letter n indicates the number of the selected type of applications monitored on the APM server. The letter N indicates the number of all types of applications monitored on the APM server. Server address 127.0.0.1 indicates that APM and the IMC platform are deployed on the same server.
¡ Related Applications—Click Add next to this field. On the Select Application window, enter a partial or complete name to filter applications, select the applications that MySQL depends on, and then click OK.
Operating system applications cannot be selected. Operators can view all dependencies of the application in the dependency topology. APM automatically adds the dependencies between MySQL and operating system applications by IP address and displays their dependencies in the application topology.
¡ Application Group—Specify an application group for the MySQL application.
- To specify an existing application group, click Add, select an application group, and then click OK.
- To specify a new application group, click Add Application Group, configure the application group settings, and then click OK.
¡ Detect Application—Select this parameter if you want to enable application detection. Application detection enables APM to verify connection to the application by using the previous parameter settings, and to determine whether to add the application monitor based on the verification result. APM adds the application monitor only when it can connect to the application. When this parameter is not specified, APM adds the application monitor without verifying the connection.
5. Click OK.
Modifying a MySQL application monitor
Authorized users can modify all parameters except the IP address and the APM server for a MySQL application monitor. When the IP address of the MySQL host changes, operators must add a new application monitor for the host. The new application monitor cannot inherit the history data from the previous application monitor.
To modify a MySQL application monitor:
1. Click the Resource tab.
2. From the navigation tree, select Application Manager > Application Monitor.
The page displays the application types that can be monitored by APM.
3. Click the Modify icon![]() for the MySQL
application monitor you want to modify.
for the MySQL
application monitor you want to modify.
The page for modifying the MySQL application monitor opens.
4. Modify the parameters as needed, except the IP address and the APM server.
For more information about parameter settings, see "Adding a SQL Server application monitor."
5. Click OK.
Viewing MySQL application monitor report
After a MySQL application monitor is added, APM collects index data of the application, and calculates its availability and health status. You can obtain monitor indexes for the MySQL application by viewing the monitor report.
To access a MySQL application monitor report:
1. Click the Resource tab.
2. From the navigation tree, select Application Manager > Application Monitor.
The application monitor list page displays all application monitors.
3. Click the name of a MySQL application monitor to display the report.
Figure 65 shows part of a MySQL application monitor report.
Figure 65 Part of a MySQL application monitor report
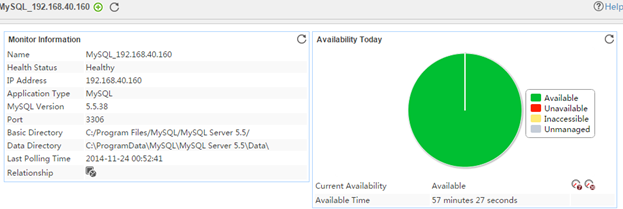
Monitor Information
The Monitor Information area contains the following fields:
· Name—Application monitor name.
· Health Status—Health status of the MySQL application.
· IP Address—IP address of the MySQL host.
· Application Type—Type of the monitored application, which is always MySQL.
· MySQL Version—Version of the MySQL application.
· Port—Service port of the MySQL application.
· Basic Directory—MySQL installation path recorded in the MySQL application.
· Data Directory—Data file storage directory in the MySQL application.
· Last Polling Time—Time when APM last polled the MySQL application.
· Relationship—Click the Relationship icon ![]() to view dependencies between the MySQL application and other applications in the dependency topology. For more information about
dependency topologies, see "Topology and application group management."
to view dependencies between the MySQL application and other applications in the dependency topology. For more information about
dependency topologies, see "Topology and application group management."
· Top5 Unrecovered Alarm—Latest five unrecovered alarms on the MySQL host. The alarm level is identified by color: yellow for minor alarms, orange for major alarms, and red for critical alarms. This field is not displayed if no alarm is generated by the MySQL application.
Availability Today
The Availability Today area contains the following fields:
· Current Availability—Availability of the MySQL application in the last polling period.
¡ Click
the Weekly History icon![]() to view the availability of the MySQL application in the last 7 days.
to view the availability of the MySQL application in the last 7 days.
¡ Click
the Monthly History icon![]() to view the availability of the MySQL application in the last 30 days.
to view the availability of the MySQL application in the last 30 days.
· Available Time—Total amount of time that the MySQL application was available after 00:00 today.
· Unavailable Time—Total amount of time that the MySQL application was unavailable after 00:00 today.
· Inaccessible Time—Total amount of time that the MySQL application was inaccessible after 00:00 today.
· Unmanaged Time—Total amount of time that the MySQL application was unmanaged after 00:00 today.
The statistics collection started when the application monitor was added. An availability time field is not displayed when its value is 0.
Thread Exclusive Memory
The Thread Exclusive Memory area contains the following fields:
· Total Thread Exclusive Memory—Total memory that is exclusive to threads.
· Thread Stack Buffer—Size of the buffer that stores identity information of each thread.
· Sort Buffer—Size of the buffer used for sorting files.
· Join Buffer—Size of the buffer used for joining two or more tables.
· Read Buffer—Size of the buffer used for reading data in order.
· Random Read Buffer—Size of the buffer used for randomly reading data.
· Temporary Table Buffer—Size of the buffer used for operating temporary tables.
Global Shared Memory
The Global Shared Memory area contains the following fields:
· Total Global Shared Memory—Total memory that is globally shared.
· Queue Buffer—Size of the buffer used for request results.
· Thread Buffer—Size of the buffer that stores idle connection threads.
· Table Buffer—Size of the buffer that stores information about file handles in the table file.
· Table Definition Buffer—Size of the buffer that stores table definition information.
· Binary Log Buffer—Size of the buffer that stores information about binary logs caused by data change.
· Key Buffer—Size of the buffer used for index blocks.
· InnoDB Log Buffer—Size of the buffer used for InnoDB transaction logs.
· InnoDB Data and Index Buffer—Size of the buffer used for InnoDB data and index blocks.
· InnoDB Dictionary Buffer—Size of the buffer used for InnoDB dictionary information.
Response Time
The Response Time area contains the following fields:
· Response Time—Response time of the MySQL application in the last polling interval.
¡ Click
the Set Threshold icon ![]() to set alarm thresholds for the response
time.
to set alarm thresholds for the response
time.
¡ Click the History Record icon ![]() to view the history graph of the response
time.
to view the history graph of the response
time.
· Connection Timeout—Time before the connection times out. Click the History
Record icon ![]() to view the history graph of the connection
timeout.
to view the history graph of the connection
timeout.
Request Statistics
The Request Statistics area contains the following fields:
· Requests/s—Number of connection requests that the MySQL application received per second in the last polling interval.
¡ Click
the Set Threshold icon ![]() to set alarm
thresholds for the requests received per second.
to set alarm
thresholds for the requests received per second.
¡ Click
the History Record icon ![]() to view the history graph of the requests received per second.
to view the history graph of the requests received per second.
· Receive Rate—Bandwidth that the MySQL
application consumed to receive
data from all clients per second in the last polling
interval. Click the History
Record icon ![]() to view the history graph of the receive rate.
to view the history graph of the receive rate.
· Send Rate—Bandwidth that the MySQL application consumed to send data to all clients per second in the last polling interval.
¡ Click
the Set Threshold icon ![]() to set alarm
thresholds for the send rate.
to set alarm
thresholds for the send rate.
¡ Click
the History Record icon ![]() to view the history
graph of the send rate.
to view the history
graph of the send rate.
Connection Statistics
The Connection Statistics area contains the following fields:
· Connections—Total number of successful connections from
the MySQL application start time to the last polling time. Click the History Record icon ![]() to view the history
graph of the connections.
to view the history
graph of the connections.
· Aborted Connections—Total number of failed connections from the
MySQL application start time to the last polling time. Click the History Record icon ![]() to view the history
graph of the aborted connections.
to view the history
graph of the aborted connections.
· Aborted Clients—Total number of connections terminated by
the MySQL server from the MySQL application start
time to the last polling time. Click the History
Record icon ![]() to view the history graph of the aborted clients.
to view the history graph of the aborted clients.
· Connections Per Second—Number of connection attempts per second.
· Established Connections Per Second—Number of established connections per second.
· Connection Cache Hit Ratio—Ratio of the connections read from the cache to the total connections.
· Max Allowed Connections—Maximum number of allowed connections.
· Actual Max Connections—Actual maximum number of connections.
Thread Details
The Thread Details area contains the following fields:
· Running Threads—Number of running threads in the MySQL application
in the last polling interval. Click the History
Record icon ![]() to view the history graph of running threads.
to view the history graph of running threads.
· Buffered Threads—Number of buffered threads in the thread cache in the last polling interval. Click the History Record icon ![]() to view the history graph of buffered threads.
to view the history graph of buffered threads.
· Thread Buffer Size—Number of threads that can be buffered in the thread cache.
Key Details
The Key Details area contains the following fields:
· Key Hit Ratio—Buffer hit ratio for keys in the last polling interval. A larger value indicates a better result.
¡ Click
the Set Threshold icon ![]() to set alarm thresholds for the key hit ratio. An alarm is
generated when the index value is less than or equal to the threshold value.
to set alarm thresholds for the key hit ratio. An alarm is
generated when the index value is less than or equal to the threshold value.
¡ Click
the History Record icon ![]() to view the history
graph of the key hit ratio.
to view the history
graph of the key hit ratio.
· Key Writes Hit Ratio—Ratio of key writes to the key write requests.
· Key Buffer Used—Size of the key buffer used by the MySQL application in the last polling
interval. Click the History
Record icon ![]() to view the history graph of the key buffer
used.
to view the history graph of the key buffer
used.
· Key Buffer—Total size of the key buffer for the MySQL application in the last polling interval.
· Index Reads—Number of key block reads from the hard disk.
· Index Reads/Min—Number of key block reads from the hard disk per minute.
· Index Writes—Number of key block writes from the hard disk.
· Index Writes/Min—Number of key block writes to the hard disk per minute.
Buffer Details
The Buffer Details area contains the following fields:
· Query Hit Ratio—Ratio of key value reads from the buffer to the number of query attempts.
· Queue Buffer—Memory allocated for buffering the request result.
· Queue Buffer Limit—Maximum memory used for storing the buffer result.
· Cache Queries—Number of query commands in the cache.
Table Lock Statistics
The Table Lock Statistics area contains the following fields:
· Table Locks Immediately
Released/sec—Number of immediately released
table locks per minute in the last polling interval. Click the History Record icon ![]() to view the history
graph of the table locks immediately released per
minute.
to view the history
graph of the table locks immediately released per
minute.
· Table Locks Wait/sec—Number of waiting table locks in the last
polling interval. Click the History
Record icon ![]() to view the history graph of the table locks
waits per minute.
to view the history graph of the table locks
waits per minute.
SQL Operation Statistics/min
The SQL Operation Statistics/min area contains the following fields:
· Deletes—Number of
Delete statements executed by the MySQL application per
minute in the last polling interval. Click the History Record icon ![]() to view the history
graph of the Delete statements
executed by the MySQL application per minute.
to view the history
graph of the Delete statements
executed by the MySQL application per minute.
· Adds—Number of Insert statements executed by the
MySQL application per minute in the last polling interval. Click the History Record icon ![]() to view the history
graph of the Add statements
executed by the MySQL application per minute.
to view the history
graph of the Add statements
executed by the MySQL application per minute.
· Queries—Number of Select statements executed by the
MySQL application per minute in the last polling interval. Click the History Record icon ![]() to view the history graph
of the Query statements
executed by the MySQL application per minute.
to view the history graph
of the Query statements
executed by the MySQL application per minute.
· Updates—Number of
Update statements executed by the MySQL application per
minute in the last polling interval. Click the History Record icon ![]() to view the history
graph of the Update statements
executed by the MySQL application per minute.
to view the history
graph of the Update statements
executed by the MySQL application per minute.
InnoDB Buffer Hit Ratio
The InnoDB Buffer Hit Ratio area contains the following field:
Hit Ratio—Hit ratio of InnoDB buffer.
Transactions Per Second
The Transactions Per Second area contains the following field:
Transactions Per Second—Number of transactions handled per second.
Application Traffic
APM collects MySQL traffic based on the IP address of the host and the traffic collection port used by the application.
The Application Traffic area contains the following fields:
· Last Hour's Traffic—Total traffic sent and received by the MySQL application over the last 1 hour in the last polling interval.
· Today's Traffic—Total traffic sent and received by the MySQL application since 00:00 today in the last polling interval.
Database Details
The Database Details area contains the following fields:
· Database—Name of the running database on the MySQL application.
· Size—Size of disk space for the database.
· Tables—Number of tables in the database.
Oracle
Oracle Database is a database management system developed by Oracle Corporation. The performance and stability affects the service applications. APM supports monitoring Oracle applications.
Adding an Oracle application monitor
APM can monitor Oracle through agents or JDBC. When you add application monitors for Oracle, follow these guidelines:
· To monitor an Oracle application through an agent, you must deploy the agent on the Windows or Linux operating system where the Oracle application is installed.
· To monitor an Oracle application through JDBC, obtain the username and password of the user who has the Oracle administrator's privileges.
· You must identify whether the Oracle application has used RAC and identify the Oracle SID to be monitored.
· Add Oracle hosts to the IMC platform so that APM can obtain and display network connections of the hosts and their access devices in the application topology. For more information about adding hosts to the IMC platform, see H3C Intelligent Management Center v7.3 Enterprise and Standard Platform Administrator Guide.
· To view traffic statistics in the monitor report of the Oracle application, make sure at least one probe is configured in APM. After an Oracle application monitor is added, APM sends the IP address and service port of the monitored Oracle application to the probes for traffic collection.
To add an Oracle application monitor:
1. Click the Resource tab.
2. Open the Add Application page by using one of the following methods:
¡ From the navigation tree, select Application Management > Add Application.
The page displays all application types that can be monitored by APM.
¡ From the navigation tree, select Application Manager > Application Monitor, and then click Add on the application monitor list page.
3. Click Oracle of the Database Server Monitor class.
The page for adding an Oracle application monitor opens.
4. Configure the following parameters:
¡ IP Address—Enter the IP address of the host on which the Oracle application to be monitored is installed. If the host is already added to the IMC platform, you can also click Select, and then select the host from the Select Devices window. For information about selecting a host, see "Quick start." APM automatically checks the specified IP address and associates the application monitor with the host managed in the IMC platform.
¡ Name—Enter a unique application monitor name. As a best practice, name the application monitor as application type_host IP address.
¡ Use Template—Select Enable or Disable from the list.
¡ Template—Click
the Configure icon ![]() next to the Template field to select an existing template. The Template field
is automatically populated with the name of the selected template. For more
information about configuring application templates, see "Configuration management." This field is displayed only when you select Enable from the Use
Template list.
next to the Template field to select an existing template. The Template field
is automatically populated with the name of the selected template. For more
information about configuring application templates, see "Configuration management." This field is displayed only when you select Enable from the Use
Template list.
¡ Description—Enter a description for the application monitor.
¡ Application Monitor Port—Enter the service port number for the Oracle application. The default is 1521. This field is displayed only when you select Disable from the Use Template list.
¡ Traffic Collection Port—Enter the service port number for the Oracle application. This field is displayed only when at least one probe is configured for APM. This field is displayed only when you select Disable from the Use Template list.
¡ Polling Interval (min)—Select a polling interval for the application monitor. Options are 1, 2, 3, 4, 5, 10, 20, and 30. The default polling interval is 5 minutes. A shorter polling interval improves real-time data accuracy at the expense of system resources. This field is displayed only when you select Disable from the Use Template list.
¡ Monitor Type—Select the Oracle running type. Options are stand-alone and rac. This field is displayed only when you select Disable from the Use Template list.
¡ Database Instance Name—Enter the instance name for the Oracle application. This field is displayed only when you select Disable from the Use Template list.
¡ Username—Enter the username of the Oracle administrator. If the username is sys, enter sys as sysdba in this field. This field is displayed only when you select Disable from the Use Template list.
¡ Password—Enter the password of the Oracle administrator. This field is displayed only when you select Disable from the Use Template list.
¡ Contact—Enter contact information, such as the name, email address, and telephone number. The default is the username of the operator who created the application monitor. This field is displayed only when you select Disable from the Use Template list.
¡ APM Server—Select an APM server to monitor the application. The options are in server-address (application-type:n/N) format. The letter n indicates the number of Oracle applications monitored on the APM server. The letter N indicates the total number of applications monitored on the APM server. Server address 127.0.0.1 indicates that APM and the IMC platform are deployed on the same server.
¡ Related Applications—Click Add next to this field. On the Select Application window, enter a partial or complete name to filter applications, select the applications that Oracle depends on, and then click OK.
Operating system applications cannot be selected. Operators can view all dependencies of the application in the dependency topology. APM automatically adds the dependencies between Oracle and operating system applications by IP address and displays their dependencies in the application topology.
¡ Application Group—Specify an application group for the Oracle application.
- To specify an existing application group, click Add, select an application group, and then click OK.
- To specify a new application group, click Add Application Group, configure the application group settings, and then click OK.
¡ Detect Application—Select this parameter if you want to enable application detection. Application detection enables APM to verify connectivity to the application by using the previous parameter settings, and to determine whether to add the application monitor based on the verification result. APM adds the application monitor only when it can connect to the application. When this parameter is not specified, APM adds the application monitor without verifying the connection.
5. Click OK.
Modifying an Oracle application monitor
Authorized users can modify all parameters except the IP address and the APM server for an Oracle application monitor. When the IP address of the Oracle host changes, operators must add a new application monitor for the host. The new application monitor cannot inherit the history data from the previous application monitor.
To modify an Oracle application monitor:
1. Click the Resource tab.
2. From the navigation tree, click Application Manager > Application Monitor.
The page displays all application types that can be monitored by APM.
3. Click the Modify icon ![]() for the Oracle
application monitor you want to modify.
for the Oracle
application monitor you want to modify.
The page for modifying the Oracle application monitor opens.
4. Modify the parameters as needed, except the IP address and the APM server.
For more information about parameter settings, see "Adding an Oracle application monitor."
5. Click OK.
Viewing the Oracle application monitor report
After an Oracle application monitor is added, APM collects index data of the application, and calculates its availability and health status, and updates the monitor report. The report shows the index values obtained from the most recent polling of the application.
To view the Oracle application monitor report:
1. Click the Resource tab.
2. From the navigation tree, select Application Manager > Application Monitor.
The application monitor list page displays all application monitors.
3. Click the name of an Oracle application monitor to display the report.
Figure 66 shows part of an Oracle application monitor report. The Oracle application monitor report contains the Summary, Objects, Tablespace, Session, Top10 SQL, and Parameter tabs.
Figure 66 Part of an Oracle application monitor report
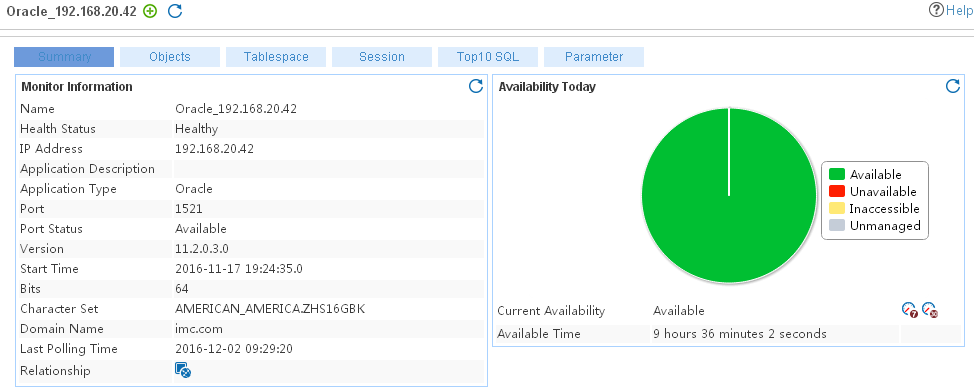
Monitor Information
The Monitor Information area contains the following fields:
· Name—Application monitor name.
· Health Status—Health status of the Oracle application.
· IP Address—IP address of the Oracle host.
· Application Type—Type of the monitored application, which is always Oracle.
· Port—Service port of the Oracle application.
· Port Status—Status of the Oracle application service port.
· Version—Version number of Oracle application.
· Start Time—Date and time when the Oracle application started.
· Bits—Number of bits for the Oracle application, 32 or 64.
· Character Set—Character set for the Oracle application.
· Last Polling Time—Time when APM last polled the Oracle application.
· Relationship—Click the Relationship icon ![]() to view dependencies
between the Oracle application and other applications in the dependency topology. For more information about dependency topologies, see "Topology and application group management."
to view dependencies
between the Oracle application and other applications in the dependency topology. For more information about dependency topologies, see "Topology and application group management."
· Top5 Unrecovered Alarm—Latest five unrecovered alarms on the Oracle host. The alarm level is identified by color: yellow for minor alarms, orange for major alarms, and red for critical alarms. This field is not displayed if no alarm is generated by the Oracle application.
Availability Today
The Availability Today area contains the following fields:
· Current Availability—Availability of the Oracle application.
¡ Click
the Weekly History icon ![]() to view the availability of the Oracle application in the last 7 days.
to view the availability of the Oracle application in the last 7 days.
¡ Click
the Monthly History icon ![]() to view the
availability of the Oracle
application in the last 30 days.
to view the
availability of the Oracle
application in the last 30 days.
· Available Time—Total amount of time that the Oracle application was available after 00:00 today.
· Unavailable Time—Total amount of time that the Oracle application was unavailable after 00:00 today.
· Inaccessible Time—Total amount of time that the Oracle application was inaccessible after 00:00 today.
· Unmanaged Time—Total amount of time that the Oracle application was unmanaged after 00:00 today.
The statistics collection started when the application monitor was added. An availability time field is not displayed when its value is 0.
Oracle Detail
The Oracle Detail area contains the following fields:
· Creation Time—Time when Oracle application installation was completed.
· Open Mode—Current open mode for the Oracle application. Open modes include READ ONLY and READ WRITE.
· Logging Mode—Current logging mode for the Oracle application. The following logging modes are available:
¡ ARCHIVELOG—The old log file is automatically copied to the specified path and cannot be overwritten by the new log file during log file switching.
¡ NOARCHIVELOG—The old log file is overwritten by the new log file during log file switching.
· Size—Size of disk space used by all the datafiles in the Oracle application.
· Block Size—Default standard block size for the Oracle application.
· Average Execution Times—Average number of times that each SQL statement in the Oracle application was executed.
¡ Click
the Set Threshold icon ![]() to set alarm thresholds for the average
execution times.
to set alarm thresholds for the average
execution times.
¡ Click
the History Record icon ![]() to view the history
graph of the average execution times.
to view the history
graph of the average execution times.
· Reads—Number of times that the Oracle application read data blocks from the disk. Click the History Record icon ![]() to view the history
graph for this field.
to view the history
graph for this field.
· Writes—Number of times that the Oracle application wrote data blocks to the disk. Click the History Record icon ![]() to view the history
graph for this field.
to view the history
graph for this field.
· Disk/Memory Sort Ratio—Disk/memory sorting ratio. It is obtained by using the formula:
Disk sorting attempts/Memory sorting attempts x 100%. Click
the History Record icon ![]() to view the history
graph of the disk/memory sorting ratio.
to view the history
graph of the disk/memory sorting ratio.
· Row Link/Row Mitigation Count—Number of row links and number of row mitigations.
· Forcible Log Switch Time—Time when the Oracle application was forced to perform Redo log file switching.
· Database Name—Name of the Oracle database.
· Physical Memory—Physical memory size of the Oracle database server.
· Transactions Per Second—Average number of transactions executed per second.
· Flashback On—Flashback setting:
¡ YES—Flashback is on.
¡ NO—Flashback is off.
¡ RESTORE POINT ONLY—Flashback is on but one can only flash back to reliable restore points.
· Locks—Number of locks in the database.
· Deadlocks—Number of deadlocks in the database.
· Weekly Growth Rate of Archived Logs—Weekly growth rate of achived logs in percentage in the database.
Connection Time
The Connection Time area contains the following field:
· Connection Time—Amount of time APM took to establish connectivity with the Oracle application.
¡ Click
the Set Threshold icon ![]() to set alarm thresholds for the connection
time.
to set alarm thresholds for the connection
time.
¡ Click the History
Record icon ![]() to view the history graph of the connection
time.
to view the history graph of the connection
time.
SGA Details
You can click the History
Record icon ![]() to view the
history graph for each field.
to view the
history graph for each field.
The SGA Details area contains the following fields:
· Buffer—Size of buffer cache in SGA.
· Fixed Area—Size of the fixed area in SGA. The fixed area, typically in small size, contains control information for other SGA regions.
· Database Buffer—Size of the library cache in SGA.
· Dictionary Buffer—Size of the dictionary cache in SGA.
· Dictionary Ratio—Ratio of the used dictionary buffer to the total dictionary buffer.
· SQL Area—Size of the SQL area in SGA.
· Shared SQL Butter Ratio—Ratio of the used shared SQL buffer to the total shared SQL buffer.
· SGA Ratio—Ratio of the used SGA buffer to the total SGA buffer.
· SGA Used Size—SGA used space size
SGA State
The System Global Area (SGA) is a shared memory space allocated to the Oracle application.
The SGA State area contains the following fields:
· Buffer Hit Ratio—Percentage of times that the requested information was found in the buffer cache.
¡ Click
the Set Threshold icon ![]() to set alarm thresholds for the buffer hit
ratio.
to set alarm thresholds for the buffer hit
ratio.
¡ Click the History
Record icon ![]() to view the history graph of the buffer hit
ratio.
to view the history graph of the buffer hit
ratio.
· Dictionary Hit Ratio—Percentage of times that the requested information was found in the dictionary cache.
¡ Click
the Set Threshold icon ![]() to set alarm thresholds for the dictionary
hit ratio.
to set alarm thresholds for the dictionary
hit ratio.
¡ Click the History
Record icon ![]() to view the history graph of the dictionary
hit ratio.
to view the history graph of the dictionary
hit ratio.
· Library Hit Ratio—Percentage of times that the requested information was found in the library cache.
¡ Click
the Set Threshold icon ![]() to set alarm thresholds for the library hit
ratio.
to set alarm thresholds for the library hit
ratio.
¡ Click the History
Record icon ![]() to view the history graph of the library hit
ratio.
to view the history graph of the library hit
ratio.
· Free Memory—Free memory in SGA. Click the History Record icon ![]() to view the history
graph of the free memory.
to view the history
graph of the free memory.
Large Pool
You can click the History
Record icon ![]() to view the
history graph for each field.
to view the
history graph for each field.
The Large Pool area contains the following fields:
· Large Pool—Total size of the large pool.
· Large Pool Free Size—Free space size of the large pool.
· Large Pool Used Size—Used space size of the large pool.
· Large Pool Ratio—Ratio of the used large pool size to the total large pool size.
Java Pool
You can click the History
Record icon ![]() to view the
history graph for each field.
to view the
history graph for each field.
The Java Pool area contains the following fields:
· Java Pool—Total size of the Java pool.
· Java Pool Free Size—Free space size of the Java pool.
· Java Pool Used Size—Used space size of the Java pool.
· Java Pool Ratio—Ratio of the used Java pool size to the total Java pool size.
Shared Pool
You can click the History
Record icon ![]() to view the
history graph for each field.
to view the
history graph for each field.
The Shared Pool area contains the following fields:
· Shared Pool—Total size of the shared pool.
· Shared Pool Free Size—Free space size of the shared pool.
· Shared Pool Used Size—Used space size of the shared pool.
· Shared Pool Ratio—Ratio of the used shared pool size to the total shared pool size.
REDO Log Buffer
You can click the History
Record icon ![]() to view the
history graph for each field.
to view the
history graph for each field.
The REDO Log Buffer area contains the following fields:
· REDO Log Buffer—REDO log buffer size.
· REDO Request Failure Ratio—Ratio of the failed REDO requests to the total REDO requests.
· REDO Writes/Sec—Number of REDO writes in the most recent polling interval.
· REDO Block Writes/Sec—Number of REDO blocks written per second in the most recent polling interval.
· REDO Entries/Sec—Number of REDO entries per second in the most recent polling interval.
Connection Information
The Connection Information area contains the following fields:
· Current Connections—Number of connections used. Click the History Record icon ![]() to view the history graph
of the current connections.
to view the history graph
of the current connections.
· Max. Connections—Maximum number of connections allowed by the Oracle application. If the number of connections reaches the maximum number, new connections cannot be established.
PGA Statistics
A Program Global Area (PGA) is a non-shared memory area allocated to each process in the Oracle application when the process starts.
Application Traffic
APM collects Oracle application traffic based on the IP address of the host and the traffic collection port used by the application.
The Application Traffic area contains the following fields:
· Last Hour's Traffic—Total traffic sent and received by the Oracle application over the last 1 hour.
· Today's Traffic—Total traffic sent and received by the Oracle application since 00:00 today.
Instance Efficiency Percentages
You can click the History
Record icon ![]() to view the
history graph for each field.
to view the
history graph for each field.
The Instance Efficiency Percentages area contains the following fields:
· Buffer Hit Ratio—Buffer hit ratio of the Oracle application.
· Library Cache Hit Ratio—Library cache hit ratio of the Oracle application.
· Latch Hit Ratio—Latch hit ratio of the Oracle application.
· No Wait Ratio for Obtaining Redo Log Buffer—Percentage of times that the Oracle application obtained Redo log buffer without waiting.
· No Wait Ratio for Obtaining Data from Memory—Percentage of times that the Oracle application obtained data from memory without waiting.
· Execute to Parse Ratio—Percentage of executed SQL statements to parsed SQL statements.
· Parse Efficiency—Parse efficiency of SQL statements.
· Running Efficiency—Running efficiency of SQL statements.
· Memory Sort Ratio—Percentage of times for sorting SQL statements in the memory.
· Disk Sorts /Sec—Number of disk sorts per second in the most recent polling interval.
· Memory Sorts /Sec—Number of memory sorts per second in the most recent polling interval.
· Flash Recovery Area Usage Ratio—Usage ratio of the Oracle flash recovery area.
· CPU Usage Ratio—Ratio of the CPU used to execute and parse SQL statements.
· PGA Hit Ratio—Hit ratio of the Process Global Area.
· PGA Ratio—Ratio of the used PGA buffer to the total PGA buffer.
Load Profile
You can click the History
Record icon ![]() to view the
history graph for each field.
to view the
history graph for each field.
The Load Profile area contains the following fields:
· Logical Chunk Reads/Sec—Number of data blocks read from the buffer cache per second.
· Physical Chunk Reads/Sec—Number of data blocks read from the disk per second.
· Physical Chunk Writes/Sec—Number of data blocks written to the disk per second.
· Chunk Changes/Sec—Number of data blocks modified per second.
· Parses/Sec—Number of SQL statements parsed per second.
· Hard Parses/Sec—Number of SQL statements hard parsed per second.
· Operations/Sec—Number of SQL statements executed per second.
· Logins/Sec—Number of logins per second.
· Hard Parse Ratio—Hard parse ratio of SQL statements.
· Soft Parse Ratio—Soft parse ratio of SQL statements.
Global Cache Information
The Global Cache Information area contains the following fields:
· Remote Cache Access Ratio—Remote cache access ratio when the Oracle application runs in a RAC.
· Disk Cache Access Ratio—Disk cache access ratio when the Oracle application runs in a RAC.
· Node Inline Traffic—Inline traffic among nodes when the Oracle application runs in a RAC.
· Local Cache Access Ratio—Local cache access ratio when the Oracle application runs in a RAC.
· Logins/Sec—Number of logins for the Oracle application per second.
DB Time
The DB Time area contains the following field:
· DB Time—Amount of time used by the Oracle application to handle non-idle waits and database computation. This field is recorded in the Automatic Workload Repository (AWR).
Database Time Zone
The Database Time Zone area contains the following fields:
· Database Time Zone—Time zone configured for the database.
· Session Time Zone—Time zone used when the client is connected to the Oracle database.
· Time—Database time when data was most recently collected.
Transactions in Current Rollback Segment
The Transactions in Current Rollback Segment area contains the following fields:
· Name—Transaction name.
· Session ID—ID of the session to which the transaction belongs.
· SQL—SQL statement executed by the transaction.
Rollback
The Rollback area contains the following fields:
· Segment—Name of the rollback segment.
· Tablespace—Name of the tablespace to which the rollback segment belongs.
· State—Status of the rollback segment. The following options are available:
¡ ONLINE—The segment is in online state.
¡ PENDING OFFLINE—The segment is in offline state, but some transactions are still using the rollback segment.
¡ OFFLINE—State that the pending offline segment goes to when the transactions are over.
· Current Size—Size of the rollback segment.
· Current Blocks—Number of current blocks used by the rollback segment.
· Initial Extent Segment—Size of the first extent segment allocated for the rollback segment.
· Next Extent Segment—Size of the second extent segment allocated for the rollback segment.
· Min Extent Segment—Minimum number of extents allocated for the rollback segment.
· Max Extent Segment—Maximum number of extents allocated for the rollback segment.
· Gets—Times of getting rollback segment headers.
· Waits—Waiting times of the rollback segment headers.
· HWM—High-water mark (HWM) of the rollback segment. HWM indicates the position of the last data block in the current segment.
· Shrinks—Shrinking times of the rollback segment.
· Wraps—Wrapping times of the rollback segment.
· Extends—Extending times of the rollback segment.
· Hit Ratio—How often the rollback segment headers have been obtained. Hit Ratio = Gets/(Gets + Waits) × 100%.
Cluster Details
The Cluster Details area displays detailed information for each instance in a cluster. For an Oracle application in standalone mode, this area displays detailed information for only the Oracle application.
The Cluster Details area contains the following fields:
· Instance No.—Number of the instance.
· Instance Name—Name of the instance.
· Host Name—Host name of the instance.
· Version—Version of the instance.
· Startup Time—Time when the instance was started.
· Instance State—State of the instance.
· Database State—State of the cluster database.
· Loading Status—Loading status of the instance.
· REDO Thread Count—Number of Redo threads in the instance.
· Allowing Login—Whether the instance can be logged in to.
· Instance Role—Role of the instance.
· Running Status—Running status of the instance.
Enqueue Request
The Enqueue Request area contains the following fields:
· Total Wait—Number of requests in the queue of the database.
· Total Request—Number of requests of the database.
· Lock Wait Ratio—Ratio of Total Wait to Total Request.
Utilization Statistic
You can click the History
Record icon ![]() to view the
history graph for each field.
to view the
history graph for each field.
The Utilization Statistic area contains the following fields:
· Process Util Rate—Utilization rate of process in the database.
· Session Util Rate—Utilization rate of session in the database.
Traverse Table
The Traverse Table area contains the following field:
Traverse Table Rate—Rate of fully traversed table in the database.
Read By Index
The Read By Index area contains the following field:
Read By INdex Rate—Rate of rows read by index in the database.
Redo Latency
The Redo Latency area contains the following field:
Log Operate Interval—Interval of log writes in the database.
Log Redo
The Log Redo area contains the following field:
QTY Redo Remain—Number of redo logs to be saved in the database.
Jobs
The Jobs area contains the following fields:
· Interuptions—Number of interrupted jobs in the database.
· Failure—Number of failed jobs in the database.
Lock Utilization
The Lock Utilization area contains the following fields:
· Used Locks—Number of locks being used.
· Max. Locks—Maximum number of locks that can be used.
· Lock Utilization Rate—Limited Lock Utilization divided by Limited Lock Utilization.
Transaction Utilization
The Transaction Utilization area contains the following field:
· TX UTIL Rate—Percentage of transaction utilization.
Parallel Query
The Parallel Query area contains the following field:
· Busy Rate—Rate of busy servers when the database executes query parallelly.
User Information
The User Information area contains the following fields:
· ID—ID of the Oracle user.
· Username—Username of the Oracle user.
· Account Status—Account status of the Oracle user.
¡ OPEN—The Oracle user is in normal state.
¡ LOCKED—The Oracle user is in locked state.
¡ EXPIRED—The password of the Oracle user has expired.
¡ LOCKED & EXPIRED—The password of the Oracle user has expired and the Oracle user is in locked state.
· Default Table Space—Name of the default table space.
· Temporary Table Space—Name of the temporary table space.
· Profile—Profile used by the Oracle user. The default is the profile that the Oracle application creates by default.
· Created Time—Time when the Oracle user was created.
· Lock Date—Date when the Oracle user was locked.
· Expiry Date—Date when the Oracle user expired.
· Remaining Lifetime (days)—Number of days before the Oracle user expires. Click the Set Threshold icon ![]() to set alarm
thresholds for this field.
to set alarm
thresholds for this field.
· DBA YES/NO—Whether the Oracle user is a DBA user.
Backup Information
The Backup Information area contains the following fields:
· Start Time—Start time of the first backup.
· Completion Time—Completion time of the last backup.
· Backup Set Size—Size of the backup set.
· Elapsed Time—Total elapsed time for all backups.
Lowest SCN of the Redo Record in the Log File
The System Change Numbers (SCNs) identify database changes by using numbers in ascending order. The greatest number indicates the latest database change.
The Lowest SCN of the redo record contained in the logfile area contains the following field:
· Lowest SCN of the redo record contained in the logfile—Lowest SCN in the Redo log file at the last polling time.
Fast Recovery Area
The Fast Recovery Area area contains the following fields:
· Fast Recovery Area Path—Fast recovery area path.
· Space Usage—Usage of the fast recovery area space. Click the History Record icon ![]() to view the history graph of
the space usage.
to view the history graph of
the space usage.
· Fast Recovery Area Used—Fast recovery area space that has been
used. Click the History Record icon ![]() to view the history
graph of the fast recovery area used.
to view the history
graph of the fast recovery area used.
· Fast Recovery Area Size—Size of the fast recovery area space.
Long Operation Statistics
The Long Operation Statistics area contains the following fields:
· Operation Name—Name of the operation that took a long time.
· Total Workload—Total workload of the operation.
· Unit—Unit for total workload.
· Start Time—Time when the operation started.
SCN Statistics
The SCN Statistics area contains the following fields:
· Name—Name of the object that uses a SCN.
· SCN ID—SCN ID for the object.
· Health Status—Health status of the object.
Long Transaction
The Long Transaction area contains the following fields:
· Start Time—Time when the transaction execution was started.
· Execution Duration—Duration that the transaction has been executed.
· SQL—SQL statements executed by the transaction.
Control File
The Control File area contains the following fields:
· Name—Path and name of the control file.
· Located in Flash Recovery Area—Whether the control file is in the flash recovery area.
· Control File Chunk Size—Size of a single chunk used by the control file.
· Control File Chunk Count—Number of chunks used by the control file.
· Control File Size—Size of the control file, which equals the number of chunks multiplied by the size of a single chunk.
Redo Log File
The Redo Log File area contains the following fields:
· Group Number—Number of the Redo log file group.
· Status—Status of the Redo log file.
· Type—Type of the Redo log file group. Options are ONLINE and STANDBY.
· Member Name—Name of the member log file.
· Located in Flash Recovery Area—Whether the Redo log file is in the flash recovery area.
· First Time—First Redo log time.
Database Lock
The Database Lock area contains the following fields:
· Object Name—Name of the locked object.
· Object Type—Type of the locked object.
· Session ID—ID of the locked session.
· Blocked Session—ID of the session that has been blocked due to the lock.
· Lock Mode—Mode of the lock:
¡ 2—Row-shared lock (Row-S, RS)
¡ 3—Row-exclusive lock (Row-X: RX)
¡ 4—Shared lock (Share, S)
¡ 5—Shared row-exclusive lock (S/Row-X, SRX)
¡ 6—Exclusive lock (Exclusive: X)
· Serial ID—Sequence number of the session.
· Event—Name of the lock event.
· Process ID—ID of the locked process.
· Process No.—Number of the locked process.
· Process Name—Name of the locked process.
· Oracle User—Locked Oracle user.
Object Statistics
The Object Statistics area contains the following fields:
· Owner—Owner of the new object.
· Object Name—Name of the object.
· Object Type—Type of the object, which can be TABLE or INDEX.
· Status—Status of the object, which can be VALID, INVALID, or N/A.
· Creation Time—Time when the object was created.
· Modification Time—Time when the object was last modified.
Invalid Object
The Invalid Object area contains the following fields:
· Owner—Owner of the invalid object.
· Object Name—Name of the object.
· Object Type—Type of the object, which can be TABLE or INDEX.
· Status—Status of the object, which can only be INVALID.
· Creation Time—Time when the object was created.
· Modification Time—Time when the object was last modified.
Index Unavailable
The Index Unavailable area contains the following fields:
· Owner—Owner of the unavailable index.
· Index Name—Name of the index.
· Index Type—Type of the index, which can be NORMAL, BITMAP, FUNCTION-BASED NORMAL, or FUNCTION-BASED BITMAP.
· Status—Status of the object, which can only be UNUSABLE.
· Table Name—Name of the table for the index.
· Deleted—Whether the index has been deleted and is in the recycle bin.
Log File Group
The Log File Group area contains the following fields:
· Group ID—ID of the log file group.
· Group Status—Status of the log file group.
· Group Size—Size of the log file group.
· Archived—Whether the log file group is archived.
· Log File—Path and name of the log file.
Archived Logs
The Archived Logs area contains the following fields:
· Alert Log Path—Path for storing archived logs.
· Archived Log Space Usage—Used archived log space in percentage in
the last polling interval. Click the History Record icon ![]() to view the history
graph of the archived log space usage.
to view the history
graph of the archived log space usage.
· Archived Log Space Used—Used archived log spaced in bytes in the last polling interval. Click the History Record icon ![]() to view the history graph of
the archived log space used.
to view the history graph of
the archived log space used.
· Archived Log Space Size—Size of the archived log space.
Dispatch Busy
The Dispatch Busy area contains the following fields:
· Dispatch Name—Name of the dispatcher process.
· Dispatch Busy Rate—Busy rate of all dispatchers in the database.
Redo Request
The Redo Request area contains the following fields:
· Wait Class—Class that redo requests belong to.
· Event—Name of the event.
· Average Wait—Average time that redo request waits for.
Details
The Details area contains the following fields:
· Name—Tablespace name.
· Allocated Bytes—Tablespace size.
· Allocated Blocks—Number of data blocks in the tablespace.
· Data Files—Number of data files in the tablespace.
State
The State area contains the following fields:
· Name—Tablespace name.
· State—Tablespace state when APM last polled the Oracle application, which can be ONLINE, OFFLINE, or INVALID.
· Usage Ratio—Usage of the tablespace.
· Free Bytes—Available space that can be used in the tablespace.
· Free Blocks—Number of available data blocks in the tablespace.
· Reads—Times of the tablespace reading data blocks from the disk.
· Writes—Times of the tablespace writing data blocks to the disk.
· Read Time—Tablespace reading time from Oracle application startup to the last polling.
· Write Time—Tablespace writing time from Oracle application startup to the last polling.
· FSFI—Free Space Fragmentation Index value of the tablespace. The smaller the value, the more fragments to be cleared in the tablespace.
Performance Index
The Performance Index area contains the following fields:
· Data File—Name and path of the Oracle application datafile.
· Tablespace—Tablespace where the datafile is located. One datafile locates in only one tablespace.
· State—Datafile state.
· Size—Size of the datafile.
· Reads—Times of reading data from the datafile.
· Writes—Times of writing data to the datafile.
· Average Read Time—Average time of reading data from the datafile.
· Average Write Time—Average time of writing data to the datafile.
Auto Ext
The Auto Ext area contains the following fields:
· Table Name—Name of the database table.
· Auto Ext—Whether the database table can be automatically extended.
· Increment Size—Size that the database table can be automatically extended.
High Used Table
The High Used Table area contains the following fields:
· Space Name—Name of the highly used tablespace.
· Free Rate—Free rate of the tablespace.
Session Statistics
The Session Statistics area contains the following fields:
· Session Count—Number of sessions when APM last polled the Oracle application.
· System Sessions—Number of sessions of the background type.
· User Sessions—Number of sessions of the user type.
· ACTIVE Sessions—Number of sessions in ACTIVE state.
· INACTIVE Sessions—Number of sessions in INACTIVE state.
· KILLED Sessions—Number of sessions in KILLED state.
· CACHED Sessions—Number of sessions in CACHED state.
· SNIPED Sessions—Number of sessions in SNIPED state.
Process Statistics
The Process Statistics area contains the following fields:
· Process Count—Number of processes when APM last polled the Oracle application.
· Background Process—Number of background processes.
Process
The Process area contains the following fields:
· Process Name—Name of the background process.
· Process ID—ID of the background process.
· SPID—Operating system process identifier.
· Serial Number—Process serial number.
· Used Memory—Size of the PGA used by the background process.
· Assigned Memory—Size of the PGA assigned to the background process.
· Freeable Memory—Size of the free PGA for the background process.
· Maximum Memory—Maximum PGA memory ever allocated by the process.
· Status—State of the background process.
· OS User—Operating system process username.
· Terminal—Operating system terminal identifier.
· Program—Program in progress.
· Background—Whether the process is a background process.
Details
The Details area contains the following fields:
· ID—Session ID.
· State—Session state.
· Computer—Name of the computer that established the session with the Oracle application.
· Username—Username used to establish the session with the Oracle application.
· Elapsed Time—Session duration.
· CPU Usage Time—Length of time for which the session has used the CPU.
· Memory Sorts—Number of times that the user performed memory sorting during the session.
· Table Scans—Number of times that the user performed table scan operations during the session.
· Physical Reads—Number of times that the user read from the disk during the session.
· Logical Reads—Number of times that the user read from the memory during the session.
· Submit—Number of times that the user executed commit operations during the session.
· Cursor—Number of cursors that the user used in the session.
· Buffer Hit Ratio—Percentage of number of logical reading times in the buffer pool to total number of logical reading times.
· OS User—Operating system client username.
· Terminal—Operating system terminal name.
· Time Of Logon—Time of logon.
· Command—Command in progress. Specific command names can be queried by the select from * v$sqlcommand statement.
Waiting Sessions
The Waiting Sessions area contains the following fields:
· ID—ID of the waiting session.
· Username—Username used to establish the session with the Oracle application.
· Events—Event that the session was waiting or the last event the session waited.
· Events Occurred—Number of times that the session waited for an event.
· State—State of the waiting session when APM last polled Oracle. The available status includes:
¡ WAITING—The session is waiting.
¡ WAITED UNKNOWN TIME—The time slot for the waiting session is unknown.
· Type—Session type. BACKGROUND and USER indicate that sessions are generated by the background process and user process, respectively.
· Wait Seconds—Length of time for which the session had waited.
Top 10 Wait Events
The Top 10 Wait Events area contains the following fields:
· Event Name—Name of the wait event.
· Wait Count—Number of times that the wait event occurred.
· Wait Duration—Amount of the wait time.
· Average Wait Duration—Amount of the average wait time.
· Wait Duration Ratio—Percentage of the wait time to the DB time. In the case of multiple CPUs, the value for this field can be greater than 100%.
· Wait Type—Type of the wait event.
Top10 SQL by Execution Duration
The Top10 SQL by Execution Duration area displays top 10 SQL statements by accumulated execution duration.
The Top10 SQL by Execution Duration area contains the following fields:
· SQL—SQL statement.
· Cumulative Execution Duration—Total duration used for parsing and executing the SQL statement.
· Cumulative CPU Time—Duration that parsing and executing the SQL statement occupies the CPU.
· Executions—Number of times that the SQL statement is executed.
· Physical Reads—Number of times for physically reading the SQL statement.
· Logical Reads—Number of times for logically reading the SQL statement.
Logical Reads Top10 SQL
The Logical Reads Top10 SQL area contains the following fields:
· SQL—SQL statement.
· Cumulative Execution Duration—Total duration used for parsing and executing the SQL statement.
· Cumulative CPU Time—Duration that parsing and executing the SQL statement has occupied the CPU.
· Executions—Number of times that the SQL statement is executed.
· Physical Reads—Number of times for physically reading the SQL statement.
· Logical Reads—Number of times for logically reading the SQL statement.
Physical Reads Top10 SQL
The Physical Reads Top10 SQL area contains the following fields:
· SQL—SQL statement.
· Cumulative Execution Duration—Total duration used for parsing and executing the SQL statement.
· Cumulative CPU Time—Duration that parsing and executing the SQL statement has occupied the CPU.
· Executions—Number of times that the SQL statement is executed.
· Physical Reads—Number of times for physically reading the SQL statement.
· Logical Reads—Number of times for logically reading the SQL statement.
Session Parameter
The Session Parameter area contains the following fields:
· Name—Name of the parameter.
· Value—Parameter value.
· Is Default—Whether the parameter is set to the default value.
· Is Session Modifiable—Whether the parameter can be changed with ALTER SESSION (TRUE) or not (FALSE).
· Is System Modifiable—Whether the parameter can be changed with ALTER SYSTEM.
¡ IMMEDIATE—The parameter can be changed with ALTER SYSTEM regardless of the type of parameter file used to start the instance. The change takes effect immediately.
¡ DEFERRED—The parameter can be changed with ALTER SYSTEM regardless of the type of parameter file used to start the instance. The change takes effect in subsequent sessions.
¡ FALSE—The parameter cannot be changed with ALTER SYSTEM unless a server parameter file was used to start the instance. The change takes effect in subsequent instances.
· Is Instance Modifiable—For parameters that can be changed with ALTER SYSTEM, whether the value of the parameter can be different for every instance (TRUE) or whether the parameter must have the same value for all Real Application Clusters instances (FALSE).
· Is Modified—Whether the parameter has been modified after instance startup.
¡ MODIFIED—The parameter has been modified with ALTER SESSION.
¡ SYSTEM_MOD—The parameter has been modified with ALTER SYSTEM.
¡ FALSE—The parameter has not been modified after instance startup.
· Description—Description of the parameter.
System Parameter
The System Parameter area contains the following fields:
· Name—Name of the parameter.
· Value—Parameter value.
· Is Default—Whether the parameter is set to the default value.
· Is Session Modifiable—Whether the parameter can be changed with ALTER SESSION (TRUE) or not (FALSE).
· Is System Modifiable—Whether the parameter can be changed with ALTER SYSTEM.
¡ IMMEDIATE—The parameter can be changed with ALTER SYSTEM regardless of the type of parameter file used to start the instance. The change takes effect immediately.
¡ DEFERRED—The parameter can be changed with ALTER SYSTEM regardless of the type of parameter file used to start the instance. The change takes effect in subsequent sessions.
¡ FALSE—The parameter cannot be changed with ALTER SYSTEM unless a server parameter file was used to start the instance. The change takes effect in subsequent instances.
· Is Instance Modifiable—For parameters that can be changed with ALTER SYSTEM, whether the value of the parameter can be different for every instance (TRUE) or whether the parameter must have the same value for all Real Application Clusters instances (FALSE).
· Is Modified—Whether the parameter has been modified after instance startup.
¡ MODIFIED—The parameter has been modified with ALTER SESSION.
¡ SYSTEM_MOD—The parameter has been modified with ALTER SYSTEM.
¡ FALSE—The parameter has not been modified after instance startup.
· Description—Description of the parameter.
SPParameter
The SPParameter area contains the following fields:
· Name—Name of the parameter.
· Value—Parameter value.
· Is Specified—Whether the parameter was specified in the server parameter file (TRUE) or not (FALSE).
DB2
DB2 is an IBM-developed DBMS. Database performance and stability affect service operations. APM supports monitoring DB2 applications for quick detection of DB2 problems.
Adding a DB2 application monitor
APM can locally or remotely monitor DB2 applications through JDBC. When you add DB2 application monitors, follow these guidelines:
· If you use agents to locally monitor DB2 applications, first install agents on hosts where DB2 applications are deployed. For more information about installing agents, see "APM agent management."
· If you remotely monitor DB2 applications through JDBC, obtain the username and password of the user who has the DB2 administrator's privileges and the database to which the DB2 administrator has access.
· Add DB2 hosts to the IMC platform so APM can obtain and display network connections of the hosts and their access devices in the application topology. For more information about adding hosts to the IMC platform, see H3C Intelligent Management Center v7.3 Enterprise and Standard Platform Administrator Guide.
· To view traffic statistics in the monitor report of the DB2 application, make sure at least one probe is configured in APM. After a DB2 application monitor is added, APM sends the IP address and service port of the monitored DB2 application to the probes for traffic collection.
To add a DB2 application monitor:
1. Click the Resource tab.
2. Open the Add Application page by using one of the following methods:
¡ From the navigation tree, select Application Manager > Add Application.
¡ From the navigation tree, select Application Manager > Application Monitor. In the application monitor list, click Add.
The Add Application page displays all application types that can be monitored by APM.
3. Click DB2 of the Database Server Monitor class.
The page for adding a DB2 application monitor opens.
4. Configure the following parameters:
¡ IP Address—Enter the IP address of the host on which the DB2 application to be monitored is installed. APM automatically checks the IP address and associates the application monitor with the host managed in the IMC platform. If the host is already added to the IMC platform, you can also click Select, and then select the host in the Select Devices window. For information about selecting a host, see "Quick start."
¡ Name—Enter a unique application monitor name. As a best practice, name the application monitor as application type_host IP address.
¡ Use Template—Select Enable or Disable from the list.
¡ Template—Click
the Configure icon ![]() next to the Template field to select an existing
template. The Template field is automatically populated with the name of the selected
template. For more information about configuring application templates, see
"Configuration management." This field is displayed only when you select Enable from the Use Template list.
next to the Template field to select an existing
template. The Template field is automatically populated with the name of the selected
template. For more information about configuring application templates, see
"Configuration management." This field is displayed only when you select Enable from the Use Template list.
¡ Description—Enter a description for the application monitor.
¡ Application Monitor Port—Enter the service port number for the DB2 application, 50000 by default. This field is available only when you select Disable from the Use Template list.
¡ Traffic Collection Port—Enter the service port number for DB2. This field is displayed only when at least one probe is configured for APM and you select Disable from the Use Template list.
¡ Polling Interval (min)—Select a polling interval for the application monitor. Available options are 1, 2, 3, 4, 5, 10, 20, and 30. The default polling interval is 5 minutes. A shorter polling interval improves real-time data accuracy at the expense of system resources. This field is available only when you select Disable from the Use Template list.
¡ Username/Password—Enter the username of the DB2 administrator. The fields are available only when you select Disable from the Use Template list.
¡ Database Name—Enter the name of the database to which the DB2 administrator has access. This field is available only when you select Disable from the Use Template list.
¡ Contact—Enter the contact information, such as the name, email address, and telephone number. The default is the username of the operator who created the application monitor. This field is available only when you select Disable the Use Template list.
¡ APM Server—Select an APM server to monitor the application. The options are in server-address (application-type:n/N) format. The letter n indicates the number of DB2 applications monitored on the APM server. The letter N indicates the total number of applications monitored on the APM server. Server address 127.0.0.1 indicates that APM and the IMC platform are deployed on the same server.
¡ Related Applications—Click Add next to this field. On the Select Application window, enter a partial or complete name to filter applications, select the applications that DB2 depends on, and then click OK.
Operating system applications cannot be selected. Operators can view all dependencies of the application in the dependency topology. APM automatically adds the dependencies between DB2 and operating system applications by IP address and displays their dependencies in the application topology.
¡ Application Group—Specify an application group for the DB2 application.
- To specify an existing application group, click Add, select an application group, and then click OK.
- To specify a new application group, click Add Application Group, configure the application group settings, and then click OK.
¡ Detect Application—Select this parameter if you want to enable application detection. Application detection enables APM to verify connection to the application by using the previous parameter settings, and to determine whether to add the application monitor based on the verification result. APM adds the application monitor only when it can connect to the application. When this parameter is not specified, APM adds the application monitor without verifying the connection.
5. Click OK.
Modifying a DB2 application monitor
Authorized users can modify all parameters except the IP address and the APM server for a DB2 application monitor. When the IP address of a monitored DB2 host changes, operators must add a new application monitor for the host. However, the new application monitor cannot inherit the history data from the previous application monitor.
To modify a DB2 application monitor:
1. Click the Resource tab.
2. From the navigation tree, select Application Manager > Application Monitor.
The application monitor list page opens.
3. Click the Modify icon ![]() for the
DB2 application monitor you want to modify.
for the
DB2 application monitor you want to modify.
The page for modifying the DB2 application monitor opens.
4. Modify the parameters as needed, except the IP address and the APM server.
For more information about parameter settings, see "Adding a DB2 application monitor."
5. Click OK.
Viewing the DB2 application monitor report
After a DB2 application monitor is added, APM collects index data of the application, evaluates the availability and health status, and updates the monitor report. The report shows the index values obtained from the most recent polling of the application.
To view the DB2 application monitor report:
1. Click the Resource tab.
2. From the navigation tree, select Application Manager > Application Monitor.
The application monitor list page displays all application monitors.
3. Click the name of a DB2 application monitor to display the report.
Figure 67 shows part of a DB2 application monitor report. The DB2 application monitor report contains the Summary and Top10 SQL tabs.
Figure 67 Part of a DB2 application monitor report
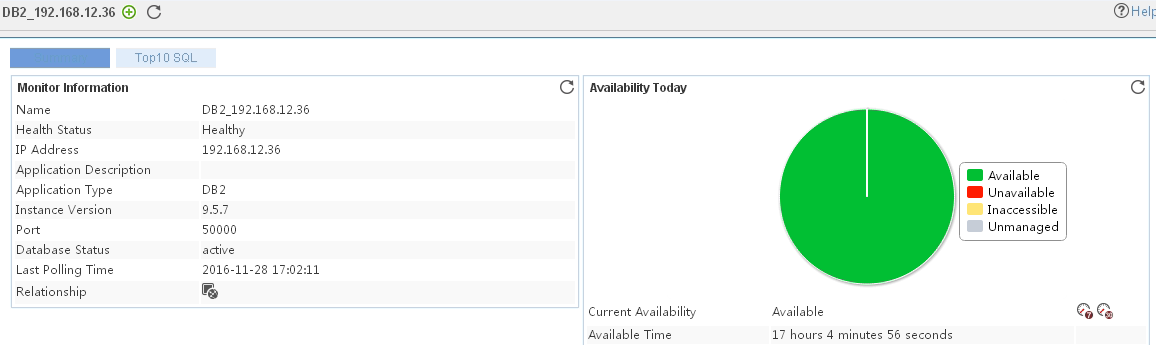
Monitor Information
The Monitor Information area contains the following fields:
· Name—Application monitor name.
· Health Status—Health status of the DB2 application.
· IP Address—IP address of the DB2 host.
· Application Type—Type of the monitored application, which is always DB2.
· Instance Version—Version of the DB2 application.
· Port—Service port of DB2, 50000 by default.
· Database Status—State of the database.
· Last Polling Time—Time when APM last polled the DB2 application.
· Relationship—Click the Related Applications icon ![]() to view
relations between applications in a dependency topology view. For more information about dependency topologies, see "Topology and application group management."
to view
relations between applications in a dependency topology view. For more information about dependency topologies, see "Topology and application group management."
· Top5 Unrecovered Alarm—Latest five unrecovered alarms on the DB2 host. This field is not displayed if no alarm was generated by the DB2 application.
Availability Today
The Availability Today area contains the following fields:
· Current Availability—Availability of the DB2 application.
¡ Click
the Weekly History icon ![]() to
view the availability of the DB2 application in the last 7 days.
to
view the availability of the DB2 application in the last 7 days.
¡ Click
the Monthly History icon ![]() to
view the availability of the DB2 application in the last 30 days.
to
view the availability of the DB2 application in the last 30 days.
· Available Time—Total amount of time that the DB2 application was available after 00:00 today.
· Unavailable Time—Total amount of time that the DB2 application was unavailable after 00:00 today.
· Inaccessible Time—Total amount of time that the DB2 application was inaccessible after 00:00 today.
· Unmanaged Time—Total amount of time that the DB2 application was unmanaged after 00:00 today.
The statistics collection started when the application monitor was added. An availability time field is not displayed when its value is 0.
Connection Statistics
The Connection Statistics area contains the following fields:
· Local Connections—Number of local connections of the DB2 instance. Click the History Record icon ![]() to view the history graph of local
connections.
to view the history graph of local
connections.
· Remote Connections—Number of remote connections of the DB2 instance.
· Total Connections—Total number of local and remote connections of the DB2 instance. Click the History Record icon ![]() to view the history graph of total
connections.
to view the history graph of total
connections.
Response Time
The Response Time area contains the following field:
· Response Time—Response time of the DB2 application. Response time indicates the period from the time when APM sends a request to the time when it receives a response for the request.
¡ Click
the Set Threshold icon ![]() to set alarm
thresholds for the response time.
to set alarm
thresholds for the response time.
¡ Click the History Record icon ![]() to view the history graph of the response time.
to view the history graph of the response time.
Agent Statistics
The Agent Statistics area contains the following fields:
· Active Agents—Number of active agents. The number of active agents is equal to the number of total agents minus the number of idle agents. Click the History
Record icon ![]() to view the history graph of the active agent statistics.
to view the history graph of the active agent statistics.
· Idle Agents—Number of unassigned agents to the applications. Click the History
Record icon ![]() to view the history graph of the idle agent statistics.
to view the history graph of the idle agent statistics.
· Waiting Agents—Maximum number of agents that have waited for tokens since the time when DB2 application
started to the time when APM
last polled the DB2 application. Click the History
Record icon ![]() to view the history graph of the waiting agent statistics.
to view the history graph of the waiting agent statistics.
· Total Agents—Total number of registered agents in the DB2 instance manager. Click the History
Record icon ![]() to view the history graph of the total agent statistics.
to view the history graph of the total agent statistics.
Database Performance
The Database Performance area contains the following fields:
· Database Heap—Size of the database heap.
· Sort List Heap—Size of the sort list heap.
· Statistics Heap—Size of the statistics heap.
· SQL Statement Heap—Size of the SQL statement heap.
· Utilities Heap—Size of the utilities heap.
· Package Cache—Size of the package cache.
· Application Memory—Size of the application memory.
· Buffer Pool—Size of the buffer pool.
· Log Buffer—Size of the log buffer.
· Catalog Cache—Size of the catalog cache.
Database Configuration
The Database Configuration area contains the following fields:
· Default Application Heap—Size of the default application heap.
· Default Tablespace Extentsize—Size of the default tablespace extent.
· Database Code Set—Character set of the DB2 application.
· Database Page Size—Size of the database page.
· Database Memory Threshold—Size of the database memory threshold.
· Database Code Page—Size of the database code page.
· Logging mode—Logging mode of the database.
· Database Backups—Number of database backups to retain.
· Lock Timeout—Time period before the lock times out. The value -1 indicates that the lock never times out.
· Lock Waits—Number of lock waits.
· Num of ESCALATION Lock—Number of escalation locks.
· Sec Log Size—Size of secondary log.
Row Statistics
The Row Statistics area contains the following fields:
· Database Name—Name of the database.
· Rows Queried/Sec—Number of rows affected by the select operation per second.
· Rows Deleted/Sec—Number of rows affected by the delete operation per second.
· Rows Inserted/Sec—Number of rows affected by the insert operation per second.
· Rows Updated/Sec—Number of rows affected by the update operation per second.
Cache Performance
The Cache Performance area contains the following fields:
· Database Name—Name of the database.
· Package Cache Hit Ratio—How often the required request sections have been found in the package cache.
· Catalog Cache Hit Ratio—How often the required table descriptors have been found in the catalog cache.
· PKG CACHE NUM OVERFLOWS—Number of overflowed package cache.
SQL Query Statistics
The SQL Query Statistics area contains the following fields:
· Database Name—Name of the database.
· Query Successes/Sec—Times that the database successfully executed the Select statements per second in the last polling interval.
· Query Failures/Sec—Times that the database failed to execute Select statements per second in the last polling interval.
· Total Work Units/Sec—Total number of SQL statements (including Commit, Rollback, dynamic, and static SQL statements) that the database executed per second in the last polling interval.
Sort OverflowStatistics
The Sort OverflowStatistics area contains the following fields:
· Database name—Name of the database.
· Catalog Cache Overflow—Size of the DB2 application catalog cache overflows.
· Sort Overflow—Size of the DB2 application sort overflows.
· Avg Sort Time—Average time for sorting.
Application Traffic
APM collects DB2 traffic based on the IP address of the host and the traffic collection port used by the application. The Application Traffic area contains the following fields:
· Last Hour's Traffic—Total traffic that is sent and received by the DB2 application over the last 1 hour.
· Today's Traffic—Total traffic that is sent and received by the DB2 application since 00:00 today.
Database Information
The Database Information area contains the following fields:
· Database Name—Name of the database.
· Alias—Alias of the database.
· Path—Complete path for storing the database in the operating system.
· Status—Database status.
· Connection Time—Most recent time when the database finished processing a connection request.
· Sort Overflow(%)—How often the sort overflow occurred.
· Deadlocks—Times of deadlocks that occurred.
· Log Usage—Database log usage ratio.
Tablespace Details
The Tablespace Details area contains the following fields:
· Name—Name of the tablespace.
· Free Bytes—Available space in the tablespace.
· Allocated Bytes—Space that the database manager allocated for the tablespace.
· Free Bytes (%)—Ratio of the available space to the total space in the tablespace.
· Automatic Expansion—Whether the tablespace is automatically expanded. The values are ON and OFF.
· Type—Type of the tablespace.
· State—State of the tablespace.
· Size—Size of the tablespace.
· Tablespace Usage—Percentage of tablespace to the total space.
Buffer Statistics
The Buffer Statistics area contains the following fields:
· Database Name—Name of the database.
· Direct Reads—Number of the reading operations that did not use the buffer pool.
· Direct Writes—Number of the writing operations that did not use the buffer pool.
· Buffer Pool Hit
Ratio—How often the required pages have been found
in the buffer pool. Click the Set Threshold icon ![]() to set alarm thresholds for the
buffer pool hit ratio.
to set alarm thresholds for the
buffer pool hit ratio.
· Index Page Hit Ratio—How often the required index pages have been found in the buffer
pool. Click the Set Threshold icon ![]() to set alarm thresholds for the index
page hit ratio.
to set alarm thresholds for the index
page hit ratio.
· Data Page Hit Ratio—How often the required data pages have been found in the buffer
pool. Click the Set Threshold icon ![]() to set alarm thresholds for the data
page hit ratio.
to set alarm thresholds for the data
page hit ratio.
Buffer Activity Statistics
The Buffer Activity Statistics area contains the following fields:
· Database name—Name of the database.
· Buffer Pool Name—Name of the buffer pool.
· Data Logical Reads—Number of data logical reads.
· Data Physical Reads—Number of data physical reads.
· Index Logical Reads—Number of index logical reads.
· Index Physical Reads—Number of index physical reads.
· Total Buffer Pool Logical Reads—Number of buffer pool logical reads.
· Buffer Pool Asynchronous Reads—Number of buffer pool asynchronous reads.
· Buffer Pool Asynchronous Writes—Number of buffer pool asynchronous writes.
· Buffer Pool Synchronous Reads—Number of buffer pool synchronous reads.
· Buffer Pool Synchronous Writes—Number of buffer pool synchronous writes.
· Synchronous/Asynchronous Reads Ratio—Ratio of the synchronous reads to the asynchronous reads.
Lock Information
The Lock Information area contains the following fields:
· Database Name—Name of the database.
· Lock Name—Name of the lock.
· Lock Mode—Mode of the lock.
¡ IN—Intent None (for dirty read).
¡ IS—Intention Share Lock.
¡ IX—Intention Exclusive Lock.
¡ NON—No Lock.
¡ NS—Share Lock (CS/RS).
¡ NX—Next-key Exclusive Lock.
¡ NW—Next-key Weak Exclusive Lock.
¡ S—Share Lock.
¡ SIX—Share with Intention Exclusive Lock.
¡ U—Update Lock.
¡ X—Exclusive Lock.
¡ Z—Super Exclusive Lock.
¡ W—Weak Exclusive Lock.
· Status—Status of the lock.
¡ CONV—Converting state.
¡ GRNT—Granted state.
· Object Type—Lock object type waited on.
¡ AUTORESIZE_LOCK—Autoresize lock type.
¡ AUTOSTORAGE_LOCK—Automatic storage lock type.
¡ BLOCK_LOCK—Block lock type.
¡ EOT_LOCK—End of table lock.
¡ INPLACE_REORG_LOCK—Inplace reorg lock.
¡ INTERNAL_LOCK—Internal lock type.
¡ INTERNALB_LOCK—Internal Online Backup lock.
¡ INTERNALC_LOCK—Internal Catalog Cache lock.
¡ INTERNALJ_LOCK—Buffer pool lock.
¡ INTERNALL_LOCK—Internal Long/Lob lock.
¡ INTERNALO_LOCK—Internal Object Table lock.
¡ INTERNALQ_LOCK—Internal DNS Sequence lock.
¡ INTERNALP_LOCK—Internal Plan lock.
¡ INTERNALS_LOCK—Internal Sequence lock.
¡ INTERNALT_LOCK—Internal Table Alter lock.
¡ INTERNALV_LOCK—Internal Variation lock.
¡ KEYVALUE_LOCK—Key value lock.
¡ ROW_LOCK—Table row lock type.
¡ SYSBOOT_LOCK—Internal lock on the sysboot table.
¡ TABLE_LOCK—Table lock type.
¡ TABLE_PART_LOCK—Table partition lock type.
¡ TABLESPACE_LOCK—Tablespace lock type.
¡ XML_PATH_LOCK—XML Path lock type.
· Table Space—Table space name.
· Table—Table name.
· Data Partition—Data partition identifier.
· Lock Count—Lock count.
· Lock Hold Count—Lock hold count.
Session
The Session area contains the following fields:
· Database Name—Name of the database.
· Application—Application name.
· Status—Application status.
· Number of associated agents—Number of used agents.
· Status Change Time—Application status change time.
SQL Rollback
The SQL Rollback area contains the following fields:
· DB Name—Name of database.
· ROLLBACK SQL STMTS—Count of SQL statements that are rolled back.
· COMMIT SQL STMTS—Count of SQL statements that are committed.
· INT DEADLOCK ROLLBACKS—Count of SQL statements that are caused by internal deadlock.
Cache Index Hit
The Cache Index Hit area contains the following fields:
· DB Name—Name of database.
· BP Name—Name of buffer pool.
· Total Hit Percent—Percentage of buffer pool index hit.
I/O Time
The I/O Time area contains the following fields:
· DB Name—Name of database.
· BP Name—Name of buffer pool.
· POOL ASYNC READ TIME—Total time of buffer pool asynchronous reads.
· DIRECT WRITE TIME—Total time of directly writes to the database.
SQL Statistics
The SQL Statistics area contains the following fields:
· DB Name—Name of database.
· DDL SQL STMTS—Count of DDL SQL statements.
· STATIC SQL STMTS—Count of static SQL statements.
· DYNAMIC SQL STMTS—Count of dynamic SQL statements.
· UID SQL STMTS—Count of UID SQL statements.
· SELECT SQL STMTS—Count of SELECT SQL statements.
· SELECT RATIO PERENCT—Percentage of select SQL statements.
· UID RATIO PERENCT—Percentage of UID SQL statements.
Top 10 SQL By Execution Time
The Top 10 SQL By Execution Time area contains the following fields:
· SQL—SQL statement.
· Executions—Times for which the SQL statement has been executed.
· Execution Time—Time taken to parse and execute the SQL statement.
Top 10 SQL By Run Time
The Top 10 SQL By Run Time area contains the following fields:
· SQL—SQL statement text.
· Run Time—Elapsed time of the statement.
· Application—Application name.
· Application Status—Application status.
¡ BACKUP—Performing a backup.
¡ COMMIT_ACT—Commit actively.
¡ COMP—Compiling a SQL statement.
¡ CONNECTED—Connection completed.
¡ CONNECTPEND—Connection pending.
¡ CREATE_DB—Creating a database.
¡ DECOUPLED—Application has been decoupled from coordinate.
¡ DISCONNECTPEND—Disconnection pending.
¡ INTR—Request interrupted.
¡ IOERROR_WAIT—Wait to disable tablespace.
¡ LOAD—Performing a fast load.
¡ LOCKWAIT—Lock wait.
¡ QUIESCE_TABLESPACE—Quiescing a tablespace.
¡ RECOMP—Recompiling a plan.
¡ REMOTE_RQST—Pending results from remote request.
¡ RESTART—Restarting a database.
¡ RESTORE—Restoring a database.
¡ ROLLBACK_ACT—Rollback activity.
¡ ROLLBACK_TO_SAVEPOINT—Rollback to savepoint.
¡ TEND—Transaction ended.
¡ THABRT—Heuristically rolled back.
¡ THCOMT—Heuristically committed.
¡ TPREP—Prepared transaction.
¡ UNLOAD—Performing a fast unload.
¡ UOWEXEC—UOW executing.
¡ UOWWAIT—UOW waiting.
¡ WAITFOR_REMOTE—Waiting for remote node.
· Author—Author that executes the SQL statement.
Top 10 SQL By Execution Frequency
The Top 10 SQL By Execution Frequency area contains the following fields:
· SQL—SQL statement text.
· Average Execution Time—Average execution time.
· Executions—Total times of statement executions.
Top 10 SQL By Sort Frequency
The Top 10 SQL By Sort Frequency area contains the following fields:
· SQL—SQL statement text.
· Executions—Total times of statement executions.
· Sort Number—Total times of statement sorts.
· Sort Number Per Execution—Number of sorts per statement execution.
Caché
Caché is a post relational database developed by Intersystems. Database performance and stability affect service operations. APM supports monitoring Caché.
Adding a Caché application monitor
APM can locally or remotely monitor Caché applications through JDBC. When you add Caché application monitors, follow these guidelines:
· If you use agents to locally monitor Caché applications, first install agents on hosts where Caché applications are deployed. For more information about installing agents, see "APM agent management."
· If you remotely monitor Caché applications through JDBC, obtain the username and password of the user who has the Caché database administrator's privileges.
· Add Caché hosts to the IMC platform so that APM can obtain and display network connections of the hosts and their access devices in the application topology. For more information about adding hosts to the IMC platform, see H3C Intelligent Management Center v7.3 Enterprise and Standard Platform Administrator Guide.
· To view traffic statistics in the monitor report of the Caché application, make sure at least one probe is configured in APM. After a Caché application monitor is added, APM sends the IP address and service port of the monitored Caché application to the probes for traffic collection.
To add a Caché application monitor:
1. Click the Resource tab.
2. Open the Add Application page by using one of the following methods:
¡ From the navigation tree, select Application Manager > Add Application.
¡ From the navigation tree, select Application Manager > Application Monitor. In the application monitor list, click Add.
The Add Application page displays all application types that can be monitored by APM.
3. Click Caché of the Database Server Monitor class.
The page for adding a Caché application monitor opens.
4. Configure the following parameters:
¡ IP Address—Enter the IP address of the host on which the Caché application to be monitored is installed. APM automatically checks the IP address and associates the application monitor with the host managed in the IMC platform. If the host is already added to the IMC platform, you can also click Select, and then select the host in the Select Devices window. For information about selecting a host, see "Quick start."
¡ Name—Enter a unique application monitor name. As a best practice, name the application monitor as application type_host IP address.
¡ Use Template—Select Enable or Disable from the list.
¡ Template—Click the Configure icon ![]() next to the Template field to select an
existing template. The Template field is
automatically populated with the name of the selected template. For more
information about configuring application templates, see "Configuration management." This field is displayed only when you select Enable from the Use Template
list.
next to the Template field to select an
existing template. The Template field is
automatically populated with the name of the selected template. For more
information about configuring application templates, see "Configuration management." This field is displayed only when you select Enable from the Use Template
list.
¡ Description—Enter a description for the application monitor.
¡ Application Monitor Port—Enter the service port number for the Caché application, 1972 by default. This field is available only when you select Disable from the Use Template list.
¡ Traffic Collection Port—Enter the service port number for the Caché application. This field is displayed only when at least one probe is configured for APM and you select Disable from the Use Template list.
¡ Polling Interval (min)—Select a polling interval for the application monitor. Available options are 1, 2, 3, 4, 5, 10, 20, and 30. The default polling interval is 5 minutes. A shorter polling interval improves real-time data accuracy at the expense of system resources. This field is available only when you select Disable from the Use Template list.
¡ Username/Password—Enter the username of the Caché administrator. The fields are available only when you select Disable from the Use Template list.
¡ Contact—Enter the contact information, such as the name, email address, and telephone number. The default is the username of the operator who created the application monitor. This field is available only when you select Disable the Use Template list.
¡ APM Server—Select an APM server to monitor the application. The options are in server-address (application-type:n/N) format. The letter n indicates the number of Caché applications monitored on the APM server. The letter N indicates the total number of applications monitored on the APM server. Server address 127.0.0.1 indicates that APM and the IMC platform are deployed on the same server.
¡ Related Applications—Click Add next to this field. On the Select Application window, enter a partial or complete name to filter applications, select the applications that Caché depends on, and then click OK.
Operating system applications cannot be selected. Operators can view all dependencies of the application in the dependency topology. APM automatically adds the dependencies between Caché and operating system applications by IP address and displays their dependencies in the application topology.
¡ Application Group—Specify an application group for the Caché application.
- To specify an existing application group, click Add, select an application group, and then click OK.
- To specify a new application group, click Add Application Group, configure the application group settings, and then click OK.
¡ Detect Application—Select this parameter if you want to enable application detection. Application detection enables APM to verify connection to the application by using the previous parameter settings, and to determine whether to add the application monitor based on the verification result. APM adds the application monitor only when it can connect to the application. When this parameter is not specified, APM adds the application monitor without verifying the connection.
5. Click OK.
Modifying a Caché application monitor
Authorized users can modify all parameters except the IP address and the APM server for a Caché application monitor. When the IP address of a monitored Caché host changes, operators must add a new application monitor for the host. However, the new application monitor cannot inherit the history data from the previous application monitor.
To modify a Caché application monitor:
1. Click the Resource tab.
2. From the navigation tree, select Application Manager > Application Monitor.
The application monitor list page opens.
3. Click the Modify
icon ![]() for the Caché application monitor you want to modify.
for the Caché application monitor you want to modify.
The page for modifying the Caché application monitor opens.
4. Modify the parameters as needed, except the IP address and the APM server.
For more information about parameter settings, see "Adding a Caché application monitor."
5. Click OK.
Viewing the Caché application monitor report
After a Caché application monitor is added, APM collects index data of the application, evaluates the availability and health status, and updates the monitor report. The report shows the index values obtained from the most recent polling of the application.
To view the Caché application monitor report:
1. Click the Resource tab.
2. From the navigation tree, select Application Manager > Application Monitor.
The application monitor list page displays all application monitors.
3. Click the name of a Caché application monitor to display the report.
Figure 68 shows part of a Caché application monitor report.
Figure 68 Part of a Caché application monitor report
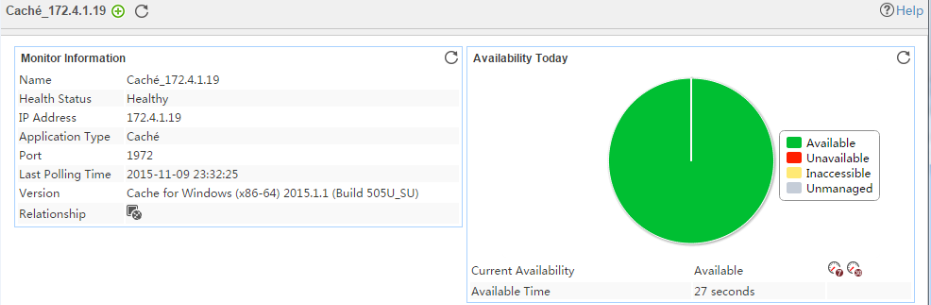
Monitor Information
The Monitor Information area contains the following fields:
· Name—Name of the Caché application monitor.
· Health Status—Health status of the Caché application.
· IP Address—IP address of the host where the Caché application resides.
· Application Type—Type of the monitored application, which is always Caché.
· Port—Port used by the Caché application, 1972 by default.
· Version—Version number of the Caché application.
· Last Polling Time—Time when APM last polled the Caché application.
· Relationship—Click the Related Applications icon ![]() to view dependencies between the Caché
application and other applications in a dependency topology view. For more information about dependency
topologies, see "Topology and application group
management."
to view dependencies between the Caché
application and other applications in a dependency topology view. For more information about dependency
topologies, see "Topology and application group
management."
· Top5 Unrecovered Alarm—Latest five unrecovered alarms on the Caché host. This field is not displayed if no alarm was generated by the Caché application.
Availability Today
The Availability Today area contains the following fields:
· Current Availability—Availability of the Caché application.
¡ Click
the Weekly History icon ![]() to view
the availability of the Caché
application in the last 7 days.
to view
the availability of the Caché
application in the last 7 days.
¡ Click
the Monthly History icon ![]() to view
the availability of the Caché
application in the last 30 days.
to view
the availability of the Caché
application in the last 30 days.
· Available Time—Total amount of time that the Caché application was available after 00:00 today.
· Unavailable Time—Total amount of time that the Caché application was unavailable after 00:00 today.
· Inaccessible Time—Total amount of time that the Caché application was inaccessible after 00:00 today.
· Unmanaged Time—Total amount of time that the Caché application was unmanaged after 00:00 today.
The statistics collection started when the application monitor was added. An availability time field is not displayed when its value is 0.
Database Information
The Database Information area contains the following fields:
· Database Name—Name of the database.
· Modified at—Time when the database was most recently modified.
· Database File Name—Name and path of the database file.
· Database Size—Size of the database.
Response Time
The Response Time area contains the following field:
· Response Time—Period from the time when APM sends a request to the time when it
receives a response for the request. Click the History Record icon ![]() to view the history
graph of the response time.
to view the history
graph of the response time.
User Information
The User Information area contains the following fields:
· User Name— Name of the user.
· Full Name—Complete name of the user group to which the user belongs.
· Super User—Whether the user is a super user.
· Expired— Whether the database user has expired.
· Expiration Date— Date when the user expired.
Process Information
The Process Information area contains the following fields:
· Process ID—ID of the process.
· Process Name—Name of the process.
· Client Program—Client program that is used to connect to the Caché database.
· Process Status—Running status of the process.
· Client IP Address—IP address of the client.
· Client Name—Name of the client.
· Global References—Number of global references.
· Last Global Reference—Object that was globally used for the most recent time.
· Used Memory—Memory used by the process.
· Peak Memory—Maximum memory used by the process.
Informix
Informix is an IBM-developed DBMS.
Configuring an Informix server
Before using APM to manage Informix on a Linux server, edit the configuration file on the server:
1. Open file /home/informix/etc/sqlhosts in a text editor.
2. Add an asterisk (*) in front of each host alias. For example, cs_dbs onsoctcp *linux sqlexe.
3. Save and close the file.
Adding an Informix application monitor
APM monitors Informix applications through JDBC. When you add Informix application monitors, follow these guidelines:
· Obtain the username and password of a user who has the Informix administrator's privileges and the names of the database and database service to which the Informix administrator has access.
· Add Informix hosts to the IMC platform so APM can obtain and display network connections of the hosts and their access devices in the application topology. For more information about adding hosts to the IMC platform, see H3C Intelligent Management Center v7.3 Enterprise and Standard Platform Administrator Guide.
· To view traffic statistics in the monitor report of the Informix application, make sure at least one probe is configured in APM. After an Informix application monitor is added, APM sends the IP address and service port of the monitored Informix application to the probes for traffic collection.
To add an Informix application monitor:
1. Click the Resource tab.
2. Open the Add Application page by using one of the following methods:
¡ From the navigation tree, select Application Manager > Add Application.
¡ From the navigation tree, select Application Manager > Application Monitor. In the application monitor list, click Add.
The Add Application page displays all application types that can be monitored by APM.
3. Click Informix of the Database Server Monitor class.
The page for adding an Informix application monitor opens.
4. Configure the following parameters:
¡ IP Address—Enter the IP address of the Informix server to be monitored. APM automatically checks the IP address and associates the application monitor with the Informix server if it is already managed in the IMC platform. To monitor an Informix server that is already managed in the IMC platform, you can also click Select, and then select the Informix server in the Select Devices window. For information about selecting an Informix server, see "Quick start."
¡ Name—Enter a unique application monitor name. As a best practice, name the application monitor as application type_host IP address.
¡ Use Template—Select Enable or Disable from the list.
¡ Template—Click the Configure icon ![]() next to the Template
field to select an existing template. The Template
field is automatically populated with the name of the selected template. For
more information about configuring application templates, see "Configuration management." This field is displayed only when you select Enable from the Use Template
list.
next to the Template
field to select an existing template. The Template
field is automatically populated with the name of the selected template. For
more information about configuring application templates, see "Configuration management." This field is displayed only when you select Enable from the Use Template
list.
¡ Description—Enter a description for the application monitor.
¡ Application Monitor Port—Enter the listening port for the Informix application. The default setting is TCP 9088. This field is available only when you select Disable from the Use Template list.
¡ Traffic Collection Port—Enter the port used by the Informix application to provide services. The default setting is TCP 9088. The parameter is displayed only after a traffic probe is configured in APM and you select Disable from the Use Template list.
¡ Polling Interval (min)—Select a polling interval for the application monitor. Available options are 1, 2, 3, 4, 5, 10, 20, and 30. The default polling interval is 5 minutes. A shorter polling interval improves real-time data accuracy at the expense of system resources. This field is available only when you select Disable from the Use Template list.
¡ Username/Password—Enter the username of the Informix administrator. The fields are available only when you select Disable from the Use Template list.
¡ Database Name—Enter a database name for connecting to the Informix application. This field is available only when you select Disable from the Use Template list.
¡ Database Service Name—Enter a database service name for connecting to the Informix application. This field is available only when you select Disable from the Use Template list.
¡ Contact—Enter the contact information, such as the name, email address, and telephone number. The default is the username of the operator who created the application monitor. This field is available only when you select Disable from the Use Template list.
¡ APM Server—Select an APM server to monitor the application. The options are in server-address (application-type:n/N) format. The letter n indicates the number of Informix applications monitored on the APM server. The letter N indicates the total number of applications monitored on the APM server. Server address 127.0.0.1 indicates that APM and the IMC platform are deployed on the same server.
¡ Related Applications—Click Add next to this field. On the Select Application window, enter a partial or complete name to filter applications, select the applications that Informix depends on, and then click OK.
Operating system applications cannot be selected. Operators can view all dependencies of the application in the dependency topology. APM automatically adds the dependencies between Informix and operating system applications by IP address and displays their dependencies in the dependency topology.
¡ Application Group—Specify an application group for the Informix application.
- To specify an existing application group, click Add, select an application group, and then click OK.
- To specify a new application group, click Add Application Group, configure the application group settings, and then click OK.
¡ Detect Application—Select this parameter if you want to enable application detection. APM verifies the application connectivity by using the previous parameter settings, and adds the application monitor only when it can connect to the application. If you do not select this parameter, APM adds the application monitor without verifying the application connectivity.
5. Click OK.
Modifying an Informix application monitor
Authorized users can modify all parameters except the IP address and the APM server for an Informix server. When the IP address of a monitored Informix server changes, authorized users must add a new application monitor for the Informix server. The new application monitor cannot inherit the history data from the previous application monitor.
To modify an Informix application monitor:
1. Click the Resource tab.
2. From the navigation tree, select Application Manager > Application Monitor.
The application monitor list page displays all application monitors.
3. Click the Modify
icon ![]() for the Informix
application monitor you want to modify.
for the Informix
application monitor you want to modify.
The page for modifying the Informix application monitor opens.
4. Modify the parameters as needed, except the IP address and the APM server.
For more information about parameter settings, see "Adding an Informix application monitor."
5. Click OK.
Viewing the Informix application monitor report
After an Informix application monitor is added, APM collects index data of the application, evaluates the availability and health status, and updates the monitor report. The report shows the index values obtained from the most recent polling of the application.
To view the Informix application monitor report:
1. Click the Resource tab.
2. From the navigation tree, select Application Manager > Application Monitor.
The application monitor list page displays all application monitors.
3. Click the name of an Informix application monitor to display the report.
Figure 69 shows part of an Informix application monitor report.
Figure 69 Part of an Informix application monitor report
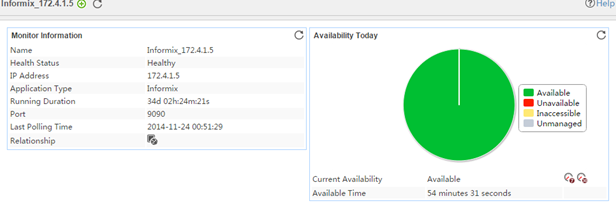
Monitor Information
The Monitor Information area contains the following fields:
· Name—Application monitor name.
· Health Status—Health status of the Informix application.
· IP Address—IP address of the Informix host.
· Application Type—Type of the monitored application, which is always Informix.
· Running Duration—Informix application running duration from the time when the application started to the time when APM last polled the application.
· Port—Service port of Informix, 9088 by default.
· Last Polling Time—Time when APM last polled the Informix application.
· Relationship—Click the Related Applications icon ![]() to view
relations between applications in a dependency topology view. For more information about dependency topologies, see "Topology and application group management."
to view
relations between applications in a dependency topology view. For more information about dependency topologies, see "Topology and application group management."
· Top5 Unrecovered Alarm—Latest five unrecovered alarms on the Informix host. This field is not displayed if no alarm was generated by the Informix application.
Availability Today
The Availability Today area contains the following fields:
· Current Availability—Availability of the Informix application.
¡ Click
the Weekly History icon ![]() to view the availability of the
Informix application in the last 7 days.
to view the availability of the
Informix application in the last 7 days.
¡ Click
the Monthly History icon ![]() to view the availability of the
Informix application in the last 30 days.
to view the availability of the
Informix application in the last 30 days.
· Available Time—Total amount of time that the Informix application was available after 00:00 today.
· Unavailable Time—Total amount of time that the Informix application was unavailable after 00:00 today.
· Inaccessible Time—Total amount of time that the Informix application was inaccessible after 00:00 today.
· Unmanaged Time—Total amount of time that the Informix application was unmanaged after 00:00 today.
The statistics collection started when the application monitor was added. An availability time field is not displayed when its value is 0.
Sort Statistics
The Sort Statistics area contains the following fields:
· Total Sorts—Total number of sorts that the Informix
application performed. Click the History
Record icon ![]() to view the history graph of total sorts.
to view the history graph of total sorts.
· Memory sorts—Number of sorts that the Informix
application performed in memory. Click the History Record icon ![]() to view the history graph of memory sorts.
to view the history graph of memory sorts.
· Disk Connections—Number
of sorts that the Informix application performed in disks. Click the History Record icon ![]() to view the history
graph of disk sorts.
to view the history
graph of disk sorts.
· Max. Sort Space—Maximum space that the Informix application
used to perform sorts. Click the History
Record icon ![]() to view the history graph of the maximum sort space.
to view the history graph of the maximum sort space.
Lock Statistics
The field in the Lock Statistics area is as follows:
· Lock Requests—Number of lock requests for the Informix
application. Click the History Record icon ![]() to view the history graph of lock requests.
to view the history graph of lock requests.
· Lock Waits—Number of lock waits for the Informix
application. Click the History Record icon ![]() to view the history graph of lock waits.
to view the history graph of lock waits.
· Deadlocks—Number of deadlocks for the Informix
application. Click the History Record icon ![]() to view the history graph of deadlocks.
to view the history graph of deadlocks.
· Deadlock Timeout Count—Number of deadlock timeouts for the
Informix application. Click the History Record icon ![]() to view the history graph of the deadlock
timeout count.
to view the history graph of the deadlock
timeout count.
Buffer Statistics
The Agent Statistics area contains the following fields:
· Buffer Read Hit Ratio—Buffer read hit ratio of the Informix application.
¡ Click
the Set Threshold icon ![]() to set alarm
thresholds for the buffer read hit ratio.
to set alarm
thresholds for the buffer read hit ratio.
¡ Click
the History Record icon ![]() to view the history graph of the buffer
read hit ratio.
to view the history graph of the buffer
read hit ratio.
· Buffer Write Hit Ratio—Buffer write hit ratio of the Informix application.
¡ Click
the Set Threshold icon ![]() to set alarm
thresholds for the buffer write hit ratio.
to set alarm
thresholds for the buffer write hit ratio.
¡ Click
the History Record icon ![]() to view the history graph of the buffer
write hit ratio.
to view the history graph of the buffer
write hit ratio.
Disk I/O Statistics
The Disk I/O Statistics area contains the following fields:
· Pages Read from Disk—Memory pages that the Informix application
read from the disk. Click the History
Record icon ![]() to view the history
graph of the pages read from the disk.
to view the history
graph of the pages read from the disk.
· Pages Written to Disk—Memory pages that the Informix application
wrote to the disk. Click the History
Record icon ![]() to view the history
graph of the pages written to the disk.
to view the history
graph of the pages written to the disk.
System Information
The System Information area contains the following fields:
· Start Time—Time when the Informix application started.
· Running Duration—Informix application running duration from the time when the application started to the time when APM last polled the application.
· Max. Chunks—Maximum number of chunks that the Informix application supports.
· Max. Dbspaces—Maximum number of dbspaces that the Informix application supports.
· Max. User Threads—Maximum number of user threads that the Informix application supports.
· Max. Transactions—Maximum number of transactions that the Informix application supports.
· Max. Locks—Maximum number of locks that the Informix application supports.
· LRU Queue Length —Maximum number of objects that the LRU queue in the Informix application can contain.
· Long Transaction Flag—Number of long transactions in the Informix application.
Session Connection Information
The Session Connection Information area contains the following fields:
· Host Name—Name of the host that connects to the Informix application.
· User Process ID—ID of the process to which the session corresponds.
· User Name—Username that is used to connect to the Informix database.
· Database Name—Name of the database to which the user connects.
· Last Running Time—Last operation time of the session.
· Idle Time—Idle time of the session.
· Connection Time—Time when the session was established.
Session Wait Information
The Session Wait Information area contains the following fields:
· Lock Waits—Whether the session waited for lock release. The value can be 0 or 1. The value of 0 indicates that the application did not wait for lock release. The value of 1 indicates that the application waited for lock release.
· Cache Waits—Whether the session waited for cache release. The value can be 0 or 1. The value of 0 indicates that the application did not wait for cache release. The value of 0 indicates that the application waited for cache release.
· Check Point Waits—Whether the session waited for check point processing to be completed. The value can be 0 or 1. The value of 0 indicates that the application did not wait for check point processing to be completed. The value of 1 indicates that the application waited for check point processing to be completed.
· Latch Waits—Whether the session waited for latch release. The value can be 0 or 1. The value of 0 indicates that the application did not wait for latch release. The value of 1 indicates that the application waited for latch release.
· Transaction Critical Section—Whether the session waited for the transaction critical section. The value can be 0 or 1. The value of 0 indicates that the application did not wait for the transaction critical section. The value of 1 indicates that the application waited for the transaction critical section.
Chunk Information
Chunks are physical storage entities. Each dbspace contains one or more chunks. The Informix application accesses data through dbspaces. The Chunk Information area contains the following fields:
· Name—Name of the storage space.
· Status—Status of the storage space.
· Type—Type of the storage space.
· Space Size—Size of the storage space.
· Free Space Size—Free size of the storage space.
· In Use (%)—Usage of storage space.
MemCached
MemCached is a distributed memory object caching system. It is widely used for speeding up Web access. APM supports MemCached monitoring.
Adding a MemCached application monitor
APM monitors MemCached applications through sockets or agents.
To monitor MemCached applications through agents, first install agents on hosts where MemCached applications are deployed. For more information about installing agents, see "APM agent management."
To add a MemCached application monitor:
1. Click the Resource tab.
2. Open the Add Application page by using one of the following methods:
¡ From the navigation tree, select Application Manager > Add Application.
¡ From the navigation tree, select Application Manager > Application Monitor. In the application monitor list, click Add.
The Add Application page displays all application types that can be monitored by APM.
3. Click MemCached of the Database Server Monitor class.
The page for adding a MemCached application monitor opens.
4. Configure the following parameters:
¡ IP Address—Enter the IP address of the host on which the MemCached application to be monitored is installed. APM automatically checks the IP address and associates the application monitor with the host if the host is already managed in the IMC platform. If the host is already managed in the IMC platform, you can also click Select, and then select the host in the Select Devices window. For information about selecting a host, see "Selecting devices."
¡ Name—Enter a unique application monitor name. As a best practice, name the application monitor as application type_host IP address.
¡ Use Template—Select Enable or Disable from the list.
¡ Template—Click the Configure icon ![]() next to the Template field to select an
existing template. The Template field is
automatically populated with the name of the selected template. This field is
displayed only when you select Enable from the Use Template list.
next to the Template field to select an
existing template. The Template field is
automatically populated with the name of the selected template. This field is
displayed only when you select Enable from the Use Template list.
¡ Description—Enter a description for the application monitor.
¡ Application Monitor Port—Enter the service port number for the MemCached application. The default setting is 11211. This field is available only when you select Disable from the Use Template list.
¡ Polling Interval (min)—Select a polling interval for the application monitor. Available options are 1, 2, 3, 4, 5, 10, 20, and 30. The default polling interval is 5 minutes. A shorter polling interval improves real-time data accuracy at the expense of system resources. This field is available only when you select Disable from the Use Template list.
¡ Contact—Enter the contact information, such as the name, email address, and telephone number. The default is the username of the operator who created the application monitor. This field is available only when you select Disable the Use Template list.
¡ APM Server—Select an APM server to monitor the application. The options are in server-address (application-type:n/N) format. The letter n indicates the number of MemCached applications monitored on the APM server. The letter N indicates the total number of applications monitored on the APM server. Server address 127.0.0.1 indicates that APM and the IMC platform are deployed on the same server.
¡ Related Applications—Click Add next to this field. On the Select Application window, enter a partial or complete name to filter applications, select the applications that MemCached depends on, and then click OK.
Operating system applications cannot be selected. APM automatically adds the dependencies between MemCached and operating system applications by IP address and displays their dependencies in the application topology.
Operators can view all dependencies of the application in the dependency topology.
¡ Application Group—Specify an application group for the MemCached application.
- To specify an existing application group, click Add, select an application group, and then click OK.
- To specify a new application group, click Add Application Group, configure the application group settings, and then click OK.
¡ Detect Application—Select this parameter if you want to enable application detection. Application detection enables APM to verify the connectivity to the application by using the previous parameter settings. APM adds the application monitor only when it can connect to the application. When this parameter is not selected, APM adds the application monitor without verifying the application connectivity.
5. Click OK.
Modifying a MemCached application monitor
Authorized users can modify all parameters except the IP address and the APM server for a MemCached application monitor. When the IP address of a monitored MemCached host changes, operators must add a new application monitor for the host. However, the new application monitor cannot inherit the history data from the previous application monitor.
To modify a MemCached application monitor:
1. Click the Resource tab.
2. From the navigation tree, select Application Manager > Application Monitor.
The application monitor list page opens.
3. Click the Modify
icon ![]() for the MemCached application monitor you want to modify.
for the MemCached application monitor you want to modify.
The page for modifying the MemCached application monitor opens.
4. Modify the parameters as needed, except the IP address and the APM server.
For more information about parameter settings, see "Adding a MemCached application monitor."
5. Click OK.
Viewing the MemCached application monitor report
After a MemCached application monitor is added, APM collects index data of the application, evaluates the availability and health status, and updates the monitor report. The report shows the index values obtained from the most recent polling of the application.
To access the MemCached application monitor report:
1. Click the Resource tab.
2. From the navigation tree, select Application Manager > Application Monitor.
The application monitor list page displays all application monitors.
3. Click the name of a MemCached application monitor to display the report.
Figure 70 shows part of a MemCached application monitor report.
Figure 70 Part of a MemCached application monitor report
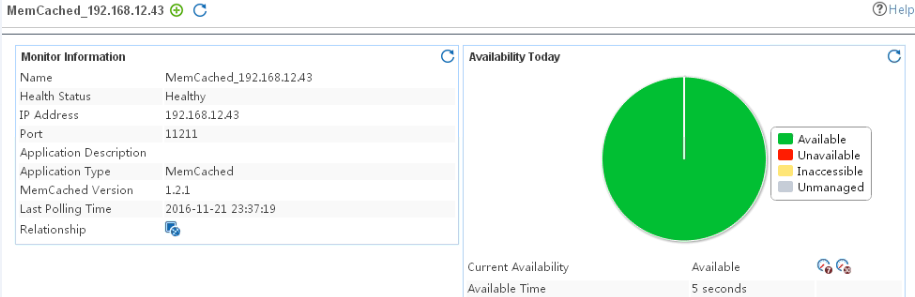
Monitor Information
The Monitor Information area contains the following fields:
· Name—Application monitor name.
· Health State—Health status of the application.
· IP Address—Host IP address of the MemCached application.
· Port—Listening port of the MemCached application.
· Application Description—Description of the MemCached application.
· Application Type—Type of the monitored application, which is MemCached.
· Last Polling Time—Time when APM last polled the MemCached application.
· Relationship—Click the Relationship
icon ![]() to view dependencies
between MemCached and other
applications in a dependency topology view. For more information
about dependency topologies, see "Topology and application group
management."
to view dependencies
between MemCached and other
applications in a dependency topology view. For more information
about dependency topologies, see "Topology and application group
management."
· Top5 Unrecovered Alarm—Latest five unrecovered alarms on the MemCached application. The alarm level is identified by color: yellow for minor alarms, orange for major alarms, and red for critical alarms. This field is not displayed if no alarm is generated by the MemCached application.
Availability Today
The Availability Today area contains the following fields:
· Current Availability—Availability of the MemCached application.
¡ Click
the Weekly History icon![]() to view the availability of the MemCached
application in the last 7 days.
to view the availability of the MemCached
application in the last 7 days.
¡ Click
the Monthly History icon![]() to view the availability of the MemCached application in the last 30 days.
to view the availability of the MemCached application in the last 30 days.
· Available Time—Total amount of time that the MemCached application was available after 00:00 today.
· Unavailable Time—Total amount of time that the MemCached application was unavailable after 00:00 today.
· Inaccessible Time—Total amount of time that the MemCached application was inaccessible after 00:00 today.
· Unmanaged Time—Total amount of time that the MemCached application was unmanaged after 00:00 today.
The statistics collection started when the application monitor was added. An availability time field is not displayed when its value is 0.
CPU Utilization
The CPU Utilization area contains the following fields:
· User CPU—Total amount of user CPU time for a process.
· System CPU—Total amount of system CPU time for a process.
Memory Utilization
The Memory Utilization area contains the following fields:
· Used Memory—Used memory of MemCached.
· Free Memory—Free memory of MemCached.
· Total Memory—Total memory of MemCached.
· Memory Used Ratio—Used memory ratio of MemCached.
· Memory Free Ratio—Free memory ratio of MemCached.
· Memory Hit Ratio—Memory hit ratio of MemCached.
Cached Hits and Misses
The Cached Hits and Misses area contains the following fields:
· Hits/min—Number of cache hits that occur in a minute.
· Misses/min—Number of cache misses that occur in a minute.
Cached Items
The Cached Items area contains the following fields:
· Items cached—Number of cached items.
· Evictions—Number of items removed from cache.
GET and SET Requests
The GET and SET Requests area contains the following fields:
· Gets/min—Number of retrieval requests per minute.
· Sets/min—Number of storage requests per minute.
Network Traffic
The Network Traffic area contains the following fields:
· Bytes Received—Number of bytes that MemCached received from the network in a minute.
· Bytes Sent—Number of bytes that MemCached sent to the network in a minute.
Connections
The Connections area contains the following fields:
· Connections—Number of current MemCached connections.
· Threads—Number of current MemCached threads.
· Response Time—Time taken by APM to execute the STATS command on the MemCached server.
Transaction
The Transaction area contains the following fields:
· SET-Time—Time used to set data to MemCached.
· GET-Time—Time used to obtain data from MemCached.
· DELETE-Time—Time used to delete data from MemCached.
· Total Transaction Time—Total time used by all operations performed on MemCached.
MongoDB
MongoDB is an open source DBMS based on the distributed file storage system. Database performance and stability affect service operations. APM supports monitoring MongoDB applications.
Adding a MongoDB application monitor
APM monitors MongoDB applications through agents or JDBC. When you add MongoDB application monitors, follow these guidelines:
· To monitor a MongoDB application through an agent, first install agents on hosts where MongoDB applications are deployed. For more information about installing agents, see "APM agent management."
· MongoDB supports both password and passwordless authentication. To monitor a MongoDB application through JDBC, obtain the username and password if a username and password is configured for the MongoDB database.
· Add MongoDB hosts to the IMC platform so that APM can obtain and display network connections of the hosts and their access devices in the application topology. For more information about adding hosts to the IMC platform, see H3C Intelligent Management Center v7.3 Enterprise and Standard Platform Administrator Guide.
· To view traffic statistics in the monitor report of the MongoDB application, make sure at least one probe is configured in APM. After a MongoDB application monitor is added, APM sends the IP address and service port of the monitored MongoDB application to the probes for traffic collection.
To add a MongoDB application monitor:
1. Click the Resource tab.
2. Open the Add Application page by using one of the following methods:
¡ From the navigation tree, select Application Manager > Add Application.
¡ From the navigation tree, select Application Manager > Application Monitor. In the application monitor list, click Add.
The Add Application page displays all application types that can be monitored by APM.
3. Click MongoDB of the Database Server Monitor class.
The page for adding a MongoDB application monitor opens.
4. Configure the following parameters:
¡ IP Address—Enter the IP address of the host on which the MongoDB application to be monitored is installed. APM automatically checks the IP address and associates the application monitor with the host managed in the IMC platform. If the host is already added to the IMC platform, you can also click Select, and then select the host in the Select Devices window. For information about selecting a host, see "Quick start."
¡ Name—Enter a unique application monitor name. As a best practice, name the application monitor as application type_host IP address.
¡ Use Template—Select Enable or Disable from the list.
¡ Template—Click the Configure icon ![]() next to the Template field to select an
existing template. The Template field is
automatically populated with the name of the selected template. For more
information about configuring application templates, see "Configuration management." This field is displayed only when you select Enable from the Use Template
list.
next to the Template field to select an
existing template. The Template field is
automatically populated with the name of the selected template. For more
information about configuring application templates, see "Configuration management." This field is displayed only when you select Enable from the Use Template
list.
¡ Description—Enter a description for the application monitor.
¡ Application Monitor Port—Enter the service port number for the MongoDB application. The default setting is 27017. This field is available only when you select Disable from the Use Template list.
¡ Traffic Collection Port—Enter the service port number for MongoDB. This field is displayed only after you configure at least one probe for APM and select Disable from the Use Template list.
¡ Polling Interval (min)—Select a polling interval for the application monitor. Available options are 1, 2, 3, 4, 5, 10, 20, and 30. The default polling interval is 5 minutes. A shorter polling interval improves real-time data accuracy at the expense of system resources. This field is available only when you select Disable from the Use Template list.
¡ Username—Enter the username of the MongoDB administrator. The fields are available only when you select Disable from the Use Template list.
¡ Password—Enter the password of the MongoDB administrator. The fields are available only when you select Disable from the Use Template list.
¡ Contact—Enter the contact information, such as the name, email address, and telephone number. The default is the username of the operator who created the application monitor. This field is available only when you select Disable the Use Template list.
¡ APM Server—Select an APM server to monitor the application. The options are in server-address (application-type:n/N) format. The letter n indicates the number of MongoDB applications monitored on the APM server. The letter N indicates the total number of applications monitored on the APM server. Server address 127.0.0.1 indicates that APM and the IMC platform are deployed on the same server.
¡ Related Applications—Click Add next to this field. On the Select Application window, enter a partial or complete name to filter applications, select the applications that MongoDB depends on, and then click OK.
Operating system applications cannot be selected. Operators can view all dependencies of the application in the dependency topology. APM automatically adds the dependencies between MongoDB and operating system applications by IP address and displays their dependencies in the application topology.
¡ Application Group—Specify an application group for the MongoDB application.
- To specify an existing application group, click Add, select an application group, and then click OK.
- To specify a new application group, click Add Application Group, configure the application group settings, and then click OK.
¡ Detect Application—Select this parameter if you want to enable application detection. Application detection enables APM to verify connection to the application by using the previous parameter settings, and to determine whether to add the application monitor based on the verification result. APM adds the application monitor only when it can connect to the application. When this parameter is not specified, APM adds the application monitor without verifying the connection.
5. Click OK.
Modifying a MongoDB application monitor
Authorized users can modify all parameters except the IP address and the APM server for a MongoDB application monitor. When the IP address of a monitored MongoDB host changes, operators must add a new application monitor for the host. However, the new application monitor cannot inherit the history data from the previous application monitor.
To modify a MongoDB application monitor:
1. Click the Resource tab.
2. From the navigation tree, select Application Manager > Application Monitor.
The application monitor list page opens.
3. Click the Modify
icon ![]() for the MongoDB application monitor you want to modify.
for the MongoDB application monitor you want to modify.
The page for modifying the MongoDB application monitor opens.
4. Modify the parameters as needed, except the IP address and the APM server.
For more information about parameter settings, see "Adding a MongoDB application monitor."
5. Click OK.
Viewing the MongoDB application monitor report
After a MongoDB application monitor is added, APM collects index data of the application, evaluates the availability and health status, and updates the monitor report. The report shows the index values obtained from the most recent polling of the application.
To view the MongoDB application monitor report:
1. Click the Resource tab.
2. From the navigation tree, select Application Manager > Application Monitor.
The application monitor list page displays all application monitors.
3. Click the name of a MongoDB application monitor to display the report.
Figure 71 shows part of a MongoDB application monitor report.
Figure 71 Part of a MongoDB application monitor report
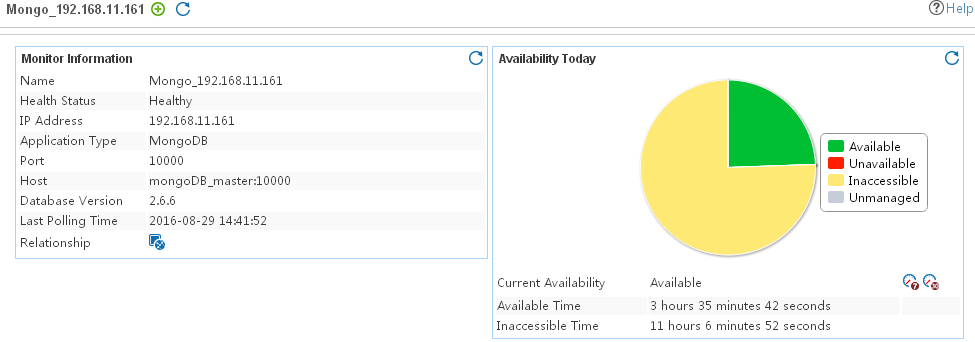
Monitor Information
The Monitor Information area contains the following fields:
· Name—Name of the application monitor.
· Health Status—Health status of the MongoDB application.
· IP Address—IP address of the MongoDB host.
· Application Type—Type of the monitored application, which is always MongoDB.
· Port—Service port of the MongoDB application.
· Host—Name of the host where the MongoDB application is deployed.
· Database Version—Database version number of the MongoDB application.
· Last Polling Time—Time when APM last polled the MongoDB application.
· Relationship—Click the Related
Applications icon ![]() to view relations between applications in a dependency topology
view. For more information about dependency topologies,
see "Topology and
application group management."
to view relations between applications in a dependency topology
view. For more information about dependency topologies,
see "Topology and
application group management."
· Top5 Unrecovered Alarm—Latest five unrecovered alarms on the MongoDB host. This field is not displayed if no alarm was generated by the MongoDB application.
Availability Today
The Availability Today area contains the following fields:
· Current Availability—Availability of the MongoDB application.
¡ Click
the Weekly History icon ![]() to view
the availability of the MongoDB application in the last 7 days.
to view
the availability of the MongoDB application in the last 7 days.
¡ Click
the Monthly History icon ![]() to view
the availability of the MongoDB application in the last 30 days.
to view
the availability of the MongoDB application in the last 30 days.
· Available Time—Total amount of time that the MongoDB application was available after 00:00 today.
· Unavailable Time—Total amount of time that the MongoDB application was unavailable after 00:00 today.
· Inaccessible Time—Total amount of time that the MongoDB application was inaccessible after 00:00 today.
· Unmanaged Time—Total amount of time that the MongoDB application was unmanaged after 00:00 today.
The statistics collection started when the application monitor was added. An availability time field is not displayed when its value is 0.
Response Time
The Response Time area contains the following field:
· Response Time—Period from the time when APM sends a request to the time when it receives a response for the request.
¡ Click
the Set Threshold icon ![]() to set alarm
thresholds for the response time.
to set alarm
thresholds for the response time.
¡ Click
the History Record icon ![]() to view the history graph of the response time.
to view the history graph of the response time.
Connections
The Connections area contains the following fields:
· Current—Number of connections to the database.
¡ Click
the Set Threshold icon ![]() to set alarm
thresholds for the current connections.
to set alarm
thresholds for the current connections.
¡ Click
the History Record icon ![]() to view the history graph of the current
connections.
to view the history graph of the current
connections.
· Available—Number of available connections of the database.
· Total Created—Number of created connections, including connections that have been closed.
Network
The Network area contains the following fields:
· Read In—Amount of network traffic received by the database.
· Read In Per Second—Amount of network traffic received by the database per second.
¡ Click
the Set Threshold icon ![]() to set alarm
thresholds for the traffic received per second.
to set alarm
thresholds for the traffic received per second.
¡ Click
the History Record icon ![]() to view the history graph of the traffic received
per second.
to view the history graph of the traffic received
per second.
· Write Out—Amount of network traffic sent by the database.
· Write Out Per Second—Amount of network traffic sent by the database per second.
¡ Click
the Set Threshold icon ![]() to set alarm
thresholds for the traffic sent per second.
to set alarm
thresholds for the traffic sent per second.
¡ Click
the History Record icon ![]() to view the history graph of the traffic sent
per second.
to view the history graph of the traffic sent
per second.
· Requests—Total number of requests received by the database.
· Requests Per Second—Number of requests received by the database per second.
¡ Click
the Set Threshold icon ![]() to set alarm
thresholds for the requests received per second.
to set alarm
thresholds for the requests received per second.
¡ Click
the History Record icon ![]() to view the history graph of the requests received
per second.
to view the history graph of the requests received
per second.
Memory
The Memory area contains the following fields:
· Bits—Number of bits of the memory.
· Resident—Amount of memory that is currently used by the
database process. Click the History
Record icon ![]() to view the history
graph of the resident memory.
to view the history
graph of the resident memory.
· Virtual—Amount of virtual memory that is currently
used by the database process. Click the History Record icon ![]() to view the history
graph of the virtual memory.
to view the history
graph of the virtual memory.
· Mapped—Amount of mapped memory by the database. Click the History Record icon ![]() to view the history graph of the mapped
memory.
to view the history graph of the mapped
memory.
· RAM Size—Size of the physical memory of the database.
Build Information
The Build Information area contains the following fields:
· Build Version—Version of the MongoDB database.
· Git Version—Git version of the MongoDB database.
· Target OS—Minimum target operating system version supported by the MongoDB database. This field is applicable only in the Windows environment.
· OpenSSL Version—OpenSSL version that the MongoDB database is built with.
· JavaScript Engine—JavaScript engine used by the MongoDB database.
· Build Bits—Number of build bits of the MongoDB database.
· Max Object Size—Maximum size of the BSON document object.
Server Information
The Server Information area contains the following fields:
· Host—Name of the host where the MongoDB database system is deployed.
· Database Version—Version of the MongoDB database.
· Process Name—Process name of the MongoDB database service.
· Process ID—Process ID of the MongoDB database service.
· Uptime—Running time of the MongoDB database service.
· Local Time—Current time of the host where the MongoDB database is deployed.
· Storage Engine—Storage engine used by the MongoDB database. This field is applicable in MongoDB versions later than MongoDB 3.0.
Asserts
The Asserts area contains the following fields:
· Regular—Number of regular assertions that occurred since the MongoDB database service process was started.
· Warning—Number of warning assertions that occurred since the MongoDB database service process was started.
· Message—Number of message assertions that occurred since the MongoDB database service process was started.
· User—Number of user assertions that occurred since the MongoDB database service process was started.
· Rollovers—Number of times the assertion counter rolls over. The assertion counter is reset to 0 when the number of assertions reaches 230.
Operation Counter
The Operation Counter area contains the following fields:
· Insert—Total number of insert operations since the MongoDB database service was started.
· Query—Total number of query operations since the MongoDB database service was started.
· Update—Total number of update operations since the MongoDB database service was started.
· Delete—Total number of delete operations since the MongoDB database service was started.
· Getmore—Total number of Getmore operations since the MongoDB database service was started.
· Command—Total number of command operations since the MongoDB database service was started.
Back Flushing
This area displays data only when the MongoDB database uses the MMAPv1 storage engine.
The Back Flushing area contains the following fields:
· Flushes—Number of times the MongoDB database flushes data and writes the flushes to the disk since the MongoDB database service was started.
· Total Time Cost—Total amount of time used by the flush operations.
· Average Time Cost—Average amount of time used by the flush
operations. Click the History
Record icon ![]() to view the history
graph of the average time cost.
to view the history
graph of the average time cost.
· Last Time Cost—Amount of time used by the last flush
operation. Click the History
Record icon ![]() to view the history
graph of the last time cost.
to view the history
graph of the last time cost.
· Last Finished At—Time when the last flush operation finished.
Database
The Database area contains the following fields:
· Name—Name of the MongoDB database.
· Size—Size of the MongoDB database.
· Is Empty—Whether the MongoDB database is empty.
Current Queue
The Current Queue area contains the following fields:
· Total—Total number of operations waiting for the lock in the current queue.
· Readers—Total number of operations waiting for the
read lock in the current queue.
Click the History Record
icon ![]() to view the history graph of the total number
of read operations.
to view the history graph of the total number
of read operations.
· Writers—Total number of operations waiting for the
write lock in the current queue. Click the History
Record icon ![]() to view the history
graph of the total number of write operations.
to view the history
graph of the total number of write operations.
Active Client
The Active Client area contains the following fields:
· Total—Total number of active clients connected to the MongoDB database.
· Readers—Total number of active clients that connect
to the MongoDB database and perform read operations. Click
the History Record icon ![]() to view the history graph of the total number
of read operations.
to view the history graph of the total number
of read operations.
· Writers—Total number of active clients that connect
to the MongoDB database and perform read operations. Click
the History Record icon ![]() to view the history graph of the total number
of write operations.
to view the history graph of the total number
of write operations.
Database Details
The Database Details area contains the following fields:
· Database—Name of the MongoDB database.
· Collections—Total number of collections in the MongoDB database.
· Objects—Total number of document objects in the MongoDB database.
· Average Object Size—Average size of document objects in the MongoDB database.
· Data Size—Total size of the data in the MongoDB database, including the padding data.
· Storage Size—Size of the storage space allocated for storing document objects in the MongoDB database.
· Indexes—Total number of indexes in the MongoDB database.
· Index Size—Total size of indexes in the MongoDB database
· File Size—Total size of the data files in the MongoDB database, including the pre-allocated space and padding data. This field is applicable only when the MMAPv1 storage engine is used.
· Namespace Size—Total size of the namespace files in the MongoDB database. This field is applicable only when the MongoDB database uses the MMAPv1 storage engine.
DM
DM is a high performance DBMS developed by Dameng. Database performance and stability affect service operations. APM supports monitoring DM V7.0.
Adding a DM application monitor
APM can monitor DM applications through agents or JDBC. When you add DM application monitors, follow these guidelines:
· If you use agents to locally monitor DM applications, first install agents on hosts where DM applications are deployed. For more information about installing agents, see "APM agent management."
· If you remotely monitor DM applications through JDBC, obtain the username and password of the user who has the DM database administrator's privileges.
· Add DM hosts to the IMC platform so that APM can obtain and display network connections of the hosts and their access devices in the application topology. For more information about adding hosts to the IMC platform, see H3C Intelligent Management Center v7.3 Enterprise and Standard Platform Administrator Guide.
· To view traffic statistics in the monitor report of the DM application, make sure at least one probe is configured in APM. After a DM application monitor is added, APM sends the IP address and service port of the monitored DM application to the probes for traffic collection.
To add a DM application monitor:
1. Click the Resource tab.
2. Open the Add Application page by using one of the following methods:
¡ From the navigation tree, select Application Manager > Add Application.
¡ From the navigation tree, select Application Manager > Application Monitor. In the application monitor list, click Add.
The Add Application page displays all application types that can be monitored by APM.
3. Click DM of the Database Server Monitor class.
The page for adding a DM application monitor opens.
4. Configure the following parameters:
¡ IP Address—Enter the IP address of the host on which the DM application to be monitored is installed. APM automatically checks the IP address and associates the application monitor with the host managed in the IMC platform. If the host is already added to the IMC platform, you can also click Select, and then select the host in the Select Devices window. For information about selecting a host, see "Quick start."
¡ Name—Enter a unique application monitor name. As a best practice, name the application monitor as application type_host IP address.
¡ Use Template—Select Enable or Disable from the list.
¡ Template—Click the Configure icon ![]() next to the Template field to select an
existing template. The Template field is
automatically populated with the name of the selected template. For more
information about configuring application templates, see "Configuration management." This field is displayed only when you select Enable from the Use Template
list.
next to the Template field to select an
existing template. The Template field is
automatically populated with the name of the selected template. For more
information about configuring application templates, see "Configuration management." This field is displayed only when you select Enable from the Use Template
list.
¡ Description—Enter a description for the application monitor.
¡ Application Monitor Port—Enter the service port number for the DM application, TCP-1433 by default. This field is available only when you select Disable from the Use Template list.
¡ Traffic Collection Port—Enter the service port number for DM. This field is displayed only when at least one probe is configured for APM and you select Disable from the Use Template list.
¡ Polling Interval (min)—Select a polling interval for the application monitor. Available options are 1, 2, 3, 4, 5, 10, 20, and 30. The default polling interval is 5 minutes. A shorter polling interval improves real-time data accuracy at the expense of system resources. This field is available only when you select Disable from the Use Template list.
¡ Username/Password—Enter the username of the DM administrator. The fields are available only when you select Disable from the Use Template list.
¡ Contact—Enter the contact information, such as the name, email address, and telephone number. The default is the username of the operator who created the application monitor. This field is available only when you select Disable the Use Template list.
¡ APM Server—Select an APM server to monitor the application. The options are in server-address (application-type:n/N) format. The letter n indicates the number of DM applications monitored on the APM server. The letter N indicates the total number of applications monitored on the APM server. Server address 127.0.0.1 indicates that APM and the IMC platform are deployed on the same server.
¡ Related Applications—Click Add next to this field. On the Select Application window, enter a partial or complete name to filter applications, select the applications that DM depends on, and then click OK.
Operating system applications cannot be selected. Operators can view all dependencies of the application in the dependency topology. APM automatically adds the dependencies between DM and operating system applications by IP address and displays their dependencies in the application topology.
¡ Application Group—Specify an application group for the DM application.
- To specify an existing application group, click Add, select an application group, and then click OK.
- To specify a new application group, click Add Application Group, configure the application group settings, and then click OK.
¡ Detect Application—Select this parameter if you want to enable application detection. Application detection enables APM to verify connection to the application by using the previous parameter settings, and to determine whether to add the application monitor based on the verification result. APM adds the application monitor only when it can connect to the application. When this parameter is not specified, APM adds the application monitor without verifying the connection.
5. Click OK.
Modifying a DM application monitor
Authorized users can modify all parameters except the IP address and the APM server for a DM application monitor. When the IP address of a monitored DM host changes, operators must add a new application monitor for the host. However, the new application monitor cannot inherit the history data from the previous application monitor.
To modify a DM application monitor:
1. Click the Resource tab.
2. From the navigation tree, select Application Manager > Application Monitor.
The application monitor list page opens.
3. Click the Modify
icon ![]() for the DM application monitor you want to modify.
for the DM application monitor you want to modify.
The page for modifying the DM application monitor opens.
4. Modify the parameters as needed, except the IP address and the APM server.
For more information about parameter settings, see "Adding a DM application monitor."
5. Click OK.
Viewing the DM application monitor report
After a DM application monitor is added, APM collects index data of the application, evaluates the availability and health status, and updates the monitor report. The report shows the index values obtained from the most recent polling of the application.
To view the DM application monitor report:
1. Click the Resource tab.
2. From the navigation tree, select Application Manager > Application Monitor.
The application monitor list page displays all application monitors.
3. Click the name of a DM application monitor to display the report.
Figure 72 shows part of a DM application monitor report.
Figure 72 Part of a DM application monitor report
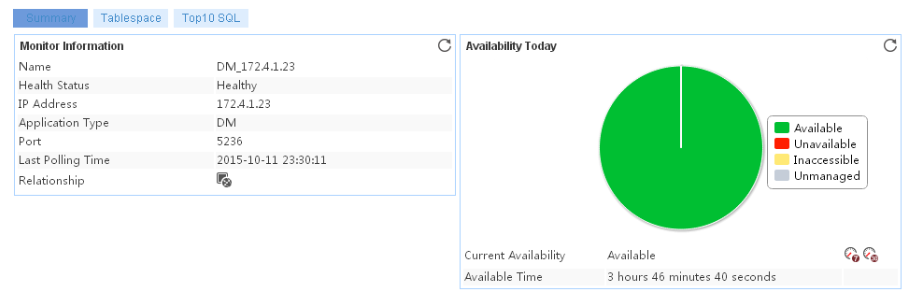
The DM application monitor report contains the Summary, Tablespace, and Top10 SQL tabs. Click each tab to view corresponding information about the DM application.
Monitor Information
The Monitor Information area contains the following fields:
· Name—Name of the DM application monitor.
· Health Status—Health status of the DM application.
· IP Address—IP address of the DM host.
· Application Type—Type of the monitored application, which is always DM.
· Port—Monitor port used by the DM application.
· Last Polling Time—Time when APM last polled the DM application.
· Relationship—Click the Related
Applications icon ![]() to view relations between applications in a dependency topology
view. For more information about dependency topologies,
see "Topology and
application group management."
to view relations between applications in a dependency topology
view. For more information about dependency topologies,
see "Topology and
application group management."
· Top5 Unrecovered Alarm—Latest five unrecovered alarms on the DM host. This field is not displayed if no alarm was generated by the DM application.
Availability Today
The Availability Today area contains the following fields:
· Current Availability—Availability of the DM application.
¡ Click
the Weekly History icon ![]() to view
the availability of the DM application in the last 7 days.
to view
the availability of the DM application in the last 7 days.
¡ Click
the Monthly History icon ![]() to view
the availability of the DM application in the last 30 days.
to view
the availability of the DM application in the last 30 days.
· Available Time—Total amount of time that the DM application was available after 00:00 today.
· Unavailable Time—Total amount of time that the DM application was unavailable after 00:00 today.
· Inaccessible Time—Total amount of time that the DM application was inaccessible after 00:00 today.
· Unmanaged Time—Total amount of time that the DM application was unmanaged after 00:00 today.
The statistics collection started when the application monitor was added. An availability time field is not displayed when its value is 0.
Database Information
The Database Information area contains the following fields:
· Database Name—Name of the database.
· Created at—Time when the database was created.
· Archiving Mode—Whether the database is archived. By default, the database is not archived.
· Database Status—Current status of the database. The database can be in any of the following states:
¡ Starting—The database is being started.
¡ Started, Redo done—The database is started and the redo is complete.
¡ Mount—The database is being mounted.
¡ Opened—The database is open.
¡ Suspended—The database is suspended.
¡ Closed—The database is closed.
· Role—Role of the database. Options are:
¡ Common—The database does not operate in cluster mode.
¡ Host—The database acts as an active database in the RAC cluster system.
¡ Standby—The database acts as a standby database in the RAC cluster system.
· Database Size—Total size of the database.
· RAC Nodes—Total number of instances in the RAC cluster system.
· Character Set—Character set of the database. The default is GB18030.
Instance Information
The Instance Information area contains the following fields:
· Instance Name—Name of the database instance.
· Host Name—Name of the host on which the database is installed.
· Database Server Version—Version of the database server.
· Database Version—Version of the database software.
· Start Time—Time when the database instance was started.
· Instance Status—Current status of the instance. Options are Mount, Open, and Suspend.
· Instance Mode—Mode of the instance. Options are Normal, Primary, and Standby.
· Cluster No.—Sequence number of the RAC cluster system.
· Cluster Role—Role of the RAC cluster system. Options are Master and Slave.
Response Time
The Response Time area contains the following field:
· Response Time—Period from the time when APM sends a request to the time when it receives a response for the request.
¡ Click
the Set Threshold icon ![]() to set alarm
thresholds for the response time.
to set alarm
thresholds for the response time.
¡ Click
the History Record icon ![]() to view the history graph of the response time.
to view the history graph of the response time.
Thread Statistics
The Thread Statistics area contains the following field:
· Current Threads—Total number of current active threads for the DM application. Click
the History Record icon ![]() to view the history graph of the current threads.
to view the history graph of the current threads.
Connection Statistics
The Connection Statistics area contains the following fields:
· Current Connections—Number of current connections for the DM application.
¡ Click
the Set Threshold icon ![]() to set alarm
thresholds for the current connections.
to set alarm
thresholds for the current connections.
¡ Click
the History Record icon ![]() to view the history graph of the current connections.
to view the history graph of the current connections.
· Max. Connections—Maximum number of connections for the DM application.
Dictionary Cache
The Dictionary Cache area contains the following fields:
· Total Size—Total size of the dictionary cache.
· Used Space—Size of the space used by the dictionary. Click the History Record icon ![]() to view the history
graph of the used space.
to view the history
graph of the used space.
· Total Dictionary Objects—Total number of dictionary objects.
· Dictionary Cache Usage—Percentage of the used dictionary space.
¡ Click
the Set Threshold icon ![]() to set alarm
thresholds for the usage.
to set alarm
thresholds for the usage.
¡ Click
the History Record icon ![]() to view the history graph of the usage.
to view the history graph of the usage.
Log Buffer
The Log Buffer area contains the following fields:
· Total Pages—Total number of pages for the log buffer.
· Used Pages—Number of pages used by the log. Click the History
Record icon ![]() to view the history
graph of the used pages.
to view the history
graph of the used pages.
· Log Buffer Usage—Percentage of log pages used.
¡ Click
the Set Threshold icon ![]() to set alarm
thresholds for the usage.
to set alarm
thresholds for the usage.
¡ Click
the History Record icon ![]() to view the history graph of the usage.
to view the history graph of the usage.
Log Information
The Log Information area contains the following fields:
· Total Size—Total size of the log.
· Free Space—Size of the available space for the log. Click the History Record icon ![]() to view the history
graph of the free space.
to view the history
graph of the free space.
· Used Space—Size of the used space for the log. Click the History
Record icon ![]() to view the history graph
of the used space.
to view the history graph
of the used space.
· Log Usage—Percentage of the used space to
the total log size. Click the History Record icon ![]() to view the history graph of the usage.
to view the history graph of the usage.
Application Traffic
The Application Traffic area contains the following fields:
· Last Hour's Traffic—Total traffic sent and received by the DM application over the last 1 hour.
· Today's Traffic—Total traffic sent and received by the DM application since 00:00 today.
Buffer Pool Information
The Buffer Pool Information area contains the following fields:
· Buffer Pool Name—Name of the buffer pool. Options are Normal, Keep, Recycle, and Fast.
· Page Size—Size of each page in the buffer pool, excluding pages in the extension pool.
· Pages—Number of pages in the buffer pool. Click the History
Record icon ![]() to view the history
graph of the pages.
to view the history
graph of the pages.
· Pages in Use—Number of data page references. Click the History
Record icon ![]() to view the history
graph of the pages being used.
to view the history
graph of the pages being used.
· Idle Pages—Number of idle pages in the buffer pool. Click the History Record icon ![]() to view the history
graph of the idle pages.
to view the history
graph of the idle pages.
· Dirty Pages—Number of dirty pages in the buffer pool. Click the History Record icon ![]() to view the history
graph of the dirty pages.
to view the history
graph of the dirty pages.
· Non-Idle Pages—Number of non-idle pages in the buffer pool. Click the History Record icon ![]() to view the history
graph of the non-idle pages.
to view the history
graph of the non-idle pages.
· Discarded Pages—Number of discarded pages in the buffer pool. Click the History Record icon ![]() to view the history
graph of the discarded pages.
to view the history
graph of the discarded pages.
· Max. Pages—Maximum number of pages in the buffer pool. Click the History Record icon ![]() to view the history
graph of the maximum pages.
to view the history
graph of the maximum pages.
· Read Hits—Number of read hits. Click the History Record
icon ![]() to view the history graph of the read hits.
to view the history graph of the read hits.
· Read Misses—Number of read misses. Click the History
Record icon ![]() to view the history
graph of the read misses.
to view the history
graph of the read misses.
· Batch Reads—Number of batch read misses. Click the History
Record icon ![]() to view the history
graph of the batch reads.
to view the history
graph of the batch reads.
· Buffer Pool Hit Ratio—Read hit ratio. Click the History Record icon ![]() to view the history graph
of the hit ratio.
to view the history graph
of the hit ratio.
User Information
The User Information area contains the following fields:
· ID—ID of the DM user.
· Username—Username of the DM user.
· Account Status—Status of the DM user account.
· Default Tablespace—Default tablespace for the DM user.
· Temp Tablespace—Temporary tablespace for the DM user.
· Profile—Profile for the DM user.
· Created at—Time when the DM user was created.
· Expired at—Time when the DM user expired.
· Expiration Duration (Days)—Remaining days before the DM user expires.
· DBA User—Whether the DM user is a DBA user.
Database Link Information
The Database Link Information area contains the following fields:
· ID—ID of the database link.
· Name—Name of the database link.
· Public—Whether the database link is public.
· Login Name—Login name of the database link.
· Host Name—Host name of the database link.
· Port Number—Port number of the database link.
· Linked—Whether the database link is up.
· Sync Link—Type of the database link. The option Yes indicates a synchronous database link and the option No indicates an asynchronous database link.
· Protocol—Protocol used by the database link.
· In Use—Whether the database link handle is being used.
· Mode ID—Mode ID of the database link.
· User ID—User ID of the database link.
Dead Lock Information
The Dead Lock Information area contains the following fields:
· No.—Sequence number of the dead lock.
· Transaction ID—ID of the transaction that generates the dead lock.
· Session ID—ID of the session that generates the dead lock.
· SQL Statement—SQL statement that generates the dead lock.
· Time—Time when the dead lock was generated.
Database Event Information
The Database Event Information area contains the following fields:
· Occurred at—Time when the event or action occurred.
· SQL Statement—SQL statement executed by the event or action.
· Executed by—User who executes the event or action.
Tablespace Information
The Tablespace Information area contains the following fields:
· Tablespace ID—ID of the tablespace for the DM application.
· Tablespace Name—Name of the tablespace for the DM application.
· Tablespace Type—Type of the tablespace for the DM application. Options are DB and Temporary.
· Tablespace Status—Status of the tablespace for the DM application. Options are Online and Offline.
· File Quantity—Number of files in the tablespace for the DM application.
· Total Size—Total size of the tablespace (in pages) for the DM application.
· Free Space—Size of the available space in the tablespace for the DM application.
· Used Space—Size of the space that is occupied by files in the tablespace for the DM application.
· Tablespace Usage—Percentage of the used tablespace space.
Tablespace File Information
The Tablespace File Information area contains the following fields:
· File Path—Path of the DM data file.
· Tablespace Name—Name of the tablespace for the DM application.
· Total Size—Total size of the DM data file.
· Free Space—Available space of the DM data file.
· Used Space—Used space of the DM data file.
· File Usage—File usage of the DM data file.
· Read Pages—Number of pages read from the DM data file.
· Write Pages—Number of pages written into the DM data file.
· Read Requests—Number of requests for reading pages from the DM data file.
· Write Requests—Number of requests for writing pages into the DM data file.
· Status—Status of the DM data file.
· Read/Write Status—The DM data file is in read or write state.
· Modified Transactions—Number of modified transactions in the DM data file.
Top 10 SQL Statements by Time
The Top 10 SQL Statements by Time area contains the following fields:
· SQL Statement—Top 10 SQL statements by cumulative execution duration.
· Execution Duration—Duration for parse and execution of the SQL statement.
· Logical Reads—Number of logical reads for the SQL statement.
· Physical Reads—Number of physical reads for the SQL statement.
Top 10 SQL Statements by Logical Read
The Top 10 SQL Statements by Logical Read area contains the following fields:
· SQL Statement—Top 10 SQL statements by logic read.
· Execution Duration—Duration for parse and execution of the SQL statement.
· Logical Reads—Number of logical reads for the SQL statement.
· Physical Reads—Number of physical reads for the SQL statement.
Top 10 SQL Statements by Physical Read
The Top 10 SQL Statements by Physical Read area contains the following fields:
· SQL Statement—Top 10 SQL statements by physical read.
· Execution Duration—Duration for parse and execution of the SQL statement.
· Logical Reads—Number of logical reads for the SQL statement.
· Physical Reads—Number of physical reads for the SQL statement.
Oracle ASM
Automatic Storage Management (ASM) simplifies storage and management of Oracle database files, such as striping and mirroring disks, and automatically adjusting I/O balancing.
Adding an Oracle ASM application monitor
When you add Oracle ASM application monitors, follow these guidelines:
· The operator needs to provide the username and password of the Oracle ASM administrator.
· Add Oracle ASM hosts to the IMC platform so that APM can obtain and display network connections of the hosts and their access devices in the application topology. For more information about adding hosts to the IMC platform, see H3C Intelligent Management Center v7.3 Enterprise and Standard Platform Administrator Guide.
To add an Oracle ASM application monitor:
1. Click the Resource tab.
2. Open the Add Application page by using one of the following methods:
¡ From the navigation tree, select Application Manager > Add Application.
¡ From the navigation tree, select Application Manager > Application Monitor. In the application monitor list, click Add.
The Add Application page displays all application types that can be monitored by APM.
3. Click Oracle ASM of the Database Server Monitor class.
The page for adding an Oracle ASM application monitor opens.
4. Configure the following parameters:
¡ IP Address—Enter the IP address of the host on which the Oracle ASM application to be monitored is installed. APM automatically checks the IP address and associates the application monitor with the host if it is already managed in the IMC platform. To monitor a host that is already managed in the IMC platform, you can also click Select, and then select the host in the Select Devices dialog box. For information about selecting a host, see "Quick start."
¡ Name—Enter a unique application monitor name. As a best practice, name the application monitor as application type_host IP address.
¡ Use Template—Select Enable or Disable from the list.
¡ Template—Click the Configure icon ![]() next to the Template field to select an existing template. The Template field is automatically populated with the name
of the selected template. For more information about configuring application
templates, see "Configuration management." This field is displayed only when you select Enable from the Use Template
list.
next to the Template field to select an existing template. The Template field is automatically populated with the name
of the selected template. For more information about configuring application
templates, see "Configuration management." This field is displayed only when you select Enable from the Use Template
list.
¡ Description—Enter a description for the application monitor.
¡ Application Monitor Port—Enter the service port of Oracle ASM. The default setting is TCP 1521. This field is available only when you select Disable from the Use Template list.
¡ Polling Interval (min)—Select a polling interval for the application monitor. Available options are 1, 2, 3, 4, 5, 10, 20, and 30. The default polling interval is 5 minutes. A shorter polling interval improves real-time data accuracy at the expense of system resources. This field is available only when you select Disable from the Use Template list.
¡ Username/Password—Enter the username of the Oracle ASM administrator. The fields are available only when you select Disable from the Use Template list.
¡ Instance Name—Enter the instance name for the Oracle ASM application. The default is +ASM.
¡ Contact—Enter the contact information, such as the name, email address, and telephone number. The default is the username of the operator who created the application monitor. This field is available only when you select Disable from the Use Template list.
¡ APM Server—Select an APM server to monitor the application. The options are in server-address (application-type:n/N) format. The letter n indicates the number of Oracle ASM applications monitored on the APM server. The letter N indicates the total number of applications monitored on the APM server. Server address 127.0.0.1 indicates that APM and the IMC platform are deployed on the same server.
¡ Related Applications—Click Add next to this field. On the Select Application window, enter a partial or complete name to filter applications, select the applications that Oracle ASM depends on, and then click OK.
Operating system applications cannot be selected. Operators can view all dependencies of the application in the dependency topology. APM automatically adds the dependencies between Oracle ASM and operating system applications by IP address and displays their dependencies in the dependency topology.
¡ Application Group—Specify an application group for the Oracle ASM application.
- To specify an existing application group, click Add, select an application group, and then click OK.
- To specify a new application group, click Add Application Group, configure the application group settings, and then click OK.
¡ Detect Application—Select this parameter if you want to enable application detection. APM verifies the application connectivity by using the previous parameter settings, and adds the application monitor only when it can connect to the application. If you do not select this parameter, APM adds the application monitor without verifying the application connectivity.
5. Click OK.
Modifying an Oracle ASM application monitor
Authorized users can modify all parameters except the IP address and the APM server for an Oracle ASM application monitor. When the IP address of a monitored Oracle ASM host changes, authorized users must add a new application monitor for the host. The new application monitor cannot inherit the history data from the previous application monitor.
To modify an Oracle ASM application monitor:
1. Click the Resource tab.
2. From the navigation tree, select Application Manager > Application Monitor.
The application monitor list page displays all application monitors.
3. Click the Modify icon ![]() for the Oracle ASM
application monitor you want to modify.
for the Oracle ASM
application monitor you want to modify.
The page for modifying the Oracle ASM application monitor opens.
4. Modify the parameters as needed, except the IP address and the APM server.
For more information about parameter settings, see "Adding an Oracle ASM application monitor."
5. Click OK.
Viewing the Oracle ASM application monitor report
After an Oracle ASM application monitor is added, APM collects application index data, evaluates the availability and health status, and updates the monitor report. The report shows the index values obtained from the most recent polling of the application.
To view the Oracle ASM application monitor report:
1. Click the Resource tab.
2. From the navigation tree, select Application Manager > Application Monitor.
The application monitor list page displays all application monitors.
3. Click the name of an Oracle ASM application monitor to display the report.
Figure 73 shows part of an Oracle ASM application monitor report.
Figure 73 Part of an Oracle ASM application monitor report
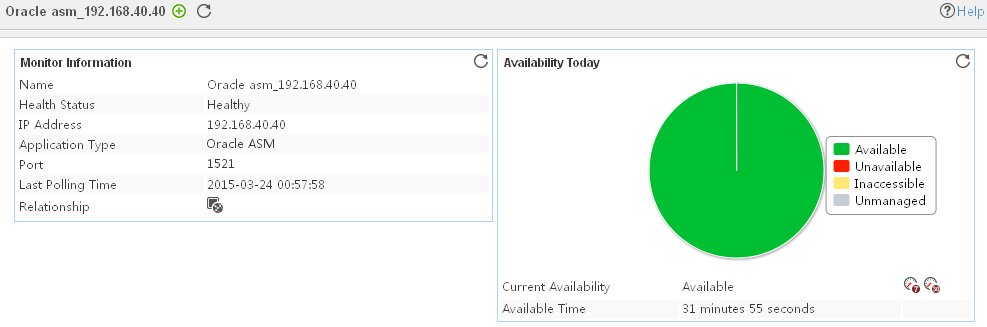
Monitor Information
The Monitor Information area contains the following fields:
· Name—Application monitor name.
· Health Status—Health status of the Oracle ASM application.
· IP Address—IP address of the Oracle ASM host.
· Application Type—Type of the monitored application, which is always Oracle ASM.
· Port—Service port of the Oracle ASM application.
· Last Polling Time—Time when APM last polled the Oracle ASM application.
· Relationship—Click the Relationship icon ![]() to view dependencies between the Oracle ASM application and other applications in a dependency topology view. For more information about dependency
topologies, see "Topology and application group
management."
to view dependencies between the Oracle ASM application and other applications in a dependency topology view. For more information about dependency
topologies, see "Topology and application group
management."
· Top5 Unrecovered Alarms—Latest five unrecovered alarms on the Oracle ASM application. This field is not displayed if no alarm was generated by the Oracle ASM application.
Availability Today
The Availability Today area contains the following fields:
· Current Availability—Availability of the Oracle ASM application.
¡ Click
the Weekly History icon ![]() to view the availability of the Oracle ASM
application in the last 7 days.
to view the availability of the Oracle ASM
application in the last 7 days.
¡ Click
the Monthly History icon ![]() to view the availability of the Oracle ASM
application in the last 30 days.
to view the availability of the Oracle ASM
application in the last 30 days.
· Available Time—Total amount of time that the Oracle ASM application was available after 00:00 today.
· Unavailable Time—Total amount of time that the Oracle ASM application was unavailable after 00:00 today.
· Inaccessible Time—Total amount of time that the Oracle ASM application was inaccessible after 00:00 today.
· Unmanaged Time—Total amount of time that the Oracle ASM application was unmanaged after 00:00 today.
The statistics collection started when the application monitor was added. An availability time field is not displayed if its value is 0.
Disk Group
The Disk Group area contains the following fields:
· Number—Number of the disk group.
· Name—Name of the disk group.
· Status—Status of the disk group in the last polling interval.
· Total—Total disk space of the disk group.
· Free—Free disk space of the disk group in the last polling interval.
· Usage—Disk space usage of the disk group in the last polling interval.
· Offline Disks—Numbers of offline disks in the disk group in the last polling interval.
Disk
The Disk area contains the following fields:
· Disk Group Number—Number of the disk group to which the disk belongs.
· Disk Number—Number of the disk.
· Name—Disk name.
· Status—Status of the disk in the last polling interval.
· Total—Total disk space of the disk.
· Free—Free disk space of the disk in the last polling interval.
· Usage—Disk space usage of the disk in the last polling interval.
· Read Rate—Read rate of the disk in the last polling interval.
· Write Rate—Write rate of the disk in the last polling interval.
· Mode Status—Mode status of the disk in the last polling interval.
· Mount Status—Mount status of the disk in the last polling interval.
· Header Status—Header status of the disk in the last polling interval.
· Path—Path of the disk.
PostgreSQL
PostgreSQL is an open source DBMS.
Adding a PostgreSQL application monitor
APM can locally or remotely monitor PostgreSQL applications through JDBC. When you add PostgreSQL application monitors, follow these guidelines:
· To locally monitor a PostgreSQL application, install agents on the Windows or Linux hosts on which the PostgreSQL applications are deployed. For more information about agents, see "APM agent management."
· To remotely monitor a PostgreSQL application, obtain the username and password of a user who has the PostgreSQL administrator's privileges.
· Add PostgreSQL hosts to the IMC platform so that APM can obtain and display network connections of the hosts and their access devices in the application topology. For more information about adding hosts to the IMC platform, see H3C Intelligent Management Center v7.3 Enterprise and Standard Platform Administrator Guide.
· To view traffic statistics in the monitor report of the PostgreSQL application, make sure at least one probe is configured in APM. After a PostgreSQL application monitor is added, APM sends the IP address and service port of the monitored PostgreSQL application to the probes for traffic collection.
To add a PostgreSQL application monitor:
1. Click the Resource tab.
2. Open the Add Application page by using one of the following methods:
¡ From the navigation tree, select Application Manager > Add Application.
¡ From the navigation tree, select Application Manager > Application Monitor. In the application monitor list, click Add.
The Add Application page displays all application types that can be monitored by APM.
3. Click PostgreSQL of the Database Server Monitor class.
The page for adding a PostgreSQL application monitor opens.
4. Configure the following parameters:
¡ IP Address—Enter the IP address of the host on which the PostgreSQL application to be monitored is installed. APM automatically checks the IP address and associates the application monitor with the host if it is already managed in the IMC platform. To monitor a host that is already managed in the IMC platform, you can also click Select, and then select the host in the Select Devices dialog box. For information about selecting a host, see "Quick start."
¡ Name—Enter a unique application monitor name. As a best practice, name the application monitor as application type_host IP address.
¡ Use Template—Select Enable or Disable from the list.
¡ Template—Click the Configure icon ![]() next to the Template field to select an existing
template. The Template field is automatically
populated with the name of the selected template. For more information about
configuring application templates, see "Configuration management." This
field is displayed only when you select Enable from
the Use Template list.
next to the Template field to select an existing
template. The Template field is automatically
populated with the name of the selected template. For more information about
configuring application templates, see "Configuration management." This
field is displayed only when you select Enable from
the Use Template list.
¡ Description—Enter a description for the application monitor.
¡ Application Monitor Port—Enter the service port of PostgreSQL. The default setting is TCP 5432. This field is available only when you select Disable from the Use Template list.
¡ Polling Interval (min)—Select a polling interval for the application monitor. Available options are 1, 2, 3, 4, 5, 10, 20, and 30. The default polling interval is 5 minutes. A shorter polling interval improves real-time data accuracy at the expense of system resources. This field is available only when you select Disable from the Use Template list.
¡ Username/Password—Enter the username of the PostgreSQL administrator. The fields are available only when you select Disable from the Use Template list.
¡ Contact—Enter the contact information, such as the name, email address, and telephone number. The default is the username of the operator who created the application monitor. This field is available only when you select Disable from the Use Template list.
¡ APM Server—Select an APM server to monitor the application. The options are in server-address (application-type:n/N) format. The letter n indicates the number of PostgreSQL applications monitored on the APM server. The letter N indicates the total number of applications monitored on the APM server. Server address 127.0.0.1 indicates that APM and the IMC platform are deployed on the same server.
¡ Related Applications—Click Add next to this field. On the Select Application window, enter a partial or complete name to filter applications, select the applications that PostgreSQL depends on, and then click OK.
Operating system applications cannot be selected. Operators can view all dependencies of the application in the dependency topology. APM automatically adds the dependencies between PostgreSQL and operating system applications by IP address and displays their dependencies in the dependency topology.
¡ Application Group—Specify an application group for the PostgreSQL application.
- To specify an existing application group, click Add, select an application group, and then click OK.
- To specify a new application group, click Add Application Group, configure the application group settings, and then click OK.
¡ Detect Application—Select this parameter if you want to enable application detection. APM verifies the application connectivity by using the previous parameter settings, and adds the application monitor only when it can connect to the application. If you do not select this parameter, APM adds the application monitor without verifying the application connectivity.
5. Click OK.
Modifying a PostgreSQL application monitor
Authorized users can modify all parameters except the IP address and the APM server for a PostgreSQL application monitor. When the IP address of a monitored PostgreSQL host changes, authorized users must add a new application monitor for the host. The new application monitor cannot inherit the history data from the previous application monitor.
To modify a PostgreSQL application monitor:
1. Click the Resource tab.
2. From the navigation tree, select Application Manager > Application Monitor.
The application monitor list page displays all application monitors.
3. Click the Modify icon ![]() for the PostgreSQL
application monitor you want to modify.
for the PostgreSQL
application monitor you want to modify.
The page for modifying the PostgreSQL application monitor opens.
4. Modify the parameters as needed, except the IP address and the APM server.
For more information about parameter settings, see "Adding a PostgreSQL application monitor."
5. Click OK.
Viewing the PostgreSQL application monitor report
After a PostgreSQL application monitor is added, APM collects application index data, evaluates the availability and health status, and updates the monitor report. The report shows the index values obtained from the most recent polling of the application.
To view the PostgreSQL application monitor report:
1. Click the Resource tab.
2. From the navigation tree, select Application Manager > Application Monitor.
The application monitor list page displays all application monitors.
3. Click the name of a PostgreSQL application monitor to display the report.
Figure 74 shows part of a PostgreSQL application monitor report.
Figure 74 Part of a PostgreSQL application monitor report

Monitor Information
The Monitor Information area contains the following fields:
· Name—Application monitor name.
· Health Status—Health status of the PostgreSQL application.
· IP Address—PostgreSQL host IP address.
· Application Type—Type of the monitored application, which is always PostgreSQL.
· Version—Version of the PostgreSQL application.
· Last Polling Time—Time when APM last polled the PostgreSQL application.
· Relationship—Click the Relationship icon ![]() to view dependencies between the PostgreSQL application and other applications in a dependency topology view. For more information about dependency
topologies, see "Topology and application group
management."
to view dependencies between the PostgreSQL application and other applications in a dependency topology view. For more information about dependency
topologies, see "Topology and application group
management."
· Top5 Unrecovered Alarms—Latest five unrecovered alarms on the PostgreSQL application. This field is not displayed if no alarm was generated by the PostgreSQL application.
Availability Today
The Availability Today area contains the following fields:
· Current Availability—Availability of the PostgreSQL application.
¡ Click
the Weekly History icon ![]() to view the availability of the PostgreSQL
application in the last 7 days.
to view the availability of the PostgreSQL
application in the last 7 days.
¡ Click
the Monthly History icon ![]() to view the availability of the PostgreSQL
application in the last 30 days.
to view the availability of the PostgreSQL
application in the last 30 days.
· Available Time—Total amount of time that the PostgreSQL application was available after 00:00 today.
· Unavailable Time—Total amount of time that the PostgreSQL application was unavailable after 00:00 today.
· Inaccessible Time—Total amount of time that the PostgreSQL application was inaccessible after 00:00 today.
· Unmanaged Time—Total amount of time that the PostgreSQL application was unmanaged after 00:00 today.
The statistics collection started when the application monitor was added. An availability time field is not displayed if its value is 0.
Database Connection Statistics
The Database Connection Statistics area contains the following fields:
· Database Name—Name of the database.
· Transaction Start Time—Start time of the last transaction.
· Query Start Time—Start time of the last query.
· Client Connection Time—Time when the client was connected to the database.
Database Status
The Database Status area contains the following fields:
· Database Name—Name of the database.
· Active Server Process Count—Number of active processes on the database.
· Total Submitted Transaction Count—Total number of transactions committed to the database.
· Total Rollback Transaction Count—Total number of transactions that the database rolled back.
· Total Disk Read Count—Total number of times that the database read blocks from the disk.
· Total Buffer Hit Count—Total number of times that the database found blocks in the buffer.
Lock Status
The Lock Status area contains the following fields:
· Database Name—Name of the database.
· Lock Mode—Mode of the lock. A lock is held or waited on by a transaction.
· Grant—Whether the lock was held or waited on by a transaction. When the lock was held by a transaction, this field displays t. When the lock was waited on by a transaction, this field displays f.
Automatic Cleaning-Freezing
The Automatic Cleaning-Freezing area displays information about the automatic cleaning system AutoVacuum.
The Automatic Cleaning-Freezing area contains the following fields:
· Database Name—Name of the database.
· Frozen Threshold—Frozen threshold for automatic cleaning.
· Frozen Transaction ID—Maximum frozen transaction ID in the database.
· Progress—Automatic cleaning progress. The progress is calculated by using the formula: Progress = Maximum frozen transaction ID/Frozen threshold x 100%.
Sequence Status
The Sequence Status area contains the following fields:
· Namespace—Namespace of the sequence.
· Sequence Name—Name of the sequence.
· Complete Sequence Name—Complete name of the sequence.
· Type—Type of the sequence.
Pg_xlog Log
The write ahead logging (WAL) files for PostgreSQL are stored in the pg_xlog directory. Contact the database administrator to archive and clear logs when the log files are excessive.
The Pg_xlog Log area contains the following field:
· Log File Count—Number of pg_xlog files. Click the History Record icon ![]() to view the history
graph of the pg_xlog file count.
to view the history
graph of the pg_xlog file count.
Table Statistics
The Table Statistics area contains the following fields:
· Table Name—Name of the database table.
· Size—Size of the database table.
· Total Size—Total size of the database table and its indexes.
· Sequence Scan Count—Number of sequence scans on the database
table. Click the History Record icon ![]() to view the history
graph of the sequence scan count.
to view the history
graph of the sequence scan count.
· Sequence Scan Read Count—Number of rows fetched from the database
table by using sequence scans. Click the History
Record icon ![]() to view the history graph of the sequence
scan read count.
to view the history graph of the sequence
scan read count.
· Index Scan—Number of index scans on the database
table. Click the History Record icon ![]() to view the history
graph of the index scan count.
to view the history
graph of the index scan count.
· Fetched Index Scan Count—Number of rows fetched from the database
table by using index scans. Click the History
Record icon ![]() to view the history graph of the fetched
index scan count.
to view the history graph of the fetched
index scan count.
· Inserted Row Count—Number of rows inserted in the database
table. Click the History Record icon ![]() to view the history
graph of the inserted row count.
to view the history
graph of the inserted row count.
· Updated Row Count—Number of rows updated in the database
table. Click the History Record icon ![]() to view the history
graph of the updated row count.
to view the history
graph of the updated row count.
· Deleted Row Count—Number of rows deleted from the database
table. Click the History Record icon ![]() to view the history
graph of the deleted row count.
to view the history
graph of the deleted row count.
· Hot Update Count—Number of hot updates in the database
table. Click the History Record icon ![]() to view the history
graph of the hot update count.
to view the history
graph of the hot update count.
· Estimated Live Row Count—Number of estimated
live rows in the database table. Click the History Record icon ![]() to view the history
graph of the estimated live row count.
to view the history
graph of the estimated live row count.
· Estimated Dead Row Count—Number of estimated
dead rows in the database table. Click the History
Record icon ![]() to view the history graph of the estimated dead row count.
to view the history graph of the estimated dead row count.
Database Statistics
The Database Statistics area contains the following fields:
· Database Name—Name of the database.
· Database OID—OID of the database.
· Database User Name—Username of the database user.
· Size—Size of the database.
· Max Connection Count—Maximum number of database connections.
· Current Connection Count—Number of current database connections. Click the History
Record icon ![]() to view the history graph of the current
database connection count.
to view the history graph of the current
database connection count.
· Total Committed Transaction
Count—Total transactions
committed to the database after the database was reset most recently. Click the History Record icon ![]() to view the history
graph of the total committed transaction count.
to view the history
graph of the total committed transaction count.
· Total Rollback Transaction
Count—Total transactions
that the database rolled back after the database was reset most recently. Click the History Record icon ![]() to view the history
graph of the total rollback transaction count.
to view the history
graph of the total rollback transaction count.
· Total Disk Read Count—Total number of times that PostgreSQL read
data from the disk after the database was reset most recently. Click the History Record icon ![]() to view the history
graph of the total disk read count.
to view the history
graph of the total disk read count.
· Buffer Hit Count—Total
number of buffer hits after the database was reset most recently. Click the History Record icon ![]() to view the history
graph of the buffer hit count.
to view the history
graph of the buffer hit count.
· Returned Row Count—Total number of returned
rows after the database was reset most recently. Click the History Record icon ![]() to view the history
graph of the returned row count.
to view the history
graph of the returned row count.
· Fetched Row Count—Total number of fetched rows after the
database was reset most recently. Click the History Record icon ![]() to view the history graph of the fetched row
count.
to view the history graph of the fetched row
count.
· Inserted Row Count—Total number of inserted rows after the
database was reset most recently. Click the History
Record icon ![]() to view the history graph of the inserted row
count.
to view the history graph of the inserted row
count.
· Updated Row Count—Total number of updated rows after the
database was reset most recently. Click the History
Record icon ![]() to view the history graph of the updated row
count.
to view the history graph of the updated row
count.
· Deleted Row Count—Total number of deleted rows after the
database was reset most recently. Click the History
Record icon ![]() to view the history graph of the deleted row
count.
to view the history graph of the deleted row
count.
Table Size Statistics
The Table Size Statistics area contains the following fields:
· Table Name—Name of the database table.
· Table Size—Size of the database table.
· Namespace Name—Name of the database table namespace.
DBQuery
DBQuery is a common monitor that uses SQL statement to query databases. You can judge the database performance through the query time. Database server error, inappropriate database table design, and excessive large database tables cause long time to get the query result.
APM supports DBQuery for the following types of databases:
· MySQL
· Oracle
· DB2
· Sybase
· SQL Server
Adding a DBQuery application monitor
APM monitors the DBQuery application through JDBC. When you add DBQuery application monitors for databases, follow these guidelines:
· Understand the database structure and design SQL statements for key database tables.
· Obtain the username and password of the user who has the database administrator's privileges, and execute the SQL statements.
· Have knowledge about the database name for MySQL, DB2, Sybase, and SQL Server databases. Obtain the instance name for Oracle databases, and obtain the non-default instance name for SQL Server that uses non-default instance name.
· Add target hosts to the IMC platform so APM can obtain and display network connections of the hosts and their access devices in the application topology. For more information about adding hosts to the IMC platform, see H3C Intelligent Management Center v7.3 Enterprise and Standard Platform Administrator Guide.
To add a DBQuery application monitor:
1. Click the Resource tab.
2. Open the Add Application page by using one of the following methods:
¡ From the navigation tree, select Application Manager > Add Application.
¡ From the navigation tree, select Application Manager > Application Monitor. In the application monitor list, click Add.
The Add Application page displays all application types that can be monitored by APM.
3. Click DBQuery of the Database Server Monitor class.
The page for adding a DBQuery application monitor opens.
4. Configure the following parameters:
¡ IP Address—Enter the IP address of the host on which the target application to be monitored is installed. APM automatically checks the IP address and associates the application monitor with the host if it is already managed in the IMC platform. To monitor a host that is already managed in the IMC platform, you can also click Select, and then select the host in the Select Devices dialog box. For information about selecting a host, see "Quick start."
¡ Name—Enter a unique application monitor name. As a best practice, name the application monitor as application type_host IP address.
¡ Use Template—Select Enable or Disable from the list.
¡ Template—Click the Configure icon ![]() next to the Template field to select an existing
template. The Template field is automatically
populated with the name of the selected template. For more information about
configuring application templates, see "Configuration management." This field is displayed only when you select Enable from the Use Template
list.
next to the Template field to select an existing
template. The Template field is automatically
populated with the name of the selected template. For more information about
configuring application templates, see "Configuration management." This field is displayed only when you select Enable from the Use Template
list.
¡ Description—Enter a description for the application monitor.
¡ Polling Interval (min)—Select a polling interval for the application monitor. Available options are 1, 2, 3, 4, 5, 10, 20, and 30. The default polling interval is 5 minutes. A shorter polling interval improves real-time data accuracy at the expense of system resources. This field is available only when you select Disable from the Use Template list.
¡ Database Type—Select the database type. Options are MySQL, Oracle, DB2, Sybase, and SQL Server. This field is available only when you select Disable from the Use Template list.
¡ Application Monitor Port—Enter the service port of DBQuery. This field is available only when you select Disable from the Use Template list.
¡ Database Name/Instance Name—Enter the database name or instance name. This field is available only when you select Disable from the Use Template list.
- Enter the database name for MySQL, DB2, Sybase, and SQL Server that uses the default instance.
- Enter the Oracle instance name for Oracle database.
- Enter the database name and instance name separated by semicolon for SQL Server that uses the non-default instance.
¡ Username—Enter the username of the DBQuery administrator. This field is available only when you select Disable from the Use Template list.
¡ Password—Enter the password of the DBQuery administrator. This field is available only when you select Disable from the Use Template list.
¡ SQL Query Statement—Enter the SQL query statement.
¡ Contact—Enter the contact information, such as the name, email address, and telephone number. The default is the username of the operator who created the application monitor. This field is available only when you select Disable from the Use Template list.
¡ APM Server—Select an APM server to monitor the application. The options are in server-address (application-type:n/N) format. The letter n indicates the number of DBQuery applications monitored on the APM server. The letter N indicates the total number of applications monitored on the APM server. Server address 127.0.0.1 indicates that APM and the IMC platform are deployed on the same server.
¡ Related Applications—Click Add next to this field. On the Select Application window, enter a partial or complete name to filter applications, select the applications that DBQuery depends on, and then click OK.
Operating system applications cannot be selected. Operators can view all dependencies of the application in the dependency topology. APM automatically adds the dependencies between DBQuery and operating system applications by IP address and displays their dependencies in the dependency topology.
¡ Application Group—Specify an application group for the DBQuery application.
- To specify an existing application group, click Add, select an application group, and then click OK.
- To specify a new application group, click Add Application Group, configure the application group settings, and then click OK.
¡ Detect Application—Select this parameter if you want to enable application detection. APM verifies the application connectivity by using the previous parameter settings, and adds the application monitor only when it can connect to the application. If you do not select this parameter, APM adds the application monitor without verifying the application connectivity.
5. Click OK.
Modifying a DBQuery application monitor
Authorized users can modify all parameters except the IP address and the APM server for a DBQuery application monitor. When the IP address of a monitored host changes, operators must add a new application monitor for the host. However, the new application monitor cannot inherit the history data from the previous application monitor.
To modify a DBQuery application monitor:
1. Click the Resource tab.
2. From the navigation tree, select Application Manager > Application Monitor.
The page displays all application types that can be monitored by APM.
3. Click the Modify icon![]() for the DBQuery application monitor you want to
modify.
for the DBQuery application monitor you want to
modify.
The page for modifying the DBQuery application monitor opens.
4. Modify the parameters as needed, except the IP address and the APM server.
For more information about parameter settings, see "Adding a DBQuery application monitor."
5. Click OK.
Viewing the DBQuery application monitor report
After the DBQuery application monitor is added, APM collects application index data, evaluates the availability and health status, and updates the monitor report. The report shows the index values obtained from the most recent polling of the application.
To view the DBQuery application monitor report:
1. Click the Resource tab.
2. From the navigation tree, select Application Manager > Application Monitor.
The application monitor list page displays all application monitors.
3. Click the name of a DBQuery application monitor to display the report.
Figure 75 shows part of a DBQuery application monitor report.
Figure 75 Part of a DBQuery application monitor report
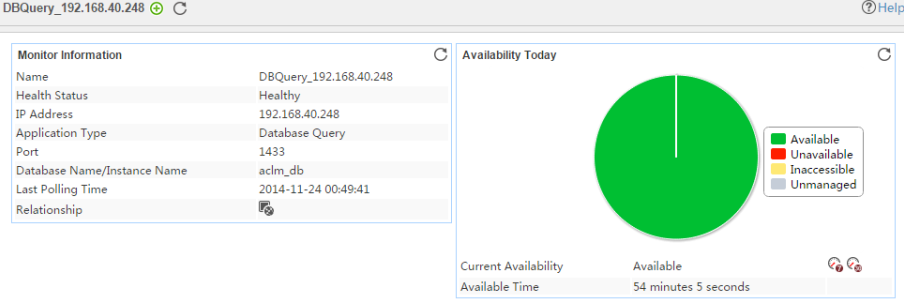
Monitor Information
The Monitor Information area contains the following fields:
· Name—Application monitor name.
· Health State—Health status of the DBQuery application.
· IP Address—IP address of the host on which the target application is installed.
· Application Type—Type of the monitored application, which is always Database Query.
· Port—Port number for the application monitor. The port number varies by database type.
· Database Name/Instance Name—Database name or instance name.
· Last Polling Time—Time when APM last polled DBQuery.
· Relationship—Click the Relationship icon ![]() to view dependencies between the DBQuery application and other applications in a dependency topology view. For
more information about dependency topologies, see "Topology and application group management."
to view dependencies between the DBQuery application and other applications in a dependency topology view. For
more information about dependency topologies, see "Topology and application group management."
· Top5 Unrecovered Alarm—Latest five unrecovered alarms on the target host. This field is not displayed if no alarm was generated by the DBQuery application.
Availability Today
The Availability Today area contains the following fields:
· Current Availability—Availability of the DBQuery application.
¡ Click
the Weekly History icon ![]() to view the availability of the DBQuery
application in the last 7 days.
to view the availability of the DBQuery
application in the last 7 days.
¡ Click
the Monthly History icon ![]() to view the availability of the DBQuery
application in the last 30 days.
to view the availability of the DBQuery
application in the last 30 days.
· Available Time—Total amount of time that the DBQuery application was available after 00:00 today.
· Unavailable Time—Total amount of time that the DBQuery application was unavailable after 00:00 today.
· Inaccessible Time—Total amount of time that the DBQuery application was inaccessible after 00:00 today.
· Unmanaged Time—Total amount of time that the DBQuery application was unmanaged after 00:00 today.
The statistics collection started when the application monitor was added. An availability time field is not displayed if its value is 0.
Response Time
The Response Time area contains the following field:
· Response Time—Response time of the DBQuery application. Response time indicates the period from the time when APM sends a request to the time when it receives a response for the request.
¡ Click
the Set Threshold icon ![]() to set alarm thresholds for the response
time.
to set alarm thresholds for the response
time.
¡ Click the History Record icon ![]() to view the history graph of the response
time.
to view the history graph of the response
time.
Query Result
The Query Result area displays 10 entries. Click More to bring up the query result window. A maximum of 200 entries can be displayed.
Sybase
Sybase is an IBM-developed DBMS. Database performance and stability impact service operations. APM supports monitoring Sybase applications for quick detection of Sybase problems.
Adding a Sybase application monitor
APM can monitor the Sybase applications through agents or JDBC. When you add application monitors for Sybase, follow these guidelines:
· To monitor a Sybase application through an agent, deploy the agent on the Windows or Linux host on which the Sybase application is installed. For more information about agents, see "APM agent management."
· To monitor a Sybase application through JDBC, obtain the username and password of a user who has the Sybase administrator's privileges.
· Add Sybase hosts to the IMC platform so APM can obtain and display network connections of the hosts and their access devices in the application topology. For more information about adding hosts to the IMC platform, see H3C Intelligent Management Center v7.3 Enterprise and Standard Platform Administrator Guide.
· To view traffic statistics in the monitor report of the Sybase application, make sure at least one probe is configured in APM. After a Sybase application monitor is added, APM sends the IP address and service port of the monitored Sybase application to the probes for traffic collection.
To add a Sybase application monitor:
1. Click the Resource tab.
2. Open the Add Application page by using one of the following methods:
¡ From the navigation tree, select Application Manager > Add Application.
¡ From the navigation tree, select Application Manager > Application Monitor. In the application monitor list, click Add.
The Add Application page displays all application types that can be monitored by APM.
3. Click Sybase of the Database Server Monitor class.
The page for adding a Sybase application monitor opens.
4. Configure the following parameters:
¡ IP Address—Enter the IP address of the host on which the Sybase application to be monitored is installed. APM automatically checks the IP address and associates the application monitor with the host if it is already managed in the IMC platform. To monitor a host that is already managed in the IMC platform, you can also click Select, and then select the host in the Select Devices dialog box. For information about selecting a host, see "Quick start."
¡ Name—Enter a unique application monitor name. As a best practice, name the application monitor as application type_host IP address.
¡ Use Template—Select Enable or Disable from the list.
¡ Template—Click the Configure icon ![]() next to the Template field to select an existing
template. The Template field is automatically
populated with the name of the selected template. For more information about
configuring application templates, see "Configuration management." This field is displayed only when Enable
is selected from the Use Template list.
next to the Template field to select an existing
template. The Template field is automatically
populated with the name of the selected template. For more information about
configuring application templates, see "Configuration management." This field is displayed only when Enable
is selected from the Use Template list.
¡ Description—Enter a description for the application monitor.
¡ Application Monitor Port—Enter the service port of Sybase. The default setting is TCP 5000. This field is available only when Disable is selected from the Use Template list.
¡ Traffic Collection Port—Enter one or more service port numbers for Sybase. To set multiple ports, separate the port numbers by commas. This field is displayed only when at least one probe is configured for APM and Disable is selected from the Use Template list.
¡ Polling Interval (min)—Select a polling interval for the application monitor. Available options are 1, 2, 3, 4, 5, 10, 20, and 30. The default polling interval is 5 minutes. A shorter polling interval improves real-time data accuracy at the expense of system resources. This field is available only when Disable is selected from the Use Template list.
¡ Username—Enter the username of the Sybase administrator. This field is available only when Disable is selected from the Use Template list.
¡ Password—Enter the password of the Sybase administrator. This field is available only when Disable is selected from the Use Template list.
¡ Contact—Enter the contact information, such as the name, email address, and telephone number. The default is the username of the operator who created the application monitor. This field is available only when Disable is selected from the Use Template list.
¡ APM Server—Select an APM server to monitor the application. The options are in server-address (application-type:n/N) format. The letter n indicates the number of Sybase applications monitored on the APM server. The letter N indicates the total number of applications monitored on the APM server. Server address 127.0.0.1 indicates that APM and the IMC platform are deployed on the same server.
¡ Related Applications—Click Add next to this field. On the Select Application window, enter a partial or complete name to filter applications, select the applications that Sybase depends on, and then click OK.
Operating system applications cannot be selected. Operators can view all dependencies of the application in the dependency topology. APM automatically adds the dependencies between Sybase and operating system applications by IP address and displays their dependencies in the dependency topology.
¡ Application Group—Specify an application group for the Sybase application.
- To specify an existing application group, click Add, select an application group, and then click OK.
- To specify a new application group, click Add Application Group, configure the application group settings, and then click OK.
¡ Detect Application—Select this parameter if you want to enable application detection. APM verifies the application connectivity by using the previous parameter settings, and adds the application monitor only when it can connect to the application. If you do not select this parameter, APM adds the application monitor without verifying the application connectivity.
5. Click OK.
Modifying a Sybase application monitor
Authorized users can modify all parameters except the IP address and the APM server for a Sybase application monitor. When the IP address of a monitored Sybase host changes, operators must add a new application monitor for the host. However, the new application monitor cannot inherit the history data from the previous application monitor.
To modify a Sybase application monitor:
1. Click the Resource tab.
2. From the navigation tree, select Application Manager > Application Monitor.
The page displays all application types that can be monitored by APM.
3. Click the Modify icon ![]() for the
Sybase application monitor you want to modify.
for the
Sybase application monitor you want to modify.
The page for modifying the Sybase application monitor opens.
4. Modify the parameters as needed, except the IP address and the APM server.
For more information about parameter settings, see "Adding a Sybase application monitor."
5. Click OK.
Viewing the Sybase application monitor report
After the Sybase application monitor is added, APM collects application index data, evaluates the availability and health status, and updates the monitor report. The report shows the index values obtained from the most recent polling of the application.
To view the Sybase application monitor report:
1. Click the Resource tab.
2. From the navigation tree, select Application Manager > Application Monitor.
The application monitor list page displays all application monitors.
3. Click the name of a Sybase application monitor to display the report.
Figure 76 shows part of a Sybase application monitor report.
Figure 76 Part of a Sybase application monitor report
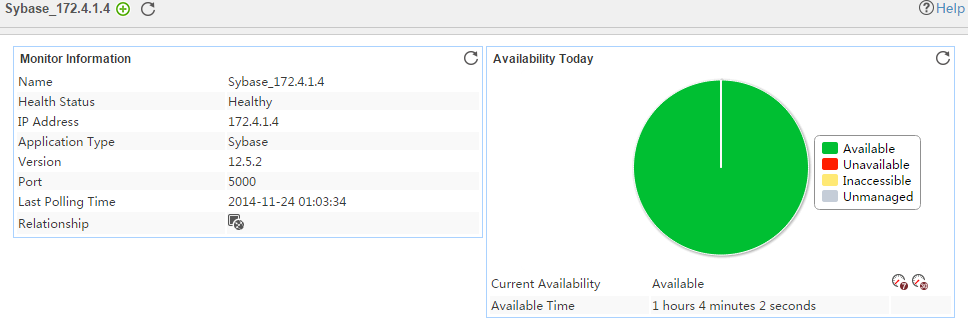
Monitor Information
The Monitor Information area contains the following fields:
· Name—Application monitor name.
· Health State—Health status of the Sybase application.
· IP Address—IP address of the Sybase host.
· Application Type—Type of the monitored application, which is always Sybase.
· Version—Version number of the Sybase application.
· Port—Port number for the Sybase application.
· Last Polling Time—Time when APM last polled Sybase.
· Relationship—Click the Relationship icon ![]() to view dependencies between the Sybase application and other applications in a dependency topology view. For
more information about dependency topologies, see "Topology and application group management.
to view dependencies between the Sybase application and other applications in a dependency topology view. For
more information about dependency topologies, see "Topology and application group management.
· Top5 Unrecovered Alarm—Latest five unrecovered alarms on the Sybase host. This field is not displayed if no alarm was generated by the Sybase application.
Availability Today
The Availability Today area contains the following fields:
· Current Availability—Availability of the Sybase application.
¡ Click
the Weekly History icon ![]() to view the availability of the Sybase
application in the last 7 days.
to view the availability of the Sybase
application in the last 7 days.
¡ Click
the Monthly History icon ![]() to view the availability of the Sybase
application in the last 30 days.
to view the availability of the Sybase
application in the last 30 days.
· Available Time—Total amount of time that the Sybase application was available after 00:00 today.
· Unavailable Time—Total amount of time that the Sybase application was unavailable after 00:00 today.
· Inaccessible Time—Total amount of time that the Sybase application was inaccessible after 00:00 today.
· Unmanaged Time—Total amount of time that the Sybase application was unmanaged after 00:00 today.
The statistics collection started when the application monitor was added. An availability time field is not displayed if its value is 0.
Memory Details
The Memory Details area contains the following fields:
· Memory Usage—Memory usage of Sybase. The memory usage is calculated by using the formula: Memory usage = Memory in use/Maximum memory x 100%.
¡ Click
the Set Threshold icon ![]() to set alarm thresholds for the memory usage.
to set alarm thresholds for the memory usage.
¡ Click the History Record icon ![]() to view the history graph of the memory usage.
to view the history graph of the memory usage.
· In Use—Size of
memory being used. Click the History Record icon ![]() to view the history
graph of used memory.
to view the history
graph of used memory.
· Free Memory—Size of free memory.
· Max Memory—Maximum memory.
Response Time
The Response Time area contains the following field:
· Response Time—Response time of the Sybase application. Response time indicates the period from the time when APM sends a request to the time when it receives a response for the request.
¡ Click
the Set Threshold icon ![]() to set alarm thresholds for the response
time.
to set alarm thresholds for the response
time.
¡ Click the History Record icon ![]() to view the history graph of the response
time.
to view the history graph of the response
time.
Connection Statistics
The Connection Statistics area contains the following fields:
· Max Connections—Maximum
number of concurrent connections allowed by Sybase. Click the History Record icon ![]() to view the history graph of the concurrent connection limit.
to view the history graph of the concurrent connection limit.
· Max
Remote Connections—Maximum number of concurrent
remote connections allowed by Sybase. Click the History Record icon ![]() to view the history graph of the concurrent remote connection limit.
to view the history graph of the concurrent remote connection limit.
· Connections—Concurrent connections when APM last polled Sybase. Click the History
Record icon ![]() to view the history graph of the concurrent connection count.
to view the history graph of the concurrent connection count.
· Remote Connections—Concurrent remote connections when APM last polled Sybase. Click the History
Record icon ![]() to view the history graph of the concurrent remote connection count.
to view the history graph of the concurrent remote connection count.
Application Traffic
APM collects Sybase traffic based on the IP address of the host and the traffic collection port used by the application.
The Application Traffic area contains the following fields:
· Last Hour's Traffic—Total traffic sent and received by Sybase over the last 1 hour.
· Today's Traffic—Total traffic sent and received by Sybase since 00:00 today.
Database Details
The Database Details area contains the following fields:
· Name—Name of the database the Sybase accessed when APM last polled Sybase.
· Total Size—Total size of the disk space assigned to the database.
· In Use—Used disk space.
· In Use (%)—Ratio of used disk space to total disk space.
· Creator—User account that created the database.
Process Details
The Process Details area contains the following fields:
· Process Name—Name of the process.
· Host—Name of the host where the process was running.
· IP address—IP address of the host.
· Status—Status of the process.
· Command—Type of the command that was being executed.
· Login Name—Name of the account that logged in to Sybase.
· Physical IO—Physical IO for the process.
· Time Blocked—Duration for how long the process is blocked.
· More—Click More to display all processes that accessed the Sybase.
Transaction Details
The Transaction Details area contains the following fields:
· Process Name—Name of the processes that were using transactions to access the database.
· Database Name—Name of the database the process accessed.
· Type—Type of the running transaction.
· Coordinator—Coordinator used by the running transaction.
· Connections—Connections for the running transaction.
· Status—Status of the running transaction.
· Start Time—Start time of the running transaction.
· Transaction Name—Name of the running transaction.
Xugu
Xugu is a relational DBMS made in China. It supports distributed storage and distributed computing. Database performance and stability affect service operations. APM supports monitoring Xugu applications.
Adding a Xugu application monitor
APM can monitor Xugu applications through agents or JDBC. When you add application monitors for Xugu, follow these guidelines:
· To monitor a Xugu application through an agent, deploy the agent on the Windows or Linux host where the Xugu application is installed. For more information about agents, see "APM agent management."
· To monitor a Xugu application through JDBC, obtain the username and password of a user who has the Xugu administrator's privileges.
· Add Xugu hosts to the IMC platform so APM can obtain and display network connections of the hosts and their access devices in the application topology. For more information about adding hosts to the IMC platform, see H3C Intelligent Management Center v7.3 Enterprise and Standard Platform Administrator Guide.
· To view traffic statistics in the monitor report of the Xugu application, make sure at least one probe is configured in APM. After a Xugu application monitor is added, APM sends the IP address and service port of the monitored Xugu application to the probes for traffic collection.
To add a Xugu application monitor:
1. Click the Resource tab.
2. Open the Add Application page by using one of the following methods:
¡ From the navigation tree, select Application Manager > Add Application.
¡ From the navigation tree, select Application Manager > Application Monitor. In the application monitor list, click Add.
The Add Application page displays all application types that can be monitored by APM.
3. Click Xugu of the Database Server Monitor class.
The page for adding a Xugu application monitor opens.
4. Configure the following parameters:
¡ IP Address—Enter the IP address of the host on which the Xugu application to be monitored is installed. APM automatically checks the IP address and associates the application monitor with the host if it is already managed in the IMC platform. To monitor a host that is already managed in the IMC platform, you can also click Select, and then select the host in the Select Devices dialog box. For information about selecting a host, see "Quick start."
¡ Name—Enter a unique application monitor name. As a best practice, name the application monitor as application type_host IP address.
¡ Use Template—Select Enable or Disable from the list.
¡ Template—Click the Configure icon ![]() next to the Template field to select an existing
template. The Template field is automatically
populated with the name of the selected template. For more information about
configuring application templates, see "Configuration management." This field is displayed only when Enable
is selected from the Use Template list.
next to the Template field to select an existing
template. The Template field is automatically
populated with the name of the selected template. For more information about
configuring application templates, see "Configuration management." This field is displayed only when Enable
is selected from the Use Template list.
¡ Description—Enter a description for the application monitor.
¡ Application Monitor Port—Enter the service port of Xugu. The default setting is TCP 5138. This field is available only when Disable is selected from the Use Template list.
¡ Traffic Collection Port—Enter one or more service port numbers for Xugu. This field is displayed only when at least one probe is configured for APM and Disable is selected from the Use Template list.
¡ Polling Interval (min)—Select a polling interval for the application monitor. Available options are 1, 2, 3, 4, 5, 10, 20, and 30. The default polling interval is 5 minutes. A shorter polling interval improves real-time data accuracy at the expense of system resources. This field is available only when Disable is selected from the Use Template list.
¡ Username—Enter the username of the Xugu administrator. This field is available only when Disable is selected from the Use Template list.
¡ Password—Enter the password of the Xugu administrator. This field is available only when Disable is selected from the Use Template list.
¡ Contact—Enter the contact information, such as the name, email address, and telephone number. The default is the username of the operator who created the application monitor. This field is available only when Disable is selected from the Use Template list.
¡ APM Server—Select an APM server to monitor the application. The options are in server-address (application-type:n/N) format. The letter n indicates the number of Xugu applications monitored on the APM server. The letter N indicates the total number of applications monitored on the APM server. Server address 127.0.0.1 indicates that APM and the IMC platform are deployed on the same server.
¡ Related Applications—Click Add next to this field. On the Select Application window, enter a partial or complete name to filter applications, select the applications that Xugu depends on, and then click OK.
Operating system applications cannot be selected. Operators can view all dependencies of the application in the dependency topology. APM automatically adds the dependencies between Xugu and operating system applications by IP address and displays their dependencies in the dependency topology.
¡ Application Group—Specify an application group for the Xugu application.
- To specify an existing application group, click Add, select an application group, and then click OK.
- To specify a new application group, click Add Application Group, configure the application group settings, and then click OK.
¡ Detect Application—Select this parameter if you want to enable application detection. APM verifies the application connectivity by using the previous parameter settings, and adds the application monitor only when it can connect to the application. If you do not select this parameter, APM adds the application monitor without verifying the application connectivity.
5. Click OK.
Modifying a Xugu application monitor
Authorized users can modify all parameters except the IP address and the APM server for a Xugu application monitor. When the IP address of a monitored Xugu host changes, operators must add a new application monitor for the host. However, the new application monitor cannot inherit the history data from the previous application monitor.
To modify a Xugu application monitor:
1. Click the Resource tab.
2. From the navigation tree, select Application Manager > Application Monitor.
The page displays all application types that can be monitored by APM.
3. Click the Modify icon ![]() for the
Xugu application monitor you want to modify.
for the
Xugu application monitor you want to modify.
The page for modifying the Xugu application monitor opens.
4. Modify the parameters as needed, except the IP address and the APM server.
For more information about parameter settings, see "Adding a Xugu application monitor."
5. Click OK.
Viewing the Xugu application monitor report
After the Xugu application monitor is added, APM collects application index data, evaluates the availability and health status, and updates the monitor report. The report shows the index values obtained from the most recent polling of the application.
To view the Xugu application monitor report:
1. Click the Resource tab.
2. From the navigation tree, select Application Manager > Application Monitor.
The application monitor list page displays all application monitors.
3. Click the name of a Xugu application monitor to display the report.
Figure 77 shows part of a Xugu application monitor report.
Figure 77 Part of a Xugu application monitor report
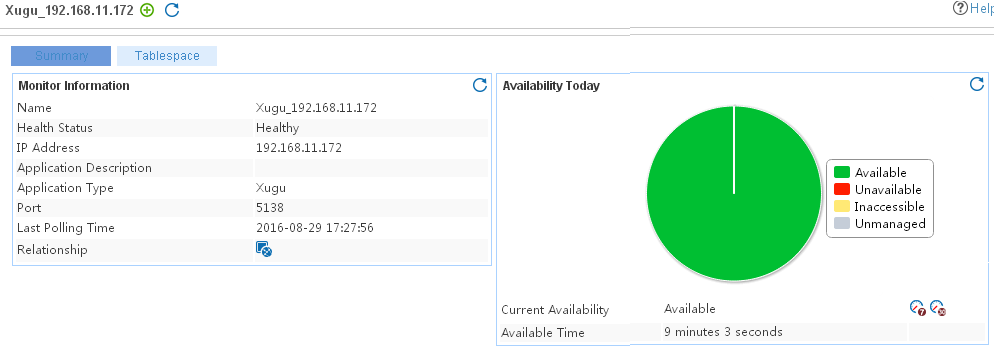
The Xugu application monitor report has the Summary and Tablespace tabs. Click each tab to view the corresponding information.
Monitor Information
The Monitor Information area contains the following fields:
· Name—Application monitor name.
· Health State—Health status of the Xugu application.
· IP Address—IP address of the Xugu host.
· Application Description—Description of the Xugu application.
· Application Type—Type of the monitored application, which is always Xugu.
· Port—Service port of the Xugu application.
· Last Polling Time—Time when APM last polled Xugu.
· Relationship—Click the Relationship icon ![]() to view dependencies between the Xugu application and other applications in a dependency topology view. For
more information about dependency topologies, see "Topology and application group management.
to view dependencies between the Xugu application and other applications in a dependency topology view. For
more information about dependency topologies, see "Topology and application group management.
· Top5 Unrecovered Alarm—Latest five unrecovered alarms on the Xugu host. This field is not displayed if no alarm was generated by the Xugu application.
Availability Today
The Availability Today area contains the following fields:
· Current Availability—Availability of the Xugu application.
¡ Click
the Weekly History icon ![]() to view the availability of the Xugu
application in the last 7 days.
to view the availability of the Xugu
application in the last 7 days.
¡ Click
the Monthly History icon ![]() to view the availability of the Xugu
application in the last 30 days.
to view the availability of the Xugu
application in the last 30 days.
· Available Time—Total amount of time that the Xugu application was available after 00:00 today.
· Unavailable Time—Total amount of time that the Xugu application was unavailable after 00:00 today.
· Inaccessible Time—Total amount of time that the Xugu application was inaccessible after 00:00 today.
· Unmanaged Time—Total amount of time that the Xugu application was unmanaged after 00:00 today.
The statistics collection started when the application monitor was added. An availability time field is not displayed if its value is 0.
Response Time
The Response Time area contains the following field:
· Response Time—Period from the time when APM sends a request to the time when it receives a response for the request.
¡ Click
the Set Threshold icon ![]() to set alarm
thresholds for the response time.
to set alarm
thresholds for the response time.
¡ Click
the History Record icon ![]() to view the history graph of the response time.
to view the history graph of the response time.
Storage Information
The Storage Information area contains the following fields:
· Tables—Total number of tables and table partitions in the Xugu database.
· Indexes—Total number of indexes and index partitions in the Xugu database.
· Large Objects—Total number of larger objects in the Xugu database.
Server Information
The Server Information area contains the following field:
· Node ID—ID of a node in the Xugu database.
· Node IP—IP address of a node in the Xugu database. If the Xugu database is operating in standalone mode, 0.0.0.0 is displayed. If the Xugu database is operating in cluster mode, the node IP address is the IP address of the server where the node is located.
· Server IP—IP address of the server where the node is located.
· Listening Port—Listening port number of the Xugu database.
· Server Name—Name of the server where the node is located.
· Operating System—Operating system type of the server where the node is located.
· Instruction Set—Instruction set of the server where the node is located.
· Database Version—Version of the database to which the node belongs.
Memory Information
The Memory Information area contains the following fields:
· Node ID—ID of a node in the Xugu database.
· Node IP—IP address of a node in the Xugu database. If the Xugu database is operating in standalone mode, 0.0.0.0 is displayed. If the Xugu database is operating in cluster mode, the node IP address is the IP address of the server where the node is located.
· Cache Block Size—Cache block size of the node.
· Total Cache Blocks—Total number of cache blocks of the node.
· Free Cache Blocks—Number of available cache blocks of the node.
· Dirty Cache Blocks—Number of dirty cache blocks of the node.
· LRU Cache Blocks—Number of the least recently used (LRU) cache blocks.
· SGA Block Size—System global area (SGA) block size of the node.
· Total SGA Blocks—Total number of SGA blocks.
· Available SGA Blocks—Number of available SGA blocks.
· Peak SGA Blocks—Number of peak SGA blocks.
Run Status
The Running Status area contains the following fields:
· Node ID—ID of a node in the Xugu database.
· Current Time—Current time of the server where the node is located.
· Requests—Total number of requests received by the node since the Xugu database was started.
· Requests/Sec—Number of requests received by the node per second in the last polling interval.
· Cache Reads—Total number of times the Xugu database reads data from the cache on the node since the Xugu database was started.
· Cache Reads/Sec—Number of times the Xugu database reads data per second from the cache on the node in the most recent polling interval.
· Disk Reads—Total number of times the Xugu database reads data from disks on the node since the Xugu database was started.
· Disk Reads/Sec—Number of times the Xugu database reads data per second from disks on the node in the most recent polling interval.
· Disk Read Size—Total size of the data that the Xugu database reads from disks on the node since the Xugu database was started.
· Disk Read Size/Sec—Size of the data that the Xugu database reads per second from disks on the node in the most recent interval.
· Disk Writes—Total number of times the Xugu database writes data to disks on the node since the Xugu database was started.
· Disk Writes/Sec—Number of times the Xugu database writes data per second to disks on the node in the most recent polling interval.
· Disk Write Size—Total size of the data that the Xugu database writes to disks on the node since the Xugu database was started.
· Disk Write Size/Sec—Size of the data that the Xugu database writes per second to disks on the node in the most recent interval.
· Net Read Size—Total size of the data that the Xugu database reads from the network on the node since the Xugu database was started.
· Net Read Size/Sec—Size of the data that the Xugu database reads per second from the network on the node in the most recent interval.
· Net Write Size—Total size of the data that the Xugu database writes to the network on the node since the Xugu database was started.
· Net Write Size/Sec—Size of the data that the Xugu database writes per second to the network on the node in the most recent interval.
· Lock Requests—Total number of lock requests on the node since the Xugu database was started.
· Dead Locks—Total number of dead locks on the node since the Xugu database was started.
· Message Sends—Total number of times the node sends messages since the Xugu database was started.
· Message Receives—Total number of times the node receives messages since the Xugu database was started.
Cluster Information
The Cluster Information area contains the following fields:
· Node ID—ID of a node in the Xugu database.
· Communication Port—IP address and communication port of the node.
· Node Type—Type of the node. Options are:
¡ Active Master
¡ Standby Master
¡ Storage
¡ Working
· Node State—Status of the node. Options are:
¡ Offline
¡ Joined
¡ Running
¡ Dead
· Processing Weight—Processing weight of the node. You can specify a value based on the server processing capacity, including the CPU and memory. The database system allocates data to the node for processing according to the specified value.
· Store Weight—Storage weight of the node. You can specify a value based on the server storage capacity. This value affects the data storage ratio of the node.
· Storage Blocks—Total number of storage blocks on the node, including the primary storage blocks on the current node and the secondary storage blocks on other nodes.
· Primary Storage Blocks—Storage blocks on the node that provide read and write services.
Database Information
The Database Information area contains the following fields:
· Database ID—ID of the database.
· Database Name—Name of the database.
· Created By—User who created the database.
· Character Set—Character set used by the database.
· Time Zone—Time zone used by the database.
· Remarks—Remarks of the database.
· Created At—Time when the database was created.
· Modified At—Time when the database was most recently modified.
Session Information
The Session Information area contains the following fields:
· Node ID—ID of a node in the Xugu database.
· Session ID—ID of a session on the node.
· Client IP—IP address of the client.
· User Name—Username used for the session connection.
· Database—Database to which the session is connected.
· Start Time—Time when the session was started.
· Access Time—Time when the session was most recently accessed.
· Session Status—Current status of the session. Options are:
¡ Establishing
¡ Connection idle
¡ Connection active,transaction processing
¡ Connection active,data input complete
User Information
The Database Information area contains the following fields:
· User ID—ID of the database user.
· User Name—Name of the database user.
· User Role—Role of the database user.
· Database—Database to which the user belongs.
· Locked—Whether the database user is locked.
· Created At—Time when the database user was created.
· Modified At—Time when the database user was most recently modified.
Application Traffic
APM collects traffic statistics for the Xugu application as per IP address and port number.
The Application Traffic area contains the following fields:
· Last Hour's Traffic—Total traffic sent and received by the Xugu application over the last 1 hour.
· Today's Traffic—Total traffic sent and received by the Xugu application since 00:00 today.
Tablespace Information
The Tablespace Information area contains the following fields:
· Node ID—ID of a node in the Xugu database.
· Node IP—IP address of a node in the Xugu database. If the Xugu database is operating in standalone mode, 0.0.0.0 is displayed. If the Xugu database is operating in cluster mode, the node IP address is the IP address of the server where the node is located.
· Tablespace ID—ID of the tablespace on the node.
· Tablespace Name—Name of the tablespace on the node.
· Tablespace Type—Type of the tablespace on the node.
· File Quantity—Number of data files in the tablespace.
· Media Error—Whether storage media errors exist in the tablespace.
Tablespace File Information
The Tablespace File Information area contains the following fields:
· Node ID—ID of a node in the Xugu database.
· Node IP—IP address of a node in the Xugu database. If the Xugu database is operating in standalone mode, 0.0.0.0 is displayed. If the Xugu database is operating in cluster mode, the node IP address is the IP address of the server where the node is located.
· Tablespace ID—ID of the tablespace on the node.
· File SN—Sequence number of a data file in the tablespace.
· File Path—Path of the data file in the tablespace.
· Max. Size—Maximum size of the data file in the tablespace. A hyphen (-) is displayed if the data file size is not limited.
· Extended Step Length—Extended step length of the data file in the tablespace.
Application server monitor
This chapter describes how to add and modify monitors for application servers, and helps you view the monitor reports.
.NET server
Microsoft .NET server is an XML Web Service platform for the Web applications developed by the .NET technology. APM provides the ability to monitor the .NET server application.
Adding a .NET server application monitor
APM can locally or remotely monitor .NET server applications through WMI. When you add application monitors for .NET servers, follow these guidelines:
· APM obtains monitor index data of .NET server applications through the WMI interface of Windows operating systems. Enable WMI on the Windows operating systems where .NET server applications are deployed. For more information about enabling WMI for the Windows operating systems, see the Microsoft Windows operating system configuration guide.
· To locally monitor .NET server applications, install agents on the Windows operating systems where .NET server applications are deployed. For more information about installing agents, see "APM agent management."
· To remotely monitor .NET server applications, obtain the correct username and password of the user who has the Windows administrator's privileges.
· Add .NET server hosts to the IMC platform so that APM can obtain and display network connections of the hosts and their access devices in the application topology. For more information about adding hosts to the IMC platform, see H3C Intelligent Management Center v7.3 Enterprise and Standard Platform Administrator Guide.
· To view traffic statistics in the monitor report of the .NET application, make sure at least one probe is configured in APM. After a .NET application monitor is added, APM sends the IP address and service port of the monitored .NET application to the probes for traffic collection.
To add a .NET server application monitor:
1. Click the Resource tab.
2. Open the Add Application page by using one of the following methods:
¡ From the navigation tree, select Application Manager > Add Application.
The page displays all application types that can be monitored by APM.
¡ From the navigation tree, select Application Manager > Application Monitor, and then click Add on the application monitor list page.
3. Click .NET Server of the Application Server Monitor class.
The page for adding a .NET server application monitor opens.
4. Configure the following parameters:
¡ IP Address—Enter the IP address of the host on which the .NET application to be monitored is installed. APM automatically checks the IP address and associates the application monitor with the host managed in the IMC platform. If the host is already added to the IMC platform, you can also click Select, and then select the host in the Select Devices window. For information about selecting a host, see "Quick start."
¡ Name—Enter a unique application monitor name. As a best practice, name the application monitor as application type_host IP address.
¡ Use Template—Select Enable or Disable from the list.
¡ Template—Click
the Configure icon ![]() next to the Template field to select an existing
template. The Template field is automatically populated with the name of the selected
template. For more information about configuring application templates, see
"Configuration management." This field is displayed only when you select Enable from the Use Template list.
next to the Template field to select an existing
template. The Template field is automatically populated with the name of the selected
template. For more information about configuring application templates, see
"Configuration management." This field is displayed only when you select Enable from the Use Template list.
¡ Description—Enter a description for the application monitor.
¡ Application Monitor Port—Enter the service port number for the .NET application, TCP 1433 by default. This field is available only when you select Disable from the Use Template list.
¡ Traffic Collection Port—Enter the service port number for .NET. This field is available only when at least one probe is configured for APM and you select Disable from the Use Template list.
¡ Polling Interval (min)—Select a polling interval for the application monitor. Available options are 1, 2, 3, 4, 5, 10, 20, and 30. The default polling interval is 5 minutes. A shorter polling interval improves real-time data accuracy at the expense of system resources. This field is available only when you select Disable from the Use Template list.
¡ Username/Password—Enter the username and password of the .NET administrator. The fields are available only when you select Disable from the Use Template list.
- If the administrator is a domain user, user the domain name \ username format.
- If the administrator is a local user, user the host name \username, IP address \username, or username format.
¡ Contact—Enter the contact information, such as the name, email address, and telephone number. The default is the username of the operator who created the application monitor. This field is available only when you select Disable from the Use Template list.
¡ APM Server—Select an APM server to monitor the application. The options are in server-address (application-type:n/N) format. The letter n indicates the number of .NET applications monitored on the APM server. The letter N indicates the total number of applications monitored on the APM server. Server address 127.0.0.1 indicates that APM and the IMC platform are deployed on the same server.
¡ Related Applications—Click Add next to this field. On the Select Application window, enter a partial or complete name to filter applications, select the applications that .NET depends on, and then click OK.
- Enter the complete or part of the application monitor name in the Search field at the top of the page, and then click Search.
- Select the application that the .NET application depends on.
- Click OK.
Operating system applications cannot be selected. Operators can view all dependencies of the application in the dependency topology. APM automatically adds the dependencies between .NET and operating system applications by IP address and displays their dependencies in the application topology.
¡ Application Group—Specify an application group for the .NET server application.
- To specify an existing application group, click Add, select an application group, and then click OK.
- To specify a new application group, click Add Application Group, configure the application group settings, and then click OK.
¡ Detect Application—Select this parameter if you want to enable application detection. Application detection enables APM to verify connection to the application by using the previous parameter settings, and to determine whether to add the application monitor based on the verification result. APM adds the application monitor only when it can connect to the application. When this parameter is not specified, APM adds the application monitor without verifying the connection.
5. Click OK.
Modifying a .NET server application monitor
Authorized users can modify all parameters except the IP address and the APM server for a .NET application monitor. When the IP address of a monitored .NET host changes, operators must add a new application monitor for the host. The new application monitor cannot inherit the history data from the previous application monitor.
To modify a .NET application monitor:
1. Click the Resource tab.
2. From the navigation tree, select Application Manager > Application Monitor.
The application monitor list page opens.
3. Click the Modify icon![]() for the .NET application monitor you want to modify.
for the .NET application monitor you want to modify.
The page for modifying the .NET application monitor opens.
4. Modify the parameters as needed, except the IP address and the APM server.
For more information about parameter settings, see "Adding a .NET server application monitor."
5. Click OK.
Viewing the .NET server application monitor report
After a .NET application monitor is added, APM collects index data of the application, evaluates the availability and health status, and updates the monitor report. The report shows the index values obtained from the most recent polling of the application.
To view the .NET application monitor report:
1. Click the Resource tab.
2. From the navigation tree, select Application Manager > Application Monitor.
The application monitor list page displays all application monitors.
3. Click the name of a .NET application monitor to display the report.
Figure 78 shows part of a .NET application monitor report.
Figure 78 Part of a .NET server application monitor report

Monitor Information
The Monitor Information area contains the following fields:
· Name—Application monitor name.
· Health Status—Health state of the .NET server application.
· IP Address—IP address of the .NET server host.
· Application Type—Type of the monitored application, which is always .NET Server.
· Last Polling Time—Time when APM last polled the .NET server application.
· Relationship—Click the Relationship icon ![]() to view relations between applications in a dependency topology
view. For more information about dependency topologies,
see "Topology and application group
management."
to view relations between applications in a dependency topology
view. For more information about dependency topologies,
see "Topology and application group
management."
· Top5 Unrecovered Alarm—Latest five unrecovered alarms on the .NET server. This field is not displayed if no alarm is generated by the .NET server.
Availability Today
The Availability Today area contains the following fields:
· Current Availability—Availability of the .NET server.
¡ Click
the Weekly History icon![]() to view
the availability of the .NET server in the last 7 days.
to view
the availability of the .NET server in the last 7 days.
¡ Click
the Monthly History icon![]() to view
the availability of the .NET server in the last 30 days.
to view
the availability of the .NET server in the last 30 days.
· Available Time—Total amount of time that the .NET server was available after 00:00 today.
· Unavailable Time—Total amount of time that the .NET server was unavailable after 00:00 today.
· Inaccessible Time—Total amount of time that the .NET server was inaccessible after 00:00 today.
· Unmanaged Time—Total amount of time that the .NET server was unmanaged after 00:00 today.
The statistics collection started when the application monitor was added. An availability time field is not displayed if its value is 0.
.NET Memory
The .NET server periodically reclaims the heap memory released by Web applications using the Garbage Collector (GC). Abnormal operation of the GC is one of the major causes for .NET server performance issues.
The .NET Memory area contains the following fields:
· CPU Usage in GC—CPU usage of GC. Click the History Record icon ![]() to for a monitor index to view the history graph of CPU usage in GC
trend.
to for a monitor index to view the history graph of CPU usage in GC
trend.
· Heap Memory—Size of the heap
memory. Click the Set Threshold
icon ![]() to set alarm
thresholds for the heap memory size.
to set alarm
thresholds for the heap memory size.
.NET Thread
The .NET server manages all the physical and logical threads created by itself. Physical threads correspond to actual threads in the operating system. The .NET Thread area contains the following fields:
· Physical Threads—Number of native OS threads created and managed by the .NET server to act as underlying threads for .NET thread objects.
¡ Click
the Set Threshold icon ![]() to set alarm thresholds for the number of
physical threads.
to set alarm thresholds for the number of
physical threads.
¡ Click
the History Record icon ![]() for a monitor index to view the history graph of the
physical threads.
for a monitor index to view the history graph of the
physical threads.
· Logical Threads—Number of current .NET
thread objects created and managed by the .NET server. Click the History Record icon ![]() for a monitor index to view the history graph of
logical threads.
for a monitor index to view the history graph of
logical threads.
· Total Connections—Total number of times the threads in the
runtime have failed to acquire
a managed lock. Click the History Record icon ![]() for a monitor index to view the history graph of the
total connections.
for a monitor index to view the history graph of the
total connections.
· Thread Queue Length—Total number of threads in all the .NET applications waiting to acquire
a managed lock. Click the History Record icon ![]() for a monitor index to view the history graph of the
thread queue length.
for a monitor index to view the history graph of the
thread queue length.
.NET Abnormality
The .NET Abnormality area contains the following field:
· Thrown Abnormalities—Total
number of abnormalities thrown
by the .NET server since the .NET server started. Click the History
Record icon ![]() to view trend statistics of the number of thrown abnormalities of the .NET
server in a line graph.
to view trend statistics of the number of thrown abnormalities of the .NET
server in a line graph.
JIT
Just-in-time (JIT) is the .NET framework compiler that converts the Microsoft Intermediate Language (MSIL) to native code on an as-needed basis. CPU usage is a major indicator of JIT.
The JIT area contains the following field:
· CPU Usage in JIT—CPU usage of JIT. Click
the History Record icon ![]() to view trend statistics of history CPU usage
of JIT in a line graph.
to view trend statistics of history CPU usage
of JIT in a line graph.
Security
The Security area contains the following field:
· Total Checks During Runtime—Total number of runtime Code Access Security (CAS) checks performed
by the .NET server since the server started. Click the History
Record icon ![]() to view history graph
of the total runtime check trend.
to view history graph
of the total runtime check trend.
.NET Application
The .NET Application area contains the following fields:
· Name—Name of the Web application. The __Total__ entry displays the summary information of all Web applications.
· Waiting Transactions—Number of COM + transactions in waiting or suspended states.
· Errors—Number of errors occurred during processing HTTP requests, including parser errors, compile errors, and runtime errors. Typically, errors do not occur during normal operation.
· Requests—Number of requests received by the Web applications since the .NET server started.
· Request Timeouts—Number of timed out requests in the Web applications.
· Application Queue Requests—Number of requests added to the queue since the .NET server started.
· Sent Request Bytes—Number of bytes sent by the Web applications.
· Received Request Bytes—Number of bytes received by the Web applications.
· Active Sessions—Number of active sessions in the Web applications.
· Transactions—Number of COM + transactions that have started in the Web applications.
· Aborted Transactions—Number of COM + transactions aborted in the Web applications.
JBoss server
The JBoss server is an open source Web server for developing and deploying Web applications complied in Java.
Configuring the JBoss server and the APM server
APM obtains monitor index data of JBoss server applications through JMX.
To monitor a JBoss server remotely:
1. Edit the startup parameters for the JBoss server.
By default, a JBoss server of version 4.2 or later versions only listens on the port with the IP address of 127.0.0.1 (local host). To enable APM to obtain index data from the JBoss server, add the parameter –b 0.0.0.0 to the startup script of the server to enable it to monitor all the local IP addresses.
¡ For Windows operating systems, the startup script is run.bat –b 0.0.0.0.
¡ For Linux operating systems, the startup script is run.sh –b 0.0.0.0.
2. Edit the hosts file on the APM server.
Add the IP address-host name mapping of the JBoss server to the hosts file of the APM server for it to identify the IP address of the JBoss server while processing the JBoss response packets.
¡ For Windows operating systems, the hosts file directory is C:\WINDOWS\system32\drivers\etc\hosts file.
¡ For Linux operating systems, the hosts file directory is /etc/hosts file.
Adding a JBoss server application monitor
APM can locally or remotely monitor JBoss server applications. When you add JBoss server application monitors, follow these guidelines:
· To locally monitor JBoss server applications, install agents on the Windows operating systems where JBoss server applications are deployed. For more information about installing agents, see "APM agent management."
· To remotely monitor JBoss server applications, configure the JBoss server and the APM server. For more information, see "Configuring the JBoss server and the APM server."
· Add JBoss server hosts to the IMC platform so that APM can obtain and display network connections of the hosts and their access devices in the application topology. For more information about adding hosts to the IMC platform, see H3C Intelligent Management Center v7.3 Enterprise and Standard Platform Administrator Guide.
· To view traffic statistics in the monitor report of the JBoss server application, make sure at least one probe is configured in APM. After a JBoss server application monitor is added, APM sends the IP address and service port of the monitored JBoss server application to the probes for traffic collection.
To add a JBoss server application monitor:
1. Click the Resource tab.
2. Open the Add Application page by using one of the following methods:
¡ From the navigation tree, select Application Manager > Add Application.
The page displays all application types that can be monitored by APM.
¡ From the navigation tree, select Application Manager > Application Monitor, and then click Add on the application monitor list page.
3. Click JBoss Server of the Application Server Monitor class.
The page for adding a JBoss server application monitor opens.
4. Configure the following parameters:
¡ IP Address—Enter the IP address of the host on which the JBoss server application to be monitored is installed. APM automatically checks the IP address and associates the application monitor with the host managed in the IMC platform. If the host is already added to the IMC platform, you can also click Select, and then select the host in the Select Devices window. For information about selecting a host, see "Quick start."
¡ Name—Enter a unique application monitor name. As a best practice, name the application monitor as application type_host IP address.
¡ Use Template—Select Enable or Disable from the list.
¡ Template—Click
the Configure icon ![]() next to the Template field to select an existing
template. The Template field is automatically populated with the name of the selected
template. For more information about configuring application templates, see
"Configuration management." This field is displayed only when you select Enable from the Use Template list.
next to the Template field to select an existing
template. The Template field is automatically populated with the name of the selected
template. For more information about configuring application templates, see
"Configuration management." This field is displayed only when you select Enable from the Use Template list.
¡ Description—Enter a description for the application monitor.
¡ Application Monitor Port—Enter the service port number for the JBoss server application, TCP 1099 by default. This field is available only when you select Disable from the Use Template list.
¡ Traffic Collection Port—Enter the service port number for JBoss. This field is available only when at least one probe is configured for APM and you select Disable from the Use Template list.
¡ Polling Interval (min)—Select a polling interval for the application monitor. Available options are 1, 2, 3, 4, 5, 10, 20, and 30. The default polling interval is 5 minutes. A shorter polling interval improves real-time data accuracy at the expense of system resources. This field is available only when you select Disable from the Use Template list.
¡ Contact—Enter the contact information, such as the name, email address, and telephone number. The default is the username of the operator who created the application monitor. This field is available only when you select Disable from the Use Template list.
¡ APM Server—Select an APM server to monitor the application. The options are in server-address (application-type:n/N) format. The letter n indicates the number of JBoss applications monitored on the APM server. The letter N indicates the total number of applications monitored on the APM server. Server address 127.0.0.1 indicates that APM and the IMC platform are deployed on the same server.
¡ Related Applications—Click Add next to this field. On the Select Application window, enter a partial or complete name to filter applications, select the applications that JBoss depends on, and then click OK.
Operating system applications cannot be selected. Operators can view all dependencies of the application in the dependency topology. APM automatically adds the dependencies between JBoss and operating system applications by IP address and displays their dependencies in the application topology.
¡ Application Group—Specify an application group for the JBoss application.
- To specify an existing application group, click Add, select an application group, and then click OK.
- To specify a new application group, click Add Application Group, configure the application group settings, and then click OK.
¡ Detect Application—Select this parameter if you want to enable application detection. Application detection enables APM to verify connection to the application by using the previous parameter settings, and to determine whether to add the application monitor based on the verification result. APM adds the application monitor only when it can connect to the application. When this parameter is not specified, APM adds the application monitor without verifying the connection.
5. Click OK.
Modifying a JBoss server application monitor
Authorized users can modify all parameters except the IP address and the APM server for a JBoss server application monitor. When the IP address of a monitored JBoss host changes, operators must add a new application monitor for the host. The new application monitor cannot inherit the history data from the previous application monitor.
To modify a JBoss server application monitor:
1. Click the Resource tab.
2. From the navigation tree, select Application Manager > Application Monitor.
The application monitor list page opens.
3. Click the Modify icon![]() for the JBoss server application monitor you want
to modify.
for the JBoss server application monitor you want
to modify.
The page for modifying the JBoss server application monitor opens.
4. Modify the parameters as needed, except the IP address and the APM server.
For more information about parameter settings, see "Adding a JBoss server application monitor."
5. Click OK.
Viewing the JBoss server application monitor report
After a JBoss server application monitor is added, APM collects index data of the application, evaluates the availability and health status, and updates the monitor report. The report shows the index values obtained from the most recent polling of the application.
To view the JBoss server application monitor report:
1. Click the Resource tab.
2. From the navigation tree, select Application Manager > Application Monitor.
The application monitor list page displays all application monitors.
3. Click the name of a JBoss server application monitor to display the report.
Figure 79 shows part of a JBoss server application monitor report.
Figure 79 Part of a JBoss server application monitor report
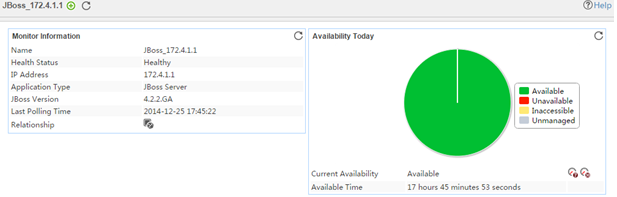
Monitor Information
The Monitor Information area contains the following fields:
· Name—Application monitor name.
· Health Status—Health state of the JBoss server application.
· IP Address—IP address of the JBoss server host.
· Application Type—Type of the monitored application, which is always JBoss Server.
· JBoss Version—Version of the JBoss server.
· Last Polling Time—Time when APM last polled the JBoss server application.
· Relationship—Click the Relationship
icon ![]() to view dependencies between applications in a dependency topology
view. For more information about dependency topologies,
see "Topology and
application group management."
to view dependencies between applications in a dependency topology
view. For more information about dependency topologies,
see "Topology and
application group management."
· Top5 Unrecovered Alarm—Latest five unrecovered alarms on the JBoss server. This field is not displayed if no alarm is generated by the JBoss server.
Availability Today
The Availability Today area contains the following fields:
· Current Availability—Availability of the JBoss server.
¡ Click the Weekly History icon![]() to view
the availability of the JBoss server in the last 7 days.
to view
the availability of the JBoss server in the last 7 days.
¡ Click the Monthly
History icon![]() to view the availability of the JBoss server in the last 30 days.
to view the availability of the JBoss server in the last 30 days.
· Available Time—Total amount of time that the JBoss server was available after 00:00 today.
· Unavailable Time—Total amount of time that the JBoss server was unavailable after 00:00 today.
· Inaccessible Time—Total amount of time that the JBoss server was inaccessible after 00:00 today.
· Unmanaged Time—Total amount of time that the JBoss server was unmanaged after 00:00 today.
The statistics collection started when the application monitor was added. An availability time field is not displayed if its value is 0.
Memory Usage
The Memory Usage area contains the following field:
· Free Memory (%)—Percentage of free memory to total memory allocated to the JBoss server by the operating system.
¡ Click the Set Threshold icon ![]() to set alarm thresholds for the free memory percentage.
to set alarm thresholds for the free memory percentage.
¡ Click
the History Record icon ![]() to view changes of the
free memory percentage over a specific time period in a
line graph.
to view changes of the
free memory percentage over a specific time period in a
line graph.
Stack
The Stack area contains the following fields:
· Total Stacks—Total size of the stack the operating system allocated to the JBoss server.
· Current Stacks—Size of the stack
that is currently being used in the JBoss server. Click the History Record icon ![]() to view history graph of the current stack
size trend.
to view history graph of the current stack
size trend.
· Free Stacks—Size of the free stack in the JBoss server.
Connection Pool
The Connection Pool area contains the following fields:
· Pool Name—Name of the connection pool.
· Pool Size—Size of the connection pool.
· Connections in Use—Total number of connections being used.
¡ Click
the Set Threshold icon ![]() to set alarm thresholds for the number of
connections being used.
to set alarm thresholds for the number of
connections being used.
¡ Click
the History Record icon ![]() for a monitor index to view the history trend statistics of connections
being used in a line graph.
for a monitor index to view the history trend statistics of connections
being used in a line graph.
· Created Connections—Total number of
connections created. Click the History Record icon ![]() for a monitor index to view the history trend statistics of created connections in a line graph.
for a monitor index to view the history trend statistics of created connections in a line graph.
· Terminated Connections—Number of connections that have been terminated. Click the History
Record icon ![]() for a monitor index
to view the history trend statistics of terminated connections in a
line graph.
for a monitor index
to view the history trend statistics of terminated connections in a
line graph.
· Idle Timeout—Maximum time an idle connection can remain in the pool. Click
the History Record icon ![]() for a monitor index to view the history trend statistics of idle timeout in a line graph.
for a monitor index to view the history trend statistics of idle timeout in a line graph.
Web Application
The Web Application area contains the following fields:
· Web Application—Name of the Web application deployed on the JBoss server.
· Servlet—Servlet used by the Web application. One Web application can use multiple servlets, each responsible for responding to and handling HTTP requests of one or multiple Web pages.
· Average Time—Average time taken by the servlet to respond to and process requests.
· Total Time—Total time taken by the servlet to load web pages and process requests.
· Max Execution Time—Maximum execution time for the servlet.
· Min Execution Time—Minimum execution time for the servlet.
· More—Click More to view all the Web applications deployed on the JBoss server in a separate window.
Application Traffic
APM collects the traffic statistics of the JBoss server based on the IP address and port number of JBoss server host. The Application Traffic area contains the following fields:
· Last Hour's Traffic—Total traffic sent and received by the JBoss server over the last 1 hour.
· Today's Traffic—Total traffic sent and received by the JBoss server since 00:00 today.
Tomcat server
Tomcat is an open source Web server developed by the Apache Software Foundation (ASF) for developing and deploying Web applications complied in Java.
Configuring the Tomcat server to support JMX monitoring
APM obtains monitor index data of Tomcat server applications through JMX. To monitor a Tomcat server, configure the environment variables and startup script for the monitored server.
To configure the green version Tomcat server:
1. Configure the environment variables for the operating system. Add the following parameters:
%JAVA_HOME%\lib\tools.jar
%JAVA_HOME%\lib\dt.jar
%CATALINA_HOME%\common\lib\jsp-api.jar
%CATALINA_HOME%\common\lib\servlet-api.jar
Parameter description:
¡ For Windows operating systems, modify the Path environment variable. Use semicolons (;) as the parameter delimiter.
¡ For Linux operating systems, modify the PATH environment variable. Use colons (:) as the parameter delimiter.
2. Add the following java options to the Tomcat startup script:
set JAVA_OPTS=%JAVA_OPTS% -Dcom.sun.management.jmxremote -Dcom.sun.management.jmxremote.port=1099 -Dcom.sun.management.jmxremote.ssl=false -Dcom.sun.management.jmxremote.authenticate=false -Djava.rmi.server.hostname=172.8.21.1.
¡ For Windows operating systems, the startup script path is <Tomcat deployment directory>\bin\catalina.bat.
¡ For Linux operating systems, the startup script path is <Tomcat deployment directory>/bin/catalina.sh.
Java option description:
¡ Dcom.sun.management.jmxremote—Enable remote access to JMX. APM can remotely access the JMX of the Tomcat server through RMI.
¡ Dcom.sun.management.jmxremote.port=1099—Specify the JMX port as 1099. You can use another port, but the port cannot conflict with other services.
¡ Dcom.sun.management.jmxremote.ssl=false—false indicates that no SSL connection is needed for remote RMI access.
¡ Dcom.sun.management.jmxremote.authenticate=false—false indicates that no authentication is needed for remote RMI access. For information about enabling authentication, see the Java document.
¡ Djava.rmi.server.hostname=172.8.21.1—Specify the local IP address that JMX listens on. The specified IP address must be able to communicate with APM.
The text should be placed in front of rem Execute Java with the applicable properties without any carriage return.
3. Restart Tomcat.
To configure the installation version Tomcat server:
4. Click Start > All programs > Apache Tomcat 5.5 > Configure Tomcat to open the Tomcat configuration console.
5. Select the Java tab.
6. At the bottom of the Java Options text box, add:
-Dcom.sun.management.jmxremote -Dcom.sun.management.jmxremote.port=1099 -Dcom.sun.management.jmxremote.ssl=false -Dcom.sun.management.jmxremote.authenticate=false -Djava.rmi.server.hostname=172.8.21.1
7. Click OK, and then restart the Tomcat server.
Adding a Tomcat server application monitor
APM can locally or remotely monitor Tomcat applications. When you add Tomcat server application monitors, follow these guidelines:
· To locally monitor Tomcat server applications, install agents on the Windows operating systems where Tomcat server applications are deployed. For more information about installing agents, see "APM agent management."
· To remotely monitor Tomcat server applications, configure the Tomcat server. For more information, see "Configuring the Tomcat server to support JMX monitoring."
· Obtain the username and password required for remote JMX access if authentication is enabled. Authentication is enabled only when the value of the java option Dcom.sun.management.jmxremote.authenticate is set to true.
· Add Tomcat server hosts to the IMC platform so that APM can obtain and display network connections of the hosts and their access devices in the application topology. For more information about adding hosts to the IMC platform, see H3C Intelligent Management Center v7.3 Enterprise and Standard Platform Administrator Guide.
· To view traffic statistics in the monitor report of the Tomcat application, make sure at least one probe is configured in APM. After a Tomcat application monitor is added, APM sends the IP address and service port of the monitored Tomcat application to the probes for traffic collection.
To add a Tomcat server application monitor:
1. Click the Resource tab.
2. Open the Add Application page by using one of the following methods:
¡ From the navigation tree, select Application Manager > Add Application.
The page displays all application types that can be monitored by APM.
¡ From the navigation tree, select Application Manager > Application Monitor, and then click Add on the application monitor list page.
3. Click Tomcat Server of the Application Server Monitor class.
The page for adding a Tomcat server application monitor opens.
4. Configure the following parameters:
¡ IP Address—Enter the IP address of the host on which the Tomcat application to be monitored is installed. APM automatically checks the IP address and associates the application monitor with the host managed in the IMC platform. If the host is already added to the IMC platform, you can also click Select, and then select the host in the Select Devices window. For information about selecting a host, see "Quick start."
¡ Name—Enter a unique application monitor name. As a best practice, name the application monitor as application type_host IP address.
¡ Use Template—Select Enable or Disable from the list.
¡ Template—Click
the Configure icon ![]() next to the Template field to select an existing
template. The Template field is automatically populated with the name of the selected
template. For more information about configuring application templates, see
"Configuration management." This field is displayed only when you select Enable from the Use Template list.
next to the Template field to select an existing
template. The Template field is automatically populated with the name of the selected
template. For more information about configuring application templates, see
"Configuration management." This field is displayed only when you select Enable from the Use Template list.
¡ Description—Enter a description for the application monitor.
¡ Application Monitor Port—Enter the service port number for the Tomcat application. Make sure the port number is the same as that specified by Dcom.sun.management.jmxremote.port in the startup script. The default value is TCP 1099. This field is available only when you select Disable from the Use Template list.
¡ Traffic Collection Port—Enter the service port number for Tomcat. This field is displayed only when at least one probe is configured for APM and you select Disable from the Use Template list.
¡ Polling Interval (min)—Select a polling interval for the application monitor. Available options are 1, 2, 3, 4, 5, 10, 20, and 30. The default polling interval is 5 minutes. A shorter polling interval improves real-time data accuracy at the expense of system resources. This field is available only when you select Disable from the Use Template list.
¡ Username/Password—Enter the username and password used for remote JMX access if authentication is enabled.
¡ Contact—Enter the contact information, such as the name, email address, and telephone number. The default is the username of the operator who created the application monitor. This field is available only when you select Disable from the Use Template list.
¡ APM Server—Select an APM server to monitor the application. The options are in server-address (application-type:n/N) format. The letter n indicates the number of Tomcat server applications monitored on the APM server. The letter N indicates the total number of applications monitored on the APM server. Server address 127.0.0.1 indicates that APM and the IMC platform are deployed on the same server.
¡ Related Applications—Click Add next to this field. On the Select Application window, enter a partial or complete name to filter applications, select the applications that Tomcat depends on, and then click OK.
Operating system applications cannot be selected. Operators can view all dependencies of the application in the dependency topology. APM automatically adds the dependencies between Tomcat and operating system applications by IP address and displays their dependencies in the application topology.
¡ Application Group—Specify an application group for the Tomcat server application.
- To specify an existing application group, click Add, select an application group, and then click OK.
- To specify a new application group, click Add Application Group, configure the application group settings, and then click OK.
¡ Detect Application—Select this parameter if you want to enable application detection. Application detection enables APM to verify connection to the application by using the previous parameter settings, and to determine whether to add the application monitor based on the verification result. APM adds the application monitor only when it can connect to the application. When this parameter is not specified, APM adds the application monitor without verifying the connection.
5. Click OK.
Modifying a Tomcat server application monitor
Authorized users can modify all parameters except the IP address and the APM server for a Tomcat server application monitor. When the IP address of a monitored Tomcat host changes, operators must add a new application monitor for the host. The new application monitor cannot inherit the history data from the previous application monitor.
To modify a Tomcat server application monitor:
1. Click the Resource tab.
2. From the navigation tree, select Application Manager > Application Monitor.
The application monitor list page opens.
3. Click the Modify icon![]() for the Tomcat server application monitor you want
to modify.
for the Tomcat server application monitor you want
to modify.
The page for modifying the Tomcat server application monitor opens.
4. Modify the parameters as needed, except the IP address and the APM server.
For more information about parameter settings, see "Adding a Tomcat server application monitor."
5. Click OK.
Viewing the Tomcat server application monitor report
After a Tomcat server application monitor is added, APM collects index data of the application, evaluates the availability and health status, and updates the monitor report. The report shows the index values obtained from the most recent polling of the application.
To view the Tomcat server application monitor report:
1. Click the Resource tab.
2. From the navigation tree, select Application Manager > Application Monitor.
The application monitor list page displays all application monitors.
3. Click the name of a Tomcat server application monitor to display the report.
Figure 80 shows part of a Tomcat server application monitor report.
Figure 80 Part of a Tomcat server application monitor report

Monitor Information
The Monitor Information area contains the following fields:
· Name—Application monitor name.
· Health Status—Health status of the Tomcat server application.
· IP Address—IP address of the Tomcat server host.
· Application Type—Type of the monitored application, which is always Tomcat Server.
· Tomcat Version—Version of the Tomcat server.
· Last Polling Time—Time when APM last polled the Tomcat server application.
· Relationship—Click the Relationship
icon ![]() to view dependencies between applications in a dependency topology
view. For more information about dependency topologies,
see "Topology and
application group management."
to view dependencies between applications in a dependency topology
view. For more information about dependency topologies,
see "Topology and
application group management."
· Top5 Unrecovered Alarm—Latest five unrecovered alarms on the Tomcat server. This field is not displayed if no alarm is generated by the Tomcat server.
Availability Today
The Availability Today area contains the following fields:
· Current Availability—Availability of the Tomcat server.
¡ Click
the Weekly History icon ![]() to view
the availability of the Tomcat server in the last 7 days.
to view
the availability of the Tomcat server in the last 7 days.
¡ Click
the Monthly History icon ![]() to view
the availability of the Tomcat server in the last 30 days.
to view
the availability of the Tomcat server in the last 30 days.
· Available Time—Total amount of time that the Tomcat server was available after 00:00 today.
· Unavailable Time—Total amount of time that the Tomcat server was unavailable after 00:00 today.
· Inaccessible Time—Total amount of time that the Tomcat server was inaccessible after 00:00 today.
· Unmanaged Time—Total amount of time that the Tomcat server was unmanaged after 00:00 today.
The statistics collection started when the application monitor was added. An availability time field is not displayed if its value is 0.
Performance
The Performance area contains the following fields:
· Response Time—Round-trip response time of the Tomcat
server. Click the History Record icon ![]() for a monitor index to
view the history graph of the response time.
for a monitor index to
view the history graph of the response time.
· Traffic—Total number of bytes received and sent by the Tomcat server since the Tomcat server started. Click the History Record icon ![]() for a monitor index to
view the history graph of the traffic trend.
for a monitor index to
view the history graph of the traffic trend.
Memory Usage
The Memory Usage area contains the following fields:
· Total Memory—Total memory allocated to the Tomcat server by the operating system.
· In Use—Used memory of the Tomcat server. Click the History Record icon ![]() to view the history graph of the memory usage
trend of the Tomcat server.
to view the history graph of the memory usage
trend of the Tomcat server.
· Free Space—Free memory of the Tomcat server.
Application Traffic
APM collects the traffic statistics of the Tomcat server based on the IP address and port number of Tomcat server host. The Application Traffic area contains the following fields:
· Last Hour's Traffic—Total traffic sent and received by the Tomcat server over the last 1 hour.
· Today's Traffic—Total traffic sent and received by the Tomcat server since 00:00 today.
Thread
The Thread area contains the following fields:
· Total Requests—Total number of requests the Tomcat server had
received since the server started. Click the History Record icon ![]() for a monitor index to view history trend statistics of the total requests.
for a monitor index to view history trend statistics of the total requests.
· Successes—Total number of requests the Tomcat server had received and responded to since the server started.
¡ Click
the Set Threshold icon ![]() to set alarm thresholds for the number of successful requests.
to set alarm thresholds for the number of successful requests.
¡ Click
the History Record icon ![]() for a monitor index to view history trend statistics of the successful requests.
for a monitor index to view history trend statistics of the successful requests.
· Errors—Total number of requests the Tomcat server had
failed to respond to since the server started. Click the History
Record icon ![]() for a monitor index
to view history trend statistics of the request errors.
for a monitor index
to view history trend statistics of the request errors.
Web Application
The Web Application area contains the following fields:
· Application Name—Name of the Web application deployed on the Tomcat server. Click the name of a Web application (/docs in this example) to view its details.
¡ URL—Web page and servlet of the Web application.
¡ Name—Name of the Web application to which the URL belongs.
¡ JSP Requests—Number of JSP requests received by the URL since the Tomcat server started.
¡ Error Requests—Number of requests the URL received but failed to respond to.
¡ Response Time—Total time taken by the URL to receive, execute, and respond to the request.
· Active Sessions—Number of active sessions in the Web application. Click the History
Record icon ![]() for a Web application
to view the history graph of the active session count trend of the application.
for a Web application
to view the history graph of the active session count trend of the application.
Lync Server 2010
Lync 2010 is a C/S model communication application offered by Microsoft. Lync 2010 contains the client Lync 2010 and the server Lync Server 2010. APM supports monitoring Lync Server 2010 through WMI.
Adding a Lync Server 2010 application monitor
APM can locally or remotely monitor Lync Server 2010 applications through WMI. When you add a Lync Server 2010 application monitor, follow these restrictions and guidelines:
· Configure and enable WMI on the hosts where Lync Server 2010 is deployed. For more information about enabling WMI on Windows, see Windows Server online help.
· To locally monitor Lync Server 2010 applications, install agents on the hosts where Lync Server 2010 applications are deployed. For more information about installing agents, see "APM agent management."
· To remotely monitor Lync Server 2010 applications, obtain the username and password of the authorized Windows host administrator. The username and password are required for adding the application monitor.
· Add Lync Server 2010 hosts to the IMC platform so that APM can obtain and display network connections of the hosts and their access devices in the application topology. For more information about adding hosts to the IMC platform, see H3C Intelligent Management Center v7.3 Enterprise and Standard Platform Administrator Guide.
· To view traffic statistics in the monitor report of the Lync Server 2010 application, make sure at least one probe is configured in APM. After a Lync Server 2010 application monitor is added, APM sends the IP address and service port of the monitored Lync Server 2010 to the probes for traffic collection.
To add a Lync Server 2010 application monitor:
1. Click the Resource tab.
2. Open the Add Application page by using one of the following methods:
¡ From the navigation tree, select Application Manager > Add Application.
¡ From the navigation tree, select Application Manager > Application Monitor. In the application monitor list, click Add.
The Add Application page displays all application types that can be monitored by APM.
3. Click Lync Server 2010 of the Application Server class.
The page for adding a Lync Server 2010 application monitor opens.
4. Configure the following parameters:
¡ IP Address—Enter the IP address of the host on which the Lync Server 2010 application to be monitored is installed. APM automatically checks the specified IP address and associates the application monitor with the host managed in the IMC platform. If the host is already added to the IMC platform, you can also click Select, and then select the host in the Select Devices dialog box. For information about selecting a host, see "Quick start."
¡ Name—Enter a unique application monitor name. As a best practice, name the application monitor as application type_host IP address.
¡ Use Template—Select Enable or Disable from the list.
¡ Template—Click
the Configure icon ![]() next to the Template field to select an existing template. The Template field
is automatically populated with the name of the selected template. For more
information about configuring application templates, see "Configuration management." This field is displayed only when you select Enable from the Use
Template list.
next to the Template field to select an existing template. The Template field
is automatically populated with the name of the selected template. For more
information about configuring application templates, see "Configuration management." This field is displayed only when you select Enable from the Use
Template list.
¡ Description—Enter a description for the application monitor.
¡ Traffic Collection Port—Enter the traffic collection port number for Lync Server 2010. This field is displayed only when at least one probe is configured for APM and is available only when you select Disable from the Use Template list.
¡ Polling Interval (min)—Select a polling interval for the application monitor. Options are 1, 2, 3, 4, 5, 10, 20, and 30. The default polling interval is 5 minutes. A shorter polling interval improves real-time data accuracy at the expense of system resources. This field is available only when you select Disable from the Use Template list.
¡ Username/Password—Enter the username and password of the Windows system administrator. The fields are available only when you select Disable from the Use Template list.
¡ Contact—Enter the contact information, such as the name, email address, and telephone number. The default is the username of the operator who created the application monitor. This field is available only when you select Disable from the Use Template list.
¡ Select the following Lync Server 2010 services to be monitored:
- Lync Server Audio/Video Conferencing
- Lync Server Audio/Video Edge
- Lync Server Conferencing Announcement
- Lync Server Call Detail Recording
- Lync Server Call Park
- Lync Server File Transfer Agent
- Lync Server Master Replicator Agent
- Lync Server Conferencing Attendant
- Lync Server Data Conferencing
- Lync Server IM Conferencing
- Lync Server Mediation
- Lync Server Bandwidth Policy Service
- Lync Online Provisioning Service
- Lync Server QoE Monitoring Service
- Lync Server Replica Replicator Agent
- Lync Server Response Group
- Lync Server Web Conferencing Edge
- World Wide Web Publishing Service
¡ APM Server—Select an APM server to monitor the application. The options are in server-address (application-type:n/N) format. The letter n indicates the number of Lync Server 2010 applications monitored on the APM server. The letter N indicates the total number of applications monitored on the APM server. Server address 127.0.0.1 indicates that APM and the IMC platform are deployed on the same server.
¡ Related Applications—Click Add next to this field. On the Select Application window, enter a partial or complete name to filter applications, select the applications that Lync Server 2010 depends on, and then click OK.
Operating system applications cannot be selected. Operators can view all dependencies of the application in the dependency topology. APM automatically adds the dependencies between Lync Server 2010 and operating system applications by IP address.
¡ Application Group—Specify an application group for the Lync Server 2010 application.
- To specify an existing application group, click Add, select an application group, and then click OK.
- To specify a new application group, click Add Application Group, configure the application group settings, and then click OK.
¡ Detect Application—Select this parameter if you want to enable application detection. APM verifies the application connectivity by using the previous parameter settings, and adds the application monitor only when it can connect to the application. If you do not select this parameter, APM adds the application monitor without verifying the application connectivity.
5. Click OK.
Modifying a Lync Server 2010 application monitor
Authorized users can modify all parameters except the IP address and the APM server for a Lync Server 2010 application monitor. When the IP address of a monitored Lync Server 2010 application changes, operators must add a new application monitor for the host. However, the new application monitor cannot inherit the history data from the previous application monitor.
To modify a Lync Server 2010 application monitor:
1. Click the Resource tab.
2. From the navigation tree, select Application Manager > Application Monitor.
The application monitor list page displays all application monitors.
3. Click the Modify
icon ![]() for the Lync Server 2010 application monitor you want to modify.
for the Lync Server 2010 application monitor you want to modify.
The page for modifying the Lync Server 2010 application monitor opens.
4. Modify the parameters as needed, except the IP address and the APM server.
For more information about parameter settings, see "Adding a Lync Server 2010 application monitor."
5. Click OK.
Viewing the Lync Server 2010 application monitor report
After a Lync Server 2010 application monitor is added, APM collects application index data, evaluates the availability and health status, and updates the monitor report. The report shows the index values obtained from the most recent polling of the application.
To access the Lync Server 2010 application monitor report:
1. Click the Resource tab.
2. From the navigation tree, select Application Manager > Application Monitor.
The application monitor list page displays all application monitors.
3. Click the name of a Lync Server 2010 application monitor to display the report.
Figure 81 shows part of a Lync Server 2010 monitor report.
Figure 81 Part of a Lync Server 2010 application monitor report
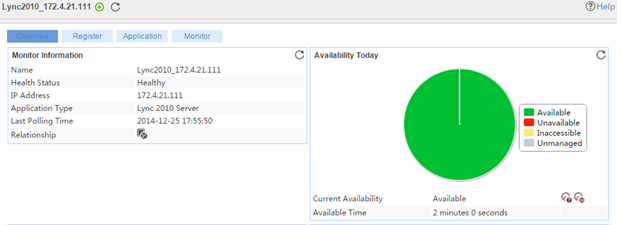
Monitor Information
The Monitor Information area contains the following fields:
· Name—Application monitor name.
· Health Status—Health state of the Lync Server 2010 application.
· IP Address—IP address of the Lync Server 2010 host.
· Application Type—Type of the monitored application, which is always Lync 2010 Server.
· Last Polling Time—Time when APM last polled the Lync Server 2010 application.
· Relationship—Click the Relationship icon ![]() to view dependencies between the Lync Server
2010 application and other applications in a dependency
topology view. For more information
about dependency topologies, see "Topology and application group management."
to view dependencies between the Lync Server
2010 application and other applications in a dependency
topology view. For more information
about dependency topologies, see "Topology and application group management."
· Top5 Unrecovered Alarms—Latest five unrecovered alarms on the Lync Server 2010 application. This field is not displayed if no alarm was generated by the Lync Server 2010 application.
Availability Today
The Availability Today area contains the following fields:
· Current Availability—Availability of the Lync Server 2010 application.
¡ Click
the Weekly History icon ![]() to view the availability of the Lync Server
2010 application in the last 7 days.
to view the availability of the Lync Server
2010 application in the last 7 days.
¡ Click
the Monthly History icon ![]() to view the availability of the Lync Server
2010 application in the last 30 days.
to view the availability of the Lync Server
2010 application in the last 30 days.
· Available Time—Total amount of time that the Lync Server 2010 application was available after 00:00 today.
· Unavailable Time—Total amount of time that the Lync Server 2010 application was unavailable after 00:00 today.
· Inaccessible Time—Total amount of time that the Lync Server 2010 application was inaccessible after 00:00 today.
· Unmanaged Time—Total amount of time that the Lync Server 2010 application was unmanaged after 00:00 today.
The statistics collection started when the application monitor was added. An availability time field is not displayed if its value is 0.
CPU Usage Ratio
The CPU Usage Ratio area contains the following field:
· CPU Usage Ratio—CPU usage ratio of the OS on the Lync Server 2010 host.
¡ Click
the Set Threshold icon ![]() to set alarm thresholds for the CPU usage
ratio.
to set alarm thresholds for the CPU usage
ratio.
¡ Click the History Record icon ![]() to view the history
graph of the CPU usage ratio.
to view the history
graph of the CPU usage ratio.
Memory Usage Ratio
The Memory Usage Ratio area displays information about physical memory and swap memory.
The Memory Usage Ratio area contains the following fields:
· Physical Memory—Physical memory of the OS, which corresponds to the physical memory bar.
· Swap—Swap memory of the OS, which corresponds to a disk space.
· Total—Total amount of the physical or swap memory.
· In Use—Size of the physical or swap memory being used. Click the History Record icon ![]() to view the history
graph of the physical or swap memory being used.
to view the history
graph of the physical or swap memory being used.
· Usage Ratio—Physical or swap memory usage ratio. The usage ratio is calculated by using the formula: Usage ratio = Memory in use/Total memory x 100%.
¡ Click
the Set Threshold icon ![]() to set alarm thresholds for the physical or
swap memory.
to set alarm thresholds for the physical or
swap memory.
¡ Click
the History Record icon
![]() to view the history graph of the physical or swap memory usage.
to view the history graph of the physical or swap memory usage.
Ping Test
When the polling interval expires, APM pings the Lync Server 2010 host by sending up to three ICMP packets. When APM receives a response, it considers the ping test a success and records the response time. When APM receives no response after three tries, it considers the ping test a failure.
The Ping Test area contains the following fields:
· Response Time—Round trip response time of the Lync Server
2010 application in the last ping operation. Click the History Record icon ![]() to view the history
graph of the response time.
to view the history
graph of the response time.
· Packets Sent—Number of ICMP packets that are sent in the last ping operation. The
maximum value is 3. Click
the History Record icon ![]() to view the history graph of the sent packets.
to view the history graph of the sent packets.
· Packets Received—Number
of ICMP response packets that are received in the last ping operation. The value is 0 or 1. Click the History Record icon ![]() to view the history
graph of the received packets.
to view the history
graph of the received packets.
Mediation Server Health Indices
The Mediation Server Health Indices area contains the following field:
· Audio Buffer Hits Per
Second—Times that the audio
buffer is used per second. Click the Set Threshold icon ![]() to set
alarm thresholds for the audio buffer hits per second.
to set
alarm thresholds for the audio buffer hits per second.
Mediation Server Relay
The Mediation Server Relay area contains the following field:
· Number of Rx Audio Channels
Started—Total number of
Rx audio channels started by all components of the Lync Server 2010
application. Click the Set
Threshold icon ![]() to set
alarm thresholds for the number of Rx audio channels
started per second.
to set
alarm thresholds for the number of Rx audio channels
started per second.
USrv Server Aggregation
The USrv Server Aggregation area contains the following field:
· Number of Aggregation Requests Per Second—Number of aggregation requests received by the Lync Server 2010 application per second.
A/V MCU
The A/V MCU area contains the following fields:
· Number of Conferences—Number of conferences on the A/V conference
server. Click the History Record icon ![]() to view the history
graph for the number of conferences.
to view the history
graph for the number of conferences.
· Number of Users—Total number of users on the A/V conference server.
· Number of TrustedUsers—Total number of trusted users on the A/V
conference server. Click the Set
Threshold icon ![]() to set
alarm thresholds for the number of trusted users.
to set
alarm thresholds for the number of trusted users.
USrv Service
The USrv Service area contains the following field:
· MWI NOTIFYs Received Per Second—Total number of MWI notifications received by all users per second.
IM MCU Health and Performance
The IM MCU Health and Performance area contains the following field:
· MCU Health Status—Health state of the IM MCU.
Service
The Service area contains the following fields:
· Service Name—Original name of the Lync Server 2010 system service.
· Display Name—Alias name of the service, which is displayed on the Windows service console. Typically, the display name of a service is different from its service name. You can recognize the service function by its service name.
· State—State of the system service.
Process
By default, APM does not monitor any
processes, and the process list is empty. Click the Config icon ![]() to select the processes to be
monitored. APM collects CPU and memory usages for the selected processes.
to select the processes to be
monitored. APM collects CPU and memory usages for the selected processes.
The Process area contains the following fields:
· Process Name—Name of the process.
· CLI—Command lines used to start the process.
· CPU Usage—CPU usage of the process.
¡ Click
the Set Threshold icon ![]() to set CPU usage alarm thresholds.
to set CPU usage alarm thresholds.
¡ Click
the History Record icon ![]() to view the CPU usage history graph.
to view the CPU usage history graph.
· Memory Usage—Memory usage of the process. Click the History
Record icon ![]() for the process to view the memory usage history
graph.
for the process to view the memory usage history
graph.
A/V Auth Requests
The A/V Auth Requests area contains the following fields:
· Credentials Issued Per Second—Number of credentials issued by the A/V identity authentication service per second.
· Bad Requests Received Per Second—Number of incorrect requests received by the A/V identity authentication service per second.
· Current Requests Serviced—Number of requests that are being processed by the A/V identity authentication service.
SIP Networking
The SIP Networking area contains the following field:
· Connections Refused for Server Overload—Number of user connections refused by the Lync Server 2010 application due to overload.
PDP TURN
The PDP TURN area contains the following fields:
· Active Client Connections—Number of active client connections.
· Client Authentication Time Out Failures Per Second—Number of clients that failed to be authenticated due to timeout per second.
· First Packet Time Outs Per Second—Number of sessions with the first packet timed out per second.
· Active Edge Connections—Number of active edge connections.
· Server Authentication Time Out Failures Per Second—Number of client connections that failed to be authenticated due to server timeout per second.
IM MCU Conferences
The IM MCU Conferences area contains the following fields:
· Active Conferences—Number of active conferences.
· Connected Users—Number of users connected to the IM MCU.
· Throttled Sip Connections—Number of SIP connections disconnected from
the IM MCU. Click the Set Threshold icon ![]() to set alarm
thresholds for disconnected SIP connections.
to set alarm
thresholds for disconnected SIP connections.
MCU Data Conferences
The MCU Data Conferences area contains the following fields:
· Blocked Files—Number of files blocked by the file transfer filter.
· Active Conferences—Number of active conferences.
· Number of Unhandled Application Exception—Number of application exceptions that have not been handled.
· Conference Workitems Load—Duration for processing tasks in the conference queue.
· Session Queues State—State of the session queue.
· Avg Time Queued in Data MCU for LDM—Average time that LDM messages wait in the data MCU queue.
· Total Data Archiving Events Recorded—Total number of data archiving event records.
QMS Agent QoE Monitor Server
The QMS Agent QoE Monitor Server area contains the following fields:
· Number of Metrics Reports Received Per Second—Number of QoE metrics reports sent by the QoE monitor agent per second.
· Number of Metrics Reports Accepted Per Second—Number of QoE metrics reports received by the QoE monitor agent per second.
· Number of Metrics Reports Rejected Per Second—Number of QoE metrics reports rejected by the QoE monitor agent per second.
· Number of Msg Queue Messages Sent Per Second—Number of MSMQ messages sent from the QoE monitor agent to the Lync monitor server per second.
· Number of Msg Queue Messages Unable to Be Sent—Number of MSMQ messages discarded by the QoE monitor agent per second because they failed to be sent to the Lync monitor server.
PDP Diagnostics
The PDP Diagnostics area contains the following fields:
· Messages Dropped Per Second—Number of messages discarded due to invalidity or resolution failure per second.
· Average Task Processing Time Milliseconds—Average processing time for valid tasks.
Endpoint Cache
The Endpoint Cache area contains the following field:
· Active Registered Endpoints—Number of active Lync clients connected to the Lync server.
SIP Peers
The SIP Peers area contains the following fields:
· Connections Active—Number of active connections on the current
server. Click the Set Threshold icon ![]() to set alarm
thresholds for active connections.
to set alarm
thresholds for active connections.
· Sends Out Standing—Total number of messages waiting to be sent in the sending queue on the current server.
SIP Protocol
The SIP Protocol area contains the following field:
· Messages in Server—Number of messages that are being processed by the Lync Server 2010 application.
A/V MCU Information
The A/V MCU Information area contains the following fields:
· Total MRAS Request—Total number of MRAS requests received by the Lync Server 2010 application.
· Total MRAS Request Error—Total number of error MRAS requests received by the Lync Server 2010 application.
· Total MRAS Request Rejected—Total number of MRAS requests rejected by the Lync Server 2010 application.
· Total MRAS Time Out Exceptions—Total number of MRAS exceptions due to timeout.
· Total MRAS Failure Response Exceptions—Total number of MRAS exceptions due to response failure.
· Total MRAS Real Time Exceptions—Total number of realtime MRAS exceptions.
· Total MRAS Generic Exceptions—Total number of general MRAS exceptions.
MEDIA Planning
The MEDIA Planning area contains the following field:
· Occasions Conference Processing Delayed—Number of conference processes that need to be delayed.
SipEps Connections
The SipEps Connections area contains the following field:
· Number of DNS Resolution Failures—Number of domain name resolution failures.
Update Endpoint SPROC
The Update Endpoint SPROC area contains the following field:
· SPROC Calls Per Second—Times that the RtcUpdateEndpoint storage process is called per second.
Get Presence SPROC
The Get Presence SPROC area contains the following field:
· SPROC Calls Per Second—Times that the RtcGetPresence storage process is called per second.
Pool Conference Statistics
The Pool Conference Statistics area contains the following fields:
· Conference Count—Number of conferences in the conference pool.
· Active Conference Count—Number of active conferences in the conference pool.
· Active Participant Count—Number of valid participants for all conferences in the conference pool.
· Active Focus Endpoint Count—Number of valid terminals for all conferences in the conference pool.
· Active MCU Session Count—Number of valid MCU sessions.
WEB Address Book Web Query
The WEB Address Book Web Query area contains the following fields:
· Successful Query Requests Per Second—Number of successful query requests per second when the Lync user queries the address book through Web.
· Failed Query Requests Per Second—Number of query request failures per second when the Lync user queries the address book through Web.
WEB Distribution List Expansion
The WEB Distribution List Expansion area contains the following fields:
· Valid User Requests Per Second—Number of successful query requests per second when the Lync user queries the address book through Web.
· Timed Out Active Directory Requests Per Second—Number of query request failures per second when the Lync user queries the address book through Web.
· Timed Out Requests Fetching Member Properties Per Second—Number of expired requests for obtaining member attribute per second.
· Soap Exceptions Per Second—Number of SOAP exceptions generated per second.
Archiving Agent MSMQ
The Archiving Agent MSMQ area contains the following fields:
· Archiving Messages Per Second—Number of messages obtained by the archiving queue per second.
· Archiving Message Bytes Per Second—Bytes of messages obtained by the archiving queue per second.
· Call Details Recording Messages Per Second—Number of call messages recorded by the CDR queue per second.
· Call Details Recording Message Bytes Per Second—Bytes of call messages recorded by the CDR queue per second.
Join Launcher Service
The Join Launcher Service area contains the following fields:
· Incoming Join Requests—Number of requests for joining conference.
· Join Failures—Number of failed connections for joining conference.
· Join Successes—Number of successful connections for joining conference.
· Join Failures Due To Base URL Lookup Failure in SQUID—Number of connection failures resulted from the failure to search the URL library in SQUID.
· Join Failures Due To Look Up User Failure—Number of connection failures resulted from the failure to search users.
MCU Factory
The MCU Factory area contains the following fields:
· Total Get MCU Requests Received—Number of GetMCU requests received by the Lync Server 2010 application.
· Total Get MCU Requests Failed—Number of invalid GetMCU requests received by the Lync Server 2010 application.
· Total Empty Get MCU Responses—Number of empty GetMCU requests received by the Lync Server 2010 application.
· Get MCU Requests Received Per Second—Number of GetMCU requests received by the Lync Server 2010 application per second.
· Total Health Notifications Received—Total number of health status notifications received by the Lync Server 2010 application.
· Total Health Notifications Failed—Total number of invalid health status notifications received by the Lync Server 2010 application.
· Health Notifications Received Per Second—Number of health status notifications received by the Lync Server 2010 application per second.
· Total Drain Requests Received—Total number of drain requests received by the Lync Server 2010 application.
Rich Presence Subscribe SQL Calls
The Rich Presence Subscribe SQL Calls area contains the following fields:
· Rtc BatchSubscribeCategoryList SPROC Calls Per Second—Times that the RtcBatchSubscribeCategoryList storage process is called per second.
· Rtc Subscribe Self SPROC Calls Per Second—Times that the RtcSubscribeSelf storage process is called per second.
· Rtc Batch Query Categories SPROC Calls Per Second—Times that the RtcBatchQueryCategories storage process is called per second.
Rich Presence Service SQL Calls
The Rich Presence Service SQL Calls area contains the following field:
· Rtc Publish Multi-Category SPROC Calls Per Second—Times that the RtcPublishMutipleCategories storage process is called per second.
Response Group Service Hosting
The Response Group Service Hosting area contains the following field:
· Total Incoming Calls Declined for Match Marking Failure—Number of incoming calls declined due to the service matching failure of the requests.
CAA Planning
The CAA Planning area contains the following fields:
· Total Incomplete Calls—Total number of incomplete calls that are sent to the conference assistant.
· Current Calls—Number of calls that are sent to the
conference assistant. Click the History Record icon
![]() to view the history graph of current calls.
to view the history graph of current calls.
· Total Calls Failed To Transfer To The Conference—Total number of calls that failed to be transferred to the conference by the conference assistant.
· Total Band Width Failures—Total number of failed calls due to the bandwidth problem.
· Total Calls With Three Conference ID Input Errors—Number of calls for which the conference assistant receives three incorrect conference IDs.
· Total Application Endpoint Creation Failures—Total number of application endpoints that failed to be created.
· Total Application Endpoint Termination Failures—Total number of application endpoints that failed to be terminated.
· Number of Times Retry Logic Was Triggered—Times that the conference assistant triggers the retry logic called by the UCMA.
· Number of Times Retry Logic Was Successful—Times that the conference assistant triggers and successfully executes the retry logic called by the UCMA.
AS MCU Health And Performance
The AS MCU Health And Performance area contains the following field:
· Health Status—Health state of the AS MCU.
AS MCU Conferences
The AS MCU Conferences area contains the following fields:
· Active Conferences—Number of active conferences.
· Active Transcoders—Number of active transcoders.
· Active Data Channels—Number of active media connections.
· Connected Users—Number of AS MCU users.
¡ Click
the Set Threshold icon ![]() to set alarm thresholds for connected users.
to set alarm thresholds for connected users.
¡ Click
the History Record icon ![]() to view the history graph of connected users.
to view the history graph of connected users.
· Active Ajax Viewers—Number of active Ajax viewers.
· Media Time Out Failures—Number of media timeouts in the AS MCU.
· Packet Loss Failure—Number of packet losses in the AS MCU.
· Sip Dialog Failures—Number of SIP session errors in the AS MCU.
· Rdp Connection Time Out Failures—Number of RDP connection timeouts in the AS MCU.
Response Call Control
The Response Call Control area contains the following fields:
· Total Incoming Calls
Declined for Memory Pressure—Number of incoming calls declined due to insufficient system memory
from the startup of the Lync Server 2010 application to the most recent polling
operation. Click the Set Threshold icon ![]() to set alarm
thresholds for incoming calls declined due to
insufficient system memory.
to set alarm
thresholds for incoming calls declined due to
insufficient system memory.
· Total Incoming Calls Declined for High Number of Active Calls—Number of incoming calls declined due excessive active calls from the startup of the Lync Server 2010 application to the most recent polling operation.
Response Match Making
The Response Match Making area contains the following field:
· Current Number of Calls—Number of calls that are being processed by the response group service.
Response Work Flow
The Response Work Flow area contains the following field:
· Calls That Failed Due To Critical Server Errors—Number of call failures caused by server error.
CAA Operations
The CAA Operations area contains the following field:
· In Complete Calls Per Second—Number of incomplete calls that are sent to the conference assistant per second.
SIP Responses
The SIP Responses area contains the following fields:
· Local 500 Responses Per Second—Number of 500 responses received by the Lync Server 2010 application per second.
· Local 503 Responses Per Second—Number of 503 responses received by the Lync Server 2010 application per second.
SIP Load Management
The SIP Load Management area contains the following fields:
· Incoming Messages Timed Out—Number of incoming messages whose maximum tracing time is exceeded on the Lync Server 2010 application.
· Address Space Usage—Percentage of available address space that is being used by the Lync Server 2010 application.
SIP Access Edge Server Connections
The SIP Access Edge Server Connections area contains the following field:
· Rejected External Edge
Client Connections Per Second—Number of client connections rejected due to remote access denial on
the external edge per second. Click the Set Threshold
icon ![]() to set
alarm thresholds for client connections rejected due to
remote access denial on the external edge per second.
to set
alarm thresholds for client connections rejected due to
remote access denial on the external edge per second.
SIP Access Edge Server Message
The SIP Access Edge Server Message area contains the following fields:
· Messages Per Second Dropped Due To Unknown Domain—Number of messages that failed to be routed because the message domain is not configured and the messages are not the alliance partners.
· External Messages Per Second Dropped for Unresolved Domain—Number of messages discarded on the external edge due to domain resolution failure.
Lync Server 2013
Lync 2013 is a C/S model communication application offered by Microsoft. Lync 2013 contains the client Lync 2013 and the server Lync Server 2013. APM supports monitoring Lync Server 2013 through WMI.
Adding a Lync Server 2013 application monitor
APM can locally or remotely monitor Lync Server 2013 applications through WMI. When you add a Lync Server 2013 application monitor, follow these restrictions and guidelines:
· Configure and enable WMI on the hosts where Lync Server 2013 is deployed. For more information about enabling WMI on Windows, see Windows Server online help.
· To locally monitor Lync Server 2013 applications, install agents on the hosts where Lync Server 2013 applications are deployed. For more information about installing agents, see "APM agent management."
· To remotely monitor Lync Server 2013 applications, obtain the username and password of the authorized Windows host administrator. The username and password are required for adding the application monitor.
· Add Lync Server 2013 hosts to the IMC platform so that APM can obtain and display network connections of the hosts and their access devices in the application topology. For more information about adding hosts to the IMC platform, see H3C Intelligent Management Center v7.3 Enterprise and Standard Platform Administrator Guide.
· To view traffic statistics in the monitor report of the Lync Server 2013 application, make sure at least one probe is configured in APM. After a Lync Server 2013 application monitor is added, APM sends the IP address and service port of the monitored Lync Server 2013 to the probes for traffic collection.
To add a Lync Server 2013 application monitor:
1. Click the Resource tab.
2. Open the Add Application page by using one of the following methods:
¡ From the navigation tree, select Application Manager > Add Application.
¡ From the navigation tree, select Application Manager > Application Monitor. In the application monitor list, click Add.
The Add Application page displays all application types that can be monitored by APM.
3. Click Lync Server 2013 of the Application Server class.
The page for adding a Lync Server 2013 application monitor opens.
4. Configure the following parameters:
¡ IP Address—Enter the IP address of the host on which the Lync Server 2013 application to be monitored is installed. APM automatically checks the specified IP address and associates the application monitor with the host managed in the IMC platform. If the host is already added to the IMC platform, you can also click Select, and then select the host in the Select Devices dialog box. For information about selecting a host, see "Quick start."
¡ Name—Enter a unique application monitor name. As a best practice, name the application monitor as application type_host IP address.
¡ Use Template—Select Enable or Disable from the list.
¡ Template—Click
the Configure icon ![]() next to the Template field to select an existing template. The Template field
is automatically populated with the name of the selected template. For more
information about configuring application templates, see "Configuration management." This field is displayed only when you select Enable from the Use
Template list.
next to the Template field to select an existing template. The Template field
is automatically populated with the name of the selected template. For more
information about configuring application templates, see "Configuration management." This field is displayed only when you select Enable from the Use
Template list.
¡ Description—Enter a description for the application monitor.
¡ Traffic Collection Port—Enter the traffic collection port number for Lync Server 2013. This field is displayed only when at least one probe is configured for APM and is available only when you select Disable from the Use Template list.
¡ Polling Interval (min)—Select a polling interval for the application monitor. Options are 1, 2, 3, 4, 5, 10, 20, and 30. The default polling interval is 5 minutes. A shorter polling interval improves real-time data accuracy at the expense of system resources. This field is available only when you select Disable from the Use Template list.
¡ Username/Password—Enter the username and password of the Windows system administrator. The fields are available only when you select Disable from the Use Template list.
¡ Contact—Enter the contact information, such as the name, email address, and telephone number. The default is the username of the operator who created the application monitor. This field is available only when you select Disable from the Use Template list.
¡ Select the following Lync Server 2013 services to be monitored:
- Lync Server Front-End
- Lync Server Application Sharing
- Lync Server Archiving
- Lync Online Telephony Conferencing
- Lync Server Audio/Video Authentication
- Lync Server Audio/Video Conferencing
- Lync Server Audio/Video Edge
- Lync Server Conferencing Announcement
- Lync Server Call Detail Recording
- Lync Server Call Park
- Lync Server File Transfer Agent
- Lync Server Master Replicator Agent
- Lync Server Conferencing Attendant
- Lync Server Data Conferencing
- Lync Server IM Conferencing
- Lync Server Mediation
- Lync Server Bandwidth Policy Service
- Lync Online Provisioning Service
- Lync Server QoE Monitoring Service
- Lync Server Replica Replicator Agent
- Lync Server Response Group
- Lync Server Web Conferencing Edge
- World Wide Web Publishing Service
¡ APM Server—Select an APM server to monitor the application. The options are in server-address (application-type:n/N) format. The letter n indicates the number of Lync Server 2013 applications monitored on the APM server. The letter N indicates the total number of applications monitored on the APM server. Server address 127.0.0.1 indicates that APM and the IMC platform are deployed on the same server.
¡ Related Applications—Click Add next to this field. On the Select Application window, enter a partial or complete name to filter applications, select the applications that Lync Server 2013 depends on, and then click OK.
Operating system applications cannot be selected. Operators can view all dependencies of the application in the dependency topology. APM automatically adds the dependencies between Lync Server 2013 and operating system applications by IP address.
¡ Application Group—Specify an application group for the Lync Server 2013 application.
- To specify an existing application group, click Add, select an application group, and then click OK.
- To specify a new application group, click Add Application Group, configure the application group settings, and then click OK.
¡ Detect Application—Select this parameter if you want to enable application detection. APM verifies the application connectivity by using the previous parameter settings, and adds the application monitor only when it can connect to the application. If you do not select this parameter, APM adds the application monitor without verifying the application connectivity.
5. Click OK.
Modifying a Lync Server 2013 application monitor
Authorized users can modify all parameters except the IP address and the APM server for a Lync Server 2013 application monitor. When the IP address of a monitored Lync Server 2013 application changes, operators must add a new application monitor for the host. However, the new application monitor cannot inherit the history data from the previous application monitor.
To modify a Lync Server 2013 application monitor:
1. Click the Resource tab.
2. From the navigation tree, select Application Manager > Application Monitor.
The application monitor list page displays all application monitors.
3. Click the Modify
icon ![]() for the Lync Server 2013 application monitor you want to modify.
for the Lync Server 2013 application monitor you want to modify.
The page for modifying the Lync Server 2013 application monitor opens.
4. Modify the parameters as needed, except the IP address and the APM server.
For more information about parameter settings, see "Adding a Lync Server 2013 application monitor."
5. Click OK.
Viewing the Lync Server 2013 application monitor report
After a Lync Server 2013 application monitor is added, APM collects application index data, evaluates the availability and health status, and updates the monitor report. The report shows the index values obtained from the most recent polling of the application.
To access the Lync Server 2013 application monitor report:
1. Click the Resource tab.
2. From the navigation tree, select Application Manager > Application Monitor.
The application monitor list page displays all application monitors.
3. Click the name of a Lync Server 2013 application monitor to display the report.
Figure 82 shows part of a Lync Server 2013 monitor report.
Figure 82 Part of a Lync Server 2013 application monitor report

Monitor Information
The Monitor Information area contains the following fields:
· Name—Application monitor name.
· Health Status—Health state of the Lync Server 2013 application.
· IP Address—IP address of the Lync Server 2013 host.
· Application Type—Type of the monitored application, which is always Lync 2013 Server.
· Last Polling Time—Time when APM last polled the Lync Server 2013 application.
· Relationship—Click the Relationship icon ![]() to view dependencies between the Lync Server
2013 application and other applications in a dependency
topology view. For more information
about dependency topologies, see "Topology and application group management."
to view dependencies between the Lync Server
2013 application and other applications in a dependency
topology view. For more information
about dependency topologies, see "Topology and application group management."
· Top5 Unrecovered Alarms—Latest five unrecovered alarms on the Lync Server 2013 application. This field is not displayed if no alarm was generated by the Lync Server 2013 application.
Availability Today
The Availability Today area contains the following fields:
· Current Availability—Availability of the Lync Server 2013 application.
¡ Click
the Weekly History icon ![]() to view the availability of the Lync Server
2013 application in the last 7 days.
to view the availability of the Lync Server
2013 application in the last 7 days.
¡ Click
the Monthly History icon ![]() to view the availability of the Lync Server
2013 application in the last 30 days.
to view the availability of the Lync Server
2013 application in the last 30 days.
· Available Time—Total amount of time that the Lync Server 2013 application was available after 00:00 today.
· Unavailable Time—Total amount of time that the Lync Server 2013 application was unavailable after 00:00 today.
· Inaccessible Time—Total amount of time that the Lync Server 2013 application was inaccessible after 00:00 today.
· Unmanaged Time—Total amount of time that the Lync Server 2013 application was unmanaged after 00:00 today.
The statistics collection started when the application monitor was added. An availability time field is not displayed if its value is 0.
CPU Usage Ratio
The CPU Usage Ratio area contains the following field:
· CPU Usage Ratio—CPU usage ratio of the OS on the Lync Server 2013 host.
¡ Click
the Set Threshold icon ![]() to set alarm thresholds for the CPU usage
ratio.
to set alarm thresholds for the CPU usage
ratio.
¡ Click the History Record icon ![]() to view the history
graph of the CPU usage ratio.
to view the history
graph of the CPU usage ratio.
Memory Usage Ratio
The Memory Usage Ratio area displays information about physical memory and swap memory.
The Memory Usage Ratio area contains the following fields:
· Physical Memory—Physical memory of the OS, which corresponds to the physical memory bar.
· Swap—Swap memory of the OS, which corresponds to a disk space.
· Total—Total amount of the physical or swap memory.
· In Use—Size of the physical or swap memory being used. Click the History Record icon ![]() to view the history
graph of the physical or swap memory being used.
to view the history
graph of the physical or swap memory being used.
· Usage Ratio—Physical or swap memory usage ratio. The usage ratio is calculated by using the formula: Usage ratio = Memory in use/Total memory x 100%.
¡ Click
the Set Threshold icon ![]() to set alarm thresholds for the physical or
swap memory.
to set alarm thresholds for the physical or
swap memory.
¡ Click
the History Record icon
![]() to view the history graph of the physical or swap memory usage.
to view the history graph of the physical or swap memory usage.
Ping Test
When the polling interval expires, APM pings the Lync Server 2013 host by sending up to three ICMP packets. When APM receives a response, it considers the ping test a success and records the response time. When APM receives no response after three tries, it considers the ping test a failure.
The Ping Test area contains the following fields:
· Response Time—Round trip response time of the Lync Server
2013 application in the last ping operation. Click the History Record icon ![]() to view the history
graph of the response time.
to view the history
graph of the response time.
· Packets Sent—Number of ICMP packets that are sent in the last ping operation. The
maximum value is 3. Click
the History Record icon ![]() to view the history graph of the sent packets.
to view the history graph of the sent packets.
· Packets Received—Number
of ICMP response packets that are received in the last ping operation. The value is 0 or 1. Click the History Record icon ![]() to view the history
graph of the received packets.
to view the history
graph of the received packets.
Mediation Server Health Indices
The Mediation Server Health Indices area contains the following field:
· Audio Buffer Hits Per
Second—Times that the audio
buffer is used per second. Click the Set Threshold icon ![]() to set
alarm thresholds for the audio buffer hits per second.
to set
alarm thresholds for the audio buffer hits per second.
Mediation Server Relay
The Mediation Server Relay area contains the following field:
· Number of Rx Audio Channels
Started—Total number of
Rx audio channels started by all components of the Lync Server 2013
application. Click the Set
Threshold icon ![]() to set
alarm thresholds for the number of Rx audio channels
started per second.
to set
alarm thresholds for the number of Rx audio channels
started per second.
USrv Server Aggregation
The USrv Server Aggregation area contains the following field:
· Number of Aggregation Requests Per Second—Number of aggregation requests received by the Lync Server 2013 application per second.
A/V MCU
The A/V MCU area contains the following fields:
· Number of Conferences—Number of conferences on the A/V conference
server. Click the History Record icon ![]() to view the history
graph for the number of conferences.
to view the history
graph for the number of conferences.
· Number of Users—Total number of users on the A/V conference server.
· Number of TrustedUsers—Total number of trusted users on the A/V
conference server. Click the Set
Threshold icon ![]() to set
alarm thresholds for the number of trusted users.
to set
alarm thresholds for the number of trusted users.
USrv Service
The USrv Service area contains the following field:
· MWI NOTIFYs Received Per Second—Total number of MWI notifications received by all users per second.
IM MCU Health and Performance
The IM MCU Health and Performance area contains the following field:
· MCU Health Status—Health state of the IM MCU.
Service
The Service area contains the following fields:
· Service Name—Original name of the Lync Server 2013 system service.
· Display Name—Alias name of the service, which is displayed on the Windows service console. Typically, the display name of a service is different from its service name. You can recognize the service function by its service name.
· State—State of the system service.
Process
By default, APM does not monitor any
processes, and the process list is empty. Click the Config icon ![]() to select the processes to be
monitored. APM collects CPU and memory usages for the selected processes.
to select the processes to be
monitored. APM collects CPU and memory usages for the selected processes.
The Process area contains the following fields:
· Process Name—Name of the process.
· CLI—Command line used to start the process.
· CPU Usage—CPU usage of the process.
¡ Click
the Set Threshold icon ![]() to set CPU usage alarm thresholds.
to set CPU usage alarm thresholds.
¡ Click
the History Record icon ![]() to view the CPU usage history graph.
to view the CPU usage history graph.
· Memory Usage—Memory usage of the process. Click the History
Record icon ![]() for the process to view the memory usage history
graph.
for the process to view the memory usage history
graph.
A/V Auth Requests
The A/V Auth Requests area contains the following fields:
· Credentials Issued Per Second—Number of credentials issued by the A/V identity authentication service per second.
· Bad Requests Received Per Second—Number of incorrect requests received by the A/V identity authentication service per second.
· Current Requests Serviced—Number of requests that are being processed by the A/V identity authentication service.
SIP Networking
The SIP Networking area contains the following field:
· Connections Refused for Server Overload—Number of user connections refused by the Lync Server 2013 application due to overload.
PDP TURN
The PDP TURN area contains the following fields:
· Active Client Connections—Number of active client connections.
· Client Authentication Time Out Failures Per Second—Number of clients that failed to be authenticated due to timeout per second.
· First Packet Time Outs Per Second—Number of sessions with the first packet timed out per second.
· Active Edge Connections—Number of active edge connections.
· Server Authentication Time Out Failures Per Second—Number of client connections that failed to be authenticated due to server timeout per second.
IM MCU Conferences
The IM MCU Conferences area contains the following fields:
· Active Conferences—Number of active conferences.
· Connected Users—Number of users connected to the IM MCU.
· Throttled Sip Connections—Number of SIP connections disconnected from
the IM MCU. Click the Set Threshold icon ![]() to set alarm
thresholds for disconnected SIP connections.
to set alarm
thresholds for disconnected SIP connections.
MCU Data Conferences
The MCU Data Conferences area contains the following fields:
· Blocked Files—Number of files blocked by the file transfer filter.
· Active Conferences—Number of active conferences.
· Number of Unhandled Application Exception—Number of application exceptions that have not been handled.
· Conference Workitems Load—Duration for processing tasks in the conference queue.
· Session Queues State—State of the session queue.
· Avg Time Queued in Data MCU for LDM—Average time that LDM messages wait in the data MCU queue.
· Total Data Archiving Events Recorded—Total number of data archiving event records.
QMS Agent QoE Monitor Server
The QMS Agent QoE Monitor Server area contains the following fields:
· Number of Metrics Reports Received Per Second—Number of QoE metrics reports sent by the QoE monitor agent per second.
· Number of Metrics Reports Accepted Per Second—Number of QoE metrics reports received by the QoE monitor agent per second.
· Number of Metrics Reports Rejected Per Second—Number of QoE metrics reports rejected by the QoE monitor agent per second.
· Number of Msg Queue Messages Sent Per Second—Number of MSMQ messages sent from the QoE monitor agent to the Lync monitor server per second.
· Number of Msg Queue Messages Unable to Be Sent—Number of MSMQ messages discarded by the QoE monitor agent per second because they failed to be sent to the Lync monitor server.
PDP Diagnostics
The PDP Diagnostics area contains the following fields:
· Messages Dropped Per Second—Number of messages discarded due to invalidity or resolution failure per second.
· Average Task Processing Time Milliseconds—Average processing time for valid tasks.
Endpoint Cache
The Endpoint Cache area contains the following field:
· Active Registered Endpoints—Number of active Lync clients connected to the Lync server.
SIP Peers
The SIP Peers area contains the following fields:
· Connections Active—Number of active connections on the current
server. Click the Set Threshold icon ![]() to set alarm
thresholds for active connections.
to set alarm
thresholds for active connections.
· Sends Out Standing—Total number of messages waiting to be sent in the sending queue on the current server.
SIP Protocol
The SIP Protocol area contains the following field:
· Messages in Server—Number of messages that are being processed by the Lync Server 2013 application.
A/V MCU Information
The A/V MCU Information area contains the following fields:
· Total MRAS Request—Total number of MRAS requests received by the Lync Server 2013 application.
· Total MRAS Request Error—Total number of error MRAS requests received by the Lync Server 2013 application.
· Total MRAS Request Rejected—Total number of MRAS requests rejected by the Lync Server 2013 application.
· Total MRAS Time Out Exceptions—Total number of MRAS exceptions due to timeout.
· Total MRAS Failure Response Exceptions—Total number of MRAS exceptions due to response failure.
· Total MRAS Real Time Exceptions—Total number of realtime MRAS exceptions.
· Total MRAS Generic Exceptions—Total number of general MRAS exceptions.
MEDIA Planning
The MEDIA Planning area contains the following field:
· Occasions Conference Processing Delayed—Number of conference processes that need to be delayed.
SipEps Connections
The SipEps Connections area contains the following field:
· Number of DNS Resolution Failures—Number of domain name resolution failures.
Update Endpoint SPROC
The Update Endpoint SPROC area contains the following field:
· SPROC Calls Per Second—Times that the RtcUpdateEndpoint storage process is called per second.
Get Presence SPROC
The Get Presence SPROC area contains the following field:
· SPROC Calls Per Second—Times that the RtcGetPresence storage process is called per second.
Pool Conference Statistics
The Pool Conference Statistics area contains the following fields:
· Conference Count—Number of conferences in the conference pool.
· Active Conference Count—Number of active conferences in the conference pool.
· Active Participant Count—Number of valid participants for all conferences in the conference pool.
· Active Focus Endpoint Count—Number of valid terminals for all conferences in the conference pool.
· Active MCU Session Count—Number of valid MCU sessions.
WEB Address Book Web Query
The WEB Address Book Web Query area contains the following fields:
· Successful Query Requests Per Second—Number of successful query requests per second when the Lync user queries the address book through Web.
· Failed Query Requests Per Second—Number of query request failures per second when the Lync user queries the address book through Web.
WEB Distribution List Expansion
The WEB Distribution List Expansion area contains the following fields:
· Valid User Requests Per Second—Number of successful query requests per second when the Lync user queries the address book through Web.
· Timed Out Active Directory Requests Per Second—Number of expired active directory requests per second when the Lync user queries the address book through Web.
· Timed Out Requests Fetching Member Properties Per Second—Number of query request failures per second when the Lync user queries the address book through Web.
· Soap Exceptions Per Second—Number of SOAP exceptions generated per second.
Archiving Agent MSMQ
The Archiving Agent MSMQ area contains the following fields:
· Archiving Messages Per Second—Number of messages obtained by the archiving queue per second.
· Archiving Message Bytes Per Second—Bytes of messages obtained by the archiving queue per second.
· Call Details Recording Messages Per Second—Number of call messages recorded by the CDR queue per second.
· Call Details Recording Message Bytes Per Second—Bytes of call messages recorded by the CDR queue per second.
Join Launcher Service
The Join Launcher Service area contains the following fields:
· Incoming Join Requests—Number of requests for joining conference.
· Join Failures—Number of failed connections for joining conference.
· Join Successes—Number of successful connections for joining conference.
· Join Failures Due To Base URL Lookup Failure in SQUID—Number of connection failures resulted from the failure to search the URL library in SQUID.
· Join Failures Due To Look Up User Failure—Number of connection failures resulted from the failure to search users.
MCU Factory
The MCU Factory area contains the following fields:
· Total Get MCU Requests Received—Number of GetMCU requests received by the Lync Server 2013 application.
· Total Get MCU Requests Failed—Number of invalid GetMCU requests received by the Lync Server 2013 application.
· Total Empty Get MCU Responses—Number of empty GetMCU requests received by the Lync Server 2013 application.
· Get MCU Requests Received Per Second—Number of GetMCU requests received by the Lync Server 2013 application per second.
· Total Health Notifications Received—Total number of health status notifications received by the Lync Server 2013 application.
· Total Health Notifications Failed—Total number of invalid health status notifications received by the Lync Server 2013 application.
· Health Notifications Received Per Second—Number of health status notifications received by the Lync Server 2013 application per second.
· Total Drain Requests Received—Total number of drain requests received by the Lync Server 2013 application.
Rich Presence Subscribe SQL Calls
The Rich Presence Subscribe SQL Calls area contains the following fields:
· Rtc BatchSubscribeCategoryList SPROC Calls Per Second—Times that the RtcBatchSubscribeCategoryList storage process is called per second.
· Rtc Subscribe Self SPROC Calls Per Second—Times that the RtcSubscribeSelf storage process is used per second.
· Rtc Batch Query Categories SPROC Calls Per Second—Times that the RtcBatchQueryCategories storage process is called per second.
Rich Presence Service SQL Calls
The Rich Presence Service SQL Calls area contains the following field:
· Rtc Publish Multi-Category SPROC Calls Per Second—Times that the RtcPublishMutipleCategories storage process is called per second.
Response Group Service Hosting
The Response Group Service Hosting area contains the following field:
· Total Incoming Calls Declined for Match Marking Failure—Number of incoming calls declined due to the service matching failure of the requests.
CAA Planning
The CAA Planning area contains the following fields:
· Total Incomplete Calls—Total number of incomplete calls that are sent to the conference assistant.
· Current Calls—Number of calls that are sent to the
conference assistant. Click the History Record icon
![]() to view the history graph of current calls.
to view the history graph of current calls.
· Total Calls Failed To Transfer To The Conference—Total number of calls that failed to be transferred to the conference by the conference assistant.
· Total Band Width Failures—Total number of failed calls due to the bandwidth problem.
· Total Calls With Three Conference ID Input Errors—Number of calls for which the conference assistant receives three incorrect conference IDs.
· Total Application Endpoint Creation Failures—Total number of application endpoints that failed to be created.
· Total Application Endpoint Termination Failures—Total number of application endpoints that failed to be terminated.
· Number of Times Retry Logic Was Triggered—Times that the conference assistant triggers the retry logic called by the UCMA.
· Number of Times Retry Logic Was Successful—Times that the conference assistant triggers and successfully executes the retry logic called by the UCMA.
AS MCU Health And Performance
The AS MCU Health And Performance area contains the following field:
· Health Status—Health state of the AS MCU.
AS MCU Conferences
The AS MCU Conferences area contains the following fields:
· Active Conferences—Number of active conferences.
· Active Transcoders—Number of active transcoders.
· Active Data Channels—Number of active media connections.
· Connected Users—Number of AS MCU users.
¡ Click
the Set Threshold icon ![]() to set alarm thresholds for connected users.
to set alarm thresholds for connected users.
¡ Click
the History Record icon ![]() to view the history graph of connected users.
to view the history graph of connected users.
· Active Ajax Viewers—Number of active Ajax viewers.
· Media Time Out Failures—Number of media timeouts generated in the AS MCU.
· Packet Loss Failure—Number of packet losses generated in the AS MCU.
· Sip Dialog Failures—Number of SIP session errors generated in the AS MCU.
· Rdp Connection Time Out Failures—Number of RDP connection timeouts generated in the AS MCU.
Response Call Control
The Response Call Control area contains the following fields:
· Total Incoming Calls
Declined for Memory Pressure—Number of incoming calls declined due to insufficient system memory
from the startup of the Lync Server 2013 application to the most recent polling
operation. Click the Set Threshold icon ![]() to set alarm
thresholds for incoming calls declined due to
insufficient system memory.
to set alarm
thresholds for incoming calls declined due to
insufficient system memory.
· Total Incoming Calls Declined for High Number of Active Calls—Number of incoming calls declined due to excessive active calls from the startup of the Lync Server 2013 application to the most recent polling operation.
Response Match Making
The Response Match Making area contains the following field:
· Current Number of Calls—Number of calls that are being processed by the response group service.
Response Work Flow
The Response Work Flow area contains the following field:
· Calls That Failed Due To Critical Server Errors—Number of call failures caused by server error.
CAA Operations
The CAA Operations area contains the following field:
· In Complete Calls Per Second—Number of incomplete calls that are sent to the conference assistant per second.
SIP Responses
The SIP Responses area contains the following fields:
· Local 500 Responses Per Second—Number of 500 responses received by the Lync Server 2013 application per second.
· Local 503 Responses Per Second—Number of 503 responses received by the Lync Server 2013 application per second.
SIP Load Management
The SIP Load Management area contains the following fields:
· Incoming Messages Timed Out—Number of incoming messages whose maximum tracing time is exceeded on the Lync Server 2013 application.
· Address Space Usage—Percentage of available address space that is being used by the Lync Server 2013 application.
SIP Access Edge Server Connections
The SIP Access Edge Server Connections area contains the following field:
· Rejected External Edge
Client Connections Per Second—Number of client connections rejected due to remote access denial on
the external edge per second. Click the Set Threshold
icon ![]() to set
alarm thresholds for client connections rejected due to
remote access denial on the external edge per second.
to set
alarm thresholds for client connections rejected due to
remote access denial on the external edge per second.
SIP Access Edge Server Message
The SIP Access Edge Server Message area contains the following fields:
· Messages Per Second Dropped Due To Unknown Domain—Number of messages that failed to be routed because the message domain is not configured and the messages are not the alliance partners.
· External Messages Per Second Dropped for Unresolved Domain—Number of messages discarded on the external edge due to domain resolution failure.
Oracle Application Server
The Oracle Application Server (Oracle OS for short) forms part of Oracle Corporation's Fusion Middleware portfolio and supports various programming languages, APIs, and frameworks.
Configuring the Oracle AS
APM monitors the Oracle AS through the Dynamic Monitoring Service (DMS) provided by the Oracle AS. For this reason, the DMS must be made accessible to the APM server. To enable the access, complete the following tasks:
1. Modify the DMS configuration file by changing the entries with the value <IMC IP> in the following text to IP address of the APM server:
# proxy to DMS AggreSpy
Redirect /dms0/AggreSpy http:// <IMC IP>:7200/dmsoc4j/AggreSpy
# DMS VirtualHost for access and logging control
Listen <IMC IP>:7200
OpmnHostPort http://<IMC IP>:7200
<VirtualHost <IMC IP>:7200>>
ServerName <IMC IP>
TransferLog "\\.\NUL"
The configuration file is located at %ORACLE_HOME%\Apache\Apache\conf\dms.conf on Windows operating systems, or $ORACLE_HOME/Apache/Apache/conf/dms.conf on Linux operating systems.
2. Save the modified configuration file and then restart the Oracle AS.
|
|
NOTE: You can check whether the Oracle Application Server is correctly configured to support APM access by connecting to the URL http://<Oracle AS IP>:<Port>/dmsoc4j/AggreSpy from the browser of the APM server. |
Adding an Oracle AS application monitor
APM can only remotely monitor Oracle AS applications. When you add Oracle AS application monitors, follow these guidelines:
· Configure the Oracle AS. For more information, see "Configuring the Oracle AS."
· Add Oracle AS server hosts to the IMC platform so that APM can obtain and display network connections of the hosts and their access devices in the application topology. For more information about adding hosts to the IMC platform, see H3C Intelligent Management Center v7.3 Enterprise and Standard Platform Administrator Guide.
· To view traffic statistics in the monitor report of the Oracle AS application, make sure at least one probe is configured in APM. After an Oracle AS application monitor is added, APM sends the IP address and service port of the monitored Oracle AS application to the probes for traffic collection.
To add an Oracle AS application monitor:
1. Click the Resource tab.
2. Open the Add Application page by using one of the following methods:
¡ From the navigation tree, select Application Manager > Add Application.
The page displays all application types that can be monitored by APM.
¡ From the navigation tree, select Application Manager > Application Monitor, and then click Add on the application monitor list page.
3. Click Oracle AS of the Application Server Monitor class.
The page for adding an Oracle AS application monitor opens.
4. Configure the following parameters:
¡ IP Address—Enter the IP address of the host on which the Oracle AS application to be monitored is installed. APM automatically checks the IP address and associates the application monitor with the host managed in the IMC platform. If the host is already added to the IMC platform, you can also click Select, and then select the host in the Select Devices window. For information about selecting a host, see "Quick start."
¡ Name—Enter a unique application monitor name. As a best practice, name the application monitor as application type_host IP address.
¡ Use Template—Select Enable or Disable from the list.
¡ Template—Click
the Configure icon ![]() next to the Template field to select an existing
template. The Template field is automatically populated with the name of the selected
template. For more information about configuring application templates, see
"Configuration management." This field is displayed only when you select Enable from the Use Template list.
next to the Template field to select an existing
template. The Template field is automatically populated with the name of the selected
template. For more information about configuring application templates, see
"Configuration management." This field is displayed only when you select Enable from the Use Template list.
¡ Description—Enter a description for the application monitor.
¡ Application Monitor Port—Enter the service port number for the Oracle AS application, TCP 8888 by default. This field is available only when you select Disable from the Use Template list.
¡ Traffic Collection Port—Enter the service port number for Oracle AS. This field is displayed only when at least one probe is configured for APM and you select Disable from the Use Template list.
¡ Polling Interval (min)—Select a polling interval for the application monitor. Available options are 1, 2, 3, 4, 5, 10, 20, and 30. The default polling interval is 5 minutes. A shorter polling interval improves real-time data accuracy at the expense of system resources. This field is available only when you select Disable from the Use Template list.
¡ Contact—Enter the contact information, such as the name, email address, and telephone number. The default is the username of the operator who created the application monitor. This field is available only when you select Disable from the Use Template list.
¡ APM Server—Select an APM server to monitor the application. The options are in server-address (application-type:n/N) format. The letter n indicates the number of Oracle AS applications monitored on the APM server. The letter N indicates the total number of applications monitored on the APM server. Server address 127.0.0.1 indicates that APM and the IMC platform are deployed on the same server.
¡ Related Applications—Click Add next to this field. On the Select Application window, enter a partial or complete name to filter applications, select the applications that Oracle AS depends on, and then click OK.
Operating system applications cannot be selected. Operators can view all dependencies of the application in the dependency topology. APM automatically adds the dependencies between Oracle AS and operating system applications by IP address and displays their dependencies in the application topology.
¡ Application Group—Specify an application group for the Oracle AS application.
- To specify an existing application group, click Add, select an application group, and then click OK.
- To specify a new application group, click Add Application Group, configure the application group settings, and then click OK.
¡ Detect Application—Select this parameter if you want to enable application detection. Application detection enables APM to verify connection to the application by using the previous parameter settings, and to determine whether to add the application monitor based on the verification result. APM adds the application monitor only when it can connect to the application. When this parameter is not specified, APM adds the application monitor without verifying the connection.
5. Click OK.
Modifying an Oracle AS application monitor
Authorized users can modify all parameters except the IP address and the APM server for an Oracle AS application monitor. When the IP address of a monitored Oracle AS host changes, operators must add a new application monitor for the host. The new application monitor cannot inherit the history data from the previous application monitor.
To modify an Oracle AS application monitor:
1. Click the Resource tab.
2. From the navigation tree, select Application Manager > Application Monitor.
The application monitor list page opens.
3. Click the Modify icon![]() for the Oracle AS server application monitor you
want to modify.
for the Oracle AS server application monitor you
want to modify.
The page for modifying the Oracle AS server application monitor opens.
4. Modify the parameters as needed, except the IP address and the APM server.
For more information about parameter settings, see "Adding an Oracle AS application monitor."
5. Click OK.
Viewing the Oracle AS application monitor report
After an Oracle AS application monitor is added, APM collects index data of the application, evaluates the availability and health status, and updates the monitor report. The report shows the index values obtained from the most recent polling of the application.
To view the Oracle AS server application monitor report:
1. Click the Resource tab.
2. From the navigation tree, select Application Manager > Application Monitor.
The application monitor list page displays all application monitors.
3. Click the name of an Oracle AS application monitor to display the report.
Figure 83 shows part of an Oracle AS server application monitor report.
Figure 83 Part of an Oracle AS application monitor report
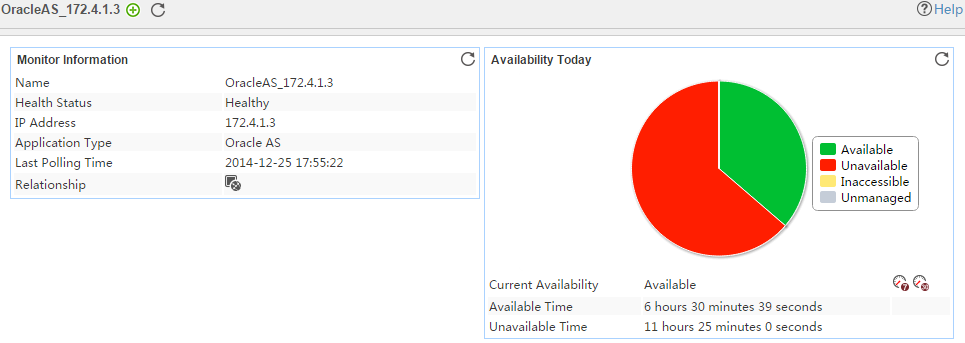
Monitor Information
The Monitor Information area contains the following fields:
· Name—Application monitor name.
· Health Status—Health status of the Oracle AS application.
· IP Address—IP address of the Oracle AS application host.
· Application Type—Type of the monitored application, which is always Oracle AS.
· Last Polling Time—Time when APM last polled the Oracle AS application.
· Relationship—Click the Relationship
icon ![]() to view dependencies
between applications in a dependency topology view. For
more information about dependency topologies, see "Topology and application group management."
to view dependencies
between applications in a dependency topology view. For
more information about dependency topologies, see "Topology and application group management."
· Top5 Unrecovered Alarm—Latest five unrecovered alarms on the Oracle AS application. This field is not displayed if no alarm is generated by the Oracle AS application.
Availability Today
The Availability Today area contains the following fields:
· Current Availability—Availability of the Oracle AS application.
¡ Click
the Weekly History icon![]() to view the availability of the Oracle AS
application in the last 7 days.
to view the availability of the Oracle AS
application in the last 7 days.
¡ Click
the Monthly History icon![]() to view the availability of the Oracle AS
application in the last 30 days.
to view the availability of the Oracle AS
application in the last 30 days.
· Available Time—Total amount of time that the Oracle AS application was available after 00:00 today.
· Unavailable Time—Total amount of time that the Oracle AS application was unavailable after 00:00 today.
· Inaccessible Time—Total amount of time that the Oracle AS application was inaccessible after 00:00 today.
· Unmanaged Time—Total amount of time that the Oracle AS application was unmanaged after 00:00 today.
The statistics collection started when the application monitor was added. An availability time field is not displayed if its value is 0.
Response Time
The Response Time area contains the following field:
· Response Time—Round-trip response time of the Oracle AS application.
¡ Click
the Set Threshold icon ![]() to set alarm thresholds for the server
response time.
to set alarm thresholds for the server
response time.
¡ Click the History Record icon ![]() to view the history graph of the response
time trend of the Oracle AS application.
to view the history graph of the response
time trend of the Oracle AS application.
OPMN Memory Details
The Oracle Process Manager and Notification Server (OPMN) is responsible for starting, stopping, and managing all the processes running on the Oracle Application Server.
The OPMN Memory Details area contains the following fields:
· Memory Used Percent—Percentage
of the used memory. The OPMN memory
usage is equal to the used memory divided by the total physical memory and multiplied
by 100%. Click the History Record icon ![]() to view the history graph of the memory usage.
to view the history graph of the memory usage.
· Memory Used—Size of the memory used by the OPMN l.
Click the History Record icon ![]() to view the history graph of the used memory.
to view the history graph of the used memory.
· Total Physical Memory—Total physical memory of the host where the Oracle AS application
resides. Click the History Record icon ![]() to view the history graph of the total physical memory.
to view the history graph of the total physical memory.
Application Traffic
APM collects the traffic statistics of the Oracle AS application based on the IP address and port number of Oracle AS application host. The Application Traffic area contains the following fields:
· Last Hour's Traffic—Total traffic sent and received by the Oracle AS application over the last 1 hour.
· Today's Traffic—Total traffic sent and received by the Oracle AS application since 00:00 today.
JVM Details
APM monitors the performance of the Java virtual machine (JVM) in which the Oracle AS application is running.
The JVM Details area contains the following fields:
· Name—Name of the JVM.
· Active Threads—Number of active threads of JVM. Click the History
Record icon ![]() to view the changes of the number of active threads of JVM in a line graph.
to view the changes of the number of active threads of JVM in a line graph.
· CPU Usage—CPU usage of the JVM. Click the Set Threshold
icon ![]() to set alarm thresholds for the CPU usage
of JVM.
to set alarm thresholds for the CPU usage
of JVM.
· Heap Usage—Heap memory usage of JVM.
· JDBC Connections—Total number of open JDBC connections.
· Memory Usage—Physical memory used by the JVM.
· Active Sessions—Number of active sessions.
· Active Transactions—Number of active transactions.
· Start Time—Time when JVM last rebooted.
Web Application Details
The Web Application Details area contains the following fields:
· Module Name—Module name of the Web application.
· Application Name—Name of the Web application.
· OC4J Instance Name—Name of the OC4J instance to which the Web application is deployed.
· Requests Per Second—Number of requests per second received by the Web application.
· Requests Completed—Total number of requests processed by the Web application since the Oracle AS application started to the last polling interval.
· Active Requests—Number of active requests for the Web application.
· Processing Time—Average time taken by the Web application to process the requests since the Oracle AS application started to the last polling interval.
· Active Sessions—Number of active sessions in the Web application.
· More—Click More to view all the Web applications deployed on the Oracle AS application in a separate window.
EJB Details
APM monitors all the EJBs (Enterprise JavaBeans) running on the Oracle AS application, including stateful beans, stateless beans, and message-driven beans. The EJB Details area contains the following fields:
· EJB Name—Name of the EJB.
· EAR Name—Name of the EAR file that the EJB is packaged in.
· Process—Source process of the EJB.
· Type—Type of the EJB, which can be Stateful, Stateless, or Message.
· Pooled Instances—Total number of instances in Pooled state.
· Ready Instances—Total number of instances in Ready state.
· Passive Instances—Total number of instances in Passive state.
WebLogic server
The WebLogic server is a J2EE complaint application server used to develop, integrate, deploy, and manage large scale, distributed Web applications, network applications, and database applications.
Copying Weblogic API files to the APM server
APM obtains monitor index data of Weblogic server applications through Weblogic APIs. To monitor Weblogic server applications, contact the Weblogic administrator to copy Weblogic API files to the APM server.
Copying Weblogic API files to the APM server (for Weblogic server 8.1)
APM can only remotely monitor Weblogic server 8.1.
To copy Weblogic API files to the APM server:
1. Log in to the Weblogic server operating system.
2. Locate the weblogic.jar and webservices.jar Weblogic API files.
Typically, the Weblogic API files are located in the \server\lib\ directory of the Weblogic installation path.
3. Copy the Weblogic API files to the \apmserver\bin\ directory of the IMC installation path.
4. Restart IMC.
Copying Weblogic API files to the APM server (for Weblogic server 9.x/10.x/11.x/12.x)
APM can locally or remotely monitor Weblogic 9.x/10.x/11.x/12.x.
To copy Weblogic API files to the APM server:
1. Log in to the Weblogic server operating system.
2. Open a Windows command window.
3. Enter the \server\lib\ directory of the Weblogic installation path.
4. Generate the wlfullclient.jar file by executing the following command:
java -jar ../../../modules/com.bea.core.jarbuilder_x.jar
5. Locate the weblogic.jar and wlfullclient.jar Weblogic API files.
Typically, the Weblogic API files are located in the \server\lib\ directory of the Weblogic installation path.
6. Perform one of the following tasks:
¡ To remotely monitor Weblogic applications, copy the Weblogic API files to the \apmserver\bin\weblogicOther\ directory of the IMC installation path.
¡ To locally monitor Weblogic applications, copy the Weblogic API files to the \apm_agent_main_win\bin\ directory of the agent installation path and restart the agent.
7. Restart IMC.
Adding a WebLogic server application monitor
When you add WebLogic server application monitors, follow these guidelines:
· To locally monitor Weblogic servers of the 8.1 version, copy the Weblogic API files to the APM server. For more information, see "Copying Weblogic API files to the APM server (for Weblogic server 8.1)."
· To locally or remotely monitor Weblogic servers of the 9.x, 10.x, 11.x, and 12.x versions, copy the Weblogic API files to the APM server. For more information, see "Copying Weblogic API files to the APM server (for Weblogic server 9.x/10.x/11.x/12.x)."
· To locally monitor Weblogic server applications, install agents on the Windows or Linux operating systems where Weblogic server applications are deployed. For more information about installing agents, see "APM agent management."
· Obtain the username and password of the user who has the Weblogic administrator's privileges so that APM can obtain monitor index data through Weblogic APIs from the WebLogic server.
· Add the WebLogic server hosts to the IMC platform so APM can obtain and display network connections of the hosts and their access devices in the application topology. For more information about adding hosts to the IMC platform, see H3C Intelligent Management Center v7.3 Enterprise and Standard Platform Administrator Guide.
· To view traffic statistics in the monitor report of the WebLogic server application, make sure at least one probe is configured in APM. After a WebLogic server application monitor is added, APM sends the IP address and service port of the monitored WebLogic server application to the probes for traffic collection.
To add a WebLogic server application monitor:
1. Click the Resource tab.
2. Open the Add Application page by using one of the following methods:
¡ From the navigation tree, select Application Manager > Add Application.
The page displays all application types that can be monitored by APM.
¡ From the navigation tree, select Application Manager > Application Monitor, and then click Add on the application monitor list page.
3. Click WebLogic server of the Application Server Monitor class.
The page for adding a WebLogic server application monitor opens.
4. Configure the following parameters:
¡ IP Address—Enter the IP address of the host on which the Weblogic server application to be monitored is installed. APM automatically checks the IP address and associates the application monitor with the host managed in the IMC platform. If the host is already added to the IMC platform, you can also click Select, and then select the host in the Select Devices window. For information about selecting a host, see "Quick start."
¡ Name—Enter a unique application monitor name. As a best practice, name the application monitor as application type_host IP address.
¡ Use Template—Select Enable or Disable from the list.
¡ Template—Click
the Configure icon ![]() next to the Template field to select an existing
template. The Template field is automatically populated with the name of the selected
template. For more information about configuring application templates, see
"Configuration management." This field is displayed only when you select Enable from the Use Template list.
next to the Template field to select an existing
template. The Template field is automatically populated with the name of the selected
template. For more information about configuring application templates, see
"Configuration management." This field is displayed only when you select Enable from the Use Template list.
¡ Description—Enter a description for the application monitor.
¡ Application Monitor Port—Enter the service port number for the Weblogic server application, TCP 7011 by default. This field is available only when you select Disable from the Use Template list.
¡ Traffic Collection Port—Enter the service port number for Weblogic server. This field is displayed only when at least one probe is configured for APM and you select Disable from the Use Template list.
¡ Polling Interval (min)—Select a polling interval for the application monitor. Available options are 1, 2, 3, 4, 5, 10, 20, and 30. The default polling interval is 5 minutes. A shorter polling interval improves real-time data accuracy at the expense of system resources. This field is available only when you select Disable from the Use Template list.
¡ Username/Password—Enter the username and password of the Weblogic administrator. The fields are available only when you select Disable from the Use Template list.
¡ Weblogic Version—Select a Weblogic server version. Options are 8.1 and 9.x/10.x/11.x/12.x.
¡ Contact—Enter the contact information, such as the name, email address, and telephone number. The default is the username of the operator who created the application monitor. This field is available only when you select Disable from the Use Template list.
¡ APM Server—Select an APM server to monitor the application. The options are in server-address (application-type:n/N) format. The letter n indicates the number of WebLogic server applications monitored on the APM server. The letter N indicates the total number of applications monitored on the APM server. Server address 127.0.0.1 indicates that APM and the IMC platform are deployed on the same server.
¡ Related Applications—Click Add next to this field. On the Select Application window, enter a partial or complete name to filter applications, select the applications that Weblogic server depends on, and then click OK.
Operating system applications cannot be selected. Operators can view all dependencies of the application in the dependency topology. APM automatically adds the dependencies between Weblogic server and operating system applications by IP address and displays their dependencies in the application topology.
¡ Application Group—Specify an application group for the WebLogic server application.
- To specify an existing application group, click Add, select an application group, and then click OK.
- To specify a new application group, click Add Application Group, configure the application group settings, and then click OK.
¡ Detect Application—Select this parameter if you want to enable application detection. Application detection enables APM to verify connection to the application by using the previous parameter settings, and to determine whether to add the application monitor based on the verification result. APM adds the application monitor only when it can connect to the application. When this parameter is not specified, APM adds the application monitor without verifying the connection.
5. Click OK.
Modifying a WebLogic server application monitor
Authorized users can modify all parameters except the IP address and the APM server for a Weblogic server application monitor. When the IP address of a monitored Weblogic host changes, operators must add a new application monitor for the host. However, the new application monitor cannot inherit the history data from the previous application monitor.
To modify a Weblogic server application monitor:
1. Click the Resource tab.
2. From the navigation tree, select Application Manager > Application Monitor.
The application monitor list page opens.
3. Click the Modify icon![]() for the Weblogic server application monitor you
want to modify.
for the Weblogic server application monitor you
want to modify.
The page for modifying the Weblogic server application monitor opens.
4. Modify the parameters as needed, except the IP address and the APM server.
For more information about parameter settings, see "Adding a WebLogic server application monitor."
5. Click OK.
Viewing the WebLogic server application monitor report
After a Weblogic server application monitor is added, APM collects index data of the application, evaluates the availability and health status, and updates the monitor report. The report shows the index values obtained from the most recent polling of the application.
To view the Weblogic server application monitor report:
1. Click the Resource tab.
2. From the navigation tree, select Application Manager > Application Monitor.
The application monitor list page displays all application monitors.
3. Click the name of a Weblogic server application monitor to display the report.
Figure 84 shows part of a Weblogic server application monitor report.
Figure 84 Part of a WebLogic server application monitor report

Monitor Information
The Monitor Information area contains the following fields:
· Name—Application monitor name.
· Health Status—Health status of the WebLogic server application.
· IP Address—IP address of the Weblogic server application host.
· Application Type—Type of the monitored application, which is always WebLogic Server.
· Version—Version of the WebLogic server.
· Last Polling Time—Time when APM last polled the WebLogic server application.
· Relationship—Click the Relationship
icon ![]() to view dependencies between applications in a dependency topology
view. For more information about dependency topologies,
see "Topology and
application group management"
to view dependencies between applications in a dependency topology
view. For more information about dependency topologies,
see "Topology and
application group management"
· Top5 Unrecovered Alarm—Latest five unrecovered alarms on the Weblogic server application. This field is not displayed if no alarm is generated by the Weblogic server application.
Availability Today
The Availability Today area contains the following fields:
· Current Availability—Availability of the Weblogic server application.
¡ Click
the Weekly History icon ![]() to
view the availability of the Weblogic server application in the last 7 days.
to
view the availability of the Weblogic server application in the last 7 days.
¡ Click
the Monthly History icon ![]() to view the
availability of the Weblogic server application in the last 30 days.
to view the
availability of the Weblogic server application in the last 30 days.
· Available Time—Total amount of time that the Weblogic server application was available after 00:00 today.
· Unavailable Time—Total amount of time that the Weblogic server application was unavailable after 00:00 today.
· Inaccessible Time—Total amount of time that the Weblogic server application was inaccessible after 00:00 today.
· Unmanaged Time—Total amount of time that the Weblogic server application was unmanaged after 00:00 today.
The statistics collection started when the application monitor was added. An availability time field is not displayed if its value is 0.
JVM Heap Memory Details
The correct operation of the Weblogic server application relies on the performance of the Java virtual machine (JVM) in which the server is running. The JVM Heap Memory Details area contains the following fields:
· Total Memory—Total heap memory size that JVM requested from the operating
system. Click the Set Threshold icon ![]() to set alarm thresholds for the
total memory.
to set alarm thresholds for the
total memory.
· Free Memory—Size of free memory
in the JVM heap. Click the Set Threshold icon ![]() to set alarm thresholds for the free memory.
to set alarm thresholds for the free memory.
· Used Memory—Size of used memory in the JVM heap.
· Max Memory—Maximum memory that JVM can request from the operating system.
· Percent—Memory usage of the JVM heap.
· Java Version—Java version of JVM.
Thread
The Thread area contains the following fields:
· Idle Count—Number of idle threads in the thread pool.
· Used Count—Number of threads being used in the thread pool.
· Total Count—Total number of threads in the thread pool.
· Request Threads—Total number of request threads in the thread queue. Click the Set Threshold icon ![]() to set alarm thresholds for the total
number of request threads in the thread queue.
to set alarm thresholds for the total
number of request threads in the thread queue.
· Active Execute Threads—Number of execute threads that are in active state.
· Hogging Threads—Number of threads that are being hogged in the thread pool.
Response Time
The Response Time area contains the following field:
· Response Time—Round-trip response time of the Weblogic server application.
¡ Click
the Set Threshold icon ![]() to set alarm
thresholds for the response time.
to set alarm
thresholds for the response time.
¡ Click the History Record icon ![]() to view the history graph of the response
time.
to view the history graph of the response
time.
Application Traffic
APM collects the traffic statistics of the Weblogic server application based on the IP address and port number of Weblogic server application host. The Application Traffic area contains the following fields:
· Last Hour's Traffic—Total traffic that is sent and received by the Weblogic server application over the last 1 hour.
· Today's Traffic—Total traffic that is sent and received by the Weblogic server application since 00:00 today.
Web Application Details
The Web Application Details area contains the following fields:
· Name—Name of the Web application.
· Current Session—Number of sessions that were accessing the Web application.
· Max. Session—Maximum number of sessions that can access the Web application.
· Session Pool—Maximum number of sessions that are allowed in the session pool.
· Session Timeout—Maximum time that a session can remain idle before the session is terminated.
Servlet Details
The Servlet Details area contains the following fields:
· Name—Name of the servlet.
· Invoke Count—Number of times that the servlet had been invoked since the Weblogic server application started.
· Average Duration—Average time that is taken by the servlet to respond to requests.
· Path—Path of the servlet.
· Servlet Capacity—Maximum capacity of the servlet in the single-thread mode.
JMS Details
The Java Message Service (JMS) enables asynchronous communication between two applications or within distributed systems. The JMS Details area contains the following fields:
· Current Connections of JMS Server—Current number of connections to the JMS server.
· Max. Connections of JMS Server—Maximum number of connections to the JMS server since the most recent reset.
· Total Connections of JMS Server—Total number of connections to the JMS server since the most recent reset.
· Current Connections of JMS Service—Current number of connections to the JMS service.
· Max. Connections of JMS Service—Maximum number of connections to the JMS service since the most recent reset.
· Total Connections of JMS Service—Total number of connections to the JMS service since the most recent reset.
JDBC Details
The JDBC Details area contains the following fields:
· Name—Name of the Weblogic server application that uses JDBC.
· JDBC—JDBC data source that is used by the Weblogic server application.
· State—Running status of JDBC.
· Current Active Connections—Number of JDBC connections that are used by the application.
· Leaked Connection—Number of JDBC connections that are used by the application but not returned to the JDBC data source after use.
· Failures To Reconnect—Failure attempts that the JDBC data source refreshes database connections.
· Prep Stmt Cache Access—Accumulated number of times that the cached Prepare Statements are accessed.
· Connections Total—Total number of database connections that are created by the JDBC data source since the JDBC data source is deployed.
· Current Capacity—Number of JDBC connections in the data source connection cache pool.
· Connection Delay—Average duration (in milliseconds) that the JDBC takes to create a physical connection.
· Highest Num Available—Highest number of database connections that were idle and available to be used by an application in this instance of the data source.
Cluster Details
The Cluster Details area contains the following fields:
· Name—Name of the Weblogic server in the cluster.
· State—Status of the Weblogic server in the cluster.
· Listen Address—IP address or DNS name on which the Weblogic server in the cluster is listening.
· Listen Port—Port on which the Weblogic server in the cluster is listening.
· Fragments Dropped—Number of multicast fragments that the Weblogic server in the cluster receives from an external cluster using the same multicast address.
· Received Count—Number of multicast fragments that the Weblogic server receives from the cluster.
· Sent Count—Number of multicast fragments that the Weblogic server sends to the cluster in the last polling interval.
· Multicast Messages Lost—Number of multicast messages that are sent to the Weblogic server in the cluster but are lost due to the server error.
· Resend Requests—Number of delta state messages that must be resent because the receiving Weblogic server in the cluster missed a message.
Cluster JVM
The Cluster JVM area contains the following fields:
· Name—Name of the Weblogic server in the cluster.
· Current Heap—Size of the JVM heap memory on the Weblogic server in the cluster.
· Current Free—Size of the free JVM heap memory on the Weblogic server in the cluster.
· Max—Maximum available size of the JVM heap memory on the Weblogic server in the cluster.
· Percent—Usage of the JVM heap memory on the Weblogic server.
· Java Version—Java version of JVM on the Weblogic server in the cluster.
Cluster Thread
The Cluster Thread area contains the following fields:
· Name—Name of the Weblogic server in the cluster.
· Completed Request—Number of threads that the Weblogic server has requested in the cluster.
· Idle—Number of threads that are in idle status on the Weblogic server in the cluster.
· Total—Total number of threads that are executed on the WebLogic server in the cluster.
· Active Execute Threads—Number of execute threads that are in active state on the Weblogic server in the cluster.
· Queue Length—Queue length of the Weblogic server in the cluster.
· Hogging Threads—Number of threads that are being hogged in the thread pool of the Weblogic server in the cluster.
Cluster Thread Detail
The Cluster Thread Detail area contains the following fields:
· Cluster—Name of the Weblogic server in the cluster.
· Thread Name—Name of the execute thread in the cluster.
· User—User on behalf of which the execute thread is currently working.
· Total Requests—Number of requests that have been processed by this queue.
· Hogger—Whether the thread is in hogger state. This field is not supported in WebLogic version 8.1.
¡ True—The execute thread is being hogged by a request for much more than the normal execution time, as automatically observed by the scheduler.
¡ False—The execute thread is being hogged by a request within the normal execution time, as automatically observed by the scheduler.
· Idle—Whether the thread is in idle state.
¡ True—The execute thread does not have any work assigned to it.
¡ False—The execute thread already has a work assigned to it.
· Standby—Whether the thread is in standby state. This field is not supported in WebLogic version 8.1.
¡ True—The execute thread is not a part of the active thread pool.
¡ False—The execute thread is a part of the active thread pool.
· Stuck—Whether the thread is in stuck state. This field is not supported in WebLogic version 8.1.
¡ True—The execute thread is stuck working on a request for more than the configured stuck thread maximum time.
¡ False—The execute thread is stuck working on a request within the configured stuck thread maximum time.
GlassFish server
The GlassFish server is an open source JaveEE5 compliant application server used to develop and deploy Java applications. APM supports monitoring GlassFish server applications through JMX.
Adding a GlassFish server application monitor
APM can locally or remotely monitor GlassFish servers through JMX. When you add a GlassFish server application monitor, follow these guidelines:
· To locally monitor GlassFish server applications, install agents on the hosts where GlassFish server applications are deployed. For more information about installing agents, see "APM agent management."
· APM obtains monitor index data of GlassFish server applications through the JMX interface. If the JMX interface of GlassFish applications requires authentication, obtain the authorized JMX username and password.
· Add GlassFish server hosts to the IMC platform so that APM can obtain and display network connections of the hosts and their access devices in the application topology. For more information about adding hosts to the IMC platform, see H3C Intelligent Management Center v7.3 Enterprise and Standard Platform Administrator Guide.
· To view traffic statistics in the monitor report of the GlassFish server application, make sure at least one probe is configured in APM. After a GlassFish server application monitor is added, APM sends the IP address and service port of the monitored GlassFish server application to the probes for traffic collection.
To add a GlassFish server application monitor:
1. Click the Resource tab.
2. Open the Add Application page by using one of the following methods:
¡ From the navigation tree, select Application Manager > Add Application.
The page displays all application types that can be monitored by APM.
¡ From the navigation tree, select Application Manager > Application Monitor, and then click Add on the application monitor list page.
3. Click GlassFish Server of the Application Server Monitor class.
The page for adding a GlassFish server application monitor opens.
4. Configure the following parameters:
¡ IP Address—Enter the IP address of the host on which the GlassFish server application to be monitored is installed. APM automatically checks the specified IP address and associates the application monitor with the host managed in the IMC platform. If the host is already added to the IMC platform, you can also click Select, and then select the host in the Select Devices dialog box. For information about selecting a host, see "Quick start."
¡ Name—Enter a unique application monitor name. As a best practice, name the application monitor as application type_host IP address.
¡ Use Template—Select Enable or Disable from the list.
¡ Template—Click
the Configure icon ![]() next to the Template field to select an existing template. The Template field
is automatically populated with the name of the selected template. For more
information about configuring application templates, see "Configuration management." This field is displayed only when you select Enable from the Use
Template list.
next to the Template field to select an existing template. The Template field
is automatically populated with the name of the selected template. For more
information about configuring application templates, see "Configuration management." This field is displayed only when you select Enable from the Use
Template list.
¡ Description—Enter a description for the application monitor.
¡ Application Monitor Port—Enter the service port number of the GlassFish server application. The default value is TCP-8686. This field is displayed only when you select Disable from the Use Template list.
¡ Traffic Collection Port—Enter the service port number of the GlassFish server application. This field is displayed only when at least one probe is configured for APM and is available only when you select Disable from the Use Template list.
¡ Polling Interval (min)—Select a polling interval for the application monitor. Options are 1, 2, 3, 4, 5, 10, 20, and 30. The default polling interval is 5 minutes. A shorter polling interval provides more accurate realtime data consumes more system resources. This field is available only when you select Disable from the Use Template list.
¡ Username/Password—Enter the username and password used for remote JMX access. The fields are available only when you select Disable from the Use Template list.
¡ Contact—Enter contact information, such as the name, email address, and telephone number. The default is the username of the operator who created the application monitor. This field is available only when you select Disable from the Use Template list.
¡ APM Server—Select an APM server to monitor the application. The options are in server-address (application-type:n/N) format. The letter n indicates the number of GlassFish server applications monitored on the APM server. The letter N indicates the total number of applications monitored on the APM server. Server address 127.0.0.1 indicates that APM and the IMC platform are deployed on the same server.
¡ Related Applications—Click Add next to this field. On the Select Application window, enter a partial or complete name to filter applications, select the applications that GlassFish server depends on, and then click OK.
Operating system applications cannot be selected. Operators can view all dependencies of the application in the dependency topology. APM automatically adds the dependencies between the GlassFish server and operating system applications by IP address and displays their dependencies in the application topology.
¡ Application Group—Specify an application group for the GlassFish server application.
- To specify an existing application group, click Add, select an application group, and then click OK.
- To specify a new application group, click Add Application Group, configure the application group settings, and then click OK.
¡ Detect Application—Select this parameter if you want to enable application detection. APM verifies the application connectivity by using the previous parameter settings, and adds the application monitor only when it can connect to the application. If you do not select this parameter, APM adds the application monitor without verifying application connectivity.
5. Click OK.
Modifying a GlassFish server application monitor
Authorized users can modify all parameters except the IP address and the APM server for a GlassFish server application monitor. When the IP address of the monitored GlassFish server host changes, operators must add a new application monitor for the host. However, the new application monitor cannot inherit the history data from the previous application monitor.
To modify a GlassFish server application monitor:
1. Click the Resource tab.
2. From the navigation tree, select Application Manager > Add Application.
The application monitor list displays all application monitors.
3. Click the Modify icon ![]() for the selected GlassFish server application
monitor.
for the selected GlassFish server application
monitor.
The page for modifying the GlassFish server application monitor opens.
4. Modify the parameters as needed, except the IP address and the APM server.
For more information about parameter settings, see "Adding a GlassFish server application monitor."
5. Click OK.
Viewing the GlassFish server application monitor report
After a GlassFish server application monitor is added, APM collects application index data, evaluates the availability and health status, and updates the monitor report. The report shows the index values obtained from the most recent polling of the application.
To access the GlassFish server application monitor report:
1. Click the Resource tab.
2. From the navigation tree, select Application Manager > Application Monitor.
The application monitor list page displays all application monitors.
3. Click the name of a GlassFish server application monitor to display the report.
Figure 85 shows part of a GlassFish server application monitor report.
Figure 85 Part of a GlassFish server application monitor report
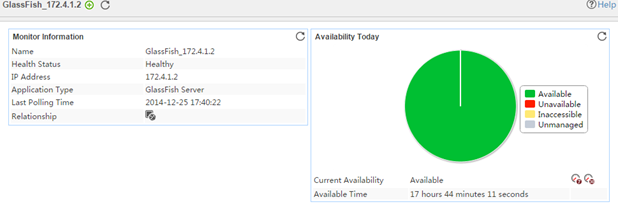
Monitor Information
The Monitor Information area contains the following fields:
· Name—Application monitor name.
· Health Status—Health status of the GlassFish server application.
· IP Address—IP address of the GlassFish server host.
· Application Type—Type of the monitored application, which is always GlassFish Server.
· Last Polling Time—Time when APM last polled the GlassFish server application.
· Relationship—Click the Relationship
icon ![]() to view dependencies
between applications in a dependency topology view. For
more information about dependency topologies, see "Topology and application group management."
to view dependencies
between applications in a dependency topology view. For
more information about dependency topologies, see "Topology and application group management."
· Top5 Unrecovered Alarm—Latest five unrecovered alarms on the GlassFish server. This field is not displayed if no alarm is generated by the GlassFish server.
Availability Today
The Availability Today area contains the following fields:
· Current Availability—Availability of the GlassFish server application.
¡ Click the Weekly History icon ![]() to
view the availability of the GlassFish server application in the last 7 days.
to
view the availability of the GlassFish server application in the last 7 days.
¡ Click the Monthly History icon ![]() to view the availability of the GlassFish server application in the last 30 days.
to view the availability of the GlassFish server application in the last 30 days.
· Available Time—Total amount of time that the GlassFish server application was available after 00:00 today.
· Unavailable Time—Total amount of time that the GlassFish server application was unavailable after 00:00 today.
· Inaccessible Time—Total amount of time that the GlassFish server application was inaccessible after 00:00 today.
· Unmanaged Time—Total amount of time that the GlassFish server application was unmanaged after 00:00 today.
The statistics collection started when the application monitor was added. An availability time field is not displayed if its value is 0.
Response Time
The Response Time area contains the following field:
· Response Time—Round-trip time duration since APM sending a request packet to APM receiving the response from the GlassFish server application.
¡ Click
the Set Threshold icon ![]() to set
alarm thresholds for the response time.
to set
alarm thresholds for the response time.
¡ Click the History Record icon ![]() to view the history graph of the response
time.
to view the history graph of the response
time.
Memory Details
The correct operation of the GlassFish server relies on the performance of the Java virtual machine (JVM) in which the server is running. APM monitors the JVM memory usage for the GlassFish server.
The Memory Details area contains the following fields:
· Total Memory—Total JVM heap size.
· Used Memory—Size of the used JVM
heap. Click the History Record icon ![]() to view the
history graph of the used JVM heap.
to view the
history graph of the used JVM heap.
· Free Memory—Size of free JVM heap.
· Memory Usage—Percentage of used memory to total memory.
¡ Click
the Set Threshold icon ![]() to set alarm
thresholds for the memory usage.
to set alarm
thresholds for the memory usage.
¡ Click
the History Record icon ![]() to view the history
graph of the memory usage.
to view the history
graph of the memory usage.
Thread Details
The Thread Details area contains the following fields:
· Thread Count—Total number of threads used for processing HTTP requests.
· Daemon Thread Count—Total number of daemon threads.
· Peak Thread Count—Maximum number of threads of the GlassFish server since the server started.
· Total Started Thread Count—Total number of threads that are created and started by the GlassFish server since the server started.
Web Application
This area displays data when APM monitors the GlassFish server of version 3.x. No data is displayed in this area when APM monitors the GlassFish server of version 2.x.
The Web Application area contains the following fields:
· Web Application Name—Name of the Web application.
· Web Application Directory—Local directory in which the project file of the Web application is located on the GlassFish server.
Application Traffic
APM collects the traffic statistics of the GlassFish server application based on the IP address and the service port.
The Application Traffic area contains the following fields:
· Last Hour's Traffic—Total traffic sent and received by the GlassFish server application over the last 1 hour.
· Today's Traffic—Total traffic sent and received by the GlassFish server application since 00:00 today.
WebSphere server
IBM WebSphere Application Server (WebSphere Server for short) is the basis of the IBM basic infrastructure for running Web applications. APM supports monitoring WebSphere servers.
Adding a WebSphere server application monitor
APM can only remotely monitor WebSphere server applications. When you add a WebSphere server application monitor, follow these guidelines:
· APM obtains monitor index data of WebSphere server applications through the SOAP interface. If the SOAP interface of WebSphere server applications requires authentication, obtain the authorized SOAP username and password.
· Add WebSphere hosts to the IMC platform so that APM can obtain and display network connections of the hosts and their access devices in the application topology. For more information about adding hosts to the IMC platform, see H3C Intelligent Management Center v7.3 Enterprise and Standard Platform Administrator Guide.
· To view traffic statistics in the monitor report of the WebSphere server application, make sure at least one probe is configured in APM. After a WebSphere server application monitor is added, APM sends the IP address and service port of the monitored WebSphere server application to the probes for traffic collection.
To add a WebSphere server application monitor:
1. Click the Resource tab.
2. Open the Add Application page by using one of the following methods:
¡ From the navigation tree, select Application Manager > Add Application.
The page displays all application types that can be monitored by APM.
¡ From the navigation tree, select Application Manager > Application Monitor, and then click Add on the application monitor list page.
3. Click WebSphere Server of the Application Server Monitor class.
The page for adding a WebSphere server application monitor opens.
4. Configure the following parameters:
¡ IP Address—Enter the IP address of the host on which the WebSphere server to be monitored is installed. APM automatically checks the specified IP address and associates the application monitor with the host managed in the IMC platform. If the host is already added to the IMC platform, you can also click Select, and then select the host in the Select Devices window. For information about selecting a host, see "Quick start."
¡ Name—Enter a unique application monitor name. As a best practice, name the application monitor as application type_host IP address.
¡ Use Template—Select Enable or Disable from the list.
¡ Template—Click
the Configure icon ![]() next to the Template field to select an existing template. The Template field
is automatically populated with the name of the selected template. For more
information about configuring application templates, see "Configuration management." This field is displayed only when you select Enable from the Use
Template list.
next to the Template field to select an existing template. The Template field
is automatically populated with the name of the selected template. For more
information about configuring application templates, see "Configuration management." This field is displayed only when you select Enable from the Use
Template list.
¡ Description—Enter a description for the application monitor.
¡ Application Monitor Port—Enter the SOAP service port of the WebSphere server application. The default value is TCP-8880. This field is available only when you select Disable from the Use Template list.
¡ Traffic Collection Port—Enter the service port number of WebSphere server. This field is displayed only when at least one probe is configured for APM and is available only when you select Disable from the Use Template list.
¡ Polling Interval (min)—Select a polling interval for the application monitor. Options are 1, 2, 3, 4, 5, 10, 20, and 30. The default polling interval is 5 minutes. A shorter polling interval provides more accurate realtime data consumes more system resources. This field is available only when you select Disable from the Use Template list.
¡ Username/Password—Enter the username and password used to access the SOAP service if the service requires authentication. The fields are available only when you select Disable from the Use Template list.
¡ Contact—Enter contact information, such as the name, email address, and telephone number. The default is the username of the operator who created the application monitor. The fields are available only when you select Disable from the Use Template list.
¡ APM Server—Select an APM server to monitor the application. The options are in server-address (application-type:n/N) format. The letter n indicates the number of WebSphere server applications monitored on the APM server. The letter N indicates the total number of applications monitored on the APM server. Server address 127.0.0.1 indicates that APM and the IMC platform are deployed on the same server.
¡ Related Applications—Click Add next to this field. On the Select Application window, enter a partial or complete name to filter applications, select the applications that WebSphere server depends on, and then click OK.
Operating system applications cannot be selected. Operators can view all dependencies of the application in the dependency topology. APM automatically adds the dependencies between the WebSphere server and operating system applications by IP address.
¡ Application Group—Specify an application group for the WebSphere server application.
- To specify an existing application group, click Add, select an application group, and then click OK.
- To specify a new application group, click Add Application Group, configure the application group settings, and then click OK.
¡ Detect Application—Select this parameter if you want to enable application detection. APM verifies the application connectivity by using the previous parameter settings, and adds the application monitor only when it can connect to the application. If you do not select this parameter, APM adds the application monitor without verifying the application connectivity.
5. Click OK.
Modifying a WebSphere server application monitor
Authorized users can modify all parameters except the IP address and the APM server for a WebSphere server application monitor. When the IP address of the monitored WebSphere server host changes, operators must add a new application monitor for the host. However, the new application monitor cannot inherit the history data from the previous application monitor.
To modify a WebSphere server application monitor:
1. Click the Resource tab.
2. From the navigation tree, select Application Manager > Application Monitor.
The application monitor list page displays all application monitors.
3. Click the Modify icon ![]() for the selected WebSphere server application
monitor.
for the selected WebSphere server application
monitor.
The page for modifying the WebSphere server application monitor opens.
4. Modify the parameters as needed, except the IP address and the APM server.
For more information about parameter settings, see "Adding a WebSphere server application monitor."
5. Click OK.
Viewing the WebSphere server application monitor report
After a WebSphere server application monitor is added, APM collects application index data, evaluates the availability and health status, and updates the monitor report. The report shows the index values obtained from the most recent polling of the application.
To access the WebSphere server application monitor report:
1. Click the Resource tab.
2. From the navigation tree, select Application Manager > Application Monitor.
The application monitor list page displays all application monitors.
3. Click the name of a WebSphere server application monitor to display the report.
Figure 86 shows part of a WebSphere server application monitor report.
Figure 86 Part of a WebSphere server application monitor report

Monitor Information
The Monitor Information area contains the following fields:
· Name—Application monitor name.
· Health Status—Health status of the WebSphere server application.
· IP Address—IP address of the WebSphere server host.
· Application Type—Type of the monitored application, which is always WebSphere Server.
· Version—Version of the WebSphere server.
· Last Polling Time—Time when APM last polled the WebSphere server application.
· Relationship—Click the Relationship
icon ![]() to view dependencies
between applications in a dependency topology view. For
more information about dependency topologies, see "Topology and application group management."
to view dependencies
between applications in a dependency topology view. For
more information about dependency topologies, see "Topology and application group management."
· Top5 Unrecovered Alarm—Latest five unrecovered alarms on the WebSphere server. This field is not displayed if no alarm is generated by the WebSphere server.
Availability Today
The Availability Today area contains the following fields:
· Current Availability—Availability of the WebSphere server application.
¡ Click the Weekly History icon ![]() to view the availability of the WebSphere server application in the last 7 days.
to view the availability of the WebSphere server application in the last 7 days.
¡ Click the Monthly History icon ![]() to view the availability of the WebSphere server application in the last 30 days.
to view the availability of the WebSphere server application in the last 30 days.
· Available Time—Total amount of time that the WebSphere server application was available after 00:00 today.
· Unavailable Time—Total amount of time that the WebSphere server application was unavailable after 00:00 today.
· Inaccessible Time—Total amount of time that the WebSphere server application was inaccessible after 00:00 today.
· Unmanaged Time—Total amount of time that the WebSphere server application was unmanaged after 00:00 today.
The statistics collection started when the application monitor was added. An availability time field is not displayed if its value is 0.
Response Time
The Response Time area contains the following field:
· Response Time—Round-trip time duration since APM sending a request packet to APM receiving the response from the WebSphere server application.
¡ Click
the Set Threshold icon ![]() to set alarm thresholds for the response
time.
to set alarm thresholds for the response
time.
¡ Click the History Record icon ![]() to view the history graph of the response
time trend.
to view the history graph of the response
time trend.
Thread Pool
The Thread Pool area contains the following fields:
· Node—Name of the WebSphere server node.
· Process—Process running on the WebSphere server node.
· Active Threads—Number of active threads in the thread pool.
· Average Threads—Average number of threads in the thread pool.
Thread Pool Detail
The Thread Pool Detail area contains the following fields:
· Node—Name of the WebSphere server node.
· Process—Process running on the WebSphere server node.
· Thread Pool—Name of thread pool.
· Active Threads—Number of concurrently active threads.
· Average Threads—Average number of threads in a pool.
· Created Threads—Total number of created threads.
· The Average Time Active—Average time in milliseconds that the threads are in active state.
· Num Thread Stops That Cleared—Number of cleared thread stops.
· Num Concurrently Stopped Threads—Number of concurrently stopped threads.
· Num Threads Declared Stopped—Number of threads that are declared stopped.
· Num Threads Destroyed—Total number of destroyed threads.
· Avg Percent Of The Time In Use—Average percent of the time that all threads are in use.
· Ratio Used—Average percent of the pool that is in use. The value is based on the total number of configured threads in the thread pool, not the current pool size.
Memory
The correct operation of the WebSphere server application relies on the performance of the Java virtual machine (JVM) in which the server is running. APM monitors the JVM memory usage for the WebSphere server application.
The Memory area contains the following fields:
· Node—Name of the WebSphere server node.
· Process—Process running on the WebSphere server node.
· Free Memory—Free memory in the
JVM heap. Click the Set Threshold icon ![]() to set
alarm thresholds for the free memory.
to set
alarm thresholds for the free memory.
· In Use—Used memory in the JVM heap. Click the Set Threshold icon ![]() to set alarm thresholds for the used memory.
to set alarm thresholds for the used memory.
· Total Memory—Total JVM heap size. The total memory is equal to the free memory plus the used memory.
· JVM Up Time—Total run time of JVM since the WebSphere server started.
Web Application
The Web Application area contains the following fields:
· Node—Name of the WebSphere server node.
· Process—Process running on the WebSphere server node.
· Requests Processed by Servlet—Total number of requests processed by the Servlet since the WebSphere server application started to the last polling.
· Service Time—Average time taken by the Servlet to process and respond to the requests since the WebSphere server started.
· Concurrently Processed Requests—Number of requests that are concurrently processed.
· Errors—Total number of times an error has been received from the servlet or JSP.
· Error Rate—Errors proportion to the number of processed requests.
Web Application Detail
The Web Application Detail area contains the following fields:
· Node—Name of the WebSphere server node.
· Process—Process running on the WebSphere server node.
· Application—Web application name.
· Requests Processed by Servlet—Total number of requests that have been processed by Servlet on the WebSphere.
· Loaded Servlets—Number of loaded servlets.
· Reloaded Servlets—Number of reloaded servlets.
· Service Time—Average response time to process Servlet requests.
· Concurrently Processed Requests—Number of requests that are concurrently processed.
· Errors—Total number of times an error has been received from the servlet or JSP.
· Error Rate—Errors proportion to the number of processed requests.
Transactions
The Transactions area contains the following fields:
· Node—Name of the WebSphere server node.
· Process—Process running on the WebSphere server node.
· Global Transactions—Total number of global transactions started by the WebSphere server since the WebSphere server started.
· Local Transactions—Total number of local transactions started by the WebSphere server since the WebSphere server started.
· Active Global Transactions—Total number of concurrently active transactions.
· Average Global Transaction Up Time—Average global transaction up time since the WebSphere server started.
· Average Local Transaction Up Time—Average local transaction up time since the WebSphere server started.
· Committed Global Transactions—Total number of transactions committed since the WebSphere server started.
· Rolled Back Global Transactions—Total number of transactions that had been rolled back since the WebSphere server started.
· Global Transaction Timedouts—Number of global transactions that timed out.
· Local Transactions Timedouts—Number of local transactions that timed out.
· Global Transaction Rollback Rate—Percentage of rolled back global transactions to global transactions.
· Global Transaction Timedout Rate—Percentage of timeout global transactions to global transactions.
· Local Transaction Timedout Rate—Percentage of timeout local transactions to local transactions.
JDBC Connection Pool
The JDBC Connection Pool area contains the following fields:
· Node—Name of the WebSphere server node.
· Process—Process running on the WebSphere server node.
· Created Connections—Total number of connections created in the connection pool since the WebSphere server started.
· Closed Connections—Total number of connections closed in the connection pool since the WebSphere server started.
· Pool Size—Size of the JDBC connection pool.
· Idle Connections—Total number of idle connections.
· Waiting Connections—Total number of connections in waiting state.
· Allocated Connections—Total number of allocated connections.
· Timeouts Connections—Number of connection timeouts in the pool.
· Used Time—Average time in milliseconds that a connection is used. The difference between the time at which the connection is allocated and returned. This value includes the JBDC operation time.
· The Average Waiting Time—Average waiting time in milliseconds until a connection is granted.
· Percent Used—Average percent of the pool that is in use. The value is based on the total number of configured connections in the connection pool, not the current number of connections.
Session
The Session area contains the following fields:
· Name—Session object name.
· Sessions Created—Number of created sessions.
· Sessions Invalidated—Number of invalidated sessions.
· Sessions Survival—Total number of sessions that are currently live.
· Session Object Size—Average size of the session objects at session level, including only serializable attributes in the cache.
· Lifetime—Average session lifetime in milliseconds. It is the difference between the time when the session became invalid and the time when the session was created.
Application Traffic
APM performs traffic statistics based on the IP address and the service port of the WebSphere server application.
The Application Traffic area contains the following fields:
· Last Hour's Traffic—Total traffic sent and received by the WebSphere server application over the last 1 hour.
· Today's Traffic—Total traffic sent and received by the WebSphere server application since 00:00 today.
Cluster
The Cluster area contains the following fields:
· Cluster Name—WebSphere cluster name.
· State—WebSphere cluster state.
· Member Name—Name of a member in the WebSphere cluster.
· Node Name—Name of a WebSphere node in the cluster.
· Weight—Weight of the WebSphere node in the cluster.
Jetty
Jetty is an open source Servlet container and provides the running environment for Java-based Web contents.
Adding a Jetty application monitor
APM can locally or remotely monitor Jetty applications through JMX. When you add a Jetty application monitor, follow these restrictions and guidelines:
· APM obtains Jetty application index data through the JMX interface. Operators need to contact the Jetty administrator to enable JMX.
· If JMX requires authentication, obtain the username and password of the Jetty administrator. The username and password are required for adding the application monitor.
· To locally monitor Jetty applications, install agents on the hosts where Jetty applications are deployed. For more information about installing agents, see "APM agent management."
· Add Jetty hosts to the IMC platform so that APM can obtain and display network connections of the hosts and their access devices in the application topology. For more information about adding hosts to the IMC platform, see H3C Intelligent Management Center v7.3 Enterprise and Standard Platform Administrator Guide.
To add a Jetty application monitor:
1. Click the Resource tab.
2. Open the Add Application page by using one of the following methods:
¡ From the navigation tree, select Application Manager > Add Application.
¡ From the navigation tree, select Application Manager > Application Monitor. In the application monitor list, click Add.
The Add Application page displays all application types that can be monitored by APM.
3. Click Jetty of the Application Server Monitor class.
The page for adding a Jetty application monitor opens.
4. Configure the following parameters:
¡ IP Address—Enter the IP address of the host on which the Jetty application to be monitored is installed. APM automatically checks the specified IP address and associates the application monitor with the host managed in the IMC platform. If the host that is already added to the IMC platform, you can also click Select, and then select the host in the Select Devices dialog box. For information about selecting a host, see "Quick start."
¡ Name—Enter a unique application monitor name. As a best practice, name the application monitor as application type_host IP address.
¡ Use Template—Select Enable or Disable from the list.
¡ Template—Click
the Configure icon ![]() next to the Template field to select an existing template. The Template field
is automatically populated with the name of the selected template. For more
information about configuring application templates, see "Configuration management." This field is displayed only when you select Enable from the Use
Template list.
next to the Template field to select an existing template. The Template field
is automatically populated with the name of the selected template. For more
information about configuring application templates, see "Configuration management." This field is displayed only when you select Enable from the Use
Template list.
¡ Description—Enter a description for the application monitor.
¡ Application Monitor Port—Enter the JMX port used to monitor the application. This field is available only when you select Disable from the Use Template list.
¡ Polling Interval (min)—Select a polling interval for the application monitor. Options are 1, 2, 3, 4, 5, 10, 20, and 30. The default polling interval is 5 minutes. A shorter polling interval improves real-time data accuracy at the expense of system resources. This field is available only when you select Disable from the Use Template list.
¡ Username/Password—Enter the username and password of the Jetty administrator. The fields are available only when you select Disable from the Use Template list.
¡ Contact—Enter the contact information, such as the name, email address, and telephone number. The default is the username of the operator who created the application monitor. This field is available only when you select Disable from the Use Template list.
¡ APM Server—Select an APM server to monitor the application. The options are in server-address (application-type:n/N) format. The letter n indicates the number of Jetty applications monitored on the APM server. The letter N indicates the total number of applications monitored on the APM server. Server address 127.0.0.1 indicates that APM and the IMC platform are deployed on the same server.
¡ Related Applications—Click Add next to this field. On the Select Application window, enter a partial or complete name to filter applications, select the applications that Jetty depends on, and then click OK.
Operating system applications cannot be selected. Operators can view all dependencies of the application in the dependency topology. APM automatically adds the dependencies between Jetty and operating system applications by IP address and displays their dependencies in the application topology.
¡ Application Group—Specify an application group for the Jetty application.
- To specify an existing application group, click Add, select an application group, and then click OK.
- To specify a new application group, click Add Application Group, configure the application group settings, and then click OK.
¡ Detect Application—Select this parameter if you want to enable application detection. APM verifies the application connectivity by using the previous parameter settings, and adds the application monitor only when it can connect to the application. If you do not select this parameter, APM adds the application monitor without verifying the application connectivity.
5. Click OK.
Modifying a Jetty application monitor
Authorized users can modify all parameters except the IP address and the APM server for a Jetty application monitor. When the IP address of a monitored Jetty host changes, operators must add a new application monitor for the host. However, the new application monitor cannot inherit the history data from the previous application monitor.
To modify a Jetty application monitor:
1. Click the Resource tab.
2. From the navigation tree, select Application Manager > Application Monitor.
The application monitor list page displays all application monitors.
3. Click the Modify
icon ![]() for the Jetty application monitor you want to modify.
for the Jetty application monitor you want to modify.
The page for modifying the Jetty application monitor opens.
4. Modify the parameters as needed, except the IP address and the APM server.
For more information about parameter settings, see "Adding a Jetty application monitor."
5. Click OK.
Viewing the Jetty application monitor report
After a Jetty application monitor is added, APM collects application index data, evaluates the availability and health status, and updates the monitor report. The report shows the index values obtained from the most recent polling of the application.
To access the Jetty application monitor report:
1. Click the Resource tab.
2. From the navigation tree, select Application Manager > Application Monitor.
The application monitor list page displays all application monitors.
3. Click the name of a Jetty application monitor to display the report.
Figure 87 shows part of a Jetty monitor report.
Figure 87 Part of a Jetty application monitor report
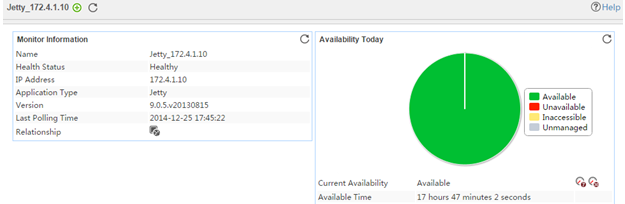
Monitor Information
The Monitor Information area contains the following fields:
· Name—Application monitor name.
· Health Status—Health status of the Jetty application.
· IP Address—IP address of the Jetty host.
· Application Type—Type of the monitored application, which is always Jetty.
· Version—Version of the Jetty OS.
· Last Polling Time—Time when APM last polled the Jetty application.
· Relationship—Click the Relationship
icon ![]() to view dependencies
between applications in a dependency topology view. For
more information about dependency topologies, see "Topology and application group management."
to view dependencies
between applications in a dependency topology view. For
more information about dependency topologies, see "Topology and application group management."
· Top5 Unrecovered Alarm—Latest five unrecovered alarms on the Jetty application. This field is not displayed if no alarm is generated by the Jetty application.
Availability Today
The Availability Today area contains the following fields:
· Current Availability—Availability of the Jetty application.
¡ Click the Weekly History icon ![]() to view the availability of the Jetty application in the
last 7 days.
to view the availability of the Jetty application in the
last 7 days.
¡ Click the Monthly History icon ![]() to view the availability of the Jetty application in the
last 30 days.
to view the availability of the Jetty application in the
last 30 days.
· Available Time—Total amount of time that the Jetty application was available after 00:00 today.
· Unavailable Time—Total amount of time that the Jetty application was unavailable after 00:00 today.
· Inaccessible Time—Total amount of time that the Jetty application was inaccessible after 00:00 today.
· Unmanaged Time—Total amount of time that the Jetty application was unmanaged after 00:00 today.
The statistics collection started when the application monitor was added. An availability time field is not displayed if its value is 0.
OS Information
The OS Information area contains the following fields:
· OS—Operating system of the Jetty host.
· Architecture—Architecture of the Jetty host, for example, the x86 architecture.
· CPU Processing Duration—CPU processing duration occupied by the Jetty application.
· Total Kernel Count—Total number of CPU kernels on the Jetty host.
· Used Virtual Memory—Size of the used virtual memory for the OS on the Jetty host.
· Total Physical Memory—Size of total physical memory on the Jetty host.
· Free Physical Memory—Size of the free physical memory on the Jetty host.
· Physical Memory Usage Ratio—Usage of the physical memory on the Jetty host. Click the History
Record icon ![]() to view the history graph of the physical
memory usage.
to view the history graph of the physical
memory usage.
· Total Swap Memory—Total virtual or swap memory size on the Jetty host.
· Free Swap Memory—Size of the free swap memory on the Jetty host.
· Swap Usage Ratio—Usage of the swap memory on the Jetty host.
Click the History
Record icon ![]() to view the history graph of the swap usage
ratio.
to view the history graph of the swap usage
ratio.
Heap Size Information
The correct operation of the Jetty application relies on the performance of the Java virtual machine (JVM). APM monitors the JVM heap memory usage.
The Heap Size Information area contains the following fields:
· Current Heap Size—Size of the current JVM heap. Click the History Record icon ![]() to view the history graph of the current heap
size.
to view the history graph of the current heap
size.
· Max Heap Size—Size of the maximum heap that the JVM can apply for.
· Committed Heap Size—Size of the heap committed by the JVM. Click the History Record icon ![]() to view the history graph of the committed
heap size.
to view the history graph of the committed
heap size.
Thread Information
The Thread Information area contains the following fields:
· Active Thread Count—Number of active threads. Click the History Record icon ![]() to view the history graph of the active thread
count.
to view the history graph of the active thread
count.
· Peak Thread Count—Maximum number of active threads. Click the History Record icon ![]() to view the history graph of the peak thread
count.
to view the history graph of the peak thread
count.
· Daemon Thread Count—Number of daemon threads. Click the History Record icon ![]() to view the history graph of the daemon
thread count.
to view the history graph of the daemon
thread count.
· Total Started Thread Count—Total number of started threads. Click the History Record icon ![]() to view the history graph of the started
threads.
to view the history graph of the started
threads.
Class Information
The Class Information area contains the following fields:
· Current Loaded Class Count—Number of classes currently loaded by the
Jetty application. Click the History
Record icon ![]() to view the history graph of the current
loaded class count.
to view the history graph of the current
loaded class count.
· Total Loaded Class Count—Number of classes that have been loaded by
the Jetty application. Click the History
Record icon ![]() to view the history graph of the total loaded
class count.
to view the history graph of the total loaded
class count.
· Total Removed Class Count—Total number of removed classes. Click the History Record icon ![]() to view the history graph of the total
removed class count.
to view the history graph of the total
removed class count.
Jetty Information
The Jetty Information area contains the following fields:
· JMX Access Address—Access address of the Jetty application.
· Java VM— Name and version of the Java virtual machine used by the Jetty application.
Lotus Domino server
IBM Lotus Domino server is collaborative office software developed by IBM and provides various types of collaboration applications.
Configuring the Lotus Domino server
APM uses Domino Internet Inter-ORB Protocol (DIIOP) to monitor the Lotus Domino server application. To monitor the Lotus Domino server application, contact the application administrator to configure the following settings:
1. Open the page for configuring a Lotus Domino server:
a. Open the names.nsf file on the IBM Lotus Domino server. By default, the file is located at IBM\Domino\data in the Domino installation path.
b. From the navigation tree, select Configuration > Severs > All Server Documents.
c. Double-click the Lotus Domino server to be monitored in the window for selecting a Lotus Domino server.
The page for configuring the Lotus Domino server opens.
2. Configure DIIOP:
a. Select Ports... > Internet Ports... > DIIOP.
b. Enter a TCP/IP port number in the TCP/IP Port Number field. The default port is 63148.
c. Select Enable from the TCP/IP Port Status list.
3. Configure the HTTP task:
a. Select Ports... > Internet Ports... > Web.
b. Enter a TCP/IP port number in the TCP/IP Port Number field. The default port is 80.
4. Allow HTTP clients to browse Domino databases:
a. Select Internet Protocols... > HTTP.
b. Select Yes for the Allow HTTP clients to browse databases parameter.
5. Enable anonymous authentication:
a. Select Ports... > Internet Ports... > Web.
b. In the Authentication Options area, select Yes from the Anonymous list.
Adding a Lotus Domino server application monitor
APM can locally or remotely monitor Lotus Domino server applications. When you add a Jetty application monitor, follow these restrictions and guidelines:
· Contact the Lotus Domino server administrator to enable DIIOP access function and obtain DIIOP user access information. For information about enabling the DIIOP function, see "Configuring the Lotus Domino server."
· To locally monitor Lotus Domino server applications, install agents on the hosts where Lotus Domino server applications are deployed. For more information about installing agents, see "APM agent management."
· Add Lotus Domino server hosts to the IMC platform so that APM can obtain and display network connections of the hosts and their access devices in the application topology. For more information about adding hosts to the IMC platform, see H3C Intelligent Management Center v7.3 Enterprise and Standard Platform Administrator Guide.
To add a Lotus Domino server application monitor:
1. Click the Resource tab.
2. Open the Add Application page by using one of the following methods:
¡ From the navigation tree, select Application Manager > Add Application.
¡ From the navigation tree, select Application Manager > Application Monitor. In the application monitor list, click Add.
The Add Application page displays all application types that can be monitored by APM.
3. Click Lotus Domino Server of the Application Server Monitor class.
The page for adding a Lotus Domino server application monitor opens.
4. Configure the following parameters:
¡ IP Address—Enter the IP address of the host on which the Lotus Domino server application to be monitored is installed. APM automatically checks the IP address and associates the application monitor with the host if it is already managed in the IMC platform. To monitor a host that is already managed in the IMC platform, you can also click Select, and then select the host in the Select Devices dialog box. For information about selecting a host, see "Quick start."
¡ Name—Enter a unique application monitor name. As a best practice, name the application monitor as application type_host IP address.
¡ Use Template—Select Enable or Disable from the list.
¡ Template—Click
the Configure icon ![]() next to the Template field to select an existing template. The Template field
is automatically populated with the name of the selected template. For more
information about configuring application templates, see "Configuration management." This field is displayed only when you select Enable from the Use
Template list.
next to the Template field to select an existing template. The Template field
is automatically populated with the name of the selected template. For more
information about configuring application templates, see "Configuration management." This field is displayed only when you select Enable from the Use
Template list.
¡ Description—Enter a description for the application monitor.
¡ Traffic Collection Port—Enter the service port number of the Lotus Domino server application. For example, you can enter 25 if SMTP is used. This field is available only when you select Disable from the Use Template list.
¡ Polling Interval (min)—Select a polling interval for the application monitor. Options are 1, 2, 3, 4, 5, 10, 20, and 30. The default polling interval is 5 minutes. A shorter polling interval improves real-time data accuracy at the expense of system resources. This field is available only when you select Disable from the Use Template list.
¡ Username/Password—Enter the username and password that can access the DIIOP function. The fields are available only when you select Disable from the Use Template list.
¡ Contact—Enter the contact information, such as the name, email address, and telephone number. The default is the username of the operator who created the application monitor. This field is available only when you select Disable from the Use Template list.
¡ APM Server—Select an APM server to monitor the application. The options are in server-address (application-type:n/N) format. The letter n indicates the number of Lotus Domino server applications monitored on the APM server. The letter N indicates the total number of applications monitored on the APM server. Server address 127.0.0.1 indicates that APM and the IMC platform are deployed on the same server.
¡ Related Applications—Click Add next to this field. On the Select Application window, enter a partial or complete name to filter applications, select the applications that the Lotus Domino server depends on, and then click OK.
Operating system applications cannot be selected. Operators can view all dependencies of the application in the dependency topology. APM automatically adds the dependencies between the Lotus Domino server and operating system applications by IP address and displays their dependencies in the application topology.
¡ Application Group—Specify an application group for the Lotus Domino server application.
- To specify an existing application group, click Add, select an application group, and then click OK.
- To specify a new application group, click Add Application Group, configure the application group settings, and then click OK.
¡ Detect Application—Select this parameter if you want to enable application detection. APM verifies the application connectivity by using the previous parameter settings, and adds the application monitor only when it can connect to the application. If you do not select this parameter, APM adds the application monitor without verifying the application connectivity.
5. Click OK.
Modifying a Lotus Domino server application monitor
Authorized users can modify all parameters except the IP address and the APM server for the Lotus Domino server application. When the IP address of a monitored Lotus Domino server host changes, operators must add a new application monitor for the host. The new application monitor cannot inherit the history data from the previous application monitor.
To modify a Lotus Domino server application monitor:
1. Click the Resource tab.
2. From the navigation tree, select Application Manager > Application Monitor.
The application monitor list page displays all application monitors.
3. Click the Modify
icon ![]() for the Lotus Domino server application monitor you want to modify.
for the Lotus Domino server application monitor you want to modify.
The page for modifying the Lotus Domino server application monitor opens.
4. Modify the parameters as needed, except the IP address and the APM server.
For more information about parameter settings, see "Adding a Lotus Domino server application monitor."
5. Click OK.
Viewing the Lotus Domino server application monitor report
After a Lotus Domino server application monitor is added, APM collects application index data, evaluates the availability and health status, and updates the monitor report. The report shows the index values obtained from the most recent polling of the application.
To view the Lotus Domino server application monitor report:
1. Click the Resource tab.
2. From the navigation tree, select Application Manager > Application Monitor.
The application monitor list page displays all application monitors.
3. Click the name of a Lotus Domino server application monitor to display the report.
Figure 88 shows part of a Lotus Domino server application monitor report.
Figure 88 Part of a Lotus Domino server application monitor report
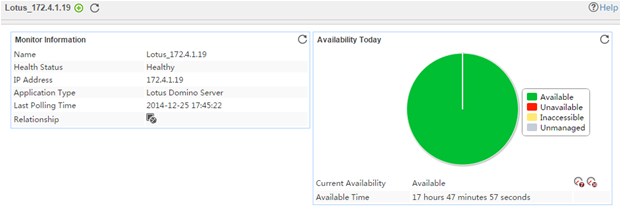
Monitor Information
The Monitor Information area contains the following fields:
· Name—Application monitor name.
· Health Status—Health state of the Lotus Domino server application.
· IP Address—Lotus Domino server host IP address.
· Application Type—Type of the monitored application, which is always Lotus Domino Server.
· Version—Version of the Lotus Domino server application.
· Last Polling Time—Time when APM last polled the Lotus Domino server application.
· Relationship—Click the Relationship icon ![]() to view dependencies between the Lotus Domino server application and other applications in a dependency topology view. For more information about dependency
topologies, see "Topology and application group management."
to view dependencies between the Lotus Domino server application and other applications in a dependency topology view. For more information about dependency
topologies, see "Topology and application group management."
· Top5 Unrecovered Alarms—Latest five unrecovered alarms on the Lotus Domino server application. This field is not displayed if no alarm was generated by the Lotus Domino server application.
Availability Today
The Availability Today area contains the following fields:
· Current Availability—Availability of the Lotus Domino server application.
¡ Click
the Weekly History icon ![]() to view the availability of the Lotus Domino server application in the last 7 days.
to view the availability of the Lotus Domino server application in the last 7 days.
¡ Click
the Monthly History icon ![]() to view the availability of the Lotus Domino server application in the last 30 days.
to view the availability of the Lotus Domino server application in the last 30 days.
· Available Time—Total amount of time that the Lotus Domino server application was available after 00:00 today.
· Unavailable Time—Total amount of time that the Lotus Domino server application was unavailable after 00:00 today.
· Inaccessible Time—Total amount of time that the Lotus Domino server application was inaccessible after 00:00 today.
· Unmanaged Time—Total amount of time that the Lotus Domino server application was unmanaged after 00:00 today.
The statistics collection started when the application monitor was added. An availability time field is not displayed if its value is 0.
CPU Usage Ratio
The CPU Usage Ratio area contains the following field:
· CPU Usage Ratio—CPU usage of the Lotus Domino server application.
¡ Click
the Set Threshold icon ![]() to set alarm
thresholds for the CPU usage ratio.
to set alarm
thresholds for the CPU usage ratio.
¡ Click
the History Record icon ![]() to view the history graph of the CPU usage
ratio.
to view the history graph of the CPU usage
ratio.
Memory Usage Ratio
The Memory Usage Ratio area contains the following field:
· Memory Usage Ratio—Memory usage of the Lotus Domino server application.
¡ Click
the Set Threshold icon ![]() to set alarm
thresholds for the memory usage ratio.
to set alarm
thresholds for the memory usage ratio.
¡ Click
the History Record icon ![]() to view the history graph of the memory
usage ratio.
to view the history graph of the memory
usage ratio.
Disk Usage Ratio
The Disk Usage Ratio area contains the following field:
· Disk Usage Ratio—Percentage of used disk space to total disk space.
¡ Click
the Set Threshold icon ![]() to set alarm
thresholds for the disk usage ratio.
to set alarm
thresholds for the disk usage ratio.
¡ Click
the History Record icon ![]() to view the history graph of the disk usage
ratio.
to view the history graph of the disk usage
ratio.
HTTP
The HTTP area contains the following fields:
· Current Connections—Number of current HTTP connections, excluding HTTP connection requests.
¡ Click
the Set Threshold icon ![]() to set alarm
thresholds for current connections.
to set alarm
thresholds for current connections.
¡ Click
the History Record icon ![]() to view the history graph of current
connections.
to view the history graph of current
connections.
· Max Connections—Maximum number of HTTP connections of the
Lotus Domino server application. Click the History Record icon ![]() to view the history
graph of maximum connections.
to view the history
graph of maximum connections.
Users
The Users area contains the following field:
· Current Users—Number of users that access the Lotus Domino server application.
¡ Click
the Set Threshold icon ![]() to set alarm
thresholds for current users.
to set alarm
thresholds for current users.
¡ Click
the History Record icon ![]() to view the history graph of current users.
to view the history graph of current users.
The Mail area contains the following fields:
· Average Time for Mail Delivery—Average mail delivery time.
¡ Click
the Set Threshold icon ![]() to set alarm
thresholds for average time for mail delivery.
to set alarm
thresholds for average time for mail delivery.
¡ Click
the History Record icon ![]() to view the history graph of average time
for mail delivery.
to view the history graph of average time
for mail delivery.
· Dead Mail/Min—Number of mails that cannot be delivered in the mail box per minute.
¡ Click
the Set Threshold icon ![]() to set alarm
thresholds for dead mails per minute.
to set alarm
thresholds for dead mails per minute.
¡ Click
the History Record icon ![]() to view the history graph of dead mails per
minute.
to view the history graph of dead mails per
minute.
· Waiting Mail/Min—Number of mails that are waiting to be delivered in the mail box per minute.
¡ Click
the Set Threshold icon ![]() to set alarm
thresholds for waiting mails per minute.
to set alarm
thresholds for waiting mails per minute.
¡ Click
the History Record icon ![]() to view the history graph of waiting mails
per minute.
to view the history graph of waiting mails
per minute.
· Delivered Mail/Min—Number of mails that are delivered from the router to the mail box per minute.
¡ Click
the Set Threshold icon ![]() to set alarm
thresholds for delivered mails per minute.
to set alarm
thresholds for delivered mails per minute.
¡ Click
the History Record icon ![]() to view the history graph of delivered
mails per minute.
to view the history graph of delivered
mails per minute.
Network Information
The Network Information area contains the following fields:
· Receive Rate—Rate at which the Lotus application receives data.
· Transmit Rate—Rate at which the Lotus application transmits data.
· Current Bandwidth—Current bandwidth of the network.
· Total Rate—Total rate at which the Lotus application receives and transmits data.
Process Information
The Process Information area contains the following field:
Active Processes—Number of currently active processes.
Task Information
The Task Information area contains the following fields:
· Concurrent Tasks—Number of concurrent tasks on the Lotus server.
· Waiting Tasks—Number of waiting tasks on the Lotus server.
Thread Information
The Thread Information area contains the following field:
Threads—Number of threads on the Lotus server.
Database Buffer Pool Information
The Database Buffer Pool Information area contains the following fields:
· Buffer Pool Reads—Number of times that the Lotus server reads data from the buffer pool.
· Buffer Pool Writes—Number of times that the Lotus server writes data to the buffer pool.
· Buffer Pool Read Hit Ratio—Read hit ratio of the buffer pool.
Database Cache Information
The Database Cache Information area contains the following fields:
· Cache Samples—Number of samples collected by the database cache each time.
· Initial Open Databases—Number of initial open databases in the database cache.
· Cache Lookups—Number of cache lookups for the database.
· Cache Size—Size of the database cache.
· Cache Congestion Rejections—Number of rejections because of database cache congestion.
Database Cache Entity Information
The Database Cache Entity Information area contains the following fields:
· Current Entities—Number of current entities in the database cache.
· Link Entities—Number of link entities in the database cache.
· Maximum Entities—Maximum number of link entities that can be stored in the database cache.
File I/O Information
The File I/O Information area contains the following fields:
· File I/O Reads—Number of file I/O reads.
· File I/O Writes—Number of file I/O writes.
Domino Server Authentication
Lotus Domino server is collaborative office software developed by IBM and provides various types of collaboration applications. In a complicated environment, APM fails to monitor the Lotus Domino server by using the procedure described in "Lotus Domino server." This section describes how to use Domino Server Authentication to monitor the Lotus Domino server. APM supports monitoring Lotus Domino 8.5 and Lotus Domino 9.x.
Configuring the Lotus Domino server
APM uses the console.nsf plugin to monitor the Lotus Domino server application. Before a Lotus Domino server application monitor is added, contact the application administrator to configure the following settings:
1. Download the Lotus Agent installation file console.nsf:
a. Click the Resource tab.
b. Open the Add Application page by using one of the following methods:
- From the navigation tree, select Application Manager > Add Application.
- From the navigation tree, select Application Manager > Application Monitor. In the application monitor list, click Add.
The Add Application page displays all application types that can be monitored by APM.
c. Click Domino Server Authentication of the Application Server Monitor class.
The page for adding a Domino Server Authentication application monitor opens.
d. Click Help in the top right corner of the page to open the help page, and then locate Download console.nsf in the Remarks area.
e. Right-click the console.nsf link, and save the file to the data directory of the Domino Server Authentication to be monitored. By default, the default data directory is \IBM\Lotus\Domino\data of the Domino installation path.
2. Configure the console.nsf file in the IBM Domino Administrator:
a. Open the IBM Domino Administrator, and use the administrator account for login.
b. Click the Domino server icon on the left server pane, and then select the server from the navigation tree that opens.
c. On the Domino Admin tab, right-click the console.nsf file, and select Signature from the shortcut menu.
d. Click OK in the dialog box that opens.
e. Right-click the console.nsf file, and select Access Control > Management from the shortcut menu.
A dialog box opens.
f. On the Basic tab, select a database file privilege from the Permissions list in the Properties area.
The permissions must be Read or higher.
g. Click OK.
3. Configure the console.nsf file in IBM Notes:
a. Use the IBM Notes client to open the console.nsf file.
b. Select Actions > pl. Brief Table Settings to open the Lotus Agent setting page.
c. Enter the IP address that can be connected to the agent in the Trusted Server IP Address List field. In this example, enter the IP address of the APM server.
d. Enter executable commands in the Command List field.
Make sure you include the following commands:
- show stat server.
- show stat platform.
- show stat http.
- show stat mail.
- show stat disk.
Adding a Domino Server Authentication application monitor
Before you add a Domino Server Authentication application monitor, add Domino Server Authentication hosts to the IMC platform so that APM can obtain and display network connections of the hosts and their access devices in the application topology. For more information about adding hosts to the IMC platform, see H3C Intelligent Management Center v7.3 Enterprise and Standard Platform Administrator Guide.
To add a Domino Server Authentication application monitor:
1. Click the Resource tab.
2. Open the Add Application page by using one of the following methods:
¡ From the navigation tree, select Application Manager > Add Application.
¡ From the navigation tree, select Application Manager > Application Monitor. In the application monitor list, click Add.
The Add Application page displays all application types that can be monitored by APM.
3. Click Domino Server Authentication of the Application Server Monitor class.
The page for adding a Domino Server Authentication application monitor opens.
4. Configure the following parameters:
¡ IP Address—Enter the IP address of the host on which the Domino Server Authentication application to be monitored is installed. APM automatically checks the IP address and associates the application monitor with the host managed in the IMC platform. If the host is already added to the IMC platform, you can also click Select, and then select the host in the Select Devices window. For information about selecting a host, see "Quick start."
¡ Name—Enter a unique application monitor name. As a best practice, name the application monitor as application type_host IP address.
¡ Use Template—Select Enable or Disable from the list.
¡ Template—Click the Configure icon ![]() next to the Template field to select an
existing template. The Template field is
automatically populated with the name of the selected template. For more
information about configuring application templates, see "Configuration management." This field is displayed only when you select Enable from the Use Template
list.
next to the Template field to select an
existing template. The Template field is
automatically populated with the name of the selected template. For more
information about configuring application templates, see "Configuration management." This field is displayed only when you select Enable from the Use Template
list.
¡ Description—Enter a description for the application monitor.
¡ Application Monitor Port—Enter the service port number for the Domino Server Authentication, 80 by default. This field is available only when you select Disable from the Use Template list.
¡ Traffic Collection Port—Enter the service port number for Domino Server Authentication. This field is displayed only when at least one probe is configured for APM and you select Disable from the Use Template list.
¡ Polling Interval (min)—Select a polling interval for the application monitor. Available options are 1, 2, 3, 4, 5, 10, 20, and 30. The default polling interval is 5 minutes. A shorter polling interval improves real-time data accuracy at the expense of system resources. This field is available only when you select Disable from the Use Template list.
¡ Domain Name—Enter a domain name for the Domino Server Authentication in the Domain Name field. This field is available only when you select Disable from the Use Template list.
¡ Contact—Enter the contact information, such as the name, email address, and telephone number. The default is the username of the operator who created the application monitor. This field is available only when you select Disable the Use Template list.
¡ APM Server—Select an APM server to monitor the application. The options are in server-address (application-type:n/N) format. The letter n indicates the number of Domino Server Authentication applications monitored on the APM server. The letter N indicates the total number of applications monitored on the APM server. Server address 127.0.0.1 indicates that APM and the IMC platform are deployed on the same server.
¡ Related Applications—Click Add next to this field. On the Select Application window, enter a partial or complete name to filter applications, select the applications that Domino Server Authentication depends on, and then click OK.
Operating system applications cannot be selected. Operators can view all dependencies of the application in the dependency topology. APM automatically adds the dependencies between Domino Server Authentication and operating system applications by IP address and displays their dependencies in the application topology.
¡ Application Group—Specify an application group for the Domino Server Authentication application.
- To specify an existing application group, click Add, select an application group, and then click OK.
- To specify a new application group, click Add Application Group, configure the application group settings, and then click OK.
¡ Detect Application—Select this parameter if you want to enable application detection. Application detection enables APM to verify connection to the application by using the previous parameter settings, and to determine whether to add the application monitor based on the verification result. APM adds the application monitor only when it can connect to the application. When this parameter is not specified, APM adds the application monitor without verifying the connection.
5. Click OK.
Modifying a Domino Server Authentication application monitor
Authorized users can modify all parameters except the IP address and the APM server for a Domino Server Authentication application monitor. When the IP address of a monitored Domino Server Authentication host changes, operators must add a new application monitor for the host. However, the new application monitor cannot inherit the history data from the previous application monitor.
To modify a Domino Server Authentication application monitor:
1. Click the Resource tab.
2. From the navigation tree, select Application Manager > Application Monitor.
The application monitor list page opens.
3. Click the Modify
icon ![]() for the Domino Server Authentication application monitor you want
to modify.
for the Domino Server Authentication application monitor you want
to modify.
The page for modifying the Domino Server Authentication application monitor opens.
4. Modify the parameters as needed, except the IP address and the APM server.
For more information about parameter settings, see "Adding a Domino Server Authentication application monitor."
5. Click OK.
Viewing the Domino Server Authentication application monitor report
After a Domino Server Authentication application monitor is added, APM collects index data of the application, evaluates the availability and health status, and updates the monitor report. The report shows the index values obtained from the most recent polling of the application.
For more information about the Domino Server Authentication application monitor report, see "Viewing the Lotus Domino server application monitor report."
Web server monitor
This chapter describes how to add and modify certain types of application monitor, and helps you view the details of application monitor reports.
Apache server
As a stable, powerful, open-source Web server, Apache is widely used in the Internet.
APM can monitor Apache 2.x. This section describes how to add and modify an Apache server application monitor, and helps you view the details of Apache server application monitor reports.
Configuring the Apache server
APM monitors an Apache server through the Web service port (TCP 80 by default) of the Apache server. To use APM to monitor the Apache server, make sure the Apache server is loaded with the status module (mod_status.so).
To configure the Apache server and make the server correctly load the status module:
1. Use a text editor to open the Apache configuration file, http.conf.
2. Remove the number sign (#) in the front of the line displaying:
LoadModule status_module modules/mod_status.so.
3. Add the following segment to the end of the configuration file:
<location /server-status>
SetHandler server-status
Order Deny,Allow
Allow from all
</location>
ExtendedStatus On
If the configuration segment already exists in the configuration file, remove the number sign (#) in the front of the configuration segment, and modify the configuration segment into the segment above.
4. Save the configuration file, and restart the Apache server.
Adding an Apache server application monitor
When you add Apache server application monitors for an Apache server, follow these guidelines:
· Make sure the Apache server is loaded with the status module (mod_status.so). For information on configuring the Apache server and making the server load the status module, see "Configuring the Apache server."
· Add Apache server hosts to the IMC platform so APM can obtain and display network connections of the hosts and their access devices in the application topology. For more information about adding hosts to the IMC platform, see H3C Intelligent Management Center v7.3 Enterprise and Standard Platform Administrator Guide.
· To view traffic statistics in the monitor report of the Apache server application, make sure at least one probe is configured in APM. After an Apache server monitor is added, APM sends the IP address of the monitored Apache server to the probes for traffic collection.
To add an Apache server application monitor:
1. Click the Resource tab.
2. Open the Add Application page by using one of the following methods:
¡ From the navigation tree, select Application Manager > Add Application.
The page displays all application types that can be monitored by APM.
¡ From the navigation tree, select Application Manager > Application Monitor, and then click Add on the application monitor list page.
3. Click Apache Server of the Web Server Monitor class.
The page for adding an Apache server application monitor opens.
4. Configure the following parameters for the application monitor:
¡ IP Address—Enter the IP address of the host on which the Apache server to be monitored is installed. If the host is already added to the IMC platform, you can also click Select, and then select the host in the Select Devices window. For information about selecting a host, see "Quick start." APM automatically checks the specified IP address and associates the application monitor with the host managed in the IMC platform.
¡ Name—Enter a unique application monitor name. As a best practice, name the application monitor as application type_host IP address.
¡ Use Template—Select Enable or Disable from the list.
¡ Template—Click the Configure icon
![]() next to the Template field
to select an existing template. The Template field is automatically
populated with the name of the selected template. For more information about
configuring application templates, see "Configuration management." This field is displayed only when you select Enable from the Use
Template list.
next to the Template field
to select an existing template. The Template field is automatically
populated with the name of the selected template. For more information about
configuring application templates, see "Configuration management." This field is displayed only when you select Enable from the Use
Template list.
¡ Description—Enter a description for the application monitor.
¡ Application Monitor Port—Enter the port through which the Apache server provides services. The port is 80 by default. This field is available only when you select Disable from the Use Template list.
¡ Traffic Collection Port—Enter one or more service port numbers for the Apache server. The port is 80 by default. This field is displayed only when at least one probe is configured for APM. This field is available only when you select Disable from the Use Template list.
¡ Polling Interval (min)—Select a polling interval for the application monitor. Options are 1, 2, 3, 4, 5, 10, 20, and 30. The default polling interval is 5 minutes. A shorter polling interval provides more accurate realtime data, but consumes more system resources. This field is available only when you select Disable from the Use Template list.
¡ Contact—Enter the contact information, such as the name, email address, and telephone number. The default is the username of the operator who created the application monitor. This field is available only when you select Disable from the Use Template list.
¡ APM Server—Select an APM server to monitor the application. The options are in server-address (application-type:n/N) format. The letter n indicates the number of Apache server applications monitored on the APM server. The letter N indicates the total number of applications monitored on the APM server. Server address 127.0.0.1 indicates that APM and the IMC platform are deployed on the same server.
¡ Related Application—Click Add next to this field. On the Select Application dialog box that opens, select the application that the Apache server application depends on.
- Enter the complete or part of the application monitor name in the Search field at the top of the page, and then click Search.
- Select the application that the Apache server application depends on.
- Click OK.
Operating system applications cannot be selected. Operators can view all dependencies of the application in the dependency topology. APM automatically adds the dependency between the Apache server and the operating system applications by IP address and displays their dependencies in the application topology.
¡ Application Group—Specify an application group for the Apache server application.
- To specify an existing application group, click Add, select an application group, and then click OK.
- To specify a new application group, click Add Application Group, configure the application group settings, and then click OK.
¡ Detect Application—Select this parameter if you want to enable application detection. Application detection enables APM to verify connection to the application by using the previous parameter settings, and to determine whether to add the application monitor based on the verification result. APM adds the application monitor only when it can connect to the application. When this parameter is not selected, APM adds the application monitor without verifying the connection.
5. Click OK.
Modifying an Apache server application monitor
Authorized users can modify all parameters except the IP address and the APM server for the Apache server application monitor. When the IP address of a monitored Apache server host changes, operators must add a new application monitor for the host. The new application monitor cannot inherit the history data from the previous application monitor.
To modify an Apache server application monitor:
1. Click the Resource tab.
2. From the navigation tree, select Application Manager > Application Monitor.
The application monitor list page displays all application monitors.
3. Click the Modify
icon![]() for the Apache server application monitor you want to modify.
for the Apache server application monitor you want to modify.
The page for modifying an Apache server application monitor opens.
4. Modify the parameters as needed, except the IP address and the APM server.
For more information about parameter settings, see "Adding an Apache server application monitor."
Viewing the Apache server application monitor report
After an Apache server application monitor is added, APM collects index data of the application, and calculates its availability and health status. You can obtain monitor indexes for the Apache server application by viewing the monitor report.
To access the Apache server application monitor report:
1. Click the Resource tab.
2. From the navigation tree, select Application Manager > Application Monitor.
The application monitor list page displays all application monitors.
3. Click the name of an Apache server application monitor to display the report.
Figure 89 shows part of an Apache server application monitor report.
Figure 89 Part of an Apache server application monitor report
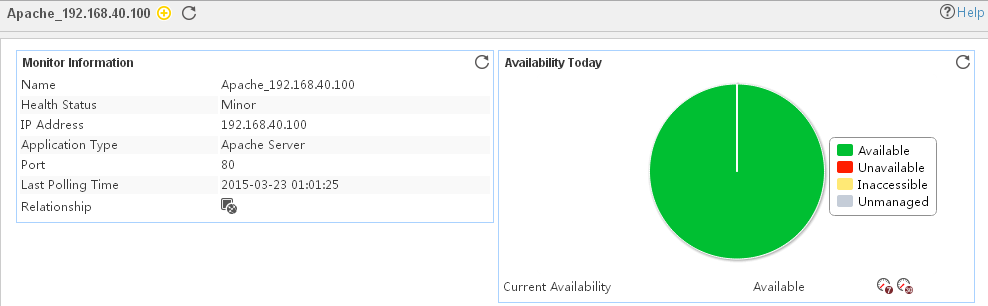
Monitor Information
The Monitor Information area contains the following fields:
· Name—Application monitor name.
· Health State—Health state of the Apache server.
· IP Address—IP address of the Apache server.
· Application Type—Type of the monitored application, which is always Apache Server.
· Port—Enter the port through which the Apache server provides Web services.
· Version–Version of Apache.
· Server Uptime—Uptime of the Apache server when APM last polled the Apache server.
· Total Bytes—Number of bytes of the page requests received by the Apache server when APM last polled the Apache server.
· Total Accesses—Number of page requests received by the Apache server when APM last polled the Apache server.
· Last Polling Time—Time when APM last polled the Apache server.
· Relationship—Click the Related
Applications icon ![]() to view dependencies between the Apache server and other
applications in a dependency topology view. For more information
about dependency topologies, see "Topology and application group management."
to view dependencies between the Apache server and other
applications in a dependency topology view. For more information
about dependency topologies, see "Topology and application group management."
· Top5 Unrecovered Alarm—Latest five unrecovered alarms on the Apache server. This field is not displayed if no alarm is generated by the Apache server. The alarm level is identified by color: yellow for minor alarms, orange for major alarms, and red for critical alarms.
Availability Today
The Availability Today area contains the following fields:
· Current Availability—Availability of the Apache server.
¡ Click the Weekly History icon![]() to view the availability of the Apache server in the last 7 days.
to view the availability of the Apache server in the last 7 days.
¡ Click the Monthly
History icon![]() to view the availability of the Apache server in the last 30 days.
to view the availability of the Apache server in the last 30 days.
· Available Time—Total amount of time that the Apache server was available after 00:00 today.
· Unavailable Time—Total amount of time that the Apache server was unavailable after 00:00 today.
· Inaccessible Time—Total amount of time that the Apache server was inaccessible after 00:00 today.
· Unmanaged Time—Total amount of time that the Apache server was unmanaged after 00:00 today.
The statistics collection started when the application monitor was added. An availability time field is not displayed if its value is 0.
Request Number
The Request Number area contains the following fields:
· Requests/Sec—Average number of requests received by the Apache server per second from the startup time of the Apache server to the time when APM last polled the Apache server.
¡ Click
the Set Threshold icon ![]() to set alarm
thresholds for the number of requests received per
second.
to set alarm
thresholds for the number of requests received per
second.
¡ Click
the History Record icon ![]() to view the history graph for the number of
requests received per second.
to view the history graph for the number of
requests received per second.
· Bytes/Sec—Average number of bytes received by the Apache server per second from the startup time of the Apache server to the time when APM last polled the Apache server.
¡ Click
the Set Threshold icon ![]() to set alarm
thresholds for the bytes received per second.
to set alarm
thresholds for the bytes received per second.
¡ Click
the History Record icon ![]() to view the history graph for the bytes received
per second.
to view the history graph for the bytes received
per second.
· Bytes/Request—Average size of requests received by the Apache server.
¡ Click
the Set Threshold icon ![]() to set alarm
thresholds for the average size
of requests received by the Apache server per second.
to set alarm
thresholds for the average size
of requests received by the Apache server per second.
¡ Click
the History Record icon ![]() to view the history graph for the average size of requests received by the Apache server per second.
to view the history graph for the average size of requests received by the Apache server per second.
Application Traffic
The Application Traffic area contains the following fields:
· Last Hour's Traffic—Total traffic received and sent by the Apache server over the last 1 hour.
· Today's Traffic—Total traffic received and sent by the Apache server since 00:00 today.
IIS server
IIS is a Web server developed by Microsoft, and provides Web services on Windows servers. Applications such as Exchange and ASP provide Web services through IIS.
APM can monitor IIS 6.0 or later versions. This section describes how to add/modify an IIS server application monitor, and helps you view the details of IIS server application monitor reports.
Adding an IIS server application monitor
APM monitors the IIS server performance through WMI. When you add application monitors for an IIS server, follow these guidelines:
· Configure and enable WMI for the Windows operating system on which the IIS server is installed. For information about enabling WMI for Windows, see Microsoft Windows Server online help.
· Add the host installed with the IIS server to the IMC platform so the connection information between the host and the access device can be obtained. For information on adding a host to the IMC platform, see H3C Intelligent Management Center v7.3 Enterprise and Standard Platform Administrator Guide.
· Add IIS server hosts to the IMC platform so APM can obtain and display network connections of the hosts and their access devices in the application topology. For more information about adding hosts to the IMC platform, see H3C Intelligent Management Center v7.3 Enterprise and Standard Platform Administrator Guide.
· Obtain the correct username and password of the user who has the Windows administrator's privileges.
· To view traffic statistics in the monitor report of the IIS server application, make sure at least one probe is configured in APM. After an IIS server monitor is added, APM sends the IP address of the monitored IIS server to the probes for traffic collection.
To add an IIS server application monitor:
1. Click the Resource tab.
2. Open the Add Application page by using one of the following methods:
¡ From the navigation tree, select Application Manager > Add Application.
The page displays all application types that can be monitored by APM.
¡ From the navigation tree, select Application Manager > Application Monitor. Click Add on the application monitor list page.
3. Click IIS Server of the Web Server Monitor class.
The page for adding an IIS server application monitor opens.
4. Configure the following parameters for the application monitor:
¡ IP Address—Enter the IP address of the host on which the IIS server to be monitored is installed. If the host is already added to the IMC platform, you can also click Select, and then select the host in the Select Devices window. For information about selecting a host, see "Quick start." APM automatically checks the specified IP address and associates the application monitor with the host managed in the IMC platform.
¡ Name—Enter a unique application monitor name. As a best practice, name the application monitor as application type_host IP address.
¡ Use Template—Select Enable or Disable from the list.
¡ Template—Click
the Configure icon ![]() next to the Template field to select an existing template. The Template field
is automatically populated with the name of the selected template. For more
information about configuring application templates, see "Configuration management." This field is displayed only when you select Enable from the Use
Template list.
next to the Template field to select an existing template. The Template field
is automatically populated with the name of the selected template. For more
information about configuring application templates, see "Configuration management." This field is displayed only when you select Enable from the Use
Template list.
¡ Description—Enter a description for the application monitor.
¡ Application Monitor Port—Enter the port through which the IIS server provides Web services. The port is 80 by default. This field is available only when you select Disable from the Use Template list.
¡ Traffic Collection Port—Enter a service port number for the IIS server. The port is 80 by default. This field is displayed only when at least one probe is configured for APM. This field is available only when you select Disable from the Use Template list.
¡ Polling Interval (min)—Select a polling interval for the application monitor. Options are 1, 2, 3, 4, 5, 10, 20, and 30. The default polling interval is 5 minutes. A shorter polling interval provides more accurate realtime data, but consumes more system resources. This field is available only when you select Disable from the Use Template list.
¡ Contact—Enter the contact information, such as the name, email address, and telephone number. The default is the username of the operator who created the application monitor. This field is available only when you select Disable from the Use Template list.
¡ Username/Password—Enter the username and password of the host administrator. This field is available only when you select Disable from the Use Template list.
- If the administrator is a domain user, use the domain name\username format.
- If the administrator is a local user, use the host name\username or IP address\username format, or simply use the username.
¡ APM Server—Select an APM server to monitor the application. The options are in server-address (application-type:n/N) format. The letter n indicates the number of IIS server applications monitored on the APM server. The letter N indicates the total number of applications monitored on the APM server. Server address 127.0.0.1 indicates that APM and the IMC platform are deployed on the same server.
¡ Related Application—Click Add next to this field. On the Select Application dialog box that opens, select the application that the IIS server application depends on.
- Enter the complete or part of the application monitor name in the Search field at the top of the page, and then click Search.
- Select the application that the IIS server application depends on.
- Click OK.
Operating system applications cannot be selected. Operators can view all dependencies of the application in the dependency topology. APM automatically adds the dependencies between the IIS server and operating system applications by IP address and displays their dependencies in the application topology.
¡ Application Group—Specify an application group for the IIS server application.
- To specify an existing application group, click Add, select an application group, and then click OK.
- To specify a new application group, click Add Application Group, configure the application group settings, and then click OK.
¡ Detect Application—Select this parameter if you want to enable application detection. Application detection enables APM to verify connection to the application by using the previous parameter settings, and to determine whether to add the application monitor based on the verification result. APM adds the application monitor only when it can connect to the application. When this parameter is not selected, APM adds the application monitor without verifying the connection.
5. Click OK.
Modifying an IIS server application monitor
Authorized users can modify all parameters except the IP address and the APM server for the IIS server application monitor. When the IP address of the IIS server host changes, operators must add a new application monitor for the host. The new application monitor cannot inherit the history data from the previous application monitor.
To modify an IIS server application monitor:
1. Click the Resource tab.
2. From the navigation tree, select Application Manager > Application Monitor.
The application monitor list page displays all application monitors.
3. Click the Modify
icon ![]() for the IIS server application monitor you want to modify.
for the IIS server application monitor you want to modify.
The page for modifying an IIS server application monitor opens.
4. Modify the parameters as needed, except the IP address and the APM server.
For more information about parameter settings, see "Adding an IIS server application monitor."
Viewing the IIS server application monitor report
After an IIS server application monitor is added, APM collects application index data, evaluates the availability and health status, and updates the monitor report. The report shows the index values obtained from the most recent polling of the application.
To access the IIS server application monitor report:
1. Click the Resource tab.
2. From the navigation tree, select Application Manager > Application Monitor.
The application monitor list page displays all application monitors.
3. Click the name of an IIS server application monitor to display the report.
Figure 90 shows part of an IIS server application monitor report.
Figure 90 Part of an IIS server application monitor report
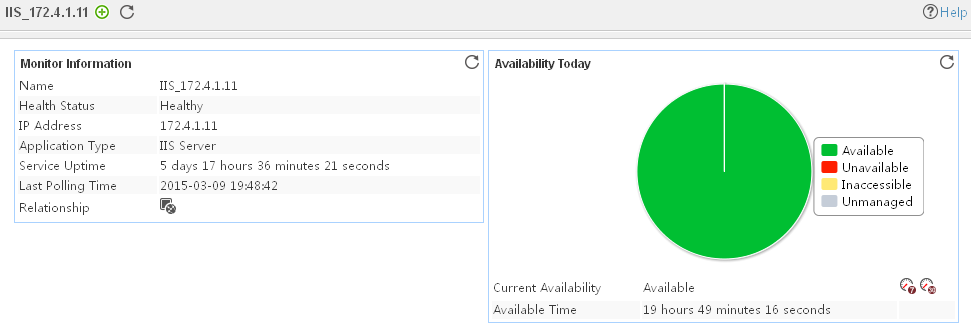
Monitor Information
The Monitor Information area contains the following fields:
· Name—Application monitor name.
· Health State—Health state of the IIS server.
· IP Address—IP address of the IIS server.
· Application Type—Type of the monitored application, which is always IIS Server.
· Service Uptime—Uptime of the IIS server when APM last polled the IIS server.
· Last Polling Time—Time when APM last polled the IIS server.
· Relationship—Click the Relationship icon ![]() to view dependencies
between the IIS server and other applications in a dependency topology view. For more information
about dependency topologies, see "Topology and application group
management."
to view dependencies
between the IIS server and other applications in a dependency topology view. For more information
about dependency topologies, see "Topology and application group
management."
· Top5 Unrecovered Alarm—Latest five unrecovered alarms on the IIS server. This field is not displayed if no alarm is generated. The alarm level is identified by color: yellow for minor alarms, orange for major alarms, and red for critical alarms.
Availability Today
The Availability Today area contains the following fields:
· Current Availability—Availability of the IIS server in the last polling period.
¡ Click
the Weekly History icon![]() to view the availability of the IIS server in the last 7 days.
to view the availability of the IIS server in the last 7 days.
¡ Click
the Monthly History icon![]() to view the availability of the IIS server in the last 30 days.
to view the availability of the IIS server in the last 30 days.
· Available Time—Total amount of time that the IIS server was available after 00:00 today.
· Unavailable Time—Total amount of time that the IIS server was unavailable after 00:00 today.
· Inaccessible Time—Total amount of time that the IIS server was inaccessible after 00:00 today.
· Unmanaged Time—Total amount of time that the IIS server was unmanaged after 00:00 today.
The statistics collection started when the application monitor was added. An availability time field is not displayed if its value is 0.
Connections
The Connections area contains the following field:
· Connections—Number of connections between the clients and the IIS server. Click
the History Record icon ![]() to view the history graph of connections.
to view the history graph of connections.
HTTP
The HTTP area contains the following fields:
· Response Time—HTTP response time of the IIS server when APM last polled the IIS server.
¡ Click
the History Record icon ![]() to view the history graph of the response
time.
to view the history graph of the response
time.
¡ Click
the Set Threshold icon ![]() to set alarm thresholds
for the response time.
to set alarm thresholds
for the response time.
· Reachable—Whether the IIS server is reachable.
Access Information
The Access Information area contains the following fields:
· Send Rate—Data sending rate of the IIS server when APM last polled the IIS
server. Click the History Record icon ![]() to view the history graph of the send rate.
to view the history graph of the send rate.
· Receive Rate—Data receiving rate of the IIS server when APM last polled the IIS
server. Click the History Record icon ![]() to view the history graph of the receive
rate.
to view the history graph of the receive
rate.
· Total Rate—Data transmitting rate of the IIS server when APM last polled the
IIS server. The total rate is approximately the sum of the send rate and the
receive rate. Click the History Record icon ![]() to view the history graph of the total rate.
to view the history graph of the total rate.
File Information
The File Information area contains the following fields:
· Files Sent/Sec—Files sent per second by the IIS server when
APM last polled the IIS server. Click the History Record icon ![]() to view the history
graph for the number of files sent per second.
to view the history
graph for the number of files sent per second.
· Files Received/Sec—Files received per second by the IIS server when APM last polled the IIS server. Click
the History Record icon ![]() to view the history graph for the number of
files received per second.
to view the history graph for the number of
files received per second.
· Files Processed/Sec—Files processed per second by the IIS server when APM last polled the IIS server. The
file process rate is approximately the sum of the file sending rate and the
file receiving rate. Click the History Record icon ![]() to view the history graph for the number of
files processed per second.
to view the history graph for the number of
files processed per second.
Anonymous Access
The Anonymous Access area contains the following fields:
· Anonymous Accesses—Number of users
accessing the IIS server by using anonymous connections when APM last polled
the IIS server. Click the History Record icon ![]() to view the history graph for the number of
anonymous accesses.
to view the history graph for the number of
anonymous accesses.
· Anonymous Accesses/Sec—Number of users
accessing the IIS server by using anonymous connections per second when APM
last polled the IIS server. Click
the History Record icon ![]() to view the history graph for the number of
anonymous accesses per second.
to view the history graph for the number of
anonymous accesses per second.
Non-Anonymous Access
The Non-Anonymous Access area contains the following fields:
· Non-Anonymous Accesses—Number of users
accessing the IIS server by using non-anonymous connections when APM last
polled the IIS server. Click the History Record
icon ![]() to view the history graph for the number of
non-anonymous accesses.
to view the history graph for the number of
non-anonymous accesses.
· Non-Anonymous Accesses/Sec—Number of users
accessing the IIS server by using non-anonymous connections per second when APM
last polled the IIS server. Click the History Record
icon ![]() to view the history graph for the number of
non-anonymous accesses per second.
to view the history graph for the number of
non-anonymous accesses per second.
Nginx server
Nginx is a stable Web and reverse proxy server, and an IMAP, POP3, and SMTP server. Nginx provides high performance and multiple functions, and occupies few system resources.
APM supports monitoring Nginx 1.9.3.
Configuring the Nginx server
APM monitors the Nginx server through the Web service port, TCP 80 by default. To monitor the Nginx server, first enable monitoring on the status module (stub_status).
To enable monitoring on the status module:
1. Use a text editor to open the nginx.conf file stored on the Nginx server.
2. Locate the following code module in the configuration file:
location /nginx_status {
……
}
¡ If the code module exists and starts with the pound sign (#), delete the pound sign (#), and then modify the contents.
To allow all hosts to access status information:
location /nginx_status {
stub_status on;
access_log off;
allow all;
}
To allow only specific hosts to access to status information:
location /nginx_status {
stub_status on;
access_log off;
allow IP; # Specify the IP addresses that are allowed to access status information
deny all;
}
¡ If the code module does not exist, add the previous code to the Server {} module in the configuration file. Typically, the added code follows the location / {...} module.
3. Save the configuration file, and then restart the Nginx server.
Adding an Nginx server application monitor
When you add Nginx server application monitors, follow these guidelines:
· Enable monitoring on the status module (stub_status). For more information, see "Configuring the Nginx server."
· Add Nginx server hosts to the IMC platform so that APM can obtain and display network connections of the hosts and their access devices in the application topology. For more information about adding hosts to the IMC platform, see H3C Intelligent Management Center v7.3 Enterprise and Standard Platform Administrator Guide.
· To view traffic statistics in the monitor report of the Nginx server application, make sure at least one probe is configured in APM. After an Nginx server application monitor is added, APM sends the IP address and service port of the monitored Nginx server application to the probes for traffic collection.
To add an Nginx server application monitor:
1. Click the Resource tab.
2. Open the Add Application page by using one of the following methods:
¡ From the navigation tree, select Application Manager > Add Application.
The page displays all application types that can be monitored by APM.
¡ From the navigation tree, select Application Manager > Application Monitor, and then click Add on the application monitor list page.
The Add Application page displays all application types that can be monitored by APM.
3. Click Nginx Server of the Web Server Monitor class.
The page for adding an Nginx server application monitor opens.
4. Configure the following parameters:
¡ IP Address—Enter the IP address of the host on which the Nginx server application to be monitored is installed. If the host is already added to the IMC platform, you can also click Select, and then select the host in the Select Devices window. For information about selecting a host, see "Quick start." APM automatically checks the specified IP address and associates the application monitor with the host managed in the IMC platform.
¡ Name—Enter a unique application monitor name. As a best practice, name the application monitor as application type_host IP address.
¡ Use Template—Select Enable or Disable from the list.
¡ Template—Click the Configure icon ![]() next to the Template field to select an
existing template. The Template field is
automatically populated with the name of the selected template. For more
information about configuring application templates, see "Configuration management." This field is displayed only when you select Enable from the Use Template
list.
next to the Template field to select an
existing template. The Template field is
automatically populated with the name of the selected template. For more
information about configuring application templates, see "Configuration management." This field is displayed only when you select Enable from the Use Template
list.
¡ Description—Enter a description for the application monitor.
¡ Application Monitor Port—Enter the service port number for the Nginx server, 80 by default. This field is available only when you select Disable from the Use Template list.
¡ Traffic Collection Port—Enter the service port number for the Nginx server. This field is displayed only when at least one probe is configured for APM and you select Disable from the Use Template list.
¡ Polling Interval (min)—Select a polling interval for the application monitor. Options are 1, 2, 3, 4, 5, 10, 20, and 30. The default polling interval is 5 minutes. A shorter polling interval provides more accurate realtime data, but consumes more system resources. This field is available only when you select Disable from the Use Template list.
¡ Relative Path—Enter the URL path where the status module resides, /nginx_status by default. This field is available only when you select Disable from the Use Template list.
¡ Contact—Enter the contact information, such as the name, email address, and telephone number. The default is the username of the operator who created the application monitor. This field is available only when you select Disable from the Use Template list.
¡ APM Server—Select an APM server to monitor the application. The options are in server-address (application-type:n/N) format. The letter n indicates the number of Nginx server applications monitored on the APM server. The letter N indicates the total number of applications monitored on the APM server. Server address 127.0.0.1 indicates that APM and the IMC platform are deployed on the same server.
¡ Related Applications—Click Add next to this field. On the Select Application window, enter a partial or complete name to filter applications, select the applications that the Nginx server depends on, and then click OK.
Operating system applications cannot be selected. Operators can view all dependencies of the application in the dependency topology.
¡ Application Group—Specify an application group for the Nginx server application.
- To specify an existing application group, click Add, select an application group, and then click OK.
- To specify a new application group, click Add Application Group, configure the application group settings, and then click OK.
¡ Detect Application—Select this parameter if you want to enable application detection. Application detection enables APM to verify connection to the application by using the previous parameter settings, and to determine whether to add the application monitor based on the verification result. APM adds the application monitor only when it can connect to the application. When this parameter is not selected, APM adds the application monitor without verifying the connection.
5. Click OK.
Modifying an Nginx server application monitor
Authorized users can modify all parameters except the IP address and the APM server for an Nginx server application monitor. When the IP address of a monitored Nginx server host changes, operators must add a new application monitor for the host. The new application monitor cannot inherit the history data from the previous application monitor.
To modify an Nginx server application monitor:
1. Click the Resource tab.
2. From the navigation tree, select Application Manager > Application Monitor.
The page displays all application types that can be monitored by APM.
3. Click the Modify icon ![]() for the Nginx
server application monitor you want to modify.
for the Nginx
server application monitor you want to modify.
The page for modifying the Nginx server application monitor opens.
4. Modify the parameters as needed, except the IP address and the APM server.
For more information about parameter settings, see "Adding an Nginx server application monitor."
5. Click OK.
Viewing the Nginx server application monitor report
After an Nginx server application monitor is added, APM collects application index data, evaluates the availability and health status, and updates the monitor report. The report shows the index values obtained from the most recent polling of the application.
To access the Nginx server application monitor report:
1. Click the Resource tab.
2. From the navigation tree, select Application Manager > Application Monitor.
The application monitor list page displays all application monitors.
3. Click the name of an Nginx server application monitor to display the report.
Figure 91 shows part of an Nginx server application monitor report.
Figure 91 Part of an Nginx server application monitor report
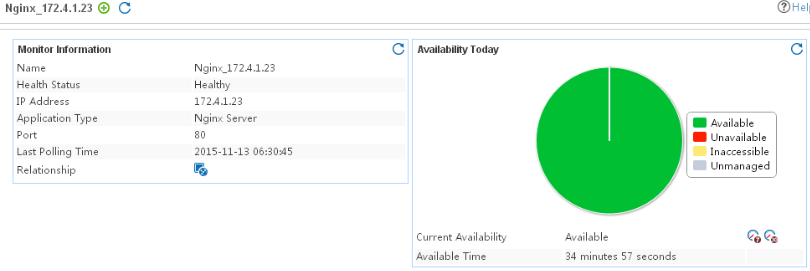
Monitor Information
The Monitor Information area contains the following fields:
· Name—Name of the Nginx server application monitor.
· Health Status—Health status of the Nginx server application.
· IP Address—IP address of the Nginx server host.
· Application Type—Type of the monitored application, which is always Nginx Server.
· Port—Web service port number used by the Nginx server.
· Last Polling Time—Time when APM last polled the Nginx server application.
· Relationship—Click the Related Applications icon ![]() to
view dependencies between the Nginx server application and other applications in
a dependency topology view. For more information about dependency topologies,
see "Topology and
application group management."
to
view dependencies between the Nginx server application and other applications in
a dependency topology view. For more information about dependency topologies,
see "Topology and
application group management."
· Top5 Unrecovered Alarm—Latest five unrecovered alarms on the Nginx server host. This field is not displayed if no alarm is generated by the Nginx server application.
Availability Today
The Availability Today area contains the following fields:
· Current Availability—Availability of the Nginx application.
¡ Click
the Weekly History icon ![]() to view the
availability of the Nginx server application in the last 7 days.
to view the
availability of the Nginx server application in the last 7 days.
¡ Click
the Monthly History icon ![]() to view the
availability of the Nginx server application in the last 30 days.
to view the
availability of the Nginx server application in the last 30 days.
· Available Time—Total amount of time that the Nginx server application was available after 00:00 today.
· Unavailable Time—Total amount of time that the Nginx application was unavailable after 00:00 today.
· Inaccessible Time—Total amount of time that the Nginx server application was inaccessible after 00:00 today.
· Unmanaged Time—Total amount of time that the Nginx server application was unmanaged after 00:00 today.
The statistics collection started when the application monitor was added. An availability time field is not displayed when its value is 0.
Response Time
The Response Time area contains the following field:
· Response Time—Period from the time when APM sends a request to the time when it receives a response for the request.
¡ Click
the Set Threshold icon ![]() to set alarm
thresholds for the response time.
to set alarm
thresholds for the response time.
¡ Click
the History Record icon ![]() to view the history graph of the response time.
to view the history graph of the response time.
Active Connections
The Active Connections area contains the following field:
· Active Connections—Number of active
connections handled by the Nginx server. Click the History
Record icon ![]() to view the history graph of active
connections.
to view the history graph of active
connections.
Connection Information
The Connection Information area contains the following fields:
· Connections/Sec—Number of connections handled by the Nginx
server per second. Click the History Record icon ![]() to view the history graph of connections per
second.
to view the history graph of connections per
second.
· Handshakes/Sec—Number of handshakes handled by the Nginx
server per second. Click the History Record icon ![]() to view the history graph of handshakes per
second.
to view the history graph of handshakes per
second.
· Requests/Sec—Number of requests handled by the Nginx
server per second. Click the History Record icon ![]() to view the history graph of requests per
second.
to view the history graph of requests per
second.
· Requests Handled by
Connection—Average
number of requests handled by the Nginx server for each connection. Click the History
Record icon ![]() to view the history graph of requests handled
by the Nginx server for each connection
to view the history graph of requests handled
by the Nginx server for each connection
· Total Connections—Total number of handled connections since
the Nginx server was started or reloaded the configuration file. Click the History
Record icon ![]() to view the history graph of total
connections.
to view the history graph of total
connections.
· Total Handshakes—Total number of handled handshakes since the
Nginx server was started or reloaded the configuration file. Click the History
Record icon ![]() to view the history graph of total
handshakes.
to view the history graph of total
handshakes.
· Total Requests—Total number of handled requests since the
Nginx server was started or reloaded the configuration file. Click the History
Record icon ![]() to view the history graph of total requests.
to view the history graph of total requests.
· Total Connection Failures—Total number of connection failures since
the Nginx server was started or reloaded the configuration file. Click the History
Record icon ![]() to view the history graph of total connection
failures.
to view the history graph of total connection
failures.
· Connection Failure Ratio—Connection failure rate in percentage since
the Nginx server was started or reloaded the configuration file. Click the History
Record icon ![]() to view the history graph of the connection
failure ratio.
to view the history graph of the connection
failure ratio.
Read/Write Information
· Message Reads—Number of Header messages the Nginx server
has received from the client since the Nginx server was started or reloaded the
configuration file. Click the History Record icon ![]() to view the history graph of message reads.
to view the history graph of message reads.
· Message Writes—Number of Header messages the Nginx server
has sent to the client since the Nginx server was started or reloaded the
configuration file. Click the History Record icon ![]() to view the history graph of message writes.
to view the history graph of message writes.
· Connections Waiting for
Request—Number of connections that are handled
by the Nginx server and are waiting for the next request. If keepalive is
enabled, this number is calculated by using the following formula: Connections
Waiting for Request = Active Connections – (Message Reads + Message Writes). Click the History Record icon ![]() to view the history graph of connections waiting
for request.
to view the history graph of connections waiting
for request.
PHP
Hypertext Preprocessor (PHP) is a scripting language embedded in the HTML text, and is usually used to develop Web programs. When a user accesses Web pages developed by using the PHP language, the Web server first delivers the Web pages with the PHP language embedded to the PHP service for parsing, and then sends the parsed pages to the user. APM can monitor the PHP service, which is responsible for parsing pages.
This section describes how to add and modify a PHP application monitor and helps you view the details of PHP application monitor reports.
Adding a PHP application monitor
APM monitors whether PHP is running properly through the Web service port (TCP 80 by default). APM requests for PHP pages from the Web server as a client, and determines whether the PHP service can normally parse the PHP pages according to the returned results. When you add a PHP server application monitor, follow these guidelines:
· Add the PHP server hosts to the IMC platform so that APM can obtain and display network connections of the hosts and their access devices in the application topology. For information on adding hosts to the IMC platform, see H3C Intelligent Management Center v7.3 Enterprise and Standard Platform Administrator Guide.
· To view traffic statistics in the monitor report of the PHP server, make sure at least one probe is configured in APM. After a PHP server monitor is added, APM sends the IP address of the monitored PHP server to the probes for traffic collection.
To add a PHP application monitor:
1. Click the Resource tab.
2. Open the Add Application page by using one of the following methods:
¡ From the navigation tree, select Application Manager > Add Application.
The page displays all application types that can be monitored by APM.
¡ From the navigation tree, select Application Manager > Application Monitor. Click Add on the application monitor list page.
3. Click PHP of the Web Server Monitor class.
The page for adding a PHP application monitor opens.
4. Configure the following parameters for the application monitor:
¡ IP Address—Enter the IP address of the host on which the PHP server to be monitored is installed. If the host is already added to the IMC platform, you can also click Select, and then select the host in the Select Devices window. For information about selecting a host, see "Quick start." APM automatically checks the specified IP address and associates the application monitor with the host managed in the IMC platform.
¡ Name—Enter a unique application monitor name. As a best practice, name the application monitor as application type_host IP address.
¡ Use Template—Select Enable or Disable from the list.
¡ Template—Click
the Configure icon ![]() next to the Template field to select an existing template. The Template field
is automatically populated with the name of the selected template. For more
information about configuring application templates, see "Configuration management." This field is displayed only when you select Enable from the Use
Template list.
next to the Template field to select an existing template. The Template field
is automatically populated with the name of the selected template. For more
information about configuring application templates, see "Configuration management." This field is displayed only when you select Enable from the Use
Template list.
¡ Description—Enter a description for the application monitor to aid maintenance.
¡ Application Monitor Port—Enter the Web service port number, which is 80 by default. This field is available only when you select Disable from the Use Template list.
¡ Traffic Collection Port—Enter a service port number for the PHP server. The port is 80 by default. This field is displayed only when at least one probe is configured for APM. This field is available only when you select Disable from the Use Template list.
¡ Polling Interval (min)—Select a polling interval for the application monitor. Options are 1, 2, 3, 4, 5, 10, 20, and 30. The default polling interval is 5 minutes. A shorter polling interval provides more accurate realtime data, but consumes more system resources. This field is available only when you select Disable from the Use Template list.
¡ Relative Path—Enter the relative path of the PHP page, which starts with a slash (/). The URL of a PHP page is in the format of http://+<IP address>+relative path, for example, http://10.154.240.55/index.php, where the relative path is /index.php. This field is available only when you select Disable from the Use Template list.
¡ Contact—Enter the contact information, such as the name, email address, and telephone number. The default is the username of the operator who created the application monitor. This field is available only when you select Disable from the Use Template list.
¡ APM Server—Select an APM server to monitor the application. The options are in server-address (application-type:n/N) format. The letter n indicates the number of PHP applications monitored on the APM server. The letter N indicates the total number of applications monitored on the APM server. Server address 127.0.0.1 indicates that APM and the IMC platform are deployed on the same server.
¡ Related Application—Click Add next to this field. On the Select Application dialog box that opens, select the application that the PHP application depends on.
- Enter the complete or part of the application monitor name in the Search field at the top of the page, and then click Search.
- Select the application that the PHP application depends on.
- Click OK.
Operating system applications cannot be selected. Operators can view all dependencies of the application in the dependency topology. APM automatically adds the dependencies between the PHP server and operating system applications by IP address and displays their dependencies in the application topology.
¡ Application Group—Specify an application group for the PHP application.
- To specify an existing application group, click Add, select an application group, and then click OK.
- To specify a new application group, click Add Application Group, configure the application group settings, and then click OK.
¡ Detect Application—Select this parameter if you want to enable application detection. Application detection enables APM to verify connection to the application by using the previous parameter settings, and to determine whether to add the application monitor based on the verification result. APM adds the application monitor only when it can connect to the application. When this parameter is not selected, APM adds the application monitor without verifying the connection.
5. Click OK.
Modifying a PHP application monitor
Authorized users can modify all parameters except the IP address and the APM server for the PHP application monitor. When the IP address of a monitored PHP host changes, operators must add a new application monitor for the host. The new application monitor cannot inherit the history data from the previous application monitor.
To modify a PHP application monitor:
1. Click the Resource tab.
2. From the navigation tree, select Application Manager > Application Monitor.
The application monitor list page displays all application monitors.
3. Click the Modify
icon ![]() for the PHP application monitor you want to modify.
for the PHP application monitor you want to modify.
The page for modifying a PHP application monitor opens.
4. Modify the parameters as needed, except the IP address and the APM server.
For more information about parameter settings, see "Adding a PHP application monitor."
5. Click OK.
Viewing the PHP application monitor report
After a PHP application monitor is added, APM collects application index data, evaluates the availability and health status, and updates the monitor report. The report shows the index values obtained from the most recent polling of the application.
To access the PHP application monitor report:
1. Click the Resource tab.
2. From the navigation tree, select Application Manager > Application Monitor.
The application monitor list page displays all application monitors.
3. Click the name of a PHP application monitor to display the report.
Figure 92 shows part of a PHP application monitor report.
Figure 92 Part of a PHP application monitor report

Monitor Information
The Monitor Information area contains the following fields:
· Name—Application monitor name.
· Health State—Health state of PHP.
· IP Address—IP address of the Web server which can parse PHP.
· Application Type—Type of the monitored application, which is always PHP.
· Port—Enter the port through which the Apache server provides Web services.
· Last Polling Time—Time when APM last polled the PHP server.
· Relationship—Click the Relationship icon ![]() to view dependencies
between PHP and other applications in a dependency topology
view. For more information about dependency topologies,
see "Topology and
application group management."
to view dependencies
between PHP and other applications in a dependency topology
view. For more information about dependency topologies,
see "Topology and
application group management."
· Top5 Unrecovered Alarm—Latest five unrecovered alarms on PHP. This field is not displayed if no alarm is generated. The alarm level is identified by color: yellow for minor alarms, orange for major alarms, and red for critical alarms.
Availability Today
The Availability Today area contains the following fields:
· Current Availability—Availability of the PHP application.
¡ Click
the Weekly History icon![]() to view the availability of the PHP application in the
last 7 days.
to view the availability of the PHP application in the
last 7 days.
¡ Click
the Monthly History icon![]() to view the availability of the PHP
application in the last 30 days.
to view the availability of the PHP
application in the last 30 days.
· Available Time—Total amount of time that PHP was available after 00:00 today.
· Unavailable Time—Total amount of time that PHP was unavailable after 00:00 today.
· Inaccessible Time—Total amount of time that PHP was inaccessible after 00:00 today.
· Unmanaged Time—Total amount of time that PHP was unmanaged after 00:00 today.
The statistics collection started when the application monitor was added. An availability time field is not displayed if its value is 0.
Response Time
The Response Time area contains the following field:
· Response Time—Response time of the PHP application. Response time refers to the length of time it takes for APM to send a request to PHP plus the length of time it takes for APM to receive the PHP response.
¡ Click
the History Record icon ![]() to view the history graph of the response
time.
to view the history graph of the response
time.
¡ Click
the Set Threshold icon ![]() to set alarm
thresholds for the response time.
to set alarm
thresholds for the response time.
Application Traffic
The Application Traffic area contains the following fields:
· Last Hour's Traffic—Total traffic received and sent by the PHP server over the last 1 hour.
· Today's Traffic—Total traffic received and sent by the PHP server since 00:00 today.
Mail server monitor
The following information describes how to add and modify mail server application monitors and how to view relevant monitor reports.
Exchange Server 2003
Adding an Exchange Server 2003 application monitor
APM monitors the Exchange Server 2003 application through WMI. When you add an Exchange Server 2003 application monitor, follow these guidelines:
· Configure and enable WMI for the Windows operating system on which Exchange Server 2003 is installed. For information about enabling WMI for Windows, see Microsoft Windows Server online help.
· Add Exchange Server 2003 hosts to the IMC platform.
For a host managed in the IMC platform, APM obtains and displays network connections of the host and its access device in the application topology. For more information about adding hosts to the IMC platform, see H3C Intelligent Management Center v7.3 Enterprise and Standard Platform Administrator Guide.
· Obtain the correct username and password of the user who has the Windows administrator's privileges.
· To view traffic statistics in the monitor report of the Exchange Server 2003 application, make sure at least one probe is configured in APM. After an Exchange Server 2003 application monitor is added, APM sends the IP address and service ports of the monitored Exchange Server 2003 application to the probes for traffic collection.
To add an Exchange Server 2003 application monitor:
1. Click the Resource tab.
2. Display the Add Application page in one of two ways:
¡ From the navigation tree, select Application Manager > Add Application.
¡ From the navigation tree, select Application Manager > Application Monitor, and then click Add on the application monitor list page.
The page displays all application types that can be monitored by APM.
3. Click Exchange 2003 of the Mail Server Monitor class.
The page for adding an Exchange Server 2003 application monitor opens.
4. Configure the following parameters for the application monitor:
¡ IP Address—Enter the IP address of the host on which the Exchange Server 2003 application to be monitored is installed. APM automatically checks the IP address and associates the application monitor with the host if it is already managed in the IMC platform. To monitor a host that is already managed in the IMC platform, you can also click Select, and then select the host in the Select Devices window. For information about selecting a host, see "Quick start."
¡ Name—Enter a unique application monitor name. As a best practice, name the application monitor as application type_host IP address.
¡ Use Template—Select Enable or Disable from the list.
¡ Template—Click
the Configure icon ![]() next to the Template field to select an existing template. The Template field
is automatically populated with the name of the selected template. For more
information about configuring application templates, see "Configuration management." This field is displayed only when you select Enable from the Use
Template list.
next to the Template field to select an existing template. The Template field
is automatically populated with the name of the selected template. For more
information about configuring application templates, see "Configuration management." This field is displayed only when you select Enable from the Use
Template list.
¡ Description—Enter a description for the application monitor.
¡ Traffic Collection Port—Enter one or more comma-separated service port numbers for Exchange Server 2003. This field is displayed only when at least one probe is configured for APM and is available only when you select Disable from the Use Template list.
¡ Polling Interval (min)—Select a polling interval for the application monitor. Options are 1, 2, 3, 4, 5, 10, 20, and 30. The default polling interval is 5 minutes. A shorter polling interval improves real-time data accuracy at the expense of system resources. This field is available only when you select Disable from the Use Template list.
¡ Username/Password—Enter the username and password of the Exchange Server 2003 administrator. The fields are available only when you select Disable from the Use Template list.
¡ Contact—Enter the contact information, such as the name, email address, and telephone number. The default is the username of the operator who created the application monitor. This field is available only when you select Disable from the Use Template list.
¡ Mailbox Path—Enter the absolute path to the mailbox file in Exchange Server 2003. This field is available only when you select Disable from the Use Template list.
¡ Public Folder Path—Enter the absolute path to the public folder in Exchange Server 2003. This field is available only when you select Disable from the Use Template list.
¡ Exchange Service—Select one or more of the following Exchange Server 2003 services to be monitored by APM:
- Microsoft Exchange IMAP4
- Microsoft Exchange Event
- Microsoft Exchange Information Store
- Microsoft Exchange Management
- Microsoft Exchange MTA Stacks
- Microsoft Exchange System Attendant
- Microsoft Exchange Site Replication Service
- Microsoft Exchange POP3
- Microsoft Exchange Routing Engine
- Simple Mail Transfer Protocol (SMTP)
¡ APM Server—Select an APM server to monitor the application. The options are in server-address (application-type:n/N) format. The letter n indicates the number of Exchange Server 2003 applications monitored on the APM server. The letter N indicates the total number of applications monitored on the APM server. Server address 127.0.0.1 indicates that APM and the IMC platform are deployed on the same server.
¡ Related Applications—Click Add next to this field. On the Select Application window, enter a partial or complete name to filter applications, select the applications that Exchange Server 2003 depends on, and then click OK.
Operating system applications cannot be selected. Operators can view all dependencies of the application in the dependency topology. APM automatically adds the dependencies between Exchange Server 2003 and operating system applications by IP address and displays their dependencies in the application topology.
¡ Application Group—Specify an application group for the Exchange Server 2003 application.
- To specify an existing application group, click Add, select an application group, and then click OK.
- To specify a new application group, click Add Application Group, configure the application group settings, and then click OK.
¡ Detect Application—Select this parameter if you want to enable application detection. APM verifies the application connectivity by using the previous parameter settings, and adds the application monitor only when it can connect to the application. If you do not select this parameter, APM adds the application monitor without verifying the application connectivity.
5. Click OK.
Modifying an Exchange Server 2003 application monitor
Authorized users can modify all parameters except the IP address and the APM server for an Exchange Server 2003 application monitor. When the IP address of a monitored Exchange Server 2003 host changes, operators must add a new application monitor for the host. The new application monitor cannot inherit the history data from the previous application monitor.
To modify an Exchange Server 2003 application monitor:
1. Click the Resource tab
2. From the navigation tree, select Application Manager > Application Monitor.
The application monitor list page opens.
3. Click the Modify icon ![]() for the Exchange 2003 application monitor you want to modify.
for the Exchange 2003 application monitor you want to modify.
The page for modifying the Exchange Server 2003 application monitor opens.
4. Modify the parameters as needed, except the IP address and the APM server.
For more information about parameter settings, see "Adding an Exchange Server 2003 application monitor."
5. Click OK.
Viewing the Exchange Server 2003 application monitor report
After an Exchange Server 2003 application monitor is added, APM collects application index data, evaluates the availability and health status, and updates the monitor report. The report shows the index values obtained from the most recent polling of the application.
To view the Exchange Server 2003 application monitor report:
1. Click the Resource tab.
2. From the navigation tree, select Application Manager > Application Monitor.
The application monitor list page displays all application monitors.
3. Click the name of an Exchange Server 2003 application monitor to display the report.
Figure 93 shows part of an Exchange Server 2003 application monitor report.
Figure 93 Part of an Exchange Server 2003 application monitor report
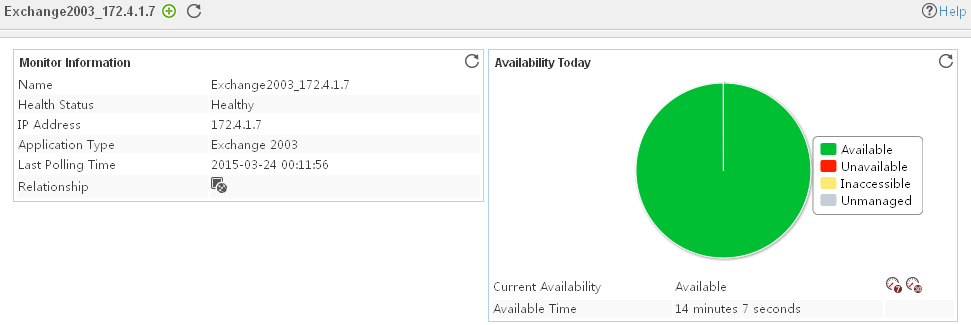
Monitor Information
The Monitor Information area contains the following fields:
· Name—Application monitor name.
· Health State—Health status of the Exchange Server 2003 application.
· IP Address—IP address of the Exchange Server 2003 host.
· Application Type—Type of the monitored application, which is always Exchange 2003.
· Last Polling Time—Time when APM last polled the Exchange Server 2003 application.
· Relationship—Click the Relationship icon ![]() to view dependencies between the Exchange Server 2003 application and other applications in a dependency topology view. For more information about dependency
topologies, see "Topology and application group management."
to view dependencies between the Exchange Server 2003 application and other applications in a dependency topology view. For more information about dependency
topologies, see "Topology and application group management."
· Top5 Unrecovered Alarms—Latest five unrecovered alarms on the Exchange Server 2003 host. The alarm level is identified by color: yellow for minor alarms, orange for major alarms, and red for critical alarms. If no alarm is generated by Exchange Server 2003, this field is not displayed.
Availability Today
The Availability Today area contains the following fields:
· Current Availability—Availability of the Exchange Server 2003 application.
¡ Click
the Weekly History icon![]() to view the availability of the Exchange Server
2003 in the last 7 days.
to view the availability of the Exchange Server
2003 in the last 7 days.
¡ Click
the Monthly History icon![]() to view the availability of the Exchange Server
2003 in the last 30 days.
to view the availability of the Exchange Server
2003 in the last 30 days.
· Available Time—Total amount of time that Exchange Server 2003 was available after 00:00 today.
· Unavailable Time—Total amount of time that Exchange Server 2003 was unavailable after 00:00 today.
· Inaccessible Time—Total amount of time that Exchange Server 2003 was inaccessible after 00:00 today.
· Unmanaged Time—Total amount of time that Exchange Server 2003 was unmanaged after 00:00 today.
The statistics collection started when the application monitor was added. An availability time field is not displayed if its value is 0.
IMAP
The IMAP area contains the following field:
· Current Connections—Number of IMAP connections used by the Exchange Server 2003 application.
POP
The POP area contains the following field:
· Current Connections—Number of POP connections used by the Exchange Server 2003 application.
Mailbox
Exchange Server allows you to organize the Exchange information store into multiple storage groups for mailbox storage and public folder storage management.
· Storage group—A storage group contains log and assistant files to manage the databases that belong to the storage group. An Exchange Server 2003 host supports up to four storage groups, each of which supports up to five databases. Databases apply to mailbox storage and public folder storage.
· Mailbox storage—Stores mailbox data of one or more users.
· Public folder storage—Stores public folder data of one or more users.
The Mailbox area shows the mailbox usage of Exchange Server 2003. If the Exchange Server 2003 host has multiple mailboxes, this area displays the overall usage of them.
The Mailbox area contains the following fields:
· Size—Disk space occupied by all mailboxes.
· Rx Queue Length—Number of mail messages in the mailbox receive queue.
· Tx Queue Length—Number of mail messages in the mailbox transmit queue.
· Active Clients—Number of clients that operated a mailbox in the last 10 minutes.
· Total Logins—Number of clients logging in to the mailboxes. The number also includes the system processes.
· Logins/Sec—Number of login requests to the mailboxes per second.
· Recipients Delivered/Min—Number of mails delivered to the recipients per minute.
· Messages Delivered/Min—Average number of mail messages delivered from mailboxes to recipients per minute.
· Messages Sent/Min—Average number of mail messages sent to the mailbox transmit queue per minute.
Public Folder
The Public Folder area shows the public folder usage of Exchange Server 2003. If the Exchange Server 2003 host has multiple public folders, this area displays the overall usage of them.
The Public Folder area contains the following fields:
· Size—Disk space occupied by all public folders.
· Tx Queue Length—Number of mail messages in the public folder storage transmit queue.
· Rx Queue Length—Number of mail messages in the public folder storage receive queue.
· Active Clients—Number of clients that operated a public folder in the last 10 minutes.
· Total Logins—Number of clients logging in to the public folders. The number also includes the system processes.
· Logins/Sec—Number of login requests to the mailboxes per second.
· Messages Delivered/Min—Average number of mail messages delivered from public folders to recipients per minute.
· Recipients Delivered/Min—Number of mails delivered to the recipients per minute.
· Messages Sent/Min—Average number of mail messages sent to the public folder transmit queue per minute.
· Messages Submitted/Min—Average number of mail messages submitted from mail clients to public folders per minute.
Statistics
The Statistics area monitors storage usage of Exchange Server 2003.
The Statistics area contains the following fields:
· Active Connections—Number of connections to a mailbox or public folder in the last 10 minutes.
· Connections—Number of client connections to the Exchange information store.
· Active Users—Number of users that have performed operations in the last 10 minutes.
SRS
The SRS area displays replications between Exchange Server 2003 servers. The site replication service (SRS) performs replications between multiple Exchange Server 2003 servers to reduce the server load.
The SRS area contains the following fields:
· Uncompleted Replications—Number of replications between sites that have not been completed in the queue.
· Left Replication Updates—Number of received replication updates that have not been applied to the local server.
AL
The AL area contains the following field:
· Address List Queue Length—Length of the address list queue.
ES
The ES area contains the following field:
· Notification Queue—Number of notifications to be processed.
MTA Statistics
The MTA Statistics area monitors operation of the Message Transport Agent (MTA) of Exchange Server 2003.
The MTA Statistics area contains the following fields:
· Working Queue Length—Number of mail messages that have not been processed by MTA in the working queue.
· Bytes/Min—Number of bytes of mail messages processed by MTA per minute.
· Bytes Received/Min—Number of bytes received by MTA through TCP/IP connections per minute.
· Bytes Sent/Min—Number of bytes sent by MTA through TCP/IP connections per minute.
· Recipient Queues—Total number of recipients of all mail messages in MTA.
· Working Queue Bytes—Total number of bytes of all mail messages in MTA.
TD Statistics
The TD Statistics area monitors operation of the transport driver of Exchange Server 2003.
The TD Statistics area contains the following fields:
· Message to Send—Number of mail messages delivered to the message database (MDB). MDB is a database instance of Exchange Server 2003. MDB can be identified as mailbox or public folder storage based on the stored data type.
· Message from MTA to IS—Number of mail messages delivered from MTA to information storage (IS).
· Message from IS to MTA—Number of mail messages delivered from IS to MTA.
· Host Cache Hits—Number of cache hits.
Service
The Service area can monitor the following Exchange Server 2003 services:
· Microsoft Exchange IMAP4
· Microsoft Exchange Event
· Microsoft Exchange Information Store
· Microsoft Exchange Management
· Microsoft Exchange MTA Stacks
· Microsoft Exchange System Attendant
· Microsoft Exchange Site Replication Service
· Microsoft Exchange POP3
· Microsoft Exchange Routing Engine
· Simple Mail Transfer Protocol (SMTP)
If one or more services were not selected when the Exchange Server 2003 monitor was added, they cannot be monitored. For more information, see "Adding an Exchange Server 2003 application monitor."
The Service area contains the following fields:
· Service Name—Original name of the service.
· Display Name—Service name or alias displayed on the Windows service console. For example, on the Windows service console, the Exchange Server 2003 MTA service uses the alias Microsoft Exchange MTA Stacks instead of the original name MSExchangeMTA. Typically, the display name identifies a service more clearly.
· Status—Service state when APM last polled Exchange Server 2003.
SMTP Statistics
The SMTP Statistics area contains the following fields:
· Inbound Connections—Total number of inbound SMTP connections for the Exchange Server 2003 application.
· Outbound Connections—Total number of outbound SMTP connections for the Exchange Server 2003 application.
· Local Retry Queue Length—Retry queue length of mail messages locally delivered by Exchange Server 2003 application.
· Local Queue Length—Queue length of mail messages locally delivered by the Exchange Server 2003 application.
· Remote Retry Queue Length—Retry queue length of mail messages delivered to the external mail system of the Exchange Server 2003 application.
· Remote Queue Length—Queue length of mail messages delivered to the external mail system of the Exchange Server 2003 application.
· Messages to Route—Number of mail messages to route by the Exchange Server 2003 application.
· Messages Sent—Number of mail messages processed and locally sent by the Exchange Server 2003 application.
· Messages Unsent—Number of mail messages failed to be delivered by the Exchange Server 2003 application.
· Classified Queue Length—Number of mail messages in the classified queue of the Exchange Server 2003 application.
Exchange Server 2007
The Microsoft Exchange Server 2007 provides mail services for domain users by cooperating with Active Directory. It supports SMTP, POP3, and IMAP4 mail protocols.
· Mailbox role
· Client Access role
· Hub Transport role
· Unified Messaging Server role
· Edge Transport Server role
Adding an Exchange Server 2007 application monitor
APM monitors the Exchange Server 2007 application through WMI. When you add an Exchange Server 2007 application monitor, follow these guidelines:
· Configure and enable WMI for the Windows operating system on which Exchange Server 2007 is installed. For information about enabling WMI for Windows, see Microsoft Windows Server online help.
· Add the Exchange Server 2007 host to be monitored to the IMC platform.
For a host managed in the IMC platform, APM obtains and displays network connections of the host and its access device in the application topology. For more information about adding hosts to the IMC platform, see H3C Intelligent Management Center v7.3 Enterprise and Standard Platform Administrator Guide.
· Obtain the correct username and password of the user who has the Windows administrator's privileges.
· To view traffic statistics in the monitor report of the Exchange Server 2007 application, make sure at least one probe is configured in APM. After an Exchange Server 2007 application monitor is added, APM sends the IP address and service ports of the monitored Exchange Server 2007 application to the probes for traffic collection.
To add an Exchange Server 2007 application monitor:
1. Click the Resource tab.
2. Display the Add Application page in two ways:
¡ From the navigation tree, select Application Manager > Add Application.
¡ From the navigation tree, select Application Manager > Application Monitor, and then click Add on the application monitor list page.
The page displays all application types that can be monitored by APM.
3. Click Exchange 2007 of the Mail Server Monitor class.
The page for adding an Exchange Server 2007 application monitor opens.
4. Configure the following parameters for the application monitor:
¡ IP Address—Enter the IP address of the host on which the Exchange Server 2007 application to be monitored is installed. APM automatically checks the IP address and associates the application monitor with the host if it is already managed in the IMC platform. To monitor a host that is already managed in the IMC platform, you can also click Select, and then select the host in the Select Devices window. For information about selecting a host, see "Quick start."
¡ Name—Enter a unique application monitor name. As a best practice, name the application monitor as application type_host IP address.
¡ Use Template—Select Enable or Disable from the list.
¡ Template—Click
the Configure icon ![]() next to the Template field to select an existing template. The Template field
is automatically populated with the name of the selected template. For more
information about configuring application templates, see "Configuration management." This field is displayed only when you select Enable from the Use
Template list.
next to the Template field to select an existing template. The Template field
is automatically populated with the name of the selected template. For more
information about configuring application templates, see "Configuration management." This field is displayed only when you select Enable from the Use
Template list.
¡ Description—Enter a description for the application monitor.
¡ Traffic Collection Port—Enter one or more comma-separated service port numbers for Exchange Server 2007. This field is displayed only when at least one probe is configured for APM and is available only when you select Disable from the Use Template list.
¡ Polling Interval (min)—Select a polling interval for the application monitor. Options are 1, 2, 3, 4, 5, 10, 20, and 30. The default polling interval is 5 minutes. A shorter polling interval improves real-time data accuracy at the expense of system resources. This field is available only when you select Disable from the Use Template list.
¡ Username/Password—Enter the username and password of the Exchange Server 2007 administrator. The fields are available only when you select Disable from the Use Template list.
¡ Contact—Enter the contact information, such as the name, email address, and telephone number. The default is the username of the operator who created the application monitor. This field is available only when you select Disable from the Use Template list.
¡ Exchange Service—Select the Exchange 2007 services to be monitored by APM according to the server roles of Exchange Server 2007. The available services vary with the server roles deployed and include:
- Microsoft Exchange Active Directory Topology
- Microsoft Exchange Anti-spam Update
- Microsoft Exchange EdgeSync
- Microsoft Exchange File Distribution
- Microsoft Exchange IMAP4
- Microsoft Exchange Information Store
- Microsoft Exchange Mailbox Assistants
- Microsoft Exchange Mail Submission
- Microsoft Exchange Monitoring
- Microsoft Exchange POP3
- Microsoft Exchange Replication
- Microsoft Exchange System Attendant
- Microsoft Exchange Search Indexer
- Microsoft Exchange Service Host
- Microsoft Exchange Transport
- Microsoft Exchange Transport Log Search
- Microsoft Exchange Unified Messaging
- Microsoft Search (Exchange)
- Microsoft Exchange ADAM
- Microsoft Exchange Edge Credential Service
¡ APM Server—Select an APM server to monitor the application. The options are in server-address (application-type:n/N) format. The letter n indicates the number of Exchange Server 2007 applications monitored on the APM server. The letter N indicates the total number of applications monitored on the APM server. Server address 127.0.0.1 indicates that APM and the IMC platform are deployed on the same server.
¡ Related Applications—Click Add next to this field. On the Select Application window, enter a partial or complete name to filter applications, select the applications that Exchange Server 2007 depends on, and then click OK.
Operating system applications cannot be selected. Operators can view all dependencies of the application in the dependency topology. APM automatically adds the dependencies between Exchange Server 2007 and operating system applications by IP address and displays their dependencies in the application topology.
¡ Application Group—Specify an application group for the Exchange Server 2007 application.
- To specify an existing application group, click Add, select an application group, and then click OK.
- To specify a new application group, click Add Application Group, configure the application group settings, and then click OK.
¡ Detect Application—Select this parameter if you want to enable application detection. APM verifies the application connectivity by using the previous parameter settings, and adds the application monitor only when it can connect to the application. If you do not select this parameter, APM adds the application monitor without verifying the application connectivity.
5. Click OK.
Modifying an Exchange Server 2007 application monitor
Authorized users can modify all parameters except the IP address and the APM server for an Exchange Server 2007 application monitor. If the IP address of a monitored Exchange Server 2007 changes, add a new application monitor for the host. The new application monitor cannot inherit the history data from the previous application monitor.
To modify an Exchange Server 2007 application monitor:
1. Click the Resource tab.
2. From the navigation tree, select Application Manager > Application Monitor.
The application monitor list page opens.
3. Click the Modify icon ![]() for the Exchange 2007 application
monitor you want to modify.
for the Exchange 2007 application
monitor you want to modify.
The page for modifying the Exchange Server 2007 application monitor opens.
4. Modify the parameters as needed, except the IP address and the APM server.
For more information about parameter settings, see "Adding an Exchange Server 2007 application monitor."
5. Click OK.
Viewing the Exchange Server 2007 application monitor report
After an Exchange Server 2007 application monitor is added, APM collects application index data, evaluates the availability and health status, and updates the monitor report. The report shows the index values obtained from the most recent polling of the application.
To view the Exchange Server 2007 application monitor report:
1. Click the Resource tab.
2. From the navigation tree, select Application Manager > Application Monitor.
The application monitor list page displays all application monitors.
3. Click the name of an Exchange Server 2007 application monitor to display the report.
Figure 94 shows part of an Exchange Server 2007 application monitor report.
Figure 94 Part of an Exchange Server 2007 application monitor report
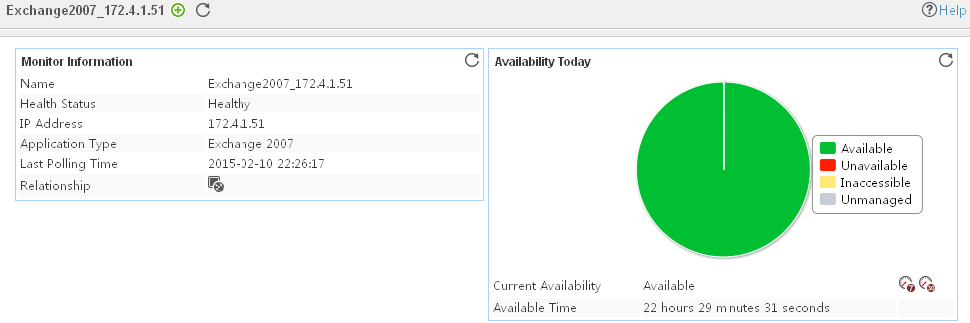
Monitor Information
The Monitor Information area contains the following fields:
· Name—Application monitor name.
· Health State—Health status of the Exchange Server 2007 application.
· IP Address—IP address of the Exchange Server 2007 host.
· Application Type—Type of the monitored application. It is always Exchange 2007 for an Exchange Server 2007 application monitor.
· Last Polling Time—Time when APM last polled the Exchange Server 2007 application.
· Relationship—Click the Relationship icon ![]() to view dependencies between the Exchange Server 2007 application and other applications in a dependency topology view. For more information about dependency
topologies, see "Topology and application group management."
to view dependencies between the Exchange Server 2007 application and other applications in a dependency topology view. For more information about dependency
topologies, see "Topology and application group management."
· Top5 Unrecovered Alarms—Latest five unrecovered alarms on the Exchange Server 2007 host. The alarm level is identified by color: yellow for minor alarms, orange for major alarms, and red for critical alarms. If no alarm is generated by Exchange Server 2007, this field is not displayed.
Availability Today
The Availability Today area contains the following fields:
· Current Availability—Availability of the Exchange Server 2007 application.
¡ Click
the Weekly History icon![]() to view the availability of the Exchange Server
2007 in
the last 7 days.
to view the availability of the Exchange Server
2007 in
the last 7 days.
¡ Click
the Monthly History icon![]() to view the availability of the Exchange Server
2007 in
the last 30 days.
to view the availability of the Exchange Server
2007 in
the last 30 days.
· Available Time—Total amount of time that Exchange Server 2007 was available after 00:00 today.
· Unavailable Time—Total amount of time that Exchange Server 2007 was unavailable after 00:00 today.
· Inaccessible Time—Total amount of time that Exchange Server 2007 was inaccessible after 00:00 today.
· Unmanaged Time—Total amount of time that Exchange Server 2007 was unmanaged after 00:00 today.
The statistics collection started when the application monitor was added. An availability time field is not displayed if its value is 0.
IMAP4
The IMAP4 area contains the following field:
· Current IMAP4 Connections—Number of IMAP4 connections used by the Exchange Server 2007 application.
¡ Click
the History Record icon ![]() to view the history graph for the number of
current IMAP4 connections.
to view the history graph for the number of
current IMAP4 connections.
¡ Click
the Set Threshold icon ![]() to set alarm
thresholds for the number of current IMAP4 connections.
to set alarm
thresholds for the number of current IMAP4 connections.
POP3
The POP3 area contains the following field:
· Current POP3 Connections—Number of POP3 connections used by the Exchange Server 2007 application.
¡ Click
the History Record icon ![]() to view the history graph for the number of current POP3 connections.
to view the history graph for the number of current POP3 connections.
¡ Click
the Set Threshold icon ![]() to set alarm
thresholds for the number of current POP3 connections.
to set alarm
thresholds for the number of current POP3 connections.
SMTP Send
The SMTP Send area contains the following fields:
· Connections—Number of outbound SMTP connections used by the Exchange Server 2007 application.
¡ Click
the History Record icon ![]() to view the history graph for the number of
outbound SMTP connections.
to view the history graph for the number of
outbound SMTP connections.
¡ Click
the Set Threshold icon ![]() to set alarm
thresholds for the number of outbound SMTP connections.
to set alarm
thresholds for the number of outbound SMTP connections.
· Messages Sent/Sec—Number of mail messages sent per second by the SMTP service used by the Exchange Server 2007 application.
¡ Click
the History Record icon ![]() to view the history graph for the number of
mail messages sent per second.
to view the history graph for the number of
mail messages sent per second.
¡ Click
the Set Threshold icon ![]() to set alarm
thresholds for the number of mail messages sent per second.
to set alarm
thresholds for the number of mail messages sent per second.
SMTP Receive
The SMTP Receive area contains the following fields:
· Connections—Number of inbound SMTP connections.
¡ Click
the History Record icon ![]() to view the history graph for the number of
inbound SMTP connections.
to view the history graph for the number of
inbound SMTP connections.
¡ Click
the Set Threshold icon ![]() to set alarm
thresholds for the number of inbound SMTP connections.
to set alarm
thresholds for the number of inbound SMTP connections.
· Messages Received/Sec—Number of mail messages received by the SMTP service per second.
¡ Click
the History Record icon ![]() to view the history graph for the number of
mail messages received by the SMTP service per second.
to view the history graph for the number of
mail messages received by the SMTP service per second.
¡ Click
the Set Threshold icon ![]() to set alarm
thresholds for the number of mail
messages received by the SMTP service per second.
to set alarm
thresholds for the number of mail
messages received by the SMTP service per second.
Buffer State
The Buffer State area contains the following fields:
· Uncompleted RPC Requests—Number of RPC requests that have not been processed.
· RPC Requests Sent/Sec—Number of RPC requests sent per second.
· Average Delay—Average delay of RPC requests.
· Active Connections—Number of active connections in all connection caches.
· Idle Connections—Number of idle connections in all connection caches.
· Connections—Number of connection caches on the Exchange Server 2007 host.
· Buffer Capability—Total size of connection caches on the Exchange Server 2007 host.
Transmit Queue State
The Transmit Queue State area contains the following fields:
· Active Mailbox Delivery Queue Length—Number of mail messages in the active mailbox delivery queue.
· Message for Delivery/Sec—Number of items to be delivered per second.
· Messages for Delivery/Sec—Number of mail messages added to the mailbox transmit queue and to be delivered per second.
· Mailbox Redelivery Queue Length—Number of mail messages in the redelivery queue.
· Remote Redelivery Queue Length—Number of mail messages to be delivered in the remote redelivery queue.
· Messages Submitted/Sec—Number of mail messages added to the submit queue per second.
Service Availability
The Availability Service area contains the following field:
· Session Hits/Sec—Number of session hits in the mailbox per second.
Active Directory Access State
The Active Directory Access State area contains the following fields:
· Buffer Hits/Sec—Number of active directory buffer hits per second.
· Buffer Failures/Sec—Number of active directory buffer hit failures per second.
· LDAP Queries/Sec—Number of LDAP query requests sent by Exchange Server 2007 per second.
· Uncompleted Asynchronous Reads—Number of LDAP asynchronous read requests that have not been completed by Exchange Server 2007.
Application Traffic
APM collects Exchange 2007 traffic based on the IP address and port number of Exchange 2007.
The Application Traffic area contains the following fields:
· Last Hour's Traffic—Total traffic sent and received by Exchange 2007 server over the last 1 hour.
· Today's Traffic—Total traffic sent and received by Exchange 2007 server since 00:00 today.
Availability State
The Availability State area contains the following fields:
· Available Requests/Sec—Number of client requests received by the availability service per second.
· Public Folder Queries/Sec—Number of client requests to get the availability information from public folders per second.
· Public Folder Request Failures/Sec—Number of client request failures to get the availability information from public folders per second.
Service
The Service area monitors the following Exchange Server 2007 services:
· Microsoft Exchange Active Directory Topology
· Microsoft Exchange Anti-spam Update
· Microsoft Exchange EdgeSync
· Microsoft Exchange File Distribution
· Microsoft Exchange IMAP4
· Microsoft Exchange Information Store
· Microsoft Exchange Mailbox Assistants
· Microsoft Exchange Mail Submission
· Microsoft Exchange Monitoring
· Microsoft Exchange POP3
· Microsoft Exchange Replication
· Microsoft Exchange System Attendant
· Microsoft Exchange Search Indexer
· Microsoft Exchange Service Host
· Microsoft Exchange Transport
· Microsoft Exchange Transport Log Search
· Microsoft Exchange Unified Messaging
· Microsoft Search (Exchange)
· Microsoft Exchange ADAM
· Microsoft Exchange Edge Credential Service
If one or more services were not selected when the Exchange Server 2007 monitor was added, they cannot be monitored. For more information, see "Adding an Exchange Server 2007 application monitor."
The Service area contains the following fields:
· Service Name—Original name of the service.
· Display Name—Service name or alias displayed on the Windows service console. For example, on the Windows service console, the Exchange Server 2007 MTA service uses the alias Microsoft Exchange MTA Stacks instead of the original name MSExchangeMTA. Typically, the display name identifies a service more clearly.
· Status—Service state of the Exchange Server 2007 application.
· More—Click More to view status of all services that are being monitored.
Exchange Server 2010
The Microsoft Exchange Server 2010 provides mail services for domain users by cooperating with Active Directory. It supports SMTP, POP3, and IMAP4 mail protocols.
Adding an Exchange Server 2010 application monitor
APM monitors the Exchange Server 2010 application through WMI. When you add an Exchange Server 2010 application monitor, follow these guidelines:
· Configure and enable WMI for the Windows operating system on which Exchange Server 2010 is installed. For information about enabling WMI for Windows, see Microsoft Windows Server online help.
· Add the Exchange Server 2010 host to be monitored to the IMC platform.
For a host managed in the IMC platform, APM obtains and displays network connections of the host and its access device in the application topology. For more information about adding hosts to the IMC platform, see H3C Intelligent Management Center v7.3 Enterprise and Standard Platform Administrator Guide.
· Obtain the username and password of the user who has the Windows administrator's privileges.
· To view traffic statistics in the monitor report of the Exchange Server 2010 application, make sure at least one probe is configured in APM. After an Exchange Server 2010 application monitor is added, APM sends the IP address and service ports of the monitored Exchange Server 2010 application to the probes for traffic collection.
To add an Exchange Server 2010 application monitor:
1. Click the Resource tab.
2. Display the Add Application page in one of two ways:
¡ From the navigation tree, select Application Manager > Add Application.
¡ From the navigation tree, select Application Manager > Application Monitor, and then click Add on the application monitor list page.
The page displays all application types that can be monitored by APM.
3. Click Exchange 2010 of the Mail Server Monitor class.
The page for adding an Exchange Server 2010 application monitor opens.
4. Configure the following parameters for the application monitor:
¡ IP Address—Enter the IP address of the host on which the Exchange Server 2010 application to be monitored is installed. APM automatically checks the IP address and associates the application monitor with the host if it is already managed in the IMC platform. To monitor a host that is already managed in the IMC platform, you can also click Select, and then select the host in the Select Devices window. For information about selecting a host, see "Quick start."
¡ Name—Enter a unique application monitor name. As a best practice, name the application monitor as application type_host IP address.
¡ Use Template—Select Enable or Disable from the list.
¡ Template—Click
the Configure icon ![]() next to the Template field to select an existing template. The Template field
is automatically populated with the name of the selected template. For more
information about configuring application templates, see "Configuration management." This field is displayed only when you select Enable from the Use
Template list.
next to the Template field to select an existing template. The Template field
is automatically populated with the name of the selected template. For more
information about configuring application templates, see "Configuration management." This field is displayed only when you select Enable from the Use
Template list.
¡ Description—Enter a description for the application monitor.
¡ Traffic Collection Port—Enter one or more comma-separated service port numbers for Exchange Server 2010. This field is displayed only when at least one probe is configured for APM and is available only when you select Disable from the Use Template list.
¡ Polling Interval (min)—Select a polling interval for the application monitor. Options are 1, 2, 3, 4, 5, 10, 20, and 30. The default polling interval is 5 minutes. A shorter polling interval improves real-time data accuracy at the expense of system resources. This field is available only when you select Disable from the Use Template list.
¡ Username/Password—Enter the username and password of the Exchange Server 2010 administrator. The fields are available only when you select Disable from the Use Template list.
¡ Contact—Enter the contact information, such as the name, email address, and telephone number. The default is the username of the operator who created the application monitor. This field is available only when you select Disable from the Use Template list.
¡ Exchange Service—Select one or more of the following Exchange Server 2010 services to be monitored by APM:
- Microsoft Exchange Active Directory Topology
- Microsoft Exchange Anti-spam Update
- Microsoft Exchange EdgeSync
- Microsoft Exchange File Distribution
- Microsoft Exchange IMAP4
- Microsoft Exchange Information Store
- Microsoft Exchange Mail Submission
- Microsoft Exchange Mailbox Assistants
- Microsoft Exchange Replication
- Microsoft Exchange Monitoring
- Microsoft Exchange POP3
- Microsoft Exchange Service Host
- Microsoft Exchange Search Indexer
- Microsoft Exchange Transport
- Microsoft Exchange Transport Log Search
- Microsoft Search (Exchange)
- Microsoft Exchange System Attendant
- Microsoft Exchange Address Book
- Microsoft Exchange Mailbox Replication
- Microsoft Exchange Protected Service Host
- Microsoft Exchange RPC Client Access
- Microsoft Exchange Server Extension for Windows Server Backup
- Microsoft Exchange Throttling
- Microsoft Exchange Forms-Based Authentication
¡ APM Server—Select an APM server to monitor the application. The options are in server-address (application-type:n/N) format. The letter n indicates the number of Exchange Server 2010 applications monitored on the APM server. The letter N indicates the total number of applications monitored on the APM server. Server address 127.0.0.1 indicates that APM and the IMC platform are deployed on the same server.
¡ Related Applications—Click Add next to this field. On the Select Application window, enter a partial or complete name to filter applications, select the applications that Exchange Server 2010 depends on, and then click OK.
Operating system applications cannot be selected. Operators can view all dependencies of the application in the dependency topology. APM automatically adds the dependencies between Exchange Server 2010 and operating system applications by IP address and displays their dependencies in the application topology.
¡ Application Group—Specify an application group for the Exchange Server 2010 application.
- To specify an existing application group, click Add, select an application group, and then click OK.
- To specify a new application group, click Add Application Group, configure the application group settings, and then click OK.
¡ Detect Application—Select this parameter if you want to enable application detection. APM verifies the application connectivity by using the previous parameter settings, and adds the application monitor only when it can connect to the application. If you do not select this parameter, APM adds the application monitor without verifying the application connectivity.
5. Click OK.
Modifying an Exchange Server 2010 application monitor
Authorized users can modify all parameters except the IP address and the APM server for an Exchange Server 2010 application monitor. If the IP address of a monitored Exchange Server 2010 host changes, add a new application monitor for the host. The new application monitor cannot inherit the history data from the previous application monitor.
To modify an Exchange Server 2010 application monitor:
1. Click the Resource tab
2. From the navigation tree, select Application Manager > Application Monitor.
The application monitor list page opens.
3. Click the Modify icon ![]() for the Exchange 2010 application monitor you want to modify.
for the Exchange 2010 application monitor you want to modify.
The page for modifying the Exchange Server 2010 application monitor opens.
4. Modify the parameters as needed, except the IP address and the APM server.
For more information about parameter settings, see "Adding an Exchange Server 2010 application monitor."
5. Click OK.
Viewing the Exchange Server 2010 application monitor report
After an Exchange Server 2010 application monitor is added, APM collects application index data, evaluates the availability and health status, and updates the monitor report. The report shows the index values obtained from the most recent polling of the application.
To view the Exchange Server 2010 application monitor report:
1. Click the Resource tab.
2. From the navigation tree, select Application Manager > Application Monitor.
The application monitor list page displays all application monitors.
3. Click the name of an Exchange Server 2010 application monitor to display the report.
Figure 94 shows part of an Exchange Server 2010 application monitor report.
Figure 95 Part of an Exchange Server 2010 application monitor report
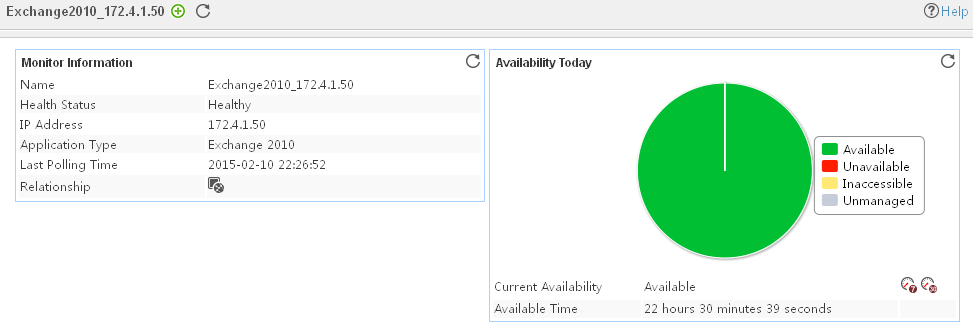
Monitor Information
The Monitor Information area contains the following fields:
· Name—Application monitor name.
· Health State—Health status of the Exchange Server 2010 application.
· IP Address—IP address of the Exchange Server 2010 host.
· Application Type—Type of the monitored application. It is always Exchange 2010 for an Exchange Server 2010 application monitor.
· Last Polling Time—Time when APM last polled the Exchange Server 2010 application.
· Relationship—Click the Relationship icon ![]() to view dependencies between the Exchange Server 2010 application and other applications in a dependency topology view. For more information about dependency
topologies, see "Topology and application group
management."
to view dependencies between the Exchange Server 2010 application and other applications in a dependency topology view. For more information about dependency
topologies, see "Topology and application group
management."
· Top5 Unrecovered Alarms—Latest five unrecovered alarms on the Exchange Server 2010 host. The alarm level is identified by color: yellow for minor alarms, orange for major alarms, and red for critical alarms. If no alarm is generated by Exchange Server 2010, this field is not displayed.
Availability Today
The Availability Today area contains the following fields:
· Current Availability—Availability of the Exchange Server 2010 application.
¡ Click
the Weekly History icon![]() to view the availability of the Exchange Server 2010
in the last 7 days.
to view the availability of the Exchange Server 2010
in the last 7 days.
¡ Click
the Monthly History icon![]() to view the availability of the Exchange Server
2010 in the last 30 days.
to view the availability of the Exchange Server
2010 in the last 30 days.
· Available Time—Total amount of time that Exchange Server 2010 was available after 00:00 today.
· Unavailable Time—Total amount of time that Exchange Server 2010 was unavailable after 00:00 today.
· Inaccessible Time—Total amount of time that Exchange Server 2010 was inaccessible after 00:00 today.
· Unmanaged Time—Total amount of time that Exchange Server 2010 was unmanaged after 00:00 today.
The statistics collection started when the application monitor was added. An availability time field is not displayed if its value is 0.
IMAP
The IMAP area contains the following field:
· Current IMAP Connections—Number of IMAP connections used by the Exchange Server 2010 application.
¡ Click
the History Record icon ![]() to view the history graph for the number of
current IMAP connections.
to view the history graph for the number of
current IMAP connections.
¡ Click
the Set Threshold icon ![]() to set alarm
thresholds for the number of current IMAP connections.
to set alarm
thresholds for the number of current IMAP connections.
POP
The POP area contains the following field:
· Current POP Connections—Number of POP connections used by the Exchange Server 2010 application.
¡ Click
the History Record icon ![]() to view the history graph for the number of POP connections.
to view the history graph for the number of POP connections.
¡ Click
the Set Threshold icon ![]() to set alarm
thresholds for the number of
POP connections.
to set alarm
thresholds for the number of
POP connections.
SMTP Send
The SMTP Send area contains the following fields:
· Connections—Number of outbound SMTP connections.
¡ Click
the History Record icon ![]() to view the history graph for the number of
outbound SMTP connections.
to view the history graph for the number of
outbound SMTP connections.
¡ Click
the Set Threshold icon ![]() to set alarm
thresholds for the number of outbound SMTP connections.
to set alarm
thresholds for the number of outbound SMTP connections.
· Messages Sent/Sec—Number of mail messages sent per second by the SMTP service.
¡ Click
the History Record icon ![]() to view the history graph for the number of mail messages sent by
the SMTP service per second.
to view the history graph for the number of mail messages sent by
the SMTP service per second.
¡ Click
the Set Threshold icon ![]() to set alarm
thresholds for the number of
mail messages sent by the SMTP service per second.
to set alarm
thresholds for the number of
mail messages sent by the SMTP service per second.
SMTP Receive
The SMTP Receive area contains the following fields:
· Connections—Number of inbound SMTP connections.
¡ Click
the History Record icon ![]() to view the history graph for the number of
inbound SMTP connections.
to view the history graph for the number of
inbound SMTP connections.
¡ Click
the Set Threshold icon ![]() to set alarm
thresholds for the number of inbound
SMTP connections.
to set alarm
thresholds for the number of inbound
SMTP connections.
· Messages Received/Sec—Number of mail messages received by the SMTP service per second.
¡ Click
the History Record icon ![]() to view the history graph for the number of mail messages received by the SMTP service per second.
to view the history graph for the number of mail messages received by the SMTP service per second.
¡ Click
the Set Threshold icon ![]() to set alarm
thresholds for the number of
mail messages received by the
SMTP service per second.
to set alarm
thresholds for the number of
mail messages received by the
SMTP service per second.
Buffer State
The Buffer State area contains the following fields:
· Uncompleted RPC Requests—Number of RPC requests that have not been processed.
· RPC Requests Sent/Sec—Number of RPC requests sent per second.
· Average Delay—Average delay of RPC requests.
· Active Connections—Number of active connections in all connection caches.
· Idle Connections—Number of idle connections in all connection caches.
· Connections—Number of connection caches on the Exchange Server 2010 host.
· Buffer Capability—Total size of connection caches on the Exchange Server 2010 host.
Transmit Queue State
The Transmit Queue State area contains the following fields:
· Active Mailbox Delivery Queue Length—Number of mail messages in the active mailbox delivery queue.
· Message for Delivery/Sec—Number of items to be delivered per second.
· Messages for Delivery/Sec—Number of mail messages added to the mailbox transmit queue and to be delivered per second.
· Mailbox Redelivery Queue Length—Number of mail messages in the redelivery queue.
· Remote Redelivery Queue Length—Number of mail messages to be delivered in the remote redelivery queue.
· Messages Submitted/Sec—Number of mail messages added to the submit queue per second.
Availability State
The Availability State area contains the following fields:
· Available Requests/Sec—Number of client requests received by the availability service per second.
· Public Folder Queries/Sec—Number of client requests to get the availability information from public folders per second.
· Public Folder Request Failures/Sec—Number of client request failures to get the availability information from public folders per second.
Active Directory Access State
The Active Directory Access State area contains the following fields:
· Buffer Hits/Sec—Number of active directory buffer hits per second.
· Buffer Failures/Sec—Number of active directory buffer hit failures per second.
· LDAP Queries/Sec—Number of LDAP query requests sent by Exchange Server 2010 per second.
· Uncompleted Asynchronous Reads—Number of LDAP asynchronous read requests that have not been completed by Exchange Server 2010.
Application Traffic
APM collects Exchange 2010 traffic based on the IP address and port number of Exchange Server 2010.
The Application Traffic area contains the following fields:
· Last Hour's Traffic—Total traffic sent and received by Exchange 2010 server over the last 1 hour.
· Today's Traffic—Total traffic sent and received by Exchange 2010 server since 00:00 today.
Service
The Service area contains the following fields:
· Service Name—Original name of the service.
· Display Name—Service name or alias displayed on the Windows service console. For example, on the Windows service console, the Exchange address book service uses the alias Microsoft Exchange Address Book instead of the original name MSExchangeAB. Typically, the display name identifies a service more clearly.
· Status—Running status of the service.
· More—Click More to view status of all services that are being monitored.
Exchange Server 2013
The Microsoft Exchange Server 2013 provides mail services for domain users by cooperating with Active Directory. It supports SMTP, POP3, and IMAP4 mail protocols.
Adding an Exchange Server 2013 application monitor
APM monitors the Exchange Server 2013 application through WMI. When you add an Exchange Server 2013 application monitor, follow these guidelines:
· Configure and enable WMI for the Windows operating system on which Exchange Server 2013 is installed. For information about enabling WMI for Windows, see Microsoft Windows Server online help.
· Add the Exchange Server 2013 host to be monitored to the IMC platform.
For a host managed in the IMC platform, APM obtains and displays network connections of the host and its access device in the application topology. For more information about adding hosts to the IMC platform, see H3C Intelligent Management Center v7.3 Enterprise and Standard Platform Administrator Guide.
· Obtain the username and password of the user who has the Windows administrator's privileges.
· To view traffic statistics in the monitor report of the Exchange Server 2013 application, make sure at least one probe is configured in APM. After an Exchange Server 2013 application monitor is added, APM sends the IP address and service ports of the monitored Exchange Server 2013 application to the probes for traffic collection.
To add an Exchange Server 2013 application monitor:
1. Click the Resource tab.
2. Display the Add Application page in one of two ways:
¡ From the navigation tree, select Application Manager > Add Application.
¡ From the navigation tree, select Application Manager > Application Monitor, and then click Add on the application monitor list page.
The page displays all application types that can be monitored by APM.
3. Click Exchange 2013 of the Mail Server Monitor class.
The page for adding an Exchange Server 2013 application monitor opens.
4. Configure the following parameters for the application monitor:
¡ IP Address—Enter the IP address of the host on which the Exchange Server 2013 application to be monitored is installed. APM automatically checks the IP address and associates the application monitor with the host if it is already managed in the IMC platform. To monitor a host that is already managed in the IMC platform, you can also click Select, and then select the host in the Select Devices window. For information about selecting a host, see "Quick start."
¡ Name—Enter a unique application monitor name. As a best practice, name the application monitor as application type_host IP address.
¡ Use Template—Select Enable or Disable from the list.
¡ Template—Click the Configure icon ![]() next to the Template field to select an
existing template. The Template field is
automatically populated with the name of the selected template. For more
information about configuring application templates, see "Configuration management." This field is displayed only when you select Enable from the Use Template
list.
next to the Template field to select an
existing template. The Template field is
automatically populated with the name of the selected template. For more
information about configuring application templates, see "Configuration management." This field is displayed only when you select Enable from the Use Template
list.
¡ Description—Enter a description for the application monitor.
¡ Traffic Collection Port—Enter one or more comma-separated service port numbers for Exchange Server 2013. This field is displayed only when at least one probe is configured for APM and is available only when you select Disable from the Use Template list.
¡ Polling Interval (min)—Select a polling interval for the application monitor. Options are 1, 2, 3, 4, 5, 10, 20, and 30. The default polling interval is 5 minutes. A shorter polling interval improves real-time data accuracy at the expense of system resources. This field is available only when you select Disable from the Use Template list.
¡ Username/Password—Enter the username and password of the Exchange Server 2013 administrator. The fields are available only when you select Disable from the Use Template list.
¡ Contact—Enter the contact information, such as the name, email address, and telephone number. The default is the username of the operator who created the application monitor. This field is available only when you select Disable from the Use Template list.
¡ Exchange Service—Select one or more of the following Exchange Server 2013 services to be monitored by APM:
- Microsoft Exchange Active Directory Topology
- Microsoft Exchange Anti-spam Update
- Microsoft Exchange Mailbox Transport Delivery
- Microsoft Exchange Diagnostics
- Microsoft Exchange EdgeSync
- Microsoft Exchange Health Manager
- Microsoft Exchange IMAP4 Backend
- Microsoft Exchange Information Store
- Microsoft Exchange Mailbox Replication
- Microsoft Exchange Migration Workflow
- Microsoft Exchange POP3 Backend
- Microsoft Exchange RPC Client Access
- Microsoft Exchange Service Host
- Microsoft Exchange Mailbox Transport Submission
- Microsoft Exchange Transport
- Microsoft Exchange Transport Log Search
- Microsoft Exchange Unified Messaging
- Tracing Service for Search in Exchange
- Microsoft Exchange Server Extension for Windows Server Backup
- Microsoft Exchange Mailbox Assistants
- Microsoft Exchange Throttling
- Microsoft Exchange Replication
- Microsoft Exchange DAG Management
- Microsoft Exchange Search
- Microsoft Exchange Frontend Transport
- Microsoft Exchange IMAP4
- Microsoft Exchange POP3
- Microsoft Exchange Unified Messaging Call Router
¡ APM Server—Select an APM server to monitor the application. The options are in server-address (application-type:n/N) format. The letter n indicates the number of Exchange Server 2013 applications monitored on the APM server. The letter N indicates the total number of applications monitored on the APM server. Server address 127.0.0.1 indicates that APM and the IMC platform are deployed on the same server.
¡ Related Applications—Click Add next to this field. On the Select Application window, enter a partial or complete name to filter applications, select the applications that Exchange Server 2013 depends on, and then click OK.
Operating system applications cannot be selected. Operators can view all dependencies of the application in the dependency topology. APM automatically adds the dependencies between Exchange Server 2013 and operating system applications by IP address and displays their dependencies in the application topology.
¡ Application Group—Specify an application group for the Exchange Server 2013 application.
- To specify an existing application group, click Add, select an application group, and then click OK.
- To specify a new application group, click Add Application Group, configure the application group settings, and then click OK.
¡ Detect Application—Select this parameter if you want to enable application detection. APM verifies the application connectivity by using the previous parameter settings, and adds the application monitor only when it can connect to the application. If you do not select this parameter, APM adds the application monitor without verifying the application connectivity.
5. Click OK.
Modifying an Exchange Server 2013 application monitor
Authorized users can modify all parameters except the IP address and the APM server for an Exchange Server 2013 application monitor. If the IP address of a monitored Exchange Server 2013 host changes, add a new application monitor for the host. The new application monitor cannot inherit the history data from the previous application monitor.
To modify an Exchange Server 2013 application monitor:
1. Click the Resource tab
2. From the navigation tree, select Application Manager > Application Monitor.
The application monitor list page opens.
3. Click the Modify
icon ![]() for the Exchange 2013 application
monitor you want to modify.
for the Exchange 2013 application
monitor you want to modify.
The page for modifying the Exchange Server 2013 application monitor opens.
4. Modify the parameters as needed, except the IP address and the APM server.
For more information about parameter settings, see "Adding an Exchange Server 2013 application monitor."
5. Click OK.
Viewing the Exchange Server 2013 application monitor report
After an Exchange Server 2013 application monitor is added, APM collects application index data, evaluates the availability and health status, and updates the monitor report. The report shows the index values obtained from the most recent polling of the application.
To view the Exchange Server 2013 application monitor report:
1. Click the Resource tab.
2. From the navigation tree, select Application Manager > Application Monitor.
The application monitor list page displays all application monitors.
3. Click the name of an Exchange Server 2013 application monitor to display the report.
Figure 96 shows part of an Exchange Server 2013 application monitor report.
Figure 96 Part of an Exchange Server 2013 application monitor report
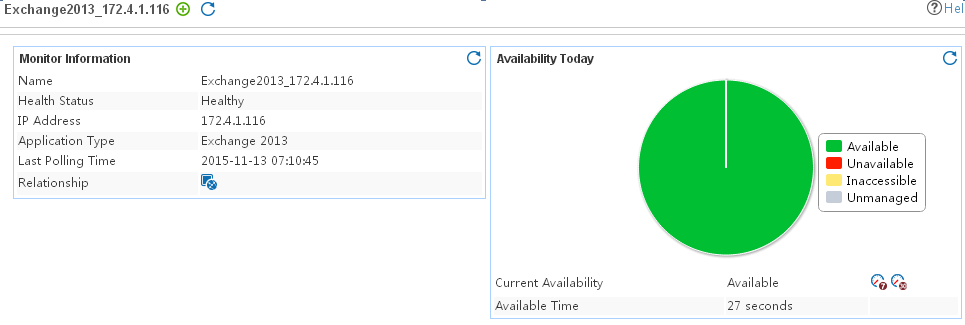
Monitor Information
The Monitor Information area contains the following fields:
· Name—Name of the application monitor.
· Health Status—Health status of the Exchange Server 2013 application.
· IP Address—IP address of the Exchange Server 2013 host.
· Application Type—Type of the monitored application, which is always Exchange 2013.
· Last Polling Time—Time when APM last polled the Exchange Server 2013 application.
· Relationship—Click the Relationship icon ![]() to view dependencies between the Exchange Server 2013 application and
other applications in a dependency topology view. For more information about
dependency topologies, see "Topology and application group
management."
to view dependencies between the Exchange Server 2013 application and
other applications in a dependency topology view. For more information about
dependency topologies, see "Topology and application group
management."
· Top5 Unrecovered Alarms—Latest five unrecovered alarms on the Exchange Server 2013 host. The alarm level is identified by color: yellow for minor alarms, orange for major alarms, and red for critical alarms. If no alarm is generated by Exchange Server 2013, this field is not displayed.
Availability Today
The Availability Today area contains the following fields:
· Current Availability—Availability of the Exchange Server 2013 application.
¡ Click
the Weekly History icon![]() to view the availability of Exchange Server 2013 in the last 7 days.
to view the availability of Exchange Server 2013 in the last 7 days.
¡ Click
the Monthly History icon![]() to view the availability of Exchange Server 2013 in the last 30
days.
to view the availability of Exchange Server 2013 in the last 30
days.
· Available Time—Total amount of time that Exchange Server 2013 was available after 00:00 today.
· Unavailable Time—Total amount of time that Exchange Server 2013 was unavailable after 00:00 today.
· Inaccessible Time—Total amount of time that Exchange Server 2013 was inaccessible after 00:00 today.
· Unmanaged Time—Total amount of time that Exchange Server 2013 was unmanaged after 00:00 today.
The statistics collection started when the application monitor was added. An availability time field is not displayed if its value is 0.
IMAP
The IMAP area contains the following field:
· Current Connections—Number of IMAP4 connections used by the Exchange Server 2013 application.
¡ Click
the History Record icon ![]() to view the history graph for the number of current IMAP4 connections.
to view the history graph for the number of current IMAP4 connections.
¡ Click
the Set Threshold icon ![]() to set alarm
thresholds for the number of current IMAP4 connections.
to set alarm
thresholds for the number of current IMAP4 connections.
POP
The POP area contains the following field:
· Current Connections—Number of POP connections used by the Exchange Server 2013 application.
¡ Click
the History Record icon ![]() to view the history graph for the number of POP connections.
to view the history graph for the number of POP connections.
¡ Click
the Set Threshold icon ![]() to set alarm
thresholds for the number of POP connections.
to set alarm
thresholds for the number of POP connections.
SMTP Send
The SMTP Send area contains the following fields:
· Connections—Number of outbound SMTP connections.
¡ Click
the History Record icon ![]() to view the history graph for the number of outbound SMTP
connections.
to view the history graph for the number of outbound SMTP
connections.
¡ Click
the Set Threshold icon ![]() to set alarm
thresholds for the number of outbound SMTP connections.
to set alarm
thresholds for the number of outbound SMTP connections.
· Messages Sent/Sec—Number of mail messages sent per second by the SMTP service.
¡ Click
the History Record icon ![]() to view the history graph for the number of mail messages sent by
the SMTP service per second.
to view the history graph for the number of mail messages sent by
the SMTP service per second.
¡ Click
the Set Threshold icon ![]() to set alarm
thresholds for the number of mail messages sent by the SMTP service per second.
to set alarm
thresholds for the number of mail messages sent by the SMTP service per second.
SMTP Receive
The SMTP Receive area contains the following fields:
· Connections—Number of inbound SMTP connections.
¡ Click
the History Record icon ![]() to view the history graph for the number of inbound SMTP
connections.
to view the history graph for the number of inbound SMTP
connections.
¡ Click
the Set Threshold icon ![]() to set alarm
thresholds for the number of inbound SMTP connections.
to set alarm
thresholds for the number of inbound SMTP connections.
· Messages Received/Sec—Number of mail messages received by the SMTP service per second.
¡ Click
the History Record icon ![]() to view the history graph for the number of mail messages received by
the SMTP service per second.
to view the history graph for the number of mail messages received by
the SMTP service per second.
¡ Click
the Set Threshold icon ![]() to set alarm
thresholds for the number of mail messages received by the SMTP service per
second.
to set alarm
thresholds for the number of mail messages received by the SMTP service per
second.
Transmit Queue State
The Transmit Queue State area contains the following fields:
· Active Mailbox Delivery Queue Length—Number of mail messages in the active mailbox delivery queue.
· Message for Delivery/Sec—Number of items to be delivered per second.
· Messages for Delivery/Sec—Number of mail messages added to the mailbox transmit queue and to be delivered per second.
· Mailbox Redelivery Queue Length—Number of mail messages in the redelivery queue.
· Messages Submitted/Sec—Number of mail messages added to the submit queue per second.
Availability State
The Availability State area contains the following fields:
· Available Requests/Sec—Number of client requests received by the availability service per second.
· Public Folder Queries/Sec—Number of client requests to get the availability information from public folders per second.
· Public Folder Request Failures/Sec—Number of client request failures to get the availability information from public folders per second.
Application Traffic
The Application Traffic area contains the following fields:
· Last Hour's Traffic—Total traffic sent and received by Exchange 2013 server over the last 1 hour.
· Today's Traffic—Total traffic sent and received by Exchange 2013 server since 00:00 today.
Service
The Service area contains the following fields:
· Service Name—Original name of the service.
· Display Name—Service name or alias displayed on the Windows service console. For example, on the Windows service console, the Exchange address book service uses the alias Microsoft Exchange Address Book instead of the original name MSExchangeAB. Typically, the display name identifies a service more clearly.
· Status—Running status of the service.
· More—Click More to view the status of all services that are being monitored.
POP3
The Post Office Protocol with version 3 (POP3) enables local email clients to retrieve mail messages from a remote mail server to their local hosts for management. Most mail servers support POP3.
Adding a POP3 application monitor
APM monitor the POP3 application through the POP3 service port (110 by default). Before adding a POP3 application monitor, follow these guidelines:
· Add the host that provides the POP3 service to be monitored to the IMC platform.
For a host managed in the IMC platform, APM obtains and displays network connections of the host and its access device in the application topology. For information about adding hosts to the IMC platform, see H3C Intelligent Management Center v7.3 Enterprise and Standard Platform Administrator Guide.
· Obtain the email address and mailbox account information to test the POP3 service by using APM as an email client.
· To view traffic statistics in the monitor report of the POP3 application, make sure at least one probe is configured in APM. After a POP3 application monitor is added, APM sends the IP address and service ports of the monitored POP3 application to the probes for traffic collection.
To add a POP3 application monitor:
1. Click the Resource tab.
2. Open the Add Application page by using one of the following methods:
¡ From the navigation tree, select Application Manager > Add Application.
¡ From the navigation tree, select Application Manager > Application Monitor, and then click Add on the application monitor list page.
The page displays all application types that can be monitored by APM.
3. Click POP3 of the Mail Server Monitor class.
The page for adding a POP3 application monitor opens.
4. Configure the following parameters for the application monitor:
¡ IP Address—Enter the IP address of the host on which the POP3 application to be monitored is installed. APM automatically checks the IP address and associates the application monitor with the host if it is already managed in the IMC platform. To monitor a host that is already managed in the IMC platform, you can also click Select, and then select the host in the Select Devices window. For information about selecting a host, see "Quick start."
¡ Name—Enter a unique application monitor name. As a best practice, name the application monitor as application type_host IP address.
¡ Use Template—Select Enable or Disable from the list.
¡ Template—Click
the Configure icon ![]() next to the Template field to select an existing template. The Template field
is automatically populated with the name of the selected template. For more
information about configuring application templates, see "Configuration management." This field is displayed only when you select Enable from the Use
Template list.
next to the Template field to select an existing template. The Template field
is automatically populated with the name of the selected template. For more
information about configuring application templates, see "Configuration management." This field is displayed only when you select Enable from the Use
Template list.
¡ Description—Enter a description for the application monitor.
¡ Application Monitor Port—Enter the POP3 service port. The default value is 110. This field is available only when you select Disable from the Use Template list.
¡ Traffic Collection Port—Enter one or more comma-separated POP3 service port numbers. The default value is 110. This field is displayed only when at least one probe is configured for APM and is available only when you select Disable from the Use Template list.
¡ Polling Interval (min)—Select a polling interval for the application monitor. Options are 1, 2, 3, 4, 5, 10, 20, and 30. The default polling interval is 5 minutes. A shorter polling interval improves real-time data accuracy at the expense of system resources. This field is available only when you select Disable from the Use Template list.
¡ Username/Password—Enter the username and password used to access the mailbox through POP3. This field is available only when you select Disable from the Use Template list.
¡ Contact—Enter user contact information, such as the name, email address, and telephone number. The default is the username of the operator who created the application monitor. This field is available only when you select Disable from the Use Template list.
¡ APM Server—Select an APM server to monitor the application. The options are in server-address (application-type:n/N) format. The letter n indicates the number of POP3 applications monitored on the APM server. The letter N indicates the total number of applications monitored on the APM server. Server address 127.0.0.1 indicates that APM and the IMC platform are deployed on the same server.
¡ Related Applications—Click Add next to this field. On the Select Application window, enter a partial or complete name to filter applications, select the applications that POP3 depends on, and then click OK.
Operating system applications cannot be selected. Operators can view all dependencies of the application in the dependency topology. APM automatically adds the dependencies between POP3 and operating system applications by IP address and displays their dependencies in the application topology.
¡ Application Group—Specify an application group for the POP3 application.
- To specify an existing application group, click Add, select an application group, and then click OK.
- To specify a new application group, click Add Application Group, configure the application group settings, and then click OK.
¡ Detect Application—Select this parameter if you want to enable application detection. APM verifies the application connectivity by using the previous parameter settings, and adds the application monitor only when it can connect to the application. If you do not select this parameter, APM adds the application monitor without verifying the application connectivity.
5. Click OK.
Modifying a POP3 application monitor
Authorized users can modify all parameters except the IP address and the APM server for a POP3 application monitor. If the IP address of a monitored POP3 host changes, add a new application monitor for the host. The new application monitor cannot inherit the history data from the previous application monitor.
To modify a POP3 application monitor:
1. Click the Resource tab.
2. From the navigation tree, select Application Manager > Application Monitor.
The application monitor list page opens.
3. Click the Modify icon ![]() for the POP3 application monitor you want to modify.
for the POP3 application monitor you want to modify.
The page for modifying the POP3 application monitor opens.
4. Modify the parameters as needed, except the IP address and the APM server.
For more information about parameter settings, see "Adding a POP3 application monitor."
5. Click OK.
Viewing the POP3 application monitor report
After a POP3 application monitor is added, APM collects application index data, evaluates the availability and health status, and updates the monitor report. The report shows the index values obtained from the most recent polling of the application.
To view the POP3 application monitor report:
1. Click the Resource tab.
2. From the navigation tree, select Application Manager > Application Monitor.
The application monitor list page displays all application monitors.
3. Click the name of a POP3 applic0ation monitor to display the report.
Figure 97 shows part of a POP3 application monitor report.
Figure 97 Part of a POP3 application monitor report
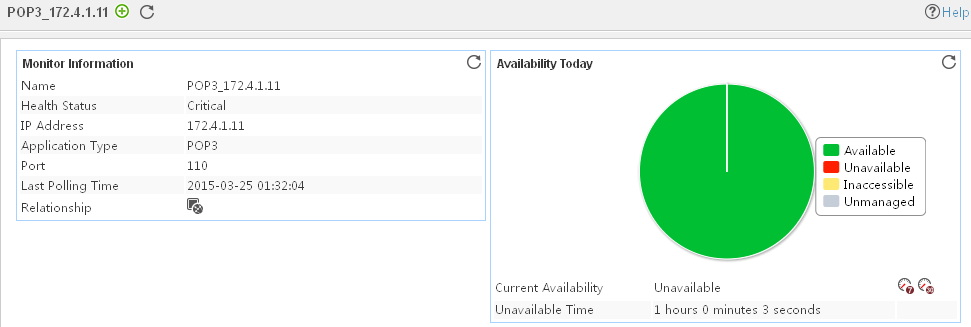
Monitor Information
The Monitor Information area contains the following fields:
· Name—Application monitor name.
· Health State—Health status of the POP3 application.
· IP Address—IP address of the POP3 host.
· Application Type—Type of the monitored application. It is always POP3 for a POP3 application monitor.
· Port—POP3 service port.
· Last Polling Time—Time when APM last polled the POP3 application.
· Relationship—Click the Relationship icon ![]() to view dependencies between the POP3 application and other applications in a dependency topology view. For
more information about dependency topologies, see "Topology and application group management."
to view dependencies between the POP3 application and other applications in a dependency topology view. For
more information about dependency topologies, see "Topology and application group management."
· Top5 Unrecovered Alarms—Latest five unrecovered alarms on the POP3 host. The alarm level is identified by color: yellow for minor alarms, orange for major alarms, and red for critical alarms. If no alarm is generated by Exchange POP3, this field is not displayed.
Availability Today
The Availability Today area contains the following fields:
· Current Availability—Availability of the POP3 service.
¡ Click
the Weekly History icon![]() to view the availability of the POP3
application in the last 7 days.
to view the availability of the POP3
application in the last 7 days.
¡ Click
the Monthly History icon![]() to view the availability of the POP3
application in the last 30 days.
to view the availability of the POP3
application in the last 30 days.
· Available Time—Total amount of time that the POP3 service was available after 00:00 today.
· Unavailable Time—Total amount of time that the POP3 service was unavailable after 00:00 today.
· Inaccessible Time—Total amount of time that the POP3 service was inaccessible after 00:00 today.
· Unmanaged Time—Total amount of time that the POP3 service was unmanaged after 00:00 today.
The statistics collection started when the application monitor was added. An availability time field is not displayed if its value is 0.
Response Time
The Response Time area contains the following field:
· Response Time—Round trip response time of the POP3 service.
¡ Click
the History Record icon ![]() to view the history graph of the response
time.
to view the history graph of the response
time.
¡ Click
the Set Threshold icon ![]() to set alarm
thresholds for the response time.
to set alarm
thresholds for the response time.
Application Traffic
APM collects POP3 traffic based on the IP address of the host and the traffic collection port used by the application.
The Application Traffic area contains the following fields:
· Last Hour's Traffic—Total traffic sent and received by POP3 over the last 1 hour.
· Today's Traffic—Total traffic sent and received by POP3 since 00:00 today.
SMTP
Simple Mail Transfer Protocol (SMTP) is an Internet standard protocol for email transmission between source and destination addresses. Most mail servers support SMTP.
Adding an SMTP application monitor
APM monitor the SMTP application through the SMTP service port (25 by default). Before adding an SMTP application monitor, follow these guidelines:
· Add the host that provides the SMTP service to be monitored to the IMC platform.
For a host managed in the IMC platform, APM obtains and displays network connections of the host and its access device in the application topology. For information about adding hosts to the IMC platform, see H3C Intelligent Management Center v7.3 Enterprise and Standard Platform Administrator Guide.
· Obtain the email address and mailbox account information to test the SMTP service by using APM as an email client.
· To view traffic statistics in the monitor report of the SMTP application, make sure at least one probe is configured in APM. After an SMTP application monitor is added, APM sends the IP address and service ports of the monitored SMTP application to the probes for traffic collection.
To add an SMTP application monitor:
1. Click the Resource tab.
2. Open the Add Application page by using one of the following methods:
¡ From the navigation tree, select Application Manager > Add Application.
¡ From the navigation tree, select Application Manager > Application Monitor, and then click Add on the application monitor list page.
The page displays all application types that can be monitored by APM.
3. Click SMTP of the Mail Server Monitor class.
The page for adding an SMTP application monitor opens.
4. Configure the following parameters for the application monitor:
¡ IP Address—Enter the IP address of the host on which the SMTP application to be monitored is installed. APM automatically checks the IP address and associates the application monitor with the host if it is already managed in the IMC platform. To monitor a host that is already managed in the IMC platform, you can also click Select, and then select the host in the Select Devices window. For information about selecting a host, see "Quick start."
¡ Name—Enter a unique application monitor name. As a best practice, name the application monitor as application type_host IP address.
¡ Use Template—Select Enable or Disable from the list.
¡ Template—Click
the Configure icon ![]() next to the Template field to select an existing template. The Template field
is automatically populated with the name of the selected template. For more
information about configuring application templates, see "Configuration management." This field is displayed only when you select Enable from the Use
Template list.
next to the Template field to select an existing template. The Template field
is automatically populated with the name of the selected template. For more
information about configuring application templates, see "Configuration management." This field is displayed only when you select Enable from the Use
Template list.
¡ Description—Enter a description for the application monitor.
¡ Application Monitor Port—Enter the SMTP service port. The default value is 110. This field is available only when you select Disable from the Use Template list.
¡ Traffic Collection Port—Enter one or more comma-separated SMTP service port numbers. The default value is 110. This field is displayed only when at least one probe is configured for APM and is available only when you select Disable from the Use Template list.
¡ Polling Interval (min)—Select a polling interval for the application monitor. Options are 1, 2, 3, 4, 5, 10, 20, and 30. The default polling interval is 5 minutes. A shorter polling interval improves real-time data accuracy at the expense of system resources.
¡ Username/Password—Enter the username and password used to access the mailbox through SMTP. This field is available only when you select Disable from the Use Template list.
¡ Email Address—Enter a valid email address that is located on the host that provides the SMTP service. For example, apm@imc.com. APM uses the email address to send and receive a test mail. This field is available only when you select Disable from the Use Template list.
¡ Contact—Enter user contact information, such as the name, email address, and telephone number. The default is the username of the operator who created the application monitor. This field is available only when you select Disable from the Use Template list.
¡ APM Server—Select an APM server to monitor the application. The options are in server-address (application-type:n/N) format. The letter n indicates the number of SMTP applications monitored on the APM server. The letter N indicates the total number of applications monitored on the APM server. Server address 127.0.0.1 indicates that APM and the IMC platform are deployed on the same server.
¡ Related Applications—Click Add next to this field. On the Select Application window, enter a partial or complete name to filter applications, select the applications that SMTP depends on, and then click OK.
Operating system applications cannot be selected. Operators can view all dependencies of the application in the dependency topology. APM automatically adds the dependencies between SMTP and operating system applications by IP address and displays their dependencies in the application topology.
¡ Application Group—Specify an application group for the SMTP application.
- To specify an existing application group, click Add, select an application group, and then click OK.
- To specify a new application group, click Add Application Group, configure the application group settings, and then click OK.
¡ Detect Application—Select this parameter if you want to enable application detection. APM verifies the application connectivity by using the previous parameter settings, and adds the application monitor only when it can connect to the application. If you do not select this parameter, APM adds the application monitor without verifying the application connectivity.
5. Click OK.
Modifying an SMTP application monitor
Authorized users can modify all parameters except the IP address and the APM server for an SMTP application monitor. If the IP address of a monitored SMTP host changes, add a new application monitor for the host. The new application monitor cannot inherit the history data from the previous application monitor.
To modify an SMTP application monitor:
1. Click the Resource tab.
2. From the navigation tree, select Application Manager > Application Monitor.
The application monitor list page opens.
3. Click the Modify icon ![]() for the SMTP application monitor you want to modify.
for the SMTP application monitor you want to modify.
The page for modifying the SMTP application monitor opens.
4. Modify the parameters as needed, except the IP address and the APM server.
For more information about parameter settings, see "Adding an SMTP application monitor."
5. Click OK.
Viewing the SMTP application monitor report
After an SMTP application monitor is added, APM collects application index data, evaluates the availability and health status, and updates the monitor report. The report shows the index values obtained from the most recent polling of the application.
To view the SMTP application monitor report:
1. Click the Resource tab.
2. From the navigation tree, select Application Manager > Application Monitor.
The application monitor list page displays all application monitors.
3. Click the name of an SMTP application monitor to display the report.
Figure 98 shows part of an SMTP application monitor report.
Figure 98 Part of an SMTP application monitor report

Monitor Information
The Monitor Information area contains the following fields:
· Name—Application monitor name.
· Health State—Health status of the SMTP application.
· IP Address—IP address of the SMTP host.
· Application Type—Type of the monitored application. It is always SMTP for an SMTP application monitor.
· Port—SMTP service port.
· Last Polling Time—Time when APM last polled the SMTP application.
· Relationship—Click the Relationship icon ![]() to view dependencies between the SMTP application and other applications in a dependency topology view. For
more information about dependency topologies, see "Topology and application group management."
to view dependencies between the SMTP application and other applications in a dependency topology view. For
more information about dependency topologies, see "Topology and application group management."
· Top5 Unrecovered Alarms—Latest five unrecovered alarms on the SMTP host. The alarm level is identified by color: yellow for minor alarms, orange for major alarms, and red for critical alarms. If no alarm is generated by SMTP, this field is not displayed.
Availability Today
The Availability Today area contains the following fields:
· Current Availability—Availability of the SMTP service.
¡ Click
the Weekly History icon![]() to view the availability of the SMTP
application in the last 7 days.
to view the availability of the SMTP
application in the last 7 days.
¡ Click
the Monthly History icon![]() to view the availability of the SMTP
application in the last 30 days.
to view the availability of the SMTP
application in the last 30 days.
· Available Time—Total amount of time that the SMTP service was available after 00:00 today.
· Unavailable Time—Total amount of time that the SMTP service was unavailable after 00:00 today.
· Inaccessible Time—Total amount of time that the SMTP service was inaccessible after 00:00 today.
· Unmanaged Time—Total amount of time that the SMTP service was unmanaged after 00:00 today.
The statistics collection started when the application monitor was added. An availability time field is not displayed if its value is 0.
Response Time
The Response Time area contains the following field:
· Response Time—Round trip response time of the SMTP service in the last polling period.
¡ Click
the History Record icon ![]() to view the history graph of the response time.
to view the history graph of the response time.
¡ Click
the Set Threshold icon ![]() to set alarm
thresholds for the response time.
to set alarm
thresholds for the response time.
Application Traffic
APM collects SMTP traffic based on the IP address of the host and the traffic collection port used by the application.
The Application Traffic area contains the following fields:
· Last Hour's Traffic—Total traffic sent and received by SMTP over the last 1 hour.
· Today's Traffic—Total traffic sent and received by SMTP since 00:00 today.
Web service monitor
This chapter describes how to add and modify Web service monitors, and helps you view relevant monitor reports.
RESTful Web service
Representational State Transfer (REST) is a predominant Web service design model and typically applies to HTTP-based APIs. A Web API or service that complies with constraints of REST architecture is called "RESTful Web service."
APM can monitor the running status of RESTful Web services. This section describes how to add and modify an application monitor for a RESTful Web service, and helps you view the monitor report.
Adding a RESTful Web service application monitor
APM monitors the RESTful Web service through the HTTP port that service uses. When you add a RESTful Web service application monitor, follow these guidelines:
· Add the RESTful Web service host to the IMC platform so APM can obtain and display network connections of the host and the access device. For information about adding hosts to the IMC platform, see H3C Intelligent Management Center v7.3 Enterprise and Standard Platform Administrator Guide.
· Obtain the username and password to access the RESTful Web service to be monitored if the service requires identity authentication.
· To view traffic statistics in the monitor report of the RESTful Web service application, make sure at least one probe is configured in APM. After a RESTful Web service application monitor is added, APM sends the IP address and port of the monitored RESTful Web service application to the probes for traffic collection.
To add an application monitor for the RESTful Web service:
1. Click the Resource tab.
2. Open the Add Application page by using one of the following methods:
¡ From the navigation tree, select Application Manager > Add Application.
The page displays all application types that can be monitored by APM.
¡ From the navigation tree, select Application Manager > Application Monitor, and then click Add on the application monitor list page.
3. Click REST Service of the Web Service Monitor class.
The page for adding a RESTful Web service application monitor opens.
4. Configure the following parameters for the application monitor:
¡ IP Address—Enter the IP address of the host where the RESTful Web service to be monitored resides. If the host is already added to the IMC platform, you can also click Select, and then select the host from the Select Devices window. For information about selecting a host, see "Quick start." APM automatically checks the specified IP address and associates the application monitor with the host managed in the IMC platform.
¡ Name—Enter a unique application monitor name. As a best practice, name the application monitor as application type_host IP address.
¡ Use Template—Select Enable or Disable from the list.
¡ Template—Click
the Configure icon ![]() next to the Template field to select an existing template. The Template field
is automatically populated with the name of the selected template. For more
information about configuring application templates, see "Configuration management." This field is displayed only when you select Enable from the Use
Template list.
next to the Template field to select an existing template. The Template field
is automatically populated with the name of the selected template. For more
information about configuring application templates, see "Configuration management." This field is displayed only when you select Enable from the Use
Template list.
¡ Description—Enter a description for the application monitor.
¡ Application Monitor Port—Enter the HTTP port used by the RESTful Web service. This field is available only when you select Disable from the Use Template list.
¡ Traffic Collection Port—Enter the port used by the RESTful Web service to provide services. The field is displayed only after at least one probe is configured for APM. This field is available only when you select Disable from the Use Template list.
¡ Polling Interval (min)—Select a polling interval for the application monitor. Options are 1, 2, 3, 4, 5, 10, 20, and 30. The default polling interval is 5 minutes. A shorter polling interval provides more accurate realtime data, but consumes more system resources. This field is available only when you select Disable from the Use Template list.
¡ Username/Password—Enter the username and password used to access the RESTful Web service if the service requires identity authentication. The fields are available only when you select Disable from the Use Template list.
¡ Path—Enter the URL of the RESTful Web service. Do not include the IP address or port information in the URL. APM determines whether the RESTful Web service is available by accessing the specified URL. This field is available only when you select Disable from the Use Template list.
¡ Contact—Enter the contact information, such as the name, email address, and telephone number. The default is the username of the operator who created the application monitor. This field is available only when you select Disable from the Use Template list.
¡ APM Server—Select an APM server to monitor the application. The options are in server-address (application-type:n/N) format. The letter n indicates the number of RESTful Web service applications monitored on the APM server. The letter N indicates the total number of applications monitored on the APM server. Server address 127.0.0.1 indicates that APM and the IMC platform are deployed on the same server.
¡ Related Applications—Click Add next to this field. On the Select Application window, enter a partial or complete name to filter applications, select the applications that the RESTful Web service depends on, and then click OK.
Operating system applications cannot be selected. Operators can view all dependencies of the application in the dependency topology. APM automatically adds the dependencies between the RESTful Web service and operating system applications by IP address and displays their dependencies in the application topology.
¡ Application Group—Specify an application group for the RESTful Web service application.
- To specify an existing application group, click Add, select an application group, and then click OK.
- To specify a new application group, click Add Application Group, configure the application group settings, and then click OK.
¡ Detect Application—Select this parameter if you want to enable application detection. Application detection enables APM to verify connection to the application by using the previous parameter settings, and to determine whether to add the application monitor based on the verification result. APM adds the application monitor only when it can connect to the application. When this parameter is not selected, APM adds the application monitor without verifying the connection.
5. Click OK.
Modifying a RESTful Web service application monitor
Authorized users can modify all parameters except the IP address and the APM server for a RESTful Web service application monitor. When the IP address of a monitored RESTful Web service host changes, operators must add a new application monitor for the host. The new application monitor cannot inherit the history data from the previous application monitor.
To modify a RESTful Web service application monitor:
1. Click the Resource tab.
2. From the navigation tree, select Application Manager > Application Monitor.
The application monitor list page displays all application monitors.
3. Click the Modify
icon ![]() for the RESTful Web service application monitor you want to modify.
for the RESTful Web service application monitor you want to modify.
The page for modifying the RESTful Web service application monitor opens.
4. Modify the parameters as needed, except the IP address and the APM server.
For more information about parameter settings, see "Adding a RESTful Web service application monitor."
5. Click OK.
Viewing the RESTful Web service application monitor report
After a RESTful Web service application monitor is added, APM collects application index data, evaluates the availability and health status, and updates the monitor report. The report shows the index values obtained from the most recent polling of the application.
To access the RESTful Web service application monitor report:
1. Click the Resource tab.
2. From the navigation tree, select Application Manager > Application Monitor.
The application monitor list page displays all application monitors.
3. Click the name of a RESTful Web service application monitor to display the report.
Figure 99 shows part of a RESTful Web service application monitor report.
Figure 99 Part of a RESTful Web service application monitor report
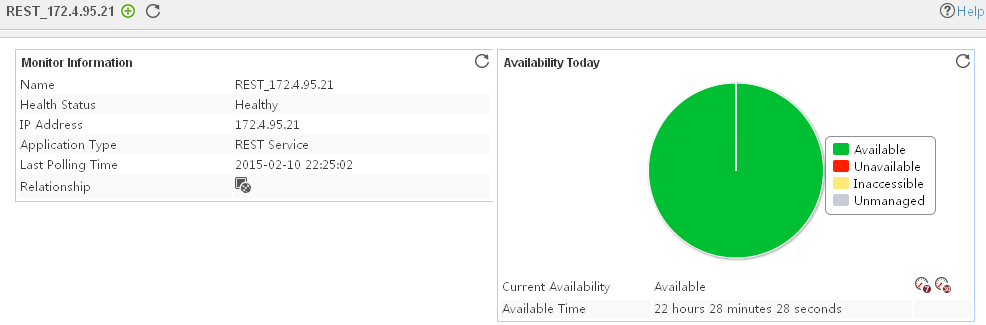
Monitor Information
The Monitor Information area contains the following fields:
· Name—Application monitor name.
· Health State—Health status of the RESTful Web service.
· IP Address—IP address of the host on which the RESTful Web service is located.
· Application Type—Type of the monitored application, which is always REST Service.
· Last Polling Time—Time when APM last polled the RESTful Web service.
· Relationship—Click the Relationship icon ![]() to view dependencies
between the RESTful Web service and other applications in a dependency topology view. For more information about dependency topologies, see "Topology and application group management."
to view dependencies
between the RESTful Web service and other applications in a dependency topology view. For more information about dependency topologies, see "Topology and application group management."
· Top5 Unrecovered Alarm—Latest five unrecovered alarms on the RESTful Web service. The alarm level is identified by color: yellow for minor alarms, orange for major alarms, and red for critical alarms. This field is not displayed if no alarm is generated by the RESTful Web service.
Availability Today
The Availability Today area contains the following fields:
· Current Availability—Availability of the RESTful Web service.
¡ Click
the Weekly History icon![]() to view the availability of the RESTful Web service in the last 7 days.
to view the availability of the RESTful Web service in the last 7 days.
¡ Click
the Monthly History icon![]() to view the availability of the RESTful Web service in the last 30
days.
to view the availability of the RESTful Web service in the last 30
days.
· Available Time—Total amount of time that the RESTful Web service was available after 00:00 today.
· Unavailable Time—Total amount of time that the RESTful Web service was unavailable after 00:00 today.
· Inaccessible Time—Total amount of time that the RESTful Web service was inaccessible after 00:00 today.
· Unmanaged Time—Total amount of time that the RESTful Web service was unmanaged after 00:00 today.
The statistics collection started when the application monitor was added. An availability time field is not displayed if its value is 0.
Response Time
The Response Time area contains the following field:
· Response Time—Round trip response time of the RESTful Web service.
¡ Click
the History Record icon ![]() to view the history graph of the response
time.
to view the history graph of the response
time.
¡ Click
the Set Threshold icon ![]() to set alarm
thresholds for the response time.
to set alarm
thresholds for the response time.
SOAP-based Web service
Simple Object Access Protocol (SOAP) is used by Web services for exchanging XML messages typically through HTTP and SMTP.
APM can monitor the running status of SOAP-based Web services. This chapter describes how to add and modify an application monitor for a SOAP-based Web service, and helps you view the monitor report.
Adding a SOAP-based Web service application monitor
APM monitors a SOAP-based Web service through accessing the HTTP port that service uses. When you add a SOAP-based Web service application monitor, follow these guidelines:
· Add the RESTful Web service host to the IMC platform so APM can obtain and display network connections of the host and the access device. For information about adding hosts to the IMC platform, see H3C Intelligent Management Center v7.3 Enterprise and Standard Platform Administrator Guide.
· Obtain the username and password used to access the SOAP-based Web service if the service requires identity authentication.
· To view traffic statistics in the monitor report of the SOAP-based Web service application, make sure at least one probe is configured in APM. After a SOAP-based Web service application monitor is added, APM sends the IP address and port of the monitored RESTful Web service application to the probes for traffic collection.
To add an application monitor for the SOAP-based Web service:
1. Click the Resource tab.
2. Open the Add Application page by using one of the following methods:
¡ From the navigation tree, select Application Manager > Add Application.
The page displays all application types that can be monitored by APM.
¡ From the navigation tree, select Application Manager > Application Monitor, and then click Add on the application monitor list page.
3. Click SOAP Service of the Web Service Monitor class.
The page for adding a SOAP-based Web service application monitor opens.
4. Configure the following parameters for the application monitor:
¡ IP Address—Enter the IP address of the host where the SOAP-based Web service to be monitored resides. If the host is already added to the IMC platform, you can also click Select, and then select the host from the Select Devices window. For information about selecting a host, see "Quick start." APM automatically checks the specified IP address and associates the application monitor with the host managed in the IMC platform.
¡ Name—Enter a unique application monitor name. As a best practice, name the application monitor as application type_host IP address.
¡ Use Template—Select Enable or Disable from the list.
¡ Template—Click
the Configure icon ![]() next to the Template field to select an existing template. The Template field
is automatically populated with the name of the selected template. For more
information about configuring application templates, see "Configuration management." This field is displayed only when you select Enable from the Use
Template list.
next to the Template field to select an existing template. The Template field
is automatically populated with the name of the selected template. For more
information about configuring application templates, see "Configuration management." This field is displayed only when you select Enable from the Use
Template list.
¡ Description—Enter a description for the application monitor.
¡ Application Monitor Port—Enter the HTTP port used by the SOAP-based Web service. This field is available only when you select Disable from the Use Template list.
¡ Traffic Collection Port—Enter the port used by the SOAP-based Web service to provide services. This field is displayed only after at least one probe is configured for APM. This field is available only when you select Disable from the Use Template list.
¡ Polling Interval (min)—Select a polling interval for the application monitor. Options are 1, 2, 3, 4, 5, 10, 20, and 30. The default polling interval is 5 minutes. A shorter polling interval provides more accurate realtime data, but consumes more system resources. This field is available only when you select Disable from the Use Template list.
¡ Username/Password—Enter the username and password used to access the SOAP-based Web service if the service requires identity authentication. The fields are available only when you select Disable from the Use Template list.
¡ Path—Enter the URL of the SOAP-based Web service. Do not include the IP address or port information in the URL. APM determines whether the SOAP-based Web service is available by accessing the specified URL. This field is available only when you select Disable from the Use Template list.
¡ Contact—Enter the contact information, such as the name, email address, and telephone number. The default is the username of the operator who created the application monitor. This field is available only when you select Disable from the Use Template list.
¡ APM Server—Select an APM server to monitor the application. The options are in server-address (application-type:n/N) format. The letter n indicates the number of SOAP-based Web service applications monitored on the APM server. The letter N indicates the total number of applications monitored on the APM server. Server address 127.0.0.1 indicates that APM and the IMC platform are deployed on the same server.
¡ Related Applications—Click Add next to this field. On the Select Application window, enter a partial or complete name to filter applications, select the applications that the SOAP-based Web service depends on, and then click OK.
Operating system applications cannot be selected. Operators can view all dependencies of the application in the dependency topology. APM automatically adds the dependencies between the SOAP-based Web service and operating system applications by IP address and displays their dependencies in the application topology.
¡ Application Group—Specify an application group for the SOAP-based Web service application.
- To specify an existing application group, click Add, select an application group, and then click OK.
- To specify a new application group, click Add Application Group, configure the application group settings, and then click OK.
¡ Detect Application—Select this parameter if you want to enable application detection. Application detection enables APM to verify connection to the application by using the previous parameter settings, and to determine whether to add the application monitor based on the verification result. APM adds the application monitor only when it can connect to the application. When this parameter is not selected, APM adds the application monitor without verifying the connection.
5. Click OK.
Modifying a SOAP-based Web service application monitor
Authorized users can modify all parameters except the IP address and the APM server for a SOAP-based Web service application monitor. When the IP address of a monitored SOAP-based Web service host changes, operators must add a new application monitor for the host. The new application monitor cannot inherit the history data from the previous application monitor.
To modify a SOAP-based Web service application monitor:
1. Click the Resource tab.
2. From the navigation tree, select Application Manager > Application Monitor.
The application monitor list page displays all application monitors.
3. Click the Modify
icon ![]() for the SOAP-based Web service application monitor you want to modify.
for the SOAP-based Web service application monitor you want to modify.
The page for modifying the SOAP-based Web service application monitor opens.
4. Modify the parameters as needed, except the IP address and the APM server.
For more information about parameter settings, see "Adding a SOAP-based Web service application monitor."
5. Click OK.
Viewing the SOAP-based Web service application monitor report
After a SOAP-based Web service is added, APM collects application index data, evaluates the availability and health status, and updates the monitor report. The report shows the index values obtained from the most recent polling of the application.
To access the SOAP-based Web service application monitor report:
1. Click the Resource tab.
2. From the navigation tree, select Application Manager > Application Monitor.
The application monitor list page displays all application monitors.
3. Click the name of a SOAP-based Web service application monitor to display the report.
Figure 100 shows part of a SOAP-based Web service application monitor report.
Figure 100 Part of a SOAP-based Web service application monitor report

Monitor Information
The Monitor Information area contains the following fields:
· Name—Application monitor name.
· Health State—Health status of the SOAP-based Web service.
· IP Address—IP address of the host on which the SOAP-based Web service is located.
· Application Type—Type of the monitored application, which is always SOAP Service.
· Last Polling Time—Time when APM last polled the SOAP-based Web service.
· Relationship—Click the Relationship icon ![]() to view dependencies
between the SOAP-based Web service and other applications in a dependency topology view. For more information
about dependency topologies, see "Topology and application group management."
to view dependencies
between the SOAP-based Web service and other applications in a dependency topology view. For more information
about dependency topologies, see "Topology and application group management."
· Top5 Unrecovered Alarm—Latest five unrecovered alarms on the SOAP-based Web service. The alarm level is identified by color: yellow for minor alarms, orange for major alarms, and red for critical alarms. This field is not displayed if no alarm is generated by the SOAP-based Web service.
Availability Today
The Availability Today area contains the following fields:
· Current Availability—Availability of the SOAP-based Web service.
¡ Click
the Weekly History icon![]() to view the availability of the SOAP-based Web service in the last 7 days.
to view the availability of the SOAP-based Web service in the last 7 days.
¡ Click
the Monthly History icon![]() to view the availability of the SOAP-based Web service in the last
30 days.
to view the availability of the SOAP-based Web service in the last
30 days.
· Available Time—Total amount of time that the SOAP-based Web service was available after 00:00 today.
· Unavailable Time—Total amount of time that the SOAP-based Web service was unavailable after 00:00 today.
· Inaccessible Time—Total amount of time that the SOAP-based Web service was inaccessible after 00:00 today.
· Unmanaged Time—Total amount of time that the SOAP-based Web service was unmanaged after 00:00 today.
The statistics collection started when the application monitor was added. An availability time field is not displayed if its value is 0.
Response Time
The Response Time area contains the following field:
· Response Time—Round trip response time of the SOAP-based Web service.
¡ Click
the History Record icon ![]() to view the history graph of the response
time.
to view the history graph of the response
time.
¡ Click
the Set Threshold icon ![]() to set alarm
thresholds for the response time.
to set alarm
thresholds for the response time.
LDAP service monitor
This chapter describes how to add and modify LDAP service application monitors, and how to view relevant monitor reports.
Active Directory service
APM supports monitoring the running status of the AD service. This section describes how to add and modify the application monitor for the AD service and helps you view the monitor report.
Adding an AD service application monitor
APM monitors the AD service through WMI. Before adding an AD application monitor, complete the following tasks:
· Add AD service hosts to the IMC platform so APM can obtain and display network connections of the hosts and their access devices in the application topology. For more information about adding hosts to the IMC platform, see H3C Intelligent Management Center v7.3 Enterprise and Standard Platform Administrator Guide.
· Obtain the correct username and password of the user who has the Windows Server administrator's privileges.
· To view traffic statistics in the monitor report of the AD service application, make sure at least one probe is configured in APM. After an AD service application monitor is added, APM sends the IP address and service port of the monitored AD service application to the probes for traffic collection.
To add an AD service application monitor:
1. Click the Resource tab.
2. Open the Add Application page in one of the two following ways:
¡ From the navigation tree, select Application Manager > Add Application.
The page displays all application types that can be monitored by APM.
¡ From the navigation tree, select Application Manager > Application Monitor, and then click Add on the application monitor list page.
3. Click Active Directory of the LDAP Service Monitor class.
The page for adding an AD service application monitor opens.
4. Configure the following parameters:
¡ IP Address—Enter the IP address of the host on which the AD service application to be monitored is installed. If the host is already added to the IMC platform, you can also click Select, and then select the host in the Select Devices window. For information about selecting a host, see "Quick start." APM automatically checks the specified IP address and associates the application monitor with the host managed in the IMC platform.
¡ Name—Enter a unique application monitor name. As a best practice, name the application monitor as application type_host IP address.
¡ Use Template—Select Enable or Disable from the list.
¡ Template—Click
the Configure icon ![]() next to the Template field to select an existing template. The Template field
is automatically populated with the name of the selected template. For more
information about configuring application templates, see "Configuration management." This field is displayed only when you select Enable from the Use
Template list.
next to the Template field to select an existing template. The Template field
is automatically populated with the name of the selected template. For more
information about configuring application templates, see "Configuration management." This field is displayed only when you select Enable from the Use
Template list.
¡ Description—Enter a description for the application monitor.
¡ Traffic Collection Port—Enter the listening port number for AD service. This field is displayed only when at least one probe is configured for APM. This field is available only when you select Disable from the Use Template list.
¡ Polling Interval (min)—Select a polling interval for the application monitor. Options are 1, 2, 3, 4, 5, 10, 20, and 30. The default polling interval is 5 minutes. A shorter polling interval improves real-time data accuracy at the expense of system resources. This field is available only when you select Disable from the Use Template list.
¡ Username—Enter the username of the authorized Windows Server host administrator. This field is available only when you select Disable from the Use Template list.
If the administrator is a domain user, use the domain name\username format.
If the administrator is a local user, use the host name\username or IP address\username, or username.
¡ Password—Enter the password of the administrator. This field is available only when you select Disable from the Use Template list.
¡ Contact—Enter user contact information, such as the name, email address, and telephone number. The default is the username of the operator who created the application monitor. This field is available only when you select Disable from the Use Template list.
¡ APM Server—Select an APM server to monitor the application. The options are in server-address (application-type:n/N) format. The letter n indicates the number of AD service applications monitored on the APM server. The letter N indicates the total number of applications monitored on the APM server. Server address 127.0.0.1 indicates that APM and the IMC platform are deployed on the same server.
¡ Related Applications—Click Add next to this field. On the Select Application window, enter a partial or complete name to filter applications, select the applications that the AD service depends on, and then click OK.
Operating system applications cannot be selected. Operators can view all dependencies of the application in the dependency topology. APM automatically adds the dependencies between AD service and operating system applications by IP address and displays their dependencies in the application topology.
¡ Application Group—Specify an application group for the AD service application.
- To specify an existing application group, click Add, select an application group, and then click OK.
- To specify a new application group, click Add Application Group, configure the application group settings, and then click OK.
¡ Detect Application—Select this parameter if you want to enable application detection. Application detection enables APM to verify connection to the application by using the previous parameter settings, and to determine whether to add the application monitor based on the verification result. APM adds the application monitor only when it can connect to the application. When this parameter is not selected, APM adds the application monitor without verifying the connection.
5. Click OK.
Modifying an AD service application monitor
Authorized users can modify all parameters except the IP address and the APM server for an AD service application monitor. When the IP address of a monitored AD service changes, operators must add a new application monitor for the AD service. The new application monitor cannot inherit the history data from the previous application monitor.
To modify an AD service application monitor:
1. Click the Resource tab.
2. From the navigation tree, select Application Manager > Application Monitor.
The application monitor list page displays all application monitors.
3. Click the Modify
icon ![]() for the desired AD service application monitor.
for the desired AD service application monitor.
The page for modifying the AD service application monitor opens.
4. Modify the parameters as needed, except the IP address and the APM server.
For more information about parameter settings, see "Adding an AD service application monitor."
5. Click OK.
Viewing the AD service application monitor report
After an AD service application monitor is added, APM collects application index data, evaluates the availability and health status, and updates the monitor report. The report shows the index values obtained from the most recent polling of the application.
To view the AD service application monitor report:
1. Click the Resource tab.
2. From the navigation tree, select Application Manager > Application Monitor.
The application monitor list page displays all application monitors.
3. Click the name of an AD service application monitor to display the report.
Figure 101 shows part of an AD service application monitor report.
Figure 101 Part of an AD service application monitor report
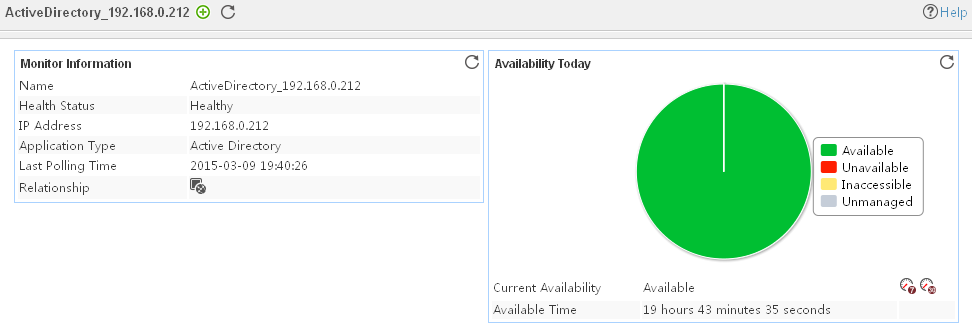
Monitor Information
The Monitor Information area contains the following fields:
· Name—Application monitor name.
· Health State—Health status of the AD service.
· IP Address—IP address of the AD service host.
· Application Type—Type of the monitored application, which is always Active Directory.
· Last Polling Time—Time when APM last polled the AD service.
· Relationship—Click the Relationship icon ![]() to view dependencies between AD service and other applications in a
dependency topology view. For more information about
dependency topologies, see "Topology and application group management."
to view dependencies between AD service and other applications in a
dependency topology view. For more information about
dependency topologies, see "Topology and application group management."
· Top5 Unrecovered Alarm—Latest five unrecovered alarms on the AD service host. The alarm level is identified by color: yellow for minor alarms, orange for major alarms, and red for critical alarms. This field is not displayed if no alarm is generated by the AD service.
Availability Today
The Availability Today area contains the following fields:
· Current Availability—Availability of the AD service.
¡ Click
the Weekly History icon![]() to view the availability of AD service in the last 7 days.
to view the availability of AD service in the last 7 days.
¡ Click
the Monthly History icon![]() to view
the availability of AD service in the last 30 days.
to view
the availability of AD service in the last 30 days.
· Available Time—Total amount of time that the AD service was available after 00:00 today.
· Unavailable Time—Total amount of time that the AD service was unavailable after 00:00 today.
· Inaccessible Time—Total amount of time that the AD service was inaccessible after 00:00 today.
· Unmanaged Time—Total amount of time that the AD service was unmanaged after 00:00 today.
The statistics collection started when the application monitor was added. An availability time field is not displayed if its value is 0.
Network Monitor
The Network Monitor area contains the following fields:
· ABClient Sessions—Number of connected ABClient sessions of the AD service. Click the History Record icon ![]() to view the history
graph for the number of connected
ABClient sessions.
to view the history
graph for the number of connected
ABClient sessions.
· DS Notification Queue Size—Number of pending update notifications that have been queued but
not yet sent to clients. Click the History Record
icon ![]() to view the history graph for the size of
DS notification queue.
to view the history graph for the size of
DS notification queue.
Database
The database of the AD service is the ntds.dit file, which is the core of the AD service and stores large amount of domain data.
The Database area contains the following field:
· File Size—Size of the ntds.dit file. Click the History Record icon ![]() to view the history graph for the size of
the file.
to view the history graph for the size of
the file.
NTFRS Process
The NTFRS process refers to the File Replication Service of AD. It is used for file synchronization among multiple domain controllers (DCs) deployed with AD, ensuring global synchronization of domain accounts and user configuration files.
The NTFRS Process area contains the following fields:
· CPU Usage Ratio—CPU usage ratio of the NTFRS process.
¡ Click
the History Record icon ![]() to view the history graph of the CPU usage.
to view the history graph of the CPU usage.
¡ Click
the Set Threshold icon ![]() to set alarm
thresholds for the CPU usage.
to set alarm
thresholds for the CPU usage.
· Handles—Total number of handles opened by the NTFRS process. Click the History Record icon ![]() to view the history
graph for the number of handles.
to view the history
graph for the number of handles.
· IO Read Rate—Rate at which the NTFRS process is reading data from I/O
operations. The I/O activity includes network, file, and device I/Os. Click the
History Record icon ![]() to view the history graph of the I/O read
rate.
to view the history graph of the I/O read
rate.
· IO Write Rate—Rate at which the NTFRS process is writing data to I/O operations.
The I/O activity includes network, file, and device I/Os. Click the History Record icon ![]() to view the history
graph of the I/O write rate.
to view the history
graph of the I/O write rate.
LSASS Process
The Local Security Authority Subsystem Service (LSASS) process of the Windows operating system processes authentication requests and permits/denies user requests. It processes domain logins from users in AD.
The LSASS Process area contains the following fields:
· CPU Usage in LSASS Process—CPU usage ratio of the LSASS process.
¡ Click
the History Record icon ![]() to view the history graph of the CPU usage.
to view the history graph of the CPU usage.
¡ Click
the Set Threshold icon ![]() to set alarm
thresholds for the CPU usage.
to set alarm
thresholds for the CPU usage.
· Handles—Total number of handles opened by the LSASS process. Click the History Record icon ![]() to view the history
graph for the number of handles.
to view the history
graph for the number of handles.
· IO Read Rate—Rate at which the LSASS process is reading data from I/O
operations. The I/O activity includes network, file, and device I/Os. Click the
History Record icon ![]() to view the history graph of the I/O read
rate.
to view the history graph of the I/O read
rate.
· IO Write Rate—Rate at which the LSASS process is writing data to I/O operations.
The I/O activity includes network, file, and device I/Os. Click the History Record icon ![]() to view the history
graph of the I/O write rate.
to view the history
graph of the I/O write rate.
Performance
The Performance area contains the following fields:
· Client Bindings/Sec—Number of DC-to-client bindings per second. Click the History Record icon ![]() to view the history
graph for the number of DC-to-client
bindings per second.
to view the history
graph for the number of DC-to-client
bindings per second.
· Server Bindings/Sec—Number of DC-to-DC bindings per second. Click the History Record icon ![]() to view the history
graph for the number of DC-to-DC
bindings per second.
to view the history
graph for the number of DC-to-DC
bindings per second.
· Directory Reads/Sec—Number of reads from directory per second. Click the History Record icon ![]() to view the history
graph for the number of reads
from the directory per second.
to view the history
graph for the number of reads
from the directory per second.
· Directory Writes/Sec—Number of writes to directory per second. Click the History Record icon ![]() to view the history
graph for the number of writes to the directory per
second.
to view the history
graph for the number of writes to the directory per
second.
Copy Statistics
The Copy Statistics area contains the following fields:
· Copied Objects/Sec—Rate at which replication updates received from ADs are applied by
the local AD. This counter excludes changes that are received but not applied. Click
the History Record icon ![]() to view the history graph for the number of
copied objects per second.
to view the history graph for the number of
copied objects per second.
· Left Objects/Sec—Number of object updates received in the current directory
replication update packet that have not yet been applied to the local AD. Click the History
Record icon ![]() to view the history
graph for the number of remaining objects.
to view the history
graph for the number of remaining objects.
· Inbound Objects/Sec—Number of objects received per second from other ADs through
inbound replication. Click the History Record icon ![]() to view the history graph for the number of
inbound objects per second.
to view the history graph for the number of
inbound objects per second.
· Outbound Objects/Sec—Number of objects sent per second to other ADs through outbound
replication. Click the History Record icon ![]() to view the history
graph for the number of outbound objects per second.
to view the history
graph for the number of outbound objects per second.
· Inbound Rate—Inbound replication rate of the current AD.
Click the History Record
icon ![]() to view the history graph for the inbound
rate.
to view the history graph for the inbound
rate.
· Outbound Rate—Outbound replication rate of the current AD. Click the History
Record icon ![]() to view the history
graph for the outbound rate.
to view the history
graph for the outbound rate.
LDAP Statistics
The LDAP Statistics area contains the following fields:
· Active LDAP Threads—Number of threads used by the LDAP subsystem. Click the History Record icon ![]() to view the history
graph for the number of active LDAP threads.
to view the history
graph for the number of active LDAP threads.
· LDAP Binding Time—Time used for the last LDAP binding. Click the History Record icon ![]() to view the history
graph of the LDAP binding time.
to view the history
graph of the LDAP binding time.
· LDAP Client Sessions—Number of currently connected LDAP client sessions. Click the History Record icon ![]() to view the history
graph for the number of LDAP client sessions.
to view the history
graph for the number of LDAP client sessions.
· LDAP Searches/Sec—Number of searches performed by LDAP clients per second. Click the History Record icon ![]() to view the history
graph for the number of
searches performed by LDAP clients per second.
to view the history
graph for the number of
searches performed by LDAP clients per second.
· LDAP UDP Operations/Sec—Number of UDP operations processed by the LDAP subsystem per second.
Click the History Record icon ![]() to view the history graph for the number of LDAP UDP operations per second.
to view the history graph for the number of LDAP UDP operations per second.
· LDAP Writes/Sec—Number of writes performed by LDAP clients per second. Click the History Record icon ![]() to view the history
graph for the number of LDAP writes per second.
to view the history
graph for the number of LDAP writes per second.
Active Directory Service
APM can obtain the service status on the server where AD the service is located through WMI parameters. When monitoring the AD service, APM monitors the following services that are closely related to the proper operation of AD:
· Windows Time
· DNS Client
· File Replication Service
· Intersite Messaging
· Kerberos Key Distribution Center
· Security Accounts Manager
· Server
· Workstation
· Remote Procedure Call
· Net Logon
The Active Directory Service area contains the following fields:
· Service Name—Original name of the service.
· Display Name—Service name or alias displayed on the Windows service console. For example, on the Windows service console, the DNS client service uses the alias DNS Client rather than the original name DNScache. Typically, the display name identifies a service more clearly.
· State—Service state in the last polling interval. A service whose state is not Running might cause abnormality of the AD service.
LDAP service
This section describes how to add and modify the application monitor for the LDAP service and helps you view the monitor report.
Adding an LDAP service application monitor
APM monitors the running state of the LDAP service through the LDAP service port (TCP port 389 by default). Before adding an LDAP service application monitor, complete the following tasks:
· Add LDAP service hosts to the IMC platform so APM can obtain and display network connections of the hosts and their access devices in the application topology. For more information about adding hosts to the IMC platform, see H3C Intelligent Management Center v7.3 Enterprise and Standard Platform Administrator Guide.
· Obtain the username and password used to query the LDAP service. APM uses the LDAP username and password to access the LDAP service.
To add an LDAP service application monitor:
1. Click the Resource tab.
2. Open the Add Application page in one of the two following ways:
¡ From the navigation tree, select Application Manager > Add Application.
The page displays all application types that can be monitored by APM.
¡ From the navigation tree, select Application Manager > Application Monitor, and then click Add on the application monitor list page.
3. Click LDAP of the LDAP Service Monitor class.
The page for adding an LDAP service application monitor opens.
4. Configure the following parameters:
¡ IP Address—Enter the IP address of the host on which the LDAP service application to be monitored is installed. If the host is already added to the IMC platform, you can also click Select, and then select the host in the Select Devices window. For information about selecting a host, see "Quick start." APM automatically checks the specified IP address and associates the application monitor with the host managed in the IMC platform.
¡ Name—Enter a unique application monitor name. As a best practice, name the application monitor as application type_host IP address.
¡ Use Template—Select Enable or Disable from the list.
¡ Template—Click
the Configure icon ![]() next to the Template field to select an existing template. The Template field
is automatically populated with the name of the selected template. For more
information about configuring application templates, see "Configuration management." This field is displayed only when you select Enable from the Use
Template list.
next to the Template field to select an existing template. The Template field
is automatically populated with the name of the selected template. For more
information about configuring application templates, see "Configuration management." This field is displayed only when you select Enable from the Use
Template list.
¡ Description—Enter a description for the application monitor to aid maintenance.
¡ Application Monitor Port—Enter the listening port of the LDAP service. The default is TCP port 389. This field is available only when you select Disable from the Use Template list.
¡ Polling Interval (min)—Select a polling interval for the application monitor. Options are 1, 2, 3, 4, 5, 10, 20, and 30. The default polling interval is 5 minutes. A shorter polling interval improves real-time data accuracy at the expense of system resources. This field is available only when you select Disable from the Use Template list.
¡ Username—Enter the LDAP username following the applicable LDAP product format (see the product user manual). This field is available only when you select Disable from the Use Template list.
In the Username area, user test in domain imc.com belongs to Organization Unit (OU) apm. Enter Username as: cn=test, ou=apm, dc=imc, dc=com.
¡ Password—Enter the password of the LDAP user. This field is available only when you select Disable from the Use Template list.
¡ Search Filter—Enter the criteria for filtering queried entries. For example, if you enter cn=*, entries with any name are displayed. You can set the AND or OR relationship between multiple criteria. The AND or OR relationship setting varies with LDAP products. For more information, see the relevant product manual. This field is available only when you select Disable from the Use Template list.
¡ Base DN—Enter the basic directory for query. For example, if you enter ou=apm, dc=imc, dc=com, APM queries only entries of OU apm in the domain imc.com. This field is available only when you select Disable from the Use Template list.
¡ Contact—Enter user contact information, such as the name, email address, and telephone number. The default is the username of the operator who created the application monitor. This field is available only when you select Disable from the Use Template list.
¡ APM Server—Select an APM server to monitor the application. The options are in server-address (application-type:n/N) format. The letter n indicates the number of LDAP service applications monitored on the APM server. The letter N indicates the total number of applications monitored on the APM server. Server address 127.0.0.1 indicates that APM and the IMC platform are deployed on the same server.
¡ Related Applications—Click Add next to this field. On the Select Application window, enter a partial or complete name to filter applications, select the applications that the LDAP service depends on, and then click OK.
Operating system applications cannot be selected. Operators can view all dependencies of the application in the dependency topology. APM automatically adds the dependencies between LDAP service and operating system applications by IP address and displays their dependencies in the application topology.
¡ Application Group—Specify an application group for the LDAP service application.
- To specify an existing application group, click Add, select an application group, and then click OK.
- To specify a new application group, click Add Application Group, configure the application group settings, and then click OK.
¡ Detect Application—Select this parameter if you want to enable application detection. Application detection enables APM to verify connection to the application by using the previous parameter settings, and to determine whether to add the application monitor based on the verification result. APM adds the application monitor only when it can connect to the application. When this parameter is not specified, APM adds the application monitor without verifying the connection.
5. Click OK.
Modifying an LDAP service application monitor
Authorized users can modify all parameters except the IP address and the APM server for an LDAP service application monitor. If the IP address of the host where the LDAP service is located changes, add a new application monitor for the LDAP service. The new application monitor cannot inherit the history data from the previous application monitor.
To modify an LDAP service application monitor:
1. Click the Resource tab.
2. From the navigation tree, select Application Manager > Application Monitor.
The application monitor list page displays all application monitors.
3. Click the Modify
icon ![]() for the LDAP service application monitor you want to modify.
for the LDAP service application monitor you want to modify.
The page for modifying the LDAP service application monitor opens.
4. Modify the parameters as needed, except the IP address and the APM server.
For more information about parameter settings, see "Adding an LDAP service application monitor."
5. Click OK.
Viewing the LDAP service application monitor report
After adding the LDAP service application monitor, APM starts collecting index data of the application to calculate its availability and health status. Authorized users obtain monitor indexes of the LDAP service by viewing the monitor report.
To access the LDAP service application monitor report:
1. Click the Resource tab.
2. From the navigation tree, select Application Manager > Application Monitor.
The application monitor list page displays all application monitors.
3. Click the name of an LDAP service application monitor to display the report.
Figure 102 shows part of an LDAP service application monitor report.
Figure 102 Part of an LDAP service application monitor report
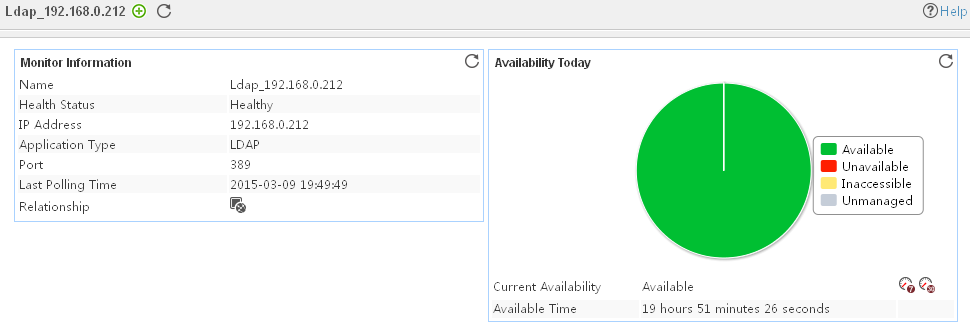
Monitor Information
The Monitor Information area contains the following fields:
· Name—Application monitor name.
· Health State—Health status of the LDAP service.
· IP Address—IP address of the LDAP service host.
· Application Type—Type of the monitored application, which is always LDAP.
· Port—Listening port number of LDAP service. The default is 389.
· Last Polling Time—Time when APM last polled the LDAP service.
· Relationship—Click the Relationship icon ![]() to view dependencies between AD service and other applications in a
dependency topology view. For more information about
dependency topologies, see "Topology and application group management."
to view dependencies between AD service and other applications in a
dependency topology view. For more information about
dependency topologies, see "Topology and application group management."
· Top5 Unrecovered Alarm—Latest five unrecovered alarms on the LDAP service host. The alarm level is identified by color: yellow for minor alarms, orange for major alarms, and red for critical alarms. This field is not displayed if no alarm is generated by the LDAP service.
Availability Today
The Availability Today area contains the following fields:
· Current Availability—Availability of the LDAP service.
¡ Click
the Weekly History icon![]() to view the availability of the LDAP
service in the last 7 days.
to view the availability of the LDAP
service in the last 7 days.
¡ Click
the Monthly History icon![]() to view the availability of the LDAP
service in the last 30 days.
to view the availability of the LDAP
service in the last 30 days.
· Available Time—Total amount of time that the LDAP service was available after 00:00 today.
· Unavailable Time—Total amount of time that the LDAP service was unavailable after 00:00 today.
· Inaccessible Time—Total amount of time that the LDAP service was inaccessible after 00:00 today.
· Unmanaged Time—Total amount of time that the LDAP service was unmanaged after 00:00 today.
The statistics collection started when the application monitor was added. An availability time field is not displayed if its value is 0.
Login Details
The Login Details area contains the following field:
· Login Time—Time taken for APM to pass the LDAP authentication by using the
LDAP username and password. Click the History Record
icon ![]() to view the history graph of the login time.
to view the history graph of the login time.
Search Details
After passing the LDAP authentication, APM queries all entries of the search base according to the Search Base and Query Filter configured in the LDAP service application monitor.
The Search Details area contains the following fields:
· Search Time—Time taken for APM to query all entries passing the query filter in
the Search Base and obtain the query result. Click the History
Record icon ![]() to view the history
graph of the search time.
to view the history
graph of the search time.
· Response Time—Time taken for APM to access the LDAP service and complete a query. The response time approximately equals login time plus search time.
¡ Click
the History Record icon ![]() to view the history graph of the response
time.
to view the history graph of the response
time.
¡ Click
the Set Threshold icon ![]() to set alarm
thresholds for the response time.
to set alarm
thresholds for the response time.
Search Result
The Search Result area contains the following fields:
¡ Result—Result (successful or not) of the query for entries passing the query filter in the Search Base.
¡ Rows—Number of entries passing the query filter in the Search Base.
File/Directory monitor
This chapter describes how to add and modify file/directory monitors, and helps you view relevant monitor reports.
File
APM can monitor the size and last modification time of individual files on Windows, UNIX, and Linux operating systems. This section describes how to add a file monitor, and helps you view the monitor report.
Adding a file monitor
APM can monitor files through WMI or CLI. When you add application monitors for files, follow these guidelines:
· Add the file host to the IMC platform so that APM can obtain and display network connections of the host and the access device in the application topology. For more information about adding hosts to the IMC platform, see H3C Intelligent Management Center v7.3 Enterprise and Standard Platform Administrator Guide.
· To monitor a file on a Windows host, first configure and enable WMI for the Windows operating system (see the Microsoft Windows operating system online help), and provide the username and password of the user who has the Windows administrator's privileges.
· To monitor a file on a Linux or UNIX host, first enable Telnet or SSH for the host (see the Linux configuration guide), and provide the username and password of the user who has the administrator's privileges.
To add a file monitor:
1. Click the Resource tab.
2. Open the Add Application page by using one of the following methods:
¡ From the navigation tree, select Application Manager > Add Application.
The page displays all application types that can be monitored by APM.
¡ From the navigation tree, select Application Manager > Application Monitor, and then click Add on the application monitor list page.
3. Click File of the File/Directory Monitor class.
The page for adding a file monitor opens.
4. Configure the following parameters:
¡ IP Address—Enter the IP address of the host on which the file to be monitored is located. APM automatically checks the specified IP address and associates the application monitor with the host managed in the IMC platform. If the host is already added to the IMC platform, you can also click Select, and then select the host in the Select Devices window. For information about selecting a host, see "Quick start."
¡ Name—Enter a unique application monitor name. As a best practice, name the application monitor as application type_host IP address.
¡ Use Template—Select Enable or Disable from the list.
¡ Template—Click the Configure icon ![]() next to the Template field to select an
existing template. The Template field is
automatically populated with the name of the selected template. For more
information about configuring application templates, see "Configuration management." This field is displayed only when you select Enable from the Use Template
list.
next to the Template field to select an
existing template. The Template field is
automatically populated with the name of the selected template. For more
information about configuring application templates, see "Configuration management." This field is displayed only when you select Enable from the Use Template
list.
¡ Description—Enter a description for the application monitor.
¡ Polling Interval (min)—Select a polling interval for the application monitor. Options are 1, 2, 3, 4, 5, 10, 20, and 30. The default polling interval is 5 minutes. A shorter polling interval provides more accurate realtime data, but consumes more system resources. This field is available only when you select Disable from the Use Template list.
¡ Monitor Type—Select the protocol (SSH, Telnet, or WMI) through which APM monitors the
file application, and then click the Configure icon ![]() (not available
for WMI) to configure related parameters. This field
is available only when you select Disable from the Use Template list.
(not available
for WMI) to configure related parameters. This field
is available only when you select Disable from the Use Template list.
When SSH is selected, configure the following parameters:
- Edit SSH Parameters—Select this option if you want to manually configure SSH parameters for APM. Make sure the SSH settings are the same as those on the operating system where the file is located.
- Select an Existing Template—Select this option if you want to select an existing SSH template for APM. For information about setting SSH parameter templates, see H3C Intelligent Management Center v7.3 Enterprise and Standard Platform Administrator Guide.
- Authentication Mode—Select the authentication mode for SSH users. Options are Password, Private Key, Password + Private Key, Password + Super Password, Private Key + Super Password, and Password + Private Key + Super Password.
The following parameters to be configured vary with authentication modes:
|
Parameter |
Remarks |
|
Username |
Enter the SSH username. The user must have the operating system administrator's privilege. |
|
Password |
Enter the password of the SSH user. |
|
Private Key File |
Enter the directory of the SSH private key file or browse to the file. |
|
Private Key Password |
Enter the password to decrypt the SSH private key file. |
|
Super Password |
Enter the super password with which an SSH user can elevate privileges after login. |
- Port—Enter the SSH port on the operating system.
- Timeout (1-120 seconds)—Enter the maximum time period that APM waits for an SSH response from the operating system. The value range is 1 to 120 seconds and the default is 10 seconds. If no SSH response is received from the operating system within the timeout time, APM considers the interaction a failure.
- Retries (1-5)—Enter how many times APM retries to send SSH packets to the operating system host.
When Telnet is selected, configure the following parameters:
- Edit Telnet Parameters—Select this option if you want to manually configure Telnet parameters for APM. Make sure the Telnet settings are the same as those on the operating system where the file is located.
- Select an Existing Template—Select this option if you want to select an existing Telnet template for APM. For information about setting Telnet parameter templates, see H3C Intelligent Management Center v7.3 Enterprise and Standard Platform Administrator Guide.
- Authentication Mode—Select the authentication mode for Telnet users. Options are Password (No Operator or Super/Manager), Username + Password, Super/Manager Password, Password + Super/Manager Password (No Operator), Username + Password + Super/Manager Password, No Username + No Password, and Username + No Password.
The following parameters to be configured vary with authentication modes:
|
Parameter |
Remarks |
|
Username |
Enter the Telnet username. The user must have the operating system administrator's privilege. |
|
Password |
Enter the password of the Telnet user. |
|
Super Password |
Enter the super password with which a Telnet user can elevate privileges after login. |
- Timeout (1-60 seconds)—Enter the maximum time period that APM waits for a Telnet response from the operating system. The value range is 1 to 60 seconds and the default is 4 seconds. If no Telnet response is received from the operating system within the timeout time, APM considers the interaction a failure.
When WMI is selected, configure the following parameters:
- Username—Enter the username of the Windows administrator.
If the administrator is a domain user, use domain name\username.
If the administrator is a local user, use host name\username or IP address\username, or use username.
- Password—Enter the password of the administrator.
¡ File Name—Enter the absolute path and name of the file you want to monitor. Use the C:\pagefile.sys format for Windows, or the /var/log/messages format for Linux and UNIX.
¡ Contact—Enter the contact information, such as the name, email address, and telephone number. The default is the username of the operator who created the application monitor.
¡ APM Server—Select an APM server to monitor the application. The options are in server-address (application-type:n/N) format. The letter n indicates the number of file applications monitored on the APM server. The letter N indicates the total number of applications monitored on the APM server. Server address 127.0.0.1 indicates that APM and the IMC platform are deployed on the same server.
¡ Related Applications—Click Add next to this field. On the Select Application window, enter a partial or complete name to filter applications, select the applications that the file application depends on, and then click OK.
Operating system applications cannot be selected. Operators can view all dependencies of the application in the dependency topology. APM automatically adds the dependencies between the file and operating system applications by IP address and displays their dependencies in the application topology.
¡ Application Group—Specify an application group for the file application.
- To specify an existing application group, click Add, select an application group, and then click OK.
- To specify a new application group, click Add Application Group, configure the application group settings, and then click OK.
¡ Detect Application—Select this parameter if you want to enable application detection. Application detection enables APM to verify connection to the application by using the previous parameter settings, and to determine whether to add the application monitor based on the verification result. APM adds the application monitor only when it can connect to the application. When this parameter is not selected, APM adds the application monitor without verifying the connection.
5. Click OK.
Modifying a file monitor
Authorized users can modify all parameters except the IP address and the APM server for a file monitor. If the IP address of the host where the monitored file is located changes, operators must add a new application monitor for the file. The new application monitor cannot inherit the history data from the previous application monitor.
To modify a file monitor:
1. Click the Resource tab.
2. From the navigation tree, select Application Manager > Application Monitor.
The application monitor list page displays all application monitors.
3. Click the Modify
icon ![]() for the file monitor you want to modify.
for the file monitor you want to modify.
The page for modifying the file monitor opens.
4. Modify the parameters as needed, except the IP address and the APM server.
For more information about parameter settings, see "Adding a file monitor"
5. Click OK.
Viewing the file monitor report
After a file application monitor is added, APM collects index data of the application, evaluates the availability and health status, and updates the monitor report. The report shows the index values obtained from the most recent polling of the application.
To access the file monitor report:
1. Click the Resource tab.
2. From the navigation tree, select Application Manager > Application Monitor.
The application monitor list page displays all application monitors.
3. Click the name of a file monitor to display the report.
Figure 103 shows part of a file monitor report.
Figure 103 Part of a file monitor report
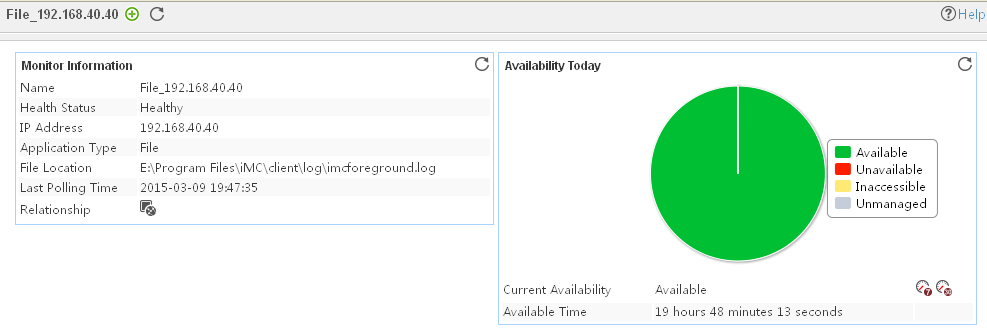
Monitor Information
The Monitor Information area contains the following fields:
· Name—Application monitor name.
· Health State—Health status of the file.
· IP Address—IP address of the host where the file is located.
· Application Type—Type of the monitored application, which is always File.
· File Location—Absolute path of the monitored file.
· Last Polling Time—Time when APM last polled the file.
· Relationship—Click the Relationship icon ![]() to view
relations between applications in a dependency topology view. For more information about dependency topologies, see "Topology and application group management."
to view
relations between applications in a dependency topology view. For more information about dependency topologies, see "Topology and application group management."
· Top5 Unrecovered Alarm—Latest five unrecovered alarms on the file. The alarm level is identified by color: yellow for minor alarms, orange for major alarms, and red for critical alarms. This field is not displayed if no alarm is generated by the file.
Availability Today
The Availability Today area contains the following fields:
· Current Availability—Availability of the file.
¡ Click the Weekly History icon![]() to view the availability of the file in the last 7 days.
to view the availability of the file in the last 7 days.
¡ Click the Monthly
History icon![]() to view the availability of the file in the last 30 days
to view the availability of the file in the last 30 days
· Available Time—Total amount of time that the file was available after 00:00 today.
· Unavailable Time—Total amount of time that the file was unavailable after 00:00 today.
· Inaccessible Time—Total amount of time that the file was inaccessible after 00:00 today.
· Unmanaged Time—Total amount of time that the file was unmanaged after 00:00 today.
The statistics collection started when the application monitor was added. An availability time field is not displayed if its value is 0.
File Statistics
The File Statistics area contains the following fields:
· File Size—Size of the file. Click the Set Threshold
icon ![]() to set
alarm thresholds for the file size.
to set
alarm thresholds for the file size.
· Last Modified—Time when the file was most recently modified.
Directory
APM can monitor the size of individual directories on Windows, UNIX, and Linux operating systems. This section describes how to add and modify a directory monitor, and helps you view the monitor report.
Adding a directory monitor
APM can monitor directories through WMI or CLI. When you add application monitors for directories, follow these guidelines:
· Add the host where the directory to be monitored is located to the IMC platform so that APM can obtain and display network connections of the host and the access device in the application topology. For more information about adding hosts to the IMC platform, see H3C Intelligent Management Center v7.3 Enterprise and Standard Platform Administrator Guide.
· To monitor a directory on a Windows host, first configure and enable WMI for the Windows operating system (see the Microsoft Windows operating system online help), and provide the username and password of the user who has the Windows administrator's privileges.
· To monitor a directory on a Linux or UNIX host, first enable Telnet or SSH for the host (see the Linux configuration guide), and configure the Telnet or SSH username and password on both the host and the IMC platform. The Telnet or SSH user must have the administrator privilege.
To add a directory monitor:
1. Click the Resource tab.
2. Open the Add Application page by using one of the following methods:
¡ From the navigation tree, select Application Manager > Add Application.
The page displays all application types that can be monitored by APM.
¡ From the navigation tree, select Application Manager > Application Monitor, and then click Add on the application monitor list page.
3. Click Directory of the File/Directory Monitor class.
The page for adding a directory monitor opens.
4. Configure the following parameters:
¡ IP Address—Enter the IP address of the host where the directory to be monitored is located. APM automatically checks the specified IP address and associates the application monitor with the host managed in the IMC platform. If the host is already added to the IMC platform, you can also click Select, and then select the host in the Select Devices window. For information about selecting a host, see "Quick start."
¡ Name—Enter a unique application monitor name. As a best practice, name the application monitor as application type_host IP address.
¡ Use Template—Select Enable or Disable from the list.
¡ Template—Click the Configure icon ![]() next to the Template field to select an
existing template. The Template field is
automatically populated with the name of the selected template. For more
information about configuring application templates, see "Configuration management." This field is displayed only when you select Enable from the Use Template
list.
next to the Template field to select an
existing template. The Template field is
automatically populated with the name of the selected template. For more
information about configuring application templates, see "Configuration management." This field is displayed only when you select Enable from the Use Template
list.
¡ Description—Enter a description for the application monitor.
¡ Polling Interval (min)—Select a polling interval for the application monitor. Options are 1, 2, 3, 4, 5, 10, 20, and 30. The default polling interval is 5 minutes. A shorter polling interval provides more accurate realtime data, but consumes more system resources. This field is available only when you select Disable from the Use Template list.
¡ Monitor Type—Select the protocol (SSH, Telnet, or WMI) through which APM monitors the
file application, and then click the Configure icon ![]() (not
available for WMI) to configure related parameters. This field is available only when
you select Disable from the Use Template list.
(not
available for WMI) to configure related parameters. This field is available only when
you select Disable from the Use Template list.
When SSH is selected, configure the following parameters:
- Edit SSH Parameters—Select this option if you want to manually configure SSH parameters for APM. Make sure the SSH settings are the same as those on the operating system where the file is located.
- Select an Existing Template—Select this option if you want to select an existing SSH template for APM. For information about setting SSH parameter templates, see H3C Intelligent Management Center v7.3 Enterprise and Standard Platform Administrator Guide.
- Authentication Mode—Select the authentication mode for SSH users. Options are Password, Private Key, Password + Private Key, Password + Super Password, Private Key + Super Password, and Password + Private Key + Super Password.
The following parameters to be configured vary with authentication modes:
|
Parameter |
Remarks |
|
Username |
Enter the SSH username. The user must have the operating system administrator's privilege. |
|
Password |
Enter the password of the SSH user. |
|
Private Key File |
Enter the directory of the SSH private key file or browse to the file. |
|
Private Key Password |
Enter the password to decrypt the SSH private key file. |
|
Super Password |
Enter the super password with which an SSH user can elevate privileges after login. |
- Port—Enter the SSH port on the operating system.
- Timeout (1-120 seconds)—Enter the maximum time period that APM waits for an SSH response from the operating system. The value range is 1 to 120 seconds and the default is 10 seconds. If no SSH response is received from the operating system within the timeout time, APM considers the interaction a failure.
- Retries (1-5)—Enter how many times APM retries to send SSH packets to the operating system host.
When Telnet is selected, configure the following parameters:
- Edit Telnet Parameters—Select this option if you want to manually configure Telnet parameters for APM. Make sure the Telnet settings are the same as those on the operating system where the file is located.
- Select an Existing Template—Select this option if you want to select an existing Telnet template for APM. For information about setting Telnet parameter templates, see H3C Intelligent Management Center v7.3 Enterprise and Standard Platform Administrator Guide.
- Authentication Mode—Select the authentication mode for Telnet users. Options are Password (No Operator or Super/Manager), Username + Password, Super/Manager Password, Password + Super/Manager Password (No Operator), Username + Password + Super/Manager Password, No Username + No Password, and Username + No Password.
The following parameters to be configured vary with authentication modes:
|
Parameter |
Remarks |
|
Username |
Enter the Telnet username. The user must have the operating system administrator's privilege. |
|
Password |
Enter the password of the Telnet user. |
|
Super Password |
Enter the super password with which a Telnet user can elevate privileges after login. |
- Timeout (1-60 seconds)—Enter the maximum time period that APM waits for a Telnet response from the operating system. The value range is 1 to 60 seconds and the default is 4 seconds. If no Telnet response is received from the operating system within the timeout time, APM considers the interaction a failure.
When WMI is selected, configure the following parameters:
- Username—Enter the username of the Windows administrator.
If the administrator is a domain user, use domain name\username.
If the administrator is a local user, use host name\username or IP address\username, or use username.
- Password—Enter the password of the administrator.
¡ Directory Name—Enter the absolute path and name of the directory you want to monitor. Use the C:\Windows format for Windows or the /home/Apache format for Linux and UNIX. This field is available only when you select Disable from the Use Template list.
¡ Contact—Enter the contact information, such as the name, email address, and telephone number. The default is the username of the operator who created the application monitor. This field is available only when you select Disable from the Use Template list.
¡ APM Server—Select an APM server to monitor the application. The options are in server-address (application-type:n/N) format. The letter n indicates the number of directory applications monitored on the APM server. The letter N indicates the total number of applications monitored on the APM server. Server address 127.0.0.1 indicates that APM and the IMC platform are deployed on the same server.
¡ Related Applications—Click Add next to this field. On the Select Application window, enter a partial or complete name to filter applications, select the applications that the directory application depends on, and then click OK.
Operating system applications cannot be selected. Operators can view all dependencies of the application in the dependency topology. APM automatically adds the dependencies between the directory and operating system applications by IP address and displays their dependencies in the application topology.
¡ Application Group—Specify an application group for the directory application.
- To specify an existing application group, click Add, select an application group, and then click OK.
- To specify a new application group, click Add Application Group, configure the application group settings, and then click OK.
¡ Detect Application—Select this parameter if you want to enable application detection. Application detection enables APM to verify connection to the application by using the previous parameter settings, and to determine whether to add the application monitor based on the verification result. APM adds the application monitor only when it can connect to the application. When this parameter is not selected, APM adds the application monitor without verifying the connection.
5. Click OK.
Modifying a directory monitor
Authorized users can modify all parameters except the IP address and the APM server for a directory monitor. When the IP address of the host where the monitored directory is located changes, operators must add a new application monitor for the directory. The new application monitor cannot inherit the history data from the previous application monitor.
To modify a directory monitor:
1. Click the Resource tab.
2. From the navigation tree, select Application Manager > Application Monitor.
The application monitor list page displays all application monitors.
3. Click the Modify
icon ![]() for the directory
monitor you want to modify.
for the directory
monitor you want to modify.
The page for modifying the directory monitor opens.
4. Modify the parameters as needed, except the IP address and the APM server.
For more information about parameter settings, see "Adding a directory monitor."
5. Click OK.
Viewing the directory monitor report
After a directory application monitor is added, APM collects index data of the application, evaluates the availability and health status, and updates the monitor report. The report shows the index values obtained from the most recent polling of the application.
To access the directory monitor report:
1. Click the Resource tab.
2. From the navigation tree, select Application Manager > Application Monitor.
The application monitor list page displays all application monitors.
3. Click the name of a directory monitor to display the report.
Figure 104 shows part of a directory monitor report.
Figure 104 Part of a directory monitor report
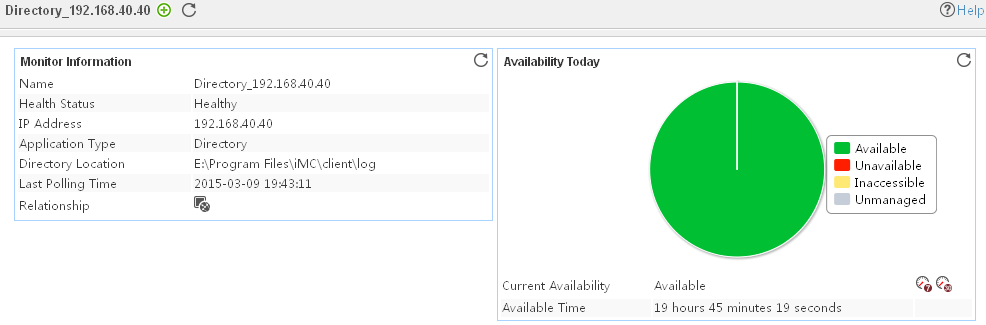
Monitor Information
The Monitor Information area contains the following fields:
· Name—Application monitor name.
· Health State—Health status of the directory.
· IP Address—IP address of the host where the directory is located.
· Application Type—Type of the monitored application, which is always Directory.
· Directory Location—Absolute path of the monitored directory.
· Last Polling Time—Time when APM last polled the directory.
· Relationship—Click the Relationship icon ![]() to view
relations between applications in a dependency topology view. For more information about dependency topologies, see "Topology and application group management."
to view
relations between applications in a dependency topology view. For more information about dependency topologies, see "Topology and application group management."
· Top5 Unrecovered Alarm—Latest five unrecovered alarms on the directory. The alarm level is identified by color: yellow for minor alarms, orange for major alarms, and red for critical alarms. This field is not displayed if no alarm is generated by the directory.
Availability Today
The Availability Today area contains the following fields:
· Current Availability—Availability of the directory.
¡ Click the Weekly History icon![]() to view the availability of the directory in the last 7 days.
to view the availability of the directory in the last 7 days.
¡ Click the Monthly
History icon![]() to view the availability of the directory in the last 30 days.
to view the availability of the directory in the last 30 days.
· Available Time—Total amount of time that the directory was available after 00:00 today.
· Unavailable Time—Total amount of time that the directory was unavailable after 00:00 today.
· Inaccessible Time—Total amount of time that the directory was inaccessible after 00:00 today.
· Unmanaged Time—Total amount of time that the directory was unmanaged after 00:00 today.
The statistics collection started when the application monitor was added. An availability time field is not displayed if its value is 0.
Directory Statistics
The Directory Statistics area contains the following fields:
· Directory Size—Disk space occupied by the directory.
¡ Click
the Set Threshold icon ![]() to set alarm
thresholds for the directory size.
to set alarm
thresholds for the directory size.
¡ Click
the History Record icon ![]() to view the history graph of the directory
size.
to view the history graph of the directory
size.
· Sub Directory Counts—Number of sub directories.
· File Counts—Number of files.
Directory Incremental
The Directory Incremental area contains the following field:
· Directory Incremental—Size change of the directory. Click the History Record icon ![]() to view the history graph of the directory
incremental.
to view the history graph of the directory
incremental.
Service monitor
SNMP service
Simple Network Management Protocol (SNMP) is a network management protocol widely supported by operating systems and network devices. SNMP MIB uses a hierarchical structure to describe nodes on the network, each of which is identified by a unique OID. Network management systems can obtain various index data from devices by reading their OIDs via SNMP. The default SNMP service port is UDP 161.
APM monitors the SNMP service status by reading specific OIDs. This section describes how to add and modify an SNMP service application monitor, and helps view the monitor report.
Adding an SNMP service application monitor
When you add an SNMP monitor, follow these guidelines:
· SNMP is enabled and configured on the SNMP hosts to be monitored.
· The target SNMP hosts must be added to the IMC platform so that APM can obtain and display network connections of the hosts and their access devices in the application topology. For more information about adding devices to the IMC platform, see H3C Intelligent Management Center v7.3 Enterprise and Standard Platform Administrator Guide.
· To view traffic statistics in the monitor report of the SNMP service application, make sure at least one probe is configured in APM. After an SNMP service application monitor is added, APM sends the IP address of the monitored SNMP service application to the probes for traffic collection.
To add an SNMP service application monitor:
1. Click the Resource tab.
2. Open the Add Application page by using one of the following methods:
¡ From the navigation tree, select Application Manager > Add Application.
The page displays all application types that can be monitored by APM.
¡ From the navigation tree, select Application Manager > Application Monitor, and then click Add on the application monitor list page.
3. Click SNMP Monitor of the Service Monitor class.
The page for adding an SNMP service application monitor opens.
4. Configure the following parameters:
¡ IP Address—Enter the IP address of the host on which the SNMP service application to be monitored is installed. APM automatically checks the specified IP address and associates the application monitor with the host managed in the IMC platform. If the host is already added to the IMC platform, you can also click Select, and then select the host in the Select Devices window. For information about selecting a host, see "Quick start."
¡ Name—Enter a unique application monitor name. As a best practice, name the application monitor as application type_host IP address.
¡ Use Template—Select Enable or Disable from the list.
¡ Template—Click the Configure icon ![]() next to the Template field to select an
existing template. The Template field is
automatically populated with the name of the selected template. For more
information about configuring application templates, see "Configuration management." This field is displayed only when you select Enable from the Use Template
list.
next to the Template field to select an
existing template. The Template field is
automatically populated with the name of the selected template. For more
information about configuring application templates, see "Configuration management." This field is displayed only when you select Enable from the Use Template
list.
¡ Description—Enter a description for the application monitor.
¡ OID—Enter the OID for SNMP monitoring. You can obtain OIDs by using a network management tool. For example, the OID of the system up time (sysUpTime) is 1.3.6.1.2.1.1.3.0. This field is available only when you select Disable from the Use Template list.
¡ OID Data Type—Select the type of the returned OID data. Options are the following:
- NULL
- INTEGER
- BITS
- OCTET STRING
- OBJECT IDENTIFIER
- Integer32
- IpAddress
- Counter32
- Gauge32
- TimeTicks
- Counter64
- Unsigned32
- DateAndTime
APM can resolve only the returned OID data that has correct OID data type. This field is available only when you select Disable from the Use Template list.
¡ Traffic Collection Port—Enter the SNMP service port. The default value is 161. This field is displayed only when at least one probe is configured for APM and when you select Disable from the Use Template list.
¡ Polling Interval (min)—Select a polling interval for the application monitor. Options are 1, 2, 3, 4, 5, 10, 20, and 30. The default polling interval is 5 minutes. A shorter polling interval improves real-time data accuracy at the expense of system resources. This field is available only when you select Disable from the Use Template list.
¡ SNMP—Set the
SNMP version and the corresponding access parameters. Click the Configure icon ![]() on the right of the SNMP window, set the SNMP version and
associated access parameters, and then click OK. This field is available only
when you select Disable from the Use Template list.
on the right of the SNMP window, set the SNMP version and
associated access parameters, and then click OK. This field is available only
when you select Disable from the Use Template list.
¡ Contact—Enter the contact information, such as the name, email address, and telephone number. The default is the username of the operator who created the application monitor. This field is available only when you select Disable from the Use Template list.
¡ APM Server—Select an APM server to monitor the application. The options are in server-address (application-type:n/N) format. The letter n indicates the number of SNMP service applications monitored on the APM server. The letter N indicates the total number of applications monitored on the APM server. Server address 127.0.0.1 indicates that APM and the IMC platform are deployed on the same server.
¡ Related Applications—Click Add next to this field. On the Select Application window, enter a partial or complete name to filter applications, select the applications that the SNMP service application depends on, and then click OK.
Operating system applications cannot be selected. Operators can view all dependencies of the application in the dependency topology. APM automatically adds the dependencies between SNMP service and operating system applications by IP address and displays their dependencies in the application topology.
¡ Application Group—Specify an application group for the SNMP service application.
- To specify an existing application group, click Add, select an application group, and then click OK.
- To specify a new application group, click Add Application Group, configure the application group settings, and then click OK.
¡ Detect Application—Select this parameter if you want to enable application detection. Application detection enables APM to verify connection to the application by using the previous parameter settings, and to determine whether to add the application monitor based on the verification result. APM adds the application monitor only when it can connect to the application. When this parameter is not selected, APM adds the application monitor without verifying the connection.
5. Click OK.
Modifying an SNMP service application monitor
Authorized users can modify all parameters except the IP address and the APM server for an SNMP service application monitor. When the IP address of a monitored SNMP host changes, authorized users must add a new application monitor for the host. The new application monitor cannot inherit the history data from the previous application monitor.
To modify an SNMP service application monitor:
1. Click the Resource tab.
2. From the navigation tree, select Application Manager > Application Monitor.
The page displays all application types that can be monitored by APM.
3. Click the Modify icon![]() for the SNMP
service application monitor you want to modify.
for the SNMP
service application monitor you want to modify.
The page for modifying the SNMP service application monitor opens.
4. Modify the parameters as needed, except the IP address and the APM server.
For more information about parameter settings, see "Adding an SMTP application monitor."
5. Click OK.
Viewing the SNMP service application monitor report
After an SNMP service application monitor is added, APM collects index data of the application, evaluates the availability and health status, and updates the monitor report. The report shows the index values obtained from the most recent polling of the application.
To access the SNMP service application monitor report:
1. Click the Resource tab.
2. From the navigation tree, select Application Manager > Application Monitor.
The application monitor list page displays all application monitors.
3. Click the name of an SNMP application monitor to display the report.
Figure 105 shows part of an SNMP service application monitor report.
Figure 105 Part of an SNMP service application monitor report

Monitor Information
The Monitor Information area contains the following fields:
· Name—Application monitor name.
· Health State—Health status of the SNMP service application.
· IP Address—IP address of the SNMP service host.
· Application Type—Type of the monitored application, which is always SNMP Monitor.
· Last Polling Time—Time when APM last polled the SNMP service.
· Relationship—Click the Relationship icon ![]() to view
dependencies between the SNMP service and other applications in a dependency
topology view. For more information about dependency
topologies, see "Topology and application group management"
to view
dependencies between the SNMP service and other applications in a dependency
topology view. For more information about dependency
topologies, see "Topology and application group management"
· Top5 Unrecovered Alarm—Latest five unrecovered alarms on the SNMP service host. The alarm level is identified by color: yellow for minor alarms, orange for major alarms, and red for critical alarms. This field is not displayed if no alarm is generated by the SNMP service.
Availability Today
The Availability Today area contains the following fields:
· Current Availability—Availability of the SNMP service.
¡ Click
the Weekly History icon![]() to view the availability of the SNMP
service in the last 7 days.
to view the availability of the SNMP
service in the last 7 days.
¡ Click
the Monthly History icon![]() to view the availability of the SNMP
service in the last 30 days.
to view the availability of the SNMP
service in the last 30 days.
· Available Time—Total amount of time that the SNMP service was available after 00:00 today.
· Unavailable Time—Total amount of time that the SNMP service was unavailable after 00:00 today.
· Inaccessible Time—Total amount of time that the SNMP service was inaccessible after 00:00 today.
· Unmanaged Time—Total amount of time that the SNMP service was unmanaged after 00:00 today.
The statistics collection started when the application monitor was added. An availability time field is not displayed when its value is 0.
Ping Test
The Ping Test area contains the following field:
· Response Time—Round trip response time of the SNMP service. Response time refers to the duration from APM sending a request to SNMP to APM receiving the SNMP response.
¡ Click
the Set Threshold icon ![]() to set alarm
thresholds for the response time.
to set alarm
thresholds for the response time.
¡ Click the History
Record icon ![]() to view the history
graph of the response time.
to view the history
graph of the response time.
SNMP OID
The SNMP OID area contains the following field:
· OID/Value—OID and its value for SNMP monitoring.
Application Traffic
APM collects SNMP service traffic based on the IP address and port number of SNMP host.
The Application Traffic area contains the following fields:
· Last Hour's Traffic—Total traffic sent and received by SNMP service over the last 1 hour.
· Today's Traffic—Total traffic sent and received by SNMP service since 00:00 today.
DNS service
Domain Name System (DNS) is a core Internet service. With DNS, users can use easy-to-remember domain names to access websites. The DNS service can automatically translate the domain names you specified into IP addresses. The default DNS service ports are TCP 53 and UDP 53.
APM monitors the DNS service status by requesting the DNS service to translate a specific domain name into an IP address. This section describes how to add and modify a DNS monitor, and helps view the monitor report.
Adding a DNS service application monitor
APM monitors DNS status through DNS service ports TCP/UDP 53. When you add a DNS service application monitor, follow these guidelines:
· Add the target host to the IMC platform. For information about adding a host to the IMC platform, see H3C Intelligent Management Center v7.3 Enterprise and Standard Platform Administrator Guide.
· To view traffic statistics in the monitor report of the DNS application, make sure at least one probe is configured in APM. After a DNS service application monitor is added, APM sends the IP address of the monitored DNS application to the probes for traffic collection.
To add a DNS service application monitor:
1. Click the Resource tab.
2. Open the Add Application page by using one of the following methods:
¡ From the navigation tree, select Application Manager > Add Application.
The page displays all application types that can be monitored by APM.
¡ From the navigation tree, select Application Manager > Application Monitor, and then click Add on the application monitor list page.
3. Click DNS Monitor of the Service Monitor class.
The page for adding a DNS service application monitor opens.
4. Configure the following parameters:
¡ IP Address—Enter the IP address of the host on which the DNS service application to be monitored is installed. APM automatically checks the specified IP address and associates the application monitor with the host managed in the IMC platform. If the host is already added to the IMC platform, you can also click Select, and then select the host in the Select Devices window. For information about selecting a host, see "Quick start."
¡ Name—Enter a unique application monitor name. As a best practice, name the application monitor as application type_host IP address.
¡ Use Template—Select Enable or Disable from the list.
¡ Template—Click
the Configure icon ![]() next to the Template field to select an existing
template. The Template field is automatically populated with the name of the selected
template. For more information about configuring application templates, see
"Configuration management." This field is displayed only when you select Enable from the Use Template list.
next to the Template field to select an existing
template. The Template field is automatically populated with the name of the selected
template. For more information about configuring application templates, see
"Configuration management." This field is displayed only when you select Enable from the Use Template list.
¡ Description—Enter a description for the application monitor.
¡ Traffic Collection Port—Enter the DNS service port. The default value is 53, including TCP 53 and UDP 53. This field is displayed only when at least one probe is configured for APM and when you select Enable from the Use Template list.
¡ Polling Interval (min)—Select a polling interval for the application monitor. Options are 1, 2, 3, 4, 5, 10, 20, and 30. The default polling interval is 5 minutes. A shorter polling interval improves real-time data accuracy at the expense of system resources. This field is displayed only when you select Enable from the Use Template list.
¡ Host—Enter the domain name of a website for DNS monitoring. For example, enter www.H3C.com. This field is displayed only when you select Enable from the Use Template list.
¡ Record Type—Select a record type for the domain name. Options are AAAA, CNAME, MX, SOA, A, SPF, NS, SRV, TXT, and PTR. For more information about record types, see Table 13. This field is displayed only when you select Enable from the Use Template list.
|
Record Types |
Remarks |
|
AAAA |
DNS Extensions to Support IP Version 6. |
|
CNAME |
Canonical name for an alias. |
|
MX |
Mail exchange. |
|
SOA |
Start of a zone of authority. |
|
A |
Host address. |
|
SPF |
Sender Policy Framework. |
|
NS |
Authoritative name server. |
|
SRV |
Service record, which identifies the location of servers. |
|
TXT |
Text strings. |
|
PTR |
Domain name pointer. |
¡ Contact—Enter the contact information, such as the name, email address, and telephone number. The default is the username of the operator who created the application monitor. This field is displayed only when you select Enable from the Use Template list.
¡ APM Server—Select an APM server to monitor the application. The options are in server-address (application-type:n/N) format. The letter n indicates the number of DNS service applications monitored on the APM server. The letter N indicates the total number of applications monitored on the APM server. Server address 127.0.0.1 indicates that APM and the IMC platform are deployed on the same server.
¡ Related Applications—Click Add next to this field. On the Select Application window, enter a partial or complete name to filter applications, select the applications that the DNS service application depends on, and then click OK.
Operating system applications cannot be selected. Operators can view all dependencies of the application in the dependency topology. APM automatically adds the dependencies between DNS service and operating system applications by IP address and displays their dependencies in the application topology.
¡ Application Group—Specify an application group for the DNS service application.
- To specify an existing application group, click Add, select an application group, and then click OK.
- To specify a new application group, click Add Application Group, configure the application group settings, and then click OK.
¡ Detect Application—Select this parameter if you want to enable application detection. Application detection enables APM to verify connection to the application by using the previous parameter settings, and to determine whether to add the application monitor based on the verification result. APM adds the application monitor only when it can connect to the application. When this parameter is not selected, APM adds the application monitor without verifying the connection.
5. Click OK.
Modifying a DNS service application monitor
Authorized users can modify all parameters except the IP address and the APM server for a DNS service application monitor. When the IP address of a monitored DNS host changes, operators must add a new application monitor for the host. The new application monitor cannot inherit the history data from the previous application monitor.
To modify a DNS service application monitor:
1. Click the Resource tab.
2. From the navigation tree, select Application Manager > Application Monitor.
The page displays all application types that can be monitored by APM.
3. Click the Modify icon ![]() for the DNS
service application monitor you want to modify.
for the DNS
service application monitor you want to modify.
The page for modifying a DNS service application monitor opens.
4. Modify the parameters as needed, except the IP address and the APM server.
For more information about parameter settings, see "Adding a DNS service application monitor."
5. Click OK.
Viewing the DNS service application monitor report
After a DNS service application monitor is added, APM collects index data of the application, evaluates the availability and health status, and updates the monitor report. The report shows the index values obtained from the most recent polling of the application.
To access the DNS service application report:
1. Click the Resource tab.
2. From the navigation tree, select Application Manager > Application Monitor.
The application monitor list page displays all application monitors.
3. Click the name of a DNS service application monitor to display the report.
Figure 106 shows part of a DNS service application monitor report.
Figure 106 Part of a DNS service application monitor report

Monitor Information
The Monitor Information area contains the following fields:
· Name—Application monitor name.
· Health State—Health status of the DNS service application.
· IP Address—IP address of the DNS service host.
· Application Type—Type of the monitored application, which is always DNS Monitor.
· Last Polling Time—Time when APM last polled the DNS service.
· Relationship—Click the Relationship icon ![]() to view
dependencies between the DNS service and other applications in a dependency
topology view. For more information about dependency
topologies, see "Topology and application group management."
to view
dependencies between the DNS service and other applications in a dependency
topology view. For more information about dependency
topologies, see "Topology and application group management."
· Top5 Unrecovered Alarm—Latest five unrecovered alarms on the DNS host. The alarm level is identified by color: yellow for minor alarms, orange for major alarms, and red for critical alarms. This field is not displayed if no alarm is generated by the DNS service.
Availability Today
The Availability Today area contains the following fields:
· Current Availability—Availability of the DNS service.
¡ Click the Weekly History icon![]() to view the availability of the DNS service in the last 7 days.
to view the availability of the DNS service in the last 7 days.
¡ Click
the Monthly History icon![]() to view the availability of the DNS service in the last 30 days.
to view the availability of the DNS service in the last 30 days.
· Available Time—Total amount of time that the DNS service was available after 00:00 today.
· Unavailable Time—Total amount of time that the DNS service was unavailable after 00:00 today.
· Inaccessible Time—Total amount of time that the DNS service was inaccessible after 00:00 today.
· Unmanaged Time—Total amount of time that the DNS service was unmanaged after 00:00 today.
The statistics collection started when the application monitor was added. An availability time field is not displayed when its value is 0.
Response Time
The Response Time area contains the following fields:
· Response Time—Round trip response time of the DNS service. Response time refers to the duration from APM sending a request to APM receiving a response.
¡ Click
the Set Threshold icon ![]() to set alarm thresholds for the response
time.
to set alarm thresholds for the response
time.
¡ Click
the History Record icon
![]() to view the history graph of the response
time.
to view the history graph of the response
time.
· Host—Domain name that APM requests the DNS service to translate.
· Record Type—Record type of the domain name.
· Alias—Alternative names of the domain name.
· Query Result—IP address of the specified domain name.
Application Traffic
APM collects DNS service traffic based on the IP address and port number of DNS host.
The Application Traffic area contains the following fields:
· Last Hour's Traffic—Total traffic sent and received by DNS service over the last 1 hour.
· Today's Traffic—Total traffic sent and received by DNS service since 00:00 today.
Java Runtime
Java Runtime refers to Java Runtime Environment (JRE). It is required to run Java applications and applets. APM monitors JRE applications.
· Java Management Extensions—JMX, is a Java technology that supplies tools for managing and monitoring applications, system objects, devices and service oriented networks.
· Remote Method Invocation—RMI, provides a model for distributed computation with Java objects. These objects can be new Java objects or simple Java wrappers around an existing Application Programming Interface (API).
· Java Naming and Directory Interface—JNDI, part of the Java platform, providing applications based on Java technology with a unified interface to multiple naming and directory services. The commonly used JNDI name is jmxrmi.
Configuring Java Runtime to support RMI access
The APM monitors the JRE applications by obtaining monitor index data through RMI access. By default, most JRE applications do not provide RMI access. Operators must modify the JRE start script to support RMI access. This section describes how to configure application with JRE to support RMI access. The applications with JRE include Tomcat server and IMC.
1. Use a text editor, such as a Notepad and vi, to open the start script of the JRE application.
For Tomcat with JRE
¡ In Windows operating system: <Tomcat installation path>\bin\catalina.bat
¡ In Linux/Unix operating system: <Tomcat installation path>/bin/catalina.sh
For IMC with JRE
¡ In Windows operating system: <IMC installation path>\Client\bin\startup.bat.
¡ In Linux/Unix operating system: <IMC installation path>/Client/bin/startup.sh.
2. Add the following text to the script:
set JAVA_OPTS=%JAVA_OPTS% -Dcom.sun.management.jmxremote -Dcom.sun.management.jmxremote.port=1099 -Dcom.sun.management.jmxremote.ssl=false -Dcom.sun.management.jmxremote.authenticate=false
Parameter description:
¡ Dcom.sun.management.jmxremote.port=1099—1099 is the listening port. It can be another port, but cannot conflict with other services.
¡ Dcom.sun.management.jmxremote.ssl=false—false indicates that no SSL connection is needed for remote RMI access.
¡ Dcom.sun.management.jmxremote.authenticate=false—false indicates that no authentication is needed for remote RMI access. For information about enabling authentication, see the Java document.
¡ No carriage returns can be included.
¡ For IMC, this text should be in front of the part "%IMC_HOME%\bin\bootstrap.jar" start.
3. Save the script and restart the JRE application.
Adding Java Runtime application monitor
When you add application monitors for Java Runtime, follow these guidelines:
· The target hosts must be added to the IMC platform so that the connections between the devices and access devices can be obtained. For information about adding devices to the IMC platform, see H3C Intelligent Management Center v7.3 Enterprise and Standard Platform Administrator Guide.
· If authentication is required for remote RMI access (the value for Dcom.sun.management.jmxremote.authenticate is true), get the username and password in advance.
· To view traffic statistics in the monitor report of the Java Runtime application, make sure at least one probe is configured in APM. After a Java Runtime application monitor is added, APM sends the IP address and port number of monitored Java Runtime application to the probes for traffic collection.
To add a Java Runtime application monitor:
1. Click the Resource tab.
2. Open the Add Application page by using one of the following methods:
¡ From the navigation tree, select Application Manager > Add Application.
The page displays all application types that can be monitored by APM.
¡ From the navigation tree, select Application Manager > Application Monitor, and then click Add on the application monitor list page.
3. Click JavaRuntime of the Service Monitor class.
The page for adding a Java Runtime application monitor opens.
4. Configure the following parameters:
¡ IP Address—Enter the IP address of the host on which the Java Runtime application to be monitored is installed. APM automatically checks the specified IP address and associates the application monitor with the host managed in the IMC platform. If the host is already added to the IMC platform, you can also click Select, and then select the host in the Select Devices window. For information about selecting a host, see "Quick start."
¡ Name—Enter a unique application monitor name. As a best practice, name the application monitor as application type_host IP address.
¡ Use Template—Select Enable or Disable from the list.
¡ Template—Click the Configure icon ![]() next to the Template field to select an
existing template. The Template field is
automatically populated with the name of the selected template. For more
information about configuring application templates, see "Configuration management." This field is displayed only when you select Enable from the Use Template
list.
next to the Template field to select an
existing template. The Template field is
automatically populated with the name of the selected template. For more
information about configuring application templates, see "Configuration management." This field is displayed only when you select Enable from the Use Template
list.
¡ Description—Enter a description for the application monitor.
¡ Application Monitor Port—Enter the RIM port. Make sure the port number is the same as that specified in the script Dcom.sun.management.jmxremote.port. This field is available only when you select Disable from the Use Template list.
¡ Traffic Collection Port—Enter the JRE application service port. This field is displayed only when at least one probe is configured for APM. This field is available only when you select Disable from the Use Template list.
¡ Polling Interval (min)—Select a polling interval for the application monitor. Options are 1, 2, 3, 4, 5, 10, 20, and 30. The default polling interval is 5 minutes. A shorter polling interval improves real-time data accuracy at the expense of system resources. This field is available only when you select Disable from the Use Template list.
¡ Username and Password—Enter the authentication username and password for remote RMI access. If the authentication is not enabled, these fields are not needed. This field is available only when you select Disable from the Use Template list.
¡ JNDI—Enter the JNDI name for RMI access. The well-known JNDI name is jmxrmi. This field is available only when you select Disable from the Use Template list.
¡ Contact—Enter the contact information, such as the name, email address, and telephone number. The default is the username of the operator who created the application monitor. This field is available only when you select Disable from the Use Template list.
¡ APM Server—Select an APM server to monitor the application. The options are in server-address (application-type:n/N) format. The letter n indicates the number of Java Runtime applications monitored on the APM server. The letter N indicates the total number of applications monitored on the APM server. Server address 127.0.0.1 indicates that APM and the IMC platform are deployed on the same server.
¡ Related Applications—Click Add next to this field. On the Select Application window, enter a partial or complete name to filter applications, select the applications that Java Runtime depends on, and then click OK.
Operating system applications cannot be selected. Operators can view all dependencies of the application in the dependency topology. APM automatically adds the dependencies between Java Runtime and operating system applications by IP address and displays their dependencies in the application topology.
¡ Application Group—Specify an application group for the Java Runtime application.
- To specify an existing application group, click Add, select an application group, and then click OK.
- To specify a new application group, click Add Application Group, configure the application group settings, and then click OK.
¡ Detect Application—Select this parameter if you want to enable application detection. Application detection enables APM to verify connection to the application by using the previous parameter settings, and to determine whether to add the application monitor based on the verification result. APM adds the application monitor only when it can connect to the application. When this parameter is not selected, APM adds the application monitor without verifying the connection.
5. Click OK.
Modifying Java Runtime application monitor
Authorized users can modify all parameters except the IP address and the APM server for a Java Runtime application monitor. When the IP address of a monitored Java Runtime host changes, operators must add a new application monitor for the host. The new application monitor cannot inherit the history data from the previous application monitor.
To modify a Java Runtime application monitor:
1. Click the Resource tab.
2. From the navigation tree, select Application Manager > Application Monitor.
The page displays all application types that can be monitored by APM.
3. Click the Modify icon ![]() for the Java
Runtime application monitor you want to modify.
for the Java
Runtime application monitor you want to modify.
The page for modifying the Java Runtime application monitor opens.
4. Modify the parameters as needed, except the IP address and the APM server.
For more information about parameter settings, see "Adding Java Runtime application monitor."
5. Click OK.
Viewing Java Runtime application monitor report
After adding the Java Runtime application monitor, APM collects application index data to calculate its availability and health status. Obtain monitor indexes for Java Runtime application by viewing the monitor report.
To access the Java Runtime application monitor report:
1. Click the Resource tab.
2. From the navigation tree, select Application Manager > Application Monitor.
The application monitor list page displays all application monitors.
3. Click the name of a Java Runtime application monitor to display the report.
Figure 107 shows part of a Java Runtime application monitor report.
Figure 107 Part of an Java Runtime application monitor report
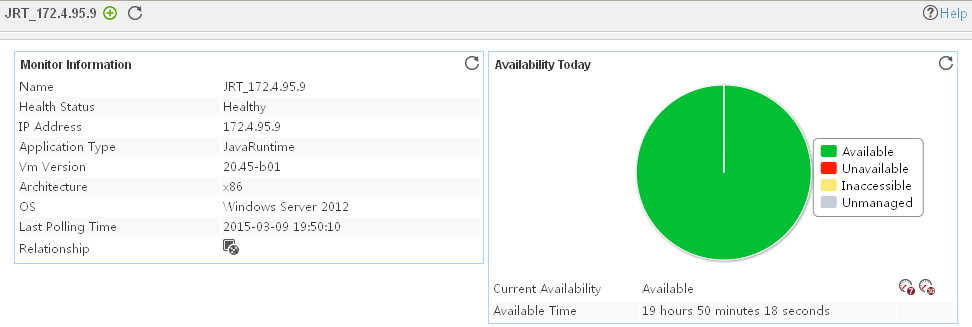
Monitor Information
The Monitor Information area contains the following fields:
· Name—Application monitor name.
· Health State—Health status of the Java Runtime application.
· IP Address—IP address of the Java Runtime host.
· Application Type—Type of the monitored application, which is always JavaRuntime.
· VM Version—Version of the Java VM that the Java Runtime uses.
· Architecture—Architecture of the Java Runtime host.
· OS—Operating system installed on the Java Runtime host.
· Last Polling Time—Time when APM last polled the Java Runtime.
· Relationship—Click the Relationship icon ![]() to view
dependencies between the Java Runtime and other applications in a dependency
topology view. For more information about dependency
topologies, see "Topology and application group management."
to view
dependencies between the Java Runtime and other applications in a dependency
topology view. For more information about dependency
topologies, see "Topology and application group management."
· Top5 Unrecovered Alarm—Latest five unrecovered alarms on the Java Runtime host. The alarm level is identified by color: yellow for minor alarms, orange for major alarms, and red for critical alarms. This field is not displayed if no alarm is generated by the Java Runtime.
Availability Today
The Availability Today area contains the following fields:
· Current Availability—Availability of the Java Runtime.
¡ Click
the Weekly History icon![]() to view the availability of the Java Runtime application in the
last 7 days.
to view the availability of the Java Runtime application in the
last 7 days.
¡ Click
the Monthly History icon![]() to view the availability of the Java Runtime application in the
last 30 days.
to view the availability of the Java Runtime application in the
last 30 days.
· Available Time—Total amount of time that the Java Runtime was available after 00:00 today.
· Unavailable Time—Total amount of time that the Java Runtime was unavailable after 00:00 today.
· Inaccessible Time—Total amount of time that the Java Runtime was inaccessible after 00:00 today.
· Unmanaged Time—Total amount of time that the Java Runtime was unmanaged after 00:00 today.
The statistics collection started when the application monitor was added. An availability time field is not displayed when its value is 0.
OS
The OS area contains the following fields:
· Available processors—Number of processors on the Java Runtime host. For a multi-core CPU, each core represents a processor.
· Committed Virtual Memory Size—Virtual memory size assigned to the Java Runtime process when APM last polled Java Runtime.
· Free Physical Memory Size—Free physical memory size on the Java Runtime host when APM last polled Java Runtime.
· Free Swap Space Size—Free swap space size on the Java Runtime host. Swap space is the amount of physical memory and virtual memory.
· Process CPU Time—Time how long the JVM occupies CPU since JVM starts.
· Total Physical Memory Size—Total physical memory size on the Java Runtime host.
· Total Swap Space Size—Total amount of the physical and virtual memory on the Java Runtime host.
· Version—Version of the operating system of the Java Runtime host.
Runtime
The Runtime area contains the following fields:
· Name—Name of the Java Runtime.
· Spec Name—Name of the Java Runtime specification.
· Spec Vendor—Vendor of the Java Runtime specification.
· Spec Version—Version of the Java Runtime specification.
· VM Name—Name of the Java VM.
· VM Vendor—Vendor of the Java VM.
· VM Version—Version of the Java VM.
Heap Memory Usage
The Heap Memory Usage area contains the following fields:
· Committed—Committed heap memory when JVM starts.
· Init—Initial heap memory.
· Max—Maximum heap memory.
· Used—Heap memory being used. Click the Set Threshold icon
![]() to set alarm thresholds for the used heap
memory.
to set alarm thresholds for the used heap
memory.
NonHeap Memory Usage
The NonHeap Memory Usage area contains the following fields:
· Committed—Committed non-heap memory when JVM starts.
· Init—Initial non-heap memory.
· Max—Maximum non-heap memory.
· Used—Non-heap memory being used. Click the Set Threshold icon
![]() to set alarm thresholds for the used
non-heap memory.
to set alarm thresholds for the used
non-heap memory.
Application Traffic
APM collects JRE application traffic of the Java Runtime host.
The Application Traffic area contains the following field:
· Last Hour's Traffic—Total traffic sent and received by Java Runtime over the last 1 hour.
· Today's Traffic—Total traffic sent and received by Java Runtime since 00:00 today.
Class Loading
The Class Loading area contains the following fields:
· Loaded Class Count—Number of classes loaded to the memory when APM last polled J.
· Unloaded Class Count—Number of unloaded classes since JRE starts.
· Total loaded Class Count—Number of loaded classes since JRE starts, including the unloaded classes.
FTP service
File Transfer Protocol (FTP) is an application layer protocol based on the client/server model. It is used to transfer files from one host to another over an IP network. FTP server uses TCP port 20 to transfer data and TCP port 21 to transfer control commands.
APM monitors the FTP service status through simulating the behavior of the FTP client. This section describes how to add and modify an FTP service application monitor, and helps view the monitor report.
Adding an FTP service application monitor
When you add application monitors for FTP, follow these guidelines:
· Add FTP hosts to the IMC platform so that APM can obtain and display network connections of the hosts and their access devices in the application topology. For more information about adding hosts to the IMC platform, see H3C Intelligent Management Center v7.3 Enterprise and Standard Platform Administrator Guide.
· Obtain the FTP account of the user who has the file upload and download privileges, and the test file to test the upload and download function of FTP. The test file can be at most 10 MB.
· To view traffic statistics in the monitor report of the FTP service application, make sure at least one probe is configured in APM. After an FTP application monitor is added, APM sends the IP address and port of the monitored FTP service application to the probes for traffic collection.
To add an FTP service application monitor:
1. Click the Resource tab.
2. Open the Add Application page by using one of the following methods:
¡ From the navigation tree, select Application Manager > Add Application.
The page displays all application types that can be monitored by APM.
¡ From the navigation tree, select Application Manager > Application Monitor, and then click Add on the application monitor list page.
3. Click FTP Monitor of the Service Monitor class.
The page for adding an FTP service application monitor opens.
4. Configure the following parameters:
¡ IP Address—Enter the IP address of the host on which the FTP service application to be monitored is installed. APM automatically checks the specified IP address and associates the application monitor with the host managed in the IMC platform. If the host is already added to the IMC platform, you can also click Select, and then select the host in the Select Devices window. For information about selecting a host, see "Quick start."
¡ Name—Enter a unique application monitor name. As a best practice, name the application monitor as application type_host IP address.
¡ Use Template—Select Enable or Disable from the list.
¡ Template—Click the Configure icon ![]() next to the Template field to select an
existing template. The Template field is
automatically populated with the name of the selected template. For more
information about configuring application templates, see "Configuration management." This field is displayed only when you select Enable from the Use Template
list.
next to the Template field to select an
existing template. The Template field is
automatically populated with the name of the selected template. For more
information about configuring application templates, see "Configuration management." This field is displayed only when you select Enable from the Use Template
list.
¡ Description—Enter a description for the application monitor.
¡ Username/Password—Enter the username and password of the FTP user. The fields are available only when you select Disable from the Use Template list.
¡ Whether to Download File—Select Yes if you want to test the download function of FTP. Otherwise, select No. This field is available only when you select Disable from the Use Template list.
- Remote Source File Name—Enter the test file name.
APM downloads the file from the root directory of the FTP server.
- Local Source File Name—Enter the local test file name, which must contains the absolute path of the file.
¡ Whether to Upload File—Select Yes if you want to test the upload function of FTP. Otherwise, select No. This field is available only when you select Disable from the Use Template list.
- Local Source File Name—Enter the local test file name, which must contains the absolute path of the file.
- Remote Source File Name—Enter the test file name.
APM uploads the file to the root directory of the FTP server.
¡ Application Monitor Port—Enter the port on FTP. The default port is 21. This field is available only when you select Disable from the Use Template list.
¡ Traffic Collection Port—Enter the service port number for FTP. The default port is 21. This field is displayed only when at least one probe is configured for APM. This field is available only when you select Disable from the Use Template list.
¡ Polling Interval (min)—Select a polling interval for the application monitor. Options are 1, 2, 3, 4, 5, 10, 20, and 30. The default polling interval is 5 minutes. A shorter polling interval improves real-time data accuracy at the expense of system resources. This field is available only when you select Disable from the Use Template list.
¡ Contact—Enter the contact information, such as the name, email address, and telephone number. The default is the username of the operator who created the application monitor. This field is available only when you select Disable from the Use Template list.
¡ APM Server—Select an APM server to monitor the application. The options are in server-address (application-type:n/N) format. The letter n indicates the number of FTP service applications monitored on the APM server. The letter N indicates the total number of applications monitored on the APM server. Server address 127.0.0.1 indicates that APM and the IMC platform are deployed on the same server.
¡ Related Applications—Click Add next to this field. On the Select Application window, enter a partial or complete name to filter applications, select the applications that the FTP service depends on, and then click OK.
Operating system applications cannot be selected. Operators can view all dependencies of the application in the dependency topology. APM automatically adds the dependencies between the FTP service and operating system applications by IP address and displays their dependencies in the application topology.
¡ Application Group—Specify an application group for the FTP service application.
- To specify an existing application group, click Add, select an application group, and then click OK.
- To specify a new application group, click Add Application Group, configure the application group settings, and then click OK.
¡ Detect Application—Select this parameter if you want to enable application detection. Application detection enables APM to verify connection to the application by using the previous parameter settings, and to determine whether to add the application monitor based on the verification result. APM adds the application monitor only when it can connect to the application. When this parameter is not selected, APM adds the application monitor without verifying the connection.
5. Click OK.
Modifying an FTP service application monitor
Authorized users can modify all parameters except the IP address and the APM server for an FTP service application monitor. When the IP address of a monitored FTP host changes, operators must add a new application monitor for the host. The new application monitor cannot inherit the history data from the previous application monitor.
To modify an FTP service application monitor:
1. Click the Resource tab.
2. From the navigation tree, select Application Manager > Application Monitor.
The page displays all application types that can be monitored by APM.
3. Click the Modify icon ![]() for the FTP service application monitor you want to modify.
for the FTP service application monitor you want to modify.
The page for modifying the FTP service application monitor opens.
4. Modify the parameters as needed, except the IP address and the APM server.
For more information about parameter settings, see "Adding an FTP service application monitor."
5. Click OK.
Viewing the FTP service application monitor report
After an FTP service application monitor is added, APM collects index data of the application, evaluates the availability and health status, and updates the monitor report. The report shows the index values obtained from the most recent polling of the application.
To access the FTP service application monitor report:
1. Click the Resource tab.
2. From the navigation tree, select Application Manager > Application Monitor.
The application monitor list page displays all application monitors.
3. Click the name of an FTP application monitor to display the report.
Figure 108 shows part of an FTP service application monitor report.
Figure 108 Part of an FTP service application monitor report

Monitor Information
The Monitor Information area contains the following fields:
· Name—Application monitor name.
· Health State—Health status of the FTP service application.
· IP Address—IP address of the FTP service host.
· Application Type—Type of the monitored application, which is always FTP Monitor.
· Last Polling Time—Time when APM last polled the FTP service.
· Relationship—Click the Relationship
icon ![]() to view dependencies
between the FTP service and other applications in a dependency topology view. For more information about dependency topologies, see "Topology and application group management."
to view dependencies
between the FTP service and other applications in a dependency topology view. For more information about dependency topologies, see "Topology and application group management."
· Top5 Unrecovered Alarm—Latest five unrecovered alarms on the FTP service host. The alarm level is identified by color: yellow for minor alarms, orange for major alarms, and red for critical alarms. This field is not displayed if no alarm is generated by the FTP service.
Availability Today
The Availability Today area contains the following fields:
· Current Availability—Availability of the FTP service.
¡ Click
the Weekly History icon![]() to view the availability of the FTP service in the last 7 days.
to view the availability of the FTP service in the last 7 days.
¡ Click
the Monthly History icon![]() to view the availability of the FTP service in the last 30 days.
to view the availability of the FTP service in the last 30 days.
· Available Time—Total amount of time that the FTP service was available after 00:00 today.
· Unavailable Time—Total amount of time that the FTP service was unavailable after 00:00 today.
· Inaccessible Time—Total amount of time that the FTP service was inaccessible after 00:00 today.
· Unmanaged Time—Total amount of time that the FTP service was unmanaged after 00:00 today.
The statistics collection started when the application monitor was added. An availability time field is not displayed when its value is 0.
Connection Information
Typically, a host that provides FTP services is called an FTP server. APM attempts to connect to and sends login requests to the FTP server in each polling period.
The Connection Information area contains the following fields:
· Connection Time—Shows how long it took APM to connect to the FTP server in the most recent successful connection attempt.
¡ Click
the Set Threshold icon ![]() to set alarm
thresholds for the connection time.
to set alarm
thresholds for the connection time.
¡ Click
the History Record icon ![]() to view the connection time history graph.
to view the connection time history graph.
· Login Time—Shows how long it took APM to log in to the FTP server in the most recent successful login attempt.
¡ Click
the Set Threshold icon ![]() to set alarm
thresholds for the login time.
to set alarm
thresholds for the login time.
¡ Click
the History Record icon ![]() to view the history graph of the login time.
to view the history graph of the login time.
File Information
After login, APM collects files and directories in the home directory of the FTP account, not including subdirectories and files in the directories. Contents displayed in the monitor report and the privileges to upload, download, and delete files vary with different FTP accounts.
The File Information area contains the following fields:
· Number of Files—Number of files in the home directory of the FTP account.
· Number of Directories——Number of directories in the home directory of the FTP account.
Upload
When the upload function test is configured, APM uploads the selected test file and records the upload results after login to the FTP server.
The Upload area contains the following fields:
· Uploaded File Size—Size of the file to be uploaded.
· Uploading Duration—Time duration for uploading the file with FTP.
· Average Uploading Rate—Average file uploading rate of FTP.
¡ Click
the Set Threshold icon ![]() to set alarm
thresholds for the average uploading rate.
to set alarm
thresholds for the average uploading rate.
¡ Click the History Record
icon ![]() to view the history graph of the average
uploading rate.
to view the history graph of the average
uploading rate.
Download
When the download function test is configured, APM downloads the selected test file and records the download results after login to the FTP server.
The Download area contains the following fields:
· Downloaded File Size—Size of the file to be downloaded.
· Downloading Duration—Time duration for downloading the file with FTP.
· Average Downloading Rate—Average file downloading rate of FTP.
¡ Click
the Set Threshold icon ![]() to set alarm
thresholds for the average downloading rate.
to set alarm
thresholds for the average downloading rate.
¡ Click the History Record
icon ![]() to view the history graph of the average
downloading rate.
to view the history graph of the average
downloading rate.
Application Traffic
The Application Traffic area contains the following fields:
· Last Hour's Traffic—Total traffic sent and received by FTP over the last 1 hour.
· Today's Traffic—Total traffic sent and received by FTP since 00:00 today.
SFTP service
Secure File Transfer Protocol (SFTP) is part of SSH. It is used to transfer files from one SFTP host to another over an IP network. SFTP establishes connections to an SSH daemon (also known as sshd). The default sshd port is TCP 22.
APM monitors the SFTP service status through simulating the behavior of the SFTP client. This section describes how to add and modify an SFTP service application monitor, and helps view the monitor report.
Adding an SFTP service application monitor
When you add application monitors for SFTP, follow these guidelines:
· Add SFTP hosts to the IMC platform so that APM can obtain and display network connections of the hosts and their access devices in the application topology. For more information about adding hosts to the IMC platform, see H3C Intelligent Management Center v7.3 Enterprise and Standard Platform Administrator Guide.
· Obtain the SFTP account of the user who has the file upload and download privileges, and the test file to test the upload and download function of SFTP. The test file can be at most 10 MB.
· To view traffic statistics in the monitor report of the SFTP service application, make sure at least one probe is configured in APM. After an SFTP application monitor is added, APM sends the IP address and port of the monitored SFTP service application to the probes for traffic collection.
To add an SFTP service application monitor:
1. Click the Resource tab.
2. Open the Add Application page by using one of the following methods:
¡ From the navigation tree, select Application Manager > Add Application.
The page displays all application types that can be monitored by APM.
¡ From the navigation tree, select Application Manager > Application Monitor, and then click Add on the application monitor list page.
3. Click SFTP Monitor of the Service Monitor class.
The page for adding an SFTP service application monitor opens.
4. Configure the following parameters:
¡ IP Address—Enter the IP address of the host on which the SFTP service application to be monitored is installed. APM automatically checks the specified IP address and associates the application monitor with the host managed in the IMC platform. If the host is already added to the IMC platform, you can also click Select, and then select the host in the Select Devices window. For information about selecting a host, see "Quick start."
¡ Name—Enter a unique application monitor name. As a best practice, name the application monitor as application type_host IP address.
¡ Use Template—Select Enable or Disable from the list.
¡ Template—Click the Configure icon ![]() next to the Template field to select an
existing template. The Template field is
automatically populated with the name of the selected template. For more
information about configuring application templates, see "Configuration management." This field is displayed only when you select Enable from the Use Template
list.
next to the Template field to select an
existing template. The Template field is
automatically populated with the name of the selected template. For more
information about configuring application templates, see "Configuration management." This field is displayed only when you select Enable from the Use Template
list.
¡ Description—Enter a description for the application monitor.
¡ Username/Password—Enter the username and password of the SFTP user. The fields are available only when you select Disable from the Use Template list.
¡ Whether to Download File—Select Yes if you want to test the download function of SFTP. Otherwise, select No. This field is available only when you select Disable from the Use Template list.
- Remote Source File Name—Enter the test file name.
APM downloads the file from the root directory of the SFTP server.
- Local Source File Name—Enter the local test file name, which must contains the absolute path of the file.
¡ Whether to Upload File—Select Yes if you want to test the upload function of SFTP. Otherwise, select No. This field is available only when you select Disable from the Use Template list.
- Local Source File Name—Enter the local test file name, which must contains the absolute path of the file.
- Remote Source File Name—Enter the test file name.
APM uploads the file to the root directory of the SFTP server.
¡ Application Monitor Port—Enter the port on SFTP. The default port is 22. This field is available only when you select Disable from the Use Template list.
¡ Traffic Collection Port—Enter the service port number for SFTP. The default port is 22. This field is displayed only when at least one probe is configured for APM. This field is available only when you select Disable from the Use Template list.
¡ Polling Interval (min)—Select a polling interval for the application monitor. Options are 1, 2, 3, 4, 5, 10, 20, and 30. The default polling interval is 5 minutes. A shorter polling interval improves real-time data accuracy at the expense of system resources. This field is available only when you select Disable from the Use Template list.
¡ Contact—Enter the contact information, such as the name, email address, and telephone number. The default is the username of the operator who created the application monitor. This field is available only when you select Disable from the Use Template list.
¡ APM Server—Select an APM server to monitor the application. The options are in server-address (application-type:n/N) format. The letter n indicates the number of SFTP service applications monitored on the APM server. The letter N indicates the total number of applications monitored on the APM server. Server address 127.0.0.1 indicates that APM and the IMC platform are deployed on the same server.
¡ Related Applications—Click Add next to this field. On the Select Application window, enter a partial or complete name to filter applications, select the applications that the SFTP service depends on, and then click OK.
Operating system applications cannot be selected. Operators can view all dependencies of the application in the dependency topology. APM automatically adds the dependencies between the SFTP service and operating system applications by IP address and displays their dependencies in the application topology.
¡ Application Group—Specify an application group for the SFTP service application.
- To specify an existing application group, click Add, select an application group, and then click OK.
- To specify a new application group, click Add Application Group, configure the application group settings, and then click OK.
¡ Detect Application—Select this parameter if you want to enable application detection. Application detection enables APM to verify connection to the application by using the previous parameter settings, and to determine whether to add the application monitor based on the verification result. APM adds the application monitor only when it can connect to the application. When this parameter is not selected, APM adds the application monitor without verifying the connection.
5. Click OK.
Modifying an SFTP service application monitor
Authorized users can modify all parameters except the IP address and the APM server for an SFTP service application monitor. When the IP address of a monitored SFTP host changes, operators must add a new application monitor for the host. The new application monitor cannot inherit the history data from the previous application monitor.
To modify an SFTP service application monitor:
1. Click the Resource tab.
2. From the navigation tree, select Application Manager > Application Monitor.
The page displays all application types that can be monitored by APM.
3. Click the Modify icon ![]() for the SFTP service application monitor you want to modify.
for the SFTP service application monitor you want to modify.
The page for modifying the SFTP service application monitor opens.
4. Modify the parameters as needed, except the IP address and the APM server.
For more information about parameter settings, see "Adding an SFTP service application monitor."
5. Click OK.
Viewing the SFTP service application monitor report
After an SFTP service application monitor is added, APM collects index data of the application, evaluates the availability and health status, and updates the monitor report. The report shows the index values obtained from the most recent polling of the application.
To access the SFTP service application monitor report:
1. Click the Resource tab.
2. From the navigation tree, select Application Manager > Application Monitor.
The application monitor list page displays all application monitors.
3. Click the name of an SFTP application monitor to display the report.
Figure 109 shows part of an SFTP service application monitor report.
Figure 109 Part of an SFTP service application monitor report
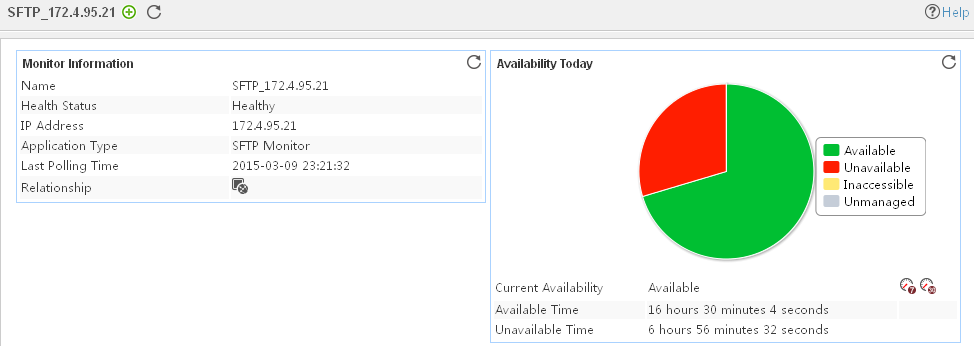
Monitor Information
The Monitor Information area contains the following fields:
· Name—Application monitor name.
· Health State—Health status of the SFTP service application.
· IP Address—IP address of the SFTP service host.
· Application Type—Type of the monitored application, which is always SFTP Monitor.
· Last Polling Time—Time when APM last polled the SFTP service.
· Relationship—Click the Relationship
icon ![]() to view dependencies
between the SFTP service and other applications in a dependency topology view. For more information about dependency topologies, see "Topology and application group management."
to view dependencies
between the SFTP service and other applications in a dependency topology view. For more information about dependency topologies, see "Topology and application group management."
· Top5 Unrecovered Alarm—Latest five unrecovered alarms on the SFTP service host. The alarm level is identified by color: yellow for minor alarms, orange for major alarms, and red for critical alarms. This field is not displayed if no alarm is generated by the SFTP service.
Availability Today
The Availability Today area contains the following fields:
· Current Availability—Availability of the SFTP service.
¡ Click
the Weekly History icon![]() to view the availability of the SFTP service in the last 7 days.
to view the availability of the SFTP service in the last 7 days.
¡ Click
the Monthly History icon![]() to view the availability of the SFTP service in the last 30 days.
to view the availability of the SFTP service in the last 30 days.
· Available Time—Total amount of time that the SFTP service was available after 00:00 today.
· Unavailable Time—Total amount of time that the SFTP service was unavailable after 00:00 today.
· Inaccessible Time—Total amount of time that the SFTP service was inaccessible after 00:00 today.
· Unmanaged Time—Total amount of time that the SFTP service was unmanaged after 00:00 today.
The statistics collection started when the application monitor was added. An availability time field is not displayed when its value is 0.
Connection Information
APM attempts to connect to and sends login requests to the SFTP server in each polling period. Typically, a host that provides SFTP services is called an SFTP server.
The Connection Information area contains the following fields:
· Connection Time—Shows how long it took APM to connect to the SFTP server in the most recent successful connection attempt.
¡ Click
the Set Threshold icon ![]() to set alarm thresholds for the connection
time.
to set alarm thresholds for the connection
time.
¡ Click
the History Record icon
![]() to view the history graph of the connection
time.
to view the history graph of the connection
time.
· Login Time—Shows how long it took APM to log in to the SFTP server in the most recent successful login attempt.
¡ Click
the Set Threshold icon ![]() to set alarm thresholds for the login time.
to set alarm thresholds for the login time.
¡ Click the History Record
icon ![]() to view the history graph of the login time.
to view the history graph of the login time.
File Information
After login, APM collects files and directories in the home directory of the SFTP account, not including subdirectories and files in the directories. Contents displayed in the monitor report and the privileges to upload, download, and delete files vary with different SFTP accounts.
The File Information area contains the following fields:
¡ Number of Files—Number of files in the home directory of the SFTP account. Click the History
Record icon ![]() to view the history graph of the number of
files.
to view the history graph of the number of
files.
¡ Number of Directories——Number of
directories in the home directory of the SFTP account.
Click the History Record icon ![]() to view the
history graph of the number of directories.
to view the
history graph of the number of directories.
Upload
When the upload function test is configured, APM uploads the selected test file and records the upload results after login to the SFTP server.
The Upload area contains the following fields:
· Uploaded File Size—Size of the file to be uploaded.
· Uploading Duration—Time duration for uploading the file with SFTP.
· Average Uploading Rate—Average file uploading rate of SFTP.
¡ Click
the Set Threshold icon ![]() to set alarm thresholds for the average
uploading rate.
to set alarm thresholds for the average
uploading rate.
¡ Click the History
Record icon ![]() to view the history
graph of the average uploading rate.
to view the history
graph of the average uploading rate.
Download
When the download function test is configured, APM downloads the selected test file and records the download results after login to the SFTP server.
The Download area contains the following fields:
· Downloaded File Size—Size of the file to be downloaded.
· Downloading Duration—Time duration for downloading the file with SFTP.
· Average Downloading Rate—Average file downloading rate of SFTP.
¡ Click
the Set Threshold icon ![]() to set alarm
thresholds for the average downloading rate.
to set alarm
thresholds for the average downloading rate.
¡ Click the History
Record icon ![]() to view the history
graph of the average downloading rate.
to view the history
graph of the average downloading rate.
Application Traffic
The Application Traffic area contains the following fields:
· Last Hour's Traffic—Total traffic sent and received by SFTP over the last 1 hour.
· Today's Traffic—Total traffic sent and received by SFTP since 00:00 today.
IPMI service
The Intelligent Platform Management Interface (IPMI) is a set of open hardware interface specifications. You can use the IPMI service to monitor physical features of servers, such as temperature, fan, and power supply.
APM supports monitoring the IPMI service.
Adding an IPMI service application monitor
When you add an IPMI service application monitor, follow these guidelines:
· Obtain the IP address of the baseboard management controller (BMC).
BMC is the intelligence in the IPMI architecture. It is a specialized microcontroller embedded on the motherboard of a server.
· Obtain the username and password of the user who has the administrator's privileges.
To add an IPMI service application monitor:
1. Click the Resource tab.
2. Open the Add Application page by using one of the following methods:
¡ From the navigation tree, select Application Manager > Add Application.
¡ From the navigation tree, select Application Manager > Application Monitor. In the application monitor list, click Add.
The Add Application page displays all application types that can be monitored by APM.
3. Click IPMI Monitor of the Service Monitor class.
The page for adding an IPMI service application monitor opens.
4. Configure the following parameters:
¡ IP Address—Enter the IP address of the BMC.
¡ Name—Enter a unique application monitor name. As a best practice, name the application monitor as application type_host IP address.
¡ Use Template—Select Enable or Disable from the list.
¡ Template—Click the Configure icon ![]() next to the Template field to select an
existing template. The Template field is
automatically populated with the name of the selected template. For more
information about configuring application templates, see "Configuration management." This field is displayed only when you select Enable from the Use Template
list.
next to the Template field to select an
existing template. The Template field is
automatically populated with the name of the selected template. For more
information about configuring application templates, see "Configuration management." This field is displayed only when you select Enable from the Use Template
list.
¡ Description—Enter a description for the application monitor.
¡ Polling Interval (min)—Select a polling interval for the application monitor. Available options are 1, 2, 3, 4, 5, 10, 20, and 30. The default polling interval is 5 minutes. A shorter polling interval improves real-time data accuracy at the expense of system resources. This field is available only when you select Disable from the Use Template list.
¡ Username/Password—Enter the username and password of the BMC. The fields are available only when you select Disable from the Use Template list.
¡ IPMI Version—Select a version number from the IPMI Version list. This field is available only when you select Disable from the Use Template list.
¡ Contact—Enter the contact information, such as the name, email address, and telephone number. The default is the username of the operator who created the application monitor. This field is available only when you select Disable the Use Template list.
¡ APM Server—Select an APM server to monitor the application. The options are in server-address (application-type:n/N) format. The letter n indicates the number of IPMI service applications monitored on the APM server. The letter N indicates the total number of applications monitored on the APM server. Server address 127.0.0.1 indicates that APM and the IMC platform are deployed on the same server.
¡ Related Applications—Click Add next to this field. On the Select Application window, enter a partial or complete name to filter applications, select the applications that the IPMI service depends on, and then click OK.
Operating system applications cannot be selected. Operators can view all dependencies of the application in the dependency topology. APM automatically adds the dependencies between the IPMI service and operating system applications by IP address and displays their dependencies in the application topology.
¡ Application Group—Specify an application group for the IPMI service application.
- To specify an existing application group, click Add, select an application group, and then click OK.
- To specify a new application group, click Add Application Group, configure the application group settings, and then click OK.
¡ Detect Application—Select this parameter if you want to enable application detection. Application detection enables APM to verify connection to the application by using the previous parameter settings, and to determine whether to add the application monitor based on the verification result. APM adds the application monitor only when it can connect to the application. When this parameter is not specified, APM adds the application monitor without verifying the connection.
5. Click OK.
Modifying an IPMI service application monitor
Authorized users can modify all parameters except the IP address and the APM server for an IPMI application monitor. When the IP address of a monitored IPMI service host changes, operators must add a new application monitor for the host. However, the new application monitor cannot inherit the history data from the previous application monitor.
To modify an IPMI service application monitor:
1. Click the Resource tab.
2. From the navigation tree, select Application Manager > Application Monitor.
The application monitor list page opens.
3. Click the Modify
icon ![]() for an IPMI service
application monitor you want to modify.
for an IPMI service
application monitor you want to modify.
The page for modifying the IPMI service application monitor opens.
4. Modify the parameters as needed, except the IP address and the APM server.
For more information about parameter settings, see "Adding an IPMI service application monitor."
5. Click OK.
Viewing the IPMI service application monitor report
After an IPMI service application monitor is added, APM collects index data of the application, evaluates the availability and health status, and updates the monitor report. The report shows the index values obtained from the most recent polling of the application.
To view the IPMI service application monitor report:
1. Click the Resource tab.
2. From the navigation tree, select Application Manager > Application Monitor.
The application monitor list page displays all application monitors.
3. Click the name of an IPMI service application monitor to display the report.
Figure 110 shows part of an IPMI service application monitor report.
Figure 110 Part of an IPMI service application monitor report
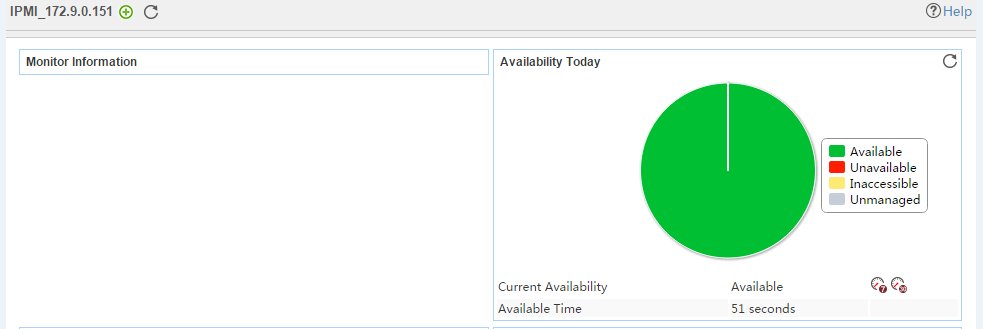
Monitor Information
The Monitor Information area contains the following fields:
· Name—Name of the application monitor.
· Health Status—Health status of the IPMI service application.
· IP Address—IP address of the IPMI service host.
· Application Type—Type of the monitored application, which is always IPMI Monitor.
· Version—Version number of the IPMI service.
· Last Polling Time—Time when APM last polled the IPMI service application.
· Relationship—Click the Relationship icon ![]() to view dependencies between the IPMI
service application and other applications in a dependency
topology view. For more information about dependency topologies, see "Topology and application group management."
to view dependencies between the IPMI
service application and other applications in a dependency
topology view. For more information about dependency topologies, see "Topology and application group management."
· Top5 Unrecovered Alarms—Latest five unrecovered alarms on the IPMI service host. The alarm level is identified by color: yellow for minor alarms, orange for major alarms, and red for critical alarms. If no alarm is generated by the IPMI service, this field is not displayed.
Availability Today
The Availability Today area contains the following fields:
· Current Availability—Availability of the IPMI service application.
¡ Click
the Weekly History icon![]() to view the availability of the IPMI
service in the last 7 days.
to view the availability of the IPMI
service in the last 7 days.
¡ Click
the Monthly History icon![]() to view the availability of the PMI service in the last 30 days.
to view the availability of the PMI service in the last 30 days.
· Available Time—Total amount of time that the IPMI service was available after 00:00 today.
· Unavailable Time—Total amount of time that the IPMI service was unavailable after 00:00 today.
· Inaccessible Time—Total amount of time that the IPMI service was inaccessible after 00:00 today.
· Unmanaged Time—Total amount of time that the IPMI service was unmanaged after 00:00 today.
The statistics collection started when the application monitor was added. An availability time field is not displayed if its value is 0.
Memory
The Memory area contains the following fields:
· Component Name—Name of the memory card.
· Status—State of the memory card.
Power Supply
The Power Supply area contains the following fields:
· Component Name—Name of the power supply.
· Status—State of the power supply.
Temperature
The Temperature area contains the following fields:
· Component Name—Name of the temperature sensor.
· Status—State of the temperature sensor.
· Value—Monitor value obtained by the temperature sensor.
Fan
The Fan area contains the following fields:
· Component Name—Name of the fan.
· Status—State of the fan.
Board
The Board area contains the following fields:
· Manufacturer—Manufacturer of the board.
· Product Name—Name and model of the device to which the board applies.
· Production Date—Date when the board was produced.
· Part Number—Part number of the board.
· Serial Number—Serial number of the board.
· System GUID—Globally unique identifier of the board.
Chassis
The Chassis area contains the following fields:
· BMC Version—Version of the BMC.
· IPMI Driver Type—Type of the IPMI driver.
· Self-Check Result—Self-check result of the server.
· Power Supply Status—State of the power supply for the chassis.
· Chassis Intrusion—Whether the chassis is open or has been opened before.
· Front Panel—Whether the front panel is open.
· Cooling Fan Fault—Whether the cooling fans operate correctly.
· Disk Fault—Whether the disks operate correctly on the server.
· Power-On Hours—Hours since the server was started.
Ping test service
This service allows APM to log in to a host through SSH or Telnet to ping a destination IP address to test the connectivity. The host is called the ping test service host. Currently, only the Linux server can act as a ping test service host.
This section describes how to add and modify a ping test service application monitor, and helps view the monitor report.
Adding a ping test service application monitor
APM monitors ping test service applications through CLI. When you add ping test service application monitors, follow these guidelines:
· Enable Telnet or SSH on the ping test service hosts. For more information about enabling Telnet or SSH on a Linux server, see the Linux server configuration guide.
· Obtain the username and password of the Telnet or SSH user who has the administrator's privileges on the ping test service hosts.
· Add ping test service hosts to the IMC platform so that APM can obtain and display network connections of the hosts and their access devices in the application topology. For more information about adding hosts to the IMC platform, see H3C Intelligent Management Center v7.3 Enterprise and Standard Platform Administrator Guide.
To add a ping test service application monitor:
1. Click the Resource tab.
2. Open the Add Application page by using one of the following methods:
¡ From the navigation tree, select Application Manager > Add Application.
The page displays all application types that can be monitored by APM.
¡ From the navigation tree, select Application Manager > Application Monitor, and then click Add on the application monitor list page.
3. Click Ping Test Monitor of the Service Monitor class.
The page for adding a ping test service application monitor opens.
4. Configure the following parameters:
¡ IP Address—Enter the IP address of the ping test service host. APM automatically checks the specified IP address and associates the application monitor with the host managed in the IMC platform. If the host is already added to the IMC platform, you can also click Select, and then select the host in the Select Devices window. For information about selecting a host, see "Quick start."
¡ Name—Enter a unique application monitor name. As a best practice, name the application monitor as application type_host IP address.
¡ Use Template—Select Enable or Disable from the list.
¡ Template—Click the Configure icon ![]() next to the Template field to select an
existing template. The Template field is
automatically populated with the name of the selected template. For more
information about configuring application templates, see "Configuration management." This field is displayed only when you select Enable from the Use Template
list.
next to the Template field to select an
existing template. The Template field is
automatically populated with the name of the selected template. For more
information about configuring application templates, see "Configuration management." This field is displayed only when you select Enable from the Use Template
list.
¡ Description—Enter a description for the application monitor.
¡ Polling Interval (min)—Select a polling interval for the application monitor. Options are 1, 2, 3, 4, 5, 10, 20, and 30. The default polling interval is 5 minutes. A shorter polling interval improves real-time data accuracy at the expense of system resources. This field is available only when you select Disable from the Use Template list.
¡ Monitor Type—Select the protocol (SSH or Telnet) through which
APM monitors the ping test service application, and
then click the Configure icon ![]() to configure related parameters. This field
is available only when you select Disable from the Use Template list.
to configure related parameters. This field
is available only when you select Disable from the Use Template list.
When SSH is selected, configure the following parameters:
- Edit SSH Parameters—Select this option if you want to manually configure SSH parameters for APM. Make sure the SSH settings are the same as those on the ping test service host.
- Select an Existing Template—Select this option if you want to select an existing SSH template for APM. For information about setting SSH parameter templates, see H3C Intelligent Management Center v7.3 Enterprise and Standard Platform Administrator Guide.
- Authentication Mode—Select the authentication mode for SSH users. Options are Password, Private Key, Password + Private Key, Password + Super Password, Private Key + Super Password, and Password + Private Key + Super Password.
The following parameters to be configured vary with authentication modes:
Username—Enter the SSH username. The user must have the administrator's privileges on the ping test service host.
Password—Enter the password of the SSH user.
Private Key File—Enter the directory of the SSH private key file or browse to the file.
Private Key Password—Enter the password to decrypt the SSH private key file.
Super Password—Enter the super password with which an SSH user can elevate privileges after login.
- Port—Enter the SSH port on the ping test service host.
- Timeout (1-120 seconds)—Enter the maximum time period that APM waits for an SSH response from the ping test service host. The value range is 1 to 120 seconds and the default is 10 seconds. If no SSH response is received from the host within the timeout time, APM considers that the interaction has failed.
- Retries (1-5)—Enter how many times APM retries to send SSH packets to the ping test service host.
When Telnet is selected, configure the following parameters:
- Edit Telnet Parameters—Select this option if you want to manually configure Telnet parameters for APM. Make sure the Telnet settings are the same as those on the ping test service host.
- Select an Existing Template—Select this option if you want to select an existing Telnet template for APM. For information about setting Telnet parameter templates, see H3C Intelligent Management Center v7.3 Enterprise and Standard Platform Administrator Guide.
- Authentication Mode—Select the authentication mode for Telnet users. Options are Password (No Operator or Super/Manager), Username + Password, Super/Manager Password, Password + Super/Manager Password (No Operator), Username + Password + Super/Manager Password, No Username + No Password, and Username + No Password.
The following parameters to be configured vary with authentication modes:
Username—Enter the Telnet username. The user must have the administrator's privileges on the ping test service host.
Password—Enter the password of the Telnet user.
Super Password—Enter the super password with which a Telnet user can elevate privileges after login.
- Timeout (1-60 seconds)—Enter the maximum time period that APM waits for a Telnet response from the ping test service host. The value range is 1 to 60 seconds and the default is 4 seconds. If no Telnet response is received from the host within the timeout time, APM considers that the interaction has failed.
¡ IP Address—Enter the destination IP address in the ping test. This field is available only when you select Disable from the Use Template list.
¡ Contact—Enter user contact information, such as the name, email address, and telephone number. The default is the username of the operator who created the application monitor. This field is available only when you select Disable from the Use Template list.
¡ APM Server—Select an APM server to monitor the application. The options are in server-address (application-type:n/N) format. The letter n indicates the number of ping test service applications monitored on the APM server. The letter N indicates the total number of applications monitored on the APM server. Server address 127.0.0.1 indicates that APM and the IMC platform are deployed on the same server.
¡ Related Applications—Click Add next to this field. On the Select Application window, enter a partial or complete name to filter applications, select the applications that the ping test service depends on, and then click OK.
Operating system applications cannot be selected. Operators can view all dependencies of the application in the dependency topology. APM automatically adds the dependencies between the ping test service and operating system applications by IP address, and displays their dependencies in the application topology.
¡ Application Group—Specify an application group for the ping test service application.
- To specify an existing application group, click Add, select an application group, and then click OK.
- To specify a new application group, click Add Application Group, configure the application group settings, and then click OK.
¡ Detect Application—Select this parameter if you want to enable application detection. Application detection enables APM to verify the connection to the application by using the previous parameter settings, and to determine whether to add the application monitor based on the verification result. APM adds the application monitor only when it can connect to the application. When this parameter is not selected, APM adds the application monitor without verifying the connection.
5. Click OK.
Modifying a ping test service application monitor
Authorized users can modify all parameters except the IP address of a ping test service host and the APM server. When the IP address of a monitored ping test service host changes, operators must add a new application monitor for the host. The new application monitor cannot inherit the history data from the previous application monitor.
To modify a ping test service application monitor:
1. Click the Resource tab.
2. From the navigation tree, select Application Manager > Application Monitor.
The page displays all application types that can be monitored by APM.
3. Click the Modify
icon ![]() for the ping test service application monitor you want to modify.
for the ping test service application monitor you want to modify.
The page for modifying the ping test service application monitor opens.
4. Modify the parameters as needed, except the IP address and the APM server.
For more information about parameter settings, see "Adding a ping test service application monitor."
5. Click OK.
Viewing the ping test service application monitor report
After a ping test service application monitor is added, APM collects index data of the application, evaluates the availability and health status, and updates the monitor report. The report shows the index values obtained from the most recent polling of the application.
To access the ping test service application monitor report:
1. Click the Resource tab.
2. From the navigation tree, select Application Manager > Application Monitor.
The application monitor list page displays all application monitors.
3. Click the name of a ping test service application monitor to display the report.
Figure 111 shows part of a ping test service application monitor report.
Figure 111 Part of a ping test service application monitor report
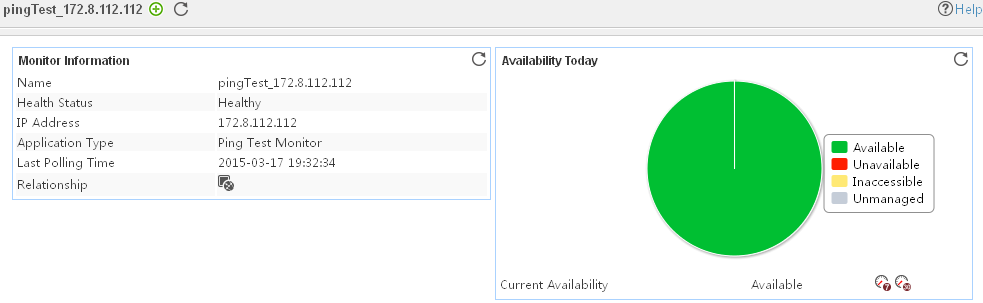
Monitor Information
The Monitor Information area contains the following fields:
· Name—Application monitor name.
· Health Status—Health state of the ping test service application.
· IP Address—IP address of the ping test service host.
· Application Type—Type of the monitored application, which is always Ping Test Monitor.
· Last Polling Time—Time when APM last polled the ping test service host.
· Relationship—Click the Relationship icon ![]() to view dependencies
between the ping test service and other applications in a dependency topology
view. For more information about dependency topologies,
see "Topology and
application group management."
to view dependencies
between the ping test service and other applications in a dependency topology
view. For more information about dependency topologies,
see "Topology and
application group management."
· Top5 Unrecovered Alarm—Latest five unrecovered alarms on the ping test service host. The alarm level is identified by color: yellow for minor alarms, orange for major alarms, and red for critical alarms. This field is not displayed if no alarm is generated by the ping test service.
Availability Today
The Availability Today area contains the following fields:
· Current Availability—Availability of the ping test service.
¡ Click
the Weekly History icon![]() to view the availability of the ping test service in the last 7
days.
to view the availability of the ping test service in the last 7
days.
¡ Click
the Monthly History icon![]() to view the availability of the ping test service in the last 30
days.
to view the availability of the ping test service in the last 30
days.
· Available Time—Total amount of time that the ping test service was available after 00:00 today.
· Unavailable Time—Total amount of time that the ping test service was unavailable after 00:00 today.
· Inaccessible Time—Total amount of time that the ping test service was inaccessible after 00:00 today.
· Unmanaged Time—Total amount of time that the ping test service was unmanaged after 00:00 today.
The statistics collection started when the application monitor was added. An availability time field is not displayed when its value is 0.
Connection Test
The Attribute and Value fields display the attributes and values collected for the ping test service in the last polling interval.
TCP port
TCP Port application monitor belongs to common monitor. APM monitors applications that use TCP ports to provide services.
APM sends a TCP connection request to a monitored TCP port and records the time that the application takes to respond to the request. You can obtain the availability and health status of the application based on the response time. This section describes how to add a TCP Port application monitor and view the TCP Port application monitor report.
Adding a TCP Port application monitor
Before APM monitors an application through TCP port, as a best practice, add the host running the application to the IMC platform. You can view the network connection between the host running the application and the access device in the application topology. For information about adding a device running an application, see H3C Intelligent Management Center v7.3 Enterprise and Standard Platform Administrator Guide.
To add a TCP Port application monitor:
1. Click the Resource tab.
2. Open the Add Application page by using one of the following methods:
¡ From the navigation tree, select Application Manager > Add Application.
The page displays all application types that can be monitored by APM.
¡ From the navigation tree, select Application Manager > Application Monitor, and then click Add on the application monitor list page.
3. Click TCP Port of Service Monitor.
The page for adding a TCP Port application monitor opens.
4. Configure the following parameters:
¡ IP Address—Enter the IP address of the host running the TCP Port service application. APM automatically checks the IP address and associates the application monitor with the host managed in the IMC platform. If the host has already been added to the IMC platform, you can also click Select, and then select the host in the Select Devices window. For information about selecting a host, see "Quick start."
¡ Name—Enter a unique application monitor name. As a best practice, name the application monitor as application type_host IP address.
¡ Use Template—Select Enable or Disable from the list.
¡ Template—Click the Configure icon ![]() next to the Template field to select an
existing template. The Template field is
automatically populated with the name of the selected template. For more
information about configuring application templates, see "Configuration management." This field is displayed only when you select Enable from the Use Template
list.
next to the Template field to select an
existing template. The Template field is
automatically populated with the name of the selected template. For more
information about configuring application templates, see "Configuration management." This field is displayed only when you select Enable from the Use Template
list.
¡ Description—Enter a description for the application monitor.
¡ Application Monitor Port—Enter the port number to be monitored. This field is available only when you select Disable from the Use Template list.
¡ Polling Interval (min)—Select a polling interval for the application monitor (in seconds). Options are 30, 60, 120, 180, 240, 300, 600, 1200, and 1800. The default polling interval is 300 seconds. A shorter polling interval improves real-time data accuracy at the expense of system resources. This field is available only when you select Disable from the Use Template list.
¡ Contact—Enter the contact information, such as the name, email address, and telephone number. The default is the username of the operator who created the application monitor. This field is available only when you select Disable from the Use Template list.
¡ APM Server—Select an APM server to monitor the application. The options are in server-address (application-type:n/N) format. The letter n indicates the number of TCP Port applications monitored on the APM server. The letter N indicates the total number of applications monitored on the APM server. Server address 127.0.0.1 indicates that APM and the IMC platform are deployed on the same server.
¡ Related Applications—Click Add next to this field. On the Select Application window, enter a partial or complete name to filter applications, select the applications that TCP Port depends on, and then click OK.
Operating system applications cannot be selected. Operators can view all dependencies of the application in the dependency topology. APM automatically adds the dependencies between TCP Port and operating system applications by IP address and displays their dependencies in the application topology.
¡ Application Group—Specify an application group for the TCP Port application.
- To specify an existing application group, click Add, select an application group, and then click OK.
- To specify a new application group, click Add Application Group, configure the application group settings, and then click OK.
¡ Detect Application—Select this parameter if you want to enable application detection. Application detection enables APM to verify connection to the application by using the previous parameter settings, and to determine whether to add the application monitor based on the verification result. APM adds the application monitor only when it can connect to the application. When this parameter is not selected, APM adds the application monitor without verifying the connection.
5. Click OK.
Modifying a TCP Port application monitor
Authorized users can modify all parameters except the IP address and the APM server for a TCP Port application monitor. When the IP address of a monitored TCP Port host changes, operators must add a new application monitor for the host. The new application monitor cannot inherit the history data from the previous application monitor.
To modify a TCP Port application monitor:
1. Click the Resource tab.
2. From the navigation tree, select Application Manager > Application Monitor.
The page displays all application types that can be monitored by APM.
3. Click the Modify icon ![]() for the TCP
Port application monitor you want to modify.
for the TCP
Port application monitor you want to modify.
The page for modifying the TCP Port service application monitor opens.
4. Modify the parameters as needed, except the IP address and the APM server.
For more information about parameter settings, see "Adding a TCP Port application monitor."
5. Click OK.
Viewing the TCP Port application monitor report
After a TCP Port application monitor is added, APM collects index data of the application, evaluates the availability and health status, and updates the monitor report. The report shows the index values obtained from the most recent polling of the application.
To access the TCP Port application monitor report:
1. Click the Resource tab.
2. From the navigation tree, select Application Manager > Application Monitor.
The application monitor list page displays all application monitors.
3. Click the name of a TCP Port application monitor to display the report.
Figure 112 shows part of a TCP Port application monitor report.
Figure 112 Part of a TCP Port application monitor report
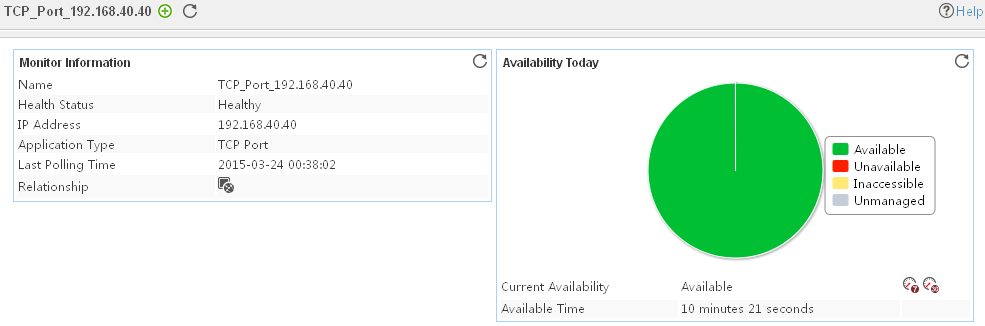
Monitor Information
The Monitor Information area contains the following fields:
· Name—Application monitor name.
· Health State—Health status of the TCP Port application.
· IP Address—IP address of the TCP Port host.
· Application Type—Type of the monitored application, which is always TCP Port.
· Last Polling Time—Time when APM last polled TCP Port.
· Relationship—Click the Relationship
icon ![]() to view dependencies
between TCP Port and other applications in a dependency topology view. For more information about dependency topologies, see "Topology and application group management."
to view dependencies
between TCP Port and other applications in a dependency topology view. For more information about dependency topologies, see "Topology and application group management."
· Top5 Unrecovered Alarm—Latest five unrecovered alarms on the TCP Port host. The alarm level is identified by color: yellow for minor alarms, orange for major alarms, and red for critical alarms. This field is not displayed if no alarm is generated by TCP Port.
Availability Today
The Availability Today area contains the following fields:
· Current Availability—Availability of TCP Port.
¡ Click the Weekly History icon![]() to view the availability of the TCP Port application in the last 7 days.
to view the availability of the TCP Port application in the last 7 days.
¡ Click
the Monthly History icon![]() to view
the availability of the TCP Port application in the last 30 days.
to view
the availability of the TCP Port application in the last 30 days.
· Available Time—Total amount of time that TCP Port was available after 00:00 today.
· Unavailable Time—Total amount of time that TCP Port was unavailable after 00:00 today.
· Inaccessible Time—Total amount of time that TCP Port was inaccessible after 00:00 today.
· Unmanaged Time—Total amount of time that TCP Port was unmanaged after 00:00 today.
The statistics collection started when the application monitor was added. An availability time field is not displayed when its value is 0.
Response Time
The Response Time area contains the following field:
· Response Time—Duration that APM occupies to connect to TCP Port most recently.
¡ Click
the Set Threshold icon ![]() to set alarm thresholds for the response
time.
to set alarm thresholds for the response
time.
¡ Click
the History Record icon
![]() to view the history graph of the response
time.
to view the history graph of the response
time.
Ceph
Ceph is an open-source storage system that implements object storage on a distributed cluster. The system is scalable, self-healing, and self-managed.
APM supports monitoring Ceph through the API provided by Ceph.
Adding a Ceph application monitor
Before adding a Ceph application monitor, contact the administrator to obtain the username and password of a user who has the administrator's privileges on the Ceph system.
To add a Ceph application monitor:
1. Click the Resource tab.
2. Open the Add Application page by using one of the following methods:
¡ From the navigation tree, select Application Manager > Add Application.
¡ From the navigation tree, select Application Manager > Application Monitor. In the application monitor list, click Add.
The Add Application page displays all application types that can be monitored by APM.
3. Click Ceph of the Service Monitor class.
The page for adding a Ceph application monitor opens.
4. Configure the following parameters:
¡ IP Address—Enter the IP address of the host on which the Ceph application to be monitored is installed. APM automatically checks the IP address and associates the application monitor with the host if the host is already managed in the IMC platform. If the host is already managed in the IMC platform, you can also click Select, and then select the host in the Select Devices window. For information about selecting a host, see "Selecting devices."
¡ Name—Enter a unique application monitor name. As a best practice, name the application monitor as application type_host IP address.
¡ Use Template—Select Enable or Disable from the list.
¡ Template—Click the Configure icon ![]() next to the Template field to select an
existing template. The Template field is
automatically populated with the name of the selected template. This field is
displayed only when you select Enable from the Use Template list.
next to the Template field to select an
existing template. The Template field is
automatically populated with the name of the selected template. This field is
displayed only when you select Enable from the Use Template list.
¡ Description—Enter a description for the application monitor.
¡ Polling Interval (min)—Select a polling interval for the application monitor. Available options are 1, 2, 3, 4, 5, 10, 20, and 30. The default polling interval is 5 minutes. A shorter polling interval improves real-time data accuracy at the expense of system resources. This field is available only when you select Disable from the Use Template list.
¡ Username—Enter the username of a Ceph user who has the administrator's privileges.
¡ Password—Enter the password of the Ceph user.
¡ Contact—Enter the contact information, such as the name, email address, and telephone number. The default is the username of the operator who created the application monitor. This field is available only when you select Disable the Use Template list.
¡ APM Server—Select an APM server to monitor the application. The options are in server-address (application-type:n/N) format. The letter n indicates the number of Ceph applications monitored on the APM server. The letter N indicates the total number of applications monitored on the APM server. Server address 127.0.0.1 indicates that APM and the IMC platform are deployed on the same server.
¡ Related Applications—Click Add next to this field. On the Select Application window, enter a partial or complete name to filter applications, select the applications that Ceph depends on, and then click OK.
Operating system applications cannot be selected. APM automatically adds the dependencies between Ceph and operating system applications by IP address and displays their dependencies in the application topology.
Operators can view all dependencies of the application in the dependency topology.
¡ Application Group—Specify an application group for the Ceph application.
- To specify an existing application group, click Add, select an application group, and then click OK.
- To specify a new application group, click Add Application Group, configure the application group settings, and then click OK.
¡ Detect Application—Select this parameter if you want to enable application detection. Application detection enables APM to verify the connectivity to the application by using the previous parameter settings. APM adds the application monitor only when it can connect to the application. When this parameter is not selected, APM adds the application monitor without verifying the application connectivity.
5. Click OK.
Modifying a Ceph application monitor
Authorized users can modify all parameters except the IP address and the APM server for a Ceph application monitor. When the IP address of a monitored Ceph host changes, operators must add a new application monitor for the host. However, the new application monitor cannot inherit the history data from the previous application monitor.
To modify a Ceph application monitor:
1. Click the Resource tab.
2. From the navigation tree, select Application Manager > Application Monitor.
The application monitor list page opens.
3. Click the Modify
icon ![]() for the Ceph application monitor you want to modify.
for the Ceph application monitor you want to modify.
The page for modifying the Ceph application monitor opens.
4. Modify the parameters as needed, except the IP address and the APM server.
For more information about parameter settings, see "Adding a Ceph application monitor."
5. Click OK.
Viewing the Ceph application monitor report
After a Ceph application monitor is added, APM collects index data of the application, evaluates the availability and health status, and updates the monitor report. The report shows the index values obtained from the most recent polling of the application.
To access the Ceph application monitor report:
1. Click the Resource tab.
2. From the navigation tree, select Application Manager > Application Monitor.
The application monitor list page displays all application monitors.
3. Click the name of a Ceph application monitor to display the report.
Figure 113 shows part of a Ceph application monitor report.
Figure 113 Part of a Ceph application monitor report
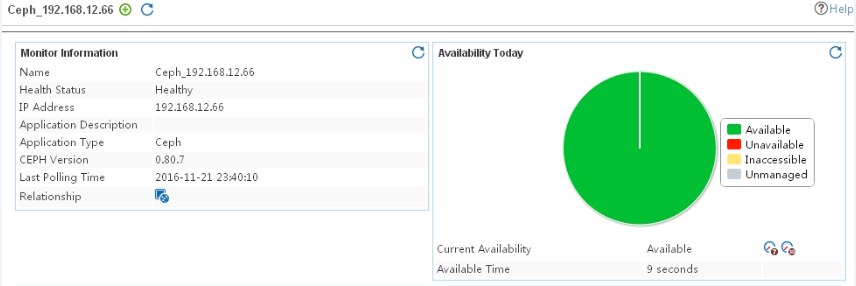
Monitor Information
The Monitor Information area contains the following fields:
· Name—Application monitor name.
· Health Status—Health status of the Ceph application.
· Application Description—Description of the Ceph application.
· Application Type—Type of the monitored application, which is Ceph.
· CEPH Version—Version of the Ceph application.
· Last Polling Time—Time when APM last polled the Ceph application.
· Relationship—Click the Relationship
icon ![]() to view dependencies
between Ceph and other
applications in a dependency topology view. For more information
about dependency topologies, see "Topology and application group management."
to view dependencies
between Ceph and other
applications in a dependency topology view. For more information
about dependency topologies, see "Topology and application group management."
· Top5 Unrecovered Alarm—Latest five unrecovered alarms on the Ceph application. The alarm level is identified by color: yellow for minor alarms, orange for major alarms, and red for critical alarms. This field is not displayed if no alarm is generated by the Ceph application.
Availability Today
The Availability Today area contains the following fields:
· Current Availability—Availability of the Ceph application.
¡ Click
the Weekly History icon![]() to view the availability of the Ceph
application in the last 7 days.
to view the availability of the Ceph
application in the last 7 days.
¡ Click
the Monthly History icon![]() to view the availability of the Ceph application in the last 30 days.
to view the availability of the Ceph application in the last 30 days.
· Available Time—Total amount of time that the Ceph application was available after 00:00 today.
· Unavailable Time—Total amount of time that the Ceph application was unavailable after 00:00 today.
· Inaccessible Time—Total amount of time that the Ceph application was inaccessible after 00:00 today.
· Unmanaged Time—Total amount of time that the Ceph application was unmanaged after 00:00 today.
The statistics collection started when the application monitor was added. An availability time field is not displayed when its value is 0.
CEPF Storage
The CEPF Storage area contains the following fields:
· Total Bytes—Total storage space of Ceph.
· Used Bytes—Used storage space of Ceph.
· Available Bytes—Free storage space of Ceph..
· Read Bytes Per Second—Number of bytes read by Ceph per second.
· Write Bytes Per Second—Number of bytes written into Ceph per second.
· Data Size—Total storage data size of Ceph.
· Use %—Ratio of the used bytes to the total bytes. Click the Set Threshold icon ![]() to set alarm thresholds for the storage usage ratio.
to set alarm thresholds for the storage usage ratio.
· ![]() —Click the History Record icon
—Click the History Record icon ![]() to view the history graph of a monitor index.
to view the history graph of a monitor index.
OSD Status
The OSD Status area contains the following fields:
· OSDs—Number of OSDs present.
· OSDUP—Number of OSDs up and running.
· OSDIN—Number of OSDs in the cluster.
· OSDOUT—Number of OSDs out of the cluster.
· OSDs In and Down—Number of down OSDs in the cluster.
· FULL—Whether the OSD is Full.
· NEARFULL—Whether the OSD is reaching near full..
PG Status
The PG Status area contains the following fields:
· Active PGs—Total number of Active placement groups.
· Down—Number of Down placement groups.
· Incomplete—Number of placement groups in Incomplete state.
· Stale—The number of placement groups in an unknown state.
· Active+Clean PGs—Total number of Active and Clean placement groups.
· Active+Remapped PGs—Total number of Active and Remapped placement groups.
· Active+Degraded PGs—The total number of Active and Degraded placement groups.
· Active+Clean+Scrubbing+Deep—Total number of Active, Clean, Scrubbing, and Deep placement groups.
· Down+Remapped+Peering—Total number of Down, Remapped, and Peering placement groups.
· Degraded—Number of Degraded placement groups.
· Peering—Number of placement groups undergoing the peering process.
· PGs—Total number of placement groups.
· ![]() —Click the History Record icon
—Click the History Record icon ![]() to view the history graph of a monitor index.
to view the history graph of a monitor index.
Monitor Details
The Monitor Details area contains the following fields:
· Monitor Name—Name of the monitor.
· Monitor address—The address required for monitors to discover each other using the monitor map.
· Rank—Rank of the Ceph monitor in the cluster.
· Severity—Health severity of the monitor.
· Total Bytes—Total disk memory of the monitor.
· Used Bytes—Used memory of the monitor.
· Available Bytes—Free memory of the monitor.
· Used %—Percentage of used memory to the total memory of the monitor. Click
the Set
Threshold icon ![]() to set
alarm thresholds for the monitor memory usage ratio.
to set
alarm thresholds for the monitor memory usage ratio.
· Last Updated—Last time when the monitor status was updated.
Dell CMC
The Dell Chassis Management Controller (CMC) provides remote management on Dell PowerEdge M1000e blade servers and controls their power supplies. It has processors and memory, and obtains power from the blade servers. APM supports monitoring Dell CMC.
Adding a Dell CMC application monitor
APM monitors Dell CMC applications through CLI. When you add Dell CMC application monitors, follow these guidelines:
· Enable Telnet or SSH on Dell CMC. For more information, see the Dell CMC configuration guide.
· Obtain the username and password of the Telnet or SSH user who has the Dell CMC administrator's privileges.
To add a Dell CMC application monitor:
1. Click the Resource tab.
2. Open the Add Application page by using one of the following methods:
¡ From the navigation tree, select Application Manager > Add Application.
¡ From the navigation tree, select Application Manager > Application Monitor. In the application monitor list, click Add.
The Add Application page displays all application types that can be monitored by APM.
3. Click Dell CMC Service of the Service Monitor class.
The page for adding a Dell CMC application monitor opens.
4. Configure the following parameters:
¡ IP Address—Enter the IP address of the host on which the Dell CMC application to be monitored is installed. APM automatically checks the IP address and associates the application monitor with the host managed in the IMC platform. If the host is already added to the IMC platform, you can also click Select, and then select the host in the Select Devices window. For information about selecting a host, see "Quick start."
¡ Name—Enter a unique application monitor name. As a best practice, name the application monitor as application type_host IP address.
¡ Use Template—Select Enable or Disable from the list.
¡ Template—Click the Configure icon ![]() next to the Template field to select an
existing template. The Template field is
automatically populated with the name of the selected template. For more
information about configuring application templates, see "Configuration management." This field is displayed only when you select Enable from the Use Template
list.
next to the Template field to select an
existing template. The Template field is
automatically populated with the name of the selected template. For more
information about configuring application templates, see "Configuration management." This field is displayed only when you select Enable from the Use Template
list.
¡ Description—Enter a description for the application monitor.
¡ Application Monitor Port—Enter the service port number for the Dell CMC application. This field is available only when you select Disable from the Use Template list.
¡ Polling Interval (min)—Select a polling interval for the application monitor. Available options are 1, 2, 3, 4, 5, 10, 20, and 30. The default polling interval is 5 minutes. A shorter polling interval improves real-time data accuracy at the expense of system resources. This field is available only when you select Disable from the Use Template list.
¡ Contact—Enter the contact information, such as the name, email address, and telephone number. The default is the username of the operator who created the application monitor. This field is available only when you select Disable the Use Template list.
¡ APM Server—Select an APM server to monitor the application. The options are in server-address (application-type:n/N) format. The letter n indicates the number of Dell CMC applications monitored on the APM server. The letter N indicates the total number of applications monitored on the APM server. Server address 127.0.0.1 indicates that APM and the IMC platform are deployed on the same server.
¡ Related Applications—Click Add next to this field. On the Select Application window, enter a partial or complete name to filter applications, select the applications that Dell CMC depends on, and then click OK.
Operating system applications cannot be selected. Operators can view all dependencies of the application in the dependency topology. APM automatically adds the dependencies between Dell CMC and operating system applications by IP address and displays their dependencies in the application topology.
¡ Application Group—Specify an application group for the Dell CMC application.
- To specify an existing application group, click Add, select an application group, and then click OK.
- To specify a new application group, click Add Application Group, configure the application group settings, and then click OK.
¡ Detect Application—Select this parameter if you want to enable application detection. Application detection enables APM to verify connection to the application by using the previous parameter settings, and to determine whether to add the application monitor based on the verification result. APM adds the application monitor only when it can connect to the application. When this parameter is not specified, APM adds the application monitor without verifying the connection.
5. Click OK.
Modifying a Dell CMC application monitor
Authorized users can modify all parameters except the IP address and the APM server for a Dell CMC application monitor. When the IP address of a monitored Dell CMC host changes, operators must add a new application monitor for the host. However, the new application monitor cannot inherit the history data from the previous application monitor.
To modify a Dell CMC application monitor:
1. Click the Resource tab.
2. From the navigation tree, select Application Manager > Application Monitor.
The application monitor list page opens.
3. Click the Modify
icon ![]() for the Dell CMC
application monitor you want to modify.
for the Dell CMC
application monitor you want to modify.
The page for modifying the Dell CMC application monitor opens.
4. Modify the parameters as needed, except the IP address and the APM server.
For more information about parameter settings, see "Adding a Dell CMC application monitor."
5. Click OK.
Viewing the Dell CMC application monitor report
After a Dell CMC application monitor is added, APM collects index data of the application, evaluates the availability and health status, and updates the monitor report. The report shows the index values obtained from the most recent polling of the application.
To view the Dell CMC application monitor report:
1. Click the Resource tab.
2. From the navigation tree, select Application Manager > Application Monitor.
The application monitor list page displays all application monitors.
3. Click the name of a Dell CMC application monitor to display the report.
Figure 114 shows part of a Dell CMC application monitor report.
Figure 114 Part of a Dell CMC application monitor report
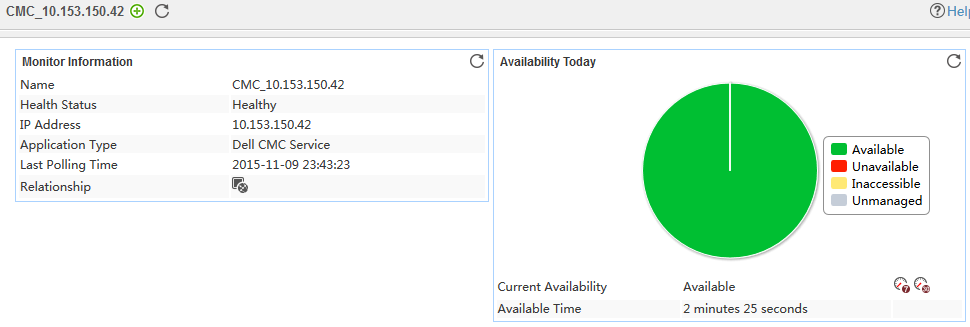
Monitor Information
The Monitor Information area contains the following fields:
· Name—Name of the Dell CMC application monitor.
· Health Status—Health status of the Dell CMC application.
· IP Address—IP address of the host where the Dell CMC application resides.
· Application Type—Type of the monitored application, which is always Dell CMC Service.
· Last Polling Time—Time when APM last polled the Dell CMC application.
· Relationship—Click the Related Applications icon ![]() to view dependencies between the Dell CMC application and other applications
in a dependency topology view. For
more information about dependency topologies, see "Topology and application group management."
to view dependencies between the Dell CMC application and other applications
in a dependency topology view. For
more information about dependency topologies, see "Topology and application group management."
· Top5 Unrecovered Alarm—Latest five unrecovered alarms on the Dell CMC host. The alarm level is identified by color: yellow for minor alarms, orange for major alarms, and red for critical alarms. This field is not displayed if no alarm is generated by the Dell CMC application.
Availability Today
The Availability Today area contains the following fields:
· Current Availability—Availability of the Dell CMC application.
¡ Click
the Weekly History icon ![]() to view
the availability of the Dell CMC application in the last 7 days.
to view
the availability of the Dell CMC application in the last 7 days.
¡ Click
the Monthly History icon ![]() to view
the availability of the Dell CMC application in the last 30 days.
to view
the availability of the Dell CMC application in the last 30 days.
· Available Time—Total amount of time that the Dell CMC application was available after 00:00 today.
· Unavailable Time—Total amount of time that the Dell CMC application was unavailable after 00:00 today.
· Inaccessible Time—Total amount of time that the Dell CMC application was inaccessible after 00:00 today.
· Unmanaged Time—Total amount of time that the Dell CMC application was unmanaged after 00:00 today.
The statistics collection started when the application monitor was added. An availability time field is not displayed when its value is 0.
Module Info
The Module Info area contains the following fields:
· Module Name—Name of the module.
· Presence—Whether the module exists in the chassis.
· Power State—Whether the module is powered on.
· Health—Whether the module operates correctly.
· Service Tag—Service tag of the module.
Ping Command
The Packet Internet Groper (ping) command is used to verify network connectivity in order to help users analyze and locate network problems. APM supports monitoring ping commands.
Adding a Ping Command application monitor
1. Click the Resource tab.
2. Open the Add Application page by using one of the following methods:
¡ From the navigation tree, select Application Manager > Add Application.
¡ From the navigation tree, select Application Manager > Application Monitor. In the application monitor list, click Add.
The Add Application page displays all application types that can be monitored by APM.
3. Click Ping Command of the Service Monitor class.
The page for adding a Ping Command application monitor opens.
4. Configure the following parameters:
¡ IP Address—Enter the IP address of the host on which the Ping Command application to be monitored is installed. APM automatically checks the IP address and associates the application monitor with the host managed in the IMC platform. If the host is already added to the IMC platform, you can also click Select, and then select the host in the Select Devices window. For information about selecting a host, see "Quick start."
¡ Name—Enter a unique application monitor name. As a best practice, name the application monitor as application type_host IP address.
¡ Use Template—Select Enable or Disable from the list.
¡ Template—Click the Configure icon ![]() next to the Template field to select an
existing template. The Template field is
automatically populated with the name of the selected template. For more
information about configuring application templates, see "Configuration management." This field is displayed only when you select Enable from the Use Template
list.
next to the Template field to select an
existing template. The Template field is
automatically populated with the name of the selected template. For more
information about configuring application templates, see "Configuration management." This field is displayed only when you select Enable from the Use Template
list.
¡ Description—Enter a description for the application monitor.
¡ Polling Interval (min)—Select a polling interval for the application monitor. Available options are 1, 2, 3, 4, 5, 10, 20, and 30. The default polling interval is 5 minutes. A shorter polling interval improves real-time data accuracy at the expense of system resources. This field is available only when you select Disable from the Use Template list.
¡ Ping Packet Size (Bytes)—Enter the ping packet size, which is 32 bytes (default) or larger. If you do not specify the ping packet size, the default setting (32 bytes) applies. This field is available only when you select Disable the Use Template list.
¡ Contact—Enter the contact information, such as the name, email address, and telephone number. The default is the username of the operator who created the application monitor. This field is available only when you select Disable the Use Template list.
¡ APM Server—Select an APM server to monitor the application. The options are in server-address (application-type:n/N) format. The letter n indicates the number of Ping Command applications monitored on the APM server. The letter N indicates the total number of applications monitored on the APM server. Server address 127.0.0.1 indicates that APM and the IMC platform are deployed on the same server.
¡ Related Applications—Click Add next to this field. On the Select Application window, enter a partial or complete name to filter applications, select the applications that Ping Command depends on, and then click OK.
Operating system applications cannot be selected. Operators can view all dependencies of the application in the dependency topology. APM automatically adds the dependencies between Ping Command and operating system applications by IP address and displays their dependencies in the application topology.
¡ Application Group—Specify an application group for the Ping Command application.
- To specify an existing application group, click Add, select an application group, and then click OK.
- To specify a new application group, click Add Application Group, configure the application group settings, and then click OK.
¡ Detect Application—Select this parameter if you want to enable application detection. Application detection enables APM to verify connection to the application by using the previous parameter settings, and to determine whether to add the application monitor based on the verification result. APM adds the application monitor only when it can connect to the application. When this parameter is not specified, APM adds the application monitor without verifying the connection.
5. Click OK.
Modifying a Ping Command application monitor
Authorized users can modify all parameters except the IP address and the APM server for a Ping Command application monitor. When the IP address of a monitored Ping Command host changes, operators must add a new application monitor for the host. However, the new application monitor cannot inherit the history data from the previous application monitor.
To modify a Ping Command application monitor:
1. Click the Resource tab.
2. From the navigation tree, select Application Manager > Application Monitor.
The application monitor list page opens.
3. Click the Modify
icon ![]() for the Ping Command monitor you want to modify.
for the Ping Command monitor you want to modify.
The page for modifying the Ping Command application monitor opens.
4. Modify the parameters as needed, except the IP address and the APM server.
For more information about parameter settings, see "Adding a Ping Command application monitor."
5. Click OK.
Viewing the Ping Command application monitor report
After a Ping Command application monitor is added, APM collects index data of the application, evaluates the availability and health status, and updates the monitor report. The report shows the index values obtained from the most recent polling of the application.
To view the Ping Command application monitor report:
1. Click the Resource tab.
2. From the navigation tree, select Application Manager > Application Monitor.
The application monitor list page displays all application monitors.
3. Click the name of a Ping Command application monitor to display the report.
Figure 115 shows part of a Ping Command application monitor report.
Figure 115 Part of a Ping Command application monitor report
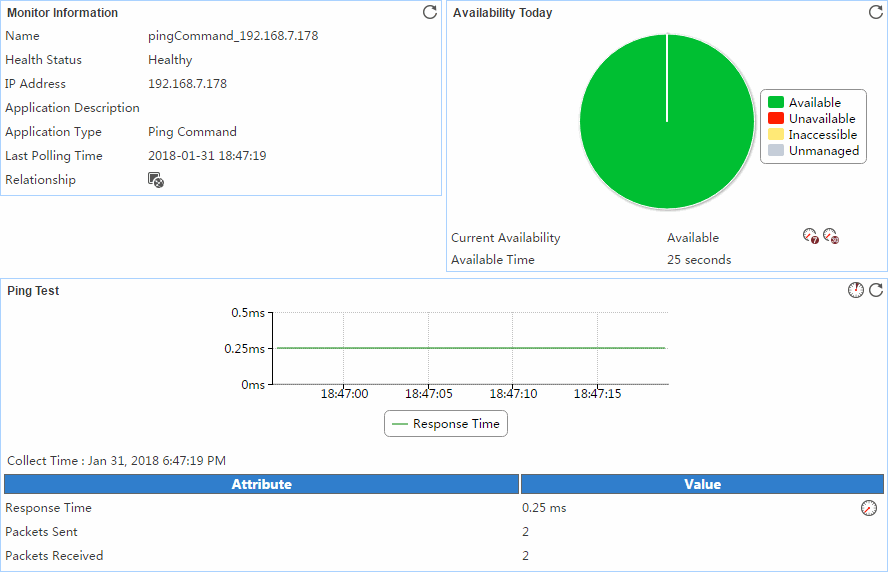
Monitor Information
The Monitor Information area contains the following fields:
· Name—Name of the Ping Command application monitor.
· Health Status—Health status of the Ping Command application.
· IP Address—IP address of the host where the Ping Command application resides.
· Application Description—Description of the Ping Command application.
· Application Type—Type of the monitored application, which is always Ping Command.
· Last Polling Time—Time when APM last polled the Ping Command application.
· Relationship—Click the Related Applications icon ![]() to view dependencies between the Ping Command application and other
applications in a dependency topology view. For more information about dependency topologies, see "Topology and application group management."
to view dependencies between the Ping Command application and other
applications in a dependency topology view. For more information about dependency topologies, see "Topology and application group management."
· Top5 Unrecovered Alarm—Latest five unrecovered alarms on the Ping Command host. The alarm level is identified by color: yellow for minor alarms, orange for major alarms, and red for critical alarms. This field is not displayed if no alarm is generated by the Ping Command application.
Availability Today
The Availability Today area contains the following fields:
· Current Availability—Availability of the Ping Command application.
¡ Click
the Weekly History icon ![]() to view
the availability of the Ping Command application in the last 7 days.
to view
the availability of the Ping Command application in the last 7 days.
¡ Click
the Monthly History icon ![]() to view
the availability of the Ping Command application in the last 30 days.
to view
the availability of the Ping Command application in the last 30 days.
· Available Time—Total amount of time that the Ping Command application was available after 00:00 today.
· Unavailable Time—Total amount of time that the Ping Command application was unavailable after 00:00 today.
· Inaccessible Time—Total amount of time that the Ping Command application was inaccessible after 00:00 today.
· Unmanaged Time—Total amount of time that the Ping Command application was unmanaged after 00:00 today.
The statistics collection started when the application monitor was added. An availability time field is not displayed when its value is 0.
Ping Test
The Ping Test area contains the following fields:
· Response Time—Response time of the ping test.
· Packets Sent—Number of packets sent during the ping test.
· Packets Received—Number of packets received during the ping test.
Common Application
You can monitor a Linux or Windows host by adding a Common Application application monitor.
Adding a Common Application application monitor
When you add a Common Application application monitor, follow these guidelines:
· If the Common Application host runs the Linux operating system, see "Linux server monitor" for relevant restrictions and guidelines.
· If the Common Application host runs the Windows operating system, see "Windows OS monitor" for relevant restrictions and guidelines.
To add a Common Application application monitor:
1. Click the Resource tab.
2. Open the Add Application page by using one of the following methods:
¡ From the navigation tree, select Application Manager > Add Application.
¡ From the navigation tree, select Application Manager > Application Monitor. In the application monitor list, click Add.
The Add Application page displays all application types that can be monitored by APM.
3. Click Common Application of the Service Monitor class.
The page for adding a Common Application application monitor opens.
4. Configure the following parameters:
¡ IP Address—Enter the IP address of the host on which the Common Application application to be monitored is installed. APM automatically checks the IP address and associates the application monitor with the host managed in the IMC platform. If the host is already added to the IMC platform, you can also click Select, and then select the host in the Select Devices window. For information about selecting a host, see "Quick start."
¡ Name—Enter a unique application monitor name. As a best practice, name the application monitor as application type_host IP address.
¡ Use Template—Select Enable or Disable from the list.
If the Common Application host runs the Linux operating system, see "Linux server monitor" for how to configure the application monitor parameters when you select Disable from the Use Template list.
If the Common Application host runs the Windows operating system, see "Windows OS monitor" for how to configure the application monitor parameters when you select Disable from the Use Template list.
¡ Template—Click the Configure icon ![]() next to the Template field to select an
existing template. The Template field is
automatically populated with the name of the selected template. For more
information about configuring application templates, see "Configuration management." This field is displayed only when you select Enable from the Use Template
list.
next to the Template field to select an
existing template. The Template field is
automatically populated with the name of the selected template. For more
information about configuring application templates, see "Configuration management." This field is displayed only when you select Enable from the Use Template
list.
¡ Description—Enter a description for the application monitor.
¡ APM Server—Select an APM server to monitor the application. The options are in server-address (application-type:n/N) format. The letter n indicates the number of Common Application applications monitored on the APM server. The letter N indicates the total number of applications monitored on the APM server. Server address 127.0.0.1 indicates that APM and the IMC platform are deployed on the same server.
¡ Related Applications—Click Add next to this field. On the Select Application window, enter a partial or complete name to filter applications, select the applications that Common Application depends on, and then click OK.
Operating system applications cannot be selected. Operators can view all dependencies of the application in the dependency topology. APM automatically adds the dependencies between Common Application and operating system applications by IP address and displays their dependencies in the application topology.
¡ Application Group—Specify an application group for the Common Application application.
- To specify an existing application group, click Add, select an application group, and then click OK.
- To specify a new application group, click Add Application Group, configure the application group settings, and then click OK.
¡ Detect Application—Select this parameter if you want to enable application detection. Application detection enables APM to verify connection to the application by using the previous parameter settings, and to determine whether to add the application monitor based on the verification result. APM adds the application monitor only when it can connect to the application. When this parameter is not specified, APM adds the application monitor without verifying the connection.
5. Click OK.
Modifying a Common Application application monitor
Authorized users can modify all parameters except the IP address and the APM server for a Common Application application monitor. When the IP address of a monitored Common Application host changes, operators must add a new application monitor for the host. However, the new application monitor cannot inherit the history data from the previous application monitor.
To modify a Common Application application monitor:
1. Click the Resource tab.
2. From the navigation tree, select Application Manager > Application Monitor.
The application monitor list page opens.
3. Click the Modify
icon ![]() for the Common Application application monitor you want to modify.
for the Common Application application monitor you want to modify.
The page for modifying the Common Application application monitor opens.
4. Modify the parameters as needed, except the IP address and the APM server.
For more information about parameter settings, see "Adding a Common Application application monitor."
5. Click OK.
Viewing the Common Application application monitor report
After a Common Application application monitor is added, APM collects index data of the application, evaluates the availability and health status, and updates the monitor report. The report shows the index values obtained from the most recent polling of the application.
To view the Common Application application monitor report:
1. Click the Resource tab.
2. From the navigation tree, select Application Manager > Application Monitor.
The application monitor list page displays all application monitors.
3. Click the name of a Common Application application monitor to display the report.
Figure 116 shows part of a Common Application application monitor report.
Figure 116 Part of a Common Application application monitor report
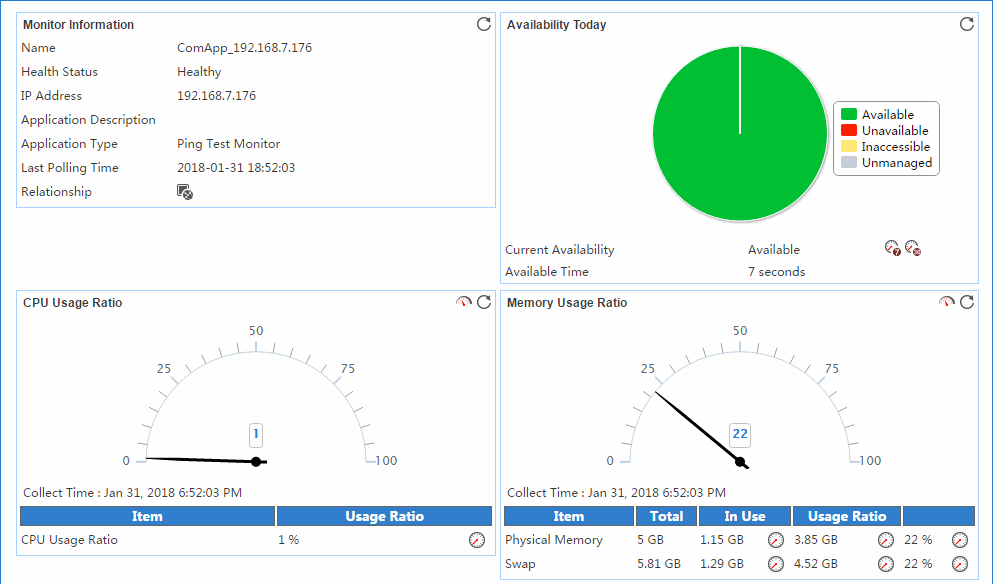
Monitor Information
The Monitor Information area contains the following fields:
· Name—Name of the Common Application application monitor.
· Health Status—Health status of the Common Application application.
· IP Address—IP address of the host where the Common Application application resides.
· Application Description—Description of the Common Application application.
· Application Type—Type of the monitored application, which is always Common Application.
· Last Polling Time—Time when APM last polled the Common Application application.
· Relationship—Click the Related Applications icon ![]() to view dependencies between the Common
Application application and other applications in a dependency topology view. For more information about dependency
topologies, see "Topology and application group management."
to view dependencies between the Common
Application application and other applications in a dependency topology view. For more information about dependency
topologies, see "Topology and application group management."
· Top5 Unrecovered Alarm—Latest five unrecovered alarms on the Common Application host. The alarm level is identified by color: yellow for minor alarms, orange for major alarms, and red for critical alarms. This field is not displayed if no alarm is generated by the Common Application application.
Availability Today
The Availability Today area contains the following fields:
· Current Availability—Availability of the Common Application application.
¡ Click
the Weekly History icon ![]() to view
the availability of the Common Application application in the last 7 days.
to view
the availability of the Common Application application in the last 7 days.
¡ Click
the Monthly History icon ![]() to view
the availability of the Common Application application in the last 30 days.
to view
the availability of the Common Application application in the last 30 days.
· Available Time—Total amount of time that the Common Application application was available after 00:00 today.
· Unavailable Time—Total amount of time that the Common Application application was unavailable after 00:00 today.
· Inaccessible Time—Total amount of time that the Common Application application was inaccessible after 00:00 today.
· Unmanaged Time—Total amount of time that the Common Application application was unmanaged after 00:00 today.
The statistics collection started when the application monitor was added. An availability time field is not displayed when its value is 0.
CPU Usage Ratio
The CPU Usage Ratio area contains the following field:
· CPU Usage Ratio—CPU usage of the application in the last polling interval.
¡ Click
the Set Threshold icon ![]() to set the CPU usage
alarm thresholds for the application.
to set the CPU usage
alarm thresholds for the application.
¡ Click
the History Record icon ![]() to view statistics of the history graph of
the CPU usage for the application.
to view statistics of the history graph of
the CPU usage for the application.
Memory Usage Ratio
The Memory Usage Ratio area displays information about physical memory and swap memory.
The Memory Usage Ratio area contains the following fields:
· Physical Memory—Physical memory of the application, which corresponds to the physical memory bar.
· Swap—Swap memory of the application, which corresponds to a disk space.
· Total—Total amount of the physical or swap memory.
· In Use—Size of the physical or swap memory that is being used. Click the History Record icon ![]() to view the history
graph of the physical or swap memory that is being used.
to view the history
graph of the physical or swap memory that is being used.
· Usage Ratio—Physical or swap memory usage ratio. The usage ratio is calculated by using the formula: Usage ratio = Memory in use/Total memory × 100%.
¡ Click
the Set Threshold icon ![]() to set alarm thresholds for the physical or
swap memory.
to set alarm thresholds for the physical or
swap memory.
¡ Click the History Record
icon ![]() to view the history graph of the physical or swap memory usage.
to view the history graph of the physical or swap memory usage.
Ping Test
APM pings the application host every polling interval. In a ping test, APM sends up to three ICMP packets to the host. When APM receives a response, it considers the ping test a success and records the response time. When APM receives no response after three tries, it considers the ping test a failure.
The Ping Test area contains the following fields:
· Response Time—Ping response time in the last ping test. Click the History Record icon ![]() to view the history
graph of the response time.
to view the history
graph of the response time.
· Packets Sent—Number of ICMP packets sent in the last ping test. The maximum value is 3.
· Packets Received—Number of ICMP responses received by APM in the last ping test. The value is 0 or 1.
Process
APM collects CPU and memory usages of selected processes. By default, APM does not monitor any process, and the process list is empty.
The Process area contains the following fields:
· Config—Click the Config icon ![]() to quickly
populate the Application Instance List with all detected processes running on the application. Select the desired processes,
and then click OK. APM collects CPU and memory
usages of the selected
processes in the next polling
interval.
to quickly
populate the Application Instance List with all detected processes running on the application. Select the desired processes,
and then click OK. APM collects CPU and memory
usages of the selected
processes in the next polling
interval.
· Process Name—Name of the process.
· CLI—Command line used to start the process.
· CPU Usage—CPU usage of the process in the last polling interval.
¡ Click
the Set Threshold icon ![]() for a process to set CPU usage alarm thresholds for the process.
for a process to set CPU usage alarm thresholds for the process.
¡ Click
the History Record icon ![]() for a process to view the CPU usage history graph for the process.
for a process to view the CPU usage history graph for the process.
· Memory Usage—Memory usage of the
process in the last polling interval. Click the History
Record icon ![]() for a process to view the memory usage history graph for the process.
for a process to view the memory usage history graph for the process.
HTTP service monitor
This chapter describes how to add and modify the URL application monitor and URL sequence application monitor, and helps you view the monitor reports.
URL
A uniform resource locator (URL) provides a reference to an Internet resource and a means of locating the resource. For more information about URL, see RFC 1738. You can access resources provided by HTTP services through URLs.
By accessing a URL, APM judges whether the HTTP service is properly running on the host that provides the resource to which the URL links.
Adding a URL application monitor
APM accesses URLs through the HTTP service port (TCP port 80 by default). When you add a URL application monitor, add HTTP service hosts to the IMC platform so APM can obtain and display network connections of the hosts and their access devices in the application topology. For more information about adding hosts to the IMC platform, see H3C Intelligent Management Center v7.3 Enterprise and Standard Platform Administrator Guide.
To add a URL application monitor:
1. Click the Resource tab.
2. Open the Add Application page by using one of the following methods:
¡ From the navigation tree, select Application Manager > Add Application.
The page displays all application types that can be monitored by APM.
¡ From the navigation tree, select Application Manager > Application Monitor, and then click Add on the application monitor list page.
3. Click the URL of the HTTP Service Monitor class.
The page for adding a URL application monitor opens.
¡ IP Address—Enter the IP address of the host on which the HTTP service application to be monitored is installed. APM automatically checks the specified IP address and associates the application monitor with the host managed in the IMC platform. If the host is already added to the IMC platform, you can also click Select, and then select the host in the Select Devices window. For information about selecting a host, see "Quick start."
¡ Name—Enter a unique application monitor name. As a best practice, name the application monitor as application type_host IP address.
¡ Use Template—Select Enable or Disable from the list.
¡ Template—Click
the Configure icon ![]() next to the Template field to select an existing
template. The Template field is automatically populated with the name of the selected
template. For more information about configuring application templates, see
"Configuration management." This field is displayed only when you select Enable from the Use Template list.
next to the Template field to select an existing
template. The Template field is automatically populated with the name of the selected
template. For more information about configuring application templates, see
"Configuration management." This field is displayed only when you select Enable from the Use Template list.
¡ Description—Enter a description for the application monitor to aid maintenance.
¡ Application Monitor Port—Enter the HTTP service port for URL access. The default port number is 80. This field is available only when you select Disable from the Use Template list.
¡ Polling Interval (min)—Select a polling interval for the application monitor. Options are 1, 2, 3, 4, 5, 10, 20, and 30. The default polling interval is 5 minutes. A shorter polling interval improves real-time data accuracy at the expense of system resources. This field is available only when you select Disable from the Use Template list.
¡ Scheme—Select HTTP or HTTPS from the list. This field is available only when you select Disable from the Use Template list.
¡ Domain Name—Enter the domain name of the Web page, for example, www.h3c.com. This field is available only when you select Disable from the Use Template list.
¡ Relative Path—Enter the relative path of the Web page, which starts with a slash (/). The URL of a Web page is in the format of http://+<IP address>+relative path, for example, http://10.154.240.55/imc/index.html, where the relative path is /imc/index.html. This field is available only when you select Disable from the Use Template list.
¡ Keyword—Specify the keyword contained on the Web page. APM counts the number of the specified keywords on the Web page file after the Web page is displayed. This field is available only when you select Disable from the Use Template list.
¡ Contact—Enter user contact information, such as the name, email address, and telephone number. The default is the username of the operator who created the application monitor. This field is available only when you select Disable from the Use Template list.
¡ APM Server—Select an APM server to monitor the application. The options are in server-address (application-type:n/N) format. The letter n indicates the number of URL applications monitored on the APM server. The letter N indicates the total number of applications monitored on the APM server. Server address 127.0.0.1 indicates that APM and the IMC platform are deployed on the same server.
¡ Related Applications—Click Add next to this field. On the Select Application window, enter a partial or complete name to filter applications, select the applications that the URL application depends on, and then click OK.
Operating system applications cannot be selected. Operators can view all dependencies of the application in the dependency topology. APM automatically adds the dependencies between URL and operating system applications by IP address and displays their dependencies in the application topology.
¡ Application Group—Specify an application group for the URL application.
- To specify an existing application group, click Add, select an application group, and then click OK.
- To specify a new application group, click Add Application Group, configure the application group settings, and then click OK.
¡ Detect Application—Select this parameter if you want to enable application detection. Application detection enables APM to verify connection to the application by using the previous parameter settings, and to determine whether to add the application monitor based on the verification result. APM adds the application monitor only when it can connect to the application. If you do not select this parameter, APM adds the application monitor without verifying the connection.
4. Click OK.
Modifying a URL application monitor
Authorized users can modify all parameters except the IP address and the APM server for a URL application monitor. If the IP address of the URL that is being monitored changes, operators must add a new application monitor for the URL. The new application monitor cannot inherit the history data from the previous application monitor.
To modify a URL application monitor:
1. Click the Resource tab.
2. From the navigation tree, select Application Manager > Application Monitor.
The page displays all application types that can be monitored by APM.
3. Click the Modify icon ![]() for the URL application monitor you want to modify.
for the URL application monitor you want to modify.
The page for modifying the URL application monitor opens.
4. Modify the parameters as needed, except the IP address and the APM server.
For more information about parameter settings, see "Adding a URL application monitor."
5. Click OK.
Viewing the URL application monitor report
After a URL application monitor is added, APM collects index data of the application, evaluates the availability and health status, and updates the monitor report. The report shows the index values obtained from the most recent polling of the application.
To access the URL application monitor report:
1. Click the Resource tab.
2. From the navigation tree, select Application Manager > Application Monitor.
The application monitor list page displays all application monitors.
3. Click the name of a URL application monitor to display the report.
Figure 117 shows part of a URL application monitor report.
Figure 117 Part of a URL application monitor report
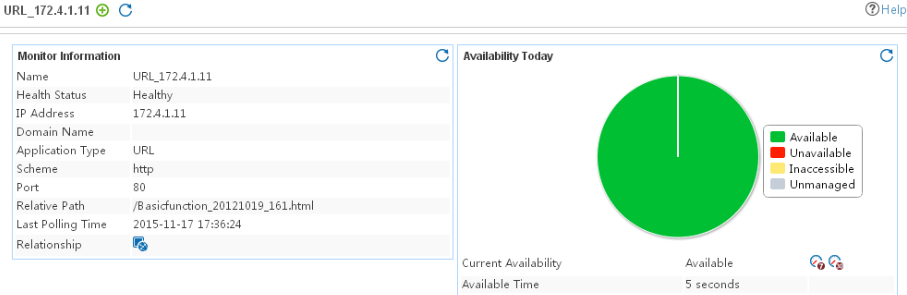
Monitor Information
The Monitor Information area contains the following fields:
· Name—Application monitor name.
· Health State—Health status of the URL.
· IP Address—IP address of the HTTP service host.
· Application Type—Type of the monitored application, which is always URL.
· Port—Port number used to access the URL. The Web server provides HTTP services through the port.
· Last Polling Time—Time when APM last polled the URL application.
· Relationship—Click the Relationship icon ![]() to view dependencies between URL and other applications in a
dependency topology view. For more information about
dependency topologies, see "Topology and application group management."
to view dependencies between URL and other applications in a
dependency topology view. For more information about
dependency topologies, see "Topology and application group management."
· Top5 Unrecovered Alarm—Latest five unrecovered alarms on the URL. The alarm level is identified by color: yellow for minor alarms, orange for major alarms, and red for critical alarms. This field is not displayed if no alarm is generated by the URL.
Availability Today
The Availability Today area contains the following fields:
· Current Availability—Availability of the URL.
¡ Click
the Weekly History icon![]() to view the availability of the URL in the last 7 days.
to view the availability of the URL in the last 7 days.
¡ Click
the Monthly History icon![]() to view the availability of the URL in the last 30 days.
to view the availability of the URL in the last 30 days.
· Available Time—Total amount of time that the URL service was available after 00:00 today.
· Unavailable Time—Total amount of time that the URL service was unavailable after 00:00 today.
· Inaccessible Time—Total amount of time that the URL service was inaccessible after 00:00 today.
· Unmanaged Time—Total amount of time that the URL service was unmanaged after 00:00 today.
The statistics collection started when the application monitor was added. An availability time field is not displayed if its value is 0.
Response Time
APM requests the Web page indicated by the URL at each polling interval, and records the URL response time.
The Response Time area contains the following fields:
· Relative path—Relative path of the monitored URL.
· Response Time—Round trip response time for a URL request.
¡ Click
the Set Threshold icon ![]() to set alarm thresholds for the response
time.
to set alarm thresholds for the response
time.
¡ Click the History
Record icon ![]() to view the history
graph of the response time.
to view the history
graph of the response time.
Page Size
The Page Size area contains the following fields:
· Page Size—Size of the obtained Web page.
· Rate of Change—Change in file size between the most recent two obtained Web pages. For example, if the file size of the most recently obtained Web page is 50 KB and the file size of its previous Web page is 40 KB, the change rate is 25% ((50-40)/40 × 100%). The value is positive if the page file size increases, and the value is negative if the page file size decreases.
Keyword
APM counts the number of keywords in the page file after the Web page is displayed.
The Keyword area contains the following fields:
· Keyword—Keywords on the Web page that are counted by APM.
· Keyword Number—Number of keywords on the Web page. Click
the History Record icon ![]() to view the
history graph of the keyword number.
to view the
history graph of the keyword number.
Response Code
The Response Code area contains the following field:
· Response Code—Value returned when APM receives the response from the Web page.
URL sequence
By using a URL sequence, APM tests a series of URL links. Test operations include Web page access, form query, and simple login. You can evaluate the interaction with the Web pages, collect HTTP service performance data, and analyze the quality of service.
Adding a URL sequence application monitor
APM accesses URLs through the HTTP service port (TCP port 80 by default). When you add a URL sequence application monitor, add HTTP service hosts to the IMC platform so APM can obtain and display network connections of the hosts and their access devices in the application topology. For more information about adding hosts to the IMC platform, see H3C Intelligent Management Center v7.3 Enterprise and Standard Platform Administrator Guide.
To use the URL sequence application monitor function, you must use software such as Badboy to record operations and generate the URL sequence description file. APM collects data based on the description file.
To add a URL sequence application monitor:
1. Click the Resource tab.
2. Open the Add Application page by using one of the following methods:
¡ From the navigation tree, select Application Manager > Add Application.
The page displays all application types that can be monitored by APM.
¡ From the navigation tree, select Application Manager > Application Monitor, and then click Add on the application monitor list page.
3. Click the URL Sequence of the HTTP Service Monitor class.
The page for adding a URL sequence application monitor opens.
¡ IP Address—Enter the IP address of the host on which the HTTP service application to be monitored is installed. APM automatically checks the specified IP address and associates the application monitor with the host managed in the IMC platform. If the host is already added to the IMC platform, you can also click Select, and then select the host in the Select Devices window. For information about selecting a host, see "Quick start."
¡ Name—Enter a unique application monitor name. As a best practice, name the application monitor as application type_host IP address.
¡ Use Template—Select Enable or Disable from the list.
¡ Template—Click
the Configure icon ![]() next to the Template field to select an existing
template. The Template field is automatically populated with the name of the selected
template. For more information about configuring application templates, see
"Configuration management." This field is displayed only when you select Enable from the Use Template list.
next to the Template field to select an existing
template. The Template field is automatically populated with the name of the selected
template. For more information about configuring application templates, see
"Configuration management." This field is displayed only when you select Enable from the Use Template list.
¡ Description—Enter a description for the application monitor to aid maintenance.
¡ Keyword—Specify the keyword contained on the Web page. APM counts the number of the specified keywords on the Web page after the Web page is displayed.
¡ Sequence Description File—Click the Browse button and select the recorded URL sequence description file.
¡ Polling Interval (min)—Select a polling interval for the application monitor. Options are 1, 2, 3, 4, 5, 10, 20, and 30. The default polling interval is 5 minutes. A shorter polling interval improves real-time data accuracy at the expense of system resources. This field is available only when you select Disable from the Use Template list.
¡ Contact—Enter user contact information, such as the name, email address, and telephone number. The default is the username of the operator who created the application monitor. This field is available only when you select Disable from the Use Template list.
¡ APM Server—Select the APM server. Options are displayed in the format of Server IP address(Application type:n/N). The N represents the number of applications that have been monitored on the APM server. The n represents the number of the same type of applications that have been monitored on the APM server. The option 127.0.0.1(Application type:n/N) indicates that the APM server is running on the same host as the IMC platform.
¡ Related Applications—Click Add next to this field. On the Select Application window, enter a partial or complete name to filter applications, select the applications that the URL sequence application depends on, and then click OK.
Operating system applications cannot be selected. Operators can view all dependencies of the application in the dependency topology. APM automatically adds the dependencies between URL sequence and operating system applications by IP address and displays their dependencies in the application topology.
¡ Application Group—Specify an application group for the URL sequence application.
- To specify an existing application group, click Add, select an application group, and then click OK.
- To specify a new application group, click Add Application Group, configure the application group settings, and then click OK.
¡ Detect Application—Select this parameter if you want to enable application detection. Application detection enables APM to verify connection to the application by using the previous parameter settings, and to determine whether to add the application monitor based on the verification result. APM adds the application monitor only when it can connect to the application. If you do not select this parameter, APM adds the application monitor without verifying the connection.
4. Click OK.
Modifying a URL sequence application monitor
You can modify all parameters except the IP Address and APM Server. If the IP address of the URL that is being monitored changes, you must add a new URL sequence application monitor.
To modify a URL sequence application monitor:
1. Click the Resource tab.
2. From the navigation tree, select Application Manager > Application Monitor.
The page displays all application types that can be monitored by APM.
3. Click the Modify icon ![]() for the URL sequence application monitor you want to modify.
for the URL sequence application monitor you want to modify.
The page for modifying the URL sequence application monitor opens.
4. Modify the parameters as needed, except the IP address and the APM server.
For more information about parameter settings, see "Adding a URL sequence application monitor."
5. Click OK.
Viewing the URL sequence application monitor report
After a URL sequence application monitor is added, APM collects index data for the URL sequence, evaluates the availability and health status, and updates the monitor report. The report shows the index values obtained from the most recent polling.
To access the URL sequence application monitor report:
1. Click the Resource tab.
2. From the navigation tree, select Application Manager > Application Monitor.
The application monitor list page displays all application monitors.
3. Click the name of a URL sequence application monitor to display the report.
Figure 118 shows part of a URL sequence application monitor report.
Figure 118 Part of a URL sequence application monitor report
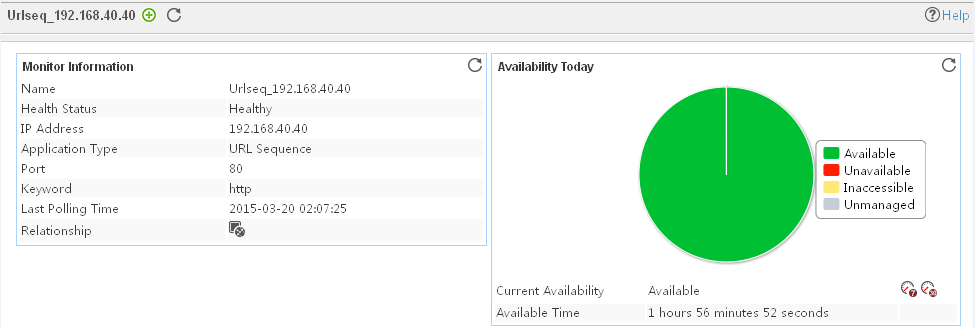
Monitor Information
The Monitor Information area contains the following fields:
· Name—Application monitor name.
· Health State—Health status of the URL sequence.
· IP Address—IP address of the HTTP service host.
· Application Type—Type of the monitored application, which is always URL Sequence.
· Port—Port number used to access the URL sequence. The Web server provides HTTP services through the port.
· Last Polling Time—Time when APM last polled the URL sequence.
· Relationship—Click the Relationship icon ![]() to view dependencies between URL and other applications in a
dependency topology view. For more information about
dependency topologies, see "Topology and application group management."
to view dependencies between URL and other applications in a
dependency topology view. For more information about
dependency topologies, see "Topology and application group management."
· Top5 Unrecovered Alarm—Latest five unrecovered alarms on the URL sequence. The alarm level is identified by color: yellow for minor alarms, orange for major alarms, and red for critical alarms. This field is not displayed if no alarm is generated by the URL sequence.
Availability Today
The Availability Today area contains the following fields:
· Current Availability—Availability of the URL sequence.
¡ Click
the Weekly History icon![]() to view the availability of the URL sequence in the
last 7 days.
to view the availability of the URL sequence in the
last 7 days.
¡ Click
the Monthly History icon![]() to view the availability of the URL sequence in the last 30 days.
to view the availability of the URL sequence in the last 30 days.
· Available Time—Total amount of time that the URL sequence was available after 00:00 today.
· Unavailable Time—Total amount of time that the URL sequence was unavailable after 00:00 today.
· Inaccessible Time—Total amount of time that the URL sequence was inaccessible after 00:00 today.
· Unmanaged Time—Total amount of time that the URL sequence was unmanaged after 00:00 today.
The statistics collection started when the application monitor was added. An availability time field is not displayed if its value is 0.
Sequence Monitoring Information
The Sequence Monitoring Information area contains the following fields:
· Test Start Time—Time when APM started the test and sent the URL request.
· Duration—Round trip response time for a URL request.
· URL—URL that was connected to during the test.
· HTTP Status Code—HTTP status code returned by the test.
· HTTP Status Value—Description for HTTP status code.
· Test Result—Whether a response is received for the URL request.
· Responded Bytes—Number of bytes in the response.
· Keyword—Keywords on the Web page that are counted by APM.
· Keyword Number—Number of keywords on the Web page found at the most recent poll. Because APM does not resolve or execute the HTTP or Java code of a Web page, this statistic might be different from the statistic collected by the Web browser.
Middleware/Portal monitor
This chapter describes how to add and modify middleware or portal application monitors, and helps you view relevant monitor reports.
Office SharePoint 2007
Office SharePoint 2007 is a set of enterprise business solutions developed by Microsoft. APM can monitor Office SharePoint 2007. The following information describes how to add and modify an Office SharePoint 2007 application monitor, and view the monitor report.
Adding an Office SharePoint 2007 application monitor
APM monitors the Office SharePoint 2007 application through WMI. When you add application monitors for Office SharePoint 2007, follow these guidelines:
· Configure and enable WMI for the Windows operating system on which Office SharePoint 2007 is deployed. For information about enabling WMI for Windows, see Microsoft Windows Server online help.
· Add Office SharePoint 2007 hosts to the IMC platform so that APM can obtain and display network connections of the hosts and their access devices in the application topology. For more information about adding hosts to the IMC platform, see H3C Intelligent Management Center v7.3 Enterprise and Standard Platform Administrator Guide.
· Obtain the correct username and password of the user who has the Windows administrator's privileges.
To add an Office SharePoint 2007 application monitor:
1. Click the Resource tab.
2. Open the Add Application page by using one of the following methods:
¡ From the navigation tree, select Application Manager > Add Application.
¡ From the navigation tree, select Application Manager > Application Monitor. In the application monitor list, click Add.
The Add Application page displays all application types that can be monitored by APM.
3. Click Office SharePoint 2007 of the Middleware/Portal Monitor class.
The page for adding an Office SharePoint 2007 application monitor opens.
4. Configure the following parameters:
¡ IP Address—Enter the IP address of the host on which Office SharePoint 2007 to be monitored is deployed. APM automatically checks the specified IP address and associates the application monitor with the host managed in the IMC platform. If the host is already added to the IMC platform, you can also click Select, and then select the host in the Select Devices window. For information about selecting a host, see "Quick start."
¡ Name—Enter a unique application monitor name. As a best practice, name the application monitor as application type_host IP address.
¡ Use Template—Select Enable or Disable from the list.
¡ Template—Click
the Configure icon ![]() next to the Template field to select an existing template. The Template field
is automatically populated with the name of the selected template. For more
information about configuring application templates, see "Configuration management." This field is displayed only when you select Enable from the Use
Template list.
next to the Template field to select an existing template. The Template field
is automatically populated with the name of the selected template. For more
information about configuring application templates, see "Configuration management." This field is displayed only when you select Enable from the Use
Template list.
¡ Description—Enter a description for the application monitor.
¡ Polling Interval (min)—Select a polling interval for the application monitor. Options are 1, 2, 3, 4, 5, 10, 20, and 30. The default polling interval is 5 minutes. A shorter polling interval improves real-time data accuracy at the expense of system resources. This field is available only when you select Disable from the Use Template list.
¡ Username—Enter the username of the Office SharePoint 2007 administrator. This field is available only when you select Disable from the Use Template list.
¡ Password—Enter the password of the Office SharePoint 2007 administrator. This field is available only when you select Disable from the Use Template list.
¡ Contact—Enter the contact information, such as the name, email address, and telephone number. The default is the username of the operator who created the application monitor. This field is available only when you select Disable from the Use Template list.
¡ APM Server—Select an APM server to monitor the application. The options are in server-address (application-type:n/N) format. The letter n indicates the number of Office SharePoint 2007 applications monitored on the APM server. The letter N indicates the total number of applications monitored on the APM server. Server address 127.0.0.1 indicates that APM and the IMC platform are deployed on the same server.
¡ Related Applications—Click Add next to this field. On the Select Application window, enter a partial or complete name to filter applications, select the applications that Office SharePoint 2007 depends on, and then click OK.
Operating system applications cannot be selected. Operators can view all dependencies of the application in the dependency topology. APM automatically adds the dependencies between Office SharePoint 2007 and operating system applications by IP address and displays their dependencies in the application topology.
¡ Application Group—Specify an application group for the Office SharePoint 2007 application.
- To specify an existing application group, click Add, select an application group, and then click OK.
- To specify a new application group, click Add Application Group, configure the application group settings, and then click OK.
¡ Detect Application—Select this parameter if you want to enable application detection. APM verifies the application connectivity by using the previous parameter settings, and adds the application monitor only when it can connect to the application. If you do not select this parameter, APM adds the application monitor without verifying the application connectivity.
5. Click OK.
Modifying an Office SharePoint 2007 application monitor
Authorized users can modify all parameters except the IP address and the APM server for an Office SharePoint 2007 application monitor. When the IP address of a monitored Office SharePoint 2007 host changes, operators must add a new application monitor for the host. The new application monitor cannot inherit the history data from the previous application monitor.
To modify an Office SharePoint 2007 application monitor:
1. Click the Resource tab.
2. From the navigation tree, select Application Manager > Application Monitor.
The application monitor list page displays all application monitors.
3. Click the Modify icon ![]() for the Office SharePoint 2007 application monitor you want to modify.
for the Office SharePoint 2007 application monitor you want to modify.
The page for modifying the Office SharePoint 2007 application monitor opens.
4. Modify the parameters as needed, except the IP address and the APM server.
For more information about parameter settings, see "Adding an Office SharePoint 2007 application monitor."
5. Click OK.
Viewing the Office SharePoint 2007 application monitor report
After an Office SharePoint 2007 application monitor is added, APM collects index data of the application, evaluates the availability and health status, and updates the monitor report. The report shows the index values obtained from the most recent polling of the application.
To view the Office SharePoint 2007 application monitor report:
1. Click the Resource tab.
2. From the navigation tree, select Application Manager > Application Monitor.
The application monitor list page displays all application monitors.
3. Click the name of an Office SharePoint 2007 application monitor to display the report.
Figure 119 shows part of an Office SharePoint 2007 application monitor report.
Figure 119 Part of an Office SharePoint 2007 application monitor report
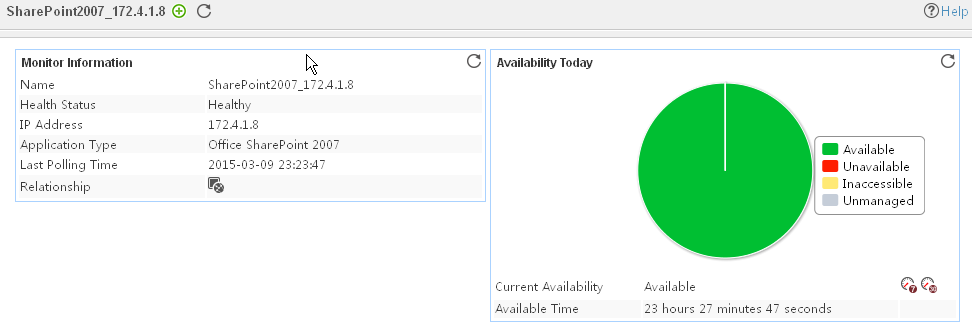
Monitor Information
The Monitor Information area contains the following fields:
· Name—Application monitor name.
· Health State—Health status of the Office SharePoint 2007 application.
· IP Address—IP address of the Office SharePoint 2007 host.
· Application Type—Type of the monitored application, which is always Office SharePoint 2007.
· Last Polling Time—Time when APM last polled Office SharePoint 2007.
· Relationship—Click the Relationship icon ![]() to view dependencies between the Office
SharePoint 2007 application and
other applications in a dependency
topology view. For more information about dependency topologies, see "Topology and application group management."
to view dependencies between the Office
SharePoint 2007 application and
other applications in a dependency
topology view. For more information about dependency topologies, see "Topology and application group management."
· Top5 Unrecovered Alarm—Latest five unrecovered alarms on the Office SharePoint 2007 host. This field is not displayed if no alarm is generated by the Office SharePoint 2007 application.
Availability Today
The Availability Today area contains the following fields:
· Current Availability—Availability of the Office SharePoint 2007 application.
¡ Click the Weekly History icon![]() to view the availability of the Office SharePoint 2007 in the last 7
days.
to view the availability of the Office SharePoint 2007 in the last 7
days.
¡ Click
the Monthly History icon![]() to view
the availability of the Office SharePoint 2007 in the last 30 days.
to view
the availability of the Office SharePoint 2007 in the last 30 days.
· Available Time—Total amount of time that the Office SharePoint 2007 application was available after 00:00 today.
· Unavailable Time—Total amount of time that the Office SharePoint 2007 application was unavailable after 00:00 today.
· Inaccessible Time—Total amount of time that the Office SharePoint 2007 application was inaccessible after 00:00 today.
· Unmanaged Time—Total amount of time that the Office SharePoint 2007 application was unmanaged after 00:00 today.
The statistics collection started when the application monitor was added. An availability time field is not displayed if its value is 0.
CPU Usage Ratio
The CPU Usage Ratio area contains the following fields:
· CPU Usage Ratio dashboard or trend graph—View the area in a dashboard or a trend graph.
¡ Dashboard graph—View the CPU usage ratio of the Office SharePoint 2007 application.
¡ Trend graph—View the changes of the CPU usage ratio for the Office SharePoint 2007 application in a line chart.
· CPU Usage Ratio—CPU usage ratio of the Office SharePoint 2007 application.
¡ Click
the Set Threshold icon ![]() to set alarm thresholds for the CPU usage
ratio.
to set alarm thresholds for the CPU usage
ratio.
¡ Click
the History Record icon
![]() to view the history graph of the CPU usage
ratio.
to view the history graph of the CPU usage
ratio.
Memory Status
The Memory Status area contains the following fields:
· Idle Memory (MB)—Amount of the idle memory of the Office SharePoint 2007 host. Idle
memory can be allocated for use by processes or the system. Click the History
Record icon ![]() to view the history graph of the idle memory.
to view the history graph of the idle memory.
· Faulty Pages/Sec—Average number of faulty pages
counted per second by the operating system of the Office SharePoint 2007 host. Click the History Record icon ![]() to view the
history graph of faulty pages per second.
to view the
history graph of faulty pages per second.
· In Use (%)—Committed virtual memory usage ratio of the Office SharePoint 2007
host. Committed virtual memory usage ratio = committed memory in use/maximum
committed virtual memory × 100%. Click the History Record
icon ![]() to view the
history graph of the committed virtual memory usage ratio.
to view the
history graph of the committed virtual memory usage ratio.
Excel Calculation Services
The Excel Calculation Services area contains the following fields:
· Sessions/Sec—Average number of sessions opened per second by Excel calculation
services. Click the History Record icon ![]() to view the
history graph of the sessions per second.
to view the
history graph of the sessions per second.
· Received Requests/Sec—Average number of active requests received per second by Excel
calculation services. Click the History Record
icon ![]() to view the
history graph of the requests received per second.
to view the
history graph of the requests received per second.
· Active Requests—Number of active requests being processed by Excel calculation
services. Click the History Record icon ![]() to view the
history graph of the active requests.
to view the
history graph of the active requests.
· Error Requests/Sec—Average number of error requests returned per second by Excel calculation
services. Click the History Record icon ![]() to view the
history graph of the error requests per second.
to view the
history graph of the error requests per second.
· Cached Charts Requested/Sec—Average times of requested charts obtained per second from cached
charts by Excel calculation services. Click the History Record
icon ![]() to view the
history graph of the cache charts requested per second.
to view the
history graph of the cache charts requested per second.
· Reports Requested/Sec—Average number of report requests received per second by Excel
calculation services. Click the History Record
icon ![]() to view the
history graph of the reports requested per second.
to view the
history graph of the reports requested per second.
· Active Sessions—Total number of active sessions in Excel calculation services. Click the History Record icon ![]() to view the
history graph of the active sessions.
to view the
history graph of the active sessions.
Office Search Collector
The Office Search Collector area contains the following fields:
· Backoff Reason—Reason that causes the Office search collector to enter backoff
state. A value of 0 indicates that the Office search collector is operating correctly. Other different values
indicate different reasons. Click the History Record
icon ![]() to view the
history graph of the backoff reason.
to view the
history graph of the backoff reason.
· Idle Threads—Number of threads possessed by the Office search collector and
waiting for documents. Click the History Record
icon ![]() to view the
history graph of the idle threads.
to view the
history graph of the idle threads.
· Delayed Documents—Number of documents delayed to be searched by the Office search
collector subject to site hit frequency rules. Click
the History Record icon ![]() to view the
history graph of the delayed documents.
to view the
history graph of the delayed documents.
· Retried Documents—Number of documents that will be retried after timeout. Click the History Record icon ![]() to view the
history graph of the retried documents.
to view the
history graph of the retried documents.
· Active Queue Length—Number of documents waiting for robot threads in the Office search
collector. Click the History Record icon ![]() to view the
history graph of the active queue length.
to view the
history graph of the active queue length.
· Server Objects—Number of servers accessed by the Office search collector during a
crawl. Office SharePoint 2007 creates a server object for a server being
accessed for the first time. Click the History Record
icon ![]() to view the
history graph of the server objects.
to view the
history graph of the server objects.
· Created Server Objects—Number of server objects created by the Office search collector. Click the History Record icon ![]() to view the
history graph of the created server objects.
to view the
history graph of the created server objects.
· Network Access Threads—Number of threads waiting for responses from remote data storage or
processing responses. Click the History Record
icon ![]() to view the
history graph of the network access threads.
to view the
history graph of the network access threads.
· Threads in Plugins—Number of threads that have been retrieved and are processed by
plugins, such as Ifilter. Click the History Record
icon ![]() to view the
history graph of the threads in plugins.
to view the
history graph of the threads in plugins.
Excel Service Web Front End
The Excel Service Web Front End area contains the following fields:
· Active Requests—Number of active requests being processed by Excel Web services. Click
the History Record icon ![]() to view the
history graph of the active requests.
to view the
history graph of the active requests.
· Requests/Sec—Number of requests received per second by Excel Web services. Click
the History Record icon ![]() to view the
history graph of the requests per second.
to view the
history graph of the requests per second.
Excel Web Access
The Excel Web Access area contains the following fields:
· Web Access Time—Average Excel Web access request time.
Click the History Record icon ![]() to view the
history graph of the Web access time.
to view the
history graph of the Web access time.
· Chart Requests/Sec—Number of chart requests
processed per second by the
Excel Web access. Click the History Record
icon ![]() to view the
history graph of the chart requests per second.
to view the
history graph of the chart requests per second.
· Average Chart Request Time—Average time length from the time when the Excel Web access
receives chart requests to the time when the Excel Web access sends responses
to the Web browser. Click the History Record
icon ![]() to view the
history graph of the average chart request time.
to view the
history graph of the average chart request time.
Active Server Pages
The Active Server Pages area contains the following fields:
· Errors/Sec—Average number of errors per second. Click
the History Record icon ![]() to view the
history graph of the errors per second.
to view the
history graph of the errors per second.
· Queued Requests—Number of requests waiting for services in the queue. Click the History Record icon ![]() to view the
history graph of the queued requests.
to view the
history graph of the queued requests.
· Rejected Requests—Number of requests rejected due to insufficient resources. Click the History Record icon ![]() to view the
history graph of the rejected requests.
to view the
history graph of the rejected requests.
· Requests/Sec—Average number of requests executed per second. Click the History Record icon ![]() to view the
history graph of the requests per second.
to view the
history graph of the requests per second.
· Current Sessions—Number of sessions being served per second.
Click the History Record icon ![]() to view the
history graph of the current sessions.
to view the
history graph of the current sessions.
· Transactions/Sec—Average number of transactions started per second. Click the History Record
icon ![]() to view the
history graph of the transactions per second.
to view the
history graph of the transactions per second.
· Pending Transactions—Number of transactions being processed.
Click the History Record icon ![]() to view the
history graph of the pending transactions.
to view the
history graph of the pending transactions.
Document Conversion
The Document Conversion area contains the following fields:
· Pending Sessions—Number of documents to be converted. Click
the History Record icon ![]() to view the
history graph of the pending sessions.
to view the
history graph of the pending sessions.
· Processed Email Messages—Email message processing rate of Office SharePoint 2007. Click the History Record icon ![]() to view the
history graph of the processed email messages.
to view the
history graph of the processed email messages.
Service
APM monitors the following services of Office SharePoint 2007:
· Office Document Conversions Launcher Service
· Office Document Conversions Load Balancer Service
· Windows SharePoint Servers Search
· Windows SharePoint Services Timer
· Windows SharePoint Services Tracing
The Service area contains the following fields:
· Service Name—Original name of the service.
· Display Name—Display name of the service, which is equivalent to the alias of the service. The Window service console shows display names of services. In most cases, the display name of a service differs from the original name.
· Status—Status of the service.
Office Search Archive Plugin
The Office Search Archive Plugin area contains the following fields:
· Name—Name of the Office search archive plugin.
· Active Documents in the First Queue—Number of documents in the first queue of the Office search archive plugin.
· Total Documents in the First Queue—Number of used documents in the first Office search archive plugin queue.
· Active Documents in the Second Queue—Number of documents in the second Office search archive plugin queue.
· Total Documents in the Second Queue—Number of used documents in the second Office search archive plugin queue.
· Total Documents—Number of documents processed by the Office search archive plugin.
· Error Documents—Number of error documents returned by the Office search archive plugin.
· Retried Documents—Number of retried documents marked by the Office search archive plugin.
· Active Queues—Length of the active queue.
· Blocked Documents—Number of documents in the waiting queue of the Office search archive plugin.
· Sessions Inserted in Batches—Number of sessions batch inserted to the database server.
Office Search Plan Plugin
The Office Search Plan Plugin area contains the following fields:
· Name—Name of the Office search plan plugin.
· Loaded Alias—Number of aliases that the Office search plan plugin has loaded.
· Mapped Alias—Number of mapped aliases.
· Copied Alias—Number of aliases ignored because of duplication.
· Error Documents—Number of error documents returned by the Office search plan plugin.
· Updates—Times of alias updates by the Office search plan plugin.
· Total Documents—Number of documents processed by the Office search plan plugin.
· Total Properties Processed—Number of properties processed by the Office search plan plugin.
Office Server Search Index
The Office Server Search Index area contains the following fields:
· Name—Name of the Office server search index.
· Queries—Number of queries to the Office server search index.
· Query Failures—Number of failed queries to the Office server search index.
· Query Successes—Number of successful queries to the Office server search index.
· Documents Filtered—Number of documents filtered by the Office server search index.
· Index Size—Size of the Office server search index.
Web Content Publishing Management Storage
The Web Content Publishing Management Storage area contains the following fields:
· Name—Name of the Web content publishing management storage.
· Cache Hit Ratio—Hit ratio of the Web content publishing management storage.
· Discarded Objects—Total number of objects removed from the Web content publishing management storage.
· Cache Hits/Sec—Average number of cache hits per second of the Web content publishing management storage.
· Cache Failures/Sec—Average number of cache misses per second of the Web content publishing management storage.
· Cache Flushes/Sec—Average number of cache flushes per second of the Web content publishing management storage.
Office SharePoint 2010
Office SharePoint 2010 is a set of enterprise business solutions developed by Microsoft. APM can monitor Office SharePoint 2010. The following information describes how to add and modify an Office SharePoint 2010 application monitor, and view the monitor report.
Adding an Office SharePoint 2010 application monitor
APM monitors the Office SharePoint 2010 application through WMI. When you add application monitors for Office SharePoint 2010, follow these guidelines:
· Configure and enable WMI for the Windows operating system on which Office SharePoint 2010 is deployed. For information about enabling WMI for Windows, see Microsoft Windows Server online help.
· Add Office SharePoint 2010 hosts to the IMC platform so that APM can obtain and display network connections of the hosts and their access devices in the application topology. For more information about adding hosts to the IMC platform, see H3C Intelligent Management Center v7.3 Enterprise and Standard Platform Administrator Guide.
· Obtain the correct username and password of the user who has the Windows administrator's privileges.
To add an Office SharePoint 2010 application monitor:
1. Click the Resource tab.
2. Open the Add Application page by using one of the following methods:
¡ From the navigation tree, select Application Manager > Add Application.
¡ From the navigation tree, select Application Manager > Application Monitor. In the application monitor list, click Add.
The Add Application page displays all application types that can be monitored by APM.
3. Click Office SharePoint 2010 of the Middleware/Portal Monitor class.
The page for adding an Office SharePoint 2010 application monitor opens.
4. Configure the following parameters:
¡ IP Address—Enter the IP address of the host on which Office SharePoint 2010 to be monitored is deployed. APM automatically checks the specified IP address and associates the application monitor with the host managed in the IMC platform. If the host that is already added to the IMC platform, you can also click Select, and then select the host in the Select Devices window. For information about selecting a host, see "Quick start."
¡ Name—Enter a unique application monitor name. As a best practice, name the application monitor as application type_host IP address.
¡ Use Template—Select Enable or Disable from the list.
¡ Template—Click
the Configure icon ![]() next to the Template field to select an existing template. The Template field
is automatically populated with the name of the selected template. For more
information about configuring application templates, see "Configuration management." This field is displayed only when you select Enable from the Use
Template list.
next to the Template field to select an existing template. The Template field
is automatically populated with the name of the selected template. For more
information about configuring application templates, see "Configuration management." This field is displayed only when you select Enable from the Use
Template list.
¡ Description—Enter a description for the application monitor.
¡ Polling Interval (min)—Select a polling interval for the application monitor. Options are 1, 2, 3, 4, 5, 10, 20, and 30. The default polling interval is 5 minutes. A shorter polling interval improves real-time data accuracy at the expense of system resources. This field is available only when you select Disable from the Use Template list.
¡ Username—Enter the username of the Office SharePoint 2010 administrator. This field is available only when you select Disable from the Use Template list.
¡ Password—Enter the password of the Office SharePoint 2010 administrator. This field is available only when you select Disable from the Use Template list.
¡ Contact—Enter the contact information, such as the name, email address, and telephone number. The default is the username of the operator who created the application monitor. This field is available only when you select Disable from the Use Template list.
¡ APM Server—Select an APM server to monitor the application. The options are in server-address (application-type:n/N) format. The letter n indicates the number of Office SharePoint 2010 applications monitored on the APM server. The letter N indicates the total number of applications monitored on the APM server. Server address 127.0.0.1 indicates that APM and the IMC platform are deployed on the same server.
¡ Related Applications—Click Add next to this field. On the Select Application window, enter a partial or complete name to filter applications, select the applications that Office SharePoint 2010 depends on, and the click OK.
Operating system applications cannot be selected. Operators can view all dependencies of the application in the dependency topology. APM automatically adds the dependencies between Office SharePoint 2010 and operating system applications by IP address and displays their dependencies in the application topology.
¡ Application Group—Specify an application group for the Office SharePoint 2010 application.
- To specify an existing application group, click Add, select an application group, and then click OK.
- To specify a new application group, click Add Application Group, configure the application group settings, and then click OK.
¡ Detect Application—Select this parameter if you want to enable application detection. APM verifies the application connectivity by using the previous parameter settings, and adds the application monitor only when it can connect to the application. If you do not select this parameter, APM adds the application monitor without verifying the application connectivity.
5. Click OK.
Modifying an Office SharePoint 2010 application monitor
Authorized users can modify all parameters except the IP address and the APM server for an Office SharePoint 2010 application monitor. When the IP address of a monitored Office SharePoint 2010 host changes, operators must add a new application monitor for the host. The new application monitor cannot inherit the history data from the previous application monitor.
To modify an Office SharePoint 2010 application monitor:
1. Click the Resource tab.
2. From the navigation tree, select Application Manager > Application Monitor.
The application monitor list page displays all application monitors.
3. Click the Modify icon ![]() for the Office SharePoint 2010 application monitor you want to modify.
for the Office SharePoint 2010 application monitor you want to modify.
The page for modifying the Office SharePoint 2010 application monitor opens.
4. Modify the parameters as needed, except the IP address and the APM server.
For more information about parameter settings, see "Adding an Office SharePoint 2010 application monitor."
5. Click OK.
Viewing the Office SharePoint 2010 application monitor report
After an Office SharePoint 2010 application monitor is added, APM collects index data of the application, evaluates the availability and health status, and updates the monitor report. The report shows the index values obtained from the most recent polling of the application.
To view the Office SharePoint 2010 application monitor report:
1. Click the Resource tab.
2. From the navigation tree, select Application Manager > Application Monitor.
The application monitor list page displays all application monitors.
3. Click the name of an Office SharePoint 2010 application monitor to display the report.
Figure 120 shows part of an Office SharePoint 2010 application monitor report.
Figure 120 Part of an Office SharePoint 2010 application monitor report
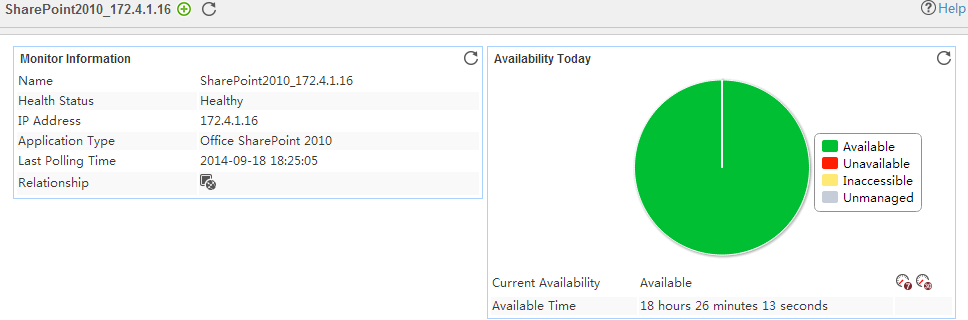
Monitor Information
The Monitor Information area contains the following fields:
· Name—Application monitor name.
· Health Status—Health status of the Office SharePoint 2010 application.
· IP Address—IP address of the Office SharePoint 2010 host.
· Application Type—Type of the monitored application, which is always Office SharePoint 2010.
· Last Polling Time—Time when APM last polled Office SharePoint 2010.
· Relationship—Click the Relationship icon ![]() to view dependencies between the Office
SharePoint 2010 application and
other applications in a dependency
topology view. For more information about dependency topologies, see "Topology and application group management."
to view dependencies between the Office
SharePoint 2010 application and
other applications in a dependency
topology view. For more information about dependency topologies, see "Topology and application group management."
· Top5 Unrecovered Alarm—Latest five unrecovered alarms on the Office SharePoint 2010 host. This field is not displayed if no alarm is generated by the Office SharePoint 2010 application.
Availability Today
The Availability Today area contains the following fields:
· Current Availability—Availability of the Office SharePoint 2010 application.
¡ Click the Weekly History icon ![]() to view
the availability of the Office SharePoint 2010 application in
the last 7 days.
to view
the availability of the Office SharePoint 2010 application in
the last 7 days.
¡ Click
the Monthly History icon ![]() to view
the availability of the Office SharePoint 2010 application in
the last 30 days.
to view
the availability of the Office SharePoint 2010 application in
the last 30 days.
· Available Time—Total amount of time that the Office SharePoint 2010 application was available after 00:00 today.
· Unavailable Time—Total amount of time that the Office SharePoint 2010 application was unavailable after 00:00 today.
· Inaccessible Time—Total amount of time that the Office SharePoint 2010 application was inaccessible after 00:00 today.
· Unmanaged Time—Total amount of time that the Office SharePoint 2010 application was unmanaged after 00:00 today.
The statistics collection started when the application monitor was added. An availability time field is not displayed if its value is 0.
CPU Usage Ratio
The CPU Usage Ratio area contains the following fields:
· CPU Usage Ratio dashboard or trend graph—View the area in a dashboard or a trend graph.
¡ Dashboard graph—View the CPU usage ratio of the Office SharePoint 2010 application.
¡ Trend graph—View the changes of the CPU usage ratio for the Office SharePoint 2010 application in a line chart. Point to a spot on the curve to view the CPU usage ratio at the specific time point.
· CPU Usage Ratio—CPU usage ratio of the Office SharePoint 2010 application.
¡ Click
the Set Threshold icon ![]() to set alarm thresholds for the CPU usage
ratio.
to set alarm thresholds for the CPU usage
ratio.
¡ Click
the History Record icon
![]() to view the history graph of the CPU usage
ratio.
to view the history graph of the CPU usage
ratio.
Memory Status
The Memory Status area contains the following fields:
· Idle Memory (MB)—Amount of the idle memory of the Office SharePoint 2010 host. Idle
memory can be allocated for use by processes or the system. Click the History
Record icon ![]() to view the history graph of the idle memory.
to view the history graph of the idle memory.
· In Use (%)—Committed virtual memory usage ratio of the Office SharePoint 2010
host. Committed virtual memory usage ratio = committed memory in use/maximum
committed virtual memory × 100%. Click the History Record
icon ![]() to view the
history graph of the committed virtual memory usage ratio.
to view the
history graph of the committed virtual memory usage ratio.
Excel Calculation Services
The Excel Calculation Services area contains the following fields:
· Sessions/Sec—Average number of sessions opened per second by Excel calculation
services. Click the History Record icon ![]() to view the
history graph of the sessions per second.
to view the
history graph of the sessions per second.
· Received Requests/Sec—Average number of active requests received per second by Excel
calculation services. Click the History Record
icon ![]() to view the
history graph of the received requests per second.
to view the
history graph of the received requests per second.
· Active Requests—Number of active requests being processed by Excel calculation
services. Click the History Record icon ![]() to view the
history graph of the active requests.
to view the
history graph of the active requests.
· Error Requests/Sec—Average number of error requests returned per second by Excel calculation
services. Click the History Record icon ![]() to view the
history graph of the error requests per second.
to view the
history graph of the error requests per second.
· Cached Charts Requested/Sec—Average times of requested charts obtained per second from cached
charts by Excel calculation services. Click the History Record
icon ![]() to view the
history graph of the cached charts requested per second.
to view the
history graph of the cached charts requested per second.
· Reports Requested/Sec—Average number of report requests received per second by Excel
calculation services. Click the History Record
icon ![]() to view the
history graph of the reports requested per second.
to view the
history graph of the reports requested per second.
· Active Sessions—Total number of active sessions in Excel calculation services. Click the History Record icon ![]() to view the
history graph of the active sessions.
to view the
history graph of the active sessions.
Office Search Collector
The Office Search Collector area contains the following fields:
· Idle Threads—Number of threads possessed by the Office search collector and
waiting for documents. Click the History Record
icon ![]() to view the
history graph of the idle threads.
to view the
history graph of the idle threads.
· Document Entries In Memory—Number of document entries in the memory of the Office search collector. Click the History Record icon ![]() to view the
history graph of the document entries in memory.
to view the
history graph of the document entries in memory.
· Active Queue Length—Number of documents waiting for robot threads in the Office search
collector. Click the History Record icon ![]() to view the
history graph of the active queue length.
to view the
history graph of the active queue length.
· Server Objects—Number of servers accessed by the Office search collector during a
crawl. Office SharePoint 2010 creates a server object for a server being
accessed for the first time. Click the History Record
icon ![]() to view the
history graph of the server objects.
to view the
history graph of the server objects.
· Created Server Objects—Number of server objects created by the Office search collector. Click the History Record icon ![]() to view the
history graph of the created server objects.
to view the
history graph of the created server objects.
· Network Access Threads—Number of threads waiting for responses from remote data storage or
processing responses. Click the History Record
icon ![]() to view the
history graph of the network access threads.
to view the
history graph of the network access threads.
· Threads in Plugins—Number of threads that have been retrieved and are processed by
plugins, such as Ifilter. Click the History Record
icon ![]() to view the
history graph of the threads in plugins.
to view the
history graph of the threads in plugins.
Excel Service Web Front End
The Excel Service Web Front End area contains the following fields:
· Active Requests—Number of active requests being processed by Excel Web services. Click
the History Record icon ![]() to view the
history graph of the active requests.
to view the
history graph of the active requests.
· Requests/Sec—Number of requests received per second by Excel Web services. Click
the History Record icon ![]() to view the
history graph of the requests per second.
to view the
history graph of the requests per second.
Active Server Pages
The Active Server Pages area contains the following fields:
· Errors/Sec—Average number of errors per second. Click
the History Record icon ![]() to view the
history graph of the errors per second.
to view the
history graph of the errors per second.
· Queued Requests—Number of requests waiting for services in the queue. Click the History Record icon ![]() to view the
history graph of the queued requests.
to view the
history graph of the queued requests.
· Rejected Requests—Number of requests rejected due to insufficient resources. Click the History Record icon ![]() to view the
history graph of the rejected requests.
to view the
history graph of the rejected requests.
· Requests/Sec—Average number of requests executed per second. Click the History Record icon ![]() to view the
history graph of the requests per second.
to view the
history graph of the requests per second.
· Current Sessions—Number of sessions being served per second.
Click the History Record icon ![]() to view the
history graph of the current sessions.
to view the
history graph of the current sessions.
· Transactions/Sec—Average number of transactions started per second. Click the History Record
icon ![]() to view the
transactions per second.
to view the
transactions per second.
· Pending Transactions—Number of transactions being processed.
Service
APM monitors the following services of Office SharePoint 2010:
· Microsoft SharePoint Server 2010 Document Conversions Launcher
· Microsoft SharePoint Server 2010 Document Conversions Load Balancer
· SharePoint Foundation Search V4
· SharePoint 2010 Timer
· SharePoint 2010 Tracing
· SharePoint 2010 VSS Writer
The Service area contains the following fields:
· Service Name—Original name of the service.
· Display Name—Display name of the service, which is equivalent to the alias of the service. The Window service console shows display names of services. In most cases, the display name of a service differs from the original name.
· Status—Status of the service when APM last polled Office SharePoint 2010.
Office Search Archive Plugin
The Office Search Archive Plugin area contains the following fields:
· Name—Name of the Office search archive plugin.
· Total Documents—Number of used documents in the Office search archive plugin queue.
· Retried Documents—Number of retried documents marked by the Office search archive plugin.
· Active Queues—Length of the active queue.
· Blocked Documents—Number of documents in the waiting queue of the Office search archive plugin.
· Sessions Inserted in Batches—Number of sessions batch inserted to the database server.
Office Search Plan Plugin
The Office Search Plan Plugin area contains the following fields:
· Name—Name of the Office search plan plugin.
· Loaded Alias—Number of aliases that the Office search plan plugin has loaded.
· Mapped Alias—Number of mapped aliases.
· Copied Alias—Number of aliases ignored because of duplication.
· Updates—Times of alias updates by the Office search plan plugin.
· Total Documents—Number of documents processed by the Office search plan plugin.
· Total Properties Processed—Number of properties processed by the Office search plan plugin.
Office Server Search Index
The Office Server Search Index area contains the following fields:
· Name—Name of the Office server search index.
· Queries—Number of queries to the Office server search index.
· Query Failures—Number of failed queries to the Office server search index.
· Query Successes—Number of successful queries to the Office server search index.
· Documents Filtered—Number of documents filtered by the Office server search index.
· Index Size—Size of the Office server search index.
Web Content Publishing Management Storage
The Web Content Publishing Management Storage area contains the following fields:
· Name—Name of the Web content publishing management storage.
· Cache Hit Ratio—Hit ratio of the Web content publishing management storage.
· Discarded Objects—Total number of objects removed from the Web content publishing management storage.
· Cache Hits/Sec—Average number of cache hits per second of the Web content publishing management storage.
· Cache Failures/Sec—Average number of cache misses per second of the Web content publishing management storage.
· Cache Flushes/Sec—Average number of cache flushes per second of the Web content publishing management storage.
Office SharePoint 2013
Office SharePoint 2013 is a set of enterprise business solutions developed by Microsoft. APM can monitor Office SharePoint 2013. The following information describes how to add and modify an Office SharePoint 2013 application monitor, and view the monitor report.
Adding an Office SharePoint 2013 application monitor
APM monitors the Office SharePoint 2013 application through WMI. When you add application monitors for Office SharePoint 2013, follow these guidelines:
· Configure and enable WMI for the Windows operating system on which Office SharePoint 2013 is deployed. For information about enabling WMI for Windows, see Microsoft Windows Server online help.
· Add Office SharePoint 2013 hosts to the IMC platform so that APM can obtain and display network connections of the hosts and their access devices in the application topology. For more information about adding hosts to the IMC platform, see H3C Intelligent Management Center v7.3 Enterprise and Standard Platform Administrator Guide.
· Obtain the correct username and password of the user who has the Windows administrator's privileges.
To add an Office SharePoint 2013 application monitor:
1. Click the Resource tab.
2. Open the Add Application page by using one of the following methods:
¡ From the navigation tree, select Application Manager > Add Application.
¡ From the navigation tree, select Application Manager > Application Monitor. In the application monitor list, click Add.
The Add Application page displays all application types that can be monitored by APM.
3. Click Office SharePoint 2013 of the Middleware/Portal Monitor class.
The page for adding an Office SharePoint 2013 application monitor opens.
4. Configure the following parameters:
¡ IP Address—Enter the IP address of the host on which Office SharePoint 2013 to be monitored is deployed. To monitor a host that is already managed in the IMC platform, you can also click Select, and then select the host in the Select Devices dialog box. For information about selecting a host, see "Quick start." APM automatically checks the specified IP address and associates the application monitor with the host managed in the IMC platform.
¡ Name—Enter a unique application monitor name. As a best practice, name the application monitor as application type_host IP address.
¡ Use Template—Select Enable or Disable from the list.
¡ Template—Click
the Configure icon ![]() next to the Template field to select an existing template. The Template field
is automatically populated with the name of the selected template. For more
information about configuring application templates, see "Configuration management." This field is displayed only when you select Enable from the Use
Template list.
next to the Template field to select an existing template. The Template field
is automatically populated with the name of the selected template. For more
information about configuring application templates, see "Configuration management." This field is displayed only when you select Enable from the Use
Template list.
¡ Description—Enter a description for the application monitor.
¡ Polling Interval (min)—Select a polling interval for the application monitor. Options are 1, 2, 3, 4, 5, 10, 20, and 30. The default polling interval is 5 minutes. A shorter polling interval improves real-time data accuracy at the expense of system resources. This field is available only when you select Disable from the Use Template list.
¡ Username—Enter the username of the Office SharePoint 2013 administrator. This field is available only when you select Disable from the Use Template list.
¡ Password—Enter the password of the Office SharePoint 2013 administrator. This field is available only when you select Disable from the Use Template list.
¡ Contact—Enter the contact information, such as the name, email address, and telephone number. The default is the username of the operator who created the application monitor. This field is available only when you select Disable from the Use Template list.
¡ APM Server—Select an APM server to monitor the application. The options are in server-address (application-type:n/N) format. The letter n indicates the number of Office SharePoint 2013 applications monitored on the APM server. The letter N indicates the total number of applications monitored on the APM server. Server address 127.0.0.1 indicates that APM and the IMC platform are deployed on the same server.
¡ Related Applications—Click Add next to this field. On the Select Application window, enter a partial or complete name to filter applications, select the applications that Office SharePoint 2013 depends on, and then click OK.
Operating system applications cannot be selected. Operators can view all dependencies of the application in the dependency topology. APM automatically adds the dependencies between Office SharePoint 2013 and operating system applications by IP address and displays their dependencies in the application topology.
¡ Application Group—Specify an application group for the Office SharePoint 2013 application.
- To specify an existing application group, click Add, select an application group, and then click OK.
- To specify a new application group, click Add Application Group, configure the application group settings, and then click OK.
¡ Detect Application—Select this parameter if you want to enable application detection. APM verifies the application connectivity by using the previous parameter settings, and adds the application monitor only when it can connect to the application. If you do not select this parameter, APM adds the application monitor without verifying the application connectivity.
5. Click OK.
Modifying an Office SharePoint 2013 application monitor
Authorized users can modify all parameters except the IP address and the APM server for an Office SharePoint 2013 application monitor. When the IP address of a monitored Office SharePoint 2013 host changes, operators must add a new application monitor for the host. The new application monitor cannot inherit the history data from the previous application monitor.
To modify an Office SharePoint 2013 application monitor:
1. Click the Resource tab.
2. From the navigation tree, select Application Manager > Application Monitor.
The application monitor list page displays all application monitors.
3. Click the Modify icon ![]() for the Office SharePoint 2013 application monitor you want to modify.
for the Office SharePoint 2013 application monitor you want to modify.
The page for modifying the Office SharePoint 2013 application monitor opens.
4. Modify the parameters as needed, except the IP address and the APM server.
For more information about parameter settings, see "Adding an Office SharePoint 2013 application monitor."
5. Click OK.
Viewing the Office SharePoint 2013 application monitor report
After an Office SharePoint 2013 application monitor is added, APM collects index data of the application, evaluates the availability and health status, and updates the monitor report. The report shows the index values obtained from the most recent polling of the application.
To view the Office SharePoint 2013 application monitor report:
1. Click the Resource tab.
2. From the navigation tree, select Application Manager > Application Monitor.
The application monitor list page displays all application monitors.
3. Click the name of an Office SharePoint 2013 application monitor to display the report.
Figure 121 shows part of an Office SharePoint 2013 application monitor report.
Figure 121 Part of an Office SharePoint 2013 application monitor report

Monitor Information
The Monitor Information area contains the following fields:
· Name—Application monitor name.
· Health Status—Health status of the Office SharePoint 2013 application.
· IP Address—IP address of the Office SharePoint 2013 host.
· Application Type—Type of the monitored application, which is always Office SharePoint 2013.
· Last Polling Time—Time when APM last polled Office SharePoint 2013.
· Relationship—Click the Relationship icon ![]() to view dependencies between the Office
SharePoint 2013 application and
other applications in a dependency
topology view. For more information about dependency topologies, see "Topology and application group management."
to view dependencies between the Office
SharePoint 2013 application and
other applications in a dependency
topology view. For more information about dependency topologies, see "Topology and application group management."
· Top5 Unrecovered Alarm—Latest five unrecovered alarms on the Office SharePoint 2013 host. This field is not displayed if no alarm is generated by the Office SharePoint 2013 application.
Availability Today
The Availability Today area contains the following fields:
· Current Availability—Availability of the Office SharePoint 2013 application.
¡ Click the Weekly History icon![]() to view the availability of the Office
SharePoint 2013 application in the last 7 days.
to view the availability of the Office
SharePoint 2013 application in the last 7 days.
¡ Click
the Monthly History icon![]() to view
the availability of the Office SharePoint 2013 application in
the last 30 days.
to view
the availability of the Office SharePoint 2013 application in
the last 30 days.
· Available Time—Total amount of time that the Office SharePoint 2013 application was available after 00:00 today.
· Unavailable Time—Total amount of time that the Office SharePoint 2013 application was unavailable after 00:00 today.
· Inaccessible Time—Total amount of time that the Office SharePoint 2013 application was inaccessible after 00:00 today.
· Unmanaged Time—Total amount of time that the Office SharePoint 2013 application was unmanaged after 00:00 today.
The statistics collection started when the application monitor was added. An availability time field is not displayed if its value is 0.
CPU Usage Ratio
The CPU Usage Ratio area contains the following fields:
· CPU Usage Ratio dashboard or trend graph—View the area in a dashboard or a trend graph.
¡ Dashboard graph—View the CPU usage ratio of the Office SharePoint 2013 application.
¡ Trend graph—View the changes of the CPU usage ratio for the Office SharePoint 2013 application in a line chart.
· CPU Usage Ratio—CPU usage ratio of the Office SharePoint 2013 application obtained when APM last polled Office SharePoint 2013.
¡ Click
the Set Threshold icon ![]() to set alarm thresholds for the CPU usage
ratio.
to set alarm thresholds for the CPU usage
ratio.
¡ Click
the History Record icon
![]() to view the history graph of the CPU usage
ratio.
to view the history graph of the CPU usage
ratio.
Memory Status
The Memory Status area contains the following fields:
· Idle Memory (MB)—Amount of the idle memory of the Office SharePoint 2013 host. Idle
memory can be allocated for use by processes or the system. Click the History
Record icon ![]() to view the history graph of the idle memory.
to view the history graph of the idle memory.
· In Use (%)—Committed virtual memory usage ratio of the Office SharePoint 2013
host. Committed virtual memory usage ratio = committed memory in use/maximum
committed virtual memory × 100%. Click the History Record
icon ![]() to view the
history graph of the committed virtual
memory usage ratio.
to view the
history graph of the committed virtual
memory usage ratio.
Excel Calculation Services
The Excel Calculation Services area contains the following fields:
· Sessions/Sec—Average number of sessions opened per second by Excel calculation
services. Click the History Record icon ![]() to view the
history graph of the sessions per second.
to view the
history graph of the sessions per second.
· Received Requests/Sec—Average number of active requests received per second by Excel
calculation services. Click the History Record
icon ![]() to view the
history graph of the requests received per second.
to view the
history graph of the requests received per second.
· Active Requests—Number of active requests being processed by Excel calculation
services. Click the History Record icon ![]() to view the
history graph of the active requests.
to view the
history graph of the active requests.
· Error Requests/Sec—Average number of error requests returned per second by Excel
calculation services. Click the History Record
icon ![]() to view the
history graph of the error requests per second.
to view the
history graph of the error requests per second.
· Cached Charts Requested/Sec—Average times of requested charts obtained per second from cached
charts by Excel calculation services. Click the History Record
icon ![]() to view the
history graph of the cached charts requested per second.
to view the
history graph of the cached charts requested per second.
· Reports Requested/Sec—Average number of report requests received per second by Excel
calculation services. Click the History Record
icon ![]() to view the
history graph of the reports requested per second.
to view the
history graph of the reports requested per second.
· Active Sessions—Total number of active sessions in Excel calculation services. Click the History Record icon ![]() to view the
history graph of the active sessions.
to view the
history graph of the active sessions.
Office Search Collector
The Office Search Collector area contains the following fields:
· Idle Threads—Number of threads possessed by the Office search collector and
waiting for documents. Click the History Record
icon ![]() to view the
history graph of the idle threads.
to view the
history graph of the idle threads.
· Document Entries In Memory—Number of document entries in the memory of the Office search collector. Click the History Record icon ![]() to view the
history graph of the document entries in memory.
to view the
history graph of the document entries in memory.
· Active Queue Length—Number of documents waiting for robot threads in the Office search
collector. Click the History Record icon ![]() to view the
history graph of the active queue length.
to view the
history graph of the active queue length.
· Server Objects—Number of servers accessed by the Office search collector during a
crawl. Office SharePoint 2013 creates a server object for a server being
accessed for the first time. Click the History Record
icon ![]() to view the
history graph of the server objects.
to view the
history graph of the server objects.
· Created Server Objects—Number of server objects created by the Office search collector. Click the History Record icon ![]() to view the
history graph of created server objects.
to view the
history graph of created server objects.
· Network Access Threads—Number of threads waiting for responses from remote data storage or
processing responses. Click the History Record
icon ![]() to view the
history graph of the network access threads.
to view the
history graph of the network access threads.
· Threads in Plugins—Number of threads that have been retrieved and are processed by
plugins, such as Ifilter. Click the History Record
icon ![]() to view the
history graph of the threads in plugins.
to view the
history graph of the threads in plugins.
Excel Service Web Front End
The Excel Service Web Front End area contains the following fields:
· Active Requests—Number of active requests being processed by Excel Web services. Click
the History Record icon ![]() to view the
history graph of the active requests.
to view the
history graph of the active requests.
· Requests/Sec—Number of requests received per second by Excel Web services. Click
the History Record icon ![]() to view the
history graph of the requests per second.
to view the
history graph of the requests per second.
Visio Web Access Services
The Visio Web Access Services area contains the following fields:
· Avg Request Process
Time(ms)—Average duration for Visio Web access services to respond to a request. Click the History Record
icon ![]() to view the
history graph of the average request process time.
to view the
history graph of the average request process time.
· Requests Received Per
Second—Number of requests received by Visio Web access services per second. Click the History Record
icon ![]() to view the
history graph of the requests received per second.
to view the
history graph of the requests received per second.
· Static Content Initial
Transmission Time—Average duration for Visio Web
access services to send original HTML and Java scripts to the client. Click the History Record icon ![]() to view the
history graph of the static
content initial transmission time.
to view the
history graph of the static
content initial transmission time.
Access Data Services
The Access Data Services area contains the following fields:
· Active Requests—Number of active requests that are being processed by Access data services. Click the History Record
icon ![]() to view the
history graph of the active requests.
to view the
history graph of the active requests.
· Active Sessions—Number of active sessions for Access data services. Click the History Record icon ![]() to view the
history graph of the active
sessions.
to view the
history graph of the active
sessions.
· Avg Cache Data Get Time—Average duration for Access data services to search data in the
cache. Click the History Record icon ![]() to view the
history graph of the average
cache data get time.
to view the
history graph of the average
cache data get time.
· Avg Result Set Open Time—Average duration for Access data services to open the result set
and return the first data block. Click the History Record
icon ![]() to view the
history graph of the average
result set open time.
to view the
history graph of the average
result set open time.
· Avg Session Time—Average session duration for Access data services at a sampling
interval. Click the History Record icon ![]() to view the
history graph of the average
session time.
to view the
history graph of the average
session time.
· Avg Request Process Time—Average duration for Access data services to process a request at a
sampling interval. Click the History Record
icon ![]() to view the
history graph of the average request process time.
to view the
history graph of the average request process time.
· Active Data Storage Requests—Number of active requests that are sent by Access data services and
are being processed by data storage. Click the History Record
icon ![]() to view the
history graph of the active data storage requests.
to view the
history graph of the active data storage requests.
· Access Workload
Availability—Percentage of logical server
availability for Access workload. Click the History Record
icon ![]() to view the
history graph of the access
workload availability.
to view the
history graph of the access
workload availability.
· Application Workload
Availability—Percentage of logical server
availability for application workload. Click the History Record
icon ![]() to view the
history graph of the application
workload availability.
to view the
history graph of the application
workload availability.
· Avg Data Storage Request
Processing Time—Average duration for data
storage to process a request at the most recent sampling interval. Click the History Record icon ![]() to view the
history graph of the average data storage request processing time.
to view the
history graph of the average data storage request processing time.
· Remaining Access Workload
Capacity—Remaining database capacity for Access
workload. Click the History Record icon ![]() to view the
history graph of the remaining access workload capacity.
to view the
history graph of the remaining access workload capacity.
· Remaining Application
Workload Capacity—Remaining database capacity
for application workload. Click the History Record
icon ![]() to view the
history graph of the remaining application
workload capacity.
to view the
history graph of the remaining application
workload capacity.
Service
APM monitors the following services of Office SharePoint 2013:
· SharePoint Timer Services
· SharePoint Tracing Services
· SharePoint Search Host Controller
· Office Document Conversions Load Balancer
· Office Document Conversions Launcher
The Service area contains the following fields:
· Service Name—Original name of the service.
· Display Name—Display name of the service, which is equivalent to the alias of the service. The Window service console shows display names of services. In most cases, the display name of a service differs from the original name.
· Status—Status of the service when APM last polled Office SharePoint 2013.
Web Content Publishing Management Storage
The Web Content Publishing Management Storage area contains the following fields:
· Name—Name of the Web content publishing management storage.
· Cache Hit Ratio—Hit ratio of the Web content publishing management storage.
· Discarded Objects—Total number of objects removed from the Web content publishing management storage.
· Cache Hits/Sec—Average number of cache hits per second of the Web content publishing management storage.
· Cache Failures/Sec—Average number of cache misses per second of the Web content publishing management storage.
· Cache Flushes/Sec—Average number of cache flushes per second of the Web content publishing management storage.
Word Automation Services
The Word Automation Services area contains the following fields:
· Name—Name of the Word automation service.
· Timer Job Execution Time—Duration of the conversion task.
ActiveMQ
ActiveMQ is an open source message queue product offered by Apache Software Foundation. APM can monitor ActiveMQ 5.8.0 through JMX but does not collect traffic for ActiveMQ.
The following information describes how to add and modify an ActiveMQ application monitor, and view the monitor report.
Adding an ActiveMQ application monitor
To add an ActiveMQ application monitor, follow these restrictions and guidelines:
· Contact the ActiveMQ administrator to enable JMX.
· If JMX requires authentication, obtain the username and password of the ActiveMQ administrator. The username and password are required for adding the application monitor.
· Add the hosts where ActiveMQ is deployed to the IMC platform so that APM can obtain and display network connections of the hosts and their access devices in the application topology. For more information about adding hosts to the IMC platform, see H3C Intelligent Management Center v7.3 Enterprise and Standard Platform Administrator Guide.
To add an ActiveMQ application monitor:
1. Click the Resource tab.
2. Open the Add Application page by using one of the following methods:
¡ From the navigation tree, select Application Manager > Add Application.
¡ From the navigation tree, select Application Manager > Application Monitor. In the application monitor list, click Add.
The Add Application page displays all application types that can be monitored by APM.
3. Click ActiveMQ of the Middleware/Portal Monitor class.
The page for adding an ActiveMQ application monitor opens.
4. Configure the following parameters:
¡ IP Address—Enter the IP address of the ActiveMQ server to be monitored. APM automatically checks the IP address and associates the application monitor with the ActiveMQ server if it is already managed in the IMC platform. To monitor an ActiveMQ server that is already managed in the IMC platform, you can also click Select, and then select the ActiveMQ server in the Select Devices dialog box. For information about selecting an ActiveMQ server, see "Quick start."
¡ Name—Enter a unique application monitor name. As a best practice, name the application monitor as application type_host IP address.
¡ Use Template—Select Enable or Disable from the list.
¡ Template—Click
the Configure icon ![]() next to the Template field to select an existing template. The Template field
is automatically populated with the name of the selected template. For more
information about configuring application templates, see "Configuration management." This field is displayed only when you select Enable from the Use
Template list.
next to the Template field to select an existing template. The Template field
is automatically populated with the name of the selected template. For more
information about configuring application templates, see "Configuration management." This field is displayed only when you select Enable from the Use
Template list.
¡ Description—Enter a description for the application monitor.
¡ Application Monitor Port—Enter the JMX port for the ActiveMQ. This field is available only when you select Disable from the Use Template list.
¡ Polling Interval (min)—Select a polling interval for the application monitor. Options are 1, 2, 3, 4, 5, 10, 20, and 30. The default polling interval is 5 minutes. A shorter polling interval improves real-time data accuracy at the expense of system resources. This field is available only when you select Disable from the Use Template list.
¡ Username/Password—Enter the username and password of the ActiveMQ administrator. The fields are available only when you select Disable from the Use Template list.
¡ Contact—Enter the contact information, such as the name, email address, and telephone number. The default is the username of the operator who created the application monitor. This field is available only when you select Disable from the Use Template list.
¡ APM Server—Select an APM server to monitor the application. The options are in server-address (application-type:n/N) format. The letter n indicates the number of ActiveMQ applications monitored on the APM server. The letter N indicates the total number of applications monitored on the APM server. Server address 127.0.0.1 indicates that APM and the IMC platform are deployed on the same server.
¡ Related Applications—Click Add next to this field. On the Select Application window, enter a partial or complete name to filter applications, select the applications that the ActiveMQ server depends on, and then click OK.
Operating system applications cannot be selected. Operators can view all dependencies of the application in the dependency topology. APM automatically adds the dependencies between the ActiveMQ server and operating system applications by IP address and displays their dependencies in the application topology.
¡ Application Group—Specify an application group for the ActiveMQ server application.
- To specify an existing application group, click Add, select an application group, and then click OK.
- To specify a new application group, click Add Application Group, configure the application group settings, and then click OK.
¡ Detect Application—Select this parameter if you want to enable application detection. APM verifies the application connectivity by using the previous parameter settings, and adds the application monitor only when it can connect to the application. If you do not select this parameter, APM adds the application monitor without verifying the application connectivity.
5. Click OK.
Modifying an ActiveMQ application monitor
Authorized users can modify all parameters except the IP address and the APM server for an ActiveMQ server. When the IP address of a monitored ActiveMQ server changes, operators must add a new application monitor for the ActiveMQ server. The new application monitor cannot inherit the history data from the previous application monitor.
To modify an ActiveMQ application monitor:
1. Click the Resource tab.
2. From the navigation tree, select Application Manager > Application Monitor.
The application monitor list page displays all application monitors.
3. Click the Modify
icon ![]() for the ActiveMQ application monitor you want to modify.
for the ActiveMQ application monitor you want to modify.
The page for modifying the ActiveMQ application monitor opens.
4. Modify the parameters as needed, except the IP address and the APM server.
For more information about parameter settings, see "Adding an ActiveMQ application monitor."
5. Click OK.
Viewing the ActiveMQ application monitor report
After an ActiveMQ application monitor is added, APM collects index data of the application, evaluates the availability and health status, and updates the monitor report. The report shows the index values obtained from the most recent polling of the application.
To view the ActiveMQ application monitor report:
1. Click the Resource tab.
2. From the navigation tree, select Application Manager > Application Monitor.
The application monitor list page displays all application monitors.
3. Click the name of an ActiveMQ application monitor to display the report.
Figure 122 shows part of an ActiveMQ application monitor report.
Figure 122 Part of an ActiveMQ application monitor report

Monitor Information
The Monitor Information area contains the following fields:
· Name—Application monitor name.
· Health State—Health status of the ActiveMQ server.
· IP Address—IP address of the ActiveMQ server.
· Application Type—Type of the monitored application, which is always ActiveMQ for an ActiveMQ application monitor.
· Version—Version of the ActiveMQ server.
· Last Polling Time—Time when APM last polled the ActiveMQ server.
· Relationship—Click the Relationship icon ![]() to view
dependencies between the ActiveMQ server and other applications in a dependency
topology view. For more information about dependency
topologies, see "Topology and application group management."
to view
dependencies between the ActiveMQ server and other applications in a dependency
topology view. For more information about dependency
topologies, see "Topology and application group management."
· Top5 Unrecovered Alarm—Latest five unrecovered alarms on the ActiveMQ server. This field is not displayed if no alarm is generated by the ActiveMQ server.
Availability Today
The Availability Today area contains the following fields:
· Current Availability—Availability of the ActiveMQ server.
¡ Click the Weekly History icon![]() to view the availability of the ActiveMQ
application in the last 7 days.
to view the availability of the ActiveMQ
application in the last 7 days.
¡ Click
the Monthly History icon![]() to view
the availability of the ActiveMQ application in the last 30 days.
to view
the availability of the ActiveMQ application in the last 30 days.
· Available Time—Total amount of time that the ActiveMQ server was available after 00:00 today.
· Unavailable Time—Total amount of time that the ActiveMQ server was unavailable after 00:00 today.
· Inaccessible Time—Total amount of time that the ActiveMQ server was inaccessible after 00:00 today.
· Unmanaged Time—Total amount of time that the ActiveMQ server was unmanaged after 00:00 today.
The statistics collection started when the application monitor was added. An availability time field is not displayed when its value is 0.
OS Information
The OS Information area contains the following fields:
· OS—Operating system of the host where ActiveMQ is deployed.
· Architecture—Architecture of the host where ActiveMQ is deployed.
· Total Kernel Count—Total number of CPU kernels on the host where ActiveMQ is deployed.
· Used Virtual Memory—Used virtual memory size of the OS on the host where ActiveMQ is deployed.
· Total Physical Memory—Total physical memory size of the OS on the host where ActiveMQ is deployed.
· Free Physical Memory—Free physical memory size of the OS on the host where ActiveMQ is deployed.
· Physical Memory Usage Ratio—Usage of
the physical memory on the host where ActiveMQ is deployed. Click the History
Record icon ![]() to view the history graph of the physical
memory usage ratio.
to view the history graph of the physical
memory usage ratio.
· Total Swap Memory—Total swap memory size on the host where ActiveMQ is deployed.
· Free Swap Memory—Free swap memory size on the host where ActiveMQ is deployed.
· Swap Usage Ratio—Usage of the swap memory on the host where ActiveMQ is deployed. Click the History Record icon ![]() to view the
history graph of the swap usage ratio.
to view the
history graph of the swap usage ratio.
Heap Size Information
The Heap Size Information area contains the following fields:
· Current Heap Size—Heap size of ActiveMQ. Click the History Record
icon ![]() to view the
current heap size.
to view the
current heap size.
· Max Heap Size—Assigned maximum heap size of ActiveMQ.
· Committed Heap Size—Committed heap size of ActiveMQ. Click the History Record
icon ![]() to view the
history graph of the committed heap size.
to view the
history graph of the committed heap size.
Thread Information
The Thread Information area contains the following fields:
· Active Thread Count—Number of active threads generated by ActiveMQ. Click the History
Record icon ![]() to view the history graph of the active
threads.
to view the history graph of the active
threads.
· Peak Thread Count—Maximum number of active threads generated by ActiveMQ since ActiveMQ was started. Click the History Record icon ![]() to view the
history graph of the peak threads.
to view the
history graph of the peak threads.
· Daemon Thread Count—Number of daemon threads generated by ActiveMQ. Click the History Record icon ![]() to view the
history graph of the daemon threads.
to view the
history graph of the daemon threads.
· Started Thread Count—Number of threads started by ActiveMQ.
Click the History Record icon ![]() to view the
history graph of the started threads.
to view the
history graph of the started threads.
Class Information
The Class Information area contains the following fields:
· Current Loaded Class Count—Number of classes loaded by ActiveMQ. Click
the History Record icon ![]() to view the
history graph of the current loaded classes.
to view the
history graph of the current loaded classes.
· Total Loaded Class Count—Total number of classes loaded by ActiveMQ.
Click the History Record icon ![]() to view the
history graph of the total loaded classes.
to view the
history graph of the total loaded classes.
· Total Removed Class Count—Total number of classes removed by ActiveMQ. Click the History Record icon ![]() to view the
history graph of the total removed classes.
to view the
history graph of the total removed classes.
ActiveMQ Information
The ActiveMQ Information area contains the following fields:
· Health Status—Health status of ActiveMQ.
· Java VM—Information about the Java VM used by ActiveMQ.
· Data File Directory—Directory where ActiveMQ data files are saved.
· Memory Limit—Maximum memory size of ActiveMQ.
· File Storage Limit—Maximum file storage size of ActiveMQ.
· Temporary Storage Limit—Temporary maximum storage size of ActiveMQ.
Hadoop
Hadoop is an open-source distributed system framework developed by the Apache software foundation. The Hadoop framework includes the following modules:
· Hadoop Distributed File System (HDFS)—A distributed file system that provides data storage services. An HDFS cluster has one name node and multiple data nodes.
· Yet Another Resource Negotiator (YARN)—A resource management system responsible for managing and scheduling resources in clusters. A YARN cluster has one resource manager and multiple node managers.
APM supports monitoring Hadoop 2.7.0 and later versions.
Adding a Hadoop application monitor
APM monitors Hadoop applications through the RESTful API. When you add a Hadoop application monitor, follow these restrictions and guidelines:
· Contact the Hadoop administrator to obtain the IP address and port number of the Hadoop name node. The IP address and port number can be obtained by viewing the following information in the hdfs-site.xml file of the Hadoop installation path:
<property>
<name>dfs.http.address</name>
<value>hadoop-master.imc.com:50070</value>
</property>
· Contact the Hadoop administrator to obtain the IP address and port number of the Hadoop resource manager. The IP address and port number can be obtained by viewing the following information in the yarn-site.xml file of the Hadoop installation path:
<name>yarn.resourcemanager.webapp.address</name>
<value>hadoop-master.imc.com:8088</value>
</property>
· Contact the Hadoop administrator to check whether a username is configured for the HDFS name node and the YARN resource manager, respectively.
· Add the hosts where Hadoop is deployed to the IMC platform so that APM can obtain and display network connections of the hosts and their access devices in the application topology. For more information about adding hosts to the IMC platform, see H3C Intelligent Management Center v7.3 Enterprise and Standard Platform Administrator Guide.
· To view traffic statistics in the monitor report of the Hadoop application, make sure at least one probe is configured in APM. After a Hadoop application monitor is added, APM sends the IP address and service port of the monitored Hadoop application to the probes for traffic collection.
To add a Hadoop application monitor:
1. Click the Resource tab.
2. Open the Add Application page by using one of the following methods:
¡ From the navigation tree, select Application Manager > Add Application.
¡ From the navigation tree, select Application Manager > Application Monitor. In the application monitor list, click Add.
The Add Application page displays all application types that can be monitored by APM.
3. Click Hadoop of the Middleware/Portal Monitor class.
The page for adding a Hadoop application monitor opens.
4. Configure the following parameters:
¡ IP Address—Enter the IP address of the host where the Hadoop name node is deployed. APM automatically checks the IP address and associates the application monitor with the host if it is already managed in the IMC platform. To monitor a host that is already managed in the IMC platform, you can also click Select, and then select the host in the Select Devices dialog box. For information about selecting a host, see "Quick start."
¡ Name—Enter a unique application monitor name. As a best practice, name the application monitor as application type_host IP address.
¡ Use Template—Select Enable or Disable from the list.
¡ Template—Click
the Configure icon ![]() next to the Template field to select an existing template. The Template field
is automatically populated with the name of the selected template. For more
information about configuring application templates, see "Configuration management." This field is displayed only when you select Enable from the Use
Template list.
next to the Template field to select an existing template. The Template field
is automatically populated with the name of the selected template. For more
information about configuring application templates, see "Configuration management." This field is displayed only when you select Enable from the Use
Template list.
¡ Description—Enter a description for the application monitor.
¡ Application Monitor Port—Enter the port number of the Hadoop name node. The default is 50070. This field is available only when you select Disable from the Use Template list.
¡ Traffic Collection Port—Enter the service port number of Hadoop. The default is 50070. This field is displayed only when at least one probe is configured for APM. This field is available only when you select Disable from the Use Template list.
¡ Polling Interval (min)—Select a polling interval for the application monitor. Options are 1, 2, 3, 4, 5, 10, 20, and 30. The default polling interval is 5 minutes. A shorter polling interval improves real-time data accuracy at the expense of system resources. This field is available only when you select Disable from the Use Template list.
¡ Name Node User Name—If a username is configured for the HDFS name node, enter the username.
¡ Resource Manager IP—Enter the IP address of the Hadoop resource manager.
¡ Resource Manager Port—Enter the port number of the Hadoop resource manager.
¡ Resource Manager User Name—If a username is configured for the YARN resource manager, enter the username.
¡ Contact—Enter the contact information, such as the name, email address, and telephone number. The default is the username of the operator who created the application monitor. This field is available only when you select Disable from the Use Template list.
¡ APM Server—Select an APM server to monitor the application. The options are in server-address (application-type:n/N) format. The letter n indicates the number of Hadoop applications monitored on the APM server. The letter N indicates the total number of applications monitored on the APM server. Server address 127.0.0.1 indicates that APM and the IMC platform are deployed on the same server.
¡ Related Applications—Click Add next to this field. On the Select Application window, enter a partial or complete name to filter applications, select the applications that Hadoop depends on, and then click OK.
Operating system applications cannot be selected. Operators can view all dependencies of the application in the dependency topology. APM automatically adds the dependencies between Hadoop and operating system applications by IP address and displays their dependencies in the application topology.
¡ Application Group—Specify an application group for the Hadoop server application.
- To specify an existing application group, click Add, select an application group, and then click OK.
- To specify a new application group, click Add Application Group, configure the application group settings, and then click OK.
¡ Detect Application—Select this parameter if you want to enable application detection. APM verifies the application connectivity by using the previous parameter settings, and adds the application monitor only when it can connect to the application. If you do not select this parameter, APM adds the application monitor without verifying the application connectivity.
5. Click OK.
Modifying a Hadoop application monitor
Authorized users can modify all parameters except the IP address and the APM server for a Hadoop application. When the IP address of a monitored Hadoop changes, operators must add a new application monitor for the Hadoop. The new application monitor cannot inherit the history data from the previous application monitor.
To modify a Hadoop application monitor:
1. Click the Resource tab.
2. From the navigation tree, select Application Manager > Application Monitor.
The application monitor list page displays all application monitors.
3. Click the Modify
icon ![]() for the Hadoop application monitor you want to modify.
for the Hadoop application monitor you want to modify.
The page for modifying the Hadoop application monitor opens.
4. Modify the parameters as needed, except the IP address and the APM server.
For more information about parameter settings, see "Adding a Hadoop application monitor."
5. Click OK.
Viewing the Hadoop application monitor report
After a Hadoop application monitor is added, APM collects index data of the application, evaluates the availability and health status, and updates the monitor report. The report shows the index values obtained from the most recent polling of the application.
To view the Hadoop application monitor report:
1. Click the Resource tab.
2. From the navigation tree, select Application Manager > Application Monitor.
The application monitor list page displays all application monitors.
3. Click the name of a Hadoop application monitor to display the report.
Figure 123 shows part of a Hadoop application monitor report.
Figure 123 Part of a Hadoop application monitor report
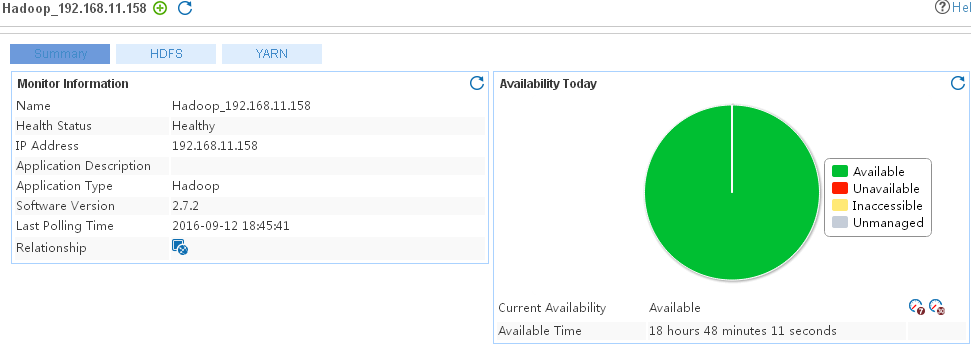
The Hadoop application monitor report has the Summary, HDFS, and YARN tabs. Click each tab to view the corresponding information.
Monitor Information
The Monitor Information area contains the following fields:
· Name—Application monitor name.
· Health Status—Current health status of Hadoop.
· IP Address—IP address of the Hadoop name node.
· Application Description—Description of the Hadoop application.
· Application Type—Type of the monitored application, which is always Hadoop for a Hadoop application monitor.
· Software Version—Version of the monitored Hadoop.
· Last Polling Time—Time when APM last polled the Hadoop.
· Relationship—Click the Relationship icon ![]() to view
dependencies between the Hadoop and other applications in a dependency topology
view. For more information about dependency topologies,
see "Topology and
application group management."
to view
dependencies between the Hadoop and other applications in a dependency topology
view. For more information about dependency topologies,
see "Topology and
application group management."
· Top5 Unrecovered Alarm—Latest five unrecovered alarms on the Hadoop. This field is not displayed if no alarm is generated by the Hadoop.
Availability Today
The Availability Today area contains the following fields:
· Current Availability—Availability of the Hadoop server.
¡ Click the Weekly History icon![]() to view the availability of the Hadoop
application in the last 7 days.
to view the availability of the Hadoop
application in the last 7 days.
¡ Click
the Monthly History icon![]() to view
the availability of the Hadoop application in the last 30 days.
to view
the availability of the Hadoop application in the last 30 days.
· Available Time—Total amount of time that the Hadoop application was available after 00:00 today.
· Unavailable Time—Total amount of time that the Hadoop application was unavailable after 00:00 today.
· Inaccessible Time—Total amount of time that the Hadoop application was inaccessible after 00:00 today.
· Unmanaged Time—Total amount of time that the Hadoop application was unmanaged after 00:00 today.
The statistics collection started when the application monitor was added. An availability time field is not displayed when its value is 0.
HDFS Response Time
The HDFS Response Time area contains the following field:
· HDFS Response Time—Period from the time when APM connects to the HDFS service to the time when it receives a response.
¡ Click
the Set Threshold icon ![]() to set alarm
thresholds for the HDFS response
time.
to set alarm
thresholds for the HDFS response
time.
¡ Click
the History Record icon ![]() to view the
history graph of the HDFS response time.
to view the
history graph of the HDFS response time.
YARN Response Time
The YARN Response Time area contains the following field:
· YARN Response Time—Period from the time when APM connects to the YARN service to the time when it receives a response.
¡ Click
the Set Threshold icon ![]() to set alarm
thresholds for the YARN response
time.
to set alarm
thresholds for the YARN response
time.
¡ Click
the History Record icon ![]() to view the
history graph of the YARN response time.
to view the
history graph of the YARN response time.
HDFS Memory Usage
The HDFS Memory Usage area contains the following fields:
· HDFS Committed Heap Memory—Heap memory size assigned to the JVM by the operating system.
· HDFS Initialized Heap Memory—Initial heap memory size of the JVM.
· HDFS Max Heap Memory—Maximum heap memory size of the JVM.
· HDFS Used Heap Memory—Used heap memory size of the JVM.
· HDFS Committed Non-Heap Memory—Non-heap memory size assigned to the JVM by the operating system.
· HDFS Initialized Non-Heap Memory—Initial non-heap memory size of the JVM.
· HDFS Max Non-Heap Memory—Maximum non-heap memory size of the JVM.
· HDFS Used Non-Heap Memory—Used non-heap memory size of the JVM.
YARN Memory Usage
The YARN Memory Usage area contains the following fields:
· YARN Committed Heap Memory—Heap memory size assigned to the JVM by the operating system.
· YARN Initialized Heap Memory—Initial heap memory size of the JVM.
· YARN Max Heap Memory—Maximum heap memory size of the JVM.
· YARN Used Heap Memory—Used heap memory size of the JVM.
· YARN Committed Non-Heap Memory—Non-heap memory size assigned to the JVM by the operating system.
· YARN Initialized Non-Heap Memory—Initial non-heap memory size of the JVM.
· YARN Max Non-Heap Memory—Maximum non-heap memory size of the JVM.
· YARN Used Non-Heap Memory—Used non-heap memory size of the JVM.
Application Traffic
The Application Traffic area contains the following fields:
· Last Hour's Traffic—Total traffic sent and received by the Hadoop application over the last 1 hour.
· Today's Traffic—Total traffic sent and received by the Hadoop application since 00:00 today.
NameNode Information
The NameNode Information area contains the following fields:
· NameNode Host—Host where the HDFS name node is deployed.
· Start Time—Time when the HDFS name node was started.
· Hadoop Version—Version of Hadoop.
· Compiled Information—Compilation information of Hadoop.
· HDFS Cluster ID—ID of the cluster to which the HDFS name node belongs.
· BlockPool ID—ID of the block pool of the HDFS name node.
· NameNode Status—Current status of the HDFS name node.
· Safe Mode—Whether the HDFS is in safe mode.
DataNode Information
The DataNode Information area contains the following fields:
· Live DataNodes—Number of active data nodes.
· Live DataNodes Percentage—Ratio of the active data nodes to the total data nodes.
· Dead DataNodes—Number of dead data nodes.
· Dead DataNodes Percentage—Ratio of the dead data nodes to the total data nodes.
· Decommissioning DataNodes—Number of data nodes that are being decommissioned from the cluster.
· Decommissioned DataNodes—Number of data nodes that have been decommissioned from the cluster.
· Corrupted DataNodes—Number of corrupted data nodes.
File System Usage
The File System Usage area contains the following fields:
· DFS Total—Total size of the DFS.
· DFS Used—Used size of the DFS.
· DFS Used Percentage—Ratio of the used size to the total size of the DFS.
· DFS Used Non-DFS—Used size of the non-DFS.
· DFS Available—Available size of the DFS.
· DFS Available Percentage—Ratio of the available size to the total size of the DFS.
· DFS Used Block Pool—Used size of the DFS block pool.
· DFS Used Block Pool Percentage—Ratio of the used size to the total size of the DFS block pool.
· DFS Total Files—Total number of files in the DFS.
Block Information
The Block Information area contains the following fields:
· Blocks Capacity—Total capacity of the blocks in the HDFS.
· Total Blocks—Total number of blocks.
· Lost Blocks—Number of lost blocks.
· Corrupted Blocks—Number of corrupted blocks.
· Excessive Blocks—Number of excessive blocks.
· Under-Replicated Blocks—Number of blocks that are being replicated.
· Suspended Replication Blocks—Number of blocks for which replication is suspended.
· Scheduled Replication Blocks—Number of blocks that are scheduled to be replicated.
· Suspended Deletion Blocks—Number of blocks for which deletion is suspended.
Snapshot Directories
The Snapshot Directories area contains the following fields:
· Path—Path of the snapshot directory in the HDFS.
· Snapshot Count—Number of snapshots created in the snapshot directory.
· Snapshot Quota—Quota of snapshots that can be created in the snapshot directory.
· Directory Modified At—Time when the snapshot directory was most recently modified.
· Permission—User permission of the snapshot directory.
· Owner—Owner of snapshot directory.
· Group—User group to which the owner of the snapshot directory belongs.
Snapshots
The Snapshots area contains the following fields:
· Snapshot ID—ID of the snapshot.
· Directory—Directory where the snapshot is stored.
· Snapshot Modified At—Time when the snapshot was most recently modified.
Live DataNodes
The Live DataNodes area contains the following fields:
· DataNode Host—Host where the active data node is deployed.
· DataNode IP Address—IP of the host where the active data node is deployed.
· DataNode HTTP Service—HTTP service IP address of the active data node.
· DataNode Status—Current status of the active data node.
· HDFS Version—Hadoop version of the active data node.
· Time Since Last Contact—Period of time since the most recent communication between the active data node with the name node.
· DataNode Blocks—Number of blocks stored on the active data node.
· DataNode Total Capacity—Total capacity of the file system on the active data node.
· DataNode Used—Used size of the file system on the active data node.
· DataNode Used Percentage—Ratio of the used size to the total size of the file system on the active data node.
· DataNode Available—Available size of the file system on the active data node.
· DataNode Available Percentage—Ratio of the available size to the total size of the file system on the active data node.
· DataNode Used Non-NFS—Used size of the non-NFS on the active data node.
· DataNode Used Block Pool—Used size of the block pool on the active data node.
· DataNode Used Block Pool Percentage—Ratio of the used size to the total size of the block pool on the active data node.
Dead DataNodes
The Dead DataNodes area contains the following fields:
· Dead DataNode Host—Host where the dead data node is deployed.
· Dead DataNode IP Address—IP of the host where the dead data node is deployed.
· Dead DataNode Time Since Last Contact—Period of time since the most recent communication between the dead data node with the name node.
· Decommissioned—Whether the dead data node is decommissioned from the cluster.
Decommissioning DataNodes
The Decommissioning DataNodes area contains the following fields:
· Decommissioning DataNode Host—Host where the data node that is being decommissioned from the YARN is deployed.
· Decommissioning DataNode IP Address—IP of the host where the data node that is being decommissioned from the YARN is deployed.
· Decommissioning DataNode Time Since Last Contact—Period of time since the most recent communication between the data node that is being decommissioned from the YARN with the name node.
Node Manager Information
The Node Manager Information area contains the following fields:
· Live NodeManagers—Number of active node managers in the YARN.
· Decommissioned NodeManagers—Number of decommissioned node managers in the YARN.
· Lost NodeManagers—Number of lost node managers in the YARN.
· Unhealthy NodeManagers—Number of unhealthy node managers in the YARN.
· Rebooted NodeManagers—Number of rebooted node managers in the YARN.
Application Information
The Application Information area contains the following fields:
· Submitted Applications—Number of submitted applications.
· Running Applications—Number of running applications.
· Suspended Applications—Number of suspended applications.
· Completed Applications—Number of completed applications.
· Killed Applications—Number of killed applications.
· Failed Applications—Number of applications that fail execution because of calculation errors or other errors.
Live Node Manager
The Live Node Manager area contains the following fields:
· NodeManager Host—Host where the active node manager is deployed.
· Node ID—ID of the active node manager.
· Rack—Rack where the active node manager is located.
· NodeManager Status—Current status of the active node manager.
· NodeManager HTTP Service—HTTP service IP address of the active node manager.
· Last Updated At—Time when the active data manager was most recently updated.
· Health Report—Health status report of the active node manager.
· YARN Version—Hadoop version of the active node manager.
· Used Memory—Used memory size of the active node manager.
· Available Memory—Available memory size of the active node manager.
Applications
The Applications area contains the following fields:
· Application ID—ID of the application.
· Name—Name of the application.
· Type—Type of the application.
· Current Status—Current status of the application.
· Final Status—Final status of the application.
· Progress—Execution progress of the application.
· User—User to which the application belongs.
· Queue—Queue where the application is located.
· YARN Cluster ID—ID of the cluster where the application is located.
· Started At—Time when the application execution was started.
· Finished At—Time when the application execution was completed.
· Elapsed Time—Duration of the application execution.
Oracle GoldenGate
The Oracle GoldenGate (OGG) is a log-based, structured data replication software platform.
APM supports monitoring Oracle GoldenGate 12.1.2.1.0 through CLI.
Adding an Oracle GoldenGate application monitor
When you add an OGG application monitor, follow these restrictions and guidelines:
· To monitor an OGG application through CLI, enable Telnet or SSH on the operating system running OGG.
· Obtain the username and password of the Telnet or SSH user who has the OGG administrator's privileges.
· Contact the OGG administrator to obtain the path to execute GGSCI.
· Add OGG hosts to the IMC platform so that APM can obtain and display network connections of the hosts and their access devices in the application topology. For more information about adding hosts to the IMC platform, see H3C Intelligent Management Center v7.3 Enterprise and Standard Platform Administrator Guide.
To add an Oracle GoldenGate application monitor:
1. Click the Resource tab.
2. Open the Add Application page by using one of the following methods:
¡ From the navigation tree, select Application Manager > Add Application.
¡ From the navigation tree, select Application Manager > Application Monitor. In the application monitor list, click Add.
The Add Application page displays all application types that can be monitored by APM.
3. Click Oracle GoldenGate of the Middleware/Portal Monitor class.
The page for adding an Oracle GoldenGate application monitor opens.
4. Configure the following parameters:
¡ IP Address—Enter the IP address of the host on which the OGG application to be monitored is installed. APM automatically checks the IP address and associates the application monitor with the host if the host is already managed in the IMC platform. If the host is already managed in the IMC platform, you can also click Select, and then select the host in the Select Devices window. For information about selecting a host, see "Selecting devices."
¡ Name—Enter a unique application monitor name. As a best practice, name the application monitor as application type_host IP address.
¡ Use Template—Select Enable or Disable from the list.
¡ Template—Click the Configure icon ![]() next to the Template field to select an
existing template. The Template field is
automatically populated with the name of the selected template. This field is
displayed only when you select Enable from the Use Template list.
next to the Template field to select an
existing template. The Template field is
automatically populated with the name of the selected template. This field is
displayed only when you select Enable from the Use Template list.
¡ Description—Enter a description for the application monitor.
¡ Polling Interval (min)—Select a polling interval for the application monitor. Available options are 1, 2, 3, 4, 5, 10, 20, and 30. The default polling interval is 5 minutes. A shorter polling interval improves real-time data accuracy at the expense of system resources. This field is available only when you select Disable from the Use Template list.
¡ Monitor Type—Select the protocol (SSH or Telnet) through which APM monitors the OGG application, and
then click the Configure icon ![]() to configure related parameters. This field is available only when you select Disable from the
Use Template list.
to configure related parameters. This field is available only when you select Disable from the
Use Template list.
When SSH is selected, configure the following parameters:
- Edit SSH Parameters—Select this option if you want to manually configure SSH parameters for APM. Make sure the SSH settings are the same as those on the OGG host.
- Select an Existing Template—Select this option if you want to select an existing SSH template for APM. For information about setting SSH parameter templates, see H3C Intelligent Management Center v7.3 Enterprise and Standard Platform Administrator Guide.
- Authentication Mode—Select the authentication mode for SSH users. Options are Password, Private Key, Password + Private Key, Password + Super Password, Private Key + Super Password, and Password + Private Key + Super Password.
The following parameters to be configured vary with authentication modes:
|
Parameter |
Remarks |
|
User Name |
Enter the SSH username. The user must have the OGG administrator's privilege. |
|
Password |
Enter the password of the SSH user. |
|
Private Key File |
Enter the directory of the SSH private key file or browse to the file. |
|
Private Key Password |
Enter the password to decrypt the SSH private key file. |
|
Super Password |
Enter the super password with which an SSH user can elevate privileges after login. |
- Port—Enter the SSH port on the OGG host.
- Timeout (1-120 seconds)—Enter the maximum time period that APM waits for an SSH response from OGG. The value range is 1 to 120 seconds and the default is 10 seconds. If no SSH response is received from OGG within the timeout time, APM considers that the interaction has failed.
- Retries (1-5)—Enter how many times APM retries to send SSH packets to the OGG host.
When Telnet is selected, configure the following parameters:
- Edit Telnet Parameters—Select this option if you want to manually configure Telnet parameters for APM. Make sure the Telnet settings are the same as those on the OGG host.
- Select an Existing Template—Select this option if you want to select an existing Telnet template for APM. For information about setting Telnet parameter templates, see H3C Intelligent Management Center v7.3 Enterprise and Standard Platform Administrator Guide.
- Authentication Mode—Select the authentication mode for Telnet users. Options are Password (No Operator or Super/Manager), Username + Password, Super/Manager Password, Password + Super/Manager Password (No Operator), Username + Password + Super/Manager Password, No Username + No Password, and Username + No Password.
The following parameters to be configured vary with authentication modes.
|
Parameter |
Remarks |
|
User Name |
Enter the Telnet username. The user must have the OGG administrator's privilege. |
|
Password |
Enter the password of the Telnet user. |
|
Super Password |
Enter the super password with which a Telnet user can elevate privileges after login. |
- Timeout (1-60 seconds)—Enter the maximum time period that APM waits for a Telnet response from the OGG host. The value range is 1 to 60 seconds and the default is 4 seconds. If no Telnet response is received from the OGG host within the timeout time, APM considers that the interaction has failed.
¡ GGSCI Path—Enter the GGSCI execution path.
¡ Contact—Enter the contact information, such as the name, email address, and telephone number. The default is the username of the operator who created the application monitor. This field is available only when you select Disable the Use Template list.
¡ APM Server—Select an APM server to monitor the application. The options are in server-address (application-type:n/N) format. The letter n indicates the number of Oracle GoldenGate applications monitored on the APM server. The letter N indicates the total number of applications monitored on the APM server. Server address 127.0.0.1 indicates that APM and the IMC platform are deployed on the same server.
¡ Related Applications—Click Add next to this field. On the Select Application window, enter a partial or complete name to filter applications, select the applications that OGG depends on, and then click OK.
Operating system applications cannot be selected. APM automatically adds the dependencies between OGG and operating system applications by IP address and displays their dependencies in the application topology.
Operators can view all dependencies of the application in the dependency topology.
¡ Application Group—Specify an application group for the OGG application.
- To specify an existing application group, click Add, select an application group, and then click OK.
- To specify a new application group, click Add Application Group, configure the application group settings, and then click OK.
¡ Detect Application—Select this parameter if you want to enable application detection. Application detection enables APM to verify the connectivity to the application by using the previous parameter settings. APM adds the application monitor only when it can connect to the application. When this parameter is not selected, APM adds the application monitor without verifying the application connectivity.
5. Click OK.
Modifying an Oracle GoldenGate application monitor
Authorized users can modify all parameters except the IP address and the APM server for an OGG application monitor. When the IP address of a monitored OGG host changes, operators must add a new application monitor for the host. However, the new application monitor cannot inherit the history data from the previous application monitor.
To modify an Oracle GoldenGate application monitor:
1. Click the Resource tab.
2. From the navigation tree, select Application Manager > Application Monitor.
The application monitor list page opens.
3. Click the Modify
icon ![]() for the OGG
application monitor you want to modify.
for the OGG
application monitor you want to modify.
The page for modifying the OGG application monitor opens.
4. Modify the parameters as needed, except the IP address and the APM server.
For more information about parameter settings, see "Adding an Oracle GoldenGate application monitor."
5. Click OK.
Viewing the Oracle GoldenGate application monitor report
After an OGG application monitor is added, APM collects index data of the application, evaluates the availability and health status, and updates the monitor report. The report shows the index values obtained from the most recent polling of the application.
To access the Oracle GoldenGate application monitor report:
1. Click the Resource tab.
2. From the navigation tree, select Application Manager > Application Monitor.
The application monitor list page displays all application monitors.
3. Click the name of an OGG application monitor to display the report.
Figure 124 shows part of an OGG application monitor report.
Figure 124 Part of an OGG application monitor report
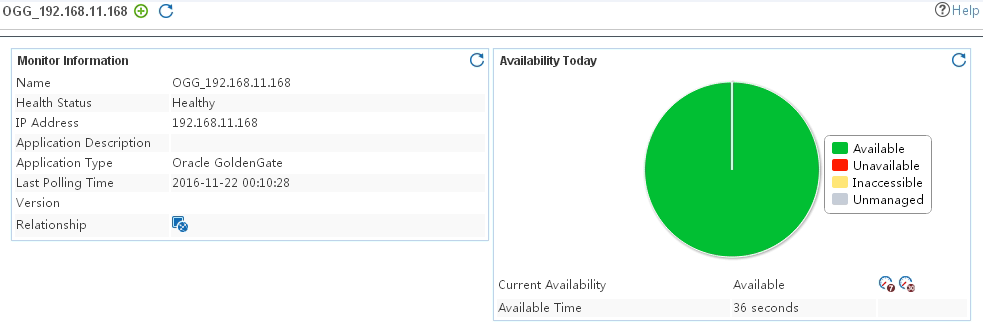
Monitor Information
The Monitor Information area contains the following fields:
· Name—Application monitor name.
· Health Status—Health status of the OGG application.
· IP Address—IP address of the OGG host.
· Application Description—Description of the OGG application.
· Application Type—Type of the monitored application, which is Oracle GoldenGate.
· Last Polling Time—Time when APM last polled the OGG application.
· Version—Version of the OGG application.
· Relationship—Click the Relationship
icon ![]() to view dependencies
between OGG and other
applications in a dependency topology view. For more information
about dependency topologies, see "Topology and application group management."
to view dependencies
between OGG and other
applications in a dependency topology view. For more information
about dependency topologies, see "Topology and application group management."
· Top5 Unrecovered Alarm—Latest five unrecovered alarms on the OGG application. The alarm level is identified by color: yellow for minor alarms, orange for major alarms, and red for critical alarms. This field is not displayed if no alarm is generated by the OGG application.
Availability Today
The Availability Today area contains the following fields:
· Current Availability—Availability of the OGG application.
¡ Click
the Weekly History icon![]() to view the availability of the OGG
application in the last 7 days.
to view the availability of the OGG
application in the last 7 days.
¡ Click
the Monthly History icon![]() to view the availability of the OGG application in the last 30 days.
to view the availability of the OGG application in the last 30 days.
· Available Time—Total amount of time that the OGG application was available after 00:00 today.
· Unavailable Time—Total amount of time that the OGG application was unavailable after 00:00 today.
· Inaccessible Time—Total amount of time that the OGG application was inaccessible after 00:00 today.
· Unmanaged Time—Total amount of time that the OGG application was unmanaged after 00:00 today.
The statistics collection started when the application monitor was added. An availability time field is not displayed when its value is 0.
Program Info
The Program Info area contains the following fields:
· Program—MANAGER, EXTRACT, or REPLICAT.
· Status—Process running status.
· Group—Name of the process.
· Lag at Chkpt—Lag time from reading the check point at the source to writing it to the target.
· Time Since Chkpt—Time since the last check point.
Total Statistics
The Total Statistics area contains the following fields:
· Group—Name of process.
· Statistics Since Time—Time when the statistics started.
· Statistics Last Time—Last time when statistics was performed.
· Total Inserts—Total number of insert operations.
· Total Updates—Total number of update operations.
· Total Befores—Total number of before operations.
· Total Deletes—Total number delete operations.
· Total Discards—Total number of discard operations.
· Total Operations—Total number of operations.
Added Statistics
The Added Statistics area contains the following fields:
· Group—Name of the process.
· Added Inserts—Number of insert operations added between two collections.
· Added Updates—Number of update operations added between two collections.
· Added Befores—Number of before operations added between two collections.
· Added Deletes—Number of delete operations added between two collections.
· Added Discards—Number of discard operations added between two collections.
· Added Operations—Total number of operations added between two collections.
Message
The Message area contains the following fields:
· Time—Time when the log was recorded.
· Message—Content of the log.
RabbitMQ
The Advanced Message Queuing Protocol (AMQP) is an open standard application layer protocol for message-oriented middleware. RabbitMQ is an implementation of AMQP written in the Erlang language.
APM supports monitoring RabbitMQ 3.5.0 and later versions.
Adding a RabbitMQ application monitor
APM monitors RabbitMQ applications through agents or the REST service. When you add a RabbitMQ application monitor, follow these restrictions and guidelines:
· To monitor a RabbitMQ application through an agent, deploy the agent on the host where the RabbitMQ application is installed. For more information about agents, see "APM agent management."
· To monitor a RabbitMQ application through the REST service:
¡ Contact the RabbitMQ administrator to obtain the username and password of a user who has the RabbitMQ administrator's privileges.
¡ Enable the Web console feature on RabbitMQ by using the rabbitmq-plugins.bat enable rabbitmq_management command.
¡ Contact the RabbitMQ administrator to obtain the REST service port number. The default is 15627. If the default setting is modified, view the port number of the rabbitmq_management service on the host where RabbitMQ is deployed. The port number of the rabbitmq_management service is the port number of the REST service.
· Add the hosts where RabbitMQ is deployed to the IMC platform so that APM can obtain and display network connections of the hosts and their access devices in the application topology. For more information about adding hosts to the IMC platform, see H3C Intelligent Management Center v7.3 Enterprise and Standard Platform Administrator Guide.
To add a RabbitMQ application monitor:
1. Click the Resource tab.
2. Open the Add Application page by using one of the following methods:
¡ From the navigation tree, select Application Manager > Add Application.
¡ From the navigation tree, select Application Manager > Application Monitor. In the application monitor list, click Add.
The Add Application page displays all application types that can be monitored by APM.
3. Click RabbitMQ of the Middleware/Portal Monitor class.
The page for adding a RabbitMQ application monitor opens.
4. Configure the following parameters:
¡ IP Address—Enter the IP address of the host where the RabbitMQ application to be monitored is installed. APM automatically checks the IP address and associates the application monitor with the host if it is already managed in the IMC platform. To monitor a host that is already managed in the IMC platform, you can also click Select, and then select the RabbitMQ name node in the Select Devices dialog box. For information about selecting a host, see "Quick start."
¡ Name—Enter a unique application monitor name. As a best practice, name the application monitor as application type_host IP address.
¡ Use Template—Select Enable or Disable from the list.
¡ Template—Click
the Configure icon ![]() next to the Template field to select an existing template. The Template field
is automatically populated with the name of the selected template. For more
information about configuring application templates, see "Configuration management." This field is displayed only when you select Enable from the Use
Template list.
next to the Template field to select an existing template. The Template field
is automatically populated with the name of the selected template. For more
information about configuring application templates, see "Configuration management." This field is displayed only when you select Enable from the Use
Template list.
¡ Description—Enter a description for the application monitor.
¡ Application Monitor Port—Enter the REST service port number of RabbitMQ. The default is 15672. This field is available only when you select Disable from the Use Template list.
¡ Polling Interval (min)—Select a polling interval for the application monitor. Options are 1, 2, 3, 4, 5, 10, 20, and 30. The default polling interval is 5 minutes. A shorter polling interval improves real-time data accuracy at the expense of system resources. This field is available only when you select Disable from the Use Template list.
¡ Username/Password—Enter the username and password of the RabbitMQ administrator. The fields are available only when you select Disable from the Use Template list.
¡ Contact—Enter the contact information, such as the name, email address, and telephone number. The default is the username of the operator who created the application monitor. This field is available only when you select Disable from the Use Template list.
¡ APM Server—Select an APM server to monitor the application. The options are in server-address (application-type:n/N) format. The letter n indicates the number of RabbitMQ applications monitored on the APM server. The letter N indicates the total number of applications monitored on the APM server. Server address 127.0.0.1 indicates that APM and the IMC platform are deployed on the same server.
¡ Related Applications—Click Add next to this field. On the Select Application window, enter a partial or complete name to filter applications, select the applications that the RabbitMQ server depends on, and then click OK.
Operating system applications cannot be selected. Operators can view all dependencies of the application in the dependency topology. APM automatically adds the dependencies between RabbitMQ and operating system applications by IP address and displays their dependencies in the application topology.
¡ Application Group—Specify an application group for the RabbitMQ application.
- To specify an existing application group, click Add, select an application group, and then click OK.
- To specify a new application group, click Add Application Group, configure the application group settings, and then click OK.
¡ Detect Application—Select this parameter if you want to enable application detection. APM verifies the application connectivity by using the previous parameter settings, and adds the application monitor only when it can connect to the application. If you do not select this parameter, APM adds the application monitor without verifying the application connectivity.
5. Click OK.
Modifying a RabbitMQ application monitor
Authorized users can modify all parameters except the IP address and the APM server for a RabbitMQ application. When the IP address of a monitored RabbitMQ host changes, operators must add a new application monitor for the host. The new application monitor cannot inherit the history data from the previous application monitor.
To modify a RabbitMQ application monitor:
1. Click the Resource tab.
2. From the navigation tree, select Application Manager > Application Monitor.
The application monitor list page displays all application monitors.
3. Click the Modify
icon ![]() for the RabbitMQ application monitor you want to modify.
for the RabbitMQ application monitor you want to modify.
The page for modifying the RabbitMQ application monitor opens.
4. Modify the parameters as needed, except the IP address and the APM server.
For more information about parameter settings, see "Adding a RabbitMQ application monitor."
5. Click OK.
Viewing the RabbitMQ application monitor report
After a RabbitMQ application monitor is added, APM collects index data of the application, evaluates the availability and health status, and updates the monitor report. The report shows the index values obtained from the most recent polling of the application.
To view the RabbitMQ application monitor report:
1. Click the Resource tab.
2. From the navigation tree, select Application Manager > Application Monitor.
The application monitor list page displays all application monitors.
3. Click the name of a RabbitMQ application monitor to display the report.
Figure 125 shows part of a RabbitMQ application monitor report.
Figure 125 Part of a RabbitMQ application monitor report
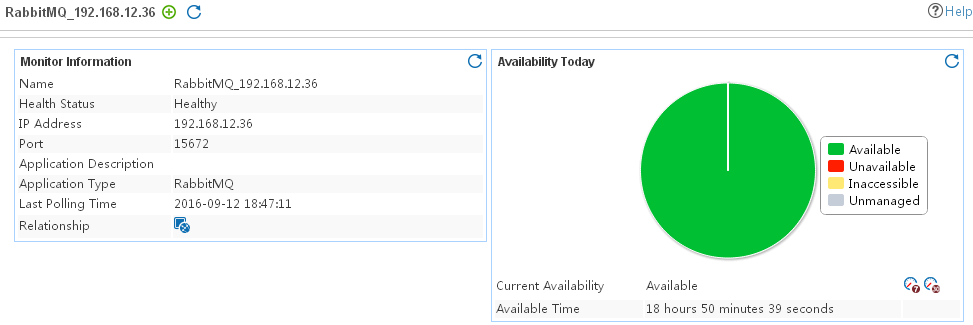
Monitor Information
The Monitor Information area contains the following fields:
· Name—Application monitor name.
· Health Status—Health status of the RabbitMQ.
· IP Address—IP address of the RabbitMQ host.
· Port—Listening port number of the RabbitMQ application.
· Application Description—Description of the RabbitMQ application.
· Application Type—Type of the monitored application, which is always RabbitMQ for a RabbitMQ application monitor.
· Last Polling Time—Time when APM last polled the RabbitMQ.
· Relationship—Click the Relationship icon ![]() to view
dependencies between the RabbitMQ and other applications in a dependency
topology view. For more information about dependency
topologies, see "Topology and application group management."
to view
dependencies between the RabbitMQ and other applications in a dependency
topology view. For more information about dependency
topologies, see "Topology and application group management."
· Top5 Unrecovered Alarm—Latest five unrecovered alarms on the RabbitMQ. This field is not displayed if no alarm is generated by the RabbitMQ.
Availability Today
The Availability Today area contains the following fields:
· Current Availability—Availability of the RabbitMQ server.
¡ Click the Weekly History icon![]() to view the availability of the RabbitMQ
application in the last 7 days.
to view the availability of the RabbitMQ
application in the last 7 days.
¡ Click
the Monthly History icon![]() to view
the availability of the RabbitMQ application in the last 30 days.
to view
the availability of the RabbitMQ application in the last 30 days.
· Available Time—Total amount of time that the RabbitMQ application was available after 00:00 today.
· Unavailable Time—Total amount of time that the RabbitMQ application was unavailable after 00:00 today.
· Inaccessible Time—Total amount of time that the RabbitMQ application was inaccessible after 00:00 today.
· Unmanaged Time—Total amount of time that the RabbitMQ application was unmanaged after 00:00 today.
The statistics collection started when the application monitor was added. An availability time field is not displayed when its value is 0.
Queued Messages
The Queued Messages area contains the following fields:
· Queued Messages—Number of queued messages.
· Unacknowledged Messages—Number of unacknowledged messages.
· Total Messages—Total number of messages.
Click the History Record
icon ![]() for an index
to view the history graph of the corresponding index data.
for an index
to view the history graph of the corresponding index data.
Messages Rate
The Messages Rate area contains the following fields:
· Publish Messages Rate—Ratio of the published messages to the total messages.
· Deliver/Get Messages Rate—Ratio of the delivered messages to the total messages.
· Acknowledged Messages Rate—Ratio of the acknowledged messages to the total messages.
Click the History Record
icon ![]() for an index
to view the history graph of the corresponding index data.
for an index
to view the history graph of the corresponding index data.
Exchanges Public Rate
The Exchanges Public Rate area contains the following fields:
· Incoming Publish Rate—Number of messages received by the RabbitMQ application per second.
· Outcoming Publish Rate—Number of messages sent by the RabbitMQ application per second.
Click the History Record
icon ![]() for an index
to view the history graph of the corresponding index data.
for an index
to view the history graph of the corresponding index data.
Exchanges Details
The Exchange Details area contains the following fields:
· Name—Name of the message exchange.
· Type—Type of message exchange. Options are:
¡ Direct
¡ Fanout
¡ Topic
¡ Headers
Connection
The Connection area contains the following fields:
· Peer Address—IP addresses of both ends of the connection.
· Protocol—AMQP protocol used by the connection.
· Receive Rate—Ratio of the messages received over the connection to the total messages.
· Send Rate—Ratio of the messages sent over the connection to the total messages.
· State—Status of the connection.
Click the History Record icon
![]() for an index
to view the history graph of the corresponding index data.
for an index
to view the history graph of the corresponding index data.
Nodes
The Nodes area contains the following fields:
· Name—Name of the node.
· Socket Descriptors Used—Number of used socket descriptors on the node.
· Socket Descriptors Available—Number of available socket descriptors on the node.
· Socket Descriptors Utilization—Ratio of the used socket descriptors to the total socket descriptors on the node.
· Erlang Processes Used—Number of used Erlang processes on the node.
· Erlang Processes Available—Number of available Erlang processes on the node.
· Erlang Processes Utilization—Ratio of the used Erlang processes to the total Erlang processes on the node.
· Memory Used—Used memory size on the node.
· Memory Available—Available memory size on the node.
· Memory Utilization—Ratio of the used memory size to the total memory size on the node.
Click the History Record icon
![]() for an index
to view the history graph of the corresponding index data. Click the Set Threshold icon
for an index
to view the history graph of the corresponding index data. Click the Set Threshold icon ![]() for
an index to set alarm thresholds for the corresponding index.
for
an index to set alarm thresholds for the corresponding index.
Queues
The Queues area contains the following fields:
· Name—Name of the message queue.
· Exclusive—Number of exclusive queues.
· Messages Ready—Number of ready messages in the queue.
· Messages Unacknowledged—Number of unacknowledged messages in the queue.
· Total Messages—Total number of messages in the queue.
· Incoming Rate—Ratio of the messages that enter the queue to the total messages.
· Deliver/Get Rate—Ratio of the delivered/got messages to the total messages in the queue.
· Acknowledged Rate—Ratio of the acknowledged messages to the total messages in the queue.
Click the History Record icon
![]() for an index
to view the history graph of the corresponding index data.
for an index
to view the history graph of the corresponding index data.
Channels
The Channels area contains the following fields:
· Channel—Name of the message channel.
· User Name—Username bound to the channel.
· Prefetch Messages—Number of messages prefetched for the channel.
· Unacknowledged Messages—Number of unacknowledged messages in the channel.
· Unconfirmed Messages—Number of unconfirmed messages in the channel.
· Publish Rate—Ratio of the published messages to the total messages.
· Deliver/Get Rate—Ratio of the delivered/got messages to the total messages in the channel.
· Acknowledged Rate—Ratio of the acknowledged messages to the total messages in the channel.
Click the History Record icon
![]() for an index
to view the history graph of the corresponding index data.
for an index
to view the history graph of the corresponding index data.
TongLINK/Q
TongLINK/Q is message-oriented middleware developed by TongTech to provide synchronous transfer, asynchronous transfer, store and forward, and reliable transfer to secure data delivery between different applications. APM supports monitoring TongLINK/Q applications.
Adding a TongLINK/Q application monitor
When you add application monitors for TongLINK/Q, follow these guidelines:
· Set the application monitor port to be the same value as the ListenPort attribute value for [SuperviseBroker] in the tlsys.conf file located in the TongLINK/Q installation folder.
· Add TongLINK/Q hosts to the IMC platform so that APM can obtain and display network connections of the hosts and their access devices in the application topology. For more information about adding hosts to the IMC platform, see H3C Intelligent Management Center v7.3 Enterprise and Standard Platform Administrator Guide.
To add a TongLINK/Q application monitor:
1. Click the Resource tab.
2. Open the Add Application page by using one of the following methods:
¡ From the navigation tree, select Application Manager > Add Application.
The page displays all application types that can be monitored by APM.
¡ From the navigation tree, select Application Manager > Application Monitor, and then click Add on the application monitor list page.
3. Click TongLINK/Q of the Middleware/Portal Monitor class.
The page for adding a TongLINK/Q application monitor opens.
4. Configure the following parameters for the application monitor:
¡ IP Address—Enter the IP address of the TongLINK/Q server to be monitored. APM automatically checks the IP address and associates the application monitor with the TongLINK/Q server if it is already managed in the IMC platform. To monitor a TongLINK/Q server that is already managed in the IMC platform, you can also click Select, and then select the TongLINK/Q server in the Select Devices dialog box. For information about selecting a TongLINK/Q server, see "Quick start."
¡ Name—Enter a unique application monitor name. As a best practice, name the application monitor as application type_host IP address.
¡ Use Template—Select Enable or Disable from the list.
¡ Template—Click the Configure icon ![]() next to the Template field to select an
existing template. The Template field is
automatically populated with the name of the selected template. For more
information about configuring application templates, see "Configuration management." This field is displayed only when you select Enable from the Use Template
list.
next to the Template field to select an
existing template. The Template field is
automatically populated with the name of the selected template. For more
information about configuring application templates, see "Configuration management." This field is displayed only when you select Enable from the Use Template
list.
¡ Description—Enter a description for the application monitor.
¡ Application Monitor Port—Enter the port on TongLINK/Q. This field is available only when you select Disable from the Use Template list.
¡ Polling Interval (min)—Select a polling interval for the application monitor. Options are 1, 2, 3, 4, 5, 10, 20, and 30. The default polling interval is 5 minutes. A shorter polling interval improves real-time data accuracy at the expense of system resources. This field is available only when you select Disable from the Use Template list.
¡ Contact—Enter the contact information, such as the name, email address, and telephone number. The default is the username of the operator who created the application monitor. This field is available only when you select Disable from the Use Template list.
¡ APM Server—Select an APM server to monitor the application. The options are in server-address (application-type:n/N) format. The letter n indicates the number of TongLINK/Q applications monitored on the APM server. The letter N indicates the total number of applications monitored on the APM server. Server address 127.0.0.1 indicates that APM and the IMC platform are deployed on the same server.
¡ Related Applications—Click Add next to this field. On the Select Application window, enter a partial or complete name to filter applications, select the applications that the TongLINK/Q server depends on, and then click OK.
Operating system applications cannot be selected. Operators can view all dependencies of the application in the dependency topology. APM automatically adds the dependencies between the TongLINK/Q server and operating system applications by IP address and displays their dependencies in the application topology.
¡ Application Group—Specify an application group for the TongLINK/Q server application.
- To specify an existing application group, click Add, select an application group, and then click OK.
- To specify a new application group, click Add Application Group, configure the application group settings, and then click OK.
¡ Detect Application—Select this parameter if you want to enable application detection. APM verifies the application connectivity by using the previous parameter settings, and adds the application monitor only when it can connect to the application. If you do not select this parameter, APM adds the application monitor without verifying the application connectivity.
5. Click OK.
Modifying a TongLINK/Q application monitor
Authorized users can modify all parameters except the IP address and the APM server for a TongLINK/Q application monitor. When the IP address of a monitored TongLINK/Q host changes, operators must add a new application monitor for the host. The new application monitor cannot inherit the history data from the previous application monitor.
To modify a TongLINK/Q application monitor:
1. Click the Resource tab.
2. From the navigation tree, select Application Manager > Application Monitor.
The page displays all application types that can be monitored by APM.
3. Click the Modify icon ![]() for the TongLINK/Q
application monitor you want to modify.
for the TongLINK/Q
application monitor you want to modify.
The page for modifying the TongLINK/Q application monitor opens.
4. Modify the parameters as needed, except the IP address and the APM server.
For more information about parameter settings, see "Adding a TongLINK/Q application monitor."
5. Click OK.
Viewing the TongLINK/Q application monitor report
After a TongLINK/Q application monitor is added, APM collects index data of the application, evaluates the availability and health status, and updates the monitor report. The report shows the index values obtained from the most recent polling of the application.
To access the TongLINK/Q application monitor report:
1. Click the Resource tab.
2. From the navigation tree, select Application Manager > Application Monitor.
The application monitor list page displays all application monitors.
3. Click the name of a TongLINK/Q application monitor to display the report.
Figure 126 shows part of a TongLINK/Q application monitor report.
Figure 126 Part of a TongLINK/Q application monitor report
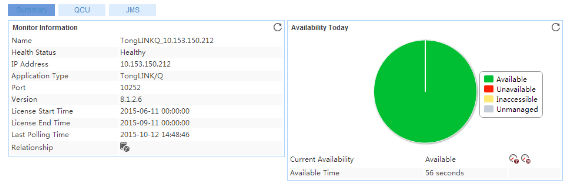
The TongLINK/Q application monitor report contains the Summary, QCU, and JMS tabs. Click each tab to view corresponding information about the TongLINK/Q application.
Monitor Information
The Monitor Information area contains the following fields:
· Name—Application monitor name.
· Health Status—Health status of the TongLINK/Q application.
· IP Address—IP address of the TongLINK/Q host.
· Application Type—Type of the monitored application, which is always TongLINK/Q.
· Port—Port number used by the TongLINK/Q application.
· Version—Version of the TongLINK/Q application.
· License Start Time—Time when the license takes effect on the TongLINK/Q application.
· License End Time—Time when the license for the TongLINK/Q application expires.
· Last Polling Time—Time when APM last polled TongLINK/Q.
· Relationship—Click the Relationship icon ![]() to view dependencies between the TongLINK/Q
application and other applications in a dependency topology view. For more information about dependency topologies, see "Topology and application group management."
to view dependencies between the TongLINK/Q
application and other applications in a dependency topology view. For more information about dependency topologies, see "Topology and application group management."
· Top5 Unrecovered Alarm—Latest five unrecovered alarms on the TongLINK/Q host. The alarm level is identified by color: yellow for minor alarms, orange for major alarms, and red for critical alarms. This field is not displayed if no alarm is generated by the TongLINK/Q application.
Availability Today
The Availability Today area contains the following fields:
· Current Availability—Availability of the TongLINK/Q application.
¡ Click
the Weekly History icon ![]() to view the availability of the TongLINK/Q application in the last 7 days.
to view the availability of the TongLINK/Q application in the last 7 days.
¡ Click
the Monthly History icon ![]() to view the availability of the TongLINK/Q
application in the last 30 days.
to view the availability of the TongLINK/Q
application in the last 30 days.
· Available Time—Total amount of time that the TongLINK/Q application was available after 00:00 today.
· Unavailable Time—Total amount of time that the TongLINK/Q application was unavailable after 00:00 today.
· Inaccessible Time—Total amount of time that the TongLINK/Q application was inaccessible after 00:00 today.
· Unmanaged Time—Total amount of time that the TongLINK/Q application was unmanaged after 00:00 today.
The statistics collection started when the application monitor was added. An availability time field is not displayed if its value is 0.
Node
A node is a set of TongLINK/Q instances required for system running, including core processes, memory resources, the log system, data storage, and application processes. APM monitors TongLINK/Q by node.
The Node area contains the following fields:
· Node Name—Name of the node.
· System Status—System status of the node.
· Max. Programs—Maximum number of programs supported by the node.
· Max. Instances—Maximum number of instances supported by the node.
· Max. Branches in Single Cluster—Maximum number of branches supported by the node in a cluster.
· Max. Network Groups—Maximum number of network groups supported by the node.
· Max. Network Transactions—Maximum number of network transactions supported by the node.
· Queue Creation and Recovery Threads—Number of queue creation and recovery threads configured for the node.
· Sending Connections—Number of sending connections configured for the node.
· Receiving Connections—Number of receiving connections configured for the node.
Page Monitor Processes
A page monitor process monitors queues of messages and sends signals to the queue management process to handle the messages. Signals are sent in special situations such as the lifecycle of a message ends and message reading by the application times out.
The Page Monitor Processes area contains the following field:
· Page Monitor Processes—Number of page monitor processes configured for a node.
Sending Processes
A sending process sends messages located in queues in a QCU. Each node can have multiple sending processes, and each sending process can have multiple connections.
The Sending Processes area contains the following fields:
· Sending Processes—Number of current sending processes.
· Max. Sending Processes—Maximum number of sending processes supported by the node.
· Sending Processes Usage—Usage of the sending processes.
Receiving Processes
A receiving process receives messages, and then places the messages in corresponding queues.
The Receiving Processes area contains the following fields:
· Receiving Processes—Number of current receiving processes.
· Max. Receiving Processes—Maximum number of receiving processes supported by a node.
· Receiving Processes Usage—Usage of the receiving processes.
JMS Broker Processes
Java Message Service (JMS) is an API provided by the Java platform to the message-oriented middleware for asynchronous communication between two applications or in a distributed system. A JMS broker process communicates with the JMS client to send and receive messages.
The JMS Broker Processes area contains the following fields:
· JMS Broker Processes—Number of current JMS broker processes.
· Max. JMS Brokers—Maximum number of JMS brokers supported by a node.
· JMS Broker Processes Usage—Usage of the JMS broker processes.
Thin Client Processes
The Thin Client Processes area contains the following fields:
· Thin Client Processes—Number of processes that communicate with the thin client broker in TongLINK/Q.
· Max. Thin Clients—Maximum number of thin clients supported by a node.
· Thin Client Processes Usage—Usage of the thin client processes.
TLQ System Process
TLQ system processes contain node monitor processes, remote management processes, and JNDI broker processes.
The TLQ System Process area contains the following fields:
· Process ID—ID of the TLQ system process.
· Configuration ID—Configuration ID of the TLQ system process.
· Process Name—Name of the TLQ system process.
· Status—Status of the TLQ system process.
· Listening Port—Port number that the TLQ system process listens to.
QCU Monitor Information
A queue control unit (QCU) runs separately in a node. It monitors and manages queues and messages in the queues.
The QCU Monitor Information area contains the following fields:
· QCU—QCU name.
· QCU Status—Status of the QCU.
· Remote Queues—Number of remote queues in the QCU.
· Cluster Queues—Number of cluster queues in the QCU.
· Virtual Queues—Number of virtual queues in the QCU.
· Available Messages in Dynamic Sending Queue—Number of available messages in a dynamic sending queue in the QCU.
· Data Entries in Sending Queue—Number of data entries in a sending queue in the QCU.
· Data Entries in Local Queue—Number of data entries in a local queue in the QCU.
· Signal Lamps—Number of signal lamps in the QCU.
QCU Space Information
The QCU Space Information area contains the following fields:
· QCU—QCU name.
· Non-Persistent Space in Dynamic Sending Queue—Size of the non-persistent space in a dynamic sending queue in the QCU.
· Persistent Space in Dynamic Sending Queue—Size of the persistent space in a dynamic sending queue in the QCU.
· Dynamic Space in Local Queue—Size of the dynamic space in a local queue in the QCU.
· Non-Persistent Space in Dynamic Local Queue—Size of the non-persistent space in a dynamic local queue in the QCU.
· Queue Sending Swap—Size of the sending swap for a queue in the QCU.
· Queue Receiving Swap—Size of the receiving swap for a queue in the QCU.
· Queue Share Memory—Size of the share memory for a queue in the QCU.
BQS Monitor Information
The BQS Monitor Information area contains the following fields:
· QCU—QCU name.
· Sending Buffer—Size of the sending buffer for the Buffer Queue System (BQS) in the QCU.
· Receiving Buffer—Size of the receiving buffer for the BQS in the QCU.
· Share Memory—Size of the share memory for the BQS in the QCU.
· Share Memories—Number of share memory resources for the BQS in the QCU.
History Messages in QCU
History messages include buffer messages and file messages. Buffer messages refer to pieces of user data in the memory. File messages are sent and received in file format. One file message corresponds to one file on a hard disk.
The History Messages in QCU area contains the following fields:
· QCU—QCU name.
· Buffer Messages Successfully Sent—Number of buffer messages that have been successfully sent in the QCU.
· File Messages Successfully Sent—Number of file messages that have been successfully sent in the QCU.
· Buffer Messages Successfully Received—Number of buffer messages that have been successfully received in the QCU.
· File Messages Successfully Received—Number of file messages that have been successfully received in the QCU.
· Buffer Messages Failed to Send—Number of buffer messages that failed to be sent in the QCU.
· File Messages Failed to Send—Number of file messages that failed to be sent in the QCU.
· Buffer Messages Failed to Receive—Number of buffer messages that failed to be received in the QCU.
· File Messages Failed to Receive—Number of file messages that failed to be received in the QCU.
QCU Process
The QCU Process area contains the following fields:
· QCU—QCU name.
· Total Processes—Total number of processes for the QCU.
· Sending Processes—Number of sending processes for the QCU.
· Receiving Processes—Number of receiving processes for the QCU.
· Thin Client Brokers—Number of thin client brokers for the QCU.
· JMS Brokers—Number of JMS brokers for the QCU.
· Publish/Subscribe Brokers—Number of publish/subscribe brokers for the QCU.
Sending Queues
A sending queue stores messages that are to be sent to a remote node.
The Sending Queues area contains the following fields:
· QCU—Name of the QCU to which the sending queue belongs.
· Sending Queues—Number of sending queues in the QCU.
· Max. Sending Queues—Maximum number of sending queues in the QCU.
· Sending Queues Usage—Usage of the sending queues in the QCU.
Local Queues
Local queues are physical queues created on local nodes. Local queues store messages transferred from remote networks, messages sent by local applications, event messages generated by the system, and system management messages.
The Local Queues area contains the following fields:
· QCU—Name of the QCU to which the local queue belongs.
· Local Queues—Number of local queues in the QCU.
· Max. Local Queues—Maximum number of local queues in the QCU.
· Local Queues Usage—Usage of the local queues in the QCU.
Sending Queue
The Sending Queues area contains the following fields:
· QCU—Name of the QCU to which the sending queue belongs.
· Queue Name—Name of the sending queue.
· Queue Status—Status of the sending queue.
· Existing Sending Connections—Whether or not the sending queue includes sending connections. Options are:
¡ 0—No sending connections are configured.
¡ 1—Sending connections exist.
· Sending Connection—Sending connection corresponding to the queue.
· Sending Process ID—Sending process ID for the queue.
· Connection Type—Connection type of the sending queue. Options are:
¡ 0—Permanent connection.
¡ 1—On-demand connection.
· Connection IP—Connection IP address of the queue.
· Connection Port—Connection port number of the queue.
· Sending Process Status—Sending process status of the queue.
· Connection Status—Connection status of the queue.
· Link Status—Link status of the queue.
· Configured Messages—Number of messages configured for the queue.
· Used Messages—Number of used messages in the queue.
· Remaining Messages—Number of remaining messages in the queue.
· Occupied Space—Size of the occupied space in the queue.
· Remaining Space—Size of the remaining space in the queue.
Local Queue
The Local Queues area contains the following fields:
· QCU—Name of the QCU to which the local queue belongs.
· Queue Name—Name of the local queue.
· Queue Status—Status of the local queue.
· Waiting Consumers—Number of waiting consumers for the local queue.
· Usage Type—Usage type of the local queue.
· Trigger Type—TongLINK/Q starts message handling processes based on any of the following trigger modes:
¡ N—None. TongLINK/Q does not start message processing.
¡ F—OnFirst. TongLINK/Q starts message processing when the local queue has the first message in Ready state.
¡ E—OnEvery. TongLINK/Q starts message processing each time when the local queue has a message in Ready state.
¡ A—OnAmount. TongLINK/Q starts message processing when the local queue has a specific number of messages.
¡ D—OnDirect. TongLINK/Q starts message processing when the number of messages in the local queue exceeds the product of current handling processes and the TrigAmount attribute value.
· Trigger Program No.—Sequence number of the trigger program for the queue. TongLINK/Q starts the corresponding message handling process based on the sequence number.
· Configured Messages—Number of messages configured for the local queue.
· Queued Messages—Total number of used messages in the local queue.
· Remaining Messages—Number of remaining messages in the local queue.
· Occupied Space—Size of the occupied space in the local queue.
· Remaining Space—Size of the remaining space in the local queue.
Sending Connection
The Sending Connection area contains the following fields:
· QCU—Name of the QCU to which the sending connection belongs.
· Sending Process—Sending process of the connection.
· Connection Name—Name of the sending connection.
· Connection Status—Status of the sending connection.
Receiving Process
The Receiving Process area contains the following fields:
· QCU—Name of the QCU to which the receiving process belongs.
· Process ID—ID of the receiving process.
· Process Status—Status of the receiving process.
· Listening IP—IP address that the receiving process listens to.
· Port Number—Port number of the receiving process.
· Description Table ID—ID of the description table for the receiving process.
· Process ID—ID of the receiving process.
· Duration—Period of time that the receiving process operates.
· Total Number—Total number of receiving processes.
Sending Process
The Sending Process area contains the following fields:
· QCU—Name of the QCU to which the sending process belongs.
· ID—ID of the sending process.
· Process Status—Status of the sending process.
· Description Table ID—ID of the description table for the sending process.
· Process ID—ID of the process.
· Sending Connections—Number of sending connections for the sending process.
· Duration—Period of time that the sending process operates.
· Total Number—Total number of sending processes.
JMS Broker
The JMS Broker area contains the following fields:
· QCU—Name of the QCU to which the JMS broker belongs.
· Monitor Status—Monitor status of the JMS broker.
· Monitor ID—Monitor ID of the JMS broker.
· Monitor Name—Monitor name of the JMS broker.
· Monitor Start Time—Time when the JMS broker monitoring started.
· Consumers—Number of consumers for the JMS broker.
· Producers—Number of producers for the JMS broker.
· Produced Messages—Number of produced messages for the JMS broker.
· Consumed Messages—Number of consumed messages for the JMS broker.
JMS Broker Connection
The JMS Broker Connection area contains the following fields:
· QCU—Name of the QCU to which the JMS broker that creates the connection belongs.
· Total Number—Total number of JMS broker connections.
· Monitor Status—Monitor status of the JMS broker connection.
· Monitor ID—Monitor ID of the JMS broker connection.
· Monitor Name—Monitor name of the JMS broker connection.
· Monitor Start Time—Time when the JMS broker connection monitoring started.
· Consumers—Number of consumers for the JMS broker connection.
· Producers—Number of producers for the JMS broker connection.
· Produced Messages—Number of produced messages for the JMS broker connection.
· Consumed Messages—Number of consumed messages for the JMS broker connection.
JMS Broker Connection Session
The JMS Broker Connection Session area contains the following fields:
· QCU—Name of the QCU to which the JMS broker connection that creates the session belongs.
· Broker ID—Broker ID of the JMS broker connection session.
· Connection ID—Connection ID of the JMS broker connection session.
· Connection Name—Connection name of the JMS broker connection session.
· Client IP—Client IP address of the JMS broker connection session. The client connects to the TongLINK/Q application through the JMS broker.
· Login Name—Login name of the JMS broker connection session.
· Client ID—Client ID of the JMS broker connection session.
· Established at—Time when the JMS broker connection session was established.
· Producers—Number of producers for the JMS broker connection session.
· Consumers—Number of consumers for the JMS broker connection session.
· Published Messages—Number of messages published by the JMS broker connection session.
· Consumed Messages—Number of messages consumed by the JMS broker connection session.
· Client Version—Client version of the JMS broker connection session.
· Total Number—Total number of JMS broker connection sessions.
WebSphere MQ
WebSphere MQ is a message-oriented middleware launched by IBM to provide unified and reliable methods for communication between different applications. It is available on a large number of platforms, including Unix, Linux, Windows, OS/2, and AS/400.
APM can monitor WebSphere MQ 6.0. This section describes how to add and modify a WebSphere MQ application monitor, and helps you view the monitor report.
Adding a WebSphere MQ application monitor
APM monitors the WebSphere MQ application through the server channel of WebSphere MQ. When you add application monitors for WebSphere MQ, follow these guidelines:
· Add WebSphere MQ hosts to the IMC platform so that APM can obtain and display network connections of the hosts and their access devices in the application topology. For more information about adding hosts to the IMC platform, see H3C Intelligent Management Center v7.3 Enterprise and Standard Platform Administrator Guide.
· To view traffic statistics in the monitor report of the WebSphere MQ application, make sure at least one probe is configured in APM. After a WebSphere MQ application monitor is added, APM sends the IP address and service port of the monitored WebSphere MQ application to the probes for traffic collection.
To add a WebSphere MQ application monitor:
1. Click the Resource tab.
2. Open the Add Application page by using one of the following methods:
¡ From the navigation tree, select Application Manager > Add Application.
The page displays all application types that can be monitored by APM.
¡ From the navigation tree, select Application Manager > Application Monitor, and then click Add on the application monitor list page.
3. Click WebSphere MQ of the Middleware/Portal Monitor class.
The page for adding a WebSphere MQ application monitor opens.
4. Configure the following parameters for the application monitor:
¡ IP Address—Enter the IP address of the WebSphere MQ server to be monitored. APM automatically checks the IP address and associates the application monitor with the WebSphere MQ server if it is already managed in the IMC platform. To monitor a WebSphere MQ server that is already managed in the IMC platform, you can also click Select, and then select the WebSphere MQ server in the Select Devices dialog box. For information about selecting an WebSphere MQ server, see "Quick start."
¡ Name—Enter a unique application monitor name. As a best practice, name the application monitor as application type_host IP address.
¡ Use Template—Select Enable or Disable from the list.
¡ Template—Click
the Configure icon ![]() next to the Template field to select an existing template. The Template field
is automatically populated with the name of the selected template. For more
information about configuring application templates, see "Configuration management." This field is displayed only when you select Enable from the Use
Template list.
next to the Template field to select an existing template. The Template field
is automatically populated with the name of the selected template. For more
information about configuring application templates, see "Configuration management." This field is displayed only when you select Enable from the Use
Template list.
¡ Description—Enter a description for the application monitor.
¡ Application Monitor Port—Enter the port on WebSphere MQ. This field is available only when you select Disable from the Use Template list.
¡ Traffic Collection Port—Enter the service port numbers for WebSphere MQ. This field is displayed only when at least one probe is configured for APM. This field is available only when you select Disable from the Use Template list.
¡ Polling Interval (min)—Select a polling interval for the application monitor. Options are 1, 2, 3, 4, 5, 10, 20, and 30. The default polling interval is 5 minutes. A shorter polling interval improves real-time data accuracy at the expense of system resources. This field is available only when you select Disable from the Use Template list.
¡ Server Channel—Enter the name of the server channel through which APM obtains performance index data of WebSphere MQ. This field is available only when you select Disable from the Use Template list.
¡ CCSID—Enter the coded character set ID of WebSphere MQ. This field is available only when you select Disable from the Use Template list.
¡ Contact—Enter the contact information, such as the name, email address, and telephone number. The default is the username of the operator who created the application monitor. This field is available only when you select Disable from the Use Template list.
¡ APM Server—Select an APM server to monitor the application. The options are in server-address (application-type:n/N) format. The letter n indicates the number of WebSphere MQ applications monitored on the APM server. The letter N indicates the total number of applications monitored on the APM server. Server address 127.0.0.1 indicates that APM and the IMC platform are deployed on the same server.
¡ Related Applications—Click Add next to this field. On the Select Application window, enter a partial or complete name to filter applications, select the applications that the WebSphere MQ server depends on, and then click OK.
Operating system applications cannot be selected. Operators can view all dependencies of the application in the dependency topology. APM automatically adds the dependencies between the WebSphere MQ server and operating system applications by IP address and displays their dependencies in the application topology.
¡ Application Group—Specify an application group for the WebSphere MQ server application.
- To specify an existing application group, click Add, select an application group, and then click OK.
- To specify a new application group, click Add Application Group, configure the application group settings, and then click OK.
¡ Detect Application—Select this parameter if you want to enable application detection. APM verifies the application connectivity by using the previous parameter settings, and adds the application monitor only when it can connect to the application. If you do not select this parameter, APM adds the application monitor without verifying the application connectivity.
5. Click OK.
Modifying a WebSphere MQ application monitor
Authorized users can modify all parameters except the IP address and the APM server for a WebSphere MQ application monitor. When the IP address of a monitored WebSphere MQ host changes, operators must add a new application monitor for the host. The new application monitor cannot inherit the history data from the previous application monitor.
To modify a WebSphere MQ application monitor:
1. Click the Resource tab.
2. From the navigation tree, select Application Manager > Application Monitor.
The page displays all application types that can be monitored by APM.
3. Click the Modify icon ![]() for the WebSphere MQ application monitor you want to modify.
for the WebSphere MQ application monitor you want to modify.
The page for modifying the WebSphere MQ application monitor opens.
4. Modify the parameters as needed, except the IP address and the APM server.
For more information about parameter settings, see "Adding a WebSphere MQ application monitor."
5. Click OK.
Viewing the WebSphere MQ application monitor report
After a WebSphere MQ application monitor is added, APM collects index data of the application, evaluates the availability and health status, and updates the monitor report. The report shows the index values obtained from the most recent polling of the application.
To access the WebSphere MQ application monitor report:
1. Click the Resource tab.
2. From the navigation tree, select Application Manager > Application Monitor.
The application monitor list page displays all application monitors.
3. Click the name of a WebSphere MQ application monitor to display the report.
Figure 127 shows part of a WebSphere MQ application monitor report.
Figure 127 Part of a WebSphere MQ application monitor report

Monitor Information
The Monitor Information area contains the following fields:
· Name—Application monitor name.
· Health State—Health status of the WebSphere MQ application.
· IP Address—IP address of the WebSphere MQ host.
· Application Type—Type of the monitored application, which is always WebSphere MQ.
· Version—Version number of WebSphere MQ.
· Last Polling Time—Time when APM last polled WebSphere MQ.
· Relationship—Click the Relationship icon ![]() to view dependencies between the WebSphere
MQ application and other applications in a dependency topology view. For
more information about dependency topologies, see "Topology and application group management."
to view dependencies between the WebSphere
MQ application and other applications in a dependency topology view. For
more information about dependency topologies, see "Topology and application group management."
· Top5 Unrecovered Alarm—Latest five unrecovered alarms on the WebSphere MQ host. The alarm level is identified by color: yellow for minor alarms, orange for major alarms, and red for critical alarms. This field is not displayed if no alarm is generated by the WebSphere MQ application.
Availability Today
The Availability Today area contains the following fields:
· Current Availability—Availability of the WebSphere MQ application.
¡ Click
the Weekly History icon![]() to view the availability of the WebSphere
MQ application in the last 7 days.
to view the availability of the WebSphere
MQ application in the last 7 days.
¡ Click
the Monthly History icon![]() to view the availability of the WebSphere
MQ application in the last 30 days.
to view the availability of the WebSphere
MQ application in the last 30 days.
· Available Time—Total amount of time that the WebSphere MQ application was available after 00:00 today.
· Unavailable Time—Total amount of time that the WebSphere MQ application was unavailable after 00:00 today.
· Inaccessible Time—Total amount of time that the WebSphere MQ application was inaccessible after 00:00 today.
· Unmanaged Time—Total amount of time that the WebSphere MQ application was unmanaged after 00:00 today.
The statistics collection started when the application monitor was added. An availability time field is not displayed if its value is 0.
Response Time
The Response Time area contains the following field:
· Response Time—Round trip response time for the WebSphere MQ request.
¡ Click
the Set Threshold icon ![]() to set alarm thresholds for the response
time.
to set alarm thresholds for the response
time.
¡ Click
the History Record icon
![]() to view the history graph of the response
time.
to view the history graph of the response
time.
Application Traffic
APM collects WebSphere MQ application traffic based on the IP address of the host and the traffic collection port used by the application.
The Application Traffic area contains the following fields:
· Last Hour's Traffic—Total traffic sent and received by the WebSphere MQ application over the last 1 hour.
· Today's Traffic—Total traffic sent and received by the WebSphere MQ application since 00:00 today.
Queue Manager
The Queue Manager area contains the following fields:
· Queue Manager Name—Name of the queue manager.
· Queue Manager Status—Current status of queue manager.
· Connection Count—Current number of connections to the queue manager.
Channel Status Count
The Channel Status Count area contains the following fields:
· Running Status Count—Number of channels in running state.
· Stopped Status Count—Number of channels in stopped state.
· Exception Status Count—Number of channels in exceptional state.
Queue
WebSphere MQ stores messages in queues until other applications process them.
The Queue area contains the following fields:
· Name—Name of the queue managed by WebSphere MQ.
· Current Queue Depth—Number of messages stored in the queue.
· Open Input Count—Number of messages being added to the queue.
· Open Output Count—Number of messages being taken from the queue.
· Max. Queue Depth—Maximum number of messages allowed to be stored in the queue.
· Queue Message Usage—Current queue depth to the maximum queue depth in percentage.
· More—Click More to view all queues.
Channel
The Channel area contains the following fields:
· Name—Name of the channel managed by WebSphere MQ.
· State—Status of the channel when APM last polled WebSphere MQ.
· Host Connected—Name of the host receiving messages from the channel.
· Bytes Sent—Number of bytes sent by the channel since channel startup.
· Bytes Received—Number of bytes received by the channel since the channel startup.
· Sending Buffer—Number of bytes sent by the channel.
· Receiving Buffer—Number of bytes received by the channel.
Listener
The Listener area contains the following fields:
· Name—Name of the listener managed by WebSphere MQ.
· State—Status of the listener when APM last polled WebSphere MQ.
· Session Count—Number of sessions between the listener and its clients when APM last polled WebSphere MQ.
· Max. Concurrent Connections—Maximum number of concurrent connections supported by the listener. Connections exceeding the limit cannot be established.
· Port—TCP port on which the listener listens.
SAP monitor
APM provides the ability to monitor the availability and performance of SAP R/3 Release 4.6C (Red Hat version) to promptly detect bottlenecks in SAP applications.
Prerequisites
Before you can monitor SAP in APM, complete the tasks for IMC as described in this section.
If IMC is installed on a Windows server, complete the following provisioning task:
1. Download SAP JavaConnector [sapjco-ntintel-2.1.8] from http://service.sap.com/connectors.
2. Decompress the package, and copy and paste the file librfc32.dll to the C:\WINDOWS\system32 directory, and the files sapjco.jar and sapjcorfc.dll to the \apmserver\repository\sap\jars directory in the IMC installation path.
3. Check whether files msvcr71.dll and msvcp71.dll exist in the C:\WINDOWS\system32 directory. If they do not exist, copy and paste them from another Windows operating system to this directory.
4. Restart IMC.
If IMC is installed on a Linux server, complete the following provisioning task:
1. Download SAP JavaConnector [sapjco-linuxintel-2.1.10] from http://service.sap.com/connectors.
2. Decompress the package, and copy and paste files librfccm.so and libsapjcorfc.so to the /apmserver/jre/lib/i386/server directory in the IMC installation path, and the file sapjco.jar to the /apmserver/repository/sap/jars directory in the IMC installation path.
3. Restart IMC.
Adding a SAP application monitor
APM monitors SAP through SAP Java Connector. When you add application monitors for SAP, follow these guidelines:
· Add SAP hosts to the IMC platform so that APM can obtain and display network connections of the hosts and their access devices in the application topology. For more information about adding hosts to the IMC platform, see H3C Intelligent Management Center v7.3 Enterprise and Standard Platform Administrator Guide.
· Obtain the following information from the SAP system administrator:
¡ Username
¡ Password
¡ Client
¡ System instance
¡ Language
To add a SAP application monitor:
1. Click the Resource tab.
2. Open the Add Application page by using one of the following methods:
¡ From the navigation tree, select Application Manager > Add Application.
The page displays all application types that can be monitored by APM.
¡ From the navigation tree, select Application Manager > Application Monitor, and then click Add on the application monitor list page.
3. Click SAP of the SAP Monitor class.
The page for adding a SAP application monitor opens.
4. Configure the following parameters:
¡ IP Address—Enter the IP address of the host on which the SAP application to be monitored is installed. APM automatically checks the specified IP address and associates the application monitor with the host managed in the IMC platform. If the host is already added to the IMC platform, you can also click Select, and then select the host in the Select Devices window. For information about selecting a host, see "Quick start."
¡ Name—Enter a unique application monitor name. As a best practice, name the application monitor as application type_host IP address.
¡ Use Template—Select Enable or Disable from the list.
¡ Template—Click
the Configure icon ![]() next to the Template field to select an existing
template. The Template field is automatically populated with the name of the selected
template. For more information about configuring application templates, see
"Configuration management." This field is displayed only when you select Enable from the Use Template list.
next to the Template field to select an existing
template. The Template field is automatically populated with the name of the selected
template. For more information about configuring application templates, see
"Configuration management." This field is displayed only when you select Enable from the Use Template list.
¡ Description—Enter a description for the application monitor to aid maintenance.
¡ Polling Interval (min)—Select a polling interval for the application monitor. Options are 1, 2, 3, 4, 5, 10, 20, and 30. The default polling interval is 5 minutes. A shorter polling interval provides more accurate realtime data, but consumes more system resources. This field is available only when you select Disable from the Use Template list.
¡ Username/Password—Enter the username and password to access the SAP application to be monitored. The fields are available only when you select Disable from the Use Template list.
¡ Client—Enter the client ID of the SAP application to be monitored. This field is available only when you select Disable from the Use Template list.
¡ System Instance—Enter the instance number of SAP application to be monitored. This field is available only when you select Disable from the Use Template list.
¡ Language—Enter the language used by the SAP application to be monitored. This field is available only when you select Disable from the Use Template list.
¡ Contact—Enter user contact information, such as the name, email address, and telephone number. The default is the username of the operator who created the application monitor. This field is available only when you select Disable from the Use Template list.
¡ APM Server—Select an APM server to monitor the application. The options are in server-address (application-type:n/N) format. The letter n indicates the number of SAP applications monitored on the APM server. The letter N indicates the total number of applications monitored on the APM server. Server address 127.0.0.1 indicates that APM and the IMC platform are deployed on the same server.
¡ Related Applications—Click Add next to this field. On the Select Application window, enter a partial or complete name to filter applications, select the applications that SAP depends on, and then click OK.
Operating system applications cannot be selected. Operators can view all dependencies of the application in the dependency topology. APM automatically adds the dependencies between SAP and operating system applications by IP address and displays their dependencies in the application topology.
¡ Application Group—Specify an application group for the SAP application.
- To specify an existing application group, click Add, select an application group, and then click OK.
- To specify a new application group, click Add Application Group, configure the application group settings, and then click OK.
¡ Detect Application—Select this parameter if you want to enable application detection. Application detection enables APM to verify connection to the application by using the previous parameter settings, and to determine whether to add the application monitor based on the verification result. APM adds the application monitor only when it can connect to the application. When this parameter is not selected, APM adds the application monitor without verifying the connection.
5. Click OK.
Modifying a SAP application monitor
Authorized users can modify all parameters except the IP address and the APM server for a SAP application monitor. When the IP address of a monitored SAP host changes, operators must add a new application monitor for the host. However, the new application monitor cannot inherit the history data from the previous application monitor.
To modify a SAP application monitor:
1. Click the Resource tab.
2. From the navigation tree, select Application Manager > Application Monitor.
The application monitor list page opens.
3. Click the Modify
icon ![]() for the SAP
application monitor you want to modify.
for the SAP
application monitor you want to modify.
The page for modifying the SAP application monitor opens.
4. Modify the parameters as needed, except the IP address and the APM server.
For more information about parameter settings, see "Adding a SAP application monitor."
5. Click OK.
Viewing the SAP application monitor report
After a SAP application monitor is added, APM collects index data of the application, evaluates the availability and health status, and updates the monitor report. The report shows the index values obtained from the most recent polling of the application.
To access the SAP application monitor report:
1. Click the Resource tab.
2. From the navigation tree, select Application Manager > Application Monitor.
The application monitor list page displays all application monitors.
3. Click the name of a SAP application monitor to display the report.
Figure 128 shows part of a SAP application monitor report.
Figure 128 Part of a SAP application monitor report
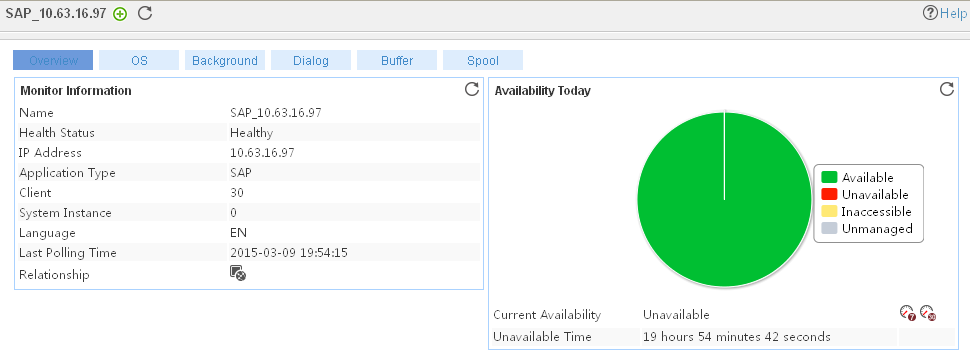
Monitor Information
The Monitor Information area contains the following fields:
· Name—Application monitor name.
· Health State—Health status of the monitored SAP application.
· IP Address—IP address of the SAP host.
· Application Type—Type of the monitored application, which is always SAP.
· Client—Number of SAP client.
· System Instance—Instance number of SAP application.
· Language—Language code of the SAP application.
· Last Polling Time—Time when APM last polled the SAP application.
· Relationship—Click the Relationship icon ![]() to view dependencies between the SAP application and other applications in a dependency topology view. For
more information about dependency topologies, see "Topology and application group management."
to view dependencies between the SAP application and other applications in a dependency topology view. For
more information about dependency topologies, see "Topology and application group management."
· Top5 Unrecovered Alarms—Latest five unrecovered alarms on the SAP host. The alarm level is identified by color: yellow for minor alarms, orange for major alarms, and red for critical alarms. If no alarm is generated by SAP, this field is not displayed.
Availability Today
The Availability Today area contains the following fields:
· Current Availability—Availability of the SAP application.
¡ Click the Weekly History icon![]() to view the availability of the SAP
application in the last 7 days.
to view the availability of the SAP
application in the last 7 days.
¡ Click
the Monthly History icon![]() to view
the availability of the SAP application in the last 30 days.
to view
the availability of the SAP application in the last 30 days.
· Available Time—Total amount of time that the SAP application was available after 00:00 today.
· Unavailable Time—Total amount of time that the SAP application was unavailable after 00:00 today.
· Inaccessible Time—Total amount of time that the SAP application was inaccessible after 00:00 today.
· Unmanaged Time—Total amount of time that the SAP application was unmanaged after 00:00 today.
The statistics collection started when the application monitor was added. An availability time field is not displayed if its value is 0.
CPU Usage
The CPU Usage area contains the following field:
· CPU Usage—CPU usage of the SAP application.
Spool Process Usage
The Spool Process Usage area contains the following field:
· Spool Process Usage—Percentage of the operating spool processes to the total number of spool processes.
Background Processing Usage
The Background Processing Usage area contains the following field:
· Background Processing Usage—Percentage of the active background processes to the total
background processes. Click the History Record
icon ![]() to view the
history graph of the background processing usage.
to view the
history graph of the background processing usage.
Dialog Response Time
The Dialog Response Time area contains the following field:
· Dialog Response Time—Response time of the dialog service for the SAP application. Click the History
Record icon ![]() to view the history graph of the dialog
response time.
to view the history graph of the dialog
response time.
Memory Page Dispatcher
The Memory Page Dispatcher area contains the following fields:
· Swap Ins—Memory
pages swapped in per second on the SAP host. Click the History Record
icon ![]() to view the
history graph of the swap Ins.
to view the
history graph of the swap Ins.
· Swap Outs—Memory
pages swapped out per second on the SAP host. Click the
History Record icon ![]() to view the
history graph of the swap outs.
to view the
history graph of the swap outs.
Disk Space Usage
The Disk Space Usage area contains the following field:
· Disk Space Usage—Percentage of used disk space on the SAP host.
Pending Background Processes
The Pending Background Processes area contains the following field:
· Pending Background Processes—Number of pending background processes in the SAP application.
Background Processing Terminations
The Background Processing Terminations area contains the following fields:
· Terminated Processes—Number of background processes that were terminated due to an
error. Click the History Record icon ![]() to view the
history graph of the terminated processes.
to view the
history graph of the terminated processes.
· Total Processes—Total number of processes in SAP background processing. Click the History Record icon ![]() to view the
history graph of the total processes.
to view the
history graph of the total processes.
Background Processing Errors
The Background Processing Errors area contains the following fields:
· Errors per Minute—Average number of errors that occur in SAP background processing
per minute. Click the History Record icon ![]() to view the
history graph of the errors per minutes.
to view the
history graph of the errors per minutes.
· Total Errors—Total number of errors that have occurred in SAP background
processing. Click the History Record icon ![]() to view the
history graph of the total errors.
to view the
history graph of the total errors.
SAP System Work Queue
The SAP System Work Queue area contains the following fields:
· SAP System Free Processes—Number
of idle SAP processes. Click the History Record
icon ![]() to view the
history graph of the SAP system free processes.
to view the
history graph of the SAP system free processes.
· SAP System Work Queue Length—Length of
the SAP system work queue. Click the History Record
icon ![]() to view the
history graph of the SAP system work queue length.
to view the
history graph of the SAP system work queue length.
Dialog Network Response Time
The Dialog Network Response Time area contains the following field:
· Dialog Network Response Time—Response time of the network communication between the client and
SAP. Click the History Record icon ![]() to view the
history graph of the dialog network response time.
to view the
history graph of the dialog network response time.
Standardization Response Time
The Standardization Response Time area contains the following field:
· Standardization Response
Time—Time that SAP uses to execute a
standardization task. Click the History Record
icon ![]() to view the
history graph of the standardization response time.
to view the
history graph of the standardization response time.
Login User
The Login User area contains the following field:
· Login User—Number of users who have logged in SAP when it was last polled by
APM. Click the History Record icon ![]() to view the
history graph of the login users.
to view the
history graph of the login users.
Buffer
The Buffer area contains the following fields:
· Buffer Name—Name of the buffer used by the SAP application. Click the History Record
icon ![]() to view the
history graph of the buffer name.
to view the
history graph of the buffer name.
· Directory Usage—Percentage of the used directory in the
buffer. Click the History Record icon ![]() to view the
history graph of the directory usage.
to view the
history graph of the directory usage.
· Space Usage—Percentage of the used storage space in the
buffer. Click the History Record icon ![]() to view the
history graph of the space usage.
to view the
history graph of the space usage.
· Swap Frequency—Number of swaps that occur in the buffer
per minute due to full buffer. Click the History Record icon ![]() to view the
history graph of the swap frequency.
to view the
history graph of the swap frequency.
· Hit Ratio—Percentage of database queries that were found in the buffer
instead of being sent to the database. Click the History Record
icon ![]() to view the
history graph of the hit ratio.
to view the
history graph of the hit ratio.
Dispatcher Queue Usage
The Dispatcher Queue Usage area contains the following field:
· Dispatcher Queue Usage—Percentage of the used space in the spool dispatcher queue when APM
last polled SAP. Click the History Record icon ![]() to view the
history graph of the dispatcher queue usage.
to view the
history graph of the dispatcher queue usage.
Request Queue Usage
The Request Queue Usage area contains the following fields:
· Request Queue Usage—Percentage of the used space in the spool request queue. Click the History Record
icon ![]() to view the
history graph of the request queue usage.
to view the
history graph of the request queue usage.
· Request Queue Pages—Number of pages stored in the spool request queue. Click the History Record icon ![]() to view the
history graph of the request queue pages.
to view the
history graph of the request queue pages.
· Request Queue Sequence
Usage—Percentage of the space used for sorting
requests in the spool request queue. Click the History Record
icon ![]() to view the
history graph of the request queue sequence usage.
to view the
history graph of the request queue sequence usage.
Spool Work Statistics
The Spool Work Statistics area contains the following fields:
· Spool Errors per Minute—Average number of errors that occur in SAP background processing
per minute. Click the History Record icon ![]() to view the
history graph of the spool errors per minute.
to view the
history graph of the spool errors per minute.
· Spool Errors—Total number of errors that have occurred in spool processes. Click the History Record icon ![]() to view the
history graph of the spool errors.
to view the
history graph of the spool errors.
· Spool Terminations—Total number of spool processes that were terminated due to an
error. Click the History Record icon ![]() to view the
history graph of the spool terminations.
to view the
history graph of the spool terminations.
· Spool Processes—Total number of spool processes. Click the History Record
icon ![]() to view the
history graph of the spool processes.
to view the
history graph of the spool processes.
Device Cache
The Device Cache area contains the following fields:
· Device Cache Usage—Used space in the device cache as a percentage. Click the History Record icon ![]() to view the
history graph of the device cache usage.
to view the
history graph of the device cache usage.
· Device Cache Fixed Ratio—Fixed device cache as a percentage. Click
the History Record icon ![]() to view the
history graph of the device cache fixed ratio.
to view the
history graph of the device cache fixed ratio.
Host Spool List
The Host Spool List area contains the following field:
· Host Spool List—Percentage of
used space in the host spool
list when APM last polled SAP. Click the History Record icon ![]() to view the
history graph of the host spool list.
to view the
history graph of the host spool list.
Virtual device monitor
APM can monitor the following virtual devices:
· Citrix XenServer
· Hyper-V
· KVM
· CAS
· PowerCenter
· VMware ESX
· VMware vCenter Server
· HW FusionCompute
Citrix XenServer
XenServer is a computer virtualization product developed by Citrix. APM can monitor XenServer 6.1.0 and later versions through APIs that are provided by Citrix.
The following information describes how to add and modify a XenServer application monitor, and view the monitor report.
Adding a Citrix XenServer application monitor
When you add a XenServer application monitor, follow these guidelines:
· Enable and configure SSH for XenServer. For more information, see the XenServer configuration guide.
· Obtain the username and password of a user who has the XenServer administrator's privileges. The username and password are required for adding the application monitor.
To add a XenServer application monitor:
1. Click the Resource tab.
2. Open the Add Application page by using one of the following methods:
¡ From the navigation tree, select Application Manager > Add Application.
¡ From the navigation tree, select Application Manager > Application Monitor. In the application monitor list, click Add.
The Add Application page displays all application types that can be monitored by APM.
3. Click Citrix XenServer of the Virtual Device Monitor class.
The page for adding a XenServer application monitor opens.
4. Configure the following parameters:
¡ IP Address—Enter the IP address of the host on which the XenServer server to be monitored is deployed. APM automatically checks the IP address and associates the application monitor with the XenServer server if it is already managed in the IMC platform. If the host is already added to the IMC platform, you can also click Select, and then select the host in the Select Devices window. For information about selecting a XenServer server, see "Quick start."
¡ Name—Enter a unique application monitor name. As a best practice, name the application monitor as application type_host IP address.
¡ Use Template—Select Enable or Disable from the list.
¡ Template—Click
the Configure icon ![]() next to the Template field to select an existing template. The Template field
is automatically populated with the name of the selected template. For more
information about configuring application templates, see "Configuration management." This field is displayed only when you select Enable from the Use
Template list.
next to the Template field to select an existing template. The Template field
is automatically populated with the name of the selected template. For more
information about configuring application templates, see "Configuration management." This field is displayed only when you select Enable from the Use
Template list.
¡ Description—Enter a description for the application monitor.
¡ Polling Interval (min)—Select a polling interval for the application monitor. Options are 1, 2, 3, 4, 5, 10, 20, and 30. The default polling interval is 5 minutes. A shorter polling interval improves real-time data accuracy at the expense of system resources. This field is available only when you select Disable from the Use Template list.
¡ Username/Password—Enter the username and password of the XenServer administrator. The fields are available only when you select Disable from the Use Template list.
¡ Contact—Enter the contact information, such as the name, email address, and telephone number. The default is the username of the operator who created the application monitor. This field is available only when you select Disable from the Use Template list.
¡ APM Server—Select an APM server to monitor the application. The options are in server-address (application-type:n/N) format. The letter n indicates the number of Citrix XenServer applications monitored on the APM server. The letter N indicates the total number of applications monitored on the APM server. Server address 127.0.0.1 indicates that APM and the IMC platform are deployed on the same server.
¡ Related Applications—Click Add next to this field. On the Select Application window, enter a partial or complete name to filter applications, select the applications that the XenServer server depends on, and then click OK.
Operating system applications cannot be selected. Operators can view all dependencies of the application in the dependency topology.
¡ Application Group—Specify an application group for the Citrix XenServer application.
- To specify an existing application group, click Add, select an application group, and then click OK.
- To specify a new application group, click Add Application Group, configure the application group settings, and then click OK.
¡ Detect Application—Select this parameter if you want to enable application detection. APM verifies the application connectivity by using the previous parameter settings, and adds the application monitor only when it can connect to the application. If you do not select this parameter, APM adds the application monitor without verifying the application connectivity.
5. Click OK.
Modifying a Citrix XenServer application monitor
Authorized users can modify all parameters except the IP address and the APM server for a Citrix XenServer application monitor. When the IP address of a monitored Citrix XenServer server changes, operators must add a new application monitor for the XenServer server. The new application monitor cannot inherit the history data from the previous application monitor.
To modify a XenServer application monitor:
1. Click the Resource tab.
2. From the navigation tree, select Application Manager > Application Monitor.
The application monitor list page displays all application monitors.
3. Click the Modify
icon ![]() for the XenServer application monitor you want to modify.
for the XenServer application monitor you want to modify.
The page for modifying the XenServer application monitor opens.
4. Modify the parameters as needed, except the IP address and the APM server.
For more information about parameter settings, see "Adding a Citrix XenServer application monitor."
5. Click OK.
Viewing the Citrix XenServer application monitor report
After a Citrix XenServer application monitor is added, APM collects index data of the application, evaluates the availability and health status, and updates the monitor report. The report shows the index values obtained from the most recent polling of the application.
To view the XenServer application monitor report:
1. Click the Resource tab.
2. From the navigation tree, select Application Manager > Application Monitor.
The application monitor list page displays all application monitors.
3. Click the name of a Citrix XenServer application monitor to display the report.
Figure 129 shows part of a Citrix XenServer application monitor report.
Figure 129 Part of a Citrix XenServer application monitor report

Monitor Information
The Monitor Information area contains the following fields:
· Name—Application monitor name.
· Health Status—Health status of the Citrix XenServer server.
· IP Address—IP address of the Citrix XenServer server.
· Application Type—Type of the monitored application, which is always Citrix XenServer for a Citrix XenServer application monitor.
· Last Polling Time—Time when APM last polled the Citrix XenServer server.
· Relationship—Click the Relationship icon ![]() to view dependencies
between the Citrix XenServer server and other applications in a dependency topology view. For more information
about dependency topologies, see "Topology and application group management."
to view dependencies
between the Citrix XenServer server and other applications in a dependency topology view. For more information
about dependency topologies, see "Topology and application group management."
· Top5 Unrecovered Alarm—Latest five unrecovered alarms on the Citrix XenServer server. This field is not displayed if no alarm is generated by the Citrix XenServer server.
Availability Today
The Availability Today area contains the following fields:
· Current Availability—Availability of the Citrix XenServer server.
¡ Click the Weekly History icon![]() to view the availability of the Citrix XenServer in the last 7 days.
to view the availability of the Citrix XenServer in the last 7 days.
¡ Click
the Monthly History icon![]() to view
the availability of the Citrix XenServer in the last 30 days.
to view
the availability of the Citrix XenServer in the last 30 days.
· Available Time—Total amount of time that the Citrix XenServer server was available after 00:00 today.
· Unavailable Time—Total amount of time that the Citrix XenServer server was unavailable after 00:00 today.
· Inaccessible Time—Total amount of time that the Citrix XenServer server was inaccessible after 00:00 today.
· Unmanaged Time—Total amount of time that the Citrix XenServer server was unmanaged after 00:00 today.
The statistics collection started when the application monitor was added. An availability time field is not displayed when its value is 0.
Pool
The Pool area contains the following fields:
· Name—Name of the pool.
· Description—Description of the pool.
· Master—Master server of the pool.
· Default SR—Default storage repository of the pool.
· HA Enabled—Whether high availability is enabled for the pool.
· WLB Enabled—Whether load balancing is enabled for the pool.
Statistic
The Statistic area contains the following fields:
· Hosts—Total count of hosts in the pool.
· SRs—Total count of storage repositories in the pool.
· Shared SRs—Total count of shared storage repositories in the pool.
· VMs—Total count of virtual machines in the pool.
· Running VMs—Total count of running virtual machines in the pool.
· Snapshots—Total count of snapshots in the pool.
· Templates—Total count of templates in the pool.
Host Information
The Host Information area contains the following fields:
· Host Name—Name of the host where the Citrix XenServer server resides.
· CPU Model—CPU model of the Citrix XenServer server.
· CPU Frequency—CPU frequency of the Citrix XenServer server.
· CPU Vendor—Vendor of the Citrix XenServer server.
· Cores per CPU—Number of CPU cores on the Citrix XenServer server.
· Major API Version—Major version number of Citrix XenServer API.
· Minor API Version—Minor version number of Citrix XenServer API.
· Description—Description of the Citrix XenServer server.
· Enable New VMs—Whether new VMs can be started on the Citrix XenServer server.
· Schedule Policy—Virtual CPU schedule policy used by the Citrix XenServer server.
· License Expiration Date—Expiration date of the license.
Memory Information
The Memory Information area contains the following fields:
· Available XenServer Memory—Available memory space of the Citrix XenServer server. Click the History Record icon ![]() to view the history
graph of the available Citrix XenServer memory.
to view the history
graph of the available Citrix XenServer memory.
· Total XenServer Memory—Total memory space of
the Citrix XenServer server. Click the History Record icon ![]() to view the history
graph of the total Citrix XenServer memory.
to view the history
graph of the total Citrix XenServer memory.
· Used XenServer Memory—Used memory space of
the Citrix XenServer server. Click the History Record icon ![]() to view the history
graph of the used Citrix XenServer memory.
to view the history
graph of the used Citrix XenServer memory.
· XenServer Memory Usage—Memory usage ratio of
the Citrix XenServer server. Click the History Record icon ![]() to view the history
graph of the Citrix XenServer memory usage ratio.
to view the history
graph of the Citrix XenServer memory usage ratio.
· Assigned XAPI Memory—Memory space assigned to XAPI after XAPI is started. Click the History Record icon ![]() to view the history graph of the assigned
XAPI memory.
to view the history graph of the assigned
XAPI memory.
· Active XAPI Memory—Memory space used
by XAPI. Click the History Record icon ![]() to view the history
graph of the active XAPI memory.
to view the history
graph of the active XAPI memory.
· Total XAPI Memory—Total memory space for XAPI. Click the History Record icon ![]() to view the history
graph of the total XAPI memory.
to view the history
graph of the total XAPI memory.
· Available XAPI Memory—Available memory of XAPI. Click the History Record icon ![]() to view the history graph of the available XAPI memory.
to view the history graph of the available XAPI memory.
Host CPU Information
The Host CPU Information area contains the following fields:
· Core Name—Name of the CPU core.
· Model—Model of the CPU.
· Usage—Usage ratio of the CPU core in the last polling period.
¡ Click
the Set Threshold icon ![]() to set alarm
thresholds for the usage.
to set alarm
thresholds for the usage.
¡ Click
the History Record icon ![]() to view the history graph of the usage.
to view the history graph of the usage.
· Frequency—CPU frequency.
· Series—Product series to which the CPU belongs.
· Model No.—Sequence number of CPU model.
· Stepping—Stepping level of the CPU.
Storage Information
The Storage Information area contains the following fields:
· Storage Name—Name of the storage.
· Description—Description of the storage.
· Storage Type—Type of the storage.
· Content Type—Type of the stored content.
· Sharable—Whether the storage can be shared by hosts.
· Usage—Usage of the storage. Click the History Record icon ![]() to view the
history graph of the usage.
to view the
history graph of the usage.
· Physical Capacity—Physical capacity of the storage.
· Virtual Capacity—Capacity of all virtual disk images in the storage.
Physical NIC Information
The Physical NIC Information area contains the following fields:
· Name—Name of the NIC on the Citrix XenServer server.
· IP Address—IP address of the NIC.
· MAC Address—MAC address of the NIC.
· Subnet Mask—Subnet mask of the NIC.
· Gateway—IP address of the gateway.
· Send Rate—Number of outbound bits per second on the NIC.
· Receive Rate—Number of inbound bits per second on the NIC.
· Send Errors—Number of outbound erroneous packets per second on the NIC.
· Receive Errors—Number of inbound erroneous packets per second on the NIC.
· Speed—Speed of the NIC.
· Mode—Duplex mode of the NIC, Full or Half.
· MTU—Maximum transmission unit of the NIC. A packet whose size exceeds the MTU will be fragmented.
VM List
The VM List area contains the following fields:
· VM Name—Name of the VM on the Citrix XenServer server.
· Power Supply Status—Status of the power supply on the VM.
· CPU Usage—CPU usage ratio of the VM.
· Virtual CPUs—Number of virtual CPUs on the VM.
VM Memory Information
The VM Memory Information area contains the following fields:
· VM Name—Name of the VM on the Citrix XenServer server.
· Memory Cost—Memory cost that occurred when the Citrix XenServer server managed the VM.
· Min. Dynamic Memory—Minimum dynamic memory space of the VM.
· Max. Dynamic Memory—Maximum dynamic memory space of the VM.
· Min. Static Memory—Minimum static memory space of the VM.
· Max. Static Memory—Maximum static memory space of the VM.
Virtual Block Device Information
The Virtual Block Device Information area contains the following fields:
· VM Name—Name of the VM to which the virtual block device belongs.
· Block Device Name—Name of the virtual block device.
· Startup Disk—Whether the virtual block device is the startup disk.
· Attached—Whether the virtual block device is active.
· Empty Device—Whether the virtual block device is used.
· Mode—Operating mode of the virtual block device, RO (Read Only) or RW (Read Write).
· Status Code—Status code of the virtual block device.
· Storage Lock—Whether the virtual block device has obtained the storage level lock.
· Type—Type of the virtual block device, DISK or CD.
· Pluggable—Whether the virtual block device is hot swappable.
Virtual Disk Image Information
The Virtual Disk Image Information area contains the following fields:
· VM Name—Name of the VM to which the virtual disk image belongs.
· Image Name—Name of the virtual disk image.
· Description—Description of the virtual disk image.
· Manageable—Whether the virtual disk image can be managed.
· Usage—Usage of the virtual disk image in the last polling period.
· Virtual Disk Size—Size of the virtual disk image.
· Read-Only—Whether the virtual disk image is read only.
· Sharable—Whether the virtual disk image can be shared.
· Storage—Name of the storage where the virtual disk image is located.
Virtual NIC Information
The Virtual NIC Information area contains the following fields:
· VM Name—Name of the VM to which the virtual NIC belongs.
· NIC Name—Name of the virtual NIC.
· MAC Address—MAC address of the virtual NIC.
· Virtual Network—Name of the network to which the virtual NIC is connected.
· MTU—Maximum transmission unit of the virtual NIC.
· Attached—Whether the virtual NIC is active in the last polling period.
· Send Rate—Number of outbound bits per second on the virtual NIC in the last polling period.
· Receive Rate—Number of inbound bits per second on the virtual NIC in the last polling period.
· Send Errors—Number of outbound erroneous packets per second on the virtual NIC in the last polling period.
· Receive Errors—Number of inbound erroneous packets per second on the virtual NIC in the last polling period.
· Read Rate—Number of bits the virtual NIC read per second in the last polling period.
· Write Rate—Number of bits the virtual NIC wrote per second in the last polling period.
Hyper-V
Hyper-V is an enterprise-level computer virtualization product offered by Microsoft. APM can monitor Hyper-V servers running on Windows Server 2012.
The following information describes how to add and modify a Hyper-V application monitor, and view the monitor report.
Adding a Hyper-V application monitor
When you add a Hyper-V application monitor, follow these guidelines:
· Configure and enable WMI on Windows.
· Obtain the username and password of a user who has the Hyper-V administrator's privileges. The username and password are required for adding the application monitor.
To add a Hyper-V application monitor:
1. Click the Resource tab.
2. Open the Add Application page by using one of the following methods:
¡ From the navigation tree, select Application Manager > Add Application.
¡ From the navigation tree, select Application Manager > Application Monitor. In the application monitor list, click Add.
The Add Application page displays all application types that can be monitored by APM.
3. Click Hyper-V of the Virtual Device Monitor class.
The page for adding a Hyper-V application monitor opens.
4. Configure the following parameters:
¡ IP Address—Enter the IP address of the host on which the Hyper-V server to be monitored is installed. APM automatically checks the IP address and associates the application monitor with the Hyper-V server if it is already managed in the IMC platform. To monitor a Hyper-V server that is already managed in the IMC platform, you can also click Select, and then select the Hyper-V server in the Select Devices dialog box. For information about selecting a Hyper-V server, see "Quick start."
¡ Name—Enter a unique application monitor name. As a best practice, name the application monitor as application type_host IP address.
¡ Use Template—Select Enable or Disable from the list.
¡ Template—Click
the Configure icon ![]() next to the Template field to select an existing template. The Template field
is automatically populated with the name of the selected template. For more
information about configuring application templates, see "Configuration management." This field is displayed only when you select Enable from the Use
Template list.
next to the Template field to select an existing template. The Template field
is automatically populated with the name of the selected template. For more
information about configuring application templates, see "Configuration management." This field is displayed only when you select Enable from the Use
Template list.
¡ Description—Enter a description for the application monitor.
¡ Polling Interval (min)—Select a polling interval for the application monitor. Options are 1, 2, 3, 4, 5, 10, 20, and 30. The default polling interval is 5 minutes. A shorter polling interval improves real-time data accuracy at the expense of system resources. This field is available only when you select Disable from the Use Template list.
¡ Username/Password—Enter the username and password of the Hyper-V administrator. The fields are available only when you select Disable from the Use Template list.
¡ Contact—Enter the contact information, such as the name, email address, and telephone number. The default is the username of the operator who created the application monitor. This field is available only when you select Disable from the Use Template list.
¡ APM Server—Select an APM server to monitor the application. The options are in server-address (application-type:n/N) format. The letter n indicates the number of Hyper-V applications monitored on the APM server. The letter N indicates the total number of applications monitored on the APM server. Server address 127.0.0.1 indicates that APM and the IMC platform are deployed on the same server.
¡ Related Applications—Click Add next to this field. On the Select Application window, enter a partial or complete name to filter applications, select the applications that the Hyper-V server depends on, and then click OK.
Operating system applications cannot be selected. Operators can view all dependencies of the application in the dependency topology.
¡ Application Group—Specify an application group for the Hyper-V application.
- To specify an existing application group, click Add, select an application group, and then click OK.
- To specify a new application group, click Add Application Group, configure the application group settings, and then click OK.
¡ Detect Application—Select this parameter if you want to enable application detection. APM verifies the application connectivity by using the previous parameter settings, and adds the application monitor only when it can connect to the application. If you do not select this parameter, APM adds the application monitor without verifying the application connectivity.
5. Click OK.
Modifying a Hyper-V application monitor
Authorized users can modify all parameters except the IP address and the APM server for a Hyper-V server. When the IP address of a monitored Hyper-V server changes, operators must add a new application monitor for the Hyper-V server. The new application monitor cannot inherit the history data from the previous application monitor.
To modify a Hyper-V application monitor:
1. Click the Resource tab.
2. From the navigation tree, select Application Manager > Application Monitor.
The application monitor list page displays all application monitors.
3. Click the Modify
icon ![]() for the Hyper-V application monitor you want to modify.
for the Hyper-V application monitor you want to modify.
The page for modifying the Hyper-V application monitor opens.
4. Modify the parameters as needed, except the IP address and the APM server.
For more information about parameter settings, see "Adding a Hyper-V application monitor."
5. Click OK.
Viewing the Hyper-V application monitor report
After a Hyper-V application monitor is added, APM collects index data of the application, evaluates the availability and health status, and updates the monitor report. The report shows the index values obtained from the most recent polling of the application.
To view the Hyper-V application monitor report:
1. Click the Resource tab.
2. From the navigation tree, select Application Manager > Application Monitor.
The application monitor list page displays all application monitors.
3. Click the name of a Hyper-V application monitor to display the report.
Figure 130 shows part of a Hyper-V application monitor report.
Figure 130 Part of a Hyper-V application monitor report
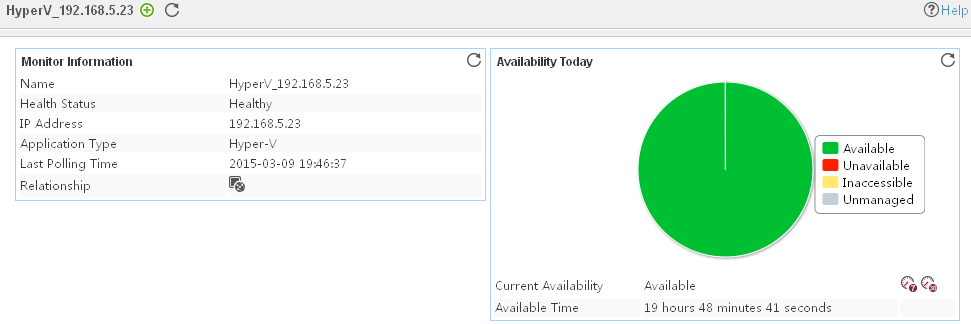
Monitor Information
The Monitor Information area contains the following fields:
· Name—Application monitor name.
· Health State—Health status of the Hyper-V server.
· IP Address—IP address of the Hyper-V server.
· Application Type—Type of the monitored application, which is always Hyper-V for a Hyper-V application monitor.
· Version—Version of the Hyper-V server.
· Last Polling Time—Time when APM last polled the Hyper-V server.
· Relationship—Click the Relationship icon ![]() to view
dependencies between the Hyper-V server and other applications in a dependency
topology view. For more information about dependency
topologies, see "Topology and application group management"
to view
dependencies between the Hyper-V server and other applications in a dependency
topology view. For more information about dependency
topologies, see "Topology and application group management"
· Top5 Unrecovered Alarm—Latest five unrecovered alarms on the Hyper-V server. This field is not displayed if no alarm is generated by the Hyper-V server.
Availability Today
The Availability Today area contains the following fields:
· Current Availability—Availability of the Hyper-V server.
¡ Click the Weekly History icon![]() to view the availability of the Hyper-V in the last 7 days.
to view the availability of the Hyper-V in the last 7 days.
¡ Click
the Monthly History icon![]() to view
the availability of the Hyper-V in the last 30 days.
to view
the availability of the Hyper-V in the last 30 days.
· Available Time—Total amount of time that the Hyper-V server was available after 00:00 today.
· Unavailable Time—Total amount of time that the Hyper-V server was unavailable after 00:00 today.
· Inaccessible Time—Total amount of time that the Hyper-V server was inaccessible after 00:00 today.
· Unmanaged Time—Total amount of time that the Hyper-V server was unmanaged after 00:00 today.
The statistics collection started when the application monitor was added. An availability time field is not displayed when its value is 0.
Hyper-V System
The Hyper-V System area contains the following fields:
· VM Count—Number of VMs running on the Hyper-V server.
· Logical Processor Count—Number of logical processors on the Hyper-V server.
· VM Processor Count—Number of virtual processors on all VMs.
Hyper-V System Service
The Hyper-V System Service area contains the following fields:
· Service Name—System service that the Hyper-V server depends on.
· Running Status—Running status of the system service.
· Service Status—Service status of the system service.
Logical Processor Usage
The Logical Processor Usage area contains the following fields:
· Logical Processor Usage dashboard or trend graph—View the area in a dashboard or a trend graph.
¡ Dashboard graph—View the logical processor usage ratio of the Hyper-V server.
¡ Trend graph—View the changes of the logical processor usage ratio for the Hyper-V server in a line chart. Point to a spot on the curve to view the logical processor usage ratio at the specific time point.
· Total Usage—Total usage of logical processors.
· Guest Code—Percentage of the logical processors that process Guest Code.
· Management System—Percentage of the logical processors occupied by the Hyper-V system.
· Free—Percentage of the free logical processors.
Memory Usage
The Memory Usage area contains the following fields:
· VM—Name of the VM running on the Hyper-V server.
· Physical Memory Usage—Physical memory size assigned to the VM.
· Current Pressure—VM memory usage. It is calculated by using the following formula: Current pressure = Memory size used by the VM/Memory size assigned to the VM x 100%.
Dynamic Memory Equalizer
The Dynamic Memory Equalizer area contains the following fields:
· Name—Name of the dynamic memory equalizer.
· Available Memory—Available memory size of the dynamic memory equalizer.
Memory Management Information
The Memory Management Information area contains the following fields:
· VM—Name of the VM running on the Hyper-V server.
· Assigned Physical Page Count—Number of physical pages assigned to the VM.
· Remote Physical Page Count—Number of VM's physical pages on a remote node.
Root Partition Memory Usage
The Root Partition Memory Usage area contains the following fields:
· Name—Name of the root partition.
· Used Page Count—Number of pages used by the root partition.
· Virtual TLB Page Count—Number of pages used by the root partition Translation Lookaside Buffer. TLB is a memory buffer used to improve the transition speed from a virtual address to a physical address.
VM Processor Usage
The VM Processor Usage area contains the following fields:
· Virtual Processor Name—Name of the VM to which the virtual processor belongs and the ID of the virtual processor in the VM.
· Usage—Usage of the virtual processor.
Virtual Switch Information
The Virtual Switch Information area contains the following fields:
· Name—Name of the virtual switch.
· Byte Processing Rate—Rate that the virtual switch processes bytes.
· Packet Processing Rate—Rate that the virtual switch processes packets.
Total Partition Memory Usage
The Total Partition Memory Usage area contains the following fields:
· Page Count—Number of pages used by all partitions in the memory.
· Address Space Count in Virtual TLB—Number of address spaces in virtual TLBs.
· Page Count Used by Virtual TLB—Number of pages used by virtual TLBs in the memory.
· GPA Space Modify Count—Number of guest physical address space modify operations.
· Virtual TLB Refresh Count—Number of virtual TLB refresh operations.
Virtual Switch Port Information
The Virtual Switch Port Information area contains the following fields:
· Port Name—Name of a port on the virtual switch.
· Byte Received/Sec—Rate that the port receives bytes.
· Byte Send/Sec—Rate that the port sends bytes.
· More—Click More to view port information for all virtual switches. By default, the report displays port information for only the first 10 virtual switches.
Host/VM Monitor
The Host/VM Monitor area contains the following fields:
· Host/VM—Name of the host or VM.
· GUID—Identifier of the host or VM.
· Monitor Type—Monitor type of the host or VM.
· Status—Status of the host or VM.
· Health Status—Health state of the host or VM.
Options and their meanings are as follows:
¡ 5—OK.
¡ 20—Major failure.
¡ 25—Critical failure.
Virtual Network Adapter
The Virtual Network Adapter area contains the following fields:
· Adapter Name—Name of the virtual network adapter.
· Bytes Processed/Sec—Rate that the virtual network adapter processes data.
· Bytes Received/Sec—Rate that the virtual network adapter receives data.
· Bytes Sent/Sec—Rate that the virtual network adapter sends data.
· Output Packet Losses/Sec—Packet loss rate when the virtual network adapter sends packets.
· Packets Sent/Sec—Rate that the virtual network adapter sends packets.
· Packets Received/Sec—Rate that the virtual network adapter receives packets.
Virtual Storage Information
The Virtual Storage Information area contains the following fields:
· Name—Real file name of the virtual storage on the disk.
· Error Operation Count—Total number of error operations on the virtual storage.
· Refresh Operation Count—Total number of refresh operations on the virtual storage.
· Read Operation Count—Total number of read operations on the virtual storage.
· Write Operation Count—Total number of write operations on the virtual storage.
· Bytes Read/Sec—Bytes read from the virtual storage per second.
· Bytes Written/Sec—Bytes written into the virtual storage per second.
KVM
KVM is a Linux-based computer virtualization product. APM can monitor KVM 0.9.3 and later versions through the CLI.
The following information describes how to add and modify a KVM application monitor, and view the monitor report.
Adding a KVM application monitor
When you add a KVM application monitor, follow these guidelines:
· Enable and configure SSH on the Linux operating system that is hosting the KVM server. For more information, see the Linux operating system configuration guide.
· Obtain the username and password of a user who has the KVM administrator's privileges. The username and password are required for adding the application monitor.
To add a KVM application monitor:
1. Click the Resource tab.
2. Open the Add Application page by using one of the following methods:
¡ From the navigation tree, select Application Manager > Add Application.
¡ From the navigation tree, select Application Manager > Application Monitor. In the application monitor list, click Add.
The Add Application page displays all application types that can be monitored by APM.
3. Click KVM of the Virtual Device Monitor class.
The page for adding a KVM application monitor opens.
4. Configure the following parameters:
¡ IP Address—Enter the IP address of the host on which the KVM server to be monitored is installed. APM automatically checks the IP address and associates the application monitor with the KVM server if it is already managed in the IMC platform. If the host is already added to the IMC platform, you can also click Select, and then select the KVM server in the Select Devices dialog box. For information about selecting a KVM server, see "Quick start."
¡ Name—Enter a unique application monitor name. As a best practice, name the application monitor as application type_host IP address.
¡ Use Template—Select Enable or Disable from the list.
¡ Template—Click
the Configure icon ![]() next to the Template field to select an existing template. The Template field
is automatically populated with the name of the selected template. For more
information about configuring application templates, see "Configuration management." This field is displayed only when you select Enable from the Use
Template list.
next to the Template field to select an existing template. The Template field
is automatically populated with the name of the selected template. For more
information about configuring application templates, see "Configuration management." This field is displayed only when you select Enable from the Use
Template list.
¡ Description—Enter a description for the application monitor.
¡ Polling Interval (min)—Select a polling interval for the application monitor. Options are 1, 2, 3, 4, 5, 10, 20, and 30. The default polling interval is 5 minutes. A shorter polling interval improves real-time data accuracy at the expense of system resources. This field is available only when you select Disable from the Use Template list.
¡ Username/Password—Enter the username and password of the KVM administrator. The fields are available only when you select Disable from the Use Template list.
¡ Contact—Enter the contact information, such as the name, email address, and telephone number. The default is the username of the operator who created the application monitor. This field is available only when you select Disable from the Use Template list.
¡ APM Server—Select an APM server to monitor the application. The options are in server-address (application-type:n/N) format. The letter n indicates the number of KVM applications monitored on the APM server. The letter N indicates the total number of applications monitored on the APM server. Server address 127.0.0.1 indicates that APM and the IMC platform are deployed on the same server.
¡ Related Applications—Click Add next to this field. On the Select Application window, enter a partial or complete name to filter applications, select the applications that the KVM server depends on, and then click OK.
Operating system applications cannot be selected. Operators can view all dependencies of the application in the dependency topology.
¡ Application Group—Specify an application group for the KVM application.
- To specify an existing application group, click Add, select an application group, and then click OK.
- To specify a new application group, click Add Application Group, configure the application group settings, and then click OK.
¡ Detect Application—Select this parameter if you want to enable application detection. APM verifies the application connectivity by using the previous parameter settings, and adds the application monitor only when it can connect to the application. If you do not select this parameter, APM adds the application monitor without verifying the application connectivity.
5. Click OK.
Modifying a KVM application monitor
Authorized users can modify all parameters except the IP address and the APM server for a KVM application monitor. When the IP address of a monitored KVM server changes, operators must add a new application monitor for the KVM server. The new application monitor cannot inherit the history data from the previous application monitor.
To modify a KVM application monitor:
1. Click the Resource tab.
2. From the navigation tree, select Application Manager > Application Monitor.
The application monitor list page displays all application monitors.
3. Click the Modify
icon ![]() for the KVM application monitor you want to modify.
for the KVM application monitor you want to modify.
The page for modifying the KVM application monitor opens.
4. Modify the parameters as needed, except the IP address and the APM server.
For more information about parameter settings, see "Adding a KVM application monitor."
5. Click OK.
Viewing the KVM application monitor report
After a KVM application monitor is added, APM collects index data of the application, evaluates the availability and health status, and updates the monitor report. The report shows the index values obtained from the most recent polling of the application.
To view the KVM application monitor report:
1. Click the Resource tab.
2. From the navigation tree, select Application Manager > Application Monitor.
The application monitor list page displays all application monitors.
3. Click the name of a KVM application monitor to display the report.
Figure 131 shows part of a KVM application monitor report.
Figure 131 Part of a KVM application monitor report
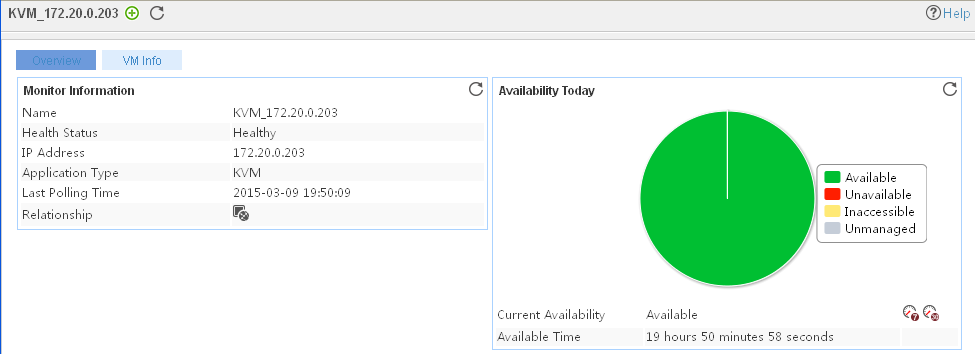
Monitor Information
The Monitor Information area contains the following fields:
· Name—Application monitor name.
· Health Status—Health status of the KVM server.
· IP Address—IP address of the KVM server.
· Application Type—Type of the monitored application, which is always KVM for a KVM application monitor.
· Last Polling Time—Time when APM last polled the KVM server.
· Relationship—Click the Relationship icon ![]() to view dependencies
between the KVM server and
other applications in a dependency topology view. For more information about dependency topologies, see "Topology and application group management."
to view dependencies
between the KVM server and
other applications in a dependency topology view. For more information about dependency topologies, see "Topology and application group management."
· Top5 Unrecovered Alarm—Latest five unrecovered alarms on the KVM server. This field is not displayed if no alarm is generated by the KVM server.
Availability Today
The Availability Today area contains the following fields:
· Current Availability—Availability of the KVM server.
¡ Click
the Weekly History icon![]() to view the availability of the KVM in the last 7 days.
to view the availability of the KVM in the last 7 days.
¡ Click
the Monthly History icon![]() to view the availability of the KVM in the last 30 days.
to view the availability of the KVM in the last 30 days.
· Available Time—Total amount of time that the KVM server was available after 00:00 today.
· Unavailable Time—Total amount of time that the KVM server was unavailable after 00:00 today.
· Inaccessible Time—Total amount of time that the KVM server was inaccessible after 00:00 today.
· Unmanaged Time—Total amount of time that the KVM server was unmanaged after 00:00 today.
The statistics collection started when the application monitor was added. An availability time field is not displayed when its value is 0.
Basic Server Information
The Basic Server Information area contains the following fields:
· Host Name—Name of the host where the KVM server resides.
· CPU Model—CPU model of the KVM server.
· Logical CPUs—Number of logical CPUs on the KVM server. Number of logical CPUs = Number of CPU slots * Number of cores per slot * Number of threads per core.
· CPU Frequency (MHz)—CPU frequency of the KVM server.
· CPU Slots—Number of CPU slots on the KVM server.
· Cores per Slot—Number of cores in each slot on the KVM server.
· Threads per Core—Number of threads in each core on the KVM server.
· NUMA Nodes—Number of NUMA nodes on the KVM server.
· Memory Capacity—Memory size of the KVM server.
VM List
The VM List area contains the following fields:
· VM ID—ID of the VM. Only VMs that are in running state have IDs.
· Name—Name of the VM.
· Status—Status of the VM.
Server CPU Usage
The Server CPU Usage area contains the following fields:
· Server CPU Usage dashboard or trend graph—View the area in a dashboard or a trend graph.
¡ Dashboard graph—Shows the CPU usage of the KVM server in the last polling period.
¡ Trend graph—Shows the CPU usage trend of the KVM server over a specific time range in a line graph.
· Used—CPU usage of the KVM server.
¡ Click
the Set Threshold icon ![]() to set alarm thresholds for the CPU usage.
to set alarm thresholds for the CPU usage.
¡ Click the History
Record icon ![]() to view the history
graph of the CPU usage.
to view the history
graph of the CPU usage.
· User—Percentage of CPU resources used by the KVM server to process user
requests. Click the History Record
icon ![]() to view the history graph of the percentage of CPU resources used
by the KVM server to process user requests.
to view the history graph of the percentage of CPU resources used
by the KVM server to process user requests.
· System—Percentage of CPU resources used by the KVM management system.
Click the History Record
icon ![]() to view the history graph of the percentage of CPU resources used
by the KVM management system.
to view the history graph of the percentage of CPU resources used
by the KVM management system.
· Free—Percentage of free CPU resources on the KVM server. Click the History Record icon ![]() to view the history graph of the percentage of free CPU resources
on the KVM server.
to view the history graph of the percentage of free CPU resources
on the KVM server.
· Waiting I/O—Percentage of CPU resources used by the KVM server to wait for I/O
operations. Click the History Record
icon ![]() to view the history graph of the percentage of CPU resources used
by the KVM server to wait for I/O operations.
to view the history graph of the percentage of CPU resources used
by the KVM server to wait for I/O operations.
Server Memory Usage
The Server Memory Usage area contains the following fields:
· Server Memory Usage dashboard or trend graph—View the area in a dashboard or a trend graph.
¡ Dashboard graph—Shows the memory usage of the KVM server in the last polling period.
¡ Trend graph—Shows the memory usage trend of the KVM server over a specific time range in a line graph.
· Total—Total memory size of the KVM server. Click the History Record icon ![]() to view the history graph of the total memory size.
to view the history graph of the total memory size.
· Free—Free memory size of the KVM server. Click the History
Record icon ![]() to view the history
graph of the free memory size.
to view the history
graph of the free memory size.
· Buffer—Buffer memory size of the KVM server. Click the History Record icon ![]() to view the history graph of the buffer memory size.
to view the history graph of the buffer memory size.
· Cache—Cache memory size of the KVM server. Click the History Record icon ![]() to view the history graph of the cache memory size.
to view the history graph of the cache memory size.
· Usage—Memory usage of the KVM server. Click the History Record
icon ![]() to view the memory usage.
to view the memory usage.
File System Usage Ratio
The File System Usage Ratio area contains the following fields:
· Mount Point—Mount point of the file system in the operating system directory structure.
· Usage—Space usage of the file system.
¡ Click
the Set Threshold icon ![]() to set alarm
thresholds for the space usage.
to set alarm
thresholds for the space usage.
¡ Click
the History Record icon ![]() to view the history graph of the space usage.
to view the history graph of the space usage.
· Capacity—Capacity of the file system.
· Used—Used space of the file system.
· Available—Free space of the file system.
Network Interface Statistics
The Network Interface Statistics area contains the following fields:
· Interface Name—Name of the network interface.
· MTU—Maximum transmission unit of the network interface. A packet whose size exceeds the MTU will be fragmented.
· Metrics—Metric of the network interface.
· Correct at Receiving—Number of inbound correct packets per second on the network
interface. Click the History Record
icon ![]() to view the history graph of the number of
inbound correct packets per second.
to view the history graph of the number of
inbound correct packets per second.
· Error at Receiving—Number of inbound erroneous packets per second on the network
interface. Click the History Record
icon ![]() to view the history graph of the number of
inbound erroneous packets per second.
to view the history graph of the number of
inbound erroneous packets per second.
· Discarded at
Receiving—Number of inbound packets discarded
per second on the network interface due to packet receiving rate limit. Click the History Record icon ![]() to view the history graph of the number of
inbound packets discarded per second.
to view the history graph of the number of
inbound packets discarded per second.
· Lost at Receiving—Number of lost inbound packets per second on the network interface.
Click the History Record
icon ![]() to view the history graph of the number of
lost inbound packets per second.
to view the history graph of the number of
lost inbound packets per second.
· Correct at Sending—Number of outbound correct packets per second on the network
interface. Click the History Record
icon ![]() to view the history graph of the number of
outbound correct packets per second.
to view the history graph of the number of
outbound correct packets per second.
· Error at Sending—Number of outbound erroneous packets per second on the network
interface. Click the History Record
icon ![]() to view the history graph of the number of
outbound erroneous packets per second.
to view the history graph of the number of
outbound erroneous packets per second.
· Discarded at Sending—Number of outbound packets discarded per second on the network
interface. Click the History Record
icon ![]() to view the history graph of the number of
outbound packets discarded per second.
to view the history graph of the number of
outbound packets discarded per second.
· Discarded due to
Exceeded Sending Rate—Number of outbound packets
discarded per second on the network interface due to packet sending rate limit.
Click the History Record
icon ![]() to view the history graph of the number of
outbound packets discarded due to packet sending rate limit per second.
to view the history graph of the number of
outbound packets discarded due to packet sending rate limit per second.
· Flag—Flags of the network interface.
¡ B—The broadcast address has been set.
¡ L—The network interface is a loopback interface.
¡ M—The network interface is operating in promiscuous mode. In this mode, the network interface can receive all packets.
¡ R—The network interface is running.
¡ U—The network interface is active.
Basic VM Information
The Basic VM Information area contains the following fields:
· VM ID—ID of the VM.
· VM Name—Name of the VM.
· UUID—Universally unique identifier of the VM.
· OS Type—Virtualization type of the VM. The hvm value represents full virtualization.
· Status—Status of the VM.
· CPUs—Number of virtual CPUs assigned to the VM.
· CPU Processing Duration—Duration occupied by the VM to process data.
· Max Memory—Maximum memory size of the VM.
· Used Memory—Used memory space of the VM.
· Persistent—Whether the VM is in persistent or temporary state.
· Auto Start—Whether the VM automatically starts up.
· Saving Status—Whether the VM is in saving state. A VM in saving state saves its current status and restores the most recently saved status at next startup.
· Security Mode—Security mode of the VM.
· Security DOI—Security domain of interpretation for the VM.
Virtual CPU Information
A virtual CPU is uniquely identified by VM name and CPU ID.
The Virtual CPU Information area contains the following fields:
· VM Name—Name of the VM to which the virtual CPU belongs.
· CPU ID—ID of the virtual CPU.
· Usage—Virtual CPU usage of the VM. Click the History Record icon ![]() to view the
history graph of the virtual CPU usage.
to view the
history graph of the virtual CPU usage.
· Status—Status of the VM in the last polling period.
· CPU Processing Duration—Duration occupied by the VM to process data.
· CPU Affinity Mask—CPU affinity for the VM. The number of y indicates the number of logical CPUs for the VM.
VM Disk Image Files
A VM disk image file represents a disk for the VM. A VM disk is uniquely identified by VM name and target device.
The VM Disk Image Files area contains the following fields:
· VM Name—Name of the VM to which the VM disk image file belongs.
· Target—Target device mapped to the disk image file in the VM.
· Source—Source file of the disk image file on the KVM server.
Image File Details
The Image File Details area contains the following fields:
· VM Name—Name of the VM to which the VM disk image file belongs.
· Capacity—Capacity of the VM disk.
· Grant—Space assigned to the VM disk.
· Used Physical Disk Space—Physical disk space occupied by the VM disk on the KVM server.
VM Network Interface List
Each VM network interface represents a NIC of the VM.
The VM Network Interface List area contains the following fields:
· VM Name—Name of the VM to which the network interface belongs.
· Interface Name—Name of the VM network interface.
· Type—Type of the VM network interface.
· Source Interface—vSwitch to which the network interface connects.
· Mode—Operating mode of the VM network interface.
· MAC Address—MAC address of the VM network interface.
VM Network Interface Statistics
The VM Network Interface Statistics area contains the following fields:
· VM Name—Name of the VM to which the network interface belongs.
· Byte Receive Rate—Number of inbound bytes per second on the VM network interface.
Click the History Record icon ![]() to view the
history graph of the number of inbound bytes per second.
to view the
history graph of the number of inbound bytes per second.
· Packet Receive Rate—Number of inbound packets per second on the VM network interface.
Click the History Record icon ![]() to view the
history graph of the number of inbound packets per second.
to view the
history graph of the number of inbound packets per second.
· Error Packet Receive
Rate—Number of inbound erroneous packets per
second on the VM network interface. Click the History Record icon ![]() to view the
history graph of the number of inbound erroneous packets per second.
to view the
history graph of the number of inbound erroneous packets per second.
· Discarded Packet
Receive Rate—Number of inbound packets discarded
per second on the VM network interface. Click the History Record icon ![]() to view the
history graph of the number of packets discarded per second.
to view the
history graph of the number of packets discarded per second.
· Byte Send Rate—Number of outbound bytes per second on the VM network interface.
Click the History Record icon ![]() to view the
history graph of the number of outbound bytes per second.
to view the
history graph of the number of outbound bytes per second.
· Packet Send Rate—Number of outbound packets per second on the VM network interface.
Click the History Record icon ![]() to view the
history graph of the number of outbound packets per second.
to view the
history graph of the number of outbound packets per second.
· Discarded Packet
Send Rate—Number of outbound packets discarded
per second on the VM network interface. Click the History Record icon ![]() to view the
history graph of the number of outbound packets discarded per second.
to view the
history graph of the number of outbound packets discarded per second.
· Error Packet Send Rate—Number of outbound erroneous packets per second on the VM network
interface. Click the History Record icon ![]() to view the
history graph of the number of outbound erroneous packets per second.
to view the
history graph of the number of outbound erroneous packets per second.
CAS
CAS is a computer virtualization product deployed by H3C. APM can monitor CAS 1.0 and CAS 2.0 through the CLI.
The following information describes how to add and modify a CAS application monitor, and view the monitor report.
Adding a CAS application monitor
Before you add a CAS application monitor, obtain the username and password of a user who has the CAS administrator's privileges. The username and password are required for adding the application monitor.
To add a CAS application monitor:
1. Click the Resource tab.
2. Open the Add Application page by using one of the following methods:
¡ From the navigation tree, select Application Manager > Add Application.
¡ From the navigation tree, select Application Manager > Application Monitor. In the application monitor list, click Add.
The Add Application page displays all application types that can be monitored by APM.
3. Click CAS of the Virtual Device Monitor class.
The page for adding a CAS application monitor opens.
4. Configure the following parameters:
¡ IP Address—Enter the IP address of the host on which the CAS server to be monitored is installed. APM automatically checks the IP address and associates the application monitor with the CAS server if it is already managed in the IMC platform. If the host is already added to the IMC platform, you can also click Select, and then select the CAS server in the Select Devices dialog box. For information about selecting a CAS server, see "Quick start."
¡ Name—Enter a unique application monitor name. As a best practice, name the application monitor as application type_host IP address.
¡ Use Template—Select Enable or Disable from the list.
¡ Template—Click
the Configure icon ![]() next to the Template field to select an existing template. The Template field
is automatically populated with the name of the selected template. For more
information about configuring application templates, see "Configuration management." This field is displayed only when you select Enable from the Use
Template list.
next to the Template field to select an existing template. The Template field
is automatically populated with the name of the selected template. For more
information about configuring application templates, see "Configuration management." This field is displayed only when you select Enable from the Use
Template list.
¡ Description—Enter a description for the application monitor.
¡ Polling Interval (min)—Select a polling interval for the application monitor. Options are 1, 2, 3, 4, 5, 10, 20, and 30. The default polling interval is 5 minutes. A shorter polling interval improves real-time data accuracy at the expense of system resources. This field is available only when you select Disable from the Use Template list.
¡ Username/Password—Enter the username and password of the CAS administrator. The fields are available only when you select Disable from the Use Template list.
¡ Contact—Enter the contact information, such as the name, email address, and telephone number. The default is the username of the operator who created the application monitor. This field is available only when you select Disable from the Use Template list.
¡ APM Server—Select an APM server to monitor the application. The options are in server-address (application-type:n/N) format. The letter n indicates the number of CAS applications monitored on the APM server. The letter N indicates the total number of applications monitored on the APM server. Server address 127.0.0.1 indicates that APM and the IMC platform are deployed on the same server.
¡ Related Applications—Click Add next to this field. On the Select Application window, enter a partial or complete name to filter applications, select the applications that the CAS server depends on, and then click OK.
Operating system applications cannot be selected. Operators can view all dependencies of the application in the dependency topology.
¡ Application Group—Specify an application group for the CAS application.
- To specify an existing application group, click Add, select an application group, and then click OK.
- To specify a new application group, click Add Application Group, configure the application group settings, and then click OK.
¡ Detect Application—Select this parameter if you want to enable application detection. APM verifies the application connectivity by using the previous parameter settings, and adds the application monitor only when it can connect to the application. If you do not select this parameter, APM adds the application monitor without verifying the application connectivity.
5. Click OK.
Modifying a CAS application monitor
Authorized users can modify all parameters except the IP address and the APM server for a CAS application monitor. When the IP address of a monitored CAS server changes, operators must add a new application monitor for the CAS server. The new application monitor cannot inherit the history data from the previous application monitor.
To modify a CAS application monitor:
1. Click the Resource tab.
2. From the navigation tree, select Application Manager > Application Monitor.
The application monitor list page displays all application monitors.
3. Click the Modify
icon ![]() for the CAS application monitor you want to modify.
for the CAS application monitor you want to modify.
The page for modifying the CAS application monitor opens.
4. Modify the parameters as needed, except the IP address and the APM server.
For more information about parameter settings, see "Adding a CAS application monitor."
5. Click OK.
Viewing the CAS application monitor report
After a CAS application monitor is added, APM collects index data of the application, evaluates the availability and health status, and updates the monitor report. The report shows the index values obtained from the most recent polling of the application.
To view the CAS application monitor report:
1. Click the Resource tab.
2. From the navigation tree, select Application Manager > Application Monitor.
The application monitor list page displays all application monitors.
3. Click the name of a CAS application monitor to display the report.
Figure 132 shows part of a CAS application monitor report.
Figure 132 Part of a CAS application monitor report
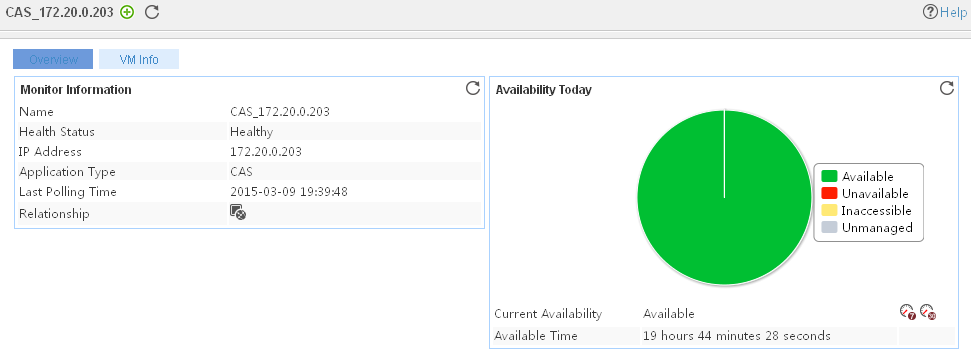
Monitor Information
The Monitor Information area contains the following fields:
· Name—Application monitor name.
· Health Status—Health status of the CAS server.
· IP Address—IP address of the CAS server.
· Application Type—Type of the monitored application, which is always CAS for a CAS application monitor.
· Last Polling Time—Time when APM last polled the CAS server.
· Relationship—Click the Relationship icon ![]() to view dependencies
between the CAS server and
other applications in a dependency topology view. For more information about dependency topologies, see "Topology and application group management."
to view dependencies
between the CAS server and
other applications in a dependency topology view. For more information about dependency topologies, see "Topology and application group management."
· Top5 Unrecovered Alarm—Latest five unrecovered alarms on the CAS server. This field is not displayed if no alarm is generated by the CAS server.
Availability Today
The Availability Today area contains the following fields:
· Current Availability—Availability of the CAS server.
¡ Click the Weekly History icon![]() to view the availability of the CAS server in the last 7 days.
to view the availability of the CAS server in the last 7 days.
¡ Click
the Monthly History icon![]() to view
the availability of the CAS server in the last 30 days.
to view
the availability of the CAS server in the last 30 days.
· Available Time—Total amount of time that the CAS server was available after 00:00 today.
· Unavailable Time—Total amount of time that the CAS server was unavailable after 00:00 today.
· Inaccessible Time—Total amount of time that the CAS server was inaccessible after 00:00 today.
· Unmanaged Time—Total amount of time that the CAS server was unmanaged after 00:00 today.
The statistics collection started when the application monitor was added. An availability time field is not displayed when its value is 0.
Basic Server Information
The Basic Server Information area contains the following fields:
· Host Name—Name of the host where the CAS server resides.
· CPU Model—CPU model of the CAS server.
· Logical CPUs—Number of logical CPUs on the CAS server. Number of logical CPUs = Number of CPU slots * Number of cores per slot * Number of threads per core.
· CPU Frequency (MHz)—CPU frequency of the CAS server.
· CPU Slots—Number of CPU slots on the CAS server.
· Cores per Slot—Number of cores in each slot on the CAS server.
· Threads per Core—Number of threads in each core on the CAS server.
· NUMA Nodes—Number of NUMA nodes on the CAS server.
· Memory Capacity—Memory size of the CAS server.
VM List
The VM List area contains the following fields:
· VM ID—ID of the VM. Only VMs that are in running state have IDs.
· Name—Name of the VM.
· Status—Status of the VM.
Server CPU Information
The Server CPU Information area contains the following fields:
· Server CPU Information dashboard or trend graph—View the area in a dashboard or a trend graph.
¡ Dashboard graph—Shows the CPU usage of the CAS server.
¡ Trend graph—Shows the CPU usage trend of the CAS server over a specific time range in a line graph.
· In Use—CPU usage of the CAS server.
¡ Click
the Set Threshold icon ![]() to set alarm thresholds for the CPU usage.
to set alarm thresholds for the CPU usage.
¡ Click the History
Record icon ![]() to view the history
graph of the CPU usage.
to view the history
graph of the CPU usage.
· User—Percentage of CPU resources used by the CAS server to process user
requests. Click the History Record
icon ![]() to view the history graph of the percentage of CPU resources used
by the CAS server to process user requests.
to view the history graph of the percentage of CPU resources used
by the CAS server to process user requests.
· OS—Percentage of CPU resources used by the CAS management system.
Click the History Record
icon ![]() to view the history graph of the percentage of CPU resources used
by the CAS management system.
to view the history graph of the percentage of CPU resources used
by the CAS management system.
· Free—Percentage of free CPU resources on the CAS server. Click the History Record icon ![]() to view the history graph of the percentage of free CPU resources
on the CAS server.
to view the history graph of the percentage of free CPU resources
on the CAS server.
· Waiting I/O—Percentage of CPU resources used by the CAS server to wait for I/O
operations. Click the History Record
icon ![]() to view the history graph of the percentage of CPU resources used
by the CAS server to wait for I/O operations.
to view the history graph of the percentage of CPU resources used
by the CAS server to wait for I/O operations.
Server Memory Information
The Server Memory Information area contains the following fields:
· Server Memory Information dashboard or
trend graph—View the
area in a dashboard or a trend graph. Click the Dashboard
icon ![]() or Trend icon
or Trend icon ![]() on the top right corner to switch between
the graphs.
on the top right corner to switch between
the graphs.
¡ Dashboard graph—Shows the memory usage of the CAS server.
¡ Trend graph—Shows the memory usage trend of the CAS server over a specific time range in a line graph.
· Total—Total memory size of the CAS server. Click the History Record icon ![]() to view the history graph of the total memory size.
to view the history graph of the total memory size.
· Free—Free memory size of the CAS server. Click the History
Record icon ![]() to view the history
graph of the free memory size.
to view the history
graph of the free memory size.
· Buffer—Buffer memory size of the CAS server. Click the History Record icon ![]() to view the history graph of the buffer memory size.
to view the history graph of the buffer memory size.
· Cache—Cache memory size of the CAS server. Click the History Record icon ![]() to view the history graph of the cache memory size.
to view the history graph of the cache memory size.
· Usage—Memory usage of the CAS server. Click the History Record
icon ![]() to view the history graph of the memory usage.
to view the history graph of the memory usage.
File System Usage
The File System Usage area contains the following fields:
· Mount Point—Mount point of the file system in the operating system directory structure.
· Usage—Space usage of the file system.
¡ Click
the Set Threshold icon ![]() to set alarm
thresholds for the space usage.
to set alarm
thresholds for the space usage.
¡ Click
the History Record icon ![]() to view the history graph of the space
usage.
to view the history graph of the space
usage.
· Capacity—Capacity of the file system.
· In Use—Used space of the file system.
· Available—Free space of the file system.
Network Interface Statistics
The Network Interface Statistics area contains the following fields:
· Interface—Name of the network interface.
· MTU—Maximum transmission unit of the network interface. A packet whose size exceeds the MTU will be fragmented.
· Metric—Metric of the network interface. Click the History Record
icon ![]() to view the
history graph of the metric.
to view the
history graph of the metric.
· Correct at Receiving—Number of inbound correct packets per second on the network
interface. Click the History Record icon ![]() to view the
history graph of the number of inbound correct packets per second.
to view the
history graph of the number of inbound correct packets per second.
· Error at Receiving—Number of inbound erroneous packets per second on the network
interface. Click the History Record icon ![]() to view the
history graph of the number of inbound erroneous packets per second.
to view the
history graph of the number of inbound erroneous packets per second.
· Discarded at
Receiving—Number of inbound packets discarded
per second on the network interface due to packet receiving rate limit. Click
the History Record icon ![]() to view the
history graph of the number of inbound packets discarded per second.
to view the
history graph of the number of inbound packets discarded per second.
· Lost at Receiving—Number of lost inbound packets per second on the network interface.
Click the History Record icon ![]() to view the
history graph of the number of lost inbound packets per second.
to view the
history graph of the number of lost inbound packets per second.
· Correct at Sending—Number of outbound correct packets per second on the network
interface. Click the History Record icon ![]() to view the
history graph of the number of outbound correct packets per second.
to view the
history graph of the number of outbound correct packets per second.
· Error at Sending—Number of outbound erroneous packets per second on the network
interface. Click the History Record icon ![]() to view the
history graph of the number of outbound erroneous packets per second.
to view the
history graph of the number of outbound erroneous packets per second.
· Discarded at Sending—Number of outbound packets discarded per second on the network
interface. Click the History Record icon ![]() to view the
history graph of the number of outbound packets discarded per second.
to view the
history graph of the number of outbound packets discarded per second.
· Discarded due to
Exceeded Sending Rate—Number of outbound packets
discarded per second on the network interface due to packet sending rate limit.
Click the History Record icon ![]() to view the
history graph of the number of outbound packets discarded per second.
to view the
history graph of the number of outbound packets discarded per second.
· Flag—Flags of the network interface.
¡ B—The broadcast address has been set.
¡ L—The network interface is a loopback interface.
¡ M—The network interface is operating in promiscuous mode. In this mode, the network interface can receive all packets.
¡ R—The network interface is running.
¡ U—The network interface is active.
Basic VM Information
The Basic VM Information area contains the following fields:
· VM ID—ID of the VM.
· VM Name—Name of the VM.
· UUID—Universally unique identifier of the VM.
· OS Type—Virtualization type of the VM. The hvm value represents full virtualization.
· Status—Status of the VM.
· CPUs—Number of virtual CPUs assigned to the VM.
· CPU Processing Duration—Duration occupied by the VM to process data.
· Max. Memory—Maximum memory size of the VM.
· Used Memory—Used memory space of the VM.
· Persistent—Whether the VM is in persistent or temporary state.
· Auto Start—Whether the VM automatically starts up.
· Saving Status—Whether the VM is in saving state. A VM in saving state saves its current status and restores the most recently saved status at next startup.
· Security Mode—Security mode of the VM.
· Security DOI—Security domain of interpretation for the VM.
Virtual CPU Information
The Virtual CPU Information area contains the following fields:
· VM Name—Name of the VM to which the virtual CPU belongs.
· CPU ID—ID of the virtual CPU.
· Usage—Virtual CPU usage of the VM. Click the History Record icon ![]() to view the
history graph of the virtual CPU usage.
to view the
history graph of the virtual CPU usage.
· Status—Status of the VM.
· CPU Processing Duration—Duration occupied by the VM to process data.
· CPU Affinity Mask—CPU affinity for the VM. The number of y indicates the number of logical CPUs for the VM.
VM Disk Image Files
A VM disk image file represents a disk for the VM. A VM disk is uniquely identified by VM name and target device.
The VM Disk Image Files area contains the following fields:
· VM Name—Name of the VM to which the VM disk image file belongs.
· Target—Target device mapped to the disk image file in the VM.
· Source—Source file of the disk image file on the CAS server.
Image File Details
The Image File Details area contains the following fields:
· VM Name—Name of the VM to which the VM disk image file belongs.
· Capacity—Capacity of the VM disk.
· Grant—Space assigned to the VM disk.
· Physical Disk Information—Physical disk space occupied by the VM disk on the CAS server.
VM Network Interface List
Each VM network interface represents a NIC of the VM.
The VM Network Interface List area contains the following fields:
· VM Name—Name of the VM to which the network interface belongs.
· Interface Name—Name of the VM network interface.
· Type—Type of the VM network interface.
· Source Interface—vSwitch to which the network interface connects.
· Mode—Operating mode of the VM network interface.
· MAC Address—MAC address of the VM network interface.
VM Network Interface Statistics
The VM Network Interface Statistics area contains the following fields:
· VM Name—Name of the VM to which the network interface belongs.
· Byte Receive Rate—Number of inbound bytes per second on the VM network interface.
Click the History Record icon ![]() to view the
history graph of the number of inbound bytes per second.
to view the
history graph of the number of inbound bytes per second.
· Packet Receive Rate—Number of inbound packets per second on the VM network interface.
Click the History Record icon ![]() to view the
history graph of the number of inbound packets per second.
to view the
history graph of the number of inbound packets per second.
· Error Packet Receive
Rate—Number of inbound erroneous packets per
second on the VM network interface. Click the History Record icon ![]() to view the
history graph of the number of inbound erroneous packets per second.
to view the
history graph of the number of inbound erroneous packets per second.
· Lost Packet Receive
Rate—Number of lost inbound packets per second
on the VM network interface. Click the History Record icon ![]() to view the
history graph of the number of lost inbound packets per second.
to view the
history graph of the number of lost inbound packets per second.
· Byte Send Rate—Number of outbound bytes per second on the VM network interface.
Click the History Record icon ![]() to view the
history graph of the number of outbound bytes per second.
to view the
history graph of the number of outbound bytes per second.
· Packet Send Rate—Number of outbound packets per second on the VM network interface.
Click the History Record icon ![]() to view the
history graph of the number of outbound packets per second.
to view the
history graph of the number of outbound packets per second.
· Lost Packet Send
Rate—Number of lost outbound packets per second
on the VM network interface. Click the History Record icon ![]() to view the
history graph of the number of lost outbound packets per second.
to view the
history graph of the number of lost outbound packets per second.
· Error Packet Send
Rate—Number of outbound erroneous packets per
second on the VM network interface. Click the History Record icon ![]() to view the
history graph of the number of outbound erroneous packets per second.
to view the
history graph of the number of outbound erroneous packets per second.
PowerCenter
PowerCenter is a server management software that uses virtualization and cloud computation technologies.
APM supports monitoring PowerCenter through REST API.
Adding a PowerCenter application monitor
Before you add a PowerCenter application monitor, contact the PowerCenter administrator to obtain the following information:
· The PowerCenter listening port number.
· The username and password of a user who has the PowerCenter administrator's privileges.
To add a PowerCenter application monitor:
1. Click the Resource tab.
2. Open the Add Application page by using one of the following methods:
¡ From the navigation tree, select Application Manager > Add Application.
¡ From the navigation tree, select Application Manager > Application Monitor. In the application monitor list, click Add.
The Add Application page displays all application types that can be monitored by APM.
3. Click PowerCenter of the Virtual Device Monitor class.
The page for adding a PowerCenter application monitor opens.
4. Configure the following parameters:
¡ IP Address—Enter the IP address of the host on which the PowerCenter application to be monitored is installed. APM automatically checks the IP address and associates the application monitor with the host if the host is already managed in the IMC platform. If the host is already managed in the IMC platform, you can also click Select, and then select the host in the Select Devices window. For information about selecting a host, see "Selecting devices."
¡ Name—Enter a unique application monitor name. As a best practice, name the application monitor as application type_host IP address.
¡ Use Template—Select Enable or Disable from the list.
¡ Template—Click the Configure icon ![]() next to the Template field to select an
existing template. The Template field is
automatically populated with the name of the selected template. This field is
displayed only when you select Enable from the Use Template list.
next to the Template field to select an
existing template. The Template field is
automatically populated with the name of the selected template. This field is
displayed only when you select Enable from the Use Template list.
¡ Description—Enter a description for the application monitor.
¡ Application Monitor Port—Enter the PowerCenter listening port number. The default port number is 8080.
¡ Polling Interval (min)—Select a polling interval for the application monitor. Available options are 1, 2, 3, 4, 5, 10, 20, and 30. The default polling interval is 5 minutes. A shorter polling interval improves real-time data accuracy at the expense of system resources. This field is available only when you select Disable from the Use Template list.
¡ Username—Enter the username of a PowerCenter user who has the administrator's privileges.
¡ Password—Enter the password of the PowerCenter user.
¡ Contact—Enter the contact information, such as the name, email address, and telephone number. The default is the username of the operator who created the application monitor. This field is available only when you select Disable the Use Template list.
¡ APM Server—Select an APM server to monitor the application. The options are in server-address (application-type:n/N) format. The letter n indicates the number of PowerCenter applications monitored on the APM server. The letter N indicates the total number of applications monitored on the APM server. Server address 127.0.0.1 indicates that APM and the IMC platform are deployed on the same server.
¡ Related Applications—Click Add next to this field. On the Select Application window, enter a partial or complete name to filter applications, select the applications that PowerCenter depends on, and then click OK.
Operating system applications cannot be selected.
Operators can view all dependencies of the application in the dependency topology.
¡ Application Group—Specify an application group for the PowerCenter application.
- To specify an existing application group, click Add, select an application group, and then click OK.
- To specify a new application group, click Add Application Group, configure the application group settings, and then click OK.
¡ Detect Application—Select this parameter if you want to enable application detection. Application detection enables APM to verify the connectivity to the application by using the previous parameter settings. APM adds the application monitor only when it can connect to the application. When this parameter is not selected, APM adds the application monitor without verifying the application connectivity.
5. Click OK.
Modifying a PowerCenter application monitor
Authorized users can modify all parameters except the IP address and the APM server for a PowerCenter application monitor. When the IP address of a monitored PowerCenter host changes, operators must add a new application monitor for the host. However, the new application monitor cannot inherit the history data from the previous application monitor.
To modify a PowerCenter application monitor:
1. Click the Resource tab.
2. From the navigation tree, select Application Manager > Application Monitor.
The application monitor list page opens.
3. Click the Modify
icon ![]() for the PowerCenter application monitor you want to modify.
for the PowerCenter application monitor you want to modify.
The page for modifying the PowerCenter application monitor opens.
4. Modify the parameters as needed, except the IP address and the APM server.
For more information about parameter settings, see "Adding a PowerCenter application monitor."
5. Click OK.
Viewing the PowerCenter application monitor report
After a PowerCenter application monitor is added, APM collects index data of the application, evaluates the availability and health status, and updates the monitor report. The report shows the index values obtained from the most recent polling of the application.
To access the PowerCenter application monitor report:
1. Click the Resource tab.
2. From the navigation tree, select Application Manager > Application Monitor.
The application monitor list page displays all application monitors.
3. Click the name of a PowerCenter application monitor to display the report.
Figure 133 shows part of a PowerCenter application monitor report.
Figure 133 Part of a PowerCenter application monitor report
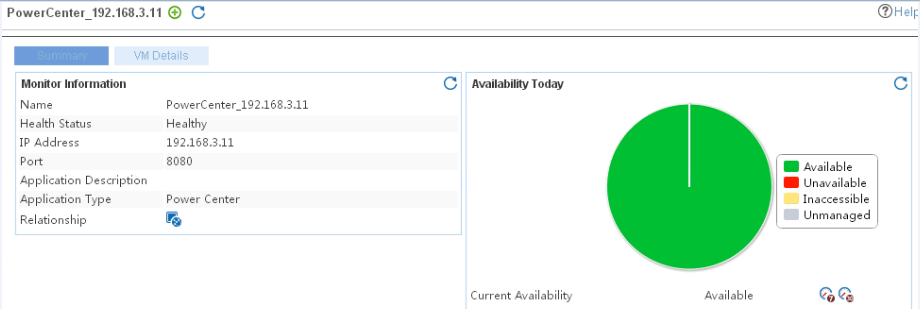
Monitor Information
The Monitor Information area contains the following fields:
· Name—Application monitor name.
· Health Status—Health status of the PowerCenter application.
· IP Address—IP address of the PowerCenter application.
· Port—Listening port number of the PowerCenter application.
· Application Description—Description of the PowerCenter application.
· Application Type—Type of the monitored application, which is Power Center.
· Version—Version of the PowerCenter application.
· Status—Running status of PowerCenter application.
· Last Polling Time—Time when APM last polled the PowerCenter application.
· Relationship—Click the Relationship
icon ![]() to view dependencies
between PowerCenter and other
applications in a dependency topology view. For more information
about dependency topologies, see "Topology and application group management."
to view dependencies
between PowerCenter and other
applications in a dependency topology view. For more information
about dependency topologies, see "Topology and application group management."
· Top5 Unrecovered Alarm—Latest five unrecovered alarms on the PowerCenter application. The alarm level is identified by color: yellow for minor alarms, orange for major alarms, and red for critical alarms. This field is not displayed if no alarm is generated by the PowerCenter application.
Availability Today
The Availability Today area contains the following fields:
· Current Availability—Availability of the PowerCenter application.
¡ Click
the Weekly History icon![]() to view the availability of the PowerCenter
application in the last 7 days.
to view the availability of the PowerCenter
application in the last 7 days.
¡ Click
the Monthly History icon![]() to view the availability of the PowerCenter application in the last 30 days.
to view the availability of the PowerCenter application in the last 30 days.
· Available Time—Total amount of time that the PowerCenter application was available after 00:00 today.
· Unavailable Time—Total amount of time that the PowerCenter application was unavailable after 00:00 today.
· Inaccessible Time—Total amount of time that the PowerCenter application was inaccessible after 00:00 today.
· Unmanaged Time—Total amount of time that the PowerCenter application was unmanaged after 00:00 today.
The statistics collection started when the application monitor was added. An availability time field is not displayed when its value is 0.
Cluster CPU Detail
The Cluster CPU Detail area contains the following fields:
· Total CPU Cores—Total number of CPU cores of hosts managed by PowerCenter.
· Free CPU Cores—Number of free CPU cores of hosts managed by PowerCenter.
· Cluster CPU Usage Ratio—CPU usage ratio of the cluster.
You can click the
History Record icon ![]() to view the history graph of a monitor index.
to view the history graph of a monitor index.
Cluster Memory Detail
The Cluster Memory Detail area contains the following fields:
· Total Memory Size—Total physical memory size of hosts managed by PowerCenter.
· Free Memory Size—Free physical memory of hosts managed by PowerCenter.
· Cluster Memory Usage Ratio—Memory usage ratio of the cluster.
You can click the
History Record icon ![]() to view the history graph of a monitor index.
to view the history graph of a monitor index.
Cluster Disk Detail
The Cluster Disk Detail area contains the following fields:
· Total Disk Size—Total disk capacity of hosts managed by PowerCenter.
· Free Disk Size—Free disk space of hosts managed by PowerCenter.
· Cluster Disk Usage Ratio—Disk usage ratio of the cluster.
You can click the Set
Threshold icon ![]() to set
alarm thresholds for a monitor index, and click the History
Record icon
to set
alarm thresholds for a monitor index, and click the History
Record icon ![]() to
view the history graph of a monitor index.
to
view the history graph of a monitor index.
Memory Details
The Memory Details area contains the following fields:
· Host Name—Name of the host.
· Total Memory Size—Total physical memory size of the host.
· Free Memory Size—Free physical memory size of the host.
· Memory Usage Ratio—Memory usage ratio of the host.
You can click the Set
Threshold icon ![]() to set
alarm thresholds for a monitor index, and click the History
Record icon
to set
alarm thresholds for a monitor index, and click the History
Record icon ![]() to
view the history graph of a monitor index.
to
view the history graph of a monitor index.
Disk Details
The Disk Details area contains the following fields:
· Host Name—Name of the host.
· Total Disk Size—Total disk size of the host.
· Free Disk Size—Free disk size of the host.
· Disk Usage Ratio—Disk usage ratio of the host.
· The Disk Details area contains the following fields:
VM List
The VM List area contains the following fields:
· Host Name—Name of the host.
· VM Name—Name of the VM.
CPU Details
The CPU Details area contains the following fields:
· Host Name—Name of the host.
· Total CPU Cores—Total number of CPU cores on the host.
· Free CPU Cores—Number of free CPU cores on the host.
· CPU Usage Ratio—CPU usage ratio of the host.
· IP—IP address of the host.
· Type—Type of the host.
· Status—Status of the host.
· Run Time—Run time of the host.
Warn Details
The Warn Details area contains the following fields:
· Warn Object—Name of the warning object, which can be a host or virtual machine.
· Warn Log Id—ID of the warning log.
· Begin Time—Begin time of the warning.
· End Time—End time of the warning.
· Warn Condition—Condition of the warning.
· Warn Line—Line of the warning.
· Time—Time that the warning lasts for.
· Warn Level—Level of the warning.
VM Information
The VM Information area contains the following fields:
· VM Name—Name of VM.
· IP—IP address of the VM.
· OS—OS of the VM.
· Status—Status of the VM.
· Run Time—Run Time of the VM.
VM CPU Information
The VM CPU Information area contains the following fields:
· VM Name—Name of the VM.
· CPU Cores—Number of CPU cores on the VM.
· Level 3 Cache Size—Size of level 3 cache on the VM.
· RunTime—Run time of the CPU.
· CPU Usage Ratio—CPU usage ratio of the VM.
VM Memory Information
The VM Memory Information area contains the following fields:
· VM Name—Name of the VM.
· Total Memory Size—Total physical memory size of the VM.
· Memory Band Width—Memory bandwidth of the VM.
· Used Memory Size—Used physical memory size of the VM.
· Memory Usage Ratio—Memory usage ratio of the VM.
VM Disk Information
The VM Disk Information area contains the following fields:
· VM Name—Name of the VM.
· Disk Name—Name of the disk.
· Total Size—Total disk size of the VM.
· Used Size—Used disk size of the VM.
· Disk Usage Ratio—Disk usage ratio of the VM.
· Disk Total pps—Total number of disk pps on the VM.
· Disk Used pps—Number of used disk pps on the VM.
· Disk Free pps—Number of free disk pps on the VM.
· Disk Vscsi—Disk vscsi of the VM.
· Slot Number—Disk slot number of the VM.
· VG—VG of the disk on the VM.
· Number of lv—Number of logical volumes of the disk on the VM.
VM Disk IO Information
The VM Disk IO Information area contains the following fields:
· VM Name—Name of the VM.
· Disk Name—Name of disk.
· Bytes Read/Sec—Data read rate of the disk per second on the VM.
· Bytes Write/Sec—Data write rate of the disk per second on the VM.
· Times Read/Sec—Data read times of the disk per second on the VM.
· Times Write/Sec—Data write times of the disk per second on the VM.
· Total Bytes Read—Total bytes read from the disk on the VM since bootup.
· Total Bytes Write—Total bytes written to the disk on the VM since bootup.
VM NIC Information
The VM NIC Information area contains the following fields:
· VM Name—Name of the VM.
· NIC Name—Name of the NIC on the VM. The NIC name starts with en when the VM operating system is AIX. The NIC name starts with ent when the VM operating system is Linux.
· IP—IP address of the NIC on the VM.
· Subnet Mask—Subnet mask of the NIC on the VM.
· Gateway—Gateway of the NIC on the VM.
· MAC—MAC address of the NIC on the VM.
· Slot Number—Slot Number of the NIC on the VM.
· Physical NIC—Physical NIC name of the NIC on the VM.
· Virtual NIC—Virtual NIC name of the NIC on the VM.
· NIC Type—Type of the NIC on the VM.
· VLAN Information—VLAN information of the NIC on the VM.
VM NIC Information
The VM Net Card Performance area contains the following fields:
· VM Name—Name of the VM.
· NIC Name—Name of the NIC. The NIC name starts with en when the VM operating system is AIX. The NIC name starts with ent when the VM operating system is Linux.
· Bytes In/Sec—Inbound data bytes of the NIC per second on the VM.
· Bytes Out/Sec—Outbound data bytes of the NIC per second on the VM.
· Total Bytes In—Total inbound data bytes of the NIC on the VM since bootup.
· Total Bytes Out—Total outbound data bytes of the NIC on the VM since bootup.
· Packages In/Sec—Inbound packets of the NIC per second on the VM.
· Packages Out/Sec—Outbound packets of the NIC per second on the VM.
· Total Packages In—Total packages in of the NIC on the VM since bootup.
· Total Packages Out—Total packages out of the NIC on the VM since bootup.
VMware ESX
VMware ESX is an enterprise-level computer virtualization product offered by VMware. APM can monitor VMware ESX 5.1 through APIs that are provided by VMware ESX.
The following information describes how to add and modify a VMware ESX application monitor, and how to view the monitor report.
Adding a VMware ESX application monitor
Before you add a VMware ESX application monitor, obtain the username and password of a user who has the VMware ESX administrator's privileges. The username and password are required for adding the application monitor.
To add a VMware ESX application monitor:
1. Click the Resource tab.
2. Open the Add Application page by using one of the following methods:
¡ From the navigation tree, select Application Manager > Add Application.
¡ From the navigation tree, select Application Manager > Application Monitor. In the application monitor list, click Add.
The Add Application page displays all application types that can be monitored by APM.
3. Click VMware ESX of the Virtual Device Monitor class.
The page for adding a VMware ESX application monitor opens.
4. Configure the following parameters:
¡ IP Address—Enter the IP address of the host on which the VMware ESX server to be monitored is installed. APM automatically checks the IP address and associates the application monitor with the VMware ESX server if it is already managed in the IMC platform. If the host is already added to the IMC platform, you can also click Select, and then select the VMware ESX server in the Select Devices dialog box. For information about selecting a VMware ESX server, see "Quick start."
¡ Name—Enter a unique application monitor name. As a best practice, name the application monitor as application type_host IP address.
¡ Use Template—Select Enable or Disable from the list.
¡ Template—Click
the Configure icon ![]() next to the Template field to select an existing template. The Template field
is automatically populated with the name of the selected template. For more
information about configuring application templates, see "Quick start."
This field is displayed only when you select Enable from the Use Template
list.
next to the Template field to select an existing template. The Template field
is automatically populated with the name of the selected template. For more
information about configuring application templates, see "Quick start."
This field is displayed only when you select Enable from the Use Template
list.
¡ Description—Enter a description for the application monitor.
¡ Polling Interval (min)—Select a polling interval for the application monitor. Options are 1, 2, 3, 4, 5, 10, 20, and 30. The default polling interval is 5 minutes. A shorter polling interval improves real-time data accuracy at the expense of system resources. This field is available only when you select Disable from the Use Template list.
¡ Username/Password—Enter the username and password of the VMware ESX administrator. The fields are available only when you select Disable from the Use Template list.
¡ Contact—Enter the contact information, such as the name, email address, and telephone number. The default is the username of the operator who created the application monitor. This field is available only when you select Disable from the Use Template list.
¡ APM Server—Select an APM server to monitor the application. The options are in server-address (application-type:n/N) format. The letter n indicates the number of VMware ESX applications monitored on the APM server. The letter N indicates the total number of applications monitored on the APM server. Server address 127.0.0.1 indicates that APM and the IMC platform are deployed on the same server.
¡ Related Applications—Click Add next to this field. On the Select Application window, enter a partial or complete name to filter applications, select the applications that the VMware ESX server depends on, and then click OK.
Operating system applications cannot be selected. Operators can view all dependencies of the application in the dependency topology.
¡ Application Group—Specify an application group for the VMware ESX application.
- To specify an existing application group, click Add, select an application group, and then click OK.
- To specify a new application group, click Add Application Group, configure the application group settings, and then click OK.
¡ Detect Application—Select this parameter if you want to enable application detection. APM verifies the application connectivity by using the previous parameter settings, and adds the application monitor only when it can connect to the application. If you do not select this parameter, APM adds the application monitor without verifying the application connectivity.
5. Click OK.
Modifying a VMware ESX application monitor
Authorized users can modify all parameters except the IP address and the APM server for a VMware ESX server. When the IP address of a monitored VMware ESX server changes, operators must add a new application monitor for the VMware ESX server. The new application monitor cannot inherit the history data from the previous application monitor.
To modify a VMware ESX application monitor:
1. Click the Resource tab.
2. From the navigation tree, select Application Manager > Application Monitor.
The application monitor list page displays all application monitors.
3. Click the Modify
icon ![]() for the VMware ESX application monitor you want to modify.
for the VMware ESX application monitor you want to modify.
The page for modifying the VMware ESX application monitor opens.
4. Modify the parameters as needed, except the IP address and the APM server.
For more information about parameter settings, see "Adding a VMware ESX application monitor."
5. Click OK.
Viewing the VMware ESX application monitor report
After a VMware ESX application monitor is added, APM collects index data of the application, evaluates the availability and health status, and updates the monitor report. The report shows the index values obtained from the most recent polling of the application.
To view the VMware ESX application monitor report:
1. Click the Resource tab.
2. From the navigation tree, select Application Manager > Application Monitor.
The application monitor list page displays all application monitors.
3. Click the name of a VMware ESX application monitor to display the report.
Figure 134 shows part of a VMware ESX application monitor report. The VMware ESX application monitor report contains the Summary, VM Detail, and Hardware tabs.
Figure 134 Part of a VMware ESX application monitor report
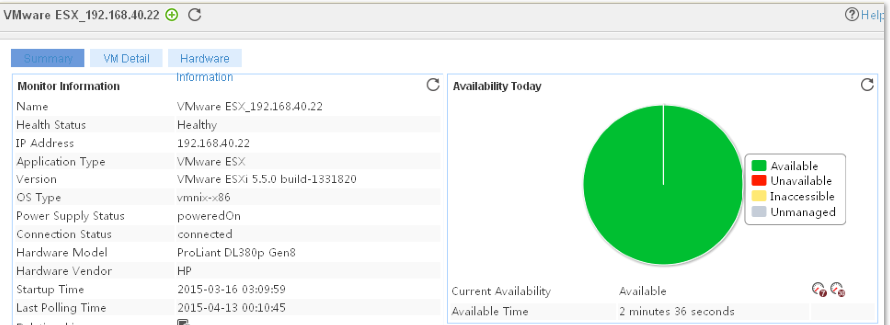
Monitor Information
The Monitor Information area contains the following fields:
· Name—Application monitor name.
· Health Status—Health status of the VMware ESX server.
· IP Address—IP address of the VMware ESX server.
· Application Type—Type of the monitored application, which is always VMware ESX for a VMware ESX application monitor.
· Version—Version of the VMware ESX server.
· OS Type—OS type of the VMware ESX server. The OS can be one of the following types:
¡ win32-x86—An x86-based version of Windows operating system.
¡ linux-x86—An x86-based version of Linux operating system.
¡ vmnix-x86—VMware ESX server based on x86.
· Power Supply Status—Status of the power supply for the VM.
· Connection Status—Whether the VM is connected to the VMware ESX server.
· Hardware Model—Model of the VMware ESX server.
· Hardware Vendor—Vendor of the VMware ESX server.
· Startup Time—Time when the VM most recently started up.
· Last Polling Time—Time when APM last polled the VMware ESX server.
· Relationship—Click the Relationship icon ![]() to view
dependencies between the VMware ESX server and other applications in a
dependency topology view. For more information about
dependency topologies, see "Topology and application group management."
to view
dependencies between the VMware ESX server and other applications in a
dependency topology view. For more information about
dependency topologies, see "Topology and application group management."
· Top5 Unrecovered Alarm—Latest five unrecovered alarms on the VMware ESX server. This field is not displayed if no alarm is generated by the VMware ESX server.
Availability Today
The Availability Today area contains the following fields:
· Current Availability—Availability of the VMware ESX server.
¡ Click
the Weekly History icon![]() to view the availability of the VMware ESX application in the last
7 days.
to view the availability of the VMware ESX application in the last
7 days.
¡ Click
the Monthly History icon![]() to view the availability of the VMware ESX application in the last
30 days.
to view the availability of the VMware ESX application in the last
30 days.
· Available Time—Total amount of time that the VMware ESX server was available after 00:00 today.
· Unavailable Time—Total amount of time that the VMware ESX server was unavailable after 00:00 today.
· Inaccessible Time—Total amount of time that the VMware ESX server was inaccessible after 00:00 today.
· Unmanaged Time—Total amount of time that the VMware ESX server was unmanaged after 00:00 today.
The statistics collection started when the application monitor was added. An availability time field is not displayed when its value is 0.
CPU Usage Ratio
The CPU Usage Ratio area contains the following fields:
· CPU Usage Ratio dashboard or trend graph—View the area in a dashboard or a trend graph.
¡ Dashboard graph—View the processor usage ratio of the VMware ESX server.
¡ Trend graph—View the changes of the processor usage ratio for the VMware ESX server in a line chart.
· CPU Usage Ratio—Processor usage ratio of the VMware ESX server. Click the History Record icon ![]() to view the history
graph of the processor usage ratio.
to view the history
graph of the processor usage ratio.
· CPU Idle Time—Duration for
which the processor on the VMware ESX server is idle. Click the History Record icon ![]() to view the history graph of the processor idle duration.
to view the history graph of the processor idle duration.
· CPU Usage MHz—Processor usage for the VMware ESX server.
· CPU Frequency—Processor frequency for the VMware ESX server.
· CPU Model—Processor model for the VMware ESX server.
· CPU Count—Number of processor cores for the VMware ESX server.
· CPU Package Count—Number of processor packages for the VMware ESX server.
· CPU Threads Count—Number of processor threads for the VMware ESX server.
Memory Usage Ratio
The Memory Usage Ratio area contains the following fields:
· Memory Usage Ratio dashboard or trend graph—View the area in a dashboard or a trend graph.
¡ Dashboard graph—View the memory usage ratio of the VMware ESX server.
¡ Trend graph—View the changes of the memory usage ratio for the VMware ESX server in a line chart.
· Memory Usage Ratio—Memory usage ratio of the VMware ESX server. Click the History Record icon ![]() to view the history
graph of the memory usage ratio.
to view the history
graph of the memory usage ratio.
· Memory Size—Total memory size. Click the History Record icon ![]() to view the history
graph of the total memory size.
to view the history
graph of the total memory size.
· Consumed Memory—Size of the memory consumed by the VMware ESX server. Click the History
Record icon ![]() to view the history
graph of the consumed memory size.
to view the history
graph of the consumed memory size.
· Active Memory—Active memory size for the VMware ESX server. Click the History Record icon ![]() to view the history
graph of the active memory size.
to view the history
graph of the active memory size.
· Overhead Memory—Overhead memory size for the VMware ESX server. Click the History Record icon ![]() to view the history
graph of the overhead memory size.
to view the history
graph of the overhead memory size.
· Reserved Memory—Reserved memory size for the VMware ESX server. Click the History Record icon ![]() to view the history
graph of the reserved memory size.
to view the history
graph of the reserved memory size.
· Shared Memory—Shared memory size for the VMware ESX server. Click the History Record icon ![]() to view the history
graph of the shared memory size.
to view the history
graph of the shared memory size.
· Granted Memory—Memory size assigned to the VMware ESX server. Click the History Record icon ![]() to view the history
graph of the assigned memory size.
to view the history
graph of the assigned memory size.
· Swap Used Memory—Swap memory size for the VMware ESX server. Click the History Record icon ![]() to view the history
graph of the swap memory size.
to view the history
graph of the swap memory size.
· Heap Memory—Heap memory size for the VMware ESX server. Click the History Record icon ![]() to view the history
graph of the heap memory size.
to view the history
graph of the heap memory size.
· System Usage Memory—System usage memory size for the
VMware ESX server. Click the History Record icon ![]() to view the history graph of the system usage memory size.
to view the history graph of the system usage memory size.
Datastore Information
The Datastore Information area contains the following fields:
· Name—Name of the data store for the VMware ESX server.
· Type—Type of the data store for the VMware ESX server.
· URL—Path of the data store for the VMware ESX server.
· Capacity—Capacity of the data store for the VMware ESX server.
· Used Space—Used space of the data store for the VMware ESX server.
· Free Space—Free space of the data store for the VMware ESX server.
· Usage Ratio—Usage of the data store for the VMware ESX server. Click the History Record icon ![]() to view the history
graph of the data store usage ratio.
to view the history
graph of the data store usage ratio.
· Free Ratio—Ratio of the data store that is not used for the VMware ESX server. Click the History
Record icon ![]() to view the history
graph of the free ratio.
to view the history
graph of the free ratio.
CPU Detail
The CPU Detail area contains the following fields:
· CPU ID—ID of the processor for the VMware ESX server.
· CPU Usage Ratio—Processor usage ratio for the VMware ESX server. Click the History Record icon ![]() to view the history
graph of the processor usage ratio.
to view the history
graph of the processor usage ratio.
· CPU Idle Time—Duration for which the processor on the VMware ESX server is idle.
Click the History Record
icon ![]() to view the history graph of the processor idle duration.
to view the history graph of the processor idle duration.
Net Card Performance
The Net Card Performance area contains the following fields:
· Name—Name of the NIC for the VMware ESX server.
· Receive Rate—Receive rate of the NIC for the VMware ESX server.
· Send Rate—Send rate of the NIC for the VMware ESX server.
· Packets Received—Number of packets received by the NIC on the VMware ESX server.
Click the History Record
icon ![]() to view the history graph of the packets received.
to view the history graph of the packets received.
· Packets Sent—Number of packets sent by the NIC on the VMware ESX server. Click
the History Record icon
![]() to view the history graph of the packets sent.
to view the history graph of the packets sent.
Datastore Performance
The Datastore Performance area contains the following fields:
· Datastore Name—Name of the data store for the VMware ESX server.
· Read Rate—Read rate of the data store for the VMware ESX server. Click the History Record icon ![]() to view the history graph of the data store read rate.
to view the history graph of the data store read rate.
· Write Rate—Write rate of the data store for the VMware ESX server. Click the History Record icon ![]() to view the history graph of the data store write rate.
to view the history graph of the data store write rate.
· Read Latency—Read latency of the data store for the VMware ESX server. Click the
History Record icon ![]() to view the history graph of the data store read latency.
to view the history graph of the data store read latency.
· Write Latency—Write latency of the data store for the VMware ESX server. Click
the History Record icon
![]() to view the history graph of the data store write latency.
to view the history graph of the data store write latency.
Disk I/O
The Disk I/O area contains the following fields:
· LUN—Logical unit number of the disk for the VMware ESX server.
· Read Rate—Read rate of the disk for the VMware ESX server. Click the History Record icon ![]() to view the history graph of the disk read rate.
to view the history graph of the disk read rate.
· Write Rate—Write rate of the disk for the VMware ESX server. Click the History Record icon ![]() to view the history graph of the disk read rate.
to view the history graph of the disk read rate.
· Read Number—Number of disk reads for the VMware ESX server. Click the History Record icon ![]() to view the history graph of the disk read number.
to view the history graph of the disk read number.
· Write Number—Number of disk writes for the VMware ESX server. Click the History Record icon ![]() to view the history graph of the disk write number.
to view the history graph of the disk write number.
· Read Latency—Read latency of the disk for the VMware ESX server. Click the History Record icon ![]() to view the history graph of the disk read latency.
to view the history graph of the disk read latency.
· Write Latency—Write latency of the disk for the VMware ESX server. Click the History Record icon ![]() to view the history graph of the disk write latency.
to view the history graph of the disk write latency.
· Commands Aborted—Number of commands aborted by the disk for the VMware ESX server.
Click the History Record
icon ![]() to view the history graph of the aborted commands.
to view the history graph of the aborted commands.
· Bus Resets—Number of bus resets performed by the disk for the VMware ESX
server. Click the History Record
icon ![]() to view the history graph of the bus resets.
to view the history graph of the bus resets.
VM Information
The VM Information area contains the following fields:
· Name—Name of the VM.
· Host Name—Name of the host on which the guest OS is located.
· Startup Time—Time when the VM most recently started up.
· Power Supply Status—Status of the power supply for the VM. Options are poweredOn and poweredOff.
· Host Status—Status of the host on which the guest OS is located. Options are running and notRunning.
· Heartbeat Status—Heartbeat status of the guest OS. Options are:
¡ GREEN—The guest OS responds correctly.
¡ YELLOW—The guest OS sometimes does not respond. The guest OS might be overloaded.
¡ RED—The guest OS has no heartbeat. The guest OS might not respond.
¡ GRAY—VMware ESX tools are not installed or stop running on the guest OS.
· OS—OS type of the VM. You can obtain the OS type when the host is running.
· IP Address—IP address of the VM. You can obtain the IP address of the VM when the host is in running state.
· Memory Size—Memory size of the VM.
· CPU Count—Number of processors for the VM.
· NIC Count—Number of NICs for the VM.
· Disk Count—Number of disks for the VM.
VM Performance
The VM Performance area contains the following fields:
· VM Name—Name of the VM.
· CPU Usage MHz—Processor usage of the VM.
· CPU Usage Ratio—Processor usage ratio of the VM. Click the History
Record icon ![]() to view the history
graph of the processor usage ratio.
to view the history
graph of the processor usage ratio.
· CPU Idle Time—Duration for which the processor for the VM
is idle. Click the History Record icon ![]() to view the history
graph of the processor idle time.
to view the history
graph of the processor idle time.
· Memory Usage Ratio—Memory usage ratio of the VM. Click the History
Record icon ![]() to view the history
graph of the memory usage ratio.
to view the history
graph of the memory usage ratio.
· Consumed Memory—Memory size consumed by the VM. Click the History
Record icon ![]() to view the history
graph of the consumed memory.
to view the history
graph of the consumed memory.
· Active Memory—Active memory size for the VM. Click the History
Record icon ![]() to view the history
graph of the active memory.
to view the history
graph of the active memory.
· Overhead Memory—Overhead memory size for the VM. Click the History
Record icon ![]() to view the history
graph of the overhead memory.
to view the history
graph of the overhead memory.
· Shared Memory—Shared memory size for the VM. Click the History
Record icon ![]() to view the history
graph of the shared memory.
to view the history
graph of the shared memory.
· Granted Memory—Assigned memory size to the VM. Click the History
Record icon ![]() to view the history
graph of the assigned memory.
to view the history
graph of the assigned memory.
VM Disk Information
The VM Disk Information area contains the following fields:
· VM Name—Name of the VM.
· Disk Name—Name of the disk for the VM.
· Capacity—Capacity of the disk for the VM.
· Used Space—Used space of the disk for the VM. Click the History
Record icon ![]() to view the history
graph of the used space.
to view the history
graph of the used space.
· Free Space—Free space of the disk for the VM. Click the History Record
icon ![]() to view the history graph of the free space.
to view the history graph of the free space.
· Usage Ratio—Disk usage ratio for the VM. Click the History Record
icon ![]() to view the history graph of the usage
ratio.
to view the history graph of the usage
ratio.
· Free Ratio—Ratio of the disks that are not used for
the VM. Click the History Record icon ![]() to view the history
graph of the ratio of the disks that are not used.
to view the history
graph of the ratio of the disks that are not used.
VM Disk I/O
The VM Disk I/O area contains the following fields:
· VM Name—Name of the VM.
· Disk Name—Name of the disk for the VM.
· Read Rate—Read rate of the disk for the VM. Click the History Record
icon ![]() to view the history graph of the disk read
rate.
to view the history graph of the disk read
rate.
· Write Rate—Write rate of the disk for the VM. Click the History Record
icon ![]() to view the history graph of the disk write
rate.
to view the history graph of the disk write
rate.
· Read Number—Number of disk reads for the VM. Click the History Record
icon ![]() to view the history graph of the disk read number.
to view the history graph of the disk read number.
· Write Number—Number of disk writes for the VM. Click the History Record
icon ![]() to view the history graph of the disk write number.
to view the history graph of the disk write number.
· Commands Aborted—Number of commands aborted by the disk for
the VM. Click the History Record icon ![]() to view the history
graph of the aborted commands.
to view the history
graph of the aborted commands.
· Bus Resets—Number of bus resets performed by the disk
for the VM. Click the History
Record icon ![]() to view the history
graph of the bus resets.
to view the history
graph of the bus resets.
VM NIC Information
The VM NIC Information area contains the following fields:
· VM Name—Name of the VM.
· NIC Name—Name of the NIC for the VM.
· IP Address—IP address of the NIC for the VM.
· MAC Address—MAC address of the NIC for the VM.
· Network—Network on which the NIC for the VM is located.
VM NIC Performance
The VM NIC Performance area contains the following fields:
· VM Name—Name of the VM.
· NIC Name—Name of the NIC for the VM.
· Receive Rate—Receive rate of the NIC for the VM.
· Send Rate—Send rate of the NIC for the VM.
· Packets Received—Number of packets received by the NIC for the VM.
· Packets Sent—Number of packets sent by the NIC for the VM.
VM Physic NIC Performance
The VM Physic NIC Performance area contains the following fields:
· VM Name—Name of the VM.
· NIC Name—Name of the physical NIC for the VM.
· Receive Rate—Receive rate of the physical NIC for the VM.
· Send Rate—Send rate of the physical NIC for the VM.
· Packets Received—Number of packets received by the physical NIC for the VM.
· Packets Sent—Number of packets sent by the physical NIC for the VM.
Power Supply Information
The Power Supply Information area contains the following fields:
· Name—Name of the power supply.
· Value—Power of the power supply.
· Health Status—Health status of the power supply.
Fan Information
The Fan Information area contains the following fields:
· Name—Name of the fan.
· Value—Usage of the fan.
· Health Status—Health status of the fan.
Processor Information
The Processor Information area contains the following fields:
· Name—Name of the processor.
· Health Status—Health status of the processor.
Memory Information
The Memory Information area contains the following fields:
· Name—Name of the memory.
· Health Status—Health status of the memory.
Sensor Temperature
The Sensor Temperature area contains the following fields:
· Name—Name of the sensor.
· Value—Temperature of the sensor. Click the History Record
icon ![]() to view the history graph of the sensor
temperature.
to view the history graph of the sensor
temperature.
· Health Status—Health status of the sensor.
Storage Information
The Storage Information area contains the following fields:
· Name—Name of the storage.
· Health Status—Health status of the storage.
Tasks Information
The Tasks Information area contains the following fields:
· Name—Task name of VMware ESX.
· Target—Task entity of VMware ESX.
· State—Task state of VMware ESX.
· Initiator—Task initiator of VMware ESX.
· Queue Time—Queue time of VMware ESX.
· Start Time—Start time of VMware ESX.
· Complete Time—Complete time of VMware ESX.
Events Information
The Events Information area contains the following fields:
· Description—Event description of VMware ESX.
· Created Time—Event creation time of VMware ESX.
· Target—Event entity of VMware ESX.
· User—Event user of VMware ESX.
VMware vCenter Server
VMware vCenter Server is a centralized platform offered by VMware to manage the VMware vSphere environment. APM can monitor VMware vCenter Server 5.5 through APIs that are provided by VMware vCenter Server.
The following information describes how to add and modify a VMware vCenter Server application monitor, and how to view the monitor report.
Adding a VMware vCenter Server application monitor
Before you add a VMware vCenter Server application monitor, obtain the username and password of a user who has the VMware vCenter Server administrator's privileges. The username and password are required for adding the application monitor.
To add a VMware vCenter Server application monitor:
1. Click the Resource tab.
2. Open the Add Application page by using one of the following methods:
¡ From the navigation tree, select Application Manager > Add Application.
¡ From the navigation tree, select Application Manager > Application Monitor. In the application monitor list, click Add.
The Add Application page displays all application types that can be monitored by APM.
3. Click VMware vCenter Server of the Virtual Device Monitor class.
The page for adding a VMware vCenter Server application monitor opens.
4. Configure the following parameters:
¡ IP Address—Enter the IP address of the host on which the VMware vCenter Server to be monitored is installed. APM automatically checks the IP address and associates the application monitor with the VMware vCenter Server if it is already managed in the IMC platform. If the host is already added to the IMC platform, you can also click Select, and then select the VMware vCenter Server in the Select Devices dialog box. For information about selecting a VMware vCenter Server, see "Quick start."
¡ Name—Enter a unique application monitor name. As a best practice, name the application monitor as Application type_host IP address.
¡ Use Template—Select Enable or Disable from the list.
¡ Template—Click
the Configure icon ![]() next to the Template field to select an existing
template. The Template field is automatically populated with the name of the selected
template. For more information about configuring application templates, see
"Quick start." This field is displayed only when you select Enable from the Use
Template list.
next to the Template field to select an existing
template. The Template field is automatically populated with the name of the selected
template. For more information about configuring application templates, see
"Quick start." This field is displayed only when you select Enable from the Use
Template list.
¡ Description—Enter a description for the application monitor.
¡ Polling Interval (min)—Select a polling interval for the application monitor. Options are 1, 2, 3, 4, 5, 10, 20, and 30. The default polling interval is 5 minutes. A shorter polling interval improves real-time data accuracy at the expense of system resources. This field is available only when you select Disable from the Use Template list.
¡ Username/Password—Enter the username and password of the VMware vCenter Server administrator. The fields are available only when you select Disable from the Use Template list.
¡ Contact—Enter the contact information, such as the name, email address, and telephone number. The default is the username of the operator who created the application monitor. This field is available only when you select Disable from the Use Template list.
¡ APM Server—Select an APM server to monitor the application. The options are in server-address (application-type:n/N) format. The letter n indicates the number of VMware vCenter Server applications monitored on the APM server. The letter N indicates the total number of applications monitored on the APM server. Server address 127.0.0.1 indicates that APM and the IMC platform are deployed on the same server.
¡ Related Applications—Click Add next to this field. On the Select Application window, enter a partial or complete name to filter applications, select the applications that the VMware vCenter Server depends on, and then click OK.
Operating system applications cannot be selected. Operators can view all dependencies of the application in the dependency topology.
¡ Application Group—Specify an application group for the VMware vCenter Server application.
- To specify an existing application group, click Add, select an application group, and then click OK.
- To specify a new application group, click Add Application Group, configure the application group settings, and then click OK.
¡ Detect Application—Select this parameter if you want to enable application detection. APM verifies the application connectivity by using the previous parameter settings, and adds the application monitor only when it can connect to the application. If you do not select this parameter, APM adds the application monitor without verifying the application connectivity.
5. Click OK.
Modifying a VMware vCenter Server application monitor
Authorized users can modify all parameters except the IP address and the APM server for a VMware vCenter Server. When the IP address of a monitored VMware vCenter Server changes, operators must add a new application monitor for the VMware vCenter Server. The new application monitor cannot inherit the history data from the previous application monitor.
To modify a VMware vCenter Server application monitor:
1. Click the Resource tab.
2. From the navigation tree, select Application Manager > Application Monitor.
The application monitor list page displays all application monitors.
3. Click the Modify
icon ![]() for the
VMware vCenter Server application monitor you want to modify.
for the
VMware vCenter Server application monitor you want to modify.
The page for modifying the VMware vCenter Server application monitor opens.
4. Modify the parameters as needed, except the IP address and the APM server.
For more information about parameter settings, see "Adding a VMware vCenter Server application monitor."
5. Click OK.
Viewing the VMware vCenter Server application monitor report
After a VMware vCenter Server application monitor is added, APM collects index data of the application, evaluates the availability and health status, and updates the monitor report. The report shows the index values obtained from the most recent polling of the application.
To view the VMware vCenter Server application monitor report:
1. Click the Resource tab.
2. From the navigation tree, select Application Manager > Application Monitor.
The application monitor list page displays all application monitors.
3. Click the name of a VMware vCenter Server application monitor to display the report.
Figure 135shows part of a VMware vCenter Server application monitor report. The VMware vCenter Server application monitor report contains the Summary, Hosts and VMs, Tasks and Events, and Alarms tabs.
Figure 135 Part of a VMware vCenter Server application monitor report
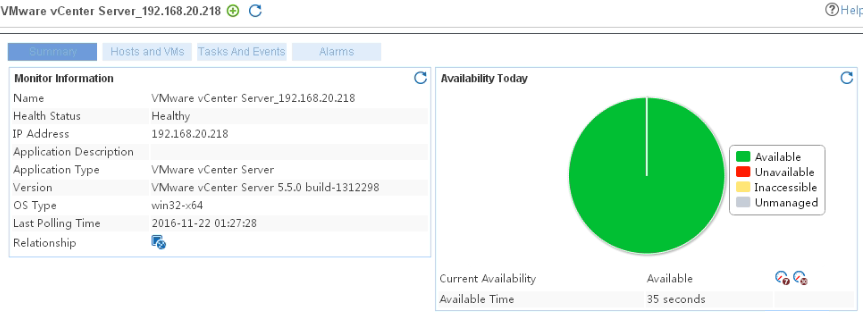
Monitor Information
The Monitor Information area contains the following fields:
· Name—Application monitor name.
· Health Status—Health status of the VMware vCenter Server.
· IP Address—IP address of the VMware vCenter Server.
· Application Description—Description of the VMware vCenter Server.
· Application Type—Type of the monitored application, which is always VMware vCenter Server for a VMware vCenter Server application monitor.
· Version—Version of the VMware vCenter Server.
· OS Type—OS type of the VMware vCenter Server.
· Last Polling Time—Time when APM last polled the VMware vCenter Server.
· Relationship—Click the Relationship icon ![]() to view dependencies between the VMware vCenter
Server and other applications in a dependency topology view. For more information about dependency topologies, see "Topology and application group management."
to view dependencies between the VMware vCenter
Server and other applications in a dependency topology view. For more information about dependency topologies, see "Topology and application group management."
· Top5 Unrecovered Alarm—Latest five unrecovered alarms on the VMware vCenter Server. This field is not displayed if no alarm is generated by the VMware vCenter Server.
Availability Today
The Availability Today area contains the following fields:
· Current Availability—Availability of the VMware vCenter Server.
¡ Click
the Weekly History icon ![]() to view the
availability of the VMware vCenter Server application in the last 7 days.
to view the
availability of the VMware vCenter Server application in the last 7 days.
¡ Click
the Monthly History icon ![]() to view the
availability of the VMware vCenter Server application in the last 30 days.
to view the
availability of the VMware vCenter Server application in the last 30 days.
· Available Time—Total amount of time that the VMware vCenter Server was available after 00:00 today.
· Unavailable Time—Total amount of time that the VMware vCenter Server was unavailable after 00:00 today.
· Inaccessible Time—Total amount of time that the VMware vCenter Server was inaccessible after 00:00 today.
· Unmanaged Time—Total amount of time that the VMware vCenter Server was unmanaged after 00:00 today.
The statistics collection started when the application monitor was added. An availability time field is not displayed when its value is 0.
VCenter Server Inventory
The VCenter Server Inventory area contains the following fields:
· Datacenter Name—Name of the data center for the VMware vCenter Server.
· Cluster Name—Name of the cluster in the data center.
· Host—IP address of the host in the cluster.
Datacenter Summary
The Datacenter Summary area contains the following fields:
· Datacenter Name—Name of the data center for the VMware vCenter Server.
· Host Number—Number of hosts managed by the data center.
· VirtualMachine Number—Number of virtual machines managed by the data center.
· Cluster Number—Number of clusters managed by the data center.
· Network Number—Number of networks managed by the data center.
· Datastore Number—Number of data stores managed by the data center.
Cluster CPU Usage Ratio
The Cluster CPU Usage Ratio area contains the following fields:
· Datacenter Name—Name of the data center for the VMware vCenter Server.
· Cluster Name—Name of the cluster in the data center.
· Cluster CPU Usage Ratio—Processor usage ratio of the cluster. Click the History
Record icon ![]() to view the history
graph of the cluster processor
usage ratio.
to view the history
graph of the cluster processor
usage ratio.
· Cluster CPU Usage MHz—Processor usage of the cluster in MHz. Click the History Record icon ![]() to view the history
graph of the cluster processor
usage.
to view the history
graph of the cluster processor
usage.
Cluster Memory Usage Ratio
The Cluster Memory Usage Ratio area contains the following fields:
· Datacenter Name—Name of the data center for the VMware vCenter Server.
· Cluster Name—Name of the cluster in the data center.
· Cluster Memory Usage Ratio—Memory usage ratio
of the cluster. Click the History Record icon ![]() to view the history graph of the cluster memory usage ratio.
to view the history graph of the cluster memory usage ratio.
· Cluster Consumed Memory—Size of the memory
consumed by the cluster. Click
the History Record icon
![]() to view the history graph of the consumed cluster
memory size.
to view the history graph of the consumed cluster
memory size.
Datastore Information
The Datastore Information area contains the following fields:
· Name—Name of the data store for the VMware vCenter Server.
· Type—Type of the data store.
· URL—Path of the data store.
· Capacity—Capacity of the data store.
· Used Space—Used space of the data store.
· Free Space—Free space of the data store.
· Usage Ratio—Usage of the data store. Click the History
Record icon ![]() to view the history
graph of the data store usage ratio.
to view the history
graph of the data store usage ratio.
· Free Ratio—Ratio of the data store that is not used. Click the History Record icon ![]() to view the history graph of the free ratio.
to view the history graph of the free ratio.
Network Information
The Network Information area contains the following fields:
· Datacenter Name—Name of the data center for the VMware vCenter Server.
· Network—Network name of the data center.
· Alarm Status—Network status:
¡ Green—The network responds correctly.
¡ Yellow—The network sometimes does not respond. The network might be overloaded.
¡ Red—The network has no heartbeat. The network might not respond.
¡ Gray—The network is not monitored.
· Alarm Actions—Alarm action status of the network:
¡ True—Alarm actions are enabled.
¡ False—Alarm actions are disabled.
· Host Number—Number of hosts using the network.
· VirtualMachine Number—Number of virtual machines using the network.
CPU Detail
The CPU Detail area contains the following fields:
· Host—Name of the host managed by the VMware vCenter Server.
· CPU ID—ID of the processor for the host.
· CPU Usage Ratio—Usage ratio of a single processor for the host. Click the History
Record icon ![]() to view the history
graph of the processor usage
ratio.
to view the history
graph of the processor usage
ratio.
· CPU Idle Time—Duration for which a single processor on the host is idle.
Click the History Record
icon ![]() to view the history graph of the processor idle duration.
to view the history graph of the processor idle duration.
Net Card Performance
The Net Card Performance area contains the following fields:
· Host—Name of the host managed by the VMware vCenter Server.
· Name—Name of the NIC for the host.
· Receive Rate—Receive rate of the NIC. Click the History Record
icon ![]() to view the history graph of the receive
rate.
to view the history graph of the receive
rate.
· Send Rate—Send rate of the NIC. Click the History Record
icon ![]() to view the history graph of the send rate.
to view the history graph of the send rate.
· Packets Received—Number of packets received by the NIC. Click the History Record icon ![]() to view the history graph of the packets received.
to view the history graph of the packets received.
· Packets Sent—Number of packets sent by the NIC. Click the History
Record icon ![]() to view the history
graph of the packets sent.
to view the history
graph of the packets sent.
Datastore Performance
The Datastore Performance area contains the following fields:
· Host—Name of the host managed by the VMware vCenter Server.
· Datastore Name—Name of the data store for the host.
· Read Rate—Read rate of the data store. Click the History
Record icon ![]() to view the history
graph of the data store read rate.
to view the history
graph of the data store read rate.
· Write Rate—Write rate of the data store. Click the History
Record icon ![]() to view the history
graph of the data store write rate.
to view the history
graph of the data store write rate.
· Read Latency—Read latency of the data store. Click the History
Record icon ![]() to view the history
graph of the data store read latency.
to view the history
graph of the data store read latency.
· Write Latency—Write latency of the data store. Click the History
Record icon ![]() to view the history
graph of the data store write latency.
to view the history
graph of the data store write latency.
Disk I/O
The Disk I/O area contains the following fields:
· Host—Name of the host managed by the VMware vCenter Server.
· LUN—Logical unit number of the disk for the host.
· Read Rate—Read rate of the disk. Click the History
Record icon ![]() to view the history
graph of the disk read rate.
to view the history
graph of the disk read rate.
· Write Rate—Write rate of the disk. Click the History
Record icon ![]() to view the history
graph of the disk read rate.
to view the history
graph of the disk read rate.
· Read Number—Number of disk reads. Click the History
Record icon ![]() to view the history
graph of the disk read number.
to view the history
graph of the disk read number.
· Write Number—Number of disk writes. Click the History
Record icon ![]() to view the history
graph of the disk write number.
to view the history
graph of the disk write number.
· Read Latency—Read latency of the disk. Click the History
Record icon ![]() to view the history
graph of the disk read latency.
to view the history
graph of the disk read latency.
· Write Latency—Write latency of the disk. Click the History
Record icon ![]() to view the history
graph of the disk write latency.
to view the history
graph of the disk write latency.
· Commands Aborted—Number of commands aborted by the disk. Click the History Record icon ![]() to view the history graph of the aborted commands.
to view the history graph of the aborted commands.
· Bus Resets—Number of bus resets performed by the disk. Click the History Record icon ![]() to view the history graph of the bus resets.
to view the history graph of the bus resets.
Host Information
The Host Information area contains the following fields:
· Host Name—Name of the host managed by the VMware vCenter Server.
· Connection State—Connection state of the host:
¡ Connected—The host is connected correctly.
¡ Disconnected—The host is disconnected.
¡ Notresponding—The host does not respond.
· Alarm Status—Alarm status for the host:
¡ Green—The host responds correctly.
¡ Yellow—The host sometimes does not respond. The host might be overloaded.
¡ Red—The host has no heartbeat. The host might not respond.
¡ Gray—The host is not monitored.
· CPU Usage Ratio—Processor usage
ratio for the host. Click the History Record icon ![]() to view the history graph of the processor usage ratio.
to view the history graph of the processor usage ratio.
· Memory Usage Ratio—Memory
usage ratio for the host. Click the History Record icon ![]() to view the history
graph of the processor usage
ratio.
to view the history
graph of the processor usage
ratio.
· Memory Size—Actual memory size for the host.
· CPU Number—Number of processors for the host.
· NIC Number—Number of NICs for the host.
· Uptime—Normal operation time of the host.
· Alarm Actions—Alarm action status of the host:
¡ True—Alarm actions are enabled.
¡ False—Alarm actions are disabled.
VirtualMachine Information
The VirtualMachine Information area contains the following fields:
· Host—Name of the host managed by the VMware vCenter Server.
· VirtualMachine Name—Name of the virtual machine managed by the host.
· Power State—State of the power supply for the virtual machine. Options are poweredOn and poweredOff.
· Alarm Status—Heartbeat status of the virtual machine OS. Options are:
¡ Green—The virtual machine OS responds correctly.
¡ Yellow—The virtual machine OS sometimes does not respond. The virtual machine OS might be overloaded.
¡ Red—The virtual machine OS has no heartbeat. The virtual machine OS might not respond.
¡ Gray—The virtual machine OS is not monitored.
· Provisioned Space—Space that is provisioned by VMware vCenter Server for the virtual machine.
· Used Space—Space that is used by the virtual machine.
· Host CPU Usage MHz—Processor usage for the ESX host to run the
virtual machine. Click the History
Record icon ![]() to view the history
graph of the processor usage.
to view the history
graph of the processor usage.
· Host Memory Used Space—Memory used by the ESX host to run the
virtual machine. Click the History
Record icon ![]() to view the history
graph of the memory usage.
to view the history
graph of the memory usage.
· Guest Memory Usage—Memory used by the virtual machine. Click the History Record
icon ![]() to view the history graph of the memory usage.
to view the history graph of the memory usage.
· Annotation—Annotation for the virtual machine.
· Alarm Actions—Alarm action status of the virtual machine:
¡ True—Alarm actions are enabled.
¡ False—Alarm actions are disabled.
Recent Tasks Information
The Recent Tasks Information area contains the following fields:
· Name—Name of the task for the VMware vCenter Server.
· Target—Entity that executes the task.
· State—Execution state of the task:
¡ Success—The task is completed.
¡ Running—The task is in progress.
¡ Queued—The task is being queued.
¡ Error—An error has occurred during the task operation.
· Initiator—User that initiates the task.
· Queue Time—Start time of the task request.
· Start Time—Time when the task started to be executed.
· Complete Time—Time when the task was completed.
History Tasks Information
The History Tasks Information area contains the following fields:
· Name—Name of the task for the VMware vCenter Server.
· Target—Entity that executes the task.
· State—Execution state of the task:
¡ Success—The task is completed.
¡ Running—The task is in progress.
¡ Queued—The task is being queued.
¡ Error—An error has occurred during the task operation.
· Initiator—User that initiates the task.
· Queue Time—Start time of the task request.
· Start Time—Time when the task started to be executed.
· Complete Time—Time when the task was completed.
Events Information
The Events Information area contains the following fields:
· Description—Description of the event for the VMware vCenter Server.
· Created Time—Time when the event occurred.
· Target—Entity that triggered the event.
· User—User that triggered the event.
Triggered Alarm
The Triggered Alarm area contains the following fields:
· Object—Object that triggered the alarm.
· Alarm Status—Severity level of the alarm:
¡ Green—Normal.
¡ Yellow—Warning.
¡ Red—Alert.
· Alarm Name—Name of the alarm.
· Triggered Time—Time when the alarm was triggered.
· Acknowledged Time—Time when the alarm was acknowledged.
· Acknowledged User—User who acknowledged the alarm.
Defined Alarm
The Defined Alarm area contains the following fields:
· Alarm Name—Name of the alarm defined in the VMware vCenter Server.
· Description—Description of the alarm.
HW FusionCompute
HW FusionCompute is a server virtualization product of Huawei. APM can monitor HW FusionCompute through REST APIs that are provided by HW FusionCompute.
The following information describes how to add and modify an HW FusionCompute application monitor, and how to view the monitor report.
Adding an HW FusionCompute application monitor
Before you add an HW FusionCompute application monitor, obtain the following information:
· Obtain the username, password, password encryption type, and authentication type of a user who has the HW FusionCompute administrator's privileges and the access rights to HTTP/HTTPS. The username, password, password encryption type, and authentication type are required for adding the application monitor.
· Contact the HW FusionCompute administrator to obtain the version and language information for the HW FusionCompute.
To add an HW FusionCompute application monitor:
1. Click the Resource tab.
2. Open the Add Application page by using one of the following methods:
¡ From the navigation tree, select Application Manager > Add Application.
¡ From the navigation tree, select Application Manager > Application Monitor. In the application monitor list, click Add.
The Add Application page displays all application types that can be monitored by APM.
3. Click HW FusionCompute of the Virtual Device Monitor class.
The page for adding an HW FusionCompute application monitor opens.
4. Configure the following parameters:
¡ IP Address—Enter the IP address of the HW FusionCompute server. APM automatically checks the IP address and associates the application monitor with the HW FusionCompute server if it is already managed in the IMC platform. If the HW FusionCompute server is already added to the IMC platform, you can also click Select, and then select the HW FusionCompute server in the Select Devices dialog box. For information about selecting an HW FusionCompute server, see "Quick start."
¡ Name—Enter a unique application monitor name. As a best practice, name the application monitor as Application type_host IP address.
¡ Use Template—Select Enable or Disable from the list.
¡ Template—Click
the Configure icon ![]() next to the Template field to select an existing template. The Template field
is automatically populated with the name of the selected template. For more
information about configuring application templates, see "Quick start."
This field is displayed only when you select Enable from the Use Template
list.
next to the Template field to select an existing template. The Template field
is automatically populated with the name of the selected template. For more
information about configuring application templates, see "Quick start."
This field is displayed only when you select Enable from the Use Template
list.
¡ Description—Enter a description for the application monitor.
¡ Application Monitor Port—Port used to monitor the application. The default value is 7070 for HTTP and 7443 for HTTPS. This field is available only when you select Disable from the Use Template list.
¡ Polling Interval (min)—Select a polling interval for the application monitor. Options are 1, 2, 3, 4, 5, 10, 20, and 30. The default polling interval is 5 minutes. A shorter polling interval improves real-time data accuracy at the expense of system resources. This field is available only when you select Disable from the Use Template list.
¡ Username/Password—Enter the username and password of the HW FusionCompute administrator. The fields are available only when you select Disable from the Use Template list.
¡ Scheme—Select the protocol used to access the application. Options are HTTP and HTTPS. This field is available only when you select Disable from the Use Template list.
¡ Authentication Type—Select the user authentication type. This field is available only when you select Disable from the Use Template list.
¡ User Type—Select the user account type. This field is available only when you select Disable from the Use Template list.
¡ Encryption Type—Select the user password encryption type. This field is available only when you select Disable from the Use Template list.
¡ Version—Select the version number for HW FusionCompute. This field is available only when you select Disable from the Use Template list.
¡ Language—Select the language for HW FusionCompute. This field is available only when you select Disable from the Use Template list.
¡ Contact—Enter the contact information, such as the name, email address, and telephone number. The default is the username of the operator who created the application monitor. This field is available only when you select Disable from the Use Template list.
¡ APM Server—Select an APM server to monitor the application. The options are in server-address (application-type:n/N) format. The letter n indicates the number of HW FusionCompute applications monitored on the APM server. The letter N indicates the total number of applications monitored on the APM server. Server address 127.0.0.1 indicates that APM and the IMC platform are deployed on the same server.
¡ Related Applications—Click Add next to this field. On the Select Application window, enter a partial or complete name to filter applications, select the applications that the HW FusionCompute depends on, and then click OK.
Operating system applications cannot be selected. Operators can view all dependencies of the application in the dependency topology.
¡ Application Group—Specify an application group for the HW FusionCompute application.
- To specify an existing application group, click Add, select an application group, and then click OK.
- To specify a new application group, click Add Application Group, configure the application group settings, and then click OK.
¡ Detect Application—Select this parameter if you want to enable application detection. APM verifies the application connectivity by using the previous parameter settings, and adds the application monitor only when it can connect to the application. If you do not select this parameter, APM adds the application monitor without verifying the application connectivity.
5. Click OK.
Modifying an HW FusionCompute application monitor
Authorized users can modify all parameters except the IP address and the APM server for an HW FusionCompute. When the IP address of a monitored HW FusionCompute changes, operators must add a new application monitor for the HW FusionCompute. The new application monitor cannot inherit the history data from the previous application monitor.
To modify an HW FusionCompute application monitor:
1. Click the Resource tab.
2. From the navigation tree, select Application Manager > Application Monitor.
The application monitor list page displays all application monitors.
3. Click the Modify
icon ![]() for the HW FusionCompute application monitor you want to modify.
for the HW FusionCompute application monitor you want to modify.
The page for modifying the HW FusionCompute application monitor opens.
4. Modify the parameters as needed, except the IP address and the APM server.
For more information about parameter settings, see "Adding an HW FusionCompute application monitor."
5. Click OK.
Viewing the HW FusionCompute application monitor report
After an HW FusionCompute application monitor is added, APM collects index data of the application, evaluates the availability and health status, and updates the monitor report. The report shows the index values obtained from the most recent polling of the application.
To view the HW FusionCompute application monitor report:
1. Click the Resource tab.
2. From the navigation tree, select Application Manager > Application Monitor.
The application monitor list page displays all application monitors.
3. Click the name of an HW FusionCompute application monitor to display the report.
Figure 136shows part of an HW FusionCompute application monitor report. The HW FusionCompute application monitor report contains the Summary and Performance tabs.
Figure 136 Part of an HW FusionCompute application monitor report
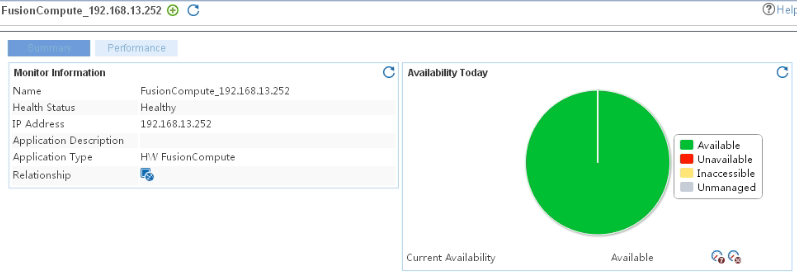
Monitor Information
The Monitor Information area contains the following fields:
· Name—Application monitor name.
· Health Status—Health status of the HW FusionCompute.
· IP Address—IP address of the HW FusionCompute.
· Application Description—Description of the HW FusionCompute.
· Application Type—Type of the monitored application, which is always HW FusionCompute for an HW FusionCompute application monitor.
· Last Polling Time—Time when APM last polled the HW FusionCompute.
· Relationship—Click the Relationship icon ![]() to view dependencies between the HW
FusionCompute and other applications in a dependency topology view. For more information about dependency topologies, see "Topology and application group management."
to view dependencies between the HW
FusionCompute and other applications in a dependency topology view. For more information about dependency topologies, see "Topology and application group management."
· Top5 Unrecovered Alarm—Latest five unrecovered alarms on the HW FusionCompute. This field is not displayed if no alarm is generated by the HW FusionCompute.
Availability Today
The Availability Today area contains the following fields:
· Current Availability—Availability of the HW FusionCompute.
¡ Click
the Weekly History icon ![]() to view the
availability of the HW FusionCompute application in the last 7 days.
to view the
availability of the HW FusionCompute application in the last 7 days.
¡ Click
the Monthly History icon ![]() to view the
availability of the HW FusionCompute application in the last 30 days.
to view the
availability of the HW FusionCompute application in the last 30 days.
· Available Time—Total amount of time that the HW FusionCompute was available after 00:00 today.
· Unavailable Time—Total amount of time that the HW FusionCompute was unavailable after 00:00 today.
· Inaccessible Time—Total amount of time that the HW FusionCompute was inaccessible after 00:00 today.
· Unmanaged Time—Total amount of time that the HW FusionCompute was unmanaged after 00:00 today.
The statistics collection started when the application monitor was added. An availability time field is not displayed when its value is 0.
Users
The Users area contains the following fields:
· User Name—Name of the HW FusionCompute user.
· User Type—Type of user.
· Management Status—Current status of the user.
· E-Mail—E-mail address of the user.
· Telephone No.—Telephone number of the user.
· Maximum Connection Number—Maximum number of connections allowed per user.
· Creation Time—Time when user was created.
· Roles—Role of the user. The management right on HW FusionCompute varies by user role.
· Account Security Type—Security type of account.
Sites
The Sites area contains the following fields:
· Name—Name of the site. A site refers to the management scope for a VRM environment.
· ID—Unique identifier of the site.
· IP—IP address of the site, which is the management IP address of the VRM node.
· VRM Status—Current status of the virtual machine.
· Self—Whether the site is currently connected to APM.
· Domain Controller—Whether the site is the domain controller.
· Time Zone—Time zone of the location where the host is located.
· NTP Cycle—NTP synchronization interval of the site.
· NTP Server—IP address or domain name of the NTP server.
· NTPBridge Server—IP address or domain name of the NTP bridge server.
Clusters
The Clusters area contains the following fields:
· Name—Name of the cluster.
· ID—Unique identifier of the cluster.
· Tag—Tag of the cluster.
· Parent File Name—Name of the file where the cluster is located.
· Resource Allocation Strategy—Resource allocation strategy of the cluster:
¡ loadBalance—Load balancing.
¡ random—Random.
· Baseline Setting(IMC ONLY)—Baseline setting in IMC mode.
· Maximum CPU Quantity—Maximum number of CPUs of the hosts in the cluster.
Cluster Resource
The Cluster Resource area contains the following fields:
· Name—Name of the cluster.
· Total CPU—Total CPU capacity of the cluster.
· Allocated CPU—Allocated CPU capacity of the cluster.
· Total Memory—Total memory capacity of the cluster.
· Allocated Memory—Allocated memory capacity of the cluster.
Cluster Enabled
The Cluster Enabled area contains the following fields:
· Name—Name of the cluster.
· Memory Overcommit Enabled—Whether memory overcommit is enabled for the cluster.
· HA Enabled—Whether the HA function is enabled for the cluster.
· DRS Enabled—Whether DRS is enabled for the cluster.
· IMC Enabled—Whether the IMC mode is enabled for the cluster.
· NUMA Enabled—Whether NUMA is enabled for the cluster.
· Local RAM Disk Enabled—Whether the local RAM disk is enabled for the cluster.
· HostNumaDrs Enabled—Whether Host NUMA DRS is enabled for the cluster.
Cluster HA Real-Time Information
The Cluster HA Real-Time Information area contains the following fields:
· Cluster—Name of the cluster.
· Current Cpu Reservation—Current CPU failover capacity. This parameter is valid only when the Control Policy is set to 0.
· Current Memory Reservation—Current memory failover capacity. This parameter is valid only when the Control Policy is set to 0.
· Master—Site identification for the master host.
· Abnormal Hosts Connected—Site identification for the hosts connected to the master abnormally.
· Normal Host Connected—Site identification for the hosts connected to the master normally.
· Available Hosts—Number of available hosts in the cluster. This parameter is valid only when the Control Policy is set to 1.
· Total Hosts—Total number of hosts in the cluster. This parameter is valid only when the Control Policy is set to 1.
· Virtual Machines Running—Total number of virtual machines running in the cluster. This parameter is valid only when the Control Policy is set to 1.
· Control Policy—Control policy used when a host failure occurs in the cluster:
¡ 0—Reserves resources.
¡ 1—Specifies a number of failed hosts that can trigger an alarm.
¡ 2—Uses dedicated failover hosts.
· Auto Migrate Virtual Machines—Whether the cluster automatically migrates virtual machines.
· FailOver Hosts—List of selected failover hosts. This parameter is valid only when the Control Policy is set to 2.
Cluster HA Real-Time Info – Slot
The Cluster HA Real-Time Info – Slot area contains the following fields:
· Cluster—Name of the cluster.
· Total Slots Quantity—Total number of slots in the cluster. This parameter is valid only when the Control Policy is set to 1.
· Available Slots Quantity—Total number of available slots in the cluster. This parameter is valid only when the Control Policy is set to 1.
· Used Slots Quantity—Number of used slots in the cluster. This parameter is valid only when the Control Policy is set to 1.
· FailOver Slots—Number of slots used for failover in the cluster. This parameter is valid only when the Control Policy is set to 1.
· CPU Slot Size—Reserved CPU size on all running virtual machines. This parameter is valid only when the Control Policy is set to 1.
· Memory Slot Size—Reserved memory size on all running virtual machines. This parameter is valid only when the Control Policy is set to 1.
Host Statistical Information
The Host Statistical Information area contains the following fields:
· Site—Name of the cluster.
· Total—Total number of hosts in the site.
· Initializing—Number of hosts that are initializing.
· Booting—Number of hosts that are booting.
· Shutting Down—Number of hosts that are shutting down.
· Rebooting—Number of hosts that are rebooting.
· Power Off—Number of hosts that are offline.
· Fault—Number of faulty hosts.
· Unknown—Number of hosts that are in unknown state.
· Normal—Number of hosts that are running correctly.
Host
The Host area contains the following fields:
· Host Name—Name of the host.
· IP—IP address of the host.
· Status—Status of the host.
· Cluster Name—Name of the cluster to which the host belongs.
· Failed Over—Whether the host is specified as a failover host.
· Maintaining—Whether the host is in maintaining state.
· Vendor—Vendor of the physical server.
· Model—Model of the physical server.
· Hypervisor—Virtualization software installed on the host.
· CPU Frequency—CPU frequency of the host.
· Physical CPU Quantity—Number of physical CPUs of the host.
· Memory Quantity—Total memory capacity of the host.
· Network Card Quantity—Number of network cards of the host.
Resource
The Resource area contains the following fields:
· Host Name—Name of the host.
· Total CPUs—Total CPU capacity of the host.
· Allocated CPUs—Allocated CPU capacity for the host.
· Total Memory—Total memory capacity of the host.
· Allocated Memory—Allocated memory capacity for the host.
Resource Shared
The Resource Shared area contains the following fields:
· Host Name—Name of the host.
· Shared Memory Sent From GDVM—Size of GDV's shared memory for sending.
· Shared Memory Sent After Reboot—Size of GDV's shared memory for sending after host reboot.
· Shared Memory Received By GDVM—Size of GDV's shared memory for receiving.
· Shared Memory Received By GDVM After Reboot—Size of GDV's shared memory for receiving after host reboot.
· VM Capacity Shared By GPU—Number of virtual machines shared by GPU. 0 means not shared.
· VM Capacity Shared By GPU After Reboot—Number of virtual machines shared by GPU after host reboot. 0 means not shared.
Statistical Information
The Statistical Information area contains the following fields:
· Site—Name of the site.
· Total—Total number of virtual machines in the site.
· Running—Number of running virtual machines in the site.
· Stopped—Number of stopped virtual machines in the site.
· Hibernated—Number of hibernated virtual machines in the site.
· Fault—Number of faulty virtual machines in the site.
Virtual Machines
The Virtual Machines area contains the following fields:
· Virtual Machine—Name of the virtual machine.
· Idle—Whether the virtual machine is idle.
· CPU Hot Plug—Whether the virtual machine supports hot plugging the CPU.
· CPU Quantity—Number of CPUs of the virtual machine.
· Is High Precision Clock—Whether the high-precision clock is enabled.
· Host IP—VNC access information of the virtual machine.
· Status—Current status of the virtual machine.
Tasks
The Tasks area contains the following fields:
· Start Time—Start time of the task.
· Progress—Progress of the task.
· Finish Time—Finish time of the task.
· Reason Description—Failure reason description for the task.
· Cancelable—Whether the task can be canceled. true means the task can be canceled. false means the task cannot be canceled.
· Cancellation Instruction—Whether a cancellation instruction is received. true means the instruction is received.
Alarms
The Alarms area contains the following fields:
· Item Alarm Level—Alarm level. Options are Emergency, Important, Minor, and Prompt.
· Item Alarm Category—Alarm category.
· Event Type—Event type of the alarm.
· Alarm Cause—Reason for the alarm.
Cluster Monitor
The Cluster Monitor area contains the following fields:
· CPU Usage—CPU usage of the cluster.
· Cpu Number—Number of physical CPUs of the cluster.
· CPU Cores—Number of CPU cores of the cluster.
· CPU Speed Total—Total CPU frequency of the cluster.
· domU Cpu Usage—CPU usage of DomU of the cluster.
· Memory Usage—Memory usage of the cluster.
· Memory Size—Memory size of the cluster.
· DomU Memory Usage—Memory usage of DomU of the cluster.
· DomU Memory Size—Memory size of DomU of the cluster.
· Disk IO In—Disk write rate of the cluster.
· Disk IO Out—Disk read rate of the cluster.
· Disk Usage—Disk utilization.
· NIC In Usage—Network interface card inbound flow utilization.
· NIC Out Usage—Network interface card outbound flow utilization.
· NIC Out Speed—Network Interface card outbound flow speed.
CPU
The CPU Info area contains the following fields:
· Version—CPU version number.
· Family—Family name to which the CPU belongs.
· Max Speed—CPU's frequency.
· Manufacturer—CPU's manufacturer.
· Sequence Number—CPU's sequence number.
· Core Count—Count of CPU cores.
Memory Info
The Memory Info area contains the following fields:
· Location—Place where the memory locates.
· Size—Total memory volume.
· Manufacturer—Memory manufacturer.
Host Dynamic Performance
The Host Dynamic Performance area contains the following fields:
· CPU Usage—Utilization rate of CPU.
· Dom0 Cpu Usage—Utilization rate of dom0's CPU.
· CPU Cores—Count of CPU cores.
· domU Cpu Cores—Count of domU's CPU cores.
· CPU Speed Total—CPU's total frequency.
· domU Cpu Speed Total—domU CPU's total frequency.
· Memory Usage—Utilization rate of memory.
· VM Memory Usage—Utilization rate of memory in the virtual machine.
· VM Memory Total—Virtual machines' total memory size.
· VM Memory Free—Virtual machines' free memory size.
· VM Running Num—Number of virtual machines that are running.
· DomU Cpu Usage—Utilization rate of DomU's CPU.
· DomU Memory Usage—Utilization rate of DomU's memory.
· VM I/O In—Speed of virtual machine's disk writes.
· VM I/O Out—Speed of virtual machine's disk reads.
· VM Byte In—Inbound flow speed of virtual machine.
· VM Byte Out—Outbound flow speed of virtual machine.
· Reboot Time—Time when the host reboots.
Net Dynamic Info
The Net Dynamic Info area contains the following fields:
· Name—Name of network.
· Status—Current status of network.
· Byte Out Speed—Outbound flow speed of network.
· Byte In Speed —Inbound flow speed of network.
· Package Receive—Package receiving rate in the network.
· Package Send—Package sending rate in the network.
· Current Speed—Current speed of network flows.
NIC Dynamic Info
The Net Dynamic Info area contains the following fields:
· Name—Name of the NIC.
· Status—Current status of NIC.
· Current Speed—Current speed of NIC flows.
· Package Send Speed—Package sending rate.
· Package Receive Speed—Package receiving rate.
· Byte In Speed—Inbound flow speed of the NIC.
· Byte Out Speed—Outbound flow speed of the NIC.
· Send Drop Packet—Drop rate of packets sent.
· Receive Drop Packet—Drop rate of packets received.
Host Static Performance
The Host Static Performance area contains the following fields:
· Board Manufacturer—Masterboard manufacturer.
· Board Product—Masterboard product number.
· Board Serial Num—Masterboard serial number.
· Board Version—Masterboard version number.
· Product Manufacturer—Server manufacturer.
· Product Name—Product name.
· Product Serial Num—Product serial number.
· Product Version—Product version.
· Product UUID—Product UUID.
· Product Family—Family that product belongs to.
· Product Wakeup Type—Way in which the product was waken up.
· Product SKU Number—Product sKU number.
· CPU Total—CPU's total frequency in GHz.
· CPU Number—Count of CPUs.
· Locator Number—Number of slots that can hold memory devices.
· Memory Total—Total size of memory.
· BIOS Release Date—Release date of BIOS.
· BIOS Version—Version number of BIOS.
· ROM Size—Size of read-only memory.
· BIOS Vendor—BIOS vendor.
· NIC Number—Number of network interface cards.
· UVP Info—UVP information.
NIC Info
The NIC Info area contains the following fields:
· Name—Name of the NIC.
· MAC—NIC's MAC address.
· Work Mode—Whether the NIC supports duplex mode.
· Port Name—Name of NIC's port.
· Speed—Speed of NIC.
NIC Original Info
The NIC Original Info area contains the following fields:
· Name—Network interface name.
· Send Packages—Number of packets sent by the NIC.
· Receive Packages—Number of packets received by the NIC.
· Send Volume—Outbound flow volume of the NIC.
· Receive Volume—Inbound flow volume of the NIC.
· Receive Drop Packets—Number of dropped received packets.
· Send Drop Packets—Number of dropped sent packets.
· Speed—Current Speed of the NIC.
· Specification—Maximum size of the NIC.
Logic Disk
The Logic Disk area contains the following fields:
· Name—Logic disk Name.
· Volume—Logic disk volume.
· Used Volume—Logic disk volume that has been used.
· Usage—Utilization rate of the logic disk.
Storage device monitor
The following information describes how to add and modify monitors for storage devices, and how to view the monitor reports.
APM supports common storage device monitors and HP MSA P2000-specific application monitors. An HP MSA P2000 application monitor supports more monitoring functions than a common storage device application monitor.
Common storage device application monitor
APM use common storage device application monitors to monitor the storage devices that support the SMI-S standard.
The SMI-S implementation varies by storage device vendor. APM might not be able to obtain some information of a monitored storage device due to SMI-S implementation differences.
Adding a common storage device application monitor
When you add a common storage device application monitor, follow these guidelines:
· Add the storage device to be monitored to the IMC platform.
For a storage device managed in the IMC platform, APM obtains and displays network connection information of the storage device and its access devices in the application topology. For more information about adding storage devices to the IMC platform, see H3C Intelligent Management Center v7.3 Enterprise and Standard Platform Administrator Guide.
· Contact the storage device administrator to obtain the username and password of a user with the administrator privileges and the access rights to HTTPS/HTTP and SMI-S. The username and password are required for adding the application monitor.
To add a common storage device application monitor:
1. Click the Resource tab.
2. Open the Add Application page by using one of the following methods:
¡ From the navigation tree, select Application Manager > Add Application.
¡ From the navigation tree, select Application Manager > Application Monitor. In the application monitor list, click Add.
The Add Application page displays all application types that can be monitored by APM.
3. Click Common Storage Device of the Storage Device Monitor class.
The page for adding a common storage device application monitor opens.
4. Configure the following parameters:
¡ IP Address—Enter the IP address of the host on which the storage device to be monitored is installed. APM automatically checks the IP address and associates the application monitor with the storage device if it is already managed in the IMC platform. If the host is already added to the IMC platform, you can also click Select, and then select the storage device in the Select Devices dialog box. For information about selecting a storage device, see "Quick start."
¡ Name—Enter a unique application monitor name. As a best practice, name the application monitor as application type_host IP address.
¡ Use Template—Select Enable or Disable from the list.
¡ Template—Click
the Configure icon ![]() next to the Template field to select an existing template. The Template field
is automatically populated with the name of the selected template. For more
information about configuring application templates, see "Configuration management." This field is displayed only when you select Enable from the Use
Template list.
next to the Template field to select an existing template. The Template field
is automatically populated with the name of the selected template. For more
information about configuring application templates, see "Configuration management." This field is displayed only when you select Enable from the Use
Template list.
¡ Description—Enter a description for the application monitor.
¡ Application Monitor Port—Port used to monitor the application. The default value is 5989. This field is available only when you select Disable from the Use Template list.
¡ Polling Interval (min)—Select a polling interval for the application monitor. Options are 1, 2, 3, 4, 5, 10, 20, and 30. The default polling interval is 5 minutes. A shorter polling interval improves real-time data accuracy at the expense of system resources. This field is available only when you select Disable from the Use Template list.
¡ Username/Password—Enter the username and password of the user who has the administrator privileges on the storage device. The fields are available only when you select Disable from the Use Template list.
¡ SSL—Select Enable or Disable from the list. If you select Enable, APM accesses the storage device through HTTPS. If you select Disable, APM accesses the storage device through HTTP.
¡ Namespace—Enter the namespace for the SMI-S interface of the storage device. The default value is /root/hpq. This field is available only when you select Disable from the Use Template list.
¡ Contact—Enter the contact information, such as the name, email address, and telephone number. The default is the username of the operator who created the application monitor. This field is available only when you select Disable from the Use Template list.
¡ APM Server—Select an APM server to monitor the application. The options are in server-address (application-type:n/N) format. The letter n indicates the number of common storage device applications monitored on the APM server. The letter N indicates the total number of applications monitored on the APM server. Server address 127.0.0.1 indicates that APM and the IMC platform are deployed on the same server.
¡ Related Applications—Click Add next to this field. On the Select Application window, enter a partial or complete name to filter applications, select the applications that the storage device depends on, and then click OK.
Operating system applications cannot be selected. Operators can view all dependencies of the application in the dependency topology.
¡ Application Group—Specify an application group for the common storage device application.
- To specify an existing application group, click Add, select an application group, and then click OK.
- To specify a new application group, click Add Application Group, configure the application group settings, and then click OK.
¡ Detect Application—Select this parameter if you want to enable application detection. APM verifies the application connectivity by using the previous parameter settings, and adds the application monitor only when it can connect to the application. If you do not select this parameter, APM adds the application monitor without verifying the application connectivity.
5. Click OK.
Modifying a common storage device application monitor
Authorized users can modify all parameters except the IP address and the APM server for a storage device. When the IP address of a monitored storage device changes, operators must add a new application monitor for the storage device. The new application monitor cannot inherit the history data from the previous application monitor.
To modify a common storage device application monitor:
1. Click the Resource tab.
2. From the navigation tree, select Application Manager > Application Monitor.
The application monitor list page displays all application monitors.
3. Click the Modify
icon ![]() for the common storage device application monitor you want to
modify.
for the common storage device application monitor you want to
modify.
The page for modifying the common storage device application monitor opens.
4. Modify the parameters as needed, except the IP address and the APM server.
For more information about parameter settings, see "Adding a common storage device application monitor."
5. Click OK.
Viewing the common storage device application monitor report
After a common storage device application monitor is added, APM collects index data of the application, evaluates the availability and health status, and updates the monitor report. The report shows the index values obtained from the most recent polling of the application.
To view the common storage device application monitor report:
1. Click the Resource tab.
2. From the navigation tree, select Application Manager > Application Monitor.
The application monitor list page displays all application monitors.
3. Click the name of a common storage device application monitor to display the report.
Figure 137 shows part of a common storage device application monitor report.
Figure 137 Part of a common storage device application monitor report

Monitor Information
The Monitor Information area contains the following fields:
· Name—Application monitor name.
· Health State—Health status of the storage device.
· IP Address—IP address of the storage device.
· Application Type—Type of the monitored application, which is always Common Storage Device for a common storage device application monitor.
· Port—Port used for monitoring the storage device.
· Namespace—Namespace of the SMI-S interface of the storage device.
· Last Polling Time—Time when APM last polled the storage device.
· Relationship—Click the Relationship icon ![]() to view
dependencies between storage device and other applications in a dependency
topology view. For more information about dependency
topologies, see "Topology and application group management."
to view
dependencies between storage device and other applications in a dependency
topology view. For more information about dependency
topologies, see "Topology and application group management."
· Top5 Unrecovered Alarm—Latest five unrecovered alarms on the storage device. This field is not displayed if no alarm is generated by the storage device.
Availability Today
The Availability Today area contains the following fields:
· Current Availability—Availability of the storage device.
¡ Click the Weekly History icon![]() to view the availability of the common storage device in the last 7
days.
to view the availability of the common storage device in the last 7
days.
¡ Click
the Monthly History icon![]() to view
the availability of the common storage device in the last 30 days.
to view
the availability of the common storage device in the last 30 days.
· Available Time—Total amount of time that the storage device was available after 00:00 today.
· Unavailable Time—Total amount of time that the storage device was unavailable after 00:00 today.
· Inaccessible Time—Total amount of time that the storage device was inaccessible after 00:00 today.
· Unmanaged Time—Total amount of time that the storage device was unmanaged after 00:00 today.
The statistics collection started when the application monitor was added. An availability time field is not displayed when its value is 0.
Basic Information
The Basic Information area contains the following fields:
· Name—Name of the storage device.
· Description—Description of the storage device.
· Vendor—Vendor of the storage device.
· Version—Version of the storage device management controller codes.
Storage Pool/Virtual Disk
The Storage Pool/Virtual Disk area contains the following fields:
· ID—ID of the storage pool or virtual disk. The value of PRIMORDIAL indicates that the storage pool is the original storage pool.
· Health Status—Health status of the storage pool or
virtual disk. Click the Set
Threshold icon ![]() to set
alarm thresholds for the health status of a virtual
disk.
to set
alarm thresholds for the health status of a virtual
disk.
· Free Space—Free space of the storage pool or virtual disk. The free space of a virtual disk is a part of its total space.
· Total Space—Total space of the storage pool or of virtual disk.
· Usage—Usage of the storage pool or virtual disk.
Power Supply Information
The Power Supply Information area contains the following fields:
· ID—ID of the power supply module.
· Name—Name of the power supply module.
· Health Status—Health status of the power supply module.
Click the Set Threshold icon ![]() to set alarm thresholds for the health
status of the power supply module.
to set alarm thresholds for the health
status of the power supply module.
Fan Information
The Fan Information area contains the following fields:
· ID—ID of the fan module.
· Name—Name of the fan module.
· Health Status—Health status of the fan module. Click the Set Threshold icon ![]() to set alarm thresholds for the health
status of the fan module.
to set alarm thresholds for the health
status of the fan module.
Disk Information
The Disk Information area contains the following fields:
· ID—ID of the disk.
· Health Status—Health status of the disk. Click the Set Threshold icon ![]() to set alarm thresholds for the health
status of the disk.
to set alarm thresholds for the health
status of the disk.
· Disk Capacity—Capacity of the disk.
· Free Space—Free space of the disk.
· Used Space—Used space of the disk.
· Disk Usage—Usage of the disk in the last polling
period. Click the History Record icon ![]() to view the disk usage statistics in a line graph.
to view the disk usage statistics in a line graph.
· More—Click More to view disk information of all disks. By default, the report displays disk information of only the first 10 disks when the storage device has more than 10 disks.
Storage Volume Information
The Storage Volume Information area contains the following fields:
· ID—ID of the storage volume.
· Health Status—Health status of the storage volume in the
last polling period. Click the Set
Threshold icon ![]() to set
alarm thresholds for the health status of the storage
volume.
to set
alarm thresholds for the health status of the storage
volume.
· Type—Type of the storage volume:
¡ Standard—Standard volume.
¡ Mastervol—Master volume.
¡ Snap-pool—Snap-pool volume.
· Capacity—Capacity of the disk.
· Free Space—Free space of the storage volume.
· Used Space—Used space of the storage volume.
· Usage—Usage of the storage volume. Click the History Record icon ![]() to view the history graph of the usage of the storage volume.
to view the history graph of the usage of the storage volume.
· Initialized—Whether the storage volume was being initialized.
· Owner—Storage controller that managed the storage volume.
· Preferred Controller—Optimal controller for managing the storage volume.
· More—Click More to view storage volume information of all storage volumes. By default, the report displays storage volume information of only the first 10 storage volumes when the common storage device has more than 10 storage volumes.
Controller Information
The Controller Information area contains the following fields:
· Name—Name of the storage controller.
· Health Status—Health status of the storage controller.
Click the Set Threshold icon ![]() to set alarm thresholds for the health
status of the storage controller.
to set alarm thresholds for the health
status of the storage controller.
· Manufacture—Manufacturer of the storage controller.
· Mode—Operating mode of the storage controller.
· Serial Number—Serial number of storage controller.
Sensor Information
The Interface Information area contains the following fields:
· ID—ID of the sensor.
· Name—Name of the sensor.
· Type—Type of the sensor. The value of Temperature indicates that the sensor is a temperature sensor.
· Health Status—Health status of the sensor. Click the Set Threshold icon ![]() to set alarm thresholds for the health
status of the sensor.
to set alarm thresholds for the health
status of the sensor.
· Description—Description of the sensor.
Interface Information
The Interface Information area contains the following fields:
· Name—Name of the interface on the storage controller. The value of mgmtportX indicates that the interface is the management interface of a controller.
· Health Status—Health status of the interface in the last
polling period. Click the Set
Threshold icon ![]() to set
alarm thresholds for the health status of the interface.
to set
alarm thresholds for the health status of the interface.
· Current Rate—Transmission rate of the interface.
· Max. Rate—Maximum transmission rate that the interface supports.
· Interface Type—Type of the interface.
· Target ID—Target ID of the interface. A hyphen (-) indicates that the interface target ID is not configured or not available.
· Network Configuration—Network configuration of the interface, including the IP address, gateway address, subnet mask, and MAC address. A hyphen (-) indicates that the interface network configuration is not configured or not available.
Performance
The Interface Information area contains the following fields:
· Name—Name of the storage device component.
· Type—Type of the storage device component.
· IO Rate—I/O rate of the storage device component.
· IO Read Rate—I/O read rate of the storage device component.
· IO Write Rate—I/O write rate of the storage device component.
· Data Read Rate—Data read rate of the storage device component.
· Data Write Rate—Data write rate of the storage device component.
· Data Transfer Rate—Data transfer rate of the storage device component.
· More—Click More to view performance information of all storage device components. By default, the report displays performance information of only the first 10 storage device components when the storage device has more than 10 components.
EMC CLARiiON application monitor
EMC CLARiiON (EMC) is a midrange storage system developed by the EMC corporation. Available EMC models include CX3, CX4, and AX4.
Adding an EMC CLARiiON application monitor
APM monitors EMC storage devices through the built-in SMI-S provider of the devices. When you add an EMC application monitor, contact the EMC administrator to perform the following tasks:
· Obtain the IP address and namespace of the SMI-S provider.
· Obtain the username and password of a user with the administrator privileges and the access rights to HTTPS and SMI-S.
· Check whether SSL is enabled on the SMI-S provider.
To add an EMC application monitor:
1. Click the Resource tab.
2. Open the Add Application page by using one of the following methods:
¡ From the navigation tree, select Application Manager > Add Application.
¡ From the navigation tree, select Application Manager > Application Monitor. In the application monitor list, click Add.
The Add Application page displays all application types that can be monitored by APM.
3. Click EMC CLARiiON of the Storage Device Monitor class.
The page for adding an EMC application monitor opens.
4. Configure the following parameters:
¡ IP Address—Enter the IP address of the SMI-S provider of the EMC storage device. APM automatically checks the IP address and associates the application monitor with the EMC storage device if it is already managed in the IMC platform. If the EMC storage device is already added to the IMC platform, you can also click Select, and then select the EMC storage device in the Select Devices dialog box. For information about selecting an EMC storage device, see "Quick start."
¡ Name—Enter a unique application monitor name. As a best practice, name the application monitor as application type_host IP address.
¡ Use Template—Select Enable or Disable from the list.
¡ Template—Click
the Configure icon ![]() next to the Template field to select an existing template. The Template field
is automatically populated with the name of the selected template. For more
information about configuring application templates, see "Configuration management." This field is displayed only when you select Enable from the Use
Template list.
next to the Template field to select an existing template. The Template field
is automatically populated with the name of the selected template. For more
information about configuring application templates, see "Configuration management." This field is displayed only when you select Enable from the Use
Template list.
¡ Description—Enter a description for the application monitor.
¡ Application Monitor Port—Port used to monitor the application. If SSL is enabled, the port number is 5988. If SSL is disabled, the port number is 5989. This field is available only when you select Disable from the Use Template list.
¡ Polling Interval (min)—Select a polling interval for the application monitor. Options are 1, 2, 3, 4, 5, 10, 20, and 30. The default polling interval is 5 minutes. A shorter polling interval improves real-time data accuracy at the expense of system resources. This field is available only when you select Disable from the Use Template list.
¡ Username/Password—Enter the username and password of the SMI-S provider. These fields are available only when you select Disable from the Use Template list.
¡ SSL—Select Enable or Disable from the list according the SSL setting on the SMI-S provider.
¡ Namespace—Enter the namespace for the SMI-S provider. The default value is /root/emc. This field is available only when you select Disable from the Use Template list.
¡ Contact—Enter the contact information, such as the name, email address, and telephone number. The default is the username of the operator who created the application monitor. This field is available only when you select Disable from the Use Template list.
¡ APM Server—Select an APM server to monitor the application. The options are in server-address (application-type:n/N) format. The letter n indicates the number of EMC applications monitored on the APM server. The letter N indicates the total number of applications monitored on the APM server. Server address 127.0.0.1 indicates that APM and the IMC platform are deployed on the same server.
¡ Related Applications—Click Add next to this field. On the Select Application window, enter a partial or complete name to filter applications, select the applications that the EMC storage device depends on, and then click OK.
Operating system applications cannot be selected. Operators can view all dependencies of the application in the dependency topology.
¡ Application Group—Specify an application group for the EMC application.
- To specify an existing application group, click Add, select an application group, and then click OK.
- To specify a new application group, click Add Application Group, configure the application group settings, and then click OK.
¡ Detect Application—Select this parameter if you want to enable application detection. APM verifies the application connectivity by using the previous parameter settings, and adds the application monitor only when it can connect to the application. If you do not select this parameter, APM adds the application monitor without verifying the application connectivity.
5. Click OK.
Modifying an EMC application monitor
Authorized users can modify all parameters except the IP address and the APM server for an EMC storage device. When the IP address of a monitored EMC storage device changes, operators must add a new application monitor for the EMC storage device. The new application monitor cannot inherit the history data from the previous application monitor.
To modify an EMC application monitor:
1. Click the Resource tab.
2. From the navigation tree, select Application Manager > Application Monitor.
The application monitor list page displays all application monitors.
3. Click the Modify
icon ![]() for the EMC application monitor you want to modify.
for the EMC application monitor you want to modify.
The page for modifying the EMC application monitor opens.
4. Modify the parameters as needed, except the IP address and the APM server.
For more information about parameter settings, see "Adding an EMC CLARiiON application monitor."
5. Click OK.
Viewing the EMC application monitor report
After an EMC application monitor is added, APM collects index data of the application, evaluates the availability and health status, and updates the monitor report. The report shows the index values obtained from the most recent polling of the application.
To view the EMC application monitor report:
1. Click the Resource tab.
2. From the navigation tree, select Application Manager > Application Monitor.
The application monitor list page displays all application monitors.
3. Click the name of an EMC application monitor to display the report.
Figure 138 shows part of an EMC application monitor report.
Figure 138 Part of an EMC application monitor report
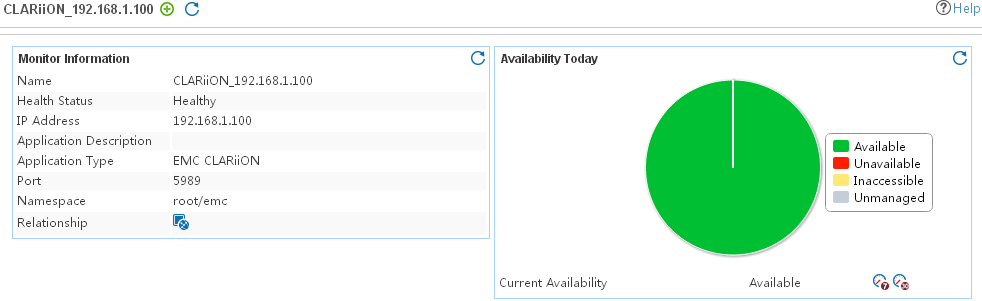
Monitor Information
The Monitor Information area contains the following fields:
· Name—Application monitor name.
· Health Status—Current health status of the EMC storage device.
· IP Address—IP address of the SMI-S provider.
· Application Description—Description of the EMC application.
· Application Type—Type of the monitored application, which is always EMC CLARiiON.
· Port—Listening port number of the SMI-S provider.
· Namespace—Namespace of the SMI-S provider.
· Last Polling Time—Time when APM last polled the SMI-S provider.
· Relationship—Click the Relationship icon ![]() to view
dependencies between the EMC storage device and other applications in a
dependency topology view. For more information about
dependency topologies, see "Topology and application group management."
to view
dependencies between the EMC storage device and other applications in a
dependency topology view. For more information about
dependency topologies, see "Topology and application group management."
· Top5 Unrecovered Alarm—Latest five unrecovered alarms on the EMC storage device. This field is not displayed if no alarm is generated by the EMC storage device.
Availability Today
The Availability Today area contains the following fields:
· Current Availability—Availability of the EMC storage device.
¡ Click the Weekly History icon![]() to view the availability of the EMC storage device in
the last 7 days.
to view the availability of the EMC storage device in
the last 7 days.
¡ Click
the Monthly History icon![]() to view
the availability of the EMC storage device in the last 30 days.
to view
the availability of the EMC storage device in the last 30 days.
· Available Time—Total amount of time that the EMC storage device was available after 00:00 today.
· Unavailable Time—Total amount of time that the EMC storage device was unavailable after 00:00 today.
· Inaccessible Time—Total amount of time that the EMC storage device was inaccessible after 00:00 today.
· Unmanaged Time—Total amount of time that the EMC storage device was unmanaged after 00:00 today.
The statistics collection started when the application monitor was added. An availability time field is not displayed when its value is 0.
Basic Information
The Basic Information area contains the following fields:
· Name—Name of the EMC storage device.
· Disk Count—Number of disks on the EMC storage device.
· System Capacity—System capacity of the EMC storage device.
· Vendor—Vendor of the EMC storage device.
· Manufacture—Manufacturer of the EMC storage device.
· Chassis Model—Chassis model of EMC storage device.
· Serial Number—Serial number of the EMC storage device.
· Version—Version of the EMC management controller codes.
Storage Pool/Virtual Disk
The Storage Pool/Virtual Disk area contains the following fields:
· ID—ID of the storage pool/virtual disk.
· Operational Status—Operating status of the storage pool/virtual disk.
· Free Space—Available space size of the storage pool/virtual disk.
· Total Space—Total space size of the storage pool/virtual disk. The total space size equals the free space size plus the used space size.
· Used Space—Used space size of the storage pool/virtual disk.
· Usage—Ratio of the used space size to the total space size of the storage pool/virtual disk.
Power Supply Information
The Power Supply Information area contains the following fields:
· ID—ID of the power supply module.
· Health Status—Health status of the power supply module. Options are:
¡ Unknown—The health status of the power supply module is unknown.
¡ OK—The power supply module is working correctly.
¡ Degraded—The power supply module is working correctly, but the health status is not optimal or recoverable errors exist.
¡ Minor failure—All functions of the power supply module are available. However, some of the functions are degraded.
¡ Major failure—The power supply module is becoming invalid. Some or all functions are degraded or becoming unavailable.
¡ Critical failure—The power supply module cannot work correctly and might be unrecoverable.
¡ Non-recoverable error—The power supply module is invalid and cannot be recovered. All functions are unavailable.
· Operational Status—Operating status of the power supply module.
· Manufacturer—Manufacturer of the power supply module.
· Model—Model of the power supply module.
· Serial Number—Serial number of the power supply module.
Disk Information
The Disk Information area contains the following fields:
· Name—Name of the disk.
· Health Status—Health status of the disk. Options are:
¡ Unknown—The health status of the disk is unknown.
¡ OK—The disk is working correctly.
¡ Degraded—The disk is working correctly, but the health status is not optimal or recoverable errors exist.
¡ Minor failure—All functions of the disk are available. However, some of the functions are degraded.
¡ Major failure—The disk is becoming invalid. Some or all functions are degraded or becoming unavailable.
¡ Critical failure—The disk cannot work correctly and might be unrecoverable.
¡ Non-recoverable error—The disk is invalid and cannot be recovered. All functions are unavailable.
· Disk Capacity—Total space size of the disk.
· Disk Consumable Space—Assigned available space size of the disk.
Storage Volume Information
The Storage Volume Information area contains the following fields:
· ID—ID of the storage volume.
· Name—Name of the storage volume.
· Health Status—Health status of the storage volume. Options are:
¡ Unknown—The health status of the storage volume is unknown.
¡ OK—The storage volume is working correctly.
¡ Degraded—The storage volume is working correctly, but the health status is not optimal or recoverable errors exist.
¡ Minor failure—All functions of the storage volume are available. However, some of the functions are degraded.
¡ Major failure—The storage volume is becoming invalid. Some or all functions are degraded or becoming unavailable.
¡ Critical failure—The storage volume cannot work correctly and might be unrecoverable.
¡ Non-recoverable error—The storage volume is invalid and cannot be recovered. All functions are unavailable.
· Operational Status—Operating status of the storage volume.
· Capacity—Total space size of the storage volume.
· Consumable Size—Assigned available space size of the storage volume.
· Initialized—Whether the storage volume was initialized.
· RAID Type—RAID type of the storage volume.
Controller Information
The Controller Information area contains the following fields:
· ID—ID of the storage controller.
· Name—Name of the storage controller.
· Health Status—Health status of the storage controller. Options are:
¡ Unknown—The health status of the storage controller is unknown.
¡ OK—The storage controller is working correctly.
¡ Degraded—The storage controller is working correctly, but the health status is not optimal or recoverable errors exist.
¡ Minor failure—All functions of the storage controller are available. However, some of the functions are degraded.
¡ Major failure—The storage controller is becoming invalid. Some or all functions are degraded or becoming unavailable.
¡ Critical failure—The storage controller cannot work correctly and might be unrecoverable.
¡ Non-recoverable error—The storage controller is invalid and cannot be recovered. All functions are unavailable.
· Operational Status—Operating status of the storage controller.
· Max Units Controlled—Maximum number of units that can be controlled by the storage controller.
Interface Information
The Interface Information area contains the following fields:
· Name—Name of the interface.
· Health Status—Health status of the interface. Options are:
¡ Unknown—The health status of the interface is unknown.
¡ OK—The interface is working correctly.
¡ Degraded—The interface is working correctly, but the health status is not optimal or recoverable errors exist.
¡ Minor failure—All functions of the interface are available. However, some of the functions are degraded.
¡ Major failure—The interface is becoming invalid. Some or all functions are degraded or becoming unavailable.
¡ Critical failure—The interface cannot work correctly and might be unrecoverable.
¡ Non-recoverable error—The interface is invalid and cannot be recovered. All functions are unavailable.
· Operational Status—Operating status of the interface.
· Current Rate—Current rate of the interface.
· Interface Count—Number of the interfaces.
· Interface Type—Type of the interface.
Battery Information
The Battery Information area contains the following fields:
· ID—ID of the battery.
· Health Status—Health status of the battery. Options are:
¡ Unknown—The health status of the battery is unknown.
¡ OK—The battery is working correctly.
¡ Degraded—The battery is working correctly, but the health status is not optimal or recoverable errors exist.
¡ Minor failure—All functions of the battery are available. However, some of the functions are degraded.
¡ Major failure—The battery is becoming invalid. Some or all functions are degraded or becoming unavailable.
¡ Critical failure—The battery cannot work correctly and might be unrecoverable.
¡ Non-recoverable error—The battery is invalid and cannot be recovered. All functions are unavailable.
· Manufacturer—Manufacturer of the battery.
· Model—Model of the battery.
Card Information
The Card Information area display information about the following types of cards: IOCardm, LinkControlCard, and SpCard.
The Card Information area contains the following fields:
· ID—ID of the card.
· Operational Status—Operating status of the card.
· Manufacturer—Manufacturer of the card.
· Model—Model of the card.
Performance
The Performance area contains the following fields:
· Instance ID—ID of the performance instance.
· Name—Name of the performance index.
· Type—Type of the performance index.
· IO Rate—I/O rate of the disk array.
· IO Read Rate—I/O read rate of the disk array.
· IO Write Rate—I/O write rate of the disk array.
· Data Read Rate—Data read rate of the disk array.
· Data Write Rate—Data write rate of the disk array.
· Data Transfer Rate—Data transfer rate of the disk array.
HP 3PAR application monitor
HP 3PAR StoreServ is an all-flash, solid-state array data storage system developed by H3C.
Adding an HP 3PAR application monitor
APM monitors HP 3PAR storage devices through the built-in SMI-S interface of the devices. When you add an HP 3PAR application monitor, follow these guidelines:
· Add the HP 3PAR storage device to be monitored to the IMC platform.
For a storage device managed in the IMC platform, APM obtains and displays network connection information of the storage device and its access devices in the application topology. For more information about adding storage devices to the IMC platform, see H3C Intelligent Management Center v7.3 Enterprise and Standard Platform Administrator Guide.
· Contact the HP 3PAR administrator to obtain the username and password of a user with the administrator privileges and the access rights to HTTPS/HTTP and SMI-S. The username and password are required for adding the application monitor.
To add an HP 3PAR application monitor:
1. Click the Resource tab.
2. Open the Add Application page by using one of the following methods:
¡ From the navigation tree, select Application Manager > Add Application.
¡ From the navigation tree, select Application Manager > Application Monitor. In the application monitor list, click Add.
The Add Application page displays all application types that can be monitored by APM.
3. Click HP 3PAR of the Storage Device Monitor class.
The page for adding an HP 3PAR application monitor opens.
4. Configure the following parameters:
¡ IP Address—Enter the IP address of the host on which the HP 3PAR storage device to be monitored is installed. APM automatically checks the IP address and associates the application monitor with the HP 3PAR storage device if it is already managed in the IMC platform. If the host is already added to the IMC platform, you can also click Select, and then select the HP 3PAR storage device in the Select Devices dialog box. For information about selecting an HP 3PAR, see "Quick start."
¡ Name—Enter a unique application monitor name. As a best practice, name the application monitor as application type_host IP address.
¡ Use Template—Select Enable or Disable from the list.
¡ Template—Click
the Configure icon ![]() next to the Template field to select an existing template. The Template field
is automatically populated with the name of the selected template. For more
information about configuring application templates, see "Configuration management." This field is displayed only when you select Enable from the Use
Template list.
next to the Template field to select an existing template. The Template field
is automatically populated with the name of the selected template. For more
information about configuring application templates, see "Configuration management." This field is displayed only when you select Enable from the Use
Template list.
¡ Description—Enter a description for the application monitor.
¡ Application Monitor Port—Port used to monitor the application. The default value is 5989. This field is available only when you select Disable from the Use Template list.
¡ Polling Interval (min)—Select a polling interval for the application monitor. Options are 1, 2, 3, 4, 5, 10, 20, and 30. The default polling interval is 5 minutes. A shorter polling interval improves real-time data accuracy at the expense of system resources. This field is available only when you select Disable from the Use Template list.
¡ Username/Password—Enter the username and password of the user who has the administrator privileges on the HP 3PAR. These fields are available only when you select Disable from the Use Template list.
¡ SSL—Select Enable or Disable from the list. If you select Enable, APM accesses the HP 3PAR storage device through HTTPS. If you select Disable, APM accesses the HP 3PAR storage device through HTTP.
¡ Namespace—Enter the namespace for the SMI-S interface of the HP 3PAR storage device. The default value is /root/tpd. This field is available only when you select Disable from the Use Template list.
¡ Contact—Enter the contact information, such as the name, email address, and telephone number. The default is the username of the operator who created the application monitor. This field is available only when you select Disable from the Use Template list.
¡ APM Server—Select an APM server to monitor the application. The options are in server-address (application-type:n/N) format. The letter n indicates the number of HP 3PAR applications monitored on the APM server. The letter N indicates the total number of applications monitored on the APM server. Server address 127.0.0.1 indicates that APM and the IMC platform are deployed on the same server.
¡ Related Applications—Click Add next to this field. On the Select Application window, enter a partial or complete name to filter applications, select the applications that the HP 3PAR storage device depends on, and then click OK.
Operating system applications cannot be selected. Operators can view all dependencies of the application in the dependency topology.
¡ Application Group—Specify an application group for the HP 3PAR application.
- To specify an existing application group, click Add, select an application group, and then click OK.
- To specify a new application group, click Add Application Group, configure the application group settings, and then click OK.
¡ Detect Application—Select this parameter if you want to enable application detection. APM verifies the application connectivity by using the previous parameter settings, and adds the application monitor only when it can connect to the application. If you do not select this parameter, APM adds the application monitor without verifying the application connectivity.
5. Click OK.
Modifying an HP 3PAR application monitor
Authorized users can modify all parameters except the IP address and the APM server for an HP 3PAR storage device. When the IP address of a monitored HP 3PAR storage device changes, operators must add a new application monitor for the HP 3PAR storage device. The new application monitor cannot inherit the history data from the previous application monitor.
To modify an HP 3PAR application monitor:
1. Click the Resource tab.
2. From the navigation tree, select Application Manager > Application Monitor.
The application monitor list page displays all application monitors.
3. Click the Modify
icon ![]() for the HP 3PAR application monitor you want to modify.
for the HP 3PAR application monitor you want to modify.
The page for modifying the HP 3PAR application monitor opens.
4. Modify the parameters as needed, except the IP address and the APM server.
For more information about parameter settings, see "Adding an HP 3PAR application monitor."
5. Click OK.
Viewing the HP 3PAR application monitor report
After an HP 3PAR application monitor is added, APM collects index data of the application, evaluates the availability and health status, and updates the monitor report. The report shows the index values obtained from the most recent polling of the application.
To view the HP 3PAR application monitor report:
1. Click the Resource tab.
2. From the navigation tree, select Application Manager > Application Monitor.
The application monitor list page displays all application monitors.
3. Click the name of an HP 3PAR application monitor to display the report.
Figure 139 shows part of an HP 3PAR application monitor report.
Figure 139 Part of an HP 3PAR application monitor report
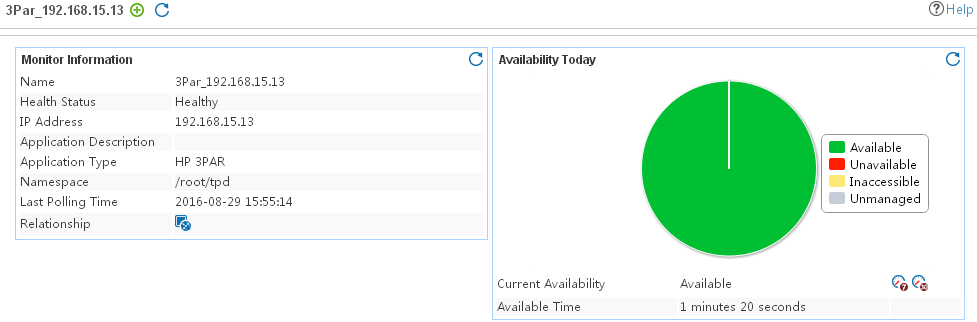
Monitor Information
The Monitor Information area contains the following fields:
· Name—Application monitor name.
· Health Status—Health status of the HP 3PAR storage device.
· IP Address—IP address of the HP 3PAR storage device.
· Application Description—Description of the HP 3PAR application.
· Application Type—Type of the monitored application, which is always HP 3PAR.
· Namespace—Namespace of the SMI-S interface of the HP 3PAR storage device.
· Last Polling Time—Time when APM last polled the HP 3PAR storage device.
· Relationship—Click the Relationship icon ![]() to view
dependencies between the HP 3PAR storage device and other applications in a
dependency topology view. For more information about
dependency topologies, see "Topology and application group management."
to view
dependencies between the HP 3PAR storage device and other applications in a
dependency topology view. For more information about
dependency topologies, see "Topology and application group management."
· Top5 Unrecovered Alarm—Latest five unrecovered alarms on the HP 3PAR storage device. This field is not displayed if no alarm is generated by the HP 3PAR storage device.
Availability Today
The Availability Today area contains the following fields:
· Current Availability—Availability of the HP 3PAR storage device.
¡ Click the Weekly History icon![]() to view the availability of the HP 3PAR storage device in
the last 7 days.
to view the availability of the HP 3PAR storage device in
the last 7 days.
¡ Click
the Monthly History icon![]() to view
the availability of the HP 3PAR
storage device in the last 30
days.
to view
the availability of the HP 3PAR
storage device in the last 30
days.
· Available Time—Total amount of time that the HP 3PAR storage device was available after 00:00 today.
· Unavailable Time—Total amount of time that the HP 3PAR storage device was unavailable after 00:00 today.
· Inaccessible Time—Total amount of time that the HP 3PAR storage device was inaccessible after 00:00 today.
· Unmanaged Time—Total amount of time that the HP 3PAR storage device was unmanaged after 00:00 today.
The statistics collection started when the application monitor was added. An availability time field is not displayed when its value is 0.
Basic Information
The Basic Information area contains the following fields:
· Name—Name of the HP 3PAR storage device.
· Model—Model of the HP 3PAR storage device.
· Primary Owner—Owner of the HP 3PAR storage device.
· Contact—Contact of the owner of the HP 3PAR storage device.
· Time Zone—Time Zone configured for the HP 3PAR storage device.
· Operational Status—Operating status of the HP 3PAR storage device.
Disk Information
The Disk Information area contains the following fields:
· Disk ID—ID of the virtual disk.
· Disk Health Status—Health status of the virtual disk. Options are:
¡ Unknown—The health status of the virtual disk is unknown.
¡ OK—The virtual disk is working correctly.
¡ Degraded—The virtual disk is working correctly, but the health status is not optimal or recoverable errors exist.
¡ Minor failure—All functions of the virtual disk are available. However, some of the functions are degraded.
¡ Major failure—The virtual disk is becoming invalid. Some or all functions are degraded or becoming unavailable.
¡ Critical failure—The virtual disk cannot work correctly and might be unrecoverable.
¡ Non-recoverable error—The virtual disk is invalid and cannot be recovered. All functions are unavailable.
· Disk Operational Status—Operating status of the virtual disk.
· Disk Size—Total size of the virtual disk.
· Disk Consumable Size—Assigned available space size of the virtual disk.
· Block Size—Block size of the virtual disk.
Controller Information
The Controller Information area contains the following fields:
· Controller ID—ID of the storage controller.
· Controller Name—Name of the storage controller.
· Controller Health Status—Health status of the storage controller. Options are:
¡ Unknown—The health status of the storage controller is unknown.
¡ OK—The storage controller is working correctly.
¡ Degraded—The storage controller is working correctly, but the health status is not optimal or recoverable errors exist.
¡ Minor failure—All functions of the storage controller are available. However, some of the functions are degraded.
¡ Major failure—The storage controller is becoming invalid. Some or all functions are degraded or becoming unavailable.
¡ Critical failure—The storage controller cannot work correctly and might be unrecoverable.
¡ Non-recoverable error—The storage controller is invalid and cannot be recovered. All functions are unavailable.
· Controller Operational Status—Operating status of the storage controller.
Fan Information
The Fan Information area contains the following fields:
· Fan Name—Name of the fan module.
· Fan Health Status—Health status of the fan module. Options are:
¡ Unknown—The health status of the fan module is unknown.
¡ OK—The fan module is working correctly.
¡ Degraded—The fan module is working correctly, but the health status is not optimal or recoverable errors exist.
¡ Minor failure—All functions of the fan module are available. However, some of the functions are degraded.
¡ Major failure—The fan module is becoming invalid. Some or all functions are degraded or becoming unavailable.
¡ Critical failure—The fan module cannot work correctly and might be unrecoverable.
¡ Non-recoverable error—The fan module is invalid and cannot be recovered. All functions are unavailable.
· Fan Operational Status—Operating status of the fan module.
· Speed—Speed of the fan module.
Storage Pool Information
The Storage Pool Information area contains the following fields:
· Pool Name—Name of the storage pool.
· Pool Health Status—Health status of the storage pool. Options are:
¡ Unknown—The health status of the storage pool is unknown.
¡ OK—The storage pool is working correctly.
¡ Degraded—The storage pool is working correctly, but the health status is not optimal or recoverable errors exist.
¡ Minor failure—All functions of the storage pool are available. However, some of the functions are degraded.
¡ Major failure—The storage pool is becoming invalid. Some or all functions are degraded or becoming unavailable.
¡ Critical failure—The storage pool cannot work correctly and might be unrecoverable.
¡ Non-recoverable error—The storage pool is invalid and cannot be recovered. All functions are unavailable.
· Pool Operational Status—Operating status of the storage pool.
· Remain Managed Space—Available space size of the storage pool.
· Total Managed Space—Total space size of the storage pool.
· Used Capacity—Used space size of the storage pool.
· Usage Ratio—Usage ratio of the storage pool.
· Space Limit—Space limit of the storage pool.
· Primordial—Whether the storage pool is the original storage pool.
Storage Volume Information
The Storage Volume Information area contains the following fields:
· Volume Name—Name of the storage volume.
· Volume Health Status—Health status of the storage volume. Options are:
¡ Unknown—The health status of the storage volume is unknown.
¡ OK—The storage volume is working correctly.
¡ Degraded—The storage volume is working correctly, but the health status is not optimal or recoverable errors exist.
¡ Minor failure—All functions of the storage volume are available. However, some of the functions are degraded.
¡ Major failure—The storage volume is becoming invalid. Some or all functions are degraded or becoming unavailable.
¡ Critical failure—The storage volume cannot work correctly and might be unrecoverable.
¡ Non-recoverable error—The storage volume is invalid and cannot be recovered. All functions are unavailable.
· Volume Operational Status—Operating status of the storage volume.
· Volume Size—Space size of the storage volume.
· Volume Consumable Size—Assigned available space size of the storage volume.
· Block Size—Block size of the storage volume.
· Volume Raw Size—Space size of the storage volume in the initial state.
· Primordial—Whether the storage volume is the original storage volume.
· RAID Type—RAID type of the storage volume.
FC Port Information
The FC Port Information area contains the following fields:
· FC Port Name—Name of the FC interface.
· FC Port Health Status—Health status of the FC interface. Options are:
¡ Unknown—The health status of the FC interface is unknown.
¡ OK—The FC interface is working correctly.
¡ Degraded—The FC interface is working correctly, but the health status is not optimal or recoverable errors exist.
¡ Minor failure—All functions of the FC interface are available. However, some of the functions are degraded.
¡ Major failure—The FC interface is becoming invalid. Some or all functions are degraded or becoming unavailable.
¡ Critical failure—The FC interface cannot work correctly and might be unrecoverable.
¡ Non-recoverable error—The FC interface is invalid and cannot be recovered. All functions are unavailable.
· FC Port Operational Status—Operating status of the FC interface.
· FC Port Type—Link technology of the FC interface.
· FC Port Bandwidth—Bandwidth of the FC interface.
· FC Port Max. Bandwidth—Maximum bandwidth of the FC interface.
· FC Port Number—Number of the FC interface.
· FC Port MTU—Maximum transmission unit (MTU) of the FC interface.
· FC Port Permanent Address—Permanent address of the FC interface.
Ethernet Port Information
The Ethernet Port Information area contains the following fields:
· Ethernet Port Name—Name of the Ethernet interface.
· Ethernet Port Health Status—Status of the Ethernet interface. Options are:
¡ Unknown—The health status of the Ethernet interface is unknown.
¡ OK—The Ethernet interface is working correctly.
¡ Degraded—The Ethernet interface is working correctly, but the health status is not optimal or recoverable errors exist.
¡ Minor failure—All functions of the Ethernet interface are available. However, some of the functions are degraded.
¡ Major failure—The Ethernet interface is becoming invalid. Some or all functions are degraded or becoming unavailable.
¡ Critical failure—The Ethernet interface cannot work correctly and might be unrecoverable.
¡ Non-recoverable error—The Ethernet interface is invalid and cannot be recovered. All functions are unavailable.
· Ethernet Port Operational Status—Operating status of the Ethernet interface.
· Ethernet Port Bandwidth—Bandwidth of the Ethernet interface.
· Ethernet Port Max. Bandwidth—Maximum bandwidth of the Ethernet interface.
· Ethernet Port Number—Number of the Ethernet interface.
· Ethernet Port MTU—Maximum transmission unit of the Ethernet interface.
· Ethernet Port Permanent Address—Permanent address of the Ethernet interface.
Power Supply Information
The Power Supply Information area contains the following fields:
· Power Supply Name—Name of the power supply module.
· Power Supply Health Status—Health status of the power supply module. Options are:
¡ Unknown—The health status of the power supply module is unknown.
¡ OK—The power supply module is working correctly.
¡ Degraded—The power supply module is working correctly, but the health status is not optimal or recoverable errors exist.
¡ Minor failure—All functions of the power supply module are available. However, some of the functions are degraded.
¡ Major failure—The power supply module is becoming invalid. Some or all functions are degraded or becoming unavailable.
¡ Critical failure—The power supply module cannot work correctly and might be unrecoverable.
¡ Non-recoverable error—The power supply module is invalid and cannot be recovered. All functions are unavailable.
· Power Supply Operational Status—Operating status of the power supply module.
· Manufacturer—Manufacturer of the power supply module.
· Model—Model of the power supply module.
· Model Name—Model name of the power supply module.
· Serial Number—Serial number of the power supply module.
· Position—Position of the power supply module.
Battery Information
The Battery Information area contains the following fields:
· Battery Name—Name of the battery.
· Battery Health Status—Health status of the battery. Options are:
¡ Unknown—The health status of the battery is unknown.
¡ OK—The battery is working correctly.
¡ Degraded—The battery is working correctly, but the health status is not optimal or recoverable errors exist.
¡ Minor failure—All functions of the battery are available. However, some of the functions are degraded.
¡ Major failure—The battery is becoming invalid. Some or all functions are degraded or becoming unavailable.
¡ Critical failure—The battery cannot work correctly and might be unrecoverable.
¡ Non-recoverable error—The battery is invalid and cannot be recovered. All functions are unavailable.
· Battery Operational Status—Operating status of the battery.
· Charging Status—Charging status of the battery.
· Max Life—Maximum lifetime of the battery.
· Manufacturer—Manufacturer of the battery.
· Model—Model of the battery.
· Model Name—Model name of the battery.
· Serial Number—Serial number of the battery.
HP MSA P2000 application monitor
HP MSA P2000 series storage devices include HP P2000 FC MSA and HP P2000 iSCSI MSA. APM monitors HP MSA P2000 storage devices through the built-in SMI-S interface of the devices. For HP MSA P2000 storage devices, you can add HP MSA P2000-specific application monitors in addition to common storage device monitors.
Adding an HP MSA P2000 application monitor
When you add an HP MSA P2000 application monitor, follow these guidelines:
· Add the HP MSA P2000 storage device to be monitored to the IMC platform.
For a storage device managed in the IMC platform, APM obtains and displays network connection information of the storage device and its access devices in the application topology. For more information about adding storage devices to the IMC platform, see H3C Intelligent Management Center v7.3 Enterprise and Standard Platform Administrator Guide.
· Contact the HP MSA P2000 administrator to obtain the username and password of a user with the administrator privileges and the access rights to HTTPS/HTTP and SMI-S. The username and password are required for adding the application monitor.
To add an HP MSA P2000 application monitor:
1. Click the Resource tab.
2. Open the Add Application page by using one of the following methods:
¡ From the navigation tree, select Application Manager > Add Application.
¡ From the navigation tree, select Application Manager > Application Monitor. In the application monitor list, click Add.
The Add Application page displays all application types that can be monitored by APM.
3. Click HP MSA P2000 of the Storage Device Monitor class.
The page for adding an HP MSA P2000 application monitor opens.
4. Configure the following parameters:
¡ IP Address—Enter the IP address of the host on which the HP MSA P2000 storage device to be monitored is installed. APM automatically checks the IP address and associates the application monitor with the HP MSA P2000 storage device if it is already managed in the IMC platform. If the host is already added to the IMC platform, you can also click Select, and then select the HP MSA P2000 storage device in the Select Devices dialog box. For information about selecting an HP MSA P2000, see "Quick start."
¡ Name—Enter a unique application monitor name. As a best practice, name the application monitor as application type_host IP address.
¡ Use Template—Select Enable or Disable from the list.
¡ Template—Click
the Configure icon ![]() next to the Template field to select an existing template. The Template field
is automatically populated with the name of the selected template. For more
information about configuring application templates, see "Configuration management." This field is displayed only when you select Enable from the Use
Template list.
next to the Template field to select an existing template. The Template field
is automatically populated with the name of the selected template. For more
information about configuring application templates, see "Configuration management." This field is displayed only when you select Enable from the Use
Template list.
¡ Description—Enter a description for the application monitor.
¡ Application Monitor Port—Port used to monitor the application. The default value is 5989. This field is available only when you select Disable from the Use Template list.
¡ Polling Interval (min)—Select a polling interval for the application monitor. Options are 1, 2, 3, 4, 5, 10, 20, and 30. The default polling interval is 5 minutes. A shorter polling interval improves real-time data accuracy at the expense of system resources. This field is available only when you select Disable from the Use Template list.
¡ Username/Password—Enter the username and password of the user who has the administrator privileges on the HP MSA P2000. The fields are available only when you select Disable from the Use Template list.
¡ SSL—Select Enable or Disable from the list. If you select Enable, APM accesses the HP MSA P2000 storage device through HTTPS. If you select Disable, APM accesses the HP MSA P2000 storage device through HTTP.
¡ Namespace—Enter the namespace for the SMI-S interface of the HP MSA P2000 storage device. The default value is /root/hpq. This field is available only when you select Disable from the Use Template list.
¡ Contact—Enter the contact information, such as the name, email address, and telephone number. The default is the username of the operator who created the application monitor. This field is available only when you select Disable from the Use Template list.
¡ APM Server—Select an APM server to monitor the application. The options are in server-address (application-type:n/N) format. The letter n indicates the number of HP MSA P2000 applications monitored on the APM server. The letter N indicates the total number of applications monitored on the APM server. Server address 127.0.0.1 indicates that APM and the IMC platform are deployed on the same server.
¡ Related Applications—Click Add next to this field. On the Select Application window, enter a partial or complete name to filter applications, select the applications that the HP MSA P2000 storage device depends on, and then click OK.
Operating system applications cannot be selected. Operators can view all dependencies of the application in the dependency topology.
¡ Application Group—Specify an application group for the HP MSA P2000 application.
- To specify an existing application group, click Add, select an application group, and then click OK.
- To specify a new application group, click Add Application Group, configure the application group settings, and then click OK.
¡ Detect Application—Select this parameter if you want to enable application detection. APM verifies the application connectivity by using the previous parameter settings, and adds the application monitor only when it can connect to the application. If you do not select this parameter, APM adds the application monitor without verifying the application connectivity.
5. Click OK.
Modifying an HP MSA P2000 application monitor
Authorized users can modify all parameters except the IP address and the APM server for an HP MSA P2000 storage device. When the IP address of a monitored HP MSA P2000 storage device changes, operators must add a new application monitor for the HP MSA P2000 storage device. The new application monitor cannot inherit the history data from the previous application monitor.
To modify an HP MSA P2000 application monitor:
1. Click the Resource tab.
2. From the navigation tree, select Application Manager > Application Monitor.
The application monitor list page displays all application monitors.
3. Click the Modify
icon ![]() for the HP MSA P2000 application monitor you want to modify.
for the HP MSA P2000 application monitor you want to modify.
The page for modifying the HP MSA P2000 application monitor opens.
4. Modify the parameters as needed, except the IP address and the APM server.
For more information about parameter settings, see "Adding an HP MSA P2000 application monitor."
5. Click OK.
Viewing the HP MSA P2000 application monitor report
After an HP MSA P2000 application monitor is added, APM collects index data of the application, evaluates the availability and health status, and updates the monitor report. The report shows the index values obtained from the most recent polling of the application.
To view the HP MSA P2000 application monitor report:
1. Click the Resource tab.
2. From the navigation tree, select Application Manager > Application Monitor.
The application monitor list page displays all application monitors.
3. Click the name of an HP MSA P2000 application monitor to display the report.
Figure 140 shows part of an HP MSA P2000 application monitor report.
Figure 140 Part of an HP MSA P2000 application monitor report
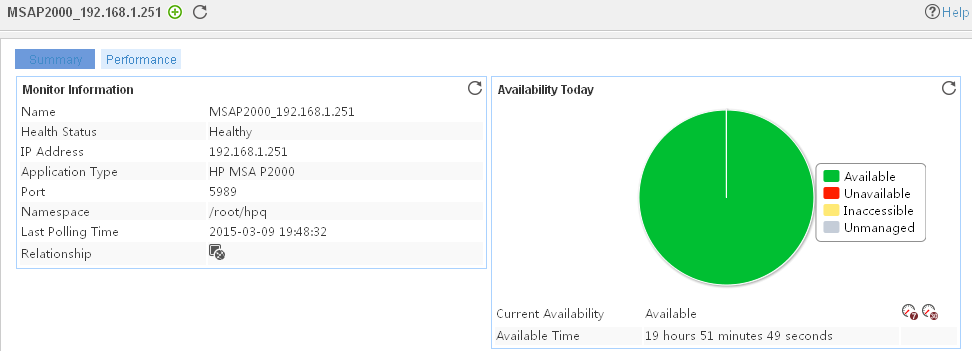
Monitor Information
The Monitor Information area contains the following fields:
· Name—Application monitor name.
· Health State—Health status of HP MSA P2000.
· IP Address—IP address of HP MSA P2000.
· Application Type—Type of the monitored application, which is always HP MSA P2000 for an HP MSA P2000 application monitor.
· Port—Port used for monitoring HP MSA P2000.
· Namespace—Namespace of the SMI-S interface of HP MSA P2000.
· Last Polling Time—Time when APM last polled HP MSA P2000.
· Relationship—Click the Relationship icon ![]() to view
dependencies between HP MSA P2000 and other applications in a dependency
topology view. For more information about dependency
topologies, see "Topology and application group management."
to view
dependencies between HP MSA P2000 and other applications in a dependency
topology view. For more information about dependency
topologies, see "Topology and application group management."
· Top5 Unrecovered Alarm—Latest five unrecovered alarms on HP MSA P2000. This field is not displayed if no alarm is generated by HP MSA P2000.
Availability Today
The Availability Today area contains the following fields:
· Current Availability—Availability of HP MSA P2000.
¡ Click the Weekly History icon![]() to view the availability of the HP MSA P2000 in the last 7 days.
to view the availability of the HP MSA P2000 in the last 7 days.
¡ Click
the Monthly History icon![]() to view
the availability of the HP MSA P2000 in the last 30 days.
to view
the availability of the HP MSA P2000 in the last 30 days.
· Available Time—Total amount of time that HP MSA P2000 was available after 00:00 today.
· Unavailable Time—Total amount of time that HP MSA P2000 was unavailable after 00:00 today.
· Inaccessible Time—Total amount of time that HP MSA P2000 was inaccessible after 00:00 today.
· Unmanaged Time—Total amount of time that HP MSA P2000 was unmanaged after 00:00 today.
The statistics collection started when the application monitor was added. An availability time field is not displayed when its value is 0.
Basic Information
The Basic Information area contains the following fields:
· Name—Name of HP MSA P2000.
· Description—Description of HP MSA P2000.
· RAID Level—RAID level of HP MSA P2000.
· Drive Count—Number of drivers on HP MSA P2000.
· System Capacity—Total physical disk capacity used by HP MSA P2000.
· Vendor—Vendor of HP MSA P2000.
· Manufacture—Manufacturer of HP MSA P2000.
· Case Model—Case model of HP MSA P2000.
· Serial Number—Serial number of HP MSA P2000.
· Version—Version of the HP MSA P2000 management controller codes.
Storage Pool/Virtual Disk
The Storage Pool/Virtual Disk area contains the following fields:
· ID—ID of the storage pool or virtual disk. The value of SAS PRIMORDIAL POOL is the ID of the storage pool. The other ID values are the IDs of virtual disks.
· Health Status—Health status of the storage pool or
virtual disk in the last polling period. Click the Set Threshold icon ![]() to set
alarm thresholds for the health status of a virtual
disk.
to set
alarm thresholds for the health status of a virtual
disk.
· Free Space—Free space of the storage pool or virtual disk. The free space of a virtual disk is a part of its total space.
· Total Space—Total space of the storage pool or virtual disk.
Power Supply Information
The Power Supply Information area contains the following fields:
· ID—ID of the power supply module.
· Name—Name of the power supply module.
· Health Status—Health status of the power supply module in
the last polling period. Click the Set Threshold icon ![]() to set
alarm thresholds for the health status of the power
supply module.
to set
alarm thresholds for the health status of the power
supply module.
Fan Information
The Fan Information area contains the following fields:
· ID—ID of the fan module.
· Name—Name of the fan module.
· Health Status—Health status of the fan module in the last
polling period. Click the Set Threshold icon ![]() to set alarm thresholds for the health
status of the fan module.
to set alarm thresholds for the health
status of the fan module.
Disk Information
The Disk Information area contains the following fields:
· ID—ID of the disk.
· Health Status—Health status of the disk. Click the Set Threshold icon ![]() to set alarm thresholds for the health
status of the disk.
to set alarm thresholds for the health
status of the disk.
· Disk Capacity—Capacity of the disk.
· Free Space—Free space of the disk.
· Used Space—Used space of the disk.
· Disk Usage—Usage of the disk in the last polling
period. Click the History Record icon ![]() to view the history graph of the disk usage.
to view the history graph of the disk usage.
· More—Click More to view disk information of all disks. By default, the report displays disk information of only the first 10 disks when the HP MSA P2000 has more than 10 disks.
Storage Volume Information
The Storage Volume Information area contains the following fields:
· ID—ID of the storage volume.
· Health Status—Health status of the storage volume in the
last polling period. Click the Set
Threshold icon ![]() to set
alarm thresholds for the health status of the storage
volume.
to set
alarm thresholds for the health status of the storage
volume.
· Type—Type of the storage volume:
¡ Standard—Standard volume.
¡ Mastervol—Master volume.
¡ Snap-pool—Snap-pool volume.
· Capacity—Capacity of the disk.
· Free Space—Free space of the storage volume.
· Used Space—Used space of the storage volume.
· Usage—Usage of the storage volume. Click the History Record icon ![]() to view the history graph of the volume usage.
to view the history graph of the volume usage.
· Initialized—Whether the storage volume was being initialized.
· Owner—Storage controller that managed the storage volume.
· Preferred Controller—Optimal controller for managing the storage volume.
· More—Click More to view storage volume information of all storage volumes. By default, the report displays storage volume information of only the first 10 storage volumes when the HP MSA P2000 has more than 10 storage volumes.
Controller Information
The Controller Information area contains the following fields:
· Name—Name of the storage controller.
· Health Status—Health status of the storage controller in
the last polling period. Click the Set Threshold icon ![]() to set
alarm thresholds for the health status of the storage
controller.
to set
alarm thresholds for the health status of the storage
controller.
· Manufacture—Manufacturer of the storage controller.
· Mode—Operating mode of the storage controller.
· Serial Number—Serial number of storage controller.
Interface Information
The Interface Information area contains the following fields:
· Name—Name of the interface on the storage controller. The value of mgmtportX indicates that the interface is the management interface of a controller.
· Health Status—Health status of the interface in the last
polling period. Click the Set
Threshold icon ![]() to set
alarm thresholds for the health status of the interface.
to set
alarm thresholds for the health status of the interface.
· Current Rate—Transmission rate of the interface.
· Max. Rate—Maximum transmission rate that the interface supports.
· Interface Type—Type of the interface.
· Target ID—Target ID of the interface. A hyphen (-) indicates that the interface target ID is not configured or not available.
· Network Configuration—Network configuration of the interface, including the IP address, gateway address, subnet mask, and MAC address. A hyphen (-) indicates that the interface network configuration is not configured or not available.
HW OceanStor 18500 V3 application monitor
HW OceanStor 18500 V3 (18500 V3) is a high-end storage system developed by Huawei.
Adding an HW OceanStor 18500 V3 application monitor
APM monitors 18500 V3 storage devices through the built-in SMI-S provider of the devices. When you add an 18500 V3 application monitor, contact the 18500 V3 administrator to perform the following tasks:
· Obtain the IP address and namespace of the SMI-S provider.
· Obtain the username and password of a user with the administrator privileges and the access rights to HTTPS and SMI-S.
· Check whether SSL is enabled on the SMI-S provider.
To add an 18500 V3 application monitor:
1. Click the Resource tab.
2. Open the Add Application page by using one of the following methods:
¡ From the navigation tree, select Application Manager > Add Application.
¡ From the navigation tree, select Application Manager > Application Monitor. In the application monitor list, click Add.
The Add Application page displays all application types that can be monitored by APM.
3. Click HW OceanStor 18500 V3 of the Storage Device Monitor class.
The page for adding an 18500 V3 application monitor opens.
4. Configure the following parameters:
¡ IP Address—Enter the IP address of the SMI-S provider of the 18500 V3 storage device. APM automatically checks the IP address and associates the application monitor with the 18500 V3 storage device if it is already managed in the IMC platform. If the 18500 V3 storage device is already added to the IMC platform, you can also click Select, and then select the 18500 V3 storage device in the Select Devices dialog box. For information about selecting an 18500 V3 storage device, see "Quick start."
¡ Name—Enter a unique application monitor name. As a best practice, name the application monitor as application type_host IP address.
¡ Use Template—Select Enable or Disable from the list.
¡ Template—Click
the Configure icon ![]() next to the Template field to select an existing template. The Template field
is automatically populated with the name of the selected template. For more
information about configuring application templates, see "Configuration management." This field is displayed only when you select Enable from the Use
Template list.
next to the Template field to select an existing template. The Template field
is automatically populated with the name of the selected template. For more
information about configuring application templates, see "Configuration management." This field is displayed only when you select Enable from the Use
Template list.
¡ Description—Enter a description for the application monitor.
¡ Application Monitor Port—Port used to monitor the application. If SSL is enabled, the port number is 5988. If SSL is disabled, the port number is 5989. This field is available only when you select Disable from the Use Template list.
¡ Polling Interval (min)—Select a polling interval for the application monitor. Options are 1, 2, 3, 4, 5, 10, 20, and 30. The default polling interval is 5 minutes. A shorter polling interval improves real-time data accuracy at the expense of system resources. This field is available only when you select Disable from the Use Template list.
¡ Username/Password—Enter the username and password of the SMI-S provider. These fields are available only when you select Disable from the Use Template list.
¡ SSL—Select Enable or Disable from the list according the SSL setting on the SMI-S provider.
¡ Namespace—Enter the namespace for the SMI-S provider. The default value is /root/huawei. This field is available only when you select Disable from the Use Template list.
¡ Contact—Enter the contact information, such as the name, email address, and telephone number. The default is the username of the operator who created the application monitor. This field is available only when you select Disable from the Use Template list.
¡ APM Server—Select an APM server to monitor the application. The options are in server-address (application-type:n/N) format. The letter n indicates the number of 18500 V3 applications monitored on the APM server. The letter N indicates the total number of applications monitored on the APM server. Server address 127.0.0.1 indicates that APM and the IMC platform are deployed on the same server.
¡ Related Applications—Click Add next to this field. On the Select Application window, enter a partial or complete name to filter applications, select the applications that the 18500 V3 storage device depends on, and then click OK.
Operating system applications cannot be selected. Operators can view all dependencies of the application in the dependency topology.
¡ Application Group—Specify an application group for the 18500 V3 application.
- To specify an existing application group, click Add, select an application group, and then click OK.
- To specify a new application group, click Add Application Group, configure the application group settings, and then click OK.
¡ Detect Application—Select this parameter if you want to enable application detection. APM verifies the application connectivity by using the previous parameter settings, and adds the application monitor only when it can connect to the application. If you do not select this parameter, APM adds the application monitor without verifying the application connectivity.
5. Click OK.
Modifying an 18500 V3 application monitor
Authorized users can modify all parameters except the IP address and the APM server for an 18500 V3 storage device. When the IP address of a monitored 18500 V3 storage device changes, operators must add a new application monitor for the 18500 V3 storage device. The new application monitor cannot inherit the history data from the previous application monitor.
To modify an 18500 V3 application monitor:
1. Click the Resource tab.
2. From the navigation tree, select Application Manager > Application Monitor.
The application monitor list page displays all application monitors.
3. Click the Modify
icon ![]() for the 18500 V3 application monitor you want to modify.
for the 18500 V3 application monitor you want to modify.
The page for modifying the 18500 V3 application monitor opens.
4. Modify the parameters as needed, except the IP address and the APM server.
For more information about parameter settings, see "Adding an HW OceanStor 18500 V3 application monitor."
5. Click OK.
Viewing the 18500 V3 application monitor report
After an 18500 V3 application monitor is added, APM collects index data of the application, evaluates the availability and health status, and updates the monitor report. The report shows the index values obtained from the most recent polling of the application.
To view the 18500 V3 application monitor report:
1. Click the Resource tab.
2. From the navigation tree, select Application Manager > Application Monitor.
The application monitor list page displays all application monitors.
3. Click the name of an 18500 V3 application monitor to display the report.
Figure 141 shows part of an 18500 V3 application monitor report.
Figure 141 Part of an 18500 V3 application monitor report
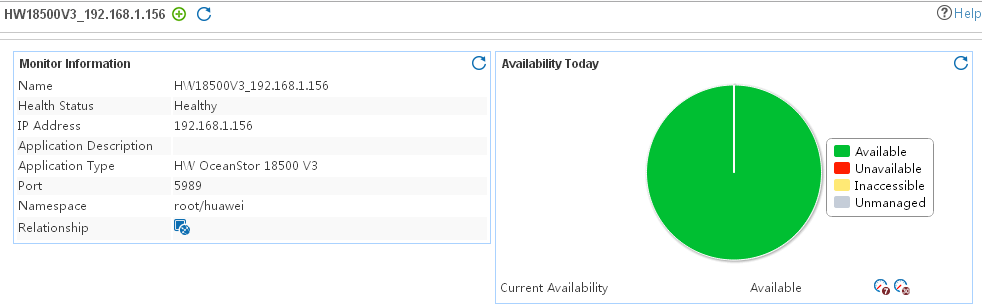
Monitor Information
The Monitor Information area contains the following fields:
· Name—Application monitor name.
· Health Status—Current health status of the 18500 V3 storage device.
· IP Address—IP address of the SMI-S provider.
· Application Description—Description of the 18500 V3 application.
· Application Type—Type of the monitored application, which is always HW OceanStor 18500 V3.
· Port—Listening port number of the SMI-S provider.
· Namespace—Namespace of the SMI-S provider.
· Last Polling Time—Time when APM last polled the SMI-S provider.
· Relationship—Click the Relationship icon ![]() to view
dependencies between the 18500 V3 storage device and other applications in a
dependency topology view. For more information about
dependency topologies, see "Topology and application group management."
to view
dependencies between the 18500 V3 storage device and other applications in a
dependency topology view. For more information about
dependency topologies, see "Topology and application group management."
· Top5 Unrecovered Alarm—Latest five unrecovered alarms on the 18500 V3 storage device. This field is not displayed if no alarm is generated by the 18500 V3 storage device.
Availability Today
The Availability Today area contains the following fields:
· Current Availability—Availability of the 18500 V3 storage device.
¡ Click the Weekly History icon![]() to view the availability of the 18500 V3 storage device in
the last 7 days.
to view the availability of the 18500 V3 storage device in
the last 7 days.
¡ Click
the Monthly History icon![]() to view
the availability of the 18500 V3 storage device in
the last 30 days.
to view
the availability of the 18500 V3 storage device in
the last 30 days.
· Available Time—Total amount of time that the 18500 V3 storage device was available after 00:00 today.
· Unavailable Time—Total amount of time that the 18500 V3 storage device was unavailable after 00:00 today.
· Inaccessible Time—Total amount of time that the 18500 V3 storage device was inaccessible after 00:00 today.
· Unmanaged Time—Total amount of time that the 18500 V3 storage device was unmanaged after 00:00 today.
The statistics collection started when the application monitor was added. An availability time field is not displayed when its value is 0.
Basic Information
The Basic Information area contains the following fields:
· ID—ID of the 18500 V3 storage device.
· Name—Name of the 18500 V3 storage device.
· Vendor—Vendor of the 18500 V3 storage device.
· Version—Version of the 18500 V3 management controller codes.
· Serial Number—Serial number of the 18500 V3 storage device.
Controller Information
The Controller Information area contains the following fields:
· ID—ID of the 18500 V3 storage device.
· Name—Name of the storage controller.
· Health Status—Health status of the storage controller. Options are:
¡ Unknown—The health status of the storage controller is unknown.
¡ OK—The storage controller is working correctly.
¡ Degraded—The storage controller is working correctly, but the health status is not optimal or recoverable errors exist.
¡ Minor failure—All functions of the storage controller are available. However, some of the functions are degraded.
¡ Major failure—The storage controller is becoming invalid. Some or all functions are degraded or becoming unavailable.
¡ Critical failure—The storage controller cannot work correctly and might be unrecoverable.
¡ Non-recoverable error—The storage controller is invalid and cannot be recovered. All functions are unavailable.
· Operational Status—Operating status of the storage controller.
· Controller ID—ID of the storage controller.
Storage Pool/Virtual Disk
The Storage Pool/Virtual Disk area contains the following fields:
· ID—ID of the storage pool/virtual disk.
· Name—Name of the storage pool/virtual disk.
· Health Status—Health status of the storage pool/virtual disk. Options are:
¡ Unknown—The health status of the storage pool/virtual disk is unknown.
¡ OK—The storage pool/virtual disk is working correctly.
¡ Degraded—The storage pool/virtual disk is working correctly, but the health status is not optimal or recoverable errors exist.
¡ Minor failure—All functions of the storage pool/virtual disk are available. However, some of the functions are degraded.
¡ Major failure—The storage pool/virtual disk is becoming invalid. Some or all functions are degraded or becoming unavailable.
¡ Critical failure—The storage pool/virtual disk cannot work correctly and might be unrecoverable.
¡ Non-recoverable error—The storage pool/virtual disk is invalid and cannot be recovered. All functions are unavailable.
· Operational Status—Operating status of the storage pool/virtual disk.
· Primordial—Whether the storage pool/virtual disk is the original storage pool/virtual disk.
· Total Space Limit—Space size limit of the storage pool/virtual disk.
· Total Space—Total space size of the storage pool/virtual disk. The total space size equals the free space size plus the used space size.
· Free Space—Available space size of the storage pool/virtual disk.
· Used Space—Used space size of the storage pool/virtual disk.
· Usage—Ratio of the used space size to the total space size of the storage pool/virtual disk.
Disk Information
The Disk Information area contains the following fields:
· ID—ID of the disk.
· Name—Name of the disk.
· Operational Status—Operating status of the disk.
· Primordial—Whether the disk is the original disk.
· Disk Capacity—Total space size of the disk.
· Disk Consumable Space—Assigned available space size of the disk.
Storage Volume Information
The Storage Volume Information area contains the following fields:
· ID—ID of the storage volume.
· Name—Name of the storage volume.
· Operational Status—Operating status of the storage volume.
· Primordial—Whether the storage volume is the original storage volume.
· Capacity—Total space size of the storage volume.
· Consumable Space—Assigned available space size of the storage volume.
· Delta Reservation—Delta space reserved for the buffer by the storage volume when a replication operation is performed.
· Is Based On Underlying Redundancy—Whether the storage volume is based on underlying redundancy.
· No Single Point Of Failure—Whether the storage volume is not a single point of failure.
· Data Redundancy—Data redundancies of the storage volume.
· Package Redundancy—Package redundancies of the storage volume.
Interface Information
The Interface Information area contains the following fields:
· ID—ID of the interface.
· Name—Name of the interface.
· Permanent Address—Permanent address of the interface.
· Interface Type—Type of the interface.
· Current Rate—Current rate of the interface.
· Max. Rate—Maximum rate of the interface.
· Link Technology—Link technology of the interface.
· Max. Transmission Unit—Maximum transmission unit of the interface.
Ethernet Port Information
The Ethernet Port Information area contains the following fields:
· ID—ID of the Ethernet interface.
· Name—Name of the Ethernet interface.
· Operational Status—Operating status of the Ethernet interface.
· Permanent Address—Permanent address of the Ethernet interface.
· Network Address—MAC address of the Ethernet interface.
· Max. Transmission Unit—Maximum transmission unit of the Ethernet interface.
· Current Rate—Current rate of the Ethernet interface.
· Requested Speed—Requested speed of the Ethernet interface.
Chassis Information
The Chassis Information area contains the following fields:
· ID—ID of the chassis.
· Name—Name of the chassis.
· Health Status—Health status of the chassis. Options are:
¡ Unknown—The health status of the chassis is unknown.
¡ OK—The chassis is working correctly.
¡ Degraded—The chassis is working correctly, but the health status is not optimal or recoverable errors exist.
¡ Minor failure—All functions of the chassis are available. However, some of the functions are degraded.
¡ Major failure—The chassis is becoming invalid. Some or all functions are degraded or becoming unavailable.
¡ Critical failure—The chassis cannot work correctly and might be unrecoverable.
¡ Non-recoverable error—The chassis is invalid and cannot be recovered. All functions are unavailable.
· Operational Status—Operating status of the chassis.
· Manufacturer—Manufacturer of the chassis.
· Model—Model of the chassis.
· Serial Number—Serial number of the chassis.
Performance
The Performance area contains the following fields:
· Instance ID—ID of the performance instance.
· Name—Name of the performance index.
· Type—Type of the performance index.
· IO Rate—I/O rate of the disk array.
· IO Read Rate—I/O read rate of the disk array.
· IO Write Rate—I/O write rate of the disk array.
· Data Read Rate—Data read rate of the disk array.
· Data Write Rate—Data write rate of the disk array.
· Data Transfer Rate—Data transfer rate of the disk array.
HW OceanStor S3900 application monitor
HW OceanStor S3900 series are M2000 data storage devices produced by Huawei.
Adding an HW OceanStor S3900 application monitor
APM monitors HW OceanStor S3900 storage devices through built-in SMI-S interfaces. When you add an HW OceanStor S3900 application monitor, follow these guidelines:
· Add the HW OceanStor S3900 storage device to be monitored to the IMC platform.
For a storage device managed in the IMC platform, APM obtains and displays network connection information of the storage device and its access devices in the application topology. For more information about adding storage devices to the IMC platform, see H3C Intelligent Management Center v7.3 Enterprise and Standard Platform Administrator Guide.
· Contact the storage device administrator to obtain the username and password of a user with the administrator privileges and the access rights to HTTPS and SMI-S. The username and password are required for adding the application monitor.
To add an HW OceanStor S3900 application monitor:
1. Click the Resource tab.
2. Open the Add Application page by using one of the following methods:
¡ From the navigation tree, select Application Manager > Add Application.
¡ From the navigation tree, select Application Manager > Application Monitor. In the application monitor list, click Add.
The Add Application page displays all application types that can be monitored by APM.
3. Click HW OceanStor S3900 of the Storage Device Monitor class.
The page for adding an HW OceanStor S3900 application monitor opens.
4. Configure the following parameters:
¡ IP Address—Enter the IP address of the host on which the HW OceanStor S3900 storage device to be monitored is installed. APM automatically checks the IP address and associates the application monitor with the storage device if it is already managed in the IMC platform. If the host is already added to the IMC platform, you can also click Select, and then select the storage device in the Select Devices dialog box. For information about selecting a storage device, see "Quick start."
¡ Name—Enter a unique application monitor name. As a best practice, name the application monitor as application type_host IP address.
¡ Use Template—Select Enable or Disable from the list.
¡ Template—Click
the Configure icon ![]() next to the Template field to select an existing template. The Template field
is automatically populated with the name of the selected template. For more
information about configuring application templates, see "Configuration management." This field is displayed only when you select Enable from the Use
Template list.
next to the Template field to select an existing template. The Template field
is automatically populated with the name of the selected template. For more
information about configuring application templates, see "Configuration management." This field is displayed only when you select Enable from the Use
Template list.
¡ Description—Enter a description for the application monitor.
¡ Application Monitor Port—Port used to monitor the application. The default value is 5989. This field is available only when you select Disable from the Use Template list.
¡ Polling Interval (min)—Select a polling interval for the application monitor. Options are 1, 2, 3, 4, 5, 10, 20, and 30. The default polling interval is 5 minutes. A shorter polling interval improves real-time data accuracy at the expense of system resources. This field is available only when you select Disable from the Use Template list.
¡ Username/Password—Enter the username and password of the user who has the administrator privileges on the storage device. The fields are available only when you select Disable from the Use Template list.
¡ SSL—Select Enable or Disable from the list. If you select Enable, APM accesses the storage device through HTTPS. If you select Disable, APM accesses the storage device through HTTP. This field is available only when you select Disable from the Use Template list.
¡ Namespace—Enter the namespace for the SMI-S interface of the storage device. The default value is /root/huaweisymantec. This field is available only when you select Disable from the Use Template list.
¡ Contact—Enter the contact information, such as the name, email address, and telephone number. The default is the username of the operator who created the application monitor. This field is available only when you select Disable from the Use Template list.
¡ APM Server—Select an APM server to monitor the application. The options are in server-address (application-type:n/N) format. The letter n indicates the number of HW OceanStor S3900 applications monitored on the APM server. The letter N indicates the total number of applications monitored on the APM server. Server address 127.0.0.1 indicates that APM and the IMC platform are deployed on the same server.
¡ Related Applications—Click Add next to this field. On the Select Application window, enter a partial or complete name to filter applications, select the applications that the storage device depends on, and then click OK.
Operating system applications cannot be selected. Operators can view all dependencies of the application in the dependency topology.
¡ Application Group—Specify an application group for the HW OceanStor S3900 application.
- To specify an existing application group, click Add, select an application group, and then click OK.
- To specify a new application group, click Add Application Group, configure the application group settings, and then click OK.
¡ Detect Application—Select this parameter if you want to enable application detection. APM verifies the application connectivity by using the previous parameter settings, and adds the application monitor only when it can connect to the application. If you do not select this parameter, APM adds the application monitor without verifying the application connectivity.
5. Click OK.
Modifying an HW OceanStor S3900 application monitor
Authorized users can modify all parameters except the IP address and the APM server for an HW OceanStor S3900 storage device. When the IP address of a monitored HW OceanStor S3900 storage device changes, operators must add a new application monitor for the device. The new application monitor cannot inherit the history data from the previous application monitor.
To modify an HW OceanStor S3900 application monitor:
1. Click the Resource tab.
2. From the navigation tree, select Application Manager > Application Monitor.
The application monitor list page displays all application monitors.
3. Click the Modify
icon ![]() for the HW OceanStor S3900 application monitor you want to modify.
for the HW OceanStor S3900 application monitor you want to modify.
The page for modifying the HW OceanStor S3900 application monitor opens.
4. Modify the parameters as needed, except the IP address and the APM server.
For more information about parameter settings, see "Adding an HW OceanStor S3900 application monitor."
5. Click OK.
Viewing the HW OceanStor S3900 application monitor report
After an HW OceanStor S3900 application monitor is added, APM collects index data of the application, evaluates the availability and health status, and updates the monitor report. The report shows the index values obtained from the most recent polling of the application.
To view the HW OceanStor S3900 application monitor report:
1. Click the Resource tab.
2. From the navigation tree, select Application Manager > Application Monitor.
The application monitor list page displays all application monitors.
3. Click the name of an HW OceanStor S3900 application monitor to display the report.
Figure 142 shows part of an HW OceanStor S3900 application monitor report.
Figure 142 Part of an HW OceanStor S3900 application monitor report
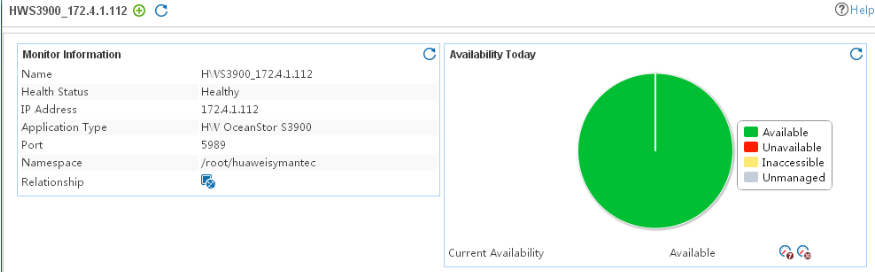
Monitor Information
The Monitor Information area contains the following fields:
· Name—Name of the application monitor.
· Health Status—Health status of the storage device.
· IP Address—IP address of the storage device.
· Application Type—Type of the monitored application, which is always HW OceanStor S3900.
· Port—Port used for monitoring the HW OceanStor S3900 storage device.
· Namespace—Namespace of the SMI-S interface of the HW OceanStor S3900 storage device.
· Last Polling Time—Time when APM last polled the HW OceanStor S3900 storage device.
· Relationship—Click the Relationship icon ![]() to view
dependencies between the HW OceanStor S3900 storage device and other
applications in a dependency topology view. For more information
about dependency topologies, see "Topology and application group management."
to view
dependencies between the HW OceanStor S3900 storage device and other
applications in a dependency topology view. For more information
about dependency topologies, see "Topology and application group management."
· Top5 Unrecovered Alarm—Latest five unrecovered alarms on the storage device. This field is not displayed if no alarm is generated by the HW OceanStor S3900 storage device.
Availability Today
The Availability Today area contains the following fields:
· Current Availability—Availability of the HW OceanStor S3900 application.
¡ Click the Weekly History icon![]() to view the availability of the HW OceanStor
S3900 application in the last 7 days.
to view the availability of the HW OceanStor
S3900 application in the last 7 days.
¡ Click
the Monthly History icon![]() to view
the availability of the HW OceanStor S3900 application in the last 30 days.
to view
the availability of the HW OceanStor S3900 application in the last 30 days.
· Available Time—Total amount of time that the HW OceanStor S3900 application was available after 00:00 today.
· Unavailable Time—Total amount of time that the HW OceanStor S3900 application was unavailable after 00:00 today.
· Inaccessible Time—Total amount of time that the HW OceanStor S3900 application was inaccessible after 00:00 today.
· Unmanaged Time—Total amount of time that the HW OceanStor S3900 application was unmanaged after 00:00 today.
The statistics collection started when the application monitor was added. An availability time field is not displayed when its value is 0.
Basic Information
The Basic Information area contains the following fields:
· Model—Model of the storage device.
· Vendor—Vendor of the device.
· Version—Version of the controller code for the device.
· Array Name—Array name of the device.
· Array SN—Array sequence number of the device.
· Array Health Status—Array health status of the device. Options are:
¡ Unknown—The health status of the array is unknown.
¡ OK—The array is working correctly.
¡ Degraded—The array is working correctly, but the health status is not optimal or recoverable errors exist.
¡ Minor failure—All functions of the array are available. However, some of the functions are degraded.
¡ Major failure—The array is becoming invalid. Some or all functions are degraded or becoming unavailable.
¡ Critical failure—The array cannot work correctly and might be unrecoverable.
¡ Non-recoverable error—The array is invalid and cannot be recovered. All functions are unavailable.
· Disk Array Running Status—Operating status of the array.
Disk Information
The Disk Information area contains the following fields:
· Disk Name—Name of the virtual disk.
· Disk Operational Status—Operating status of the virtual disk. Options are:
¡ Unknown—The health status of the virtual disk is unknown.
¡ OK—The virtual disk is working correctly.
¡ Degraded—The virtual disk is working correctly, but the health status is not optimal or recoverable errors exist.
¡ Minor failure—All functions of the virtual disk are available. However, some of the functions are degraded.
¡ Major failure—The virtual disk is becoming invalid. Some or all functions are degraded or becoming unavailable.
¡ Critical failure—The virtual disk cannot work correctly and might be unrecoverable.
¡ Non-recoverable error—The virtual disk is invalid and cannot be recovered. All functions are unavailable.
· Disk Size—Size of the virtual disk.
· Disk Consumable Size—Assigned available space size of the virtual disk.
· Block Size—Block size of the virtual disk.
Power Supply Information
The Power Supply Information area contains the following fields:
· Power Name—Name of the power supply.
· Power Health Status—Health status of the power supply. Options are:
¡ Unknown—The health status of the power supply is unknown.
¡ OK—The power supply is working correctly.
¡ Degraded—The power supply is working correctly, but the health status is not optimal or recoverable errors exist.
¡ Minor failure—All functions of the power supply are available. However, some of the functions are degraded.
¡ Major failure—The power supply is becoming invalid. Some or all functions are degraded or becoming unavailable.
¡ Critical failure—The power supply cannot work correctly and might be unrecoverable.
¡ Non-recoverable error—The power supply is invalid and cannot be recovered. All functions are unavailable.
· Power Operational Status—Operating status of the power supply.
· Total Output Power—Output power of the power supply.
Fan Information
The Fan Information area contains the following fields:
· Fan Name—Name of the fan.
· Fan Health Status—Health status of the fan. Click the Set Threshold icon ![]() to set alarm thresholds for the health
status of the fan. Options are:
to set alarm thresholds for the health
status of the fan. Options are:
¡ Unknown—The health status of the fan is unknown.
¡ OK—The fan is working correctly.
¡ Degraded—The fan is working correctly, but the health status is not optimal or recoverable errors exist.
¡ Minor failure—All functions of the fan are available. However, some of the functions are degraded.
¡ Major failure—The fan is becoming invalid. Some or all functions are degraded or becoming unavailable.
¡ Critical failure—The fan cannot work correctly and might be unrecoverable.
¡ Non-recoverable error—The fan is invalid and cannot be recovered. All functions are unavailable.
· Fan Operational Status—Operating status of the fan.
Storage Pool Information
The Storage Pool Information area contains the following fields:
· Pool ID—ID of the storage pool.
· Pool Name—Name of the storage pool.
· Primordial—Whether the storage pool is initialized.
· Pool Health Status—Health status of the storage pool. Options are:
¡ Unknown—The health status of the storage pool is unknown.
¡ OK—The storage pool is working correctly.
¡ Degraded—The storage pool is working correctly, but the health status is not optimal or recoverable errors exist.
¡ Minor failure—All functions of the storage pool are available. However, some of the functions are degraded.
¡ Major failure—The storage pool is becoming invalid. Some or all functions are degraded or becoming unavailable.
¡ Critical failure—The storage pool cannot work correctly and might be unrecoverable.
¡ Non-recoverable error—The storage pool is invalid and cannot be recovered. All functions are unavailable.
· Pool Operational Status—Operating status of the storage pool.
· Total Managed Space—Total space size of the storage pool.
· Remain Managed Space—Available space size of the storage pool.
· Used Space—Used space size of the storage pool.
· Usage Ratio—Usage ratio of the storage pool.
Storage Volume Information
The Storage Volume Information area contains the following fields:
· Volume ID—ID of the storage volume.
· WWN—World Wide Name of the storage volume.
· Volume Operational Status—Operating status of the storage volume.
· Volume Size—Space size of the storage volume.
· Volume Consumable Size—Assigned available space size of the storage volume.
· Block Size—Block space size of the storage volume.
· Data Redundancy—Data redundancies of the storage volume.
Controller Information
The Controller Information area contains the following fields:
· Controller Name—Name of the storage controller.
· Controller Health Status—Health status of the storage controller. Options are:
¡ Unknown—The health status of the storage controller is unknown.
¡ OK—The storage controller is working correctly.
¡ Degraded—The storage controller is working correctly, but the health status is not optimal or recoverable errors exist.
¡ Minor failure—All functions of the storage pool are available. However, some of the functions are degraded.
¡ Major failure—The storage controller is becoming invalid. Some or all functions are degraded and even become unavailable.
¡ Critical failure—The storage controller cannot work correctly and might be unrecoverable.
¡ Non-recoverable error—The storage controller is invalid and cannot be recovered. All functions are unavailable.
· Controller Operational Status—Operating status of the storage controller.
· Is Master—Whether the storage controller is a master controller.
· IP Address—IP address of the storage controller.
FC Port Information
The FC Port Information area contains the following fields:
· FC Port Name—Name of the FC interface.
· FC Port Operational Status—Operating status of the FC interface.
· FC Port Type—Link technology of the FC interface.
· FC Port Number—FC interface number.
Chassis Information
The Chassis Information area contains the following fields:
· Chassis Name—Name of the chassis.
· Chassis SN—Sequence number of the chassis.
· Chassis Model—Model of the chassis.
· Chassis Health Status—Health status of the chassis. Options are:
¡ Unknown—The health status of the chassis is unknown.
¡ OK—The chassis is working correctly.
¡ Degraded—The chassis is working correctly, but the health status is not optimal or recoverable errors exist.
¡ Minor failure—All functions of the chassis are available. However, some of the functions are degraded.
¡ Major failure—The chassis is becoming invalid. Some or all functions are degraded or becoming unavailable.
¡ Critical failure—The chassis cannot work correctly and might be unrecoverable.
¡ Non-recoverable error—The chassis is invalid and cannot be recovered. All functions are unavailable.
· Chassis Operational Status—Operating status of the chassis.
· Chassis Type—Type of the chassis.
· Chassis Manufacturer—Manufacturer of the chassis.
IBM Storwize V5000 application monitor
IBM Storwize V5000 is a storage device developed by IBM.
Adding an IBM Storwize V5000 application monitor
APM monitors IBM Storwize V5000 storage devices through built-in SMI-S interfaces. When you add an IBM Storwize V5000 application monitor, follow these guidelines:
· Add the IBM Storwize V5000 storage device to be monitored to the IMC platform.
For a storage device managed in the IMC platform, APM obtains and displays network connection information of the storage device and its access devices in the application topology. For more information about adding storage devices to the IMC platform, see H3C Intelligent Management Center v7.3 Enterprise and Standard Platform Administrator Guide.
· Contact the storage device administrator to obtain the username and password of a user with the administrator privileges and the access rights to SMI-S. The username and password are required for adding the application monitor.
To add an IBM Storwize V5000 application monitor:
1. Click the Resource tab.
2. Open the Add Application page by using one of the following methods:
¡ From the navigation tree, select Application Manager > Add Application.
¡ From the navigation tree, select Application Manager > Application Monitor. In the application monitor list, click Add.
The Add Application page displays all application types that can be monitored by APM.
3. Click IBM Storwize V5000 of the Storage Device Monitor class.
The page for adding an IBM Storwize V5000 application monitor opens.
4. Configure the following parameters:
¡ IP Address—Enter the IP address of the host where the IBM Storwize V5000 storage device to be monitored is installed. APM automatically checks the IP address and associates the application monitor with the storage device if it is already managed in the IMC platform. If the host is already added to the IMC platform, you can also click Select, and then select the storage device in the Select Devices dialog box. For information about selecting a storage device, see "Quick start."
¡ Name—Enter a unique application monitor name. As a best practice, name the application monitor as application type_host IP address.
¡ Use Template—Select Enable or Disable from the list.
¡ Template—Click
the Configure icon ![]() next to the Template field to select an existing template. The Template field
is automatically populated with the name of the selected template. For more
information about configuring application templates, see "Configuration management." This field is displayed only when you select Enable from the Use
Template list.
next to the Template field to select an existing template. The Template field
is automatically populated with the name of the selected template. For more
information about configuring application templates, see "Configuration management." This field is displayed only when you select Enable from the Use
Template list.
¡ Description—Enter a description for the application monitor.
¡ Polling Interval (min)—Select a polling interval for the application monitor. Options are 1, 2, 3, 4, 5, 10, 20, and 30. The default polling interval is 5 minutes. A shorter polling interval improves real-time data accuracy at the expense of system resources. This field is available only when you select Disable from the Use Template list.
¡ Username/Password—Enter the username and password of the user who has the administrator privileges on the storage device. The fields are available only when you select Disable from the Use Template list.
¡ Namespace—Enter the namespace for the SMI-S interface of the storage device. The default value is /root/ibm. This field is available only when you select Disable from the Use Template list.
¡ Contact—Enter the contact information, such as the name, email address, and telephone number. The default is the username of the operator who created the application monitor. This field is available only when you select Disable from the Use Template list.
¡ APM Server—Select an APM server to monitor the application. The options are in server-address (application-type:n/N) format. The letter n indicates the number of IBM Storwize V5000 applications monitored on the APM server. The letter N indicates the total number of applications monitored on the APM server. Server address 127.0.0.1 indicates that APM and the IMC platform are deployed on the same server.
¡ Related Applications—Click Add next to this field. On the Select Application window, enter a partial or complete name to filter applications, select the applications that the storage device depends on, and then click OK.
Operating system applications cannot be selected. Operators can view all dependencies of the application in the dependency topology.
¡ Application Group—Specify an application group for the IBM Storwize V5000 application.
- To specify an existing application group, click Add, select an application group, and then click OK.
- To specify a new application group, click Add Application Group, configure the application group settings, and then click OK.
¡ Detect Application—Select this parameter if you want to enable application detection. APM verifies the application connectivity by using the previous parameter settings, and adds the application monitor only when it can connect to the application. If you do not select this parameter, APM adds the application monitor without verifying the application connectivity.
5. Click OK.
Modifying an IBM Storwize V5000 application monitor
Authorized users can modify all parameters except the IP address and the APM server for an IBM Storwize V5000 storage device. When the IP address of a monitored IBM Storwize V5000 storage device changes, operators must add a new application monitor for the device. The new application monitor cannot inherit the history data from the previous application monitor.
To modify an IBM Storwize V5000 application monitor:
1. Click the Resource tab.
2. From the navigation tree, select Application Manager > Application Monitor.
The application monitor list page displays all application monitors.
3. Click the Modify
icon ![]() for the IBM Storwize V5000 application monitor you want to modify.
for the IBM Storwize V5000 application monitor you want to modify.
The page for modifying the IBM Storwize V5000 application monitor opens.
4. Modify the parameters as needed, except the IP address and the APM server.
For more information about parameter settings, see "Adding an IBM Storwize V5000 application monitor."
5. Click OK.
Viewing the IBM Storwize V5000 application monitor report
After an IBM Storwize V5000 application monitor is added, APM collects index data of the application, evaluates the availability and health status, and updates the monitor report. The report shows the index values obtained from the most recent polling of the application.
To view the IBM Storwize V5000 application monitor report:
1. Click the Resource tab.
2. From the navigation tree, select Application Manager > Application Monitor.
The application monitor list page displays all application monitors.
3. Click the name of an IBM Storwize V5000 application monitor to display the report.
Figure 143 shows part of an IBM Storwize V5000 application monitor report.
Figure 143 Part of an IBM Storwize V5000 application monitor report
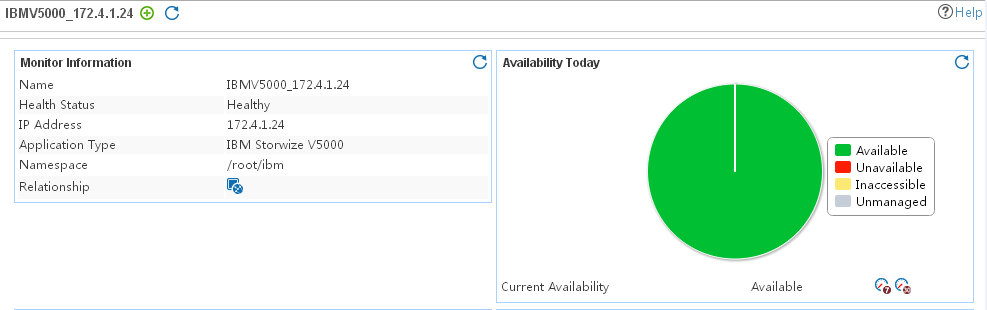
Monitor Information
The Monitor Information area contains the following fields:
· Name—Name of the application monitor.
· Health Status—Health status of the storage device.
· IP Address—IP address of the storage device.
· Application Type—Type of the monitored application, which is always IBM Storwize V5000.
· Namespace—Namespace of the SMI-S interface for the IBM Storwize V5000 storage device.
· Last Polling Time—Time when APM last polled the IBM Storwize V5000 storage device.
· Relationship—Click the Relationship icon ![]() to view
dependencies between the IBM Storwize V5000 storage device and other
applications in a dependency topology view. For more information
about dependency topologies, see "Topology and application group management."
to view
dependencies between the IBM Storwize V5000 storage device and other
applications in a dependency topology view. For more information
about dependency topologies, see "Topology and application group management."
· Top5 Unrecovered Alarm—Latest five unrecovered alarms on the storage device. This field is not displayed if no alarm is generated by the IBM Storwize V5000 storage device.
Availability Today
The Availability Today area contains the following fields:
· Current Availability—Availability of the IBM Storwize V5000 application.
¡ Click the Weekly History icon![]() to view the availability of the IBM Storwize
V5000 application in the last 7 days.
to view the availability of the IBM Storwize
V5000 application in the last 7 days.
¡ Click
the Monthly History icon![]() to view
the availability of the IBM Storwize V5000 application in the last 30 days.
to view
the availability of the IBM Storwize V5000 application in the last 30 days.
· Available Time—Total amount of time that the IBM Storwize V5000 application was available after 00:00 today.
· Unavailable Time—Total amount of time that the IBM Storwize V5000 application was unavailable after 00:00 today.
· Inaccessible Time—Total amount of time that the IBM Storwize V5000 application was inaccessible after 00:00 today.
· Unmanaged Time—Total amount of time that the IBM Storwize V5000 application was unmanaged after 00:00 today.
The statistics collection started when the application monitor was added. An availability time field is not displayed when its value is 0.
Basic information
The Basic Information area contains the following fields:
· Model—Model of the storage device.
· Vendor—Vendor of the storage device.
· Version—Version of the controller code for the storage device.
· Name—Name of the storage device.
· Status—Status of the storage device.
· Array Name—Array name for the storage device.
· RAID Level—RAID level of the storage device.
· Allocated Capacity—Allocated capacity of the storage device.
· Available Capacity—Available capacity of the storage device.
· Backend Capacity—Backend capacity of the storage device.
· Pool Capacity—Pool capacity of the storage device.
· Total Used Capacity—Total used capacity of the storage device.
· Total VDisk Capacity—Total virtual disk capacity of the storage device.
Disk Information
The Disk Information area contains the following fields:
· Disk ID—ID of the virtual disk.
· Disk Name—Name of the virtual disk.
· Health Status—Health status of the virtual disk. Options are:
¡ Unknown—The health status of the virtual disk is unknown.
¡ OK—The virtual disk is working correctly.
¡ Degraded—The virtual disk is working correctly, but the health status is not optimal or recoverable errors exist.
¡ Minor failure—All functions of the virtual disk are available. However, some of the functions are degraded.
¡ Major failure—The virtual disk is becoming invalid. Some or all functions are degraded or becoming unavailable.
¡ Critical failure—The virtual disk cannot work correctly and might be unrecoverable.
¡ Non-recoverable error—The virtual disk is invalid and cannot be recovered. All functions are unavailable.
· Disk Size—Size of the virtual disk.
· Disk Consumable Size—Assigned available space size of the virtual disk.
· Block Size—Block size of the virtual disk.
Storage Pool Information
The Storage Pool Information area contains the following fields:
· Pool ID—ID of the storage pool.
· Pool Name—Name of the storage pool.
· Pool Caption—Caption of the storage pool.
· Pool Status—Health status of the storage pool. Options are:
¡ Unknown—The health status of the storage pool is unknown.
¡ OK—The storage pool is working correctly.
¡ Degraded—The storage pool is working correctly, but the health status is not optimal or recoverable errors exist.
¡ Minor failure—All functions of the storage pool are available. However, some of the functions are degraded.
¡ Major failure—The storage pool is becoming invalid. Some or all functions are degraded or becoming unavailable.
¡ Critical failure—The storage pool cannot work correctly and might be unrecoverable.
¡ Non-recoverable error—The storage pool is invalid and cannot be recovered. All functions are unavailable.
· Backend Volume Num.—Number of backend volumes in the storage pool.
· Storage Volume Num.—Number of storage volumes in the storage pool.
· Total Managed Space—Total managed space of the storage pool.
· Remain Managed Space—Remaining managed space of the storage pool.
· Used Capacity—Used capacity of the storage pool.
· Usage Ratio—Usage of the storage pool.
Storage Volume Information
The Storage Volume Information area contains the following fields:
· Volume ID—ID of the storage volume.
· Volume Caption—Caption of the storage volume.
· Volume Status—Health status of the storage volume. Options are:
¡ Unknown—The health status of the storage volume is unknown.
¡ OK—The storage volume is working correctly.
¡ Degraded—The storage volume is working correctly, but the health status is not optimal or recoverable errors exist.
¡ Minor failure—All functions of the storage volume are available. However, some of the functions are degraded.
¡ Major failure—The storage volume is becoming invalid. Some or all functions are degraded or becoming unavailable.
¡ Critical failure—The storage volume cannot work correctly and might be unrecoverable.
¡ Non-recoverable error—The storage volume is invalid and cannot be recovered. All functions are unavailable.
· Volume Size—Size of the storage volume.
· Volume Consumable Size—Assigned available space size of the storage volume.
· Block Size—Block size of the storage volume.
· Group ID—ID of the group to which the storage volume belongs.
· Group Name—Name of the group to which the storage volume belongs.
· Pool ID—ID of the storage pool to which the storage volume belongs.
· Pool Name—Name of the storage pool to which the storage volume belongs.
FC Port Information
The FC Port Information area contains the following fields:
· Device ID—Device ID of the FC interface.
· FC Port Status—Status of the FC interface.
· FC Port ID—ID of the FC interface.
· FC Port Node Name—Name of the node where the FC interface is located.
· FC Port Type—Link technology of the FC interface.
· FC Port Bandwidth—Bandwidth of the FC interface.
· Max. Bandwidth—Maximum bandwidth of the FC interface.
· FC Port Number—FC interface number.
· FC Port MTU—Maximum transmission unit of the FC interface.
Ethernet Port Information
The Ethernet Port Information area contains the following fields:
· Device ID—Device ID of the Ethernet interface.
· Ethernet Port Status—Status of the Ethernet interface.
· Ethernet Port Bandwidth—Bandwidth of the Ethernet interface.
· Ethernet Port Number—Ethernet interface number.
· Ethernet Port MTU—Maximum transmission unit of the Ethernet interface.
· Ethernet Port Active MTU—Active maximum transmission unit of the Ethernet interface.
IBM Storwize V7000 application monitor
IBM Storwize V7000 is a storage device developed by IBM.
Adding an IBM Storwize V7000 application monitor
APM monitors IBM Storwize V7000 storage devices through built-in SMI-S interfaces. When you add an IBM Storwize V7000 application monitor, follow these guidelines:
· Add the IBM Storwize V7000 storage device to be monitored to the IMC platform.
For a storage device managed in the IMC platform, APM obtains and displays network connection information of the storage device and its access devices in the application topology. For more information about adding storage devices to the IMC platform, see H3C Intelligent Management Center v7.3 Enterprise and Standard Platform Administrator Guide.
· Contact the storage device administrator to obtain the username and password of a user with the administrator privileges and the access rights to SMI-S. The username and password are required for adding the application monitor.
To add an IBM Storwize V7000 application monitor:
1. Click the Resource tab.
2. Open the Add Application page by using one of the following methods:
¡ From the navigation tree, select Application Manager > Add Application.
¡ From the navigation tree, select Application Manager > Application Monitor. In the application monitor list, click Add.
The Add Application page displays all application types that can be monitored by APM.
3. Click IBM Storwize V7000 of the Storage Device Monitor class.
The page for adding an IBM Storwize V7000 application monitor opens.
4. Configure the following parameters:
¡ IP Address—Enter the IP address of the host where the IBM Storwize V7000 storage device to be monitored is installed. APM automatically checks the IP address and associates the application monitor with the storage device if it is already managed in the IMC platform. If the host is already added to the IMC platform, you can also click Select, and then select the storage device in the Select Devices dialog box. For information about selecting a storage device, see "Quick start."
¡ Name—Enter a unique application monitor name. As a best practice, name the application monitor as application type_host IP address.
¡ Use Template—Select Enable or Disable from the list.
¡ Template—Click
the Configure icon ![]() next to the Template field to select an existing template. The Template field
is automatically populated with the name of the selected template. For more
information about configuring application templates, see "Configuration management." This field is displayed only when you select Enable from the Use
Template list.
next to the Template field to select an existing template. The Template field
is automatically populated with the name of the selected template. For more
information about configuring application templates, see "Configuration management." This field is displayed only when you select Enable from the Use
Template list.
¡ Description—Enter a description for the application monitor.
¡ Polling Interval (min)—Select a polling interval for the application monitor. Options are 1, 2, 3, 4, 5, 10, 20, and 30. The default polling interval is 5 minutes. A shorter polling interval improves real-time data accuracy at the expense of system resources. This field is available only when you select Disable from the Use Template list.
¡ Username/Password—Enter the username and password of the user who has the administrator privileges on the storage device. The fields are available only when you select Disable from the Use Template list.
¡ Namespace—Enter the namespace for the SMI-S interface of the storage device. The default value is /root/ibm. This field is available only when you select Disable from the Use Template list.
¡ Contact—Enter the contact information, such as the name, email address, and telephone number. The default is the username of the operator who created the application monitor. This field is available only when you select Disable from the Use Template list.
¡ APM Server—Select an APM server to monitor the application. The options are in server-address (application-type:n/N) format. The letter n indicates the number of IBM Storwize V7000 applications monitored on the APM server. The letter N indicates the total number of applications monitored on the APM server. Server address 127.0.0.1 indicates that APM and the IMC platform are deployed on the same server.
¡ Related Applications—Click Add next to this field. On the Select Application window, enter a partial or complete name to filter applications, select the applications that the storage device depends on, and then click OK.
Operating system applications cannot be selected. Operators can view all dependencies of the application in the dependency topology.
¡ Application Group—Specify an application group for the IBM Storwize V7000 application.
- To specify an existing application group, click Add, select an application group, and then click OK.
- To specify a new application group, click Add Application Group, configure the application group settings, and then click OK.
¡ Detect Application—Select this parameter if you want to enable application detection. APM verifies the application connectivity by using the previous parameter settings, and adds the application monitor only when it can connect to the application. If you do not select this parameter, APM adds the application monitor without verifying the application connectivity.
5. Click OK.
Modifying an IBM Storwize V7000 application monitor
Authorized users can modify all parameters except the IP address and the APM server for an IBM Storwize V7000 storage device. When the IP address of a monitored IBM Storwize V7000 storage device changes, operators must add a new application monitor for the device. The new application monitor cannot inherit the history data from the previous application monitor.
To modify an IBM Storwize V7000 application monitor:
1. Click the Resource tab.
2. From the navigation tree, select Application Manager > Application Monitor.
The application monitor list page displays all application monitors.
3. Click the Modify
icon ![]() for the IBM Storwize V7000 application monitor you want to modify.
for the IBM Storwize V7000 application monitor you want to modify.
The page for modifying the IBM Storwize V7000 application monitor opens.
4. Modify the parameters as needed, except the IP address and the APM server.
For more information about parameter settings, see "Adding an IBM Storwize V7000 application monitor."
5. Click OK.
Viewing the IBM Storwize V7000 application monitor report
After an IBM Storwize V7000 application monitor is added, APM collects index data of the application, evaluates the availability and health status, and updates the monitor report. The report shows the index values obtained from the most recent polling of the application.
To view the IBM Storwize V7000 application monitor report:
1. Click the Resource tab.
2. From the navigation tree, select Application Manager > Application Monitor.
The application monitor list page displays all application monitors.
3. Click the name of an IBM Storwize V7000 application monitor to display the report.
Figure 144 shows part of an IBM Storwize V7000 application monitor report.
Figure 144 Part of an IBM Storwize V7000 application monitor report

Monitor Information
The Monitor Information area contains the following fields:
· Name—Name of the application monitor.
· Health Status—Current health status of the storage device.
· IP Address—IP address of the storage device.
· Application Description—Description of the IBM Storwize V7000 application.
· Application Type—Type of the monitored application, which is always IBM Storwize V7000.
· Namespace—Namespace of the SMI-S interface for the IBM Storwize V7000 storage device.
· Last Polling Time—Time when APM last polled the IBM Storwize V7000 storage device.
· Relationship—Click the Relationship icon ![]() to view
dependencies between the IBM Storwize V7000 storage device and other
applications in a dependency topology view. For more information
about dependency topologies, see "Topology and application group management."
to view
dependencies between the IBM Storwize V7000 storage device and other
applications in a dependency topology view. For more information
about dependency topologies, see "Topology and application group management."
· Top5 Unrecovered Alarm—Latest five unrecovered alarms on the storage device. This field is not displayed if no alarm is generated by the IBM Storwize V7000 storage device.
Availability Today
The Availability Today area contains the following fields:
· Current Availability—Availability of the IBM Storwize V7000 application.
¡ Click the Weekly History icon![]() to view the availability of the IBM Storwize
V7000 application in the last 7 days.
to view the availability of the IBM Storwize
V7000 application in the last 7 days.
¡ Click
the Monthly History icon![]() to view
the availability of the IBM Storwize V7000 application in the last 30 days.
to view
the availability of the IBM Storwize V7000 application in the last 30 days.
· Available Time—Total amount of time that the IBM Storwize V7000 application was available after 00:00 today.
· Unavailable Time—Total amount of time that the IBM Storwize V7000 application was unavailable after 00:00 today.
· Inaccessible Time—Total amount of time that the IBM Storwize V7000 application was inaccessible after 00:00 today.
· Unmanaged Time—Total amount of time that the IBM Storwize V7000 application was unmanaged after 00:00 today.
The statistics collection started when the application monitor was added. An availability time field is not displayed when its value is 0.
Basic information
The Basic Information area contains the following fields:
· Model—Model of the storage device.
· Vendor—Vendor of the storage device.
· Version—Version of the controller codes for the storage device.
· Name—Name of the storage device.
· Status—Status of the storage device.
· Array Name—Array name for the storage device.
· RAID Level—RAID level of the storage device.
· Allocated Capacity—Allocated capacity of the storage device.
· Available Capacity—Available capacity of the storage device.
· Backend Capacity—Backend capacity of the storage device.
· Pool Capacity—Pool capacity of the storage device.
· Total Used Capacity—Total used capacity of the storage device.
· Total VDisk Capacity—Total virtual disk capacity of the storage device.
Disk Information
The Disk Information area contains the following fields:
· Disk ID—ID of the virtual disk.
· Disk Name—Name of the virtual disk.
· Health Status—Health status of the virtual disk. Options are:
¡ Unknown—The health status of the virtual disk is unknown.
¡ OK—The virtual disk is working correctly.
¡ Degraded—The virtual disk is working correctly, but the health status is not optimal or recoverable errors exist.
¡ Minor failure—All functions of the virtual disk are available. However, some of the functions are degraded.
¡ Major failure—The virtual disk is becoming invalid. Some or all functions are degraded or becoming unavailable.
¡ Critical failure—The virtual disk cannot work correctly and might be unrecoverable.
¡ Non-recoverable error—The virtual disk is invalid and cannot be recovered. All functions are unavailable.
· Disk Size—Size of the virtual disk.
· Disk Consumable Size—Assigned available space size of the virtual disk.
· Block Size—Block size of the virtual disk.
Storage Pool Information
The Storage Pool Information area contains the following fields:
· Pool ID—ID of the storage pool.
· Pool Name—Name of the storage pool.
· Pool Caption—Caption of the storage pool.
· Pool Status—Health status of the storage pool. Options are:
¡ Unknown—The health status of the storage pool is unknown.
¡ OK—The storage pool is working correctly.
¡ Degraded—The storage pool is working correctly, but the health status is not optimal or recoverable errors exist.
¡ Minor failure—All functions of the storage pool are available. However, some of the functions are degraded.
¡ Major failure—The storage pool is becoming invalid. Some or all functions are degraded or becoming unavailable.
¡ Critical failure—The storage pool cannot work correctly and might be unrecoverable.
¡ Non-recoverable error—The storage pool is invalid and cannot be recovered. All functions are unavailable.
· Backend Volume Num.—Number of backend volumes in the storage pool.
· Storage Volume Num.—Number of storage volumes in the storage pool.
· Total Managed Space—Total space size of the storage pool.
· Remain Managed Space—Available space size of the storage pool.
· Used Capacity—Used capacity of the storage pool.
· Usage Ratio—Usage of the storage pool.
Storage Volume Information
The Storage Volume Information area contains the following fields:
· Volume ID—ID of the storage volume.
· Volume Caption—Caption of the storage volume.
· Volume Status—Health status of the storage volume. Options are:
¡ Unknown—The health status of the storage volume is unknown.
¡ OK—The storage volume is working correctly.
¡ Degraded—The storage volume is working correctly, but the health status is not optimal or recoverable errors exist.
¡ Minor failure—All functions of the storage volume are available. However, some of the functions are degraded.
¡ Major failure—The storage volume is becoming invalid. Some or all functions are degraded or becoming unavailable.
¡ Critical failure—The storage volume cannot work correctly and might be unrecoverable.
¡ Non-recoverable error—The storage volume is invalid and cannot be recovered. All functions are unavailable.
· Volume Size—Size of the storage volume.
· Volume Consumable Size—Assigned available space size of the storage volume.
· Block Size—Block size of the storage volume.
· Group ID—ID of the group to which the storage volume belongs.
· Group Name—Name of the group to which the storage volume belongs.
· Pool ID—ID of the storage pool to which the storage volume belongs.
· Pool Name—Name of the storage pool to which the storage volume belongs.
FC Port Information
The FC Port Information area contains the following fields:
· Device ID—Device ID of the FC interface.
· FC Port Status—Status of the FC interface.
· FC Port ID—ID of the FC interface.
· FC Port Node Name—Name of the node where the FC interface is located.
· FC Port Type—Link technology of the FC interface.
· FC Port Bandwidth—Bandwidth of the FC interface.
· Max. Bandwidth—Maximum bandwidth of the FC interface.
· FC Port Number—FC interface number.
· FC Port MTU—Maximum transmission unit of the FC interface.
Ethernet Port Information
The Ethernet Port Information area contains the following fields:
· Device ID—Device ID of the Ethernet interface.
· Ethernet Port Status—Status of the Ethernet interface.
· Ethernet Port Bandwidth—Bandwidth of the Ethernet interface.
· Ethernet Port Number—Ethernet interface number.
· Ethernet Port MTU—Maximum transmission unit of the Ethernet interface.
· Ethernet Port Active MTU—Active maximum transmission unit of the Ethernet interface.
H3C P5730 application monitor
H3C FlexStorage P5730 (P5730) is a storage device developed by H3C to meet various virtual environment demands.
Adding a P5730 application monitor
APM monitors P5730 applications through agents or REST interfaces. When you add a P5730 application monitor, follow these guidelines:
· To monitor a P5730 application through an agent, deploy the agent on the host where the P5730 application is installed. For more information about agents, see "APM agent management."
· Make sure the SSH and REST services have been enabled on the P5730 device.
· Contact the P5730 administrator to obtain the username and password of a user with the administrator privileges and the access rights to the SSH and REST services.
· Contact the P5730 administrator to obtain the port number of the REST service. The default is 8081.
· Add the P5730 storage device to be monitored to the IMC platform.
For a storage device managed in the IMC platform, APM obtains and displays network connection information of the storage device and its access devices in the application topology. For more information about adding storage devices to the IMC platform, see H3C Intelligent Management Center v7.3 Enterprise and Standard Platform Administrator Guide.
To add a P5730 application monitor:
1. Click the Resource tab.
2. Open the Add Application page by using one of the following methods:
¡ From the navigation tree, select Application Manager > Add Application.
¡ From the navigation tree, select Application Manager > Application Monitor. In the application monitor list, click Add.
The Add Application page displays all application types that can be monitored by APM.
3. Click H3C P5730 of the Storage Device Monitor class.
The page for adding a P5730 application monitor opens.
4. Configure the following parameters:
¡ IP Address—Enter the IP address of the P5730 storage device. APM automatically checks the IP address and associates the application monitor with the P5730 storage device if it is already managed in the IMC platform. If the host is already added to the IMC platform, you can also click Select, and then select the P5730 storage device in the Select Devices dialog box. For information about selecting a P5730, see "Quick start."
¡ Name—Enter a unique application monitor name. As a best practice, name the application monitor as application type_host IP address.
¡ Use Template—Select Enable or Disable from the list.
¡ Template—Click
the Configure icon ![]() next to the Template field to select an existing template. The Template field
is automatically populated with the name of the selected template. For more
information about configuring application templates, see "Configuration management." This field is displayed only when you select Enable from the Use
Template list.
next to the Template field to select an existing template. The Template field
is automatically populated with the name of the selected template. For more
information about configuring application templates, see "Configuration management." This field is displayed only when you select Enable from the Use
Template list.
¡ Description—Enter a description for the application monitor.
¡ Application Monitor Port—Port used to monitor the application. The default value is 16022. This field is available only when you select Disable from the Use Template list.
¡ Polling Interval (min)—Select a polling interval for the application monitor. Options are 1, 2, 3, 4, 5, 10, 20, and 30. The default polling interval is 5 minutes. A shorter polling interval improves real-time data accuracy at the expense of system resources. This field is available only when you select Disable from the Use Template list.
¡ Username/Password—Enter the username and password of the user who has the administrator privileges on the P5730. These fields are available only when you select Disable from the Use Template list.
¡ REST Port—Enter the REST port number of the P5730 storage device. The default value is 8081. This field is available only when you select Disable from the Use Template list.
¡ Contact—Enter the contact information, such as the name, email address, and telephone number. The default is the username of the operator who created the application monitor. This field is available only when you select Disable from the Use Template list.
¡ APM Server—Select an APM server to monitor the application. The options are in server-address (application-type:n/N) format. The letter n indicates the number of P5730 applications monitored on the APM server. The letter N indicates the total number of applications monitored on the APM server. Server address 127.0.0.1 indicates that APM and the IMC platform are deployed on the same server.
¡ Related Applications—Click Add next to this field. On the Select Application window, enter a partial or complete name to filter applications, select the applications that the P5730 storage device depends on, and then click OK.
Operating system applications cannot be selected. Operators can view all dependencies of the application in the dependency topology.
¡ Application Group—Specify an application group for the P5730 application.
- To specify an existing application group, click Add, select an application group, and then click OK.
- To specify a new application group, click Add Application Group, configure the application group settings, and then click OK.
¡ Detect Application—Select this parameter if you want to enable application detection. APM verifies the application connectivity by using the previous parameter settings, and adds the application monitor only when it can connect to the application. If you do not select this parameter, APM adds the application monitor without verifying the application connectivity.
5. Click OK.
Modifying a P5730 application monitor
Authorized users can modify all parameters except the IP address and the APM server for a P5730 storage device. When the IP address of a monitored P5730 storage device changes, operators must add a new application monitor for the P5730 storage device. The new application monitor cannot inherit the history data from the previous application monitor.
To modify a P5730 application monitor:
1. Click the Resource tab.
2. From the navigation tree, select Application Manager > Application Monitor.
The application monitor list page displays all application monitors.
3. Click the Modify
icon ![]() for the P5730 application monitor you want to modify.
for the P5730 application monitor you want to modify.
The page for modifying the P5730 application monitor opens.
4. Modify the parameters as needed, except the IP address and the APM server.
For more information about parameter settings, see "Adding a P5730 application monitor."
5. Click OK.
Viewing the P5730 application monitor report
After a P5730 application monitor is added, APM collects index data of the application, evaluates the availability and health status, and updates the monitor report. The report shows the index values obtained from the most recent polling of the application.
To view the P5730 application monitor report:
1. Click the Resource tab.
2. From the navigation tree, select Application Manager > Application Monitor.
The application monitor list page displays all application monitors.
3. Click the name of a P5730 application monitor to display the report.
Figure 145 shows part of a P5730 application monitor report.
Figure 145 Part of a P5730 application monitor report
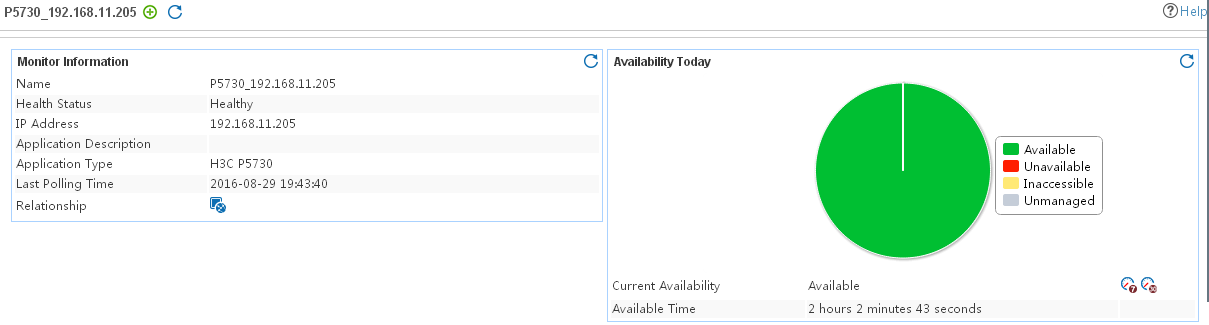
Monitor Information
The Monitor Information area contains the following fields:
· Name—Application monitor name.
· Health Status—Health status of the P5730 storage device.
· IP Address—IP address of the P5730 storage device.
· Application Description—Description of the P5730 application.
· Application Type—Type of the monitored application, which is always H3C P5730.
· Last Polling Time—Time when APM last polled the P5730 storage device.
· Relationship—Click the Relationship icon ![]() to view
dependencies between the P5730 storage device and other applications in a
dependency topology view. For more information about
dependency topologies, see "Topology and application group management."
to view
dependencies between the P5730 storage device and other applications in a
dependency topology view. For more information about
dependency topologies, see "Topology and application group management."
· Top5 Unrecovered Alarm—Latest five unrecovered alarms on the P5730 storage device. This field is not displayed if no alarm is generated by the P5730 storage device.
Availability Today
The Availability Today area contains the following fields:
· Current Availability—Availability of the P5730 device.
¡ Click the Weekly History icon![]() to view the availability of the P5730 storage device in
the last 7 days.
to view the availability of the P5730 storage device in
the last 7 days.
¡ Click
the Monthly History icon![]() to view
the availability of the P5730 storage device in the last 30 days.
to view
the availability of the P5730 storage device in the last 30 days.
· Available Time—Total amount of time that the P5730 storage device was available after 00:00 today.
· Unavailable Time—Total amount of time that the P5730 storage device was unavailable after 00:00 today.
· Inaccessible Time—Total amount of time that the P5730 storage device was inaccessible after 00:00 today.
· Unmanaged Time—Total amount of time that the P5730 storage device was unmanaged after 00:00 today.
The statistics collection started when the application monitor was added. An availability time field is not displayed when its value is 0.
CPU Usage Ratio
The CPU Usage Ratio area contains the following field:
· CPU Usage Ratio—CPU usage ratio of the P5730 storage device.
Click the History Record
icon ![]() to view the history graph of the CPU usage
ratio.
to view the history graph of the CPU usage
ratio.
Memory Usage Ratio
The Memory Usage Ratio area contains the following field:
· Memory Usage Ratio—Memory usage ratio of the P5730 storage device.
Click the History Record
icon ![]() to view the history graph of the memory usage
ratio.
to view the history graph of the memory usage
ratio.
Cluster
The Cluster area contains the following fields:
· Name—Name of the cluster.
· Module Count—Number of storage modules in the cluster.
· Storage Module IP—IP address of each storage module in the cluster.
· Virtual IP Enabled—Whether the virtual IP address of the cluster is enabled.
· Available Space—Available space size of the cluster.
· Total Space—Total space size of the cluster.
· Supported Features—List of features supported by the cluster.
· Adaptive Optimization Supported—Whether the cluster supports adaptive optimization.
Click the History Record
icon ![]() for an index
to view the history graph of the corresponding index data.
for an index
to view the history graph of the corresponding index data.
Cluster Performance
The Cluster Performance area contains the following fields:
· Cluster Performance Unit—Name of the cluster.
· I/O Reads—Number of read operations per second on the cluster.
· I/O Writes—Number of write operations per second on the cluster.
· I/O Total—Total number of transfer operations per second on the cluster.
· I/O Read Rate—Read rate in Mbps of the cluster.
· I/O Write Rate—Write rate in Mbps of the cluster.
· I/O Transfer Rate—Transfer rate in Mbps of the cluster.
· Read Queue Depth—Depth of the read queue in the cluster.
· Write Queue Depth—Depth of the write queue in the cluster.
· Total Queue Depth—Total depth of the read and write queues in the cluster.
· Read Latency—Read operation latency of the cluster.
· Write Latency—Write operation latency of the cluster.
Click the History
Record icon ![]() for an index
to view the history graph of the corresponding index data.
for an index
to view the history graph of the corresponding index data.
Cluster Virtual IP
The Storage Virtual IP area contains the following fields:
· Name—Name of the cluster.
· IP—Virtual IP address of the cluster.
· Mask—Mask of the virtual IP address of the cluster.
Cluster Space
The Cluster Space area contains the following fields:
· Name—Name of the cluster.
· Replication Level—Replication level of the cluster.
· Available Space—Available space of each replication level in the cluster. Click the History Record icon ![]() to view the history graph of the available
space.
to view the history graph of the available
space.
Volume
The Volume area contains the following fields:
· Name—Name of the storage volume.
· Created At—Time when the storage volume was created.
· Alternate Name—Alternative name of the storage volume.
· Size—Total size of the storage volume.
· Provisioned Space—Size configured for the storage volume.
· Replica Count—Number of replications of the storage volume.
· iSCSI Qualified Name—iSCSI qualified name of the storage volume.
· Bytes Written—Number of bytes written in the storage volume.
· Availability—Whether the storage volume is online.
· Cluster—Name of the cluster to which the storage volume belongs.
· Transport Server ID—ID of the server that provides transfer service for the storage volume.
· Date Protection Level—Data protection level of the storage volume. Options are:
¡ 0—Network RAID-0 (None).
¡ 1—Network RAID-5 (Single Parity).
¡ 2—Network RAID-10 (2-Way Mirror).
¡ 3—Network RAID-10 (3-Way Mirror).
¡ 4—Network RAID-10 (4-Way Mirror).
¡ 5—Network RAID-6 (Dual Parity).
· Transport Type—Date transfer type of the storage volume. Options are:
¡ 0—iSCSI.
¡ 1—Fiber channel.
Click the History Record icon ![]() for
an index to view the history graph of the corresponding index data.
for
an index to view the history graph of the corresponding index data.
Volume Performance
The Volume Performance area contains the following fields:
· Volume Performance Unit—Name of the storage volume.
· I/O Reads—Number of read operations per second on the storage volume.
· I/O Writes—Number of write operations per second on the storage volume.
· I/O Total—Total number of transfer operations per second on the storage volume.
· I/O Read Rate—Read rate in Mbps of the storage volume.
· I/O Write Rate—Write rate in Mbps of the storage volume.
· I/O Transfer Rate—Transfer rate in Mbps of the storage volume.
· Read Queue Depth—Depth of the read queue in the storage volume.
· Write Queue Depth—Depth of the write queue in the storage volume.
· Total Queue Depth—Total depth of the read and write queues in the storage volume.
· Read Latency—Read operation latency of the storage volume.
· Write Latency—Write operation latency of the storage volume.
Click the History Record
icon ![]() to view the
history graph of the corresponding index data.
to view the
history graph of the corresponding index data.
Volume Status
The Volume Status area contains the following fields:
· Name—Name of the storage volume.
· Thinly Provisioned—Whether the storage volume is thinly provisioned.
· In Deletion—Whether the volume is being deleted.
· VIP Rebalancing—Whether VIP rebalancing is being performed for the storage volume.
· Enabled for Adaptive Optimization—Whether adaptive optimization is enabled for the storage volume.
· In Migration—Whether the storage volume is migrating to another cluster.
· SCSI LUN Status—SCSI LUN status of the storage volume.
· Unrecoverable I/O Errors—Whether the storage volume has unrecoverable I/O errors.
· Restripe Pending Status—Restripe pending status of the storage volume.
· Replication Status—Replication status of the storage volume.
· Resynchronization Status—Resynchronization status of the storage volume.
· Migration Status—Migration status of the storage volume.
· Licensed—Whether the storage volume is licensed.
· Fiber Channel Transport Status—Fiber channel transport status of the storage volume. Options are:
¡ 0—None.
¡ 1—Transitioning.
¡ 2—ActiveNonOptimized.
¡ 3—ActiveOptimized.
¡ 4—Network RAID-10 (4-Way Mirror).
¡ 5—Network RAID-6 (Dual Parity).
Volume iSCSI Session
The Volume iSCSI Session area contains the following fields:
· Volume—Name of the storage volume.
· Server—Name of the server accessing the storage volume.
· Gateway IP—IP address of the gateway connected to the server.
· Initiator IP—IP address of the iSCSI initiator of the server.
· Initiator Port—IP port of the iSCSI initiator.
· IQN—Qualified name of the iSCSI initiator.
· Session ID—ID of the iSCSI session.
· Session Resetting—Whether the iSCSI session is reset.
· Status—Status of the iSCSI session.
· Target IP—Target IP address of the iSCSI session.
· Target Port—Target IP port of the iSCSI session.
· Target Portal Group Tag—Target portal group tag of the iSCSI session.
Volume ACL
The Volume ACL area contains the following fields:
· Volume—Name of the storage volume.
· Server—Name of the server accessing the storage volume.
· Exclusive Access Right—Whether the server has exclusive access right to the storage volume.
· Read Access Right—Whether the server has read access right to the storage volume.
· Write Access Right—Whether the server has write access right to the storage volume.
· LUN—Permissions assigned to the storage volume by the LUN. This field is applicable only when the transport type is fiber channel.
Snapshot
The Snapshot area contains the following fields:
· Name—Name of the snapshot.
· Created At—Time when the snapshot was created.
· Alternate name—Alternative name of the snapshot.
· Transport Type—SCSI transport type for the snapshot. Options are:
¡ 0—iSCSI.
¡ 1—Fiber channel.
· Size—Size of the snapshot.
· Provisioned Space—Space size configured for the snapshot.
· iSCSI IQN—iSCSI qualified name of the snapshot.
· Primary Snapshot—Whether the snapshot is a primary snapshot. The value of false indicates that the snapshot is a remote snapshot.
· Bytes Written—Number of bytes written in the snapshot.
· Availability—Whether the snapshot is online.
· Cluster—Name of the cluster to which the snapshot belongs.
· Cluster ID—ID of the cluster to which the snapshot belongs.
· Used Writable Space—Amount of data written to the snapshot, which is the sum of data written to the snapshot and all parent snapshots.
· Management Identifier—Identifier of the application managing the snapshot. Options are:
¡ 0—Not managed.
¡ 1—VSS.
¡ 2—VMware.
· Transport Server ID—ID of the transport server. This field is applicable only when the transport type is fiber channel.
Snapshot Status
The Snapshot Status area contains the following fields:
· Name—Name of the snapshot.
· In Deletion—Whether the snapshot is being deleted.
· Thinly Provisioned—Whether the snapshot is thinly provisioned.
· Scheduled Generation—Whether the snapshot was generated by a schedule.
· In Migration—Whether the snapshot is migrating.
· SCSI LUN Status—SCSI LUN status of the snapshot.
· Unrecoverable I/O Errors—Whether the snapshot has unrecoverable I/O errors.
· Restripe Pending Status—Restripe pending status of the snapshot.
· Replication Status—Replication status of the snapshot.
· Resynchronization Status—Resynchronization status of the snapshot.
· Migration Status—Migration status of the snapshot.
· Licensed—Whether the snapshot is licensed.
· Fiber Channel Transport Status—Fiber channel transport status of the snapshot. Options are:
¡ 0—None.
¡ 1—Transitioning.
¡ 2—ActiveNonOptimized.
¡ 3—ActiveOptimized.
Snapshot iSCSI Session
The Snapshot iSCSI Session area contains the following fields:
· Snapshot—Name of the snapshot.
· Server—Name of the server to which the snapshot belongs.
· Gateway IP—IP address of the gateway connected to the server.
· Initiator IP—IP address of the iSCSI initiator.
· Initiator Port—Port number of the iSCSI initiator.
· IQN—Qualified name of the iSCSI initiator.
· Session ID—ID of the iSCSI session.
· Session Resetting—Whether the session is reset.
· Status—Status of the iSCSI connection.
· Target IP—IP address of the iSCSI target.
· Target Port—Port number of the iSCSI target.
· Target Portal Group Tag—iSCSI target portal group tag.
Snapshot ACL
The Snapshot ACL area contains the following fields:
· Snapshot—Name of the snapshot.
· Server—Name of the server accessing the snapshot.
· Exclusive Access Right—Whether the server has exclusive access right to the snapshot.
· Read Access Right—Whether the server has read access right to the snapshot.
· Write Access Right—Whether the server has write access right to the snapshot.
· LUN—Permissions assigned to the snapshot by the LUN. This field is applicable only when the transport type is fiber channel.
Server
The Server area contains the following fields:
· Name—Name of the server.
· Boot Volume ID—ID of the fiber channel boot volume on the server.
· Boot Volume LUN—ID of the LUN of the fiber channel boot volume on the server.
· CHAP Authentication—Whether CHAP authentication is required by the server.
· CHAP Initiator Secret—CHAP initiator secret of the server.
· CHAP Name—CHAP name of the server.
· CHAP Target Secret—CHAP target secret of the server.
· Controlling Server Name—Name or IP address of the controlling server.
· Fiber Channel Available—Whether fiber channel is enabled.
· In Server Cluster—Whether the server belongs to a server cluster.
· iSCSI Enabled—Indicates whether iSCSI of the server is enabled.
· iSCSI IQN—iSCSI qualified name of the server.
· iSCSI LoadBalancing Enabled—Whether iSCSI load balancing of the server is enabled.
Hitachi VSP application monitor
The Hitachi Vitual Storage Platform (VSP) is the new-generation enterprise-level storage platform of Hitachi Data Systems. The VSP GX00 series consists of the mid-range product G200, enterprise entry-level G400/G600, and enterprise-level G800. These products and the high-end G1000 of the industry form the complete product series.
Adding a Hitachi VSP application monitor
APM uses the SMI-S protocol to obtain index data for the Hitachi VSP application that is collected through the installed Hitachi Command Suite software. When you add a Hitachi VSP application monitor, contact the Hitachi VSP administrator to perform the following tasks:
· Obtain the IP address and namespace of the Hitachi Command Suite.
· Obtain the username and password of a user with the administrator privileges and the access rights to HTTPS and SMI-S.
· Check whether SSL is enabled for Hitachi Command Suite.
To add a Hitachi VSP application monitor:
1. Click the Resource tab.
2. Open the Add Application page by using one of the following methods:
¡ From the navigation tree, select Application Manager > Add Application.
¡ From the navigation tree, select Application Manager > Application Monitor. In the application monitor list, click Add.
The Add Application page displays all application types that can be monitored by APM.
3. Click Hitachi VSP of the Storage Device Monitor class.
The page for adding a Hitachi VSP application monitor opens.
4. Configure the following parameters:
¡ IP Address—Enter the IP address of the Hitachi Command Suite. APM automatically checks the IP address and associates the application monitor with the Hitachi VSP if it is already managed in the IMC platform. If the host is already added to the IMC platform, you can also click Select, and then select the Hitachi VSP in the Select Devices dialog box. For information about selecting a Hitachi VSP, see "Quick start."
¡ Name—Enter a unique application monitor name. As a best practice, name the application monitor as application type_host IP address.
¡ Use Template—Select Enable or Disable from the list.
¡ Template—Click
the Configure icon ![]() next to the Template field to select an existing template. The Template field
is automatically populated with the name of the selected template. For more
information about configuring application templates, see "Configuration management." This field is displayed only when you select Enable from the Use
Template list.
next to the Template field to select an existing template. The Template field
is automatically populated with the name of the selected template. For more
information about configuring application templates, see "Configuration management." This field is displayed only when you select Enable from the Use
Template list.
¡ Description—Enter a description for the application monitor.
¡ Application Monitor Port—Port used to monitor the application. The default value is 5988. This field is available only when you select Disable from the Use Template list.
¡ Polling Interval (min)—Select a polling interval for the application monitor. Options are 1, 2, 3, 4, 5, 10, 20, and 30. The default polling interval is 5 minutes. A shorter polling interval improves real-time data accuracy at the expense of system resources. This field is available only when you select Disable from the Use Template list.
¡ Username/Password—Enter the username and password of the user who has the administrator privileges on the Hitachi VSP. These fields are available only when you select Disable from the Use Template list.
¡ SSL—Select whether or not to implement connection encryption using SSL. This field is available only when you select Disable from the Use Template list.
¡ Namespace—Enter the namespace for the SMI-S interface. The default value is root/smis/current. This field is available only when you select Disable from the Use Template list.
¡ Storage System Name—Enter the storage system name. This field is available only when you select Disable from the Use Template list.
¡ Contact—Enter the contact information, such as the name, email address, and telephone number. The default is the username of the operator who created the application monitor. This field is available only when you select Disable from the Use Template list.
¡ APM Server—Select an APM server to monitor the application. The options are in server-address (application-type:n/N) format. The letter n indicates the number of Hitachi VSP applications monitored on the APM server. The letter N indicates the total number of applications monitored on the APM server. Server address 127.0.0.1 indicates that APM and the IMC platform are deployed on the same server.
¡ Related Applications—Click Add next to this field. On the Select Application window, enter a partial or complete name to filter applications, select the applications that the Hitachi VSP depends on, and then click OK.
Operating system applications cannot be selected. Operators can view all dependencies of the application in the dependency topology.
¡ Application Group—Specify an application group for the Hitachi VSP application.
- To specify an existing application group, click Add, select an application group, and then click OK.
- To specify a new application group, click Add Application Group, configure the application group settings, and then click OK.
¡ Detect Application—Select this parameter if you want to enable application detection. APM verifies the application connectivity by using the previous parameter settings, and adds the application monitor only when it can connect to the application. If you do not select this parameter, APM adds the application monitor without verifying the application connectivity.
5. Click OK.
Modifying a Hitachi VSP application monitor
Authorized users can modify all parameters except the IP address and the APM server for a Hitachi VSP application monitor. When the IP address of a monitored Hitachi VSP host changes, operators must add a new application monitor for the host. However, the new application monitor cannot inherit the history data from the previous application monitor.
To modify a Hitachi VSP application monitor:
1. Click the Resource tab.
2. From the navigation tree, select Application Manager > Application Monitor.
The application monitor list page opens.
3. Click the Modify
icon ![]() for the Hitachi VSP application monitor you want to modify.
for the Hitachi VSP application monitor you want to modify.
The page for modifying the Hitachi VSP application monitor opens.
4. Modify the parameters as needed, except the IP address and the APM server.
For more information about parameter settings, see "Adding a Hitachi VSP application monitor."
5. Click OK.
Viewing the Hitachi VSP application monitor report
After a Hitachi VSP application monitor is added, APM collects index data of the application, evaluates the availability and health status, and updates the monitor report. The report shows the index values obtained from the most recent polling of the application.
To view the Hitachi VSP application monitor report:
1. Click the Resource tab.
2. From the navigation tree, select Application Manager > Application Monitor.
The application monitor list page displays all application monitors.
3. Click the name of the Hitachi VSP application monitor to display the report.
Figure 146 shows part of a Hitachi VSP application monitor report.
Figure 146 Part of a Hitachi VSP application monitor report
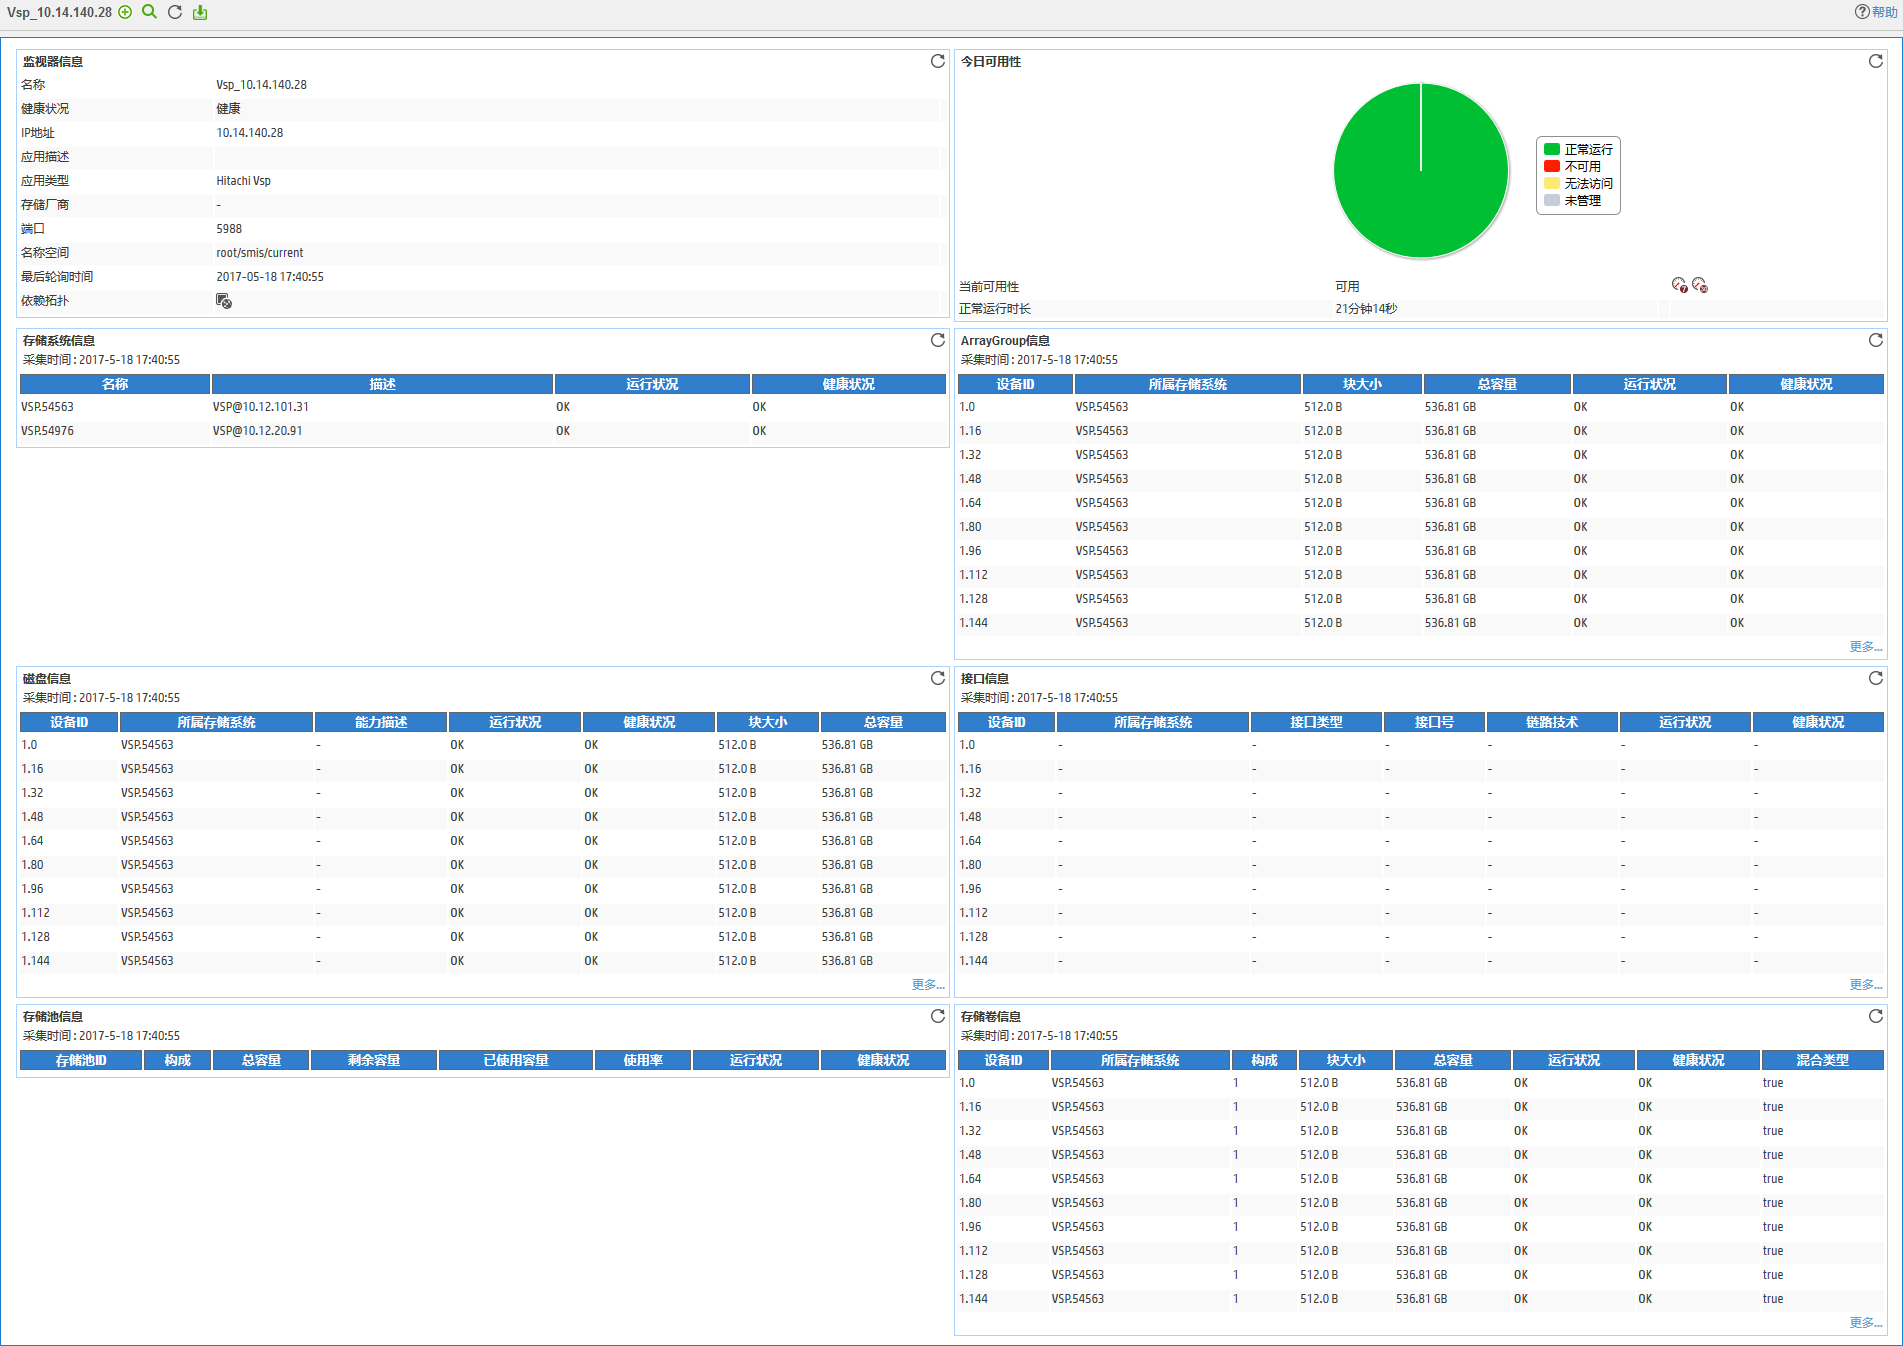
Monitor Information
The Monitor Information area contains the following fields:
· Name—Name of the Hitachi VSP application monitor.
· Health Status—Health status of the Hitachi VSP application.
· IP Address—IP address of the Hitachi Command Suite software.
· Application Description—Description of the Hitachi VSP application.
· Application Type—Type of the monitored application, which is always Hitachi VSP.
· Vendor—Vendor of the storage device.
· Port—Listening port number of the Hitachi Command Suite.
· Namespace—Namespace of the Hitachi Command Suite.
· Last Polling Time—Time when APM last polled the Hitachi Command Suite.
· Relationship—Click the Related Applications icon ![]() to view dependencies between the Hitachi
VSP application and other applications in a dependency topology view. For more information about dependency
topologies, see "Topology and application group management."
to view dependencies between the Hitachi
VSP application and other applications in a dependency topology view. For more information about dependency
topologies, see "Topology and application group management."
Availability Today
The Availability Today area contains the following fields:
· Current Availability—Availability of the Hitachi VSP application.
¡ Click
the Weekly History icon ![]() to view
the availability of the Hitachi VSP application in the last 7 days.
to view
the availability of the Hitachi VSP application in the last 7 days.
¡ Click
the Monthly History icon ![]() to view
the availability of the Hitachi VSP application in the last 30 days.
to view
the availability of the Hitachi VSP application in the last 30 days.
· Available Time—Total amount of time that the Hitachi VSP application was available after 00:00 today.
· Unavailable Time—Total amount of time that the Hitachi VSP application was unavailable after 00:00 today.
· Inaccessible Time—Total amount of time that the Hitachi VSP application was inaccessible after 00:00 today.
· Unmanaged Time—Total amount of time that the Hitachi VSP application was unmanaged after 00:00 today.
The statistics collection started when the application monitor was added. An availability time field is not displayed when its value is 0.
Storage System Information
The Storage System Information area contains the following fields:
· Name—Name of the storage system.
· Description—Description of the storage system.
· Operational Status—Operational status of the storage system.
· Health Status—Health state of the storage system.
ArrayGroup Information
The ArrayGroup Information area contains the following fields:
· ArrayGroup ID—ID of the ArrayGroup.
· Owning Storage System—Storage system to which the ArrayGroup belongs.
· Block Size—Block size of the ArrayGroup.
· Total Size—Total size of the ArrayGroup.
· Operational Status—Operational status of the ArrayGroup.
· Health Status—Health state of the ArrayGroup.
Disk Information
The Disk Information area contains the following fields:
· Device ID—ID of the disk.
· Owning Storage System—Storage system to which the disk belongs.
· Description—Description of the disk size.
· Operational Status—Operational status of the disk.
· Health Status—Health state of the disk.
· Block Size—Block size of the disk.
· Total Size—Total size of the disk.
Port Information
The Port Information area contains the following fields:
· Port ID—ID of the port.
· Owning Storage System—Storage system to which the port belongs.
· Port Type—Type of the port.
· Port Number—Port number.
· Link Technology—Link technology of the port.
· Operational Status—Operational status of the port.
· Health Status—Health state of the port.
· WWN—WWN information of the port.
Pool Information
The Pool Information area contains the following fields:
· Pool ID—ID of the storage pool.
· Owning Storage System—Storage system to which the storage pool belongs.
· Composition—Indicates what the storage pool consists of.
· Total Size—Total space of the storage pool.
· Remaining Size—Remaining space of the storage pool.
· Used Size—Used space of the storage pool.
· Utilization—Utilization of the storage pool.
· Operational Status—Operational status of the storage pool.
· Health Status—Health state of the storage pool.
Volume Information
The Volume Information area contains the following fields:
· Volume ID—ID of the volume.
· Owning Storage System—Storage system to which the volume belongs.
· Composition—Indicates what the volume consists of.
· Block Size—Block size of the volume.
· Total Size—Total size of the volume.
· Operational Status—Operational status of the volume.
· Health Status—Health state of the volume.
· Composite—Whether the volume is composite type.
EMC VMAX 100K application monitor
EMC VMAX 100K is a high-end storage system developed by EMC. Typically models include 100K, 200K, and 400K.
Adding an EMC VMAX 100K application monitor
APM monitors EMC VMAX storage devices through the built-in SMI-S provider of the devices. When you add an EMC VMAX application monitor, contact the EMC VMAX administrator to perform the following tasks:
· Obtain the IP address and namespace of the SMI-S provider.
· Obtain the username and password of a user with the administrator privileges and the access rights to HTTPS and SMI-S.
· Check whether SSL is enabled on the SMI-S provider.
To add an EMC VMAX 100K application monitor:
1. Click the Resource tab.
2. Open the Add Application page by using one of the following methods:
¡ From the navigation tree, select Application Manager > Add Application.
¡ From the navigation tree, select Application Manager > Application Monitor. In the application monitor list, click Add.
The Add Application page displays all application types that can be monitored by APM.
3. Click EMC VMAX 100K of the Storage Device Monitor class.
The page for adding an EMC VMAX 100K application monitor opens.
4. Configure the following parameters:
¡ IP Address—Enter the IP address of the SMI-S provider of the EMC VMAX 100K. APM automatically checks the IP address and associates the application monitor with the EMC VMAX 100K storage device if it is already managed in the IMC platform. If the EMC VMAX 100K storage device is already added to the IMC platform, you can also click Select, and then select the EMC VMAX 100K storage device in the Select Devices dialog box. For information about selecting an EMC VMAX 100K storage device, see "Quick start."
¡ Name—Enter a unique application monitor name. As a best practice, name the application monitor as application type_host IP address.
¡ Use Template—Select Enable or Disable from the list.
¡ Template—Click
the Configure icon ![]() next to the Template field to select an existing template. The Template field
is automatically populated with the name of the selected template. For more
information about configuring application templates, see "Configuration management." This field is displayed only when you select Enable from the Use
Template list.
next to the Template field to select an existing template. The Template field
is automatically populated with the name of the selected template. For more
information about configuring application templates, see "Configuration management." This field is displayed only when you select Enable from the Use
Template list.
¡ Description—Enter a description for the application monitor.
¡ Application Monitor Port—Port used to monitor the application. If SSL is enabled, the port number is 5989. If SSL is disabled, the port number is 5988. This field is available only when you select Disable from the Use Template list.
¡ Polling Interval (min)—Select a polling interval for the application monitor. Options are 1, 2, 3, 4, 5, 10, 20, and 30. The default polling interval is 5 minutes. A shorter polling interval improves real-time data accuracy at the expense of system resources. This field is available only when you select Disable from the Use Template list.
¡ Username/Password—Enter the username and password of the SMI-S provider. These fields are available only when you select Disable from the Use Template list.
¡ SSL—Select Enable or Disable from the list according the SSL setting on the SMI-S provider.
¡ Namespace—Enter the namespace for the SMI-S provider. The default value is root/emc. This field is available only when you select Disable from the Use Template list.
¡ Contact—Enter the contact information, such as the name, email address, and telephone number. The default is the username of the operator who created the application monitor. This field is available only when you select Disable from the Use Template list.
¡ APM Server—Select an APM server to monitor the application. The options are in server-address (application-type:n/N) format. The letter n indicates the number of EMC VMAX 100K applications monitored on the APM server. The letter N indicates the total number of applications monitored on the APM server. Server address 127.0.0.1 indicates that APM and the IMC platform are deployed on the same server.
¡ Related Applications—Click Add next to this field. On the Select Application window, enter a partial or complete name to filter applications, select the applications that the VMAX 100K device depends on, and then click OK.
Operating system applications cannot be selected. Operators can view all dependencies of the application in the dependency topology.
¡ Application Group—Specify an application group for the VMAX 100K application.
- To specify an existing application group, click Add, select an application group, and then click OK.
- To specify a new application group, click Add Application Group, configure the application group settings, and then click OK.
¡ Detect Application—Select this parameter if you want to enable application detection. APM verifies the application connectivity by using the previous parameter settings, and adds the application monitor only when it can connect to the application. If you do not select this parameter, APM adds the application monitor without verifying the application connectivity.
5. Click OK.
Modifying an EMC VMAX 100K application monitor
Authorized users can modify all parameters except the IP address and the APM server for an EMC VMAX 100K device. When the IP address of a monitored VMAX 100K device changes, operators must add a new application monitor for the VMAX 100K device. The new application monitor cannot inherit the history data from the previous application monitor.
To modify a VMAX 100K application monitor:
1. Click the Resource tab.
2. From the navigation tree, select Application Manager > Application Monitor.
The application monitor list page displays all application monitors.
3. Click the Modify
icon ![]() for the VMAX 100K application monitor you want to
modify.
for the VMAX 100K application monitor you want to
modify.
The page for modifying the VMAX 100K application monitor opens.
4. Modify the parameters as needed, except the IP address and the APM server.
For more information about parameter settings, see "Adding an EMC VMAX 100K application monitor."
5. Click OK.
Viewing the EMC VMAX 100K application monitor report
After an EMC VMAX 100K application monitor is added, APM collects index data of the application, evaluates the availability and health status, and updates the monitor report. The report shows the index values obtained from the most recent polling of the application.
To view the EMC VMAX 100K application monitor report:
1. Click the Resource tab.
2. From the navigation tree, select Application Manager > Application Monitor.
The application monitor list page displays all application monitors.
3. Click the name of an EMC VMAX 100K application monitor to display the report.
Figure 147 shows part of an EMC VMAX 100K application monitor report.
Figure 147 Part of an EMC VMAX 100K application monitor report
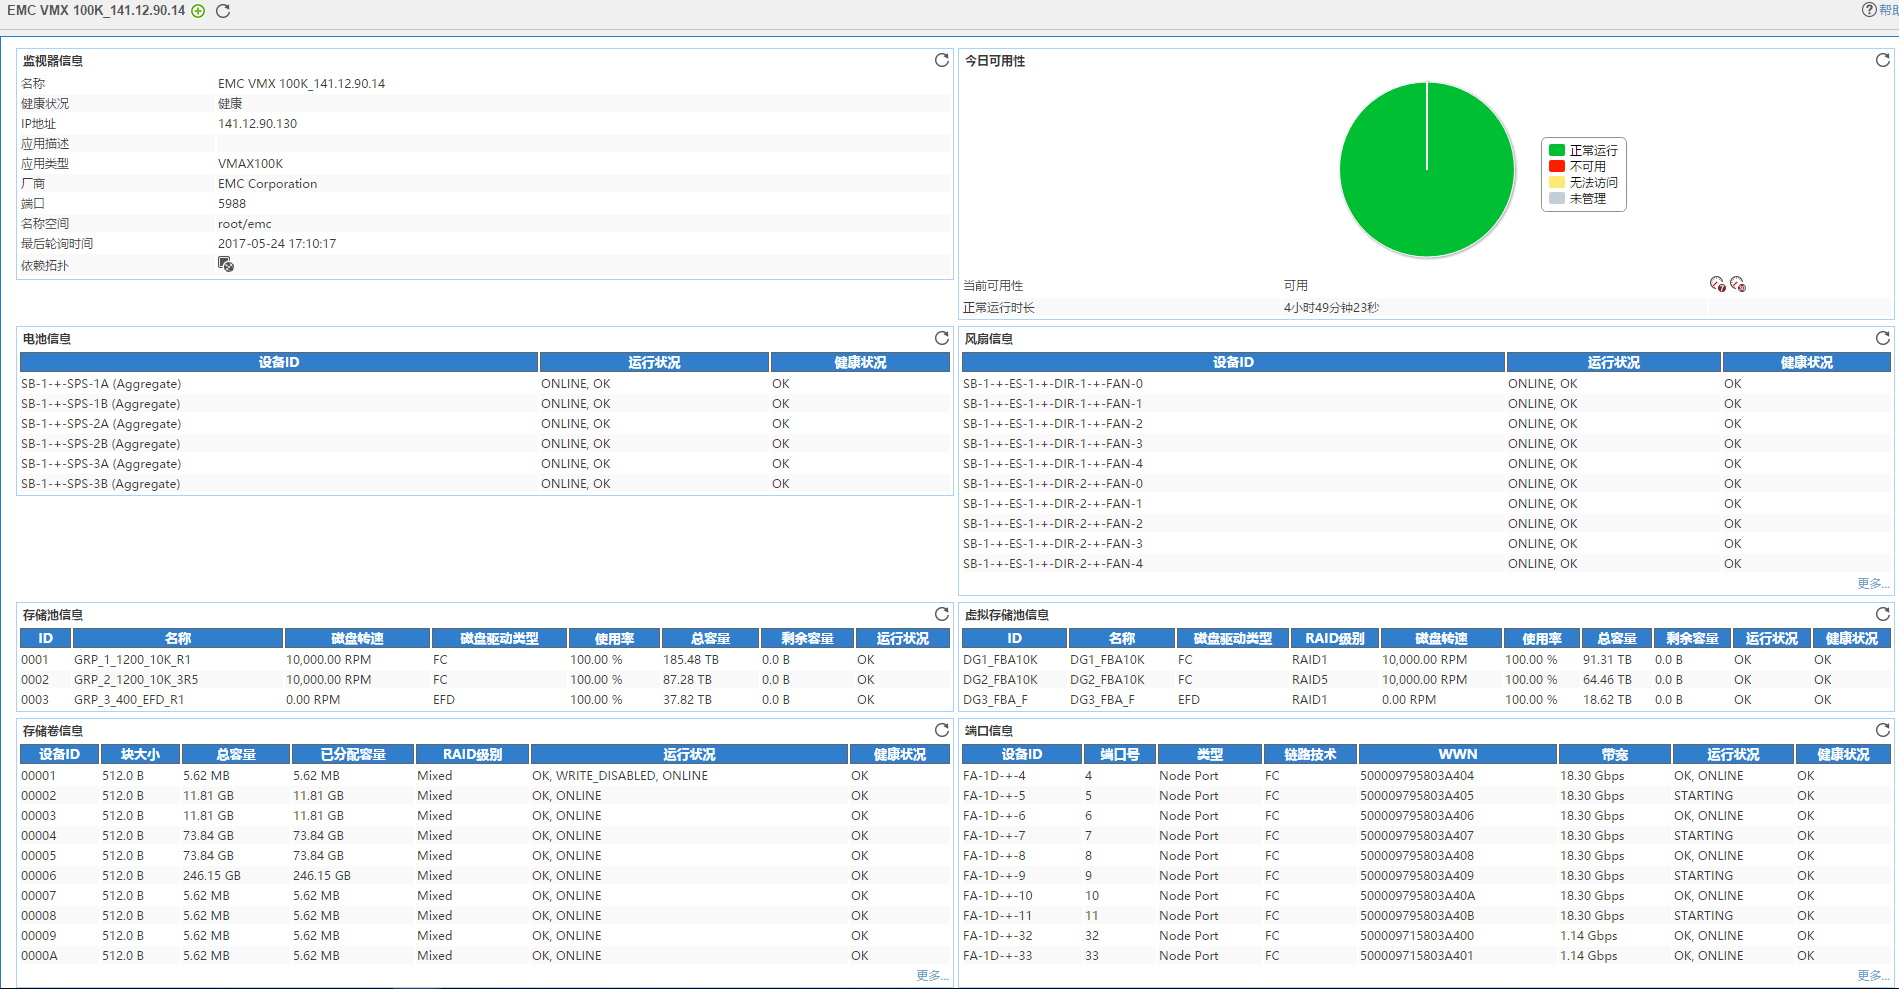
Monitor Information
The Monitor Information area contains the following fields:
· Name—Application monitor name.
· Health Status—Current health status of the EMC VMAX 100K.
· IP Address—IP address of the SMI-S provider.
· Application Description—Description of the EMC VMAX 100K application.
· Application Type—Type of the monitored application, which is always EMC VMAX 100K.
· Port—Listening port number of the SMI-S provider.
· Namespace—Namespace of the SMI-S provider.
· Last Polling Time—Time when APM last polled the SMI-S provider.
· Relationship—Click the Relationship icon ![]() to view
dependencies between the EMC VMAX
100K storage device and other applications in a dependency topology view. For more information about dependency topologies, see "Topology and application group management."
to view
dependencies between the EMC VMAX
100K storage device and other applications in a dependency topology view. For more information about dependency topologies, see "Topology and application group management."
· Top5 Unrecovered Alarm—Latest five unrecovered alarms on the EMC VMAX 100K storage device. This field is not displayed if no alarm is generated by the EMC VMAX 100K storage device.
Availability Today
The Availability Today area contains the following fields:
· Current Availability—Availability of the EMC VMAX 100K storage device.
¡ Click the Weekly History icon![]() to view the availability of the EMC VMAX 100K storage
device in the last 7 days.
to view the availability of the EMC VMAX 100K storage
device in the last 7 days.
¡ Click
the Monthly History icon![]() to view
the availability of the EMC VMAX
100K storage device in the last 30 days.
to view
the availability of the EMC VMAX
100K storage device in the last 30 days.
· Available Time—Total amount of time that the EMC VMAX 100K storage device was available after 00:00 today.
· Unavailable Time—Total amount of time that the EMC VMAX 100K storage device was unavailable after 00:00 today.
· Inaccessible Time—Total amount of time that the EMC VMAX 100K storage device was inaccessible after 00:00 today.
· Unmanaged Time—Total amount of time that the EMC VMAX 100K storage device was unmanaged after 00:00 today.
The statistics collection started when the application monitor was added. An availability time field is not displayed when its value is 0.
Battery Information
The Battery Information area contains the following fields:
· Device ID—ID of the battery.
· Operational Status—Operational status of the battery.
· Health Status—Health state of the battery.
Fan Information
The Fan Information area contains the following fields:
· Device ID—ID of the fan.
· Operational Status—Operational status of the fan.
· Health Status—Health state of the fan.
Storage Pool Information
The Storage Pool Information area contains the following fields:
· Pool ID—ID of the storage pool.
· Name—Name of the storage pool.
· Disk RPM—RPM of the disk in the storage pool.
· Disk Driver Type—Type of the disk in the storage pool.
· Utilization—Utilization of the storage pool.
· Total Size—Total space of the storage pool.
· Remaining Size—Remianting space of the storage pool.
· Operational Status—Operational status of the storage pool.
Virtual Storage Pool Information
The Virtual Storage Pool Information area contains the following fields:
· Pool ID—ID of the virtual storage pool.
· Name—Name of the virtual storage pool.
· Disk Driver Type—Type of the disk in the virtual storage pool.
· Raid Level—RAID level of the virtual storage pool.
· Disk RPM—RPM of the disk in the virtual storage pool.
· Utilization—Utilization of the virtual storage pool.
· Total Size—Total space of the virtual storage pool.
· Remaining Size—Remaining space of the virtual storage pool.
· Operational Status—Operational status of the virtual storage pool.
· Health Status—Health state of the virtual storage pool.
Storage Volume Information
The Storage Volume Information area contains the following fields:
· Device ID—ID of the storage volume.
· Block Size—Block size of the storage volume.
· Total Size—Total space of the storage volume.
· Comsumable Size—Available space of the storage volume.
· Raid Level—RAID level of the virtual storage volume.
· Operational Status—Operational status of the storage volume.
· Health Status—Health state of the storage volume.
FCPort Information
The FCPort Information area contains the following fields:
· Device ID—Device ID of the port.
· Port Number—Port number.
· Port Type—Type of the port.
· Link Technology—Link technology of the port.
· WWN—WWN information of the port.
· Bandwidth—Bandwidth of the port.
· Operational Status—Operational status of the port.
· Health Status—Health state of the port.
APM service report
The APM service report function is implemented through the report function of the IMC platform. The IMC platform generates realtime reports and scheduled reports based on report templates. Operators can use iAR to customize report templates or use report templates provided by IMC.
You can view all reports on the Report tab of the IMC platform. For information about using the report function, see H3C Intelligent Management Center v7.3 Enterprise and Standard Platform Administrator Guide.
This section describes realtime reports and scheduled reports generated through APM service report templates.
|
Name |
Realtime report |
Scheduled report |
|
Application health report |
Available |
Available |
|
Application available report |
Available |
Available |
Realtime reports
Operators can quickly visit APM realtime reports by clicking the Report tab of the IMC platform and specifying report-related parameters. Realtime reports can be exported to the RPT, PDF, XLS, RTF, or CSV format or printed in hard copy for archiving.
All APM report templates can generate realtime reports.
Application health reports
An application health report displays the Healthy state percentage of applications in a specific time range.
To view the application health report of an application:
1. Click the Report tab.
2. In the My Real Time Reports area, click Application Health Report.
The window for setting parameters opens.
3. Set the time range for the report:
¡ Begin time—Click the Begin time box and then select the start time in the YYYY-MM-DD hh:mm format in the calendar that opens.
¡ End time—Click the End time box and then select the end time in the YYYY-MM-DD hh:mm format in the calendar that opens.
4. Click OK.
Figure 148 shows the application health report of the application.
Figure 148 Application health report
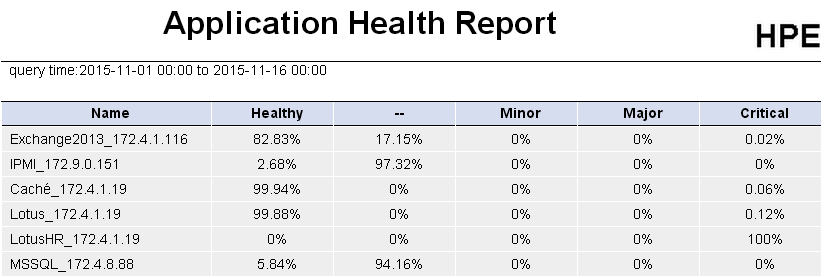
Application Health Report area fields:
· Query time—Time range of data statistics in the report.
· Name—Application monitor name. One application monitor corresponds to one application.
· Healthy—Healthy state time percentage of the application in the specified time range.
· Unknown (--)—Unknown state time percentage of the application in the specified time range.
· Minor—Minor state time percentage of the application in the specified time range.
· Major—Major state time percentage of the application in the specified time range.
· Critical—Critical state time percentage of the application in the specified time range.
Application available reports
An application available report displays the Available state percentage of applications in the specified time range.
To view the application available report:
1. Click the Report tab.
2. In the My Real Time Reports area, click Application Health Report.
The window for setting parameters opens.
3. Set the time range for the report:
¡ Begin time—Click the Begin time box and then select the start time in the YYYY-MM-DD hh:mm format in the calendar that opens.
¡ End time—Click the End time box and then select the end time in the YYYY-MM-DD hh:mm format in the calendar that opens. You can also enter the end time in the YYYY-MM-DD hh:mm format.
4. Click OK.
Figure 149 shows the application available report of the application.
Figure 149 Application available report
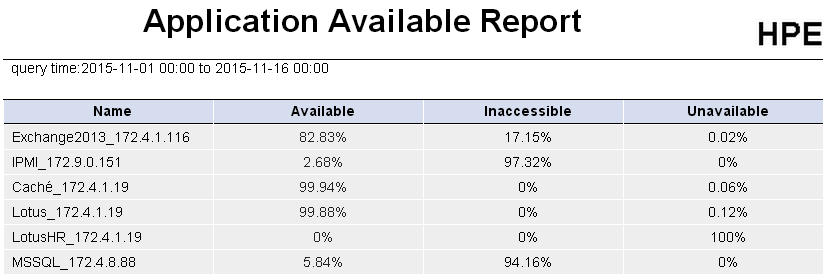
Application Available Report area fields:
· Query time—Time range of data statistics in the report.
· Name—Application monitor name. One application monitor corresponds to one application.
· Available—Available state time percentage of the application in the specified time range.
· Inaccessible—Inaccessible state time percentage of the application in the specified time range.
· Unavailable—Unavailable state time percentage of the application in the specified time range.
Scheduled reports
The IMC platform can generate the following scheduled reports:
· Daily reports
· Weekly reports
· Monthly reports
· Quarterly reports
· Half yearly reports
· Yearly reports
Operators can export the generated reports in the PDF, CSV, or XLS format and send them to the specified email boxes.
All APM report templates can generate scheduled reports. You can perform the same operations to add scheduled reports in different templates.
For information about contents in a scheduled report, see "Realtime reports."
Adding a scheduled report
1. Click the Report tab.
2. Open the Add Scheduled Report page by using one of the following methods:
¡ From the navigation tree, select Reports > Add Scheduled Report.
The page for adding scheduled reports is displayed.
¡ From the navigation tree, select Scheduled Reports > All Scheduled Reports, and then click Add on the All Scheduled Reports page.
The page for adding scheduled reports is displayed.
3. Select a report template:
a. Click Select on the right of the Template Name field.
The Query Template page opens.
b. Enter the complete or part of the template name in the template name field.
APM supports fuzzy searching for this field.
c. In the template query area, select Applications Manager Report for Type.
d. Click Query.
e. Select a template.
If the template is provided by APM, see Table 14.
f. Click OK.
The template name populates the template name area.
4. Enter the scheduled report name in the Scheduled Report Name field.
The default scheduled report name is the name of the used template.
5. Select the operator group authorized to view scheduled reports:
All operators in this group can view the scheduled report.
To view which operators are included in an operator group:
a. Click the Operator
Group Information icon ![]() .
.
The window that displays operator group information opens.
b. Select the target operator group from the Operator Group List area.
All operators included in the group are displayed in the Operators in Selected Groups area.
c. Click OK.
6. Specify the following parameters:
¡ Schedule Type—Select the schedule type. Options are Daily, Weekly, Monthly, Quarterly, Half yearly, and Yearly.
¡ Report Start Date—Click the Report Start Date box and then select the start date in the YYYY-MM-DD format in the calendar that opens.
The IMC platform generates a scheduled report at 04:00 the day next to the start day. The scheduled report contains data between the start day and 00:00 the day next to the start day.
¡ If you select the Daily schedule type, reports of the previous day are generated every day. For example, if you set the report start date to 2011-08-10, the first daily report is generated at 04:00 on 08, 11, 2011, and the data in the report is the data collected till 00:00 on the day that the report was generated.
¡ If you select the Weekly schedule type, reports of the previous seven days are generated every seven days. For example, if you set the report start date to 2011-08-10, the first weekly report is generated at 04:00 on 08, 17, 2011, and the data from 08, 10, 2011 to 08, 16, 2011 is displayed in the report.
¡ If you select the Monthly schedule type, reports of the previous month are generated every month. For example, if you set the report start date to 2011-08-10, the first monthly report is generated at 04:00 on 09, 10, 2011, and the data collected till 00:00 on the day that the report was generated is displayed in the report.
¡ If you select the Quarterly schedule type, reports of the previous three months are generated every three months. For example, if you set the report start date to 2011-08-10, the first quarterly report is generated at 04:00 on 11, 10, 2011, and the data collected till 00:00 on the day that the report was generated is displayed in the report.
¡ If you select the Half Yearly schedule type, reports of the last half year are generated every half year. For example, if you set the report start date to 2011-08-10, the first half yearly report is generated at 04:00 on 02, 10, 2012, and the data collected till 00:00 on the day that the report was generated is displayed in the report.
¡ If you select the Yearly schedule type, reports of the last year are generated every year. For example, if you set the report start date to 2011-08-10, the first yearly report is generated at 04:00 on 08, 10, 2012, and the data collected till 00:00 on the day that the report was generated is displayed in the report.
7. (Optional.) Set the time when a report becomes invalid. Then, IMC platform does not generate any scheduled report.
Click the End by box and then set the invalid time in the YYYY-MM-DD hh:mm format in the calendar that opens.
8. From the Report File Format list, select a report file format. Options are PDF, CSV, MSExcel, and MSExcel (Data-only).
9. (Optional.) Set to send a report by Email:
Select Send by Email, and enter the email address of the receiver. Reports can be sent to one email address.
10. Set query start time and end time:
a. Click the Set Parameter icon ![]() for the start time.
for the start time.
b. Select the start time for each schedule type from the schedule parameter list:
- Daily—Options are Begin time, One hour after begin time through Twenty-three hours after begin time, and End time.
- Weekly—Options are Begin time, One day after begin time through Six days after begin time, and End time.
- Monthly—Options are Begin time, One day after begin time through Thirty days after begin time, and End time.
- Quarterly—Options are Begin time, One month after begin time, Two months after begin time, and End time.
- Half Yearly—Options are Begin time, One month after begin time, Five months after begin time, and End time.
- Yearly—Options are Begin time, One month after begin time, Eleven months after begin time, and End time.
c. Click OK to return to the page for adding a report.
The Set Parameter icon changes from ![]() to
to ![]() .
.
d. Click the Set Parameter
icon ![]() for the end time.
for the end time.
e. Select the end time for each schedule type from the schedule parameter list:
- Daily—Options are Begin time, One hour after begin time through Twenty-three hours after begin time, and End time.
- Weekly—Options are Begin time, One day after begin time through Six days after begin time, and End time.
- Monthly—Options are Begin time, One day after begin time through Thirty days after begin time, and End time.
- Quarterly—Options are Begin time, One month after begin time, Two months after begin time, and End time.
- Half Yearly—Options are Begin time, One month after begin time, Five months after begin time, and End time.
- Yearly—Options are Begin time, One month after begin time, Eleven months after begin time, and End time.
f. Click OK to return to the page for adding a report.
The Set Parameter icon changes from ![]() to
to ![]() . The
end time must be later than the begin time.
. The
end time must be later than the begin time.
11. Click OK.
Configuration examples
The chapter provides two configuration examples for using APM to monitor applications on a network:
· In configuration example 1, a small Internet data center website is deployed with Linux, Apache, MySQL, and PHP servers. Users can access the WWW service at the website.
· In configuration example 2, a corporate data center is deployed to use Microsoft technologies including DNS, IIS, Active Directory, Exchange, .NET, and SQL Server. Users can access the file server, receive and send emails, and use the OA system.
Configuration example 1
In this example, a website with the domain name www.apm-test.com is deployed with Linux, Apache, MySQL, and PHP servers.
Network diagram
See Figure 150.

This network comprises the following devices (all hosts are running Linux):
· DNS—DNS server used to resolve the domain name apm-test.com. It is deployed with BIND v9 and supports round robin load balancing.
· Web1/Web2—Web servers that provide web services.
· MySQL-M/MySQL-S—Database servers deployed with MySQL. The replication function is enabled for MySQL. MySQL-M is the primary server. MySQL-S is the secondary server and it backs up the data and uploads the backup data to the FTP server every day.
· FTP—FTP server deployed VSFTP. It receives backup data from MySQL-S every day.
· SW1—Layer 3 switch that provides network access services and performs access control for all servers.
Administrators required for the network include:
· Administrator A—Performs routine network maintenance. As a member of the operator group Administrator Group, administrator A has the Admin privilege and manages all servers, network devices, BIND, and VSFTP.
· Administrator B—Updates and publishes web pages. As a member of the operator group Web Group, administrator B has the maintainer privilege and manages Web 1, Web 2, Apache, and PHP.
· Administrator C—Performs routine database maintenance and optimization. As a member of the operator group DB Group, administrator B has the maintainer privilege and manages MySQL-M, MySQL-S, and MySQL.
· Administrator D—Monitors services 24 hours a day, 7 days a week. As a member of the operator group 7*24 Monitor Group, administrator D has the viewer privilege.
Configuration consideration
You can configure APM to monitor the following applications in the network:
· Linux applications on the six Linux servers. Before you add a Linux monitor, you must create an administrator account that allows SSH login to the Linux server.
· Apache applications on Web 1 and Web 2. Before you add an Apache server monitor, you must modify the Apache configuration file.
· MySQL applications on MySQL-M and MySQL-S. Before you add a MySQL monitor, you must create an administrator account that allows remote login to the MySQL server.
· PHP applications on Web 1 and Web 2.
· DNS service application on the DNS server. The DNS server needs to resolve the domain name www.apm-test.com.
· FTP application on the FTP server. Before you add an FTP monitor, you must create an FTP account that allows login to the FTP server.
In addition, you can add the following application monitors for better network management:
· Directory monitor—Monitors the server directories used to save backup files and helps prevent backup file upload failures due to disk space insufficiency.
· Database query monitor—You can add database query monitors for critical databases to detect query slowdown.
· URL monitor—You can add URL application monitors to monitor critical pages, such as the home page http://www.apm-test.com/index.html and the user login page http://www.apm-test.com/user/login.php.
Configuration procedure
1. Configure the Apache server. For more information, see "Web service monitor."
2. Create a server administrator account, a MySQL account, and an FTP account:
¡ Linux username/password—root/apm123
¡ MySQL username/password—apmtest/apm123
¡ FTP username/password—apm/apm123
3. Add the switch and the servers to the IMC platform. You can view detailed information about the switch and servers on the IMC platform.
4. Add the following application monitors:
¡ Linux monitor.
¡ Apache server monitor.
¡ MySQL monitor.
¡ PHP monitor.
¡ DNS monitor.
¡ FTP monitor.
¡ Directory monitor.
¡ Database query monitor.
¡ URL monitor.
5. Add application groups as shown in Table 15.
|
Application group |
Application |
Operator group |
Privilege |
|
Group A |
· All Linux applications · BIND · VSFTP |
Administrator Group |
ADMIN |
|
Group B |
· Apache servers on Web 1 and Web 2 · PHP application on Web 1 and Web 2 · Linux servers on Web 1 and Web 2 |
Web Group |
Maintainer |
|
Group C |
· MySQL on MySQL-M and MySQL-S · Linux servers on MySQL-M and MySQL-S |
DB Group |
Maintainer |
|
Group D |
All applications |
7*24 Monitor Group |
Viewer |
6. An operator of the 7*24 Monitor Group can view the application topology after logging in to IMC. See Figure 151.
Figure 151 Application topology
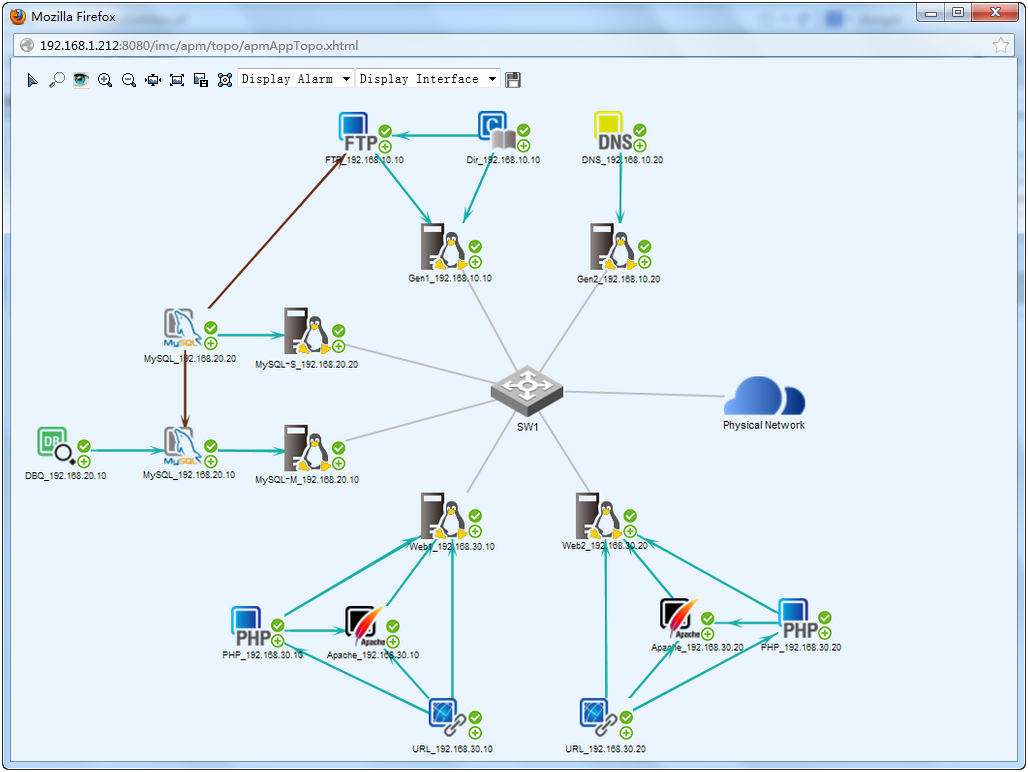
Table 16 Application topology
|
Server |
Application monitor |
Application type |
Dependency |
|
FTP |
Gen1_192.168.10.10 |
Linux |
None |
|
FTP_192.168.10.10 |
FTP service |
Depends on Linux |
|
|
Dir_192.168.10.10 |
Directory |
Depends on: · Linux · FTP |
|
|
DNS |
Gen2_192.168.10.20 |
Linux |
None |
|
DNS_192.168.10.20 |
DNS service |
Depends on Linux |
|
|
MySQL-M |
MySQL-M_192.168.20.10 |
Linux |
None |
|
MySQL_192.168.20.10 |
MySQL |
Depends on Linux |
|
|
DBQ_192.168.20.10 |
Database query |
Depends on: · Linux · FTP · MySQL (primary) |
|
|
MySQL-S |
MySQL-S_192.168.20.10 |
Linux |
None |
|
MySQL_192.168.20.10 |
MySQL |
Depends on: · Linux · MySQL (secondary) · FTP |
|
|
Web1 |
Web1_192.168.30.10 |
Linux |
None |
|
Apache_192.168.30.10 |
Apache server |
Depends on Linux |
|
|
PHP_192.168.30.10 |
PHP |
Depends on: · Linux · Apache server |
|
|
URL_192.168.30.10 |
URL |
Depends on: · Linux · Apache server · PHP |
|
|
Web2 |
Web1_192.168.30.20 |
Linux |
None |
|
Apache_192.168.30.20 |
Apache server |
Depends on Linux |
|
|
PHP_192.168.30.20 |
PHP |
Depends on: · Linux · Apache server |
|
|
URL_192.168.30.20 |
URL |
Depends on: · Linux · Apache server · PHP |
|
|
Note: All Linux servers are connected to the network through the Layer 3 switch SW1. |
|||
7. View the application monitoring reports.
On the topology, an operator can view the monitoring reports of the applications through the right-click menus.
Configuration example 2
In this example, a company has a data center that uses Microsoft technologies and uses file, email, and OA servers to provide IT services. All PCs in the company belong to domain apm-test.com.
Network diagram
See Figure 152.
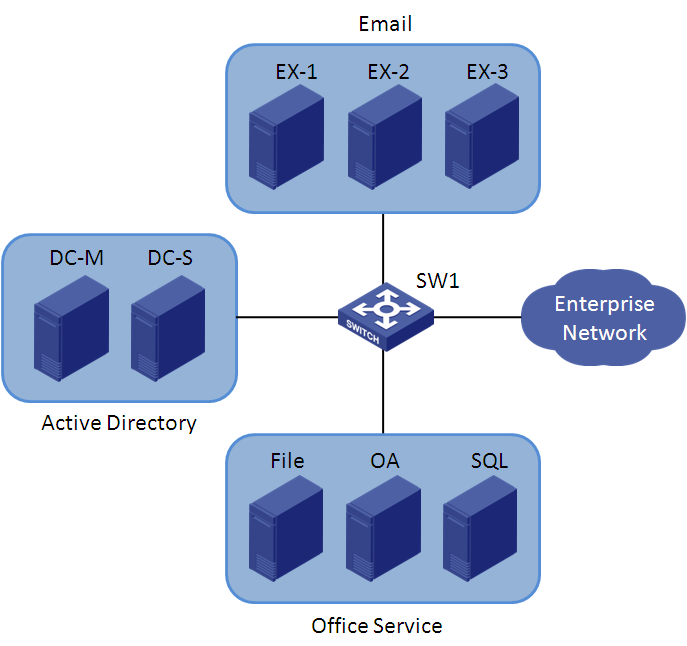
This network comprises the following devices (all hosts are running Windows Server 2003):
· DC-M/DC-S—Primary and secondary DCs in domain apm-test.com. DNS service is integrated on DC-M.
· EX-1/EX-2/EX-3—Mail servers running Exchange Server 2007. EX-1 and EX-2 belong to domain apm-test.com. EX-3 does not belong to any domain.
¡ EX-1—Deployed with the hub transport role, client access role, and mailbox role.
¡ EX-2—Deployed with the unified messaging server role.
¡ EX-3—Deployed with the edge transport server role.
· File—File server in domain apm-test.com, provides file services for the R&D, Sales, and Finance departments.
· OA—OA server in domain apm-test.com, developed by using the .NET technology and released through IIS.
· SQL—Database server used to provide database support for the OA system. It is running SQL Server 2005 and belongs to domain apm-test.com.
· SW1—Layer 3 switch that provides network access services and performs access control for all servers.
Administrators required for the network include:
· Administrator A—Performs routine network maintenance. As a member of the operator group Administrator Group, administrator A has the Admin privilege and manages all servers and network devices.
· Administrator B—Manages DCs DC-M and DC-S. As a member of the operator group DC Group, administrator B has the maintainer privilege.
· Administrator C—Manages mail servers EX-1, EX-2, and EX-3. As a member of the operator group Email Group, administrator C has the maintainer privilege.
· Administrator D—Responsible for office service management and maintenance. As a member of the operator group Office Group, administrator D has the maintainer privilege and manages servers File, OA, and SQL Server.
Configuration consideration
You can configure APM to monitor the following applications in the network:
· Windows Server applications on the eight hosts. Before you add a Windows Server monitor, you must enable the WMI feature for Windows Server and create an administrator account for the server.
· Active Directory applications on DCs DC-M and DC-S and DNS service application integrated on the primary DC DC-M. The DNS server needs to resolve the DC domain name dc-m.apm-test.com and the web client domain name mail.apm-test.com.
· Exchange Server 2007 applications on EX-1, EX-2, and EX-3, and IIS server and .NET server applications on EX-1. When you add an Exchange Server 2007 monitor, note that the services to be monitored are different for different roles.
· Directories for the three departments on File. The monitors monitor the directories to help prevent disk space insufficiency.
· IIS server and .NET server applications on OA.
· SQL Server on SQL.
Configuration procedure
1. Add the switch and the servers to the IMC platform. You can view detailed information about the switch and servers on the IMC platform.
2. Add the following application monitors:
¡ Windows Server monitor.
¡ Active Directory monitor.
¡ DNS monitor.
¡ Exchange Server 2007 monitor.
¡ IIS server monitor.
¡ .NET server monitor.
¡ Directory monitor.
¡ SQL Server monitor.
3. Add application groups as shown in Table 17.
|
Application group |
Application |
Operator group |
Privilege |
|
Group A |
All Windows Server applications |
Administrator Group |
ADMIN |
|
Group B |
· Active Directory on DC-M and DC-S · Windows Server on DC-M and DC-S · DNS on DC-M |
DC Group |
Maintainer |
|
Group C |
· Exchange Server 2007 on EX-1, EX-2, and EX-3 · IIS server on EX-1 · .NET server on EX-1 · Windows Server on EX-1, EX-2, and EX-3 |
Email Group |
Maintainer |
|
Group D |
· Three directories on File · SQL Server on SQL · IIS server on OA · .NET server on OA |
Office Group |
Maintainer |
4. An operator of the Administrator Group can view the application topology after logging in to IMC. See Figure 153.
Figure 153 Application topology
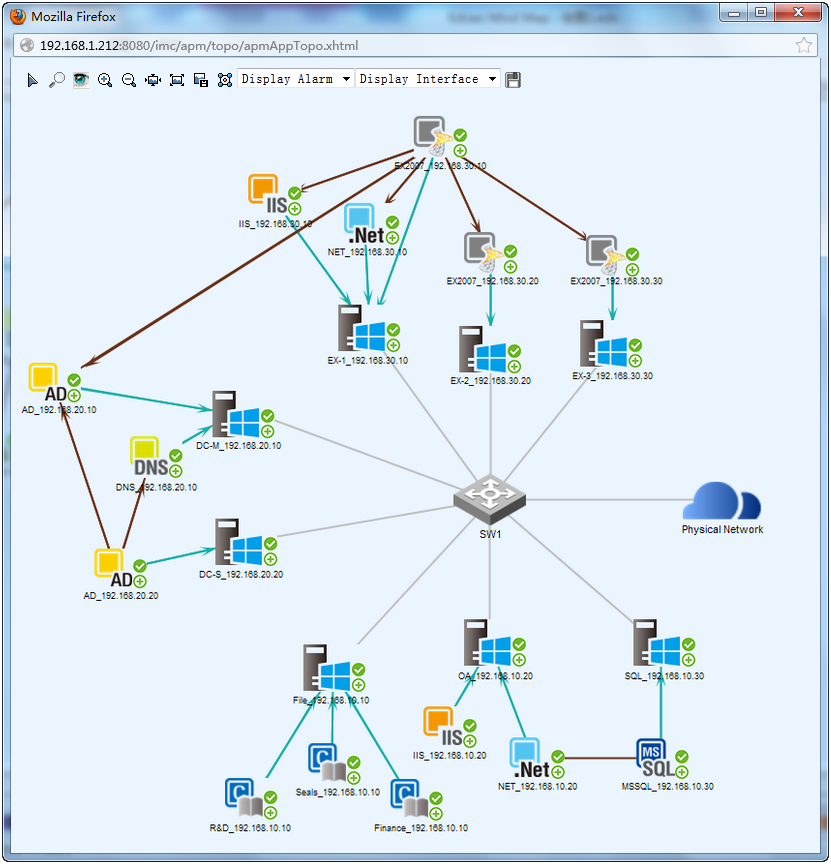
Table 18 Application topology
|
Server |
Application monitor |
Application type |
Dependency |
|
EX-1 |
EX1_192.168.30.10 |
Windows Server |
None |
|
IIS_192.168.30.10 |
IIS server |
Depends on Windows Server |
|
|
NET_192.168.30.10 |
.NET server |
Depends on Windows Server |
|
|
EX2007_192.168.30.10 |
Exchange Server 2007 |
Depends on: · Windows Server · IIS server · .NET server · Active Directory · Exchange Server 2007 (unified messaging) · Exchange Server 2007 (edge transport) |
|
|
EX-2 |
EX2_192.168.30.20 |
Windows Server |
None |
|
EX2007_192.168.30.20 |
Exchange Server 2007 |
Depends on Windows Server |
|
|
EX-3 |
EX2_192.168.30.30 |
Windows Server |
None |
|
EX2007_192.168.30.30 |
Exchange Server 2007 |
Depends on Windows Server |
|
|
DC-M |
DC-M_192.168.20.10 |
Windows Server |
None |
|
AD_192.168.20.10 |
Active Directory |
Depends on Windows Server |
|
|
DNS_192.168.20.10 |
DNS service |
Depends on Windows Server |
|
|
DC-S |
DC-S_192.168.20.20 |
Windows Server |
None |
|
AD_192.168.20.20 |
Active Directory |
Depends on: · Windows Server · DNS service · Active Directory (primary) |
|
|
File |
File_192.168.10.10 |
Windows Server |
None |
|
R&D_192.168.10.10 |
Directory |
Depends on Windows Server |
|
|
Sales_192.168.10.10 |
Directory |
Depends on Windows Server |
|
|
Finance_192.168.10.10 |
Directory |
Depends on Windows Server |
|
|
OA |
OA_192.168.10.20 |
Windows Server |
None |
|
IIS_192.168.10.20 |
IIS server |
Depends on Windows Server |
|
|
NET_192.168.10.20 |
.NET server |
Depends on: · Windows Server · SQL Server |
|
|
SQL |
SQL_192.168.10.30 |
Windows Server |
None |
|
MSSQL_192.168.10.30 |
SQL Server |
Depends on Windows Server |
|
|
Note: All Windows servers are connected to the network through the Layer 3 switch SW1. |
|||
5. View the application monitoring reports.
On the topology, an operator can view the monitoring reports of the applications through the right-click menus.
