- Released At: 04-09-2024
- Page Views:
- Downloads:
- Table of Contents
- Related Documents
-
NSM
Device Management Configuration Examples
Document version: 5W100-20240827
Copyright © 2024 New H3C Technologies Co., Ltd. All rights reserved.
No part of this manual may be reproduced or transmitted in any form or by any means without prior written consent of New H3C Technologies Co., Ltd.
Except for the trademarks of New H3C Technologies Co., Ltd., any trademarks that may be mentioned in this document are the property of their respective owners.
The information in this document is subject to change without notice.
Example: Configuring device management
Synchronize device information
Open the Web-based NMS of a device
Change an access parameter template
Introduction
The auto discovery feature helps detect devices on the network. The device view presents information about all network devices in the system, allowing users to quickly know their basic operating status. The resource details page displays comprehensive device information, including an overview, device details, alarm information, monitoring details, and group information. You can also perform configuration tasks, such as modifying device labels and access parameter templates.
Feature usage guide
Applicable scenarios
On the device view page, you can view the device status, device label, IP address, device category, and device model. The resource details page displays an overview, device details, alarm information, monitoring details, and group information. You can also modify basic device information and access parameter templates through the device details page.
On the auto discovery page, you can view the task name, task status, start date, and last execution time.
Prerequisites
· Log in to Unified Platform with an operator account with device management permissions. If the operator lacks the permission, navigate to the Role Management > Roles page in the left navigation tree under the System tab and assign permissions to the operator.
· The devices to be managed can communicate with the system.
· To read information from a device, configure a correct SNMP parameter template. To deploy configuration to a device, configure SSH or Telnet parameters on the device.
Example: Configuring device management
After you add a device to the system, you can monitor and configure the device.
Procedures
Add a network device
1. Log in to Unified Platform.
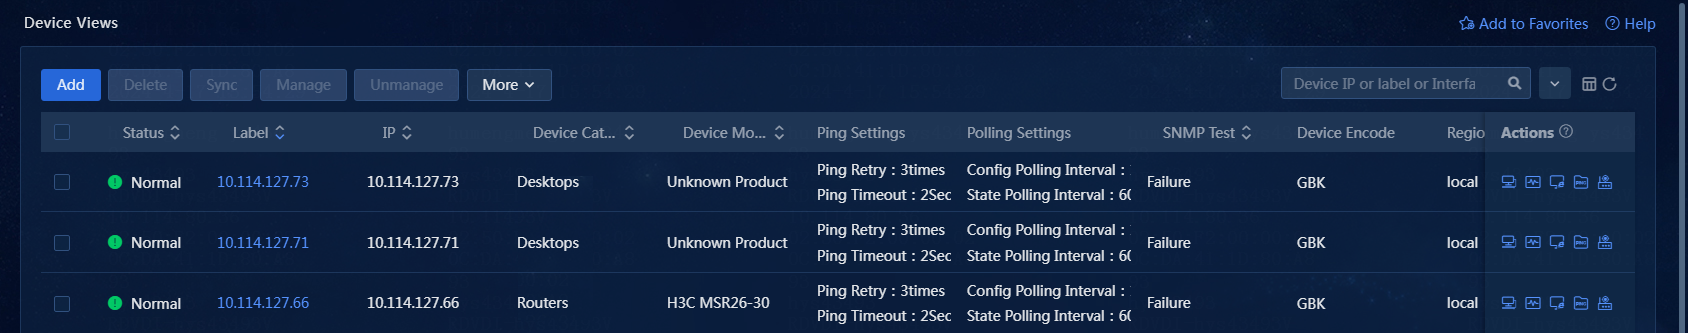
2. On the top navigation bar, click Management. From the left navigation pane, select Device Management > Device Views, as shown in Figure 1.
3. Click Add. The Add Device page opens, as shown in Figure 2.
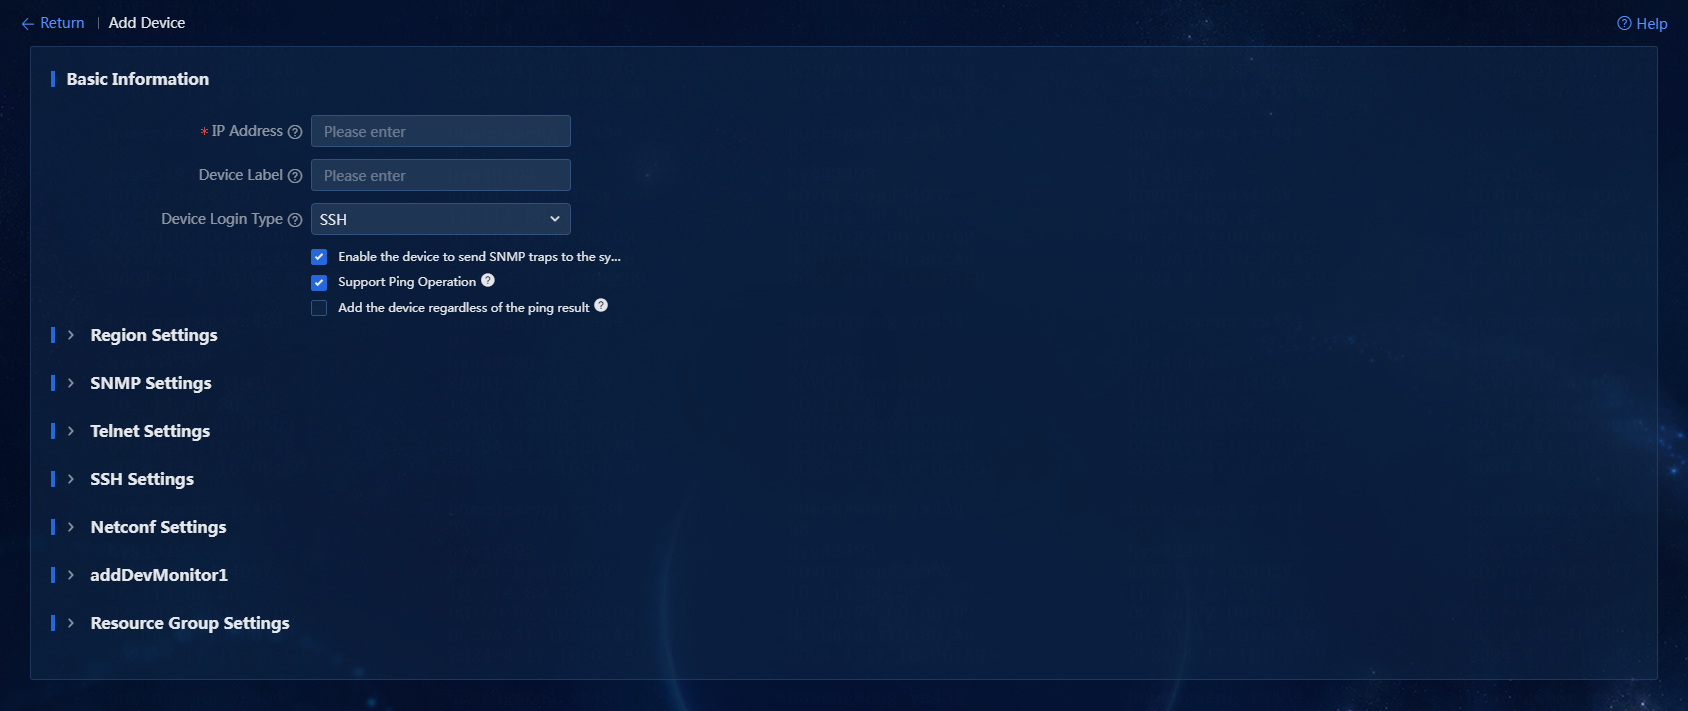
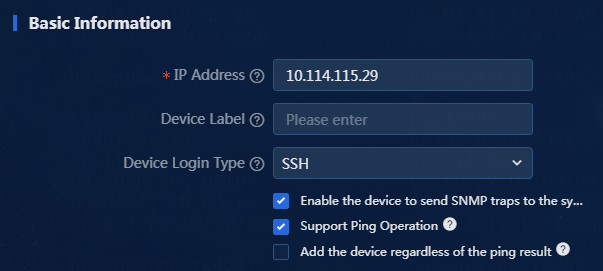
4. In the Basic Information area, specify the IP address, device label, and login type of the device, as shown in Figure 3.
¡ IP Address: Enter the IP address of the network device. An IPv4 address is in dotted decimal notation, and cannot be loopback address 127.0.0.1 or local domain name localhost. An IPv6 address is in colon hexadecimal notation. In this example, 192.167.1.120 is entered.
¡ Device Label: Enter the device label of the network device. If you do not enter a device label, the system reads the sysname as the device label. The device label can contain a maximum of 64 characters. If the entered device label is different from the sysname, the device can be managed successfully, and the entered device label is displayed on the page. In this example, no device label is entered.
¡ Device Login Type: Select a login type. Options include Telnet (default), SSH, and None. In this example, the default is used.
¡ Enable the device to send SNMP traps to the system: Select whether to have the device to send traps (SNMP notifications) to the system. In this example, this option is selected (the default).
¡ Support Ping Operation: Select whether to ping the device from the system before adding the device to the system. If the device cannot be pinged or does not support ping operations, it cannot be added to the system. If you do not select this option, the device is added to the system without being pinged. In this example, this option is selected (the default).
¡ Add the device regardless of the ping result: Select whether to add the device to the system even if it cannot be pinged. In this example, this option is not selected (the default).
Figure 3 Configuring basic information
5. Configure SNMP settings. Telnet, SSH, and NETCONF settings can be left blank. In this example, only SNMP settings are configured, and Telnet, SSH, and NETCONF settings are left blank.
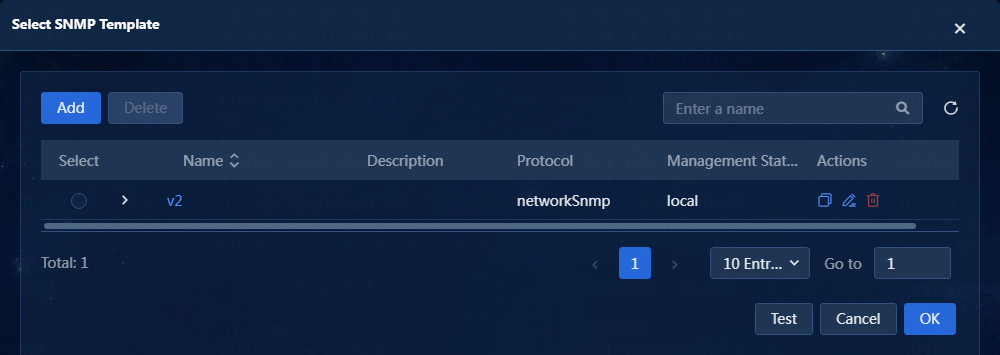
a. Click Select. The Select SNMP Template window opens, as shown in Figure 4.
Figure 4 Select SNMP Template window
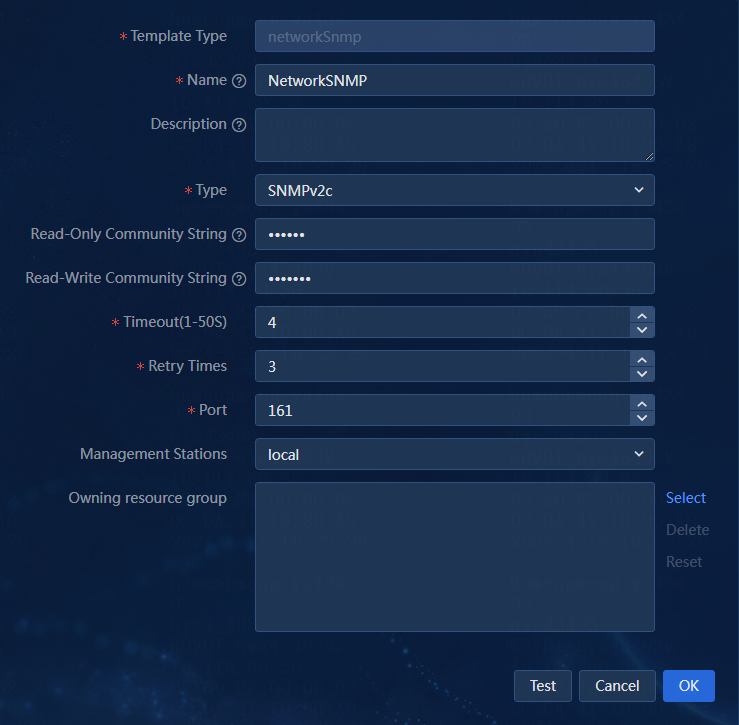
b. Select an existing template, or click Add to add a template and then select the new template. In this example, a new template is added and selected, as shown in Figure 5.
- Template Type: This parameter displays networkSnmp and is not configurable.
- Name: Enter a template name. The template name can contain a maximum of 50 characters. Valid characters include Chinese characters, letters, digits, spaces, underscores (_), hyphens (-), colons (:), and dots (.). In this example, the template name is NetworkSNMP.
- Description: Enter a description for the template, a string of up to 200 characters. In this example, this parameter is left blank.
- Type: Select a version for the SNMP template. The default version is SNMPv1. In this example, SNMPv2c is used. Most devices support SNMPv1, SNMPv2c, and SNMPv3. Support for the versions depends on the device model.
- Read-Only Community String: Communities with read-only permissions can only query devices. You must specify the read-only community string, the read-write community string, or both. You can modify the read-only community string based on the device type. The default is public. In this example, the default is used.
- Read-Write Community String: Communities with read/write permissions can configure devices. The default is private. In this example, the default is used.
- Timeout (1-50): Enter the maximum amount of time that the system can wait for a response from the device, in seconds. The default is 4 seconds. In this example, the default is used.
- Retry Times: Enter the maximum number of retries that can be performed by the system when a communication failure occurs with the device. The default is 3. In this example, the default is used.
- Port: Enter the port number used to log in to the device through SNMP. The default is 61.
- Management Station: Select a management station for the device. This parameter appears only if you have installed the Region component. By default, a device belongs to the local management station.
- Resource Group: Select a resource group. The SNMP template will inherit the permissions of the resource group. In this example, no resource group is selected.
Figure 5 Adding an SNMP template
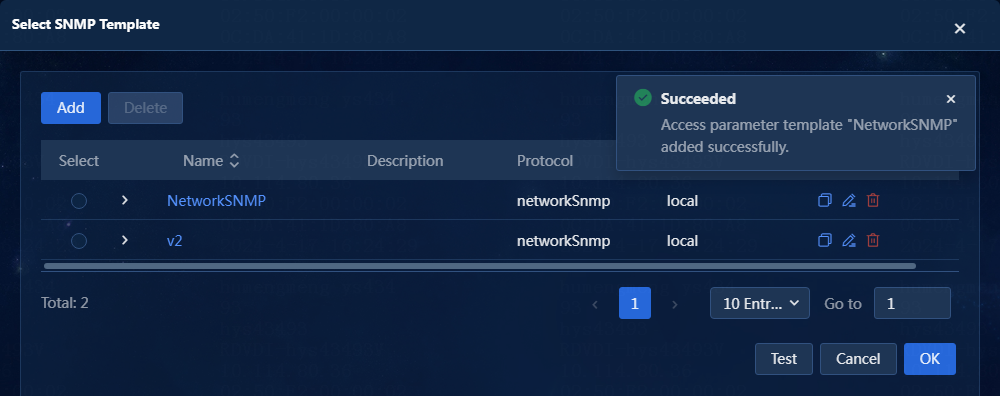
c. Click OK to add the SNMP template, as shown in Figure 6.
Figure 6 SNMP template successfully added
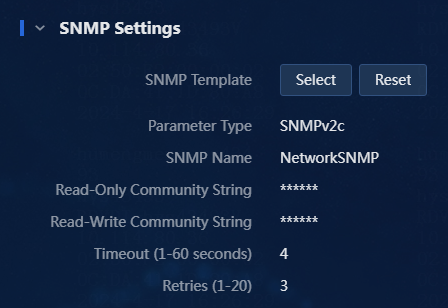
d. Select the new SNMP template, and click OK.
Figure 7 SNMP settings completed
6. Select monitor templates for the device.
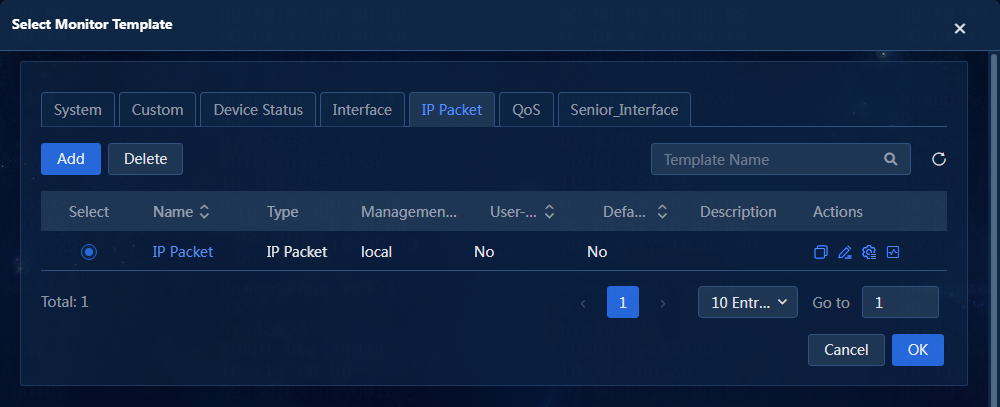
a. Click Select. On the Select Monitor Template window, you can select an existing template. If you do not select a template, the default template is used. You can set the default template on the Monitor > Monitor Options > Monitor Templates page. Alternatively, you can click Add to add a template and then select the new template. In this example, an existing template named IP Packet is selected.
Figure 8 Selecting a monitor template
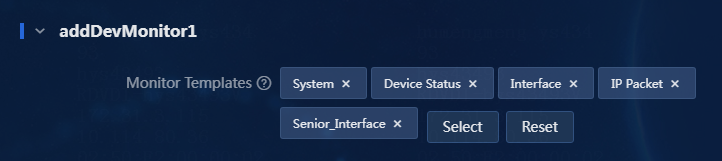
b. Click OK to return to the Add Device page, as shown in Figure 9. You can select a maximum of one template of each type.
Figure 9 Configuring monitor settings
7. Select a resource group for the device.
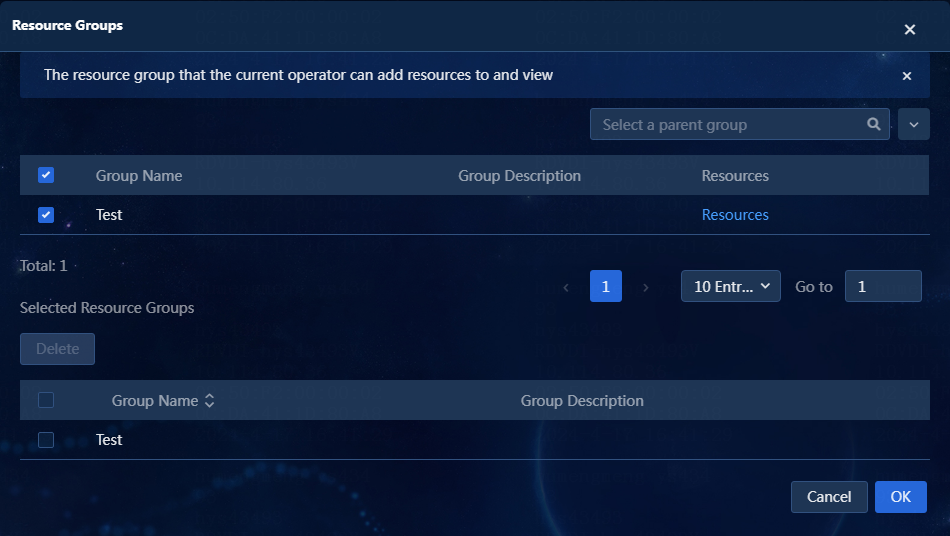
a. Click Select. On the window that opens, select a resource group. The device will inherit the permissions of the resource group. If no resource group is selected but the resource group permission is set for an operator, the operator cannot see the added device. You must assign the device to the resource group by using an administrator role. In this example, an existing resource group named Test is selected, as shown in Figure 10.
Figure 10 Selecting a resource group
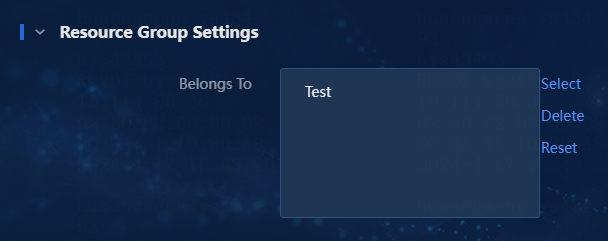
b. Click OK to return to the Add Device page, as shown in Figure 11. You can select more resource groups or delete selected resource groups.
Figure 11 Configuring resource groups
8. Select a management station for the device.
In this example, the Region component has been installed, but no lower-level sites are set up. The default local management station is used in this example, as shown in Figure 12.

9. Click OK to add the device. You can see the new device on the Device Views page, as shown in Figure 13.
Figure 13 Device added successfully
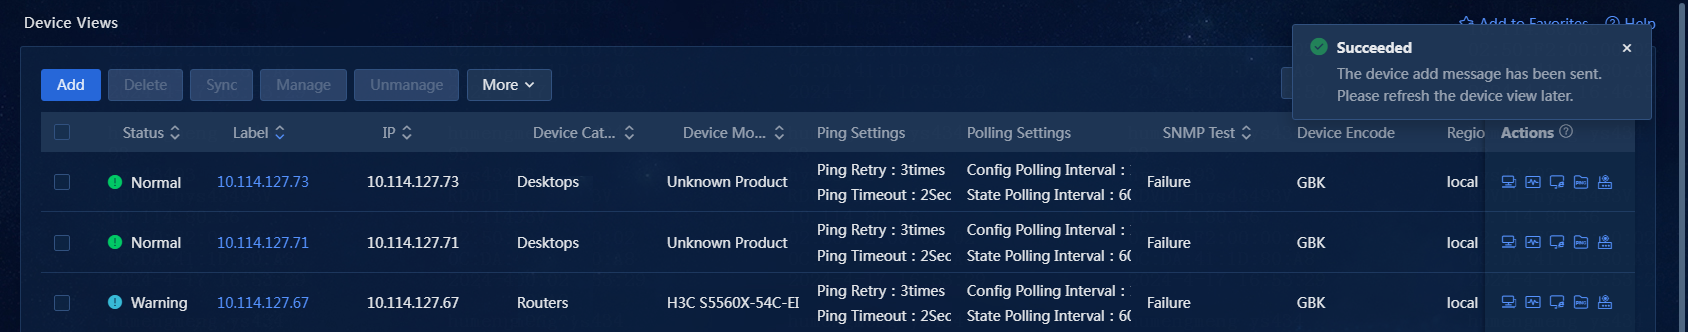
10. You can see the new device after you refresh the Device Views page, as shown in Figure 14.
Figure 14 Adding a network device

Automatic discovery tasks
This feature allows you to discover devices in the network. From this menu, you can view and maintain existing network discovery tasks and add network discovery tasks as needed.
If the system is installed with the Region component, you can filter discovery tasks by region.
To add an auto discovery task:
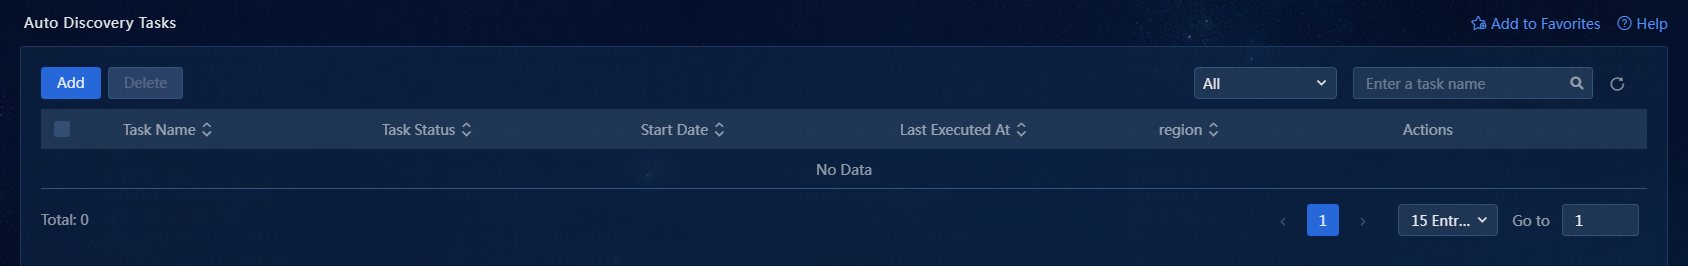
1. On the top navigation bar, click Management. From the left navigation pane, select Device Management > Automatic Discovery Tasks. The Automatic Discovery Tasks page opens, as shown in Figure 15.
Figure 15 Automatic discovery task list
2. Click Add. The Auto Discovery Task page opens.
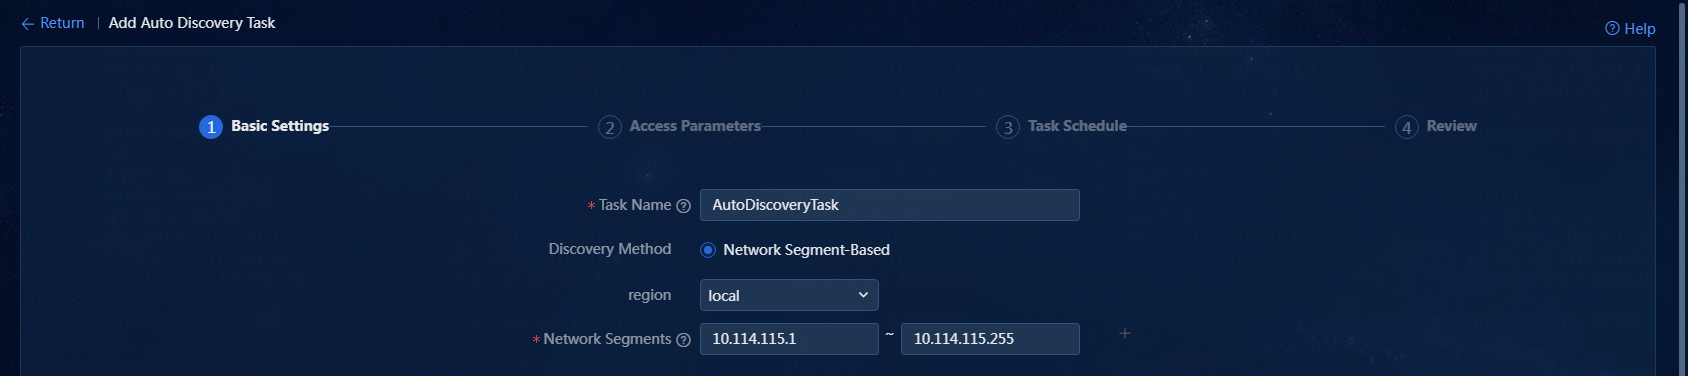
3. Configure the following basic settings:
¡ Task Name: Enter a task name. A maximum of 100 characters are allowed. In this example, AutoDiscoveryTask is entered.
¡ Discovery Method: Select a discovery method. Only the Network Segment-Based method is supported.
¡ Management Station: Select a management station for the task. This parameter appears only if you have installed the Region component. By default, a device belongs to the local management station. In this example, the default management station is selected.
¡ Network Segments: Enter network segments for auto discovery. Up to five autodiscovery network segments can be added, and the total IP addresses in the autodiscovery network segments cannot exceed 65535. In this example, one network segment (10.114.115.1-10.114.115.255) is entered, as shown in Figure 16.
4. After completing the configuration, click Next to access the Access Parameters page.
Figure 16 Configuring basic settings
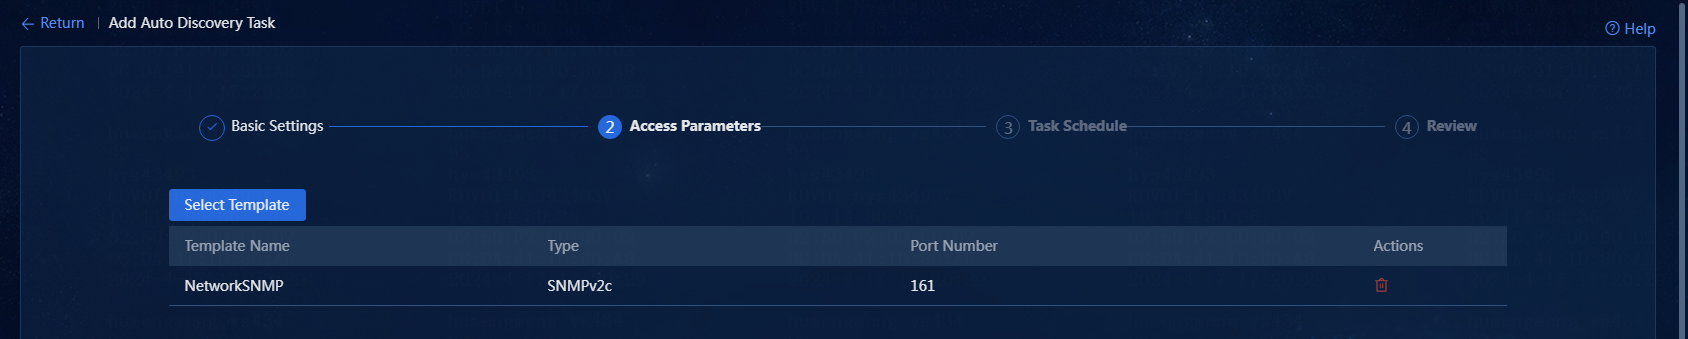
5. Configure access parameters: Add an SNMP template or select an existing SNMP template. Click Add. On the window that opens, you can select an existing SNMP template or add an SNMP template. In this example, an existing SNMP template named NetworkSNMP is selected.
6. Click OK. To return to the Add Auto Discovery Task page, as shown in Figure 17. Click Next to go to the Task Schedule page.
Figure 17 Configuring access parameters
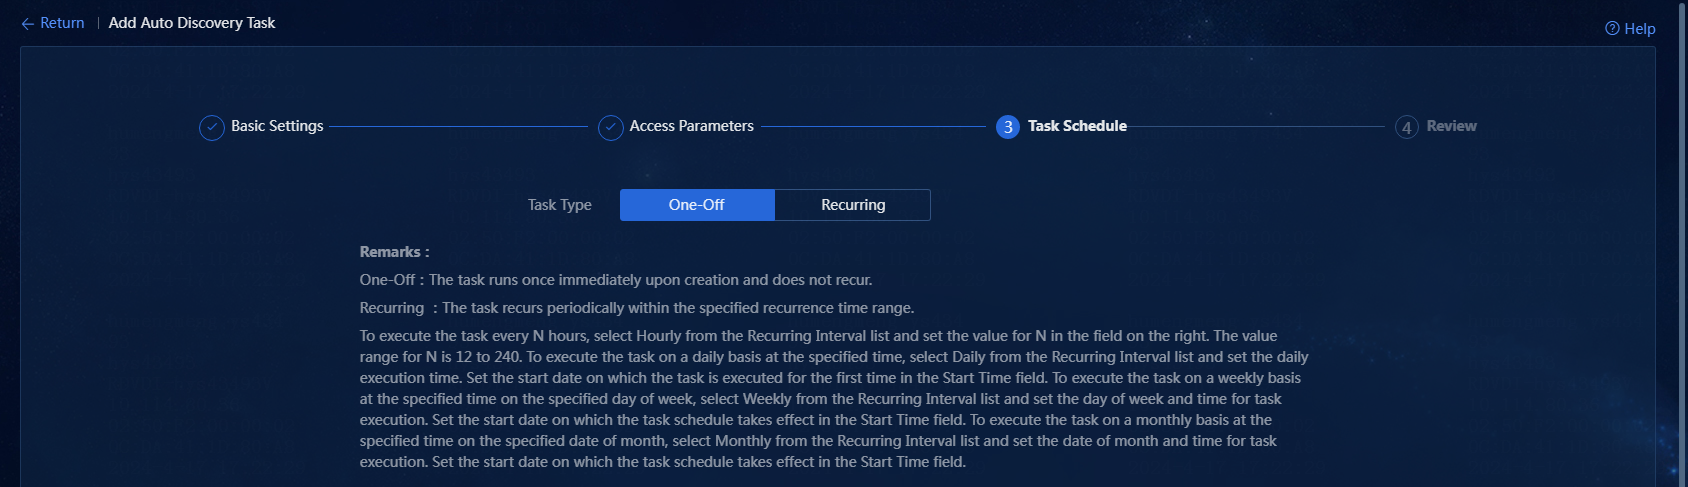
7. Select a task type. Options include One-Off and Recurring. In this example, One-Off is selected, as shown in Figure 18.
¡ One-Off: The task runs once immediately upon creation and does not recur.
¡ Recurring: The task recurs at the set recurring interval.
Figure 18 Selecting a task type
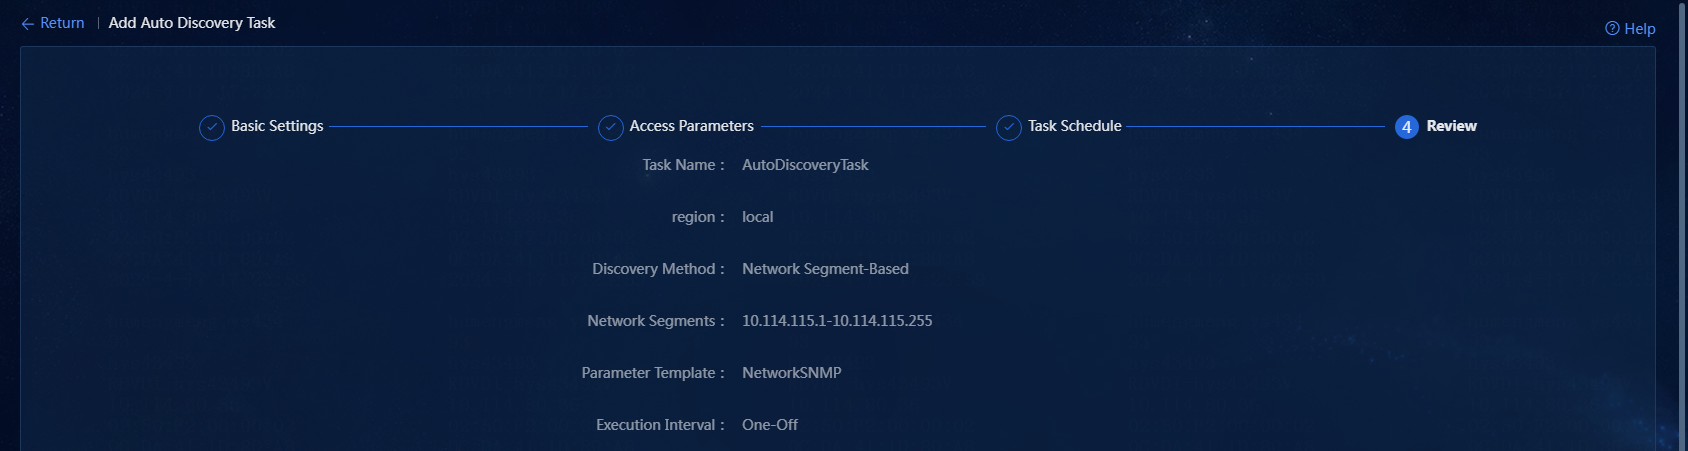
8. Confirm the configuration: Click Next to go to the Review page, as shown in Figure 19.
Figure 19 Confirming configuration
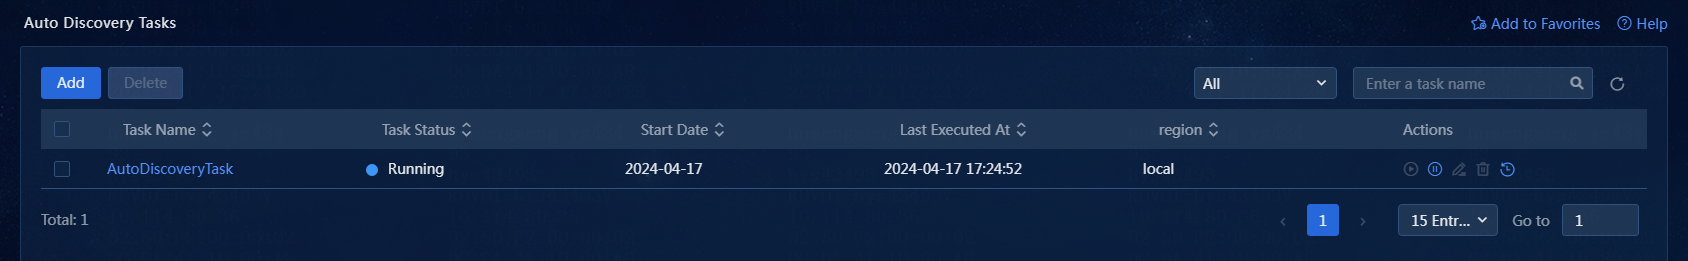
9. After confirming the configuration, click OK. The auto discovery task is added successfully, as shown in Figure 20.
Figure 20 Auto discovery task added successfully
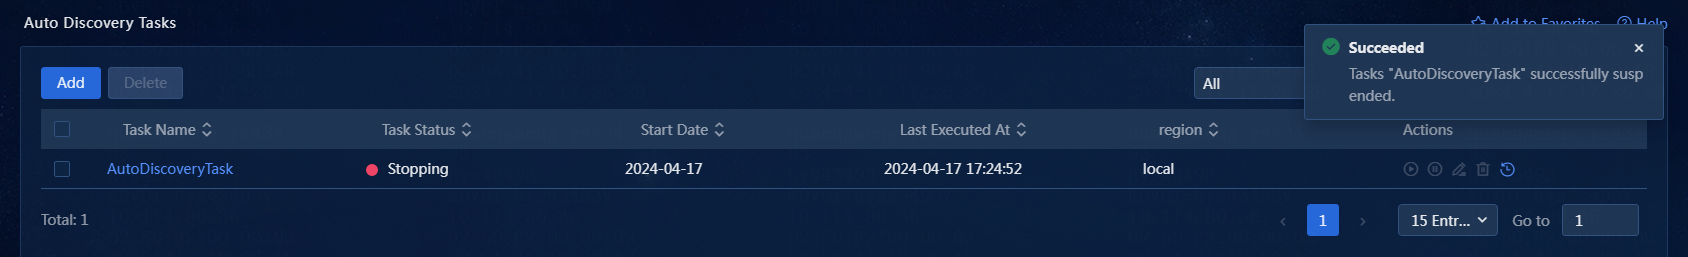
10. The auto discovery task list displays all auto discovery tasks. After the auto discovery task is stopped, it is displayed as shown in Figure 21.
Figure 21 Viewing discovery tasks
11. Click the ![]() icon in the Actions column for a task. The execution history page for
that task opens, as shown in Figure 22.
icon in the Actions column for a task. The execution history page for
that task opens, as shown in Figure 22.

12. Click an execution record ID or the ![]() icon
in the Actions column. The execution details page
for that record opens, as shown in Figure 23.
icon
in the Actions column. The execution details page
for that record opens, as shown in Figure 23.
Figure 23 Viewing the execution result

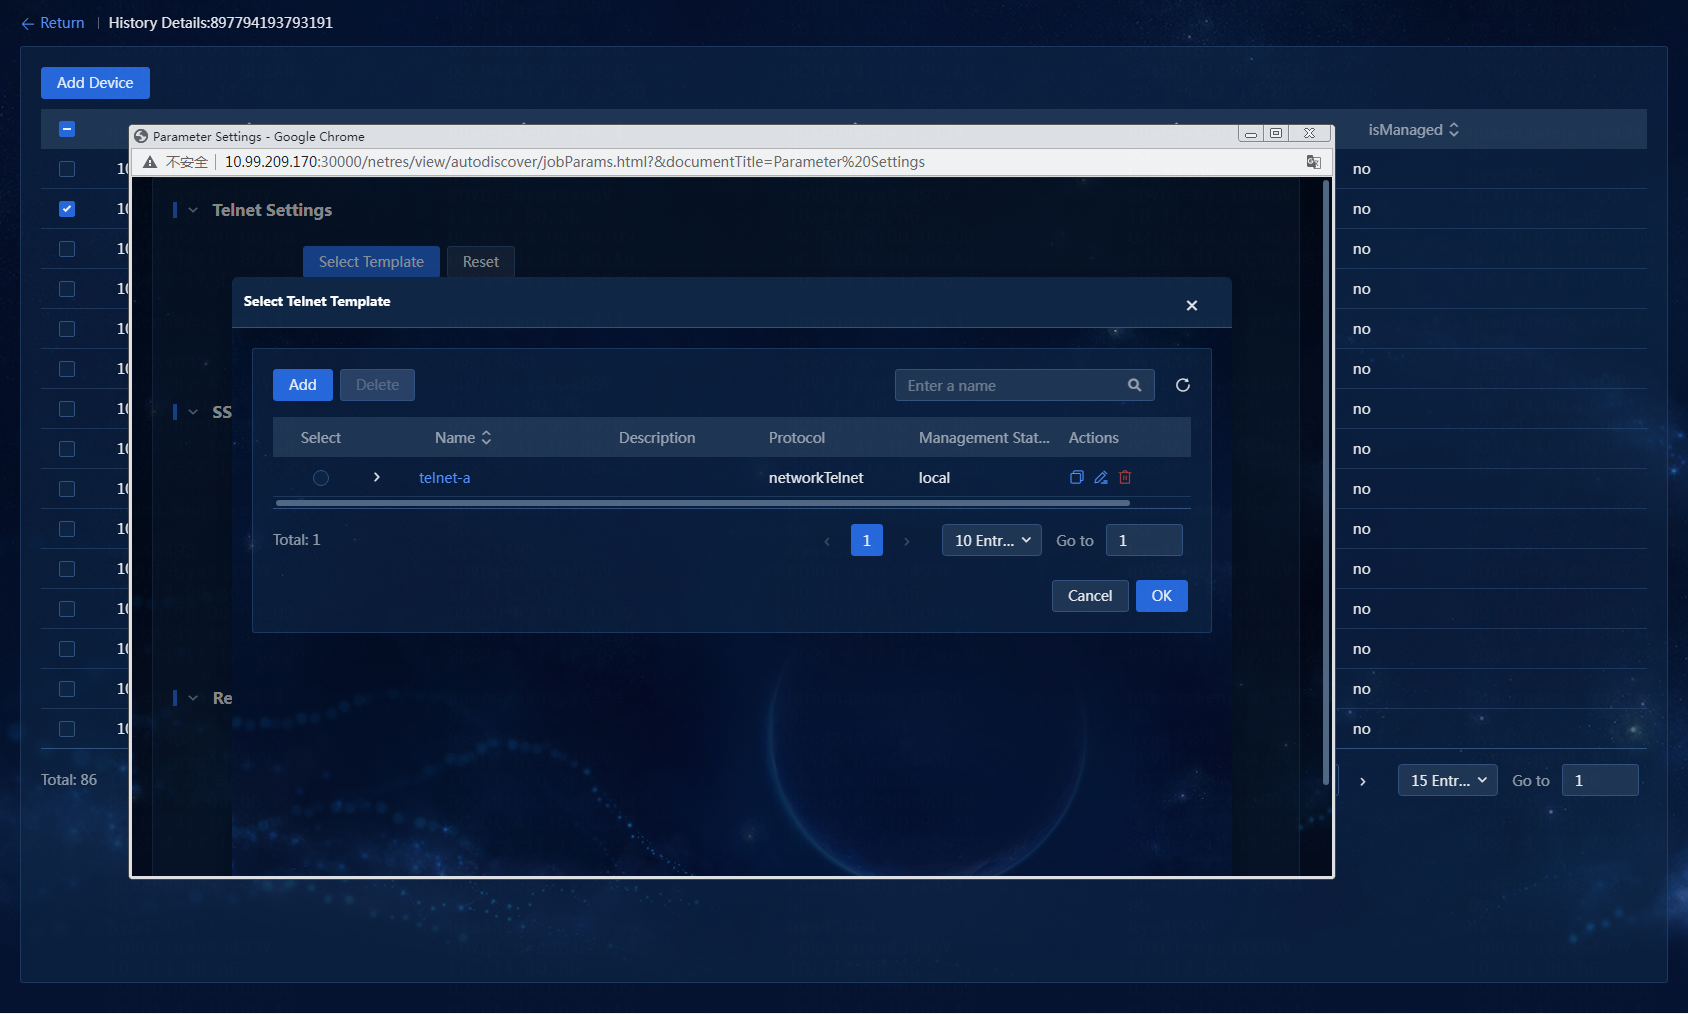
13. Select one or more discovered resources. In this example, one resource is selected. Click Add Device to add the device to the system. You can select an SSH template and a Telnet template when adding the device, as shown in Figure 24. In this example, an existing Telnet template is selected.
Figure 24 Selecting a Telnet template
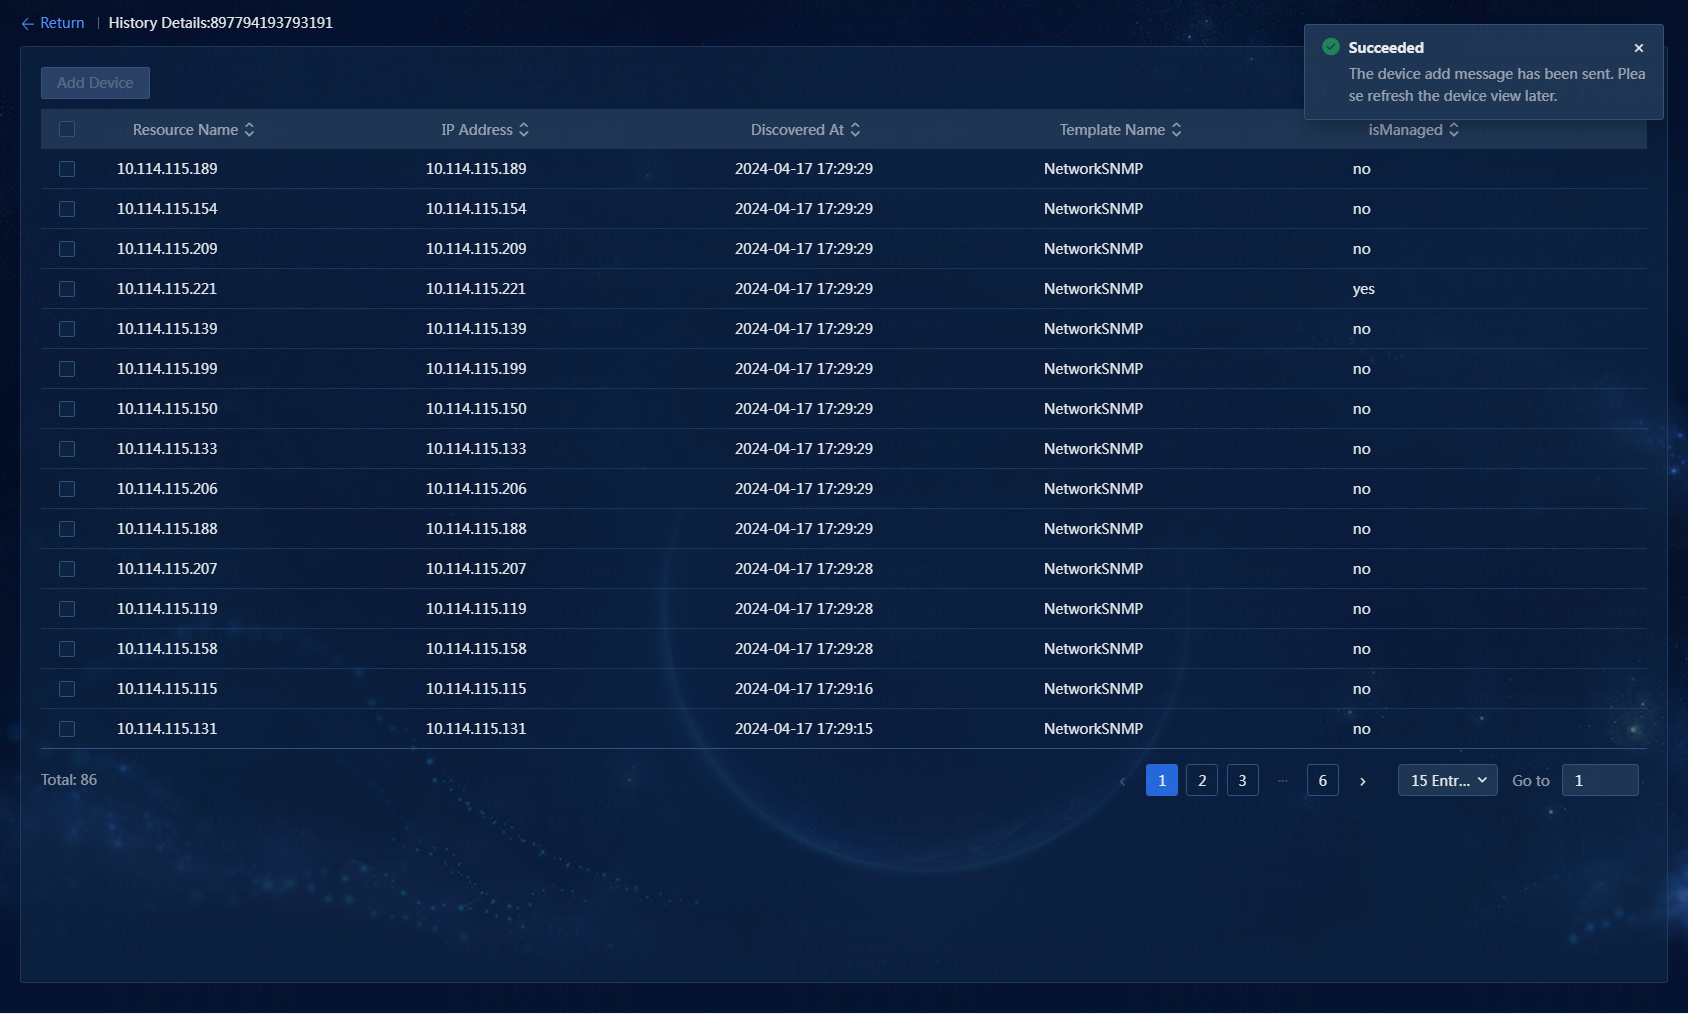
14. Click OK to add the device, as shown in Figure 25.
Figure 25 Device added successfully
15. Return to the Device Views page and view the added device, as shown in Figure 26.
Manage or unmanage devices
If you are not concerned with a specific device for a period of time, they can set the device to the unmanaged state. When you want to know information about the device again, you can set it to the managed state. After a device is set to the unmanaged state, the system will stop polling the device but you can still configure the device.
Unmanage devices on the Device Views page
Perform the following tasks:
1. On the top navigation bar, click Management. From the left navigation pane, select Device Management > Device Views.
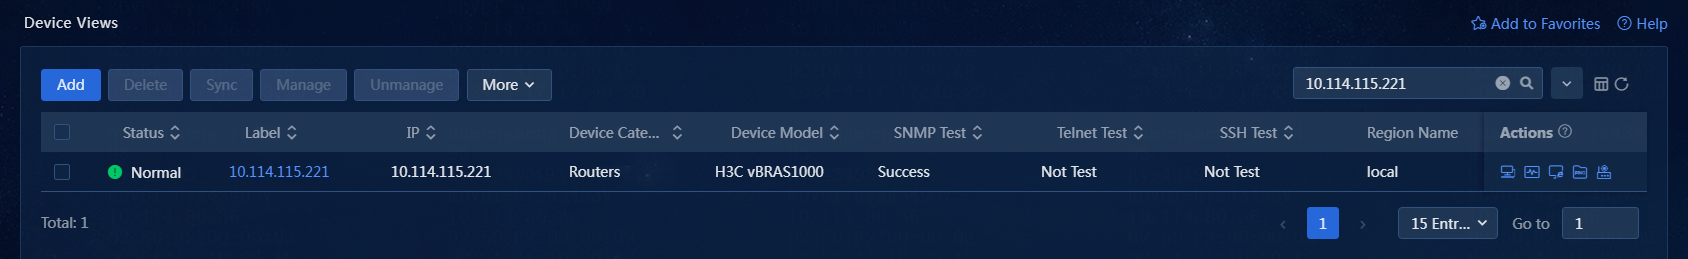
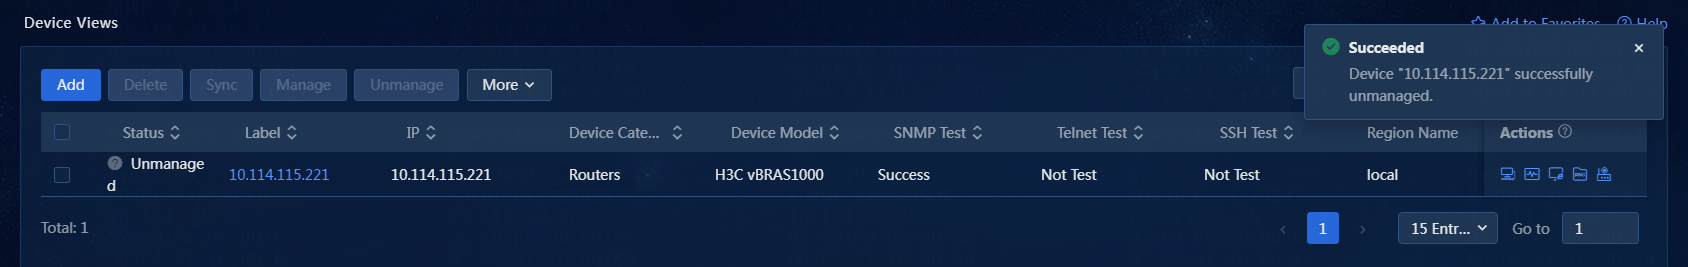
2. On the Device Views page, select one or more devices, and click Unmanage. The status for an unmanaged device is Unmanaged, and the icon for it on the network topology is grayed. The system no longer generated alarms for the device, but the active alarms and history alarms are retained, as shown in Figure 27.
Manage devices on the Device Views page
Perform the following tasks:
1. On the top navigation bar, click Management. From the left navigation pane, select Device Management > Device Views.
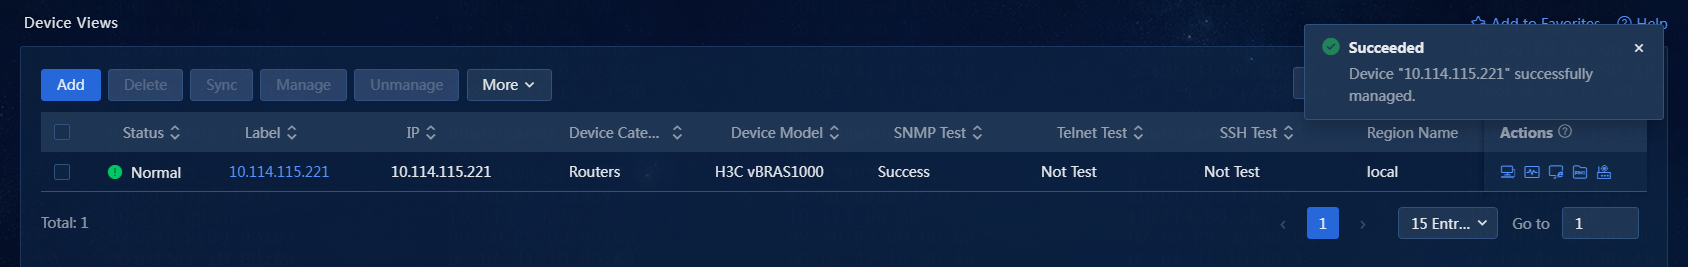
2. Select one or more devices, and click Manage. The system will immediately obtain the status information of the managed device. You can view the status information later by refreshing the page, as shown in Figure 28. On the network topology, the icon of the device is highlighted.
Manage or unmanage devices on the Device Details page
Perform the following tasks:
1. On the top navigation bar, click Management. From the left navigation pane, select Device Management > Device Views.
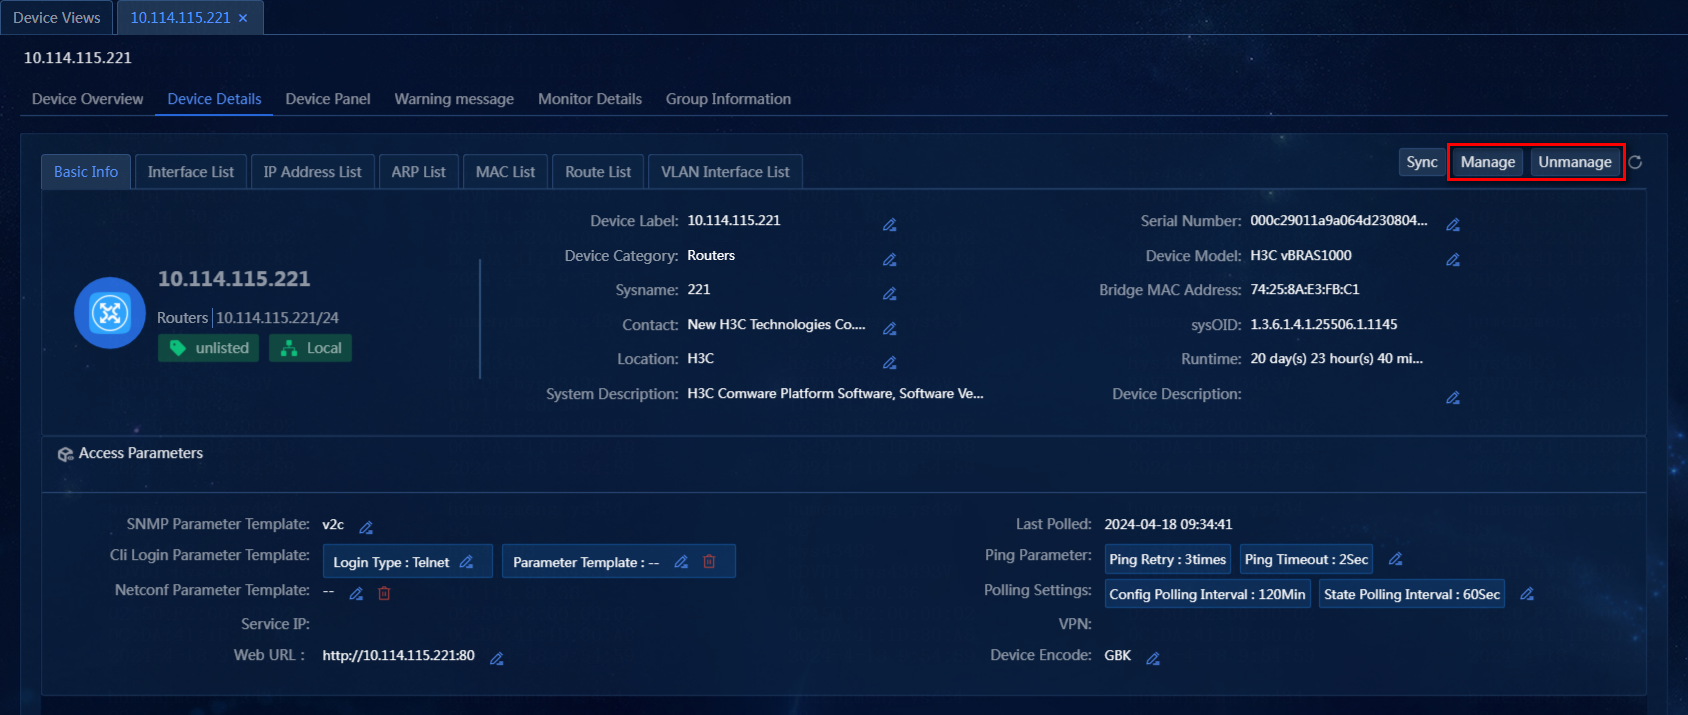
2. On the Device Views page, click the label of a device. Click the Device Details tab, and click Manage or Unmanage to manage or unmanage the device, as shown in Figure 29.
Figure 29 Managing or unmanaging devices
Synchronize device information
This feature can immediately reads the information of a device update it to the system. However, this process takes time.
Synchronize device information on the Device Views page
Perform the following tasks:
1. On the top navigation bar, click Management. From the left navigation pane, select Device Management > Device Views.
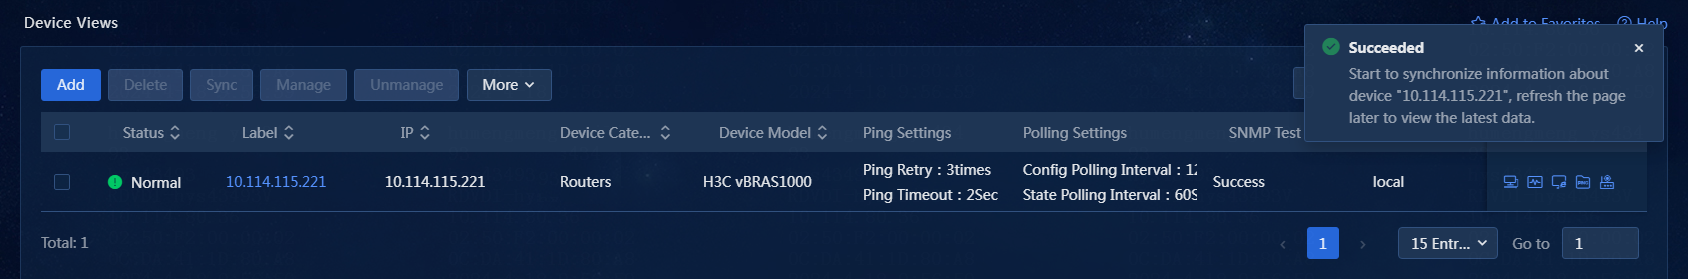
2. On the Device Views page, select one or more devices, and click Sync, as shown in Figure 30.
Figure 30 Synchronizing device information
Synchronize device information on the Device Details page
Perform the following tasks:
1. On the top navigation bar, click Management. From the left navigation pane, select Device Management > Device Views.
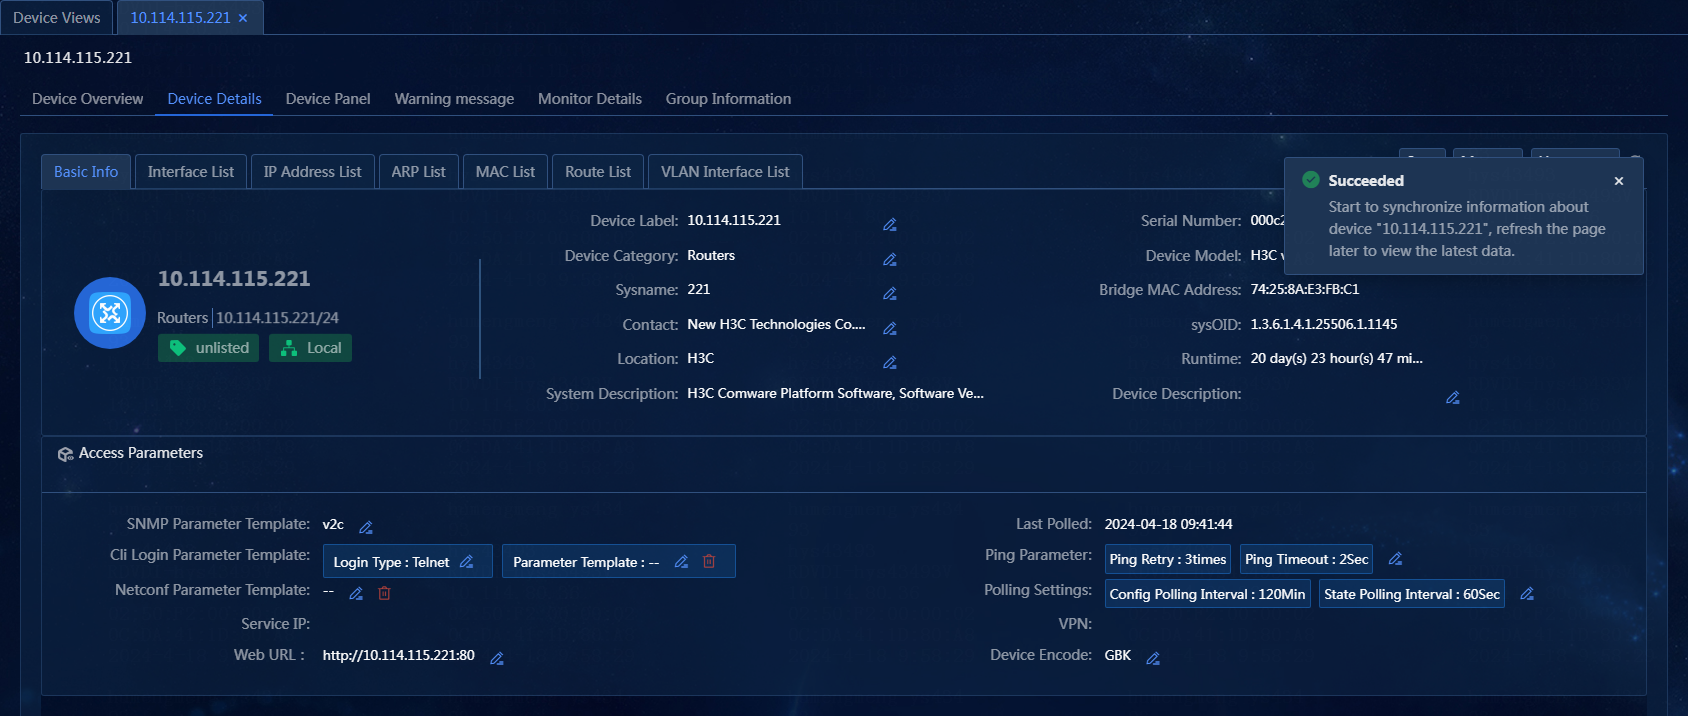
2. On the Device Views page, click the label of a device. Click the Device Details tab, and click Sync to synchronize device information, as shown in Figure 31.
Figure 31 Synchronizing device information
Import or export devices
Export devices
This feature allows you to save all device information from the device view to your local system, facilitating network device data backup and easier maintenance. The exported device information is saved in a CSV file. As a best practice to maintain data accuracy, do not modify the exported file.
Perform the following tasks:
1. On the top navigation bar, click Management. From the left navigation pane, select Device Management > Device Views.
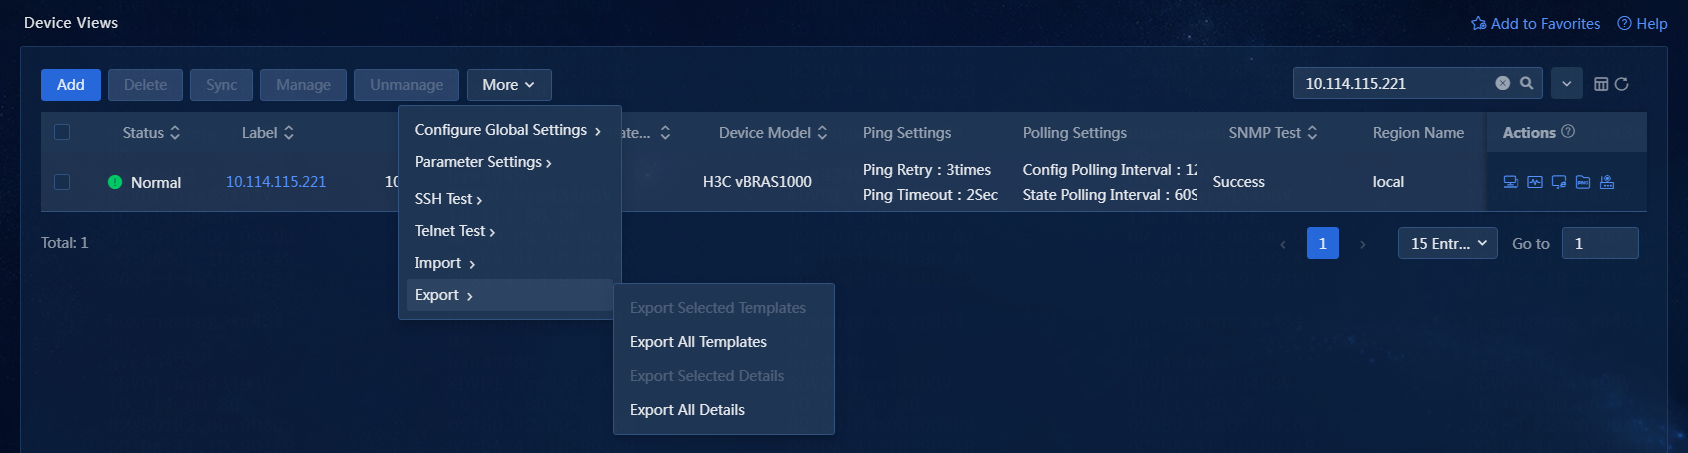
2. On the Device Views page, click More.
3. Click Export, and select Export All Templates or Export All Details. In this example, Export All Details is selected. The following device details will be exported: device label, sysname, device status, contact, IP address, location, mask, device model, OID, last polling time, device category, interface count, MAC address, runtime, system description, login type, ping support, and serial number. as shown in Figure 32.
The Export Selected Templates and Export Selected Details options are available only if you have selected devices.
Import devices
This feature enables you to import files exported from other network management systems into the current system, allowing for quick network device management and easier maintenance.
Perform the following tasks:
1. On the top navigation bar, click Management. From the left navigation pane, select Device Management > Device Views.
2. On the Device Views page, click More.
3. Click Import, and select Import Device. The Import Device window opens, as shown in Figure 33. Download a template file and enter the device information in the file, or use a template exported from another system. In this example, the template file downloaded on the window is used.
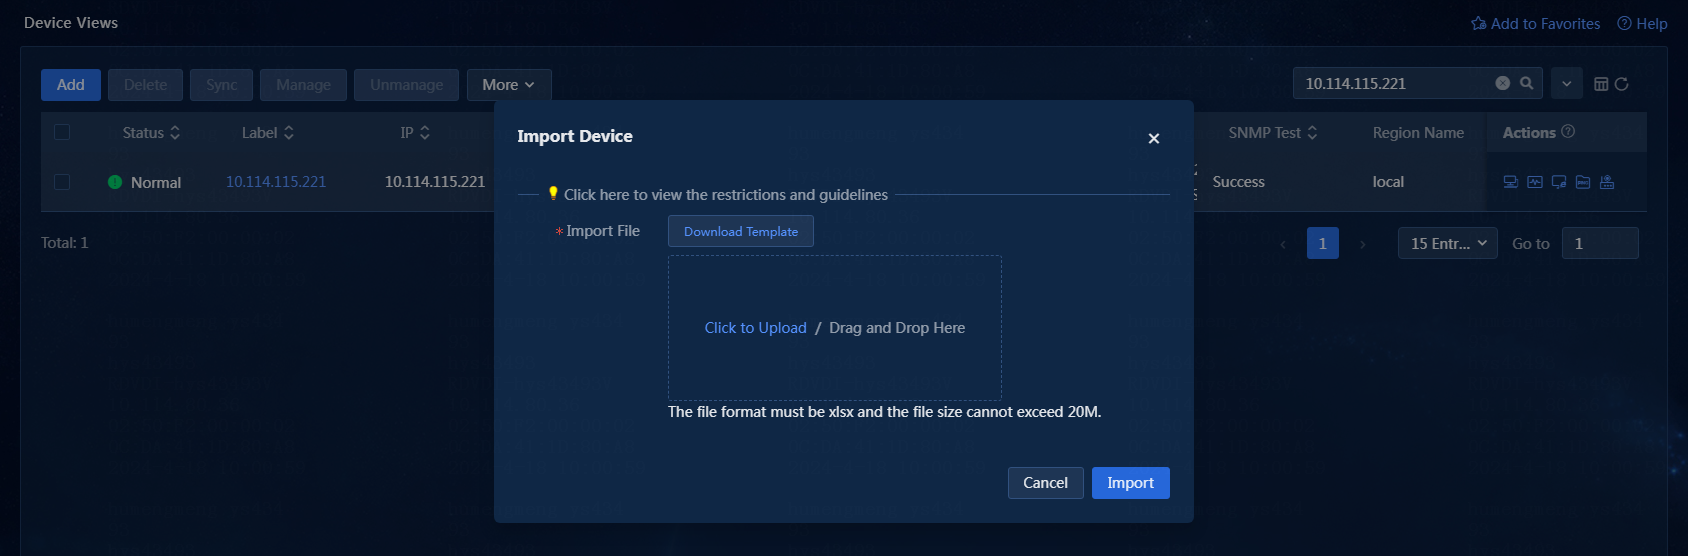
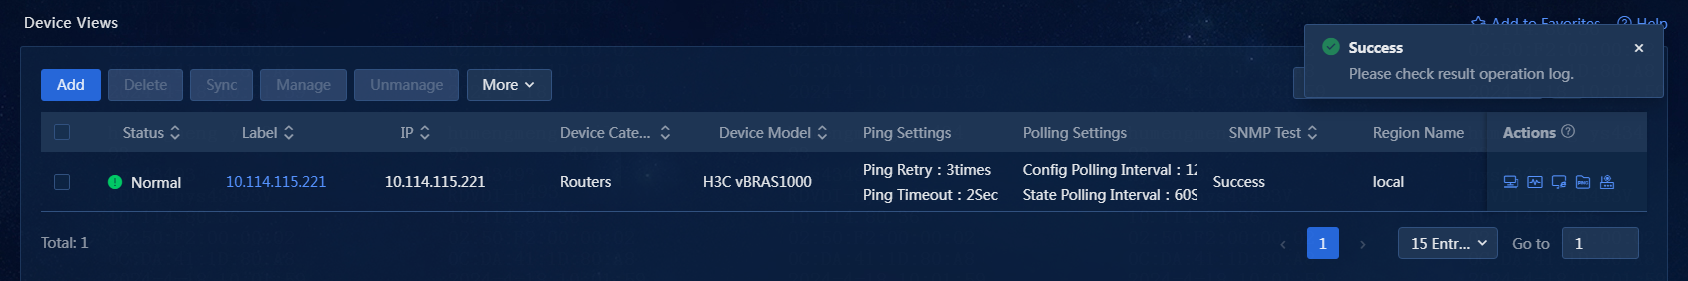
4. After selecting a file, click Import. You can view the import result in the operation log.
Open the Web-based NMS of a device
1. On the top navigation bar, click Management. From the left navigation pane, select Device Management > Device Views.
2. On the Device Views
page, click the ![]() icon in the Actions column for a
device.
icon in the Actions column for a
device.
Ping a device
1. On the top navigation bar, click Management. From the left navigation pane, select Device Management > Device Views.
2. On the Device Views
page, click the ![]() icon in the Actions column for a
device. On the window that opens, execute a ping operation, as shown in Figure 35.
icon in the Actions column for a
device. On the window that opens, execute a ping operation, as shown in Figure 35.
¡ IP Address: Enter an IP address. By default, the IP address of the current device is displayed. You can also enter another IP address. In this example, the IP address of the current device is pinged.
¡ Type: Select a ping type. Options include By Times and Continuous Ping. In this example, By Times is selected.
- By Times: Ping the device with the specified number of packets.
- Continuous Ping: Ping the device until you click Stop.
¡ Packet Size (Byte): Select the size of a ping packet. The default is 32 bytes. In this example, the default is used.
¡ Packet Count (1-500): Specify the number of packets sent in a single ping operation. The default is 5. In this example, the default is used.
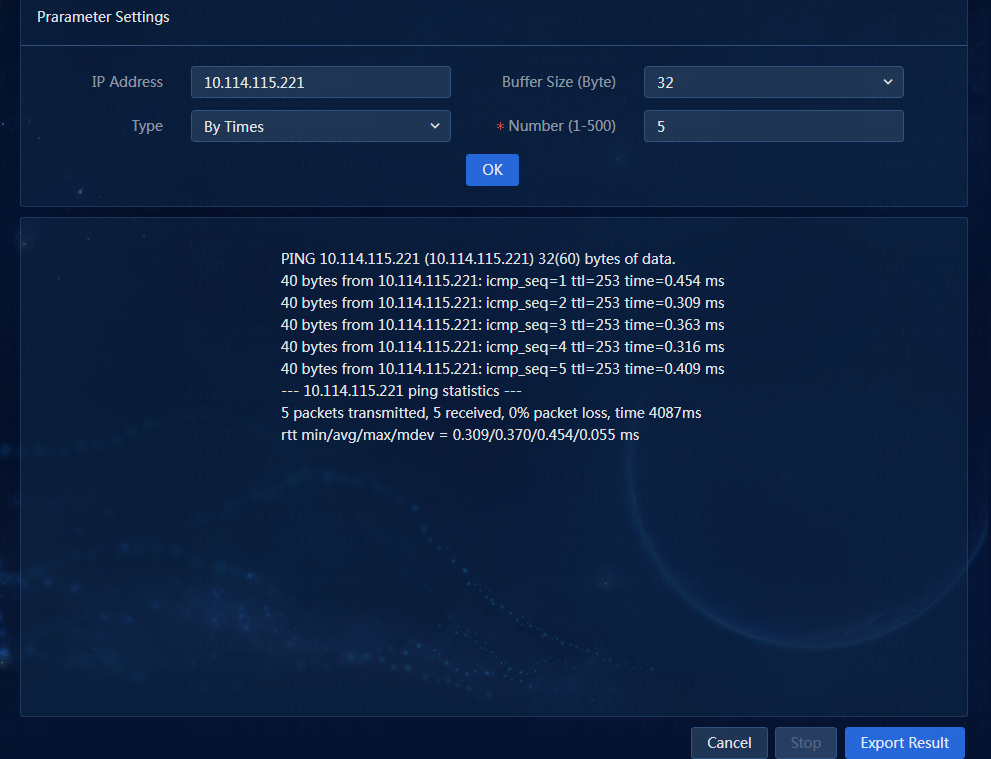
3. To export the ping result, click Export Result. In this example, the ping result is not exported.
4. Click OK.
Change an access parameter template
Change an access parameter template on the Device Views page
1. On the top navigation bar, click Management. From the left navigation pane, select Device Management > Device Views.
2. On the Device Views page, select one or more devices.
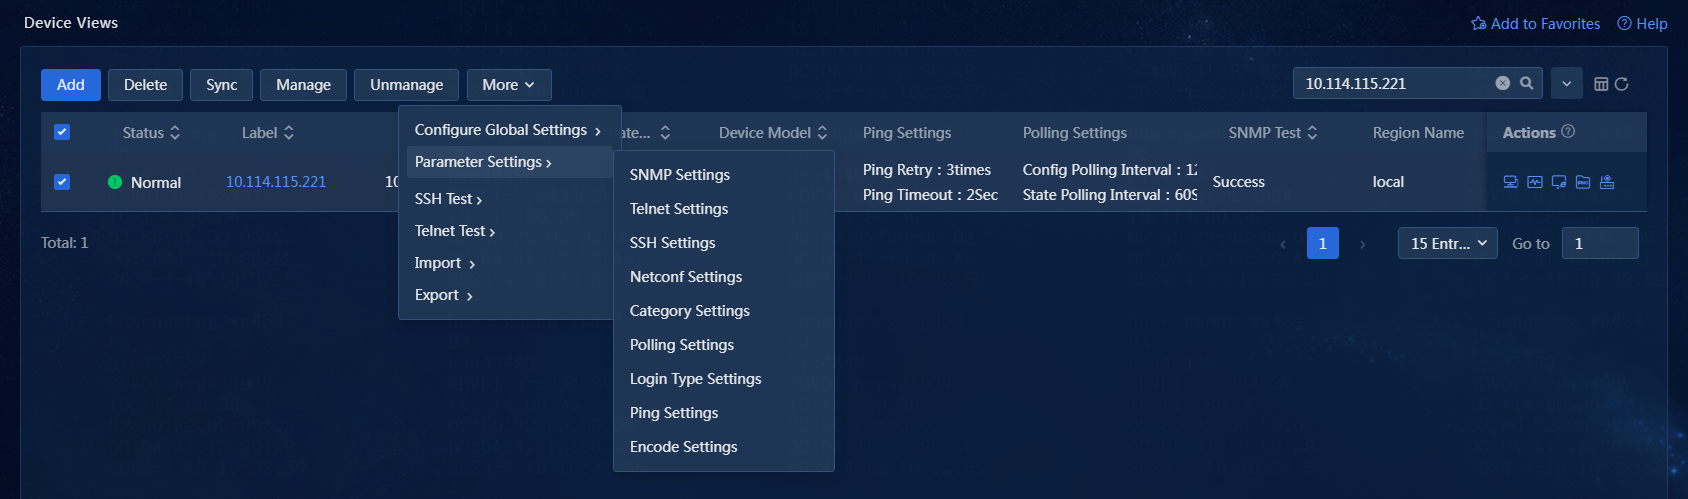
3. Click More, and click Parameter Settings, as shown in Figure 36. Change an access parameter template as needed.
Figure 36 Changing an access parameter template
4. Click OK.
Change an access parameter template on the Device Details page
Perform the following tasks:
1. On the top navigation bar, click Management. From the left navigation pane, select Device Management > Device Views.
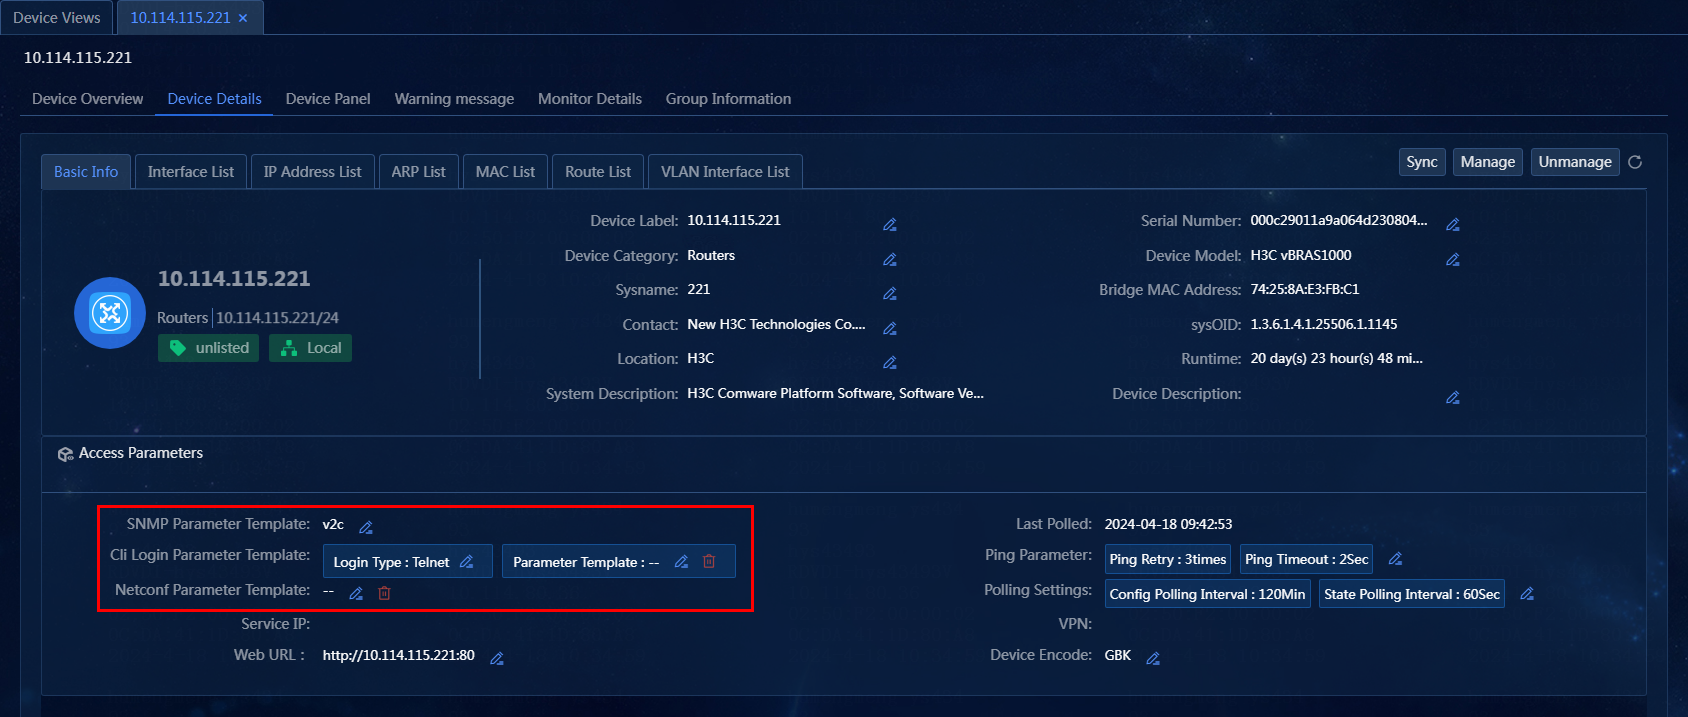
2. On the Device Views page, click the label of a device. Click the Device Details tab. In the Basic Info > Access Parameters area, change the SNMP template, Telnet template, and SSH template as needed, as shown in Figure 37.
Figure 37 Changing parameter templates
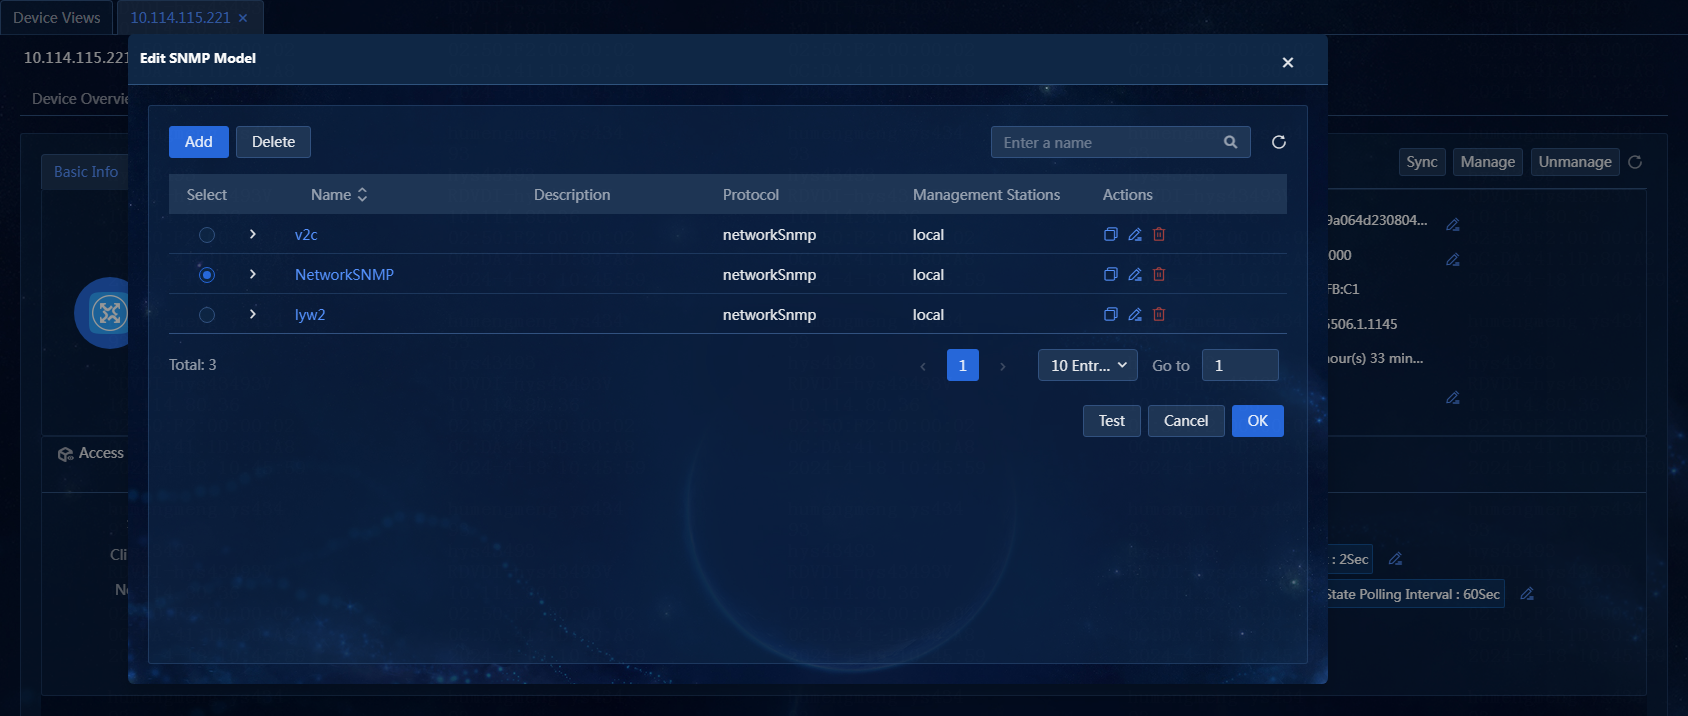
3. Click the ![]() icon for the SNMP
parameter template. On the windows that opens, select an existing template or
click Add to add a template and then select the added
template. In this example, an existing template named networkSnmp
is selected.
icon for the SNMP
parameter template. On the windows that opens, select an existing template or
click Add to add a template and then select the added
template. In this example, an existing template named networkSnmp
is selected.
Figure 38 Selecting an SNMP parameter template
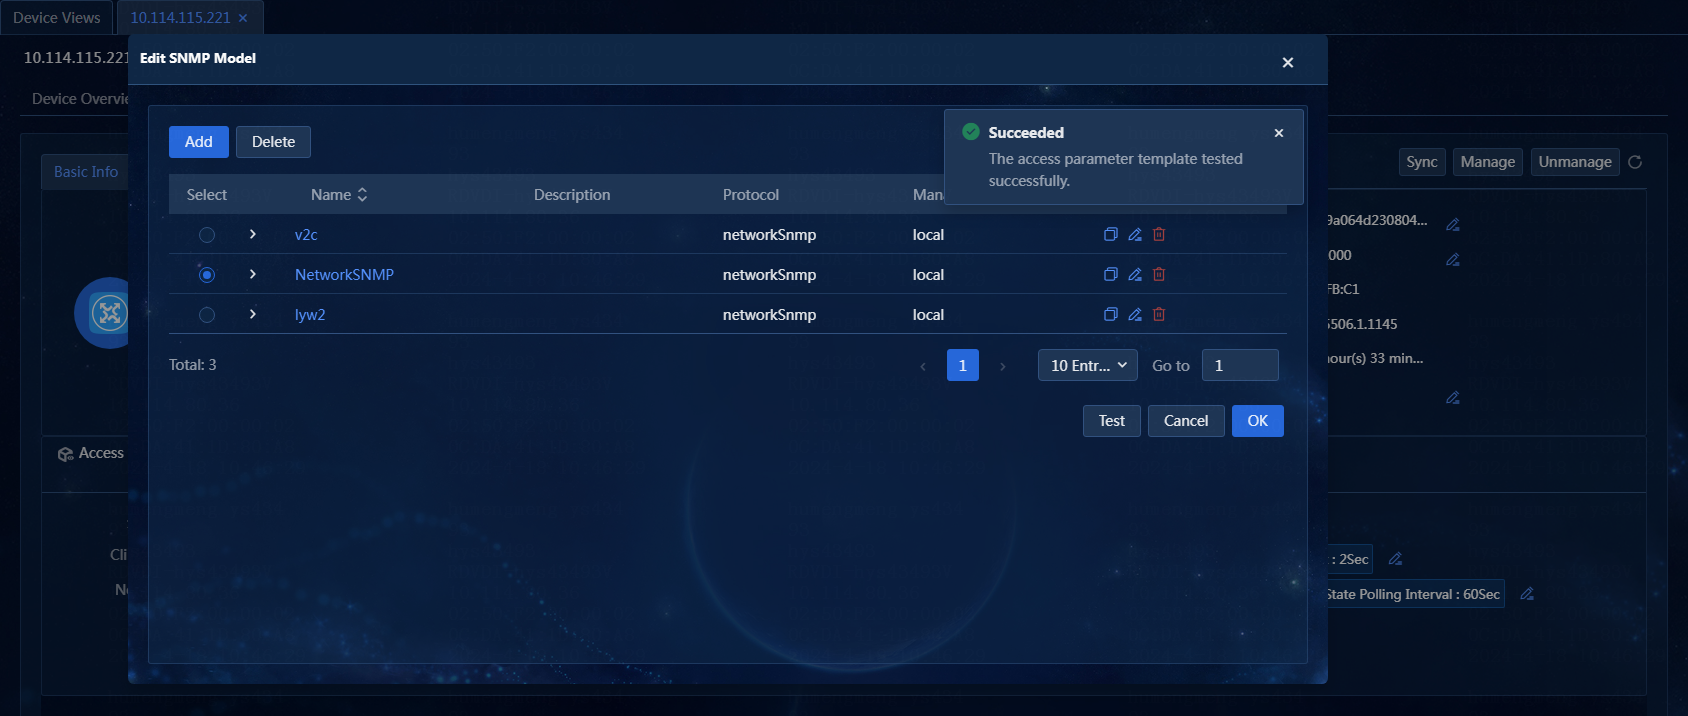
4. Click Test to test the parameter template, as shown in Figure 39.
Figure 39 Testing the parameter template
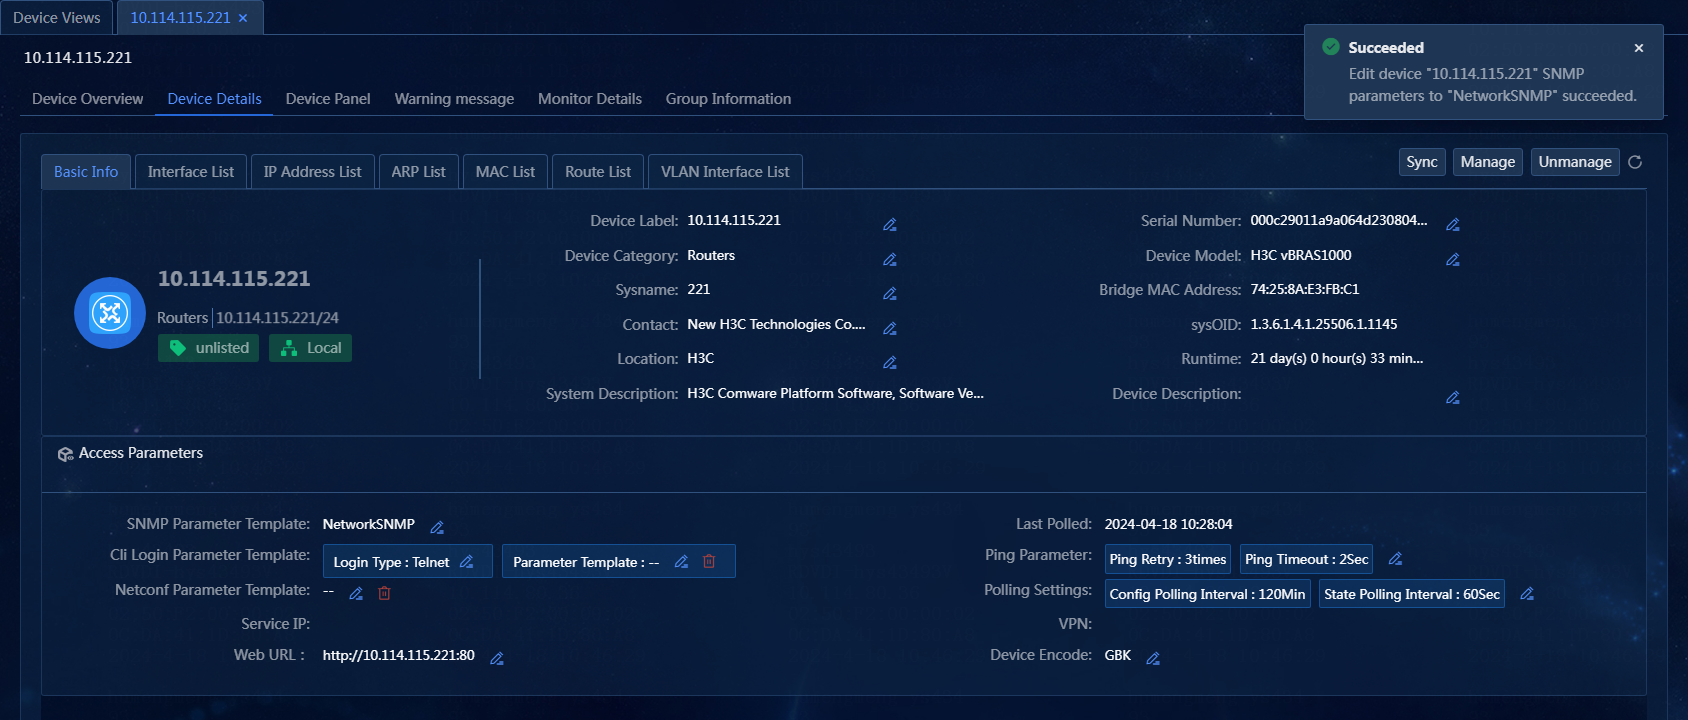
5. Click OK to change the SNMP parameter template, as shown in Figure 40.
Figure 40 SNMP parameter template changed successfully
Edit device details
Edit the device label on the Device Details page
1. On the top navigation bar, click Management. From the left navigation pane, select Device Management > Device Views.
2. On the Device Views
page, click the label of a device. Click the Device
Details tab. On the Basic Info tab, click
the ![]() tab for the device label. The Edit Device
Label window opens, as shown in Figure 41.
tab for the device label. The Edit Device
Label window opens, as shown in Figure 41.
Figure 41 Editing the device label
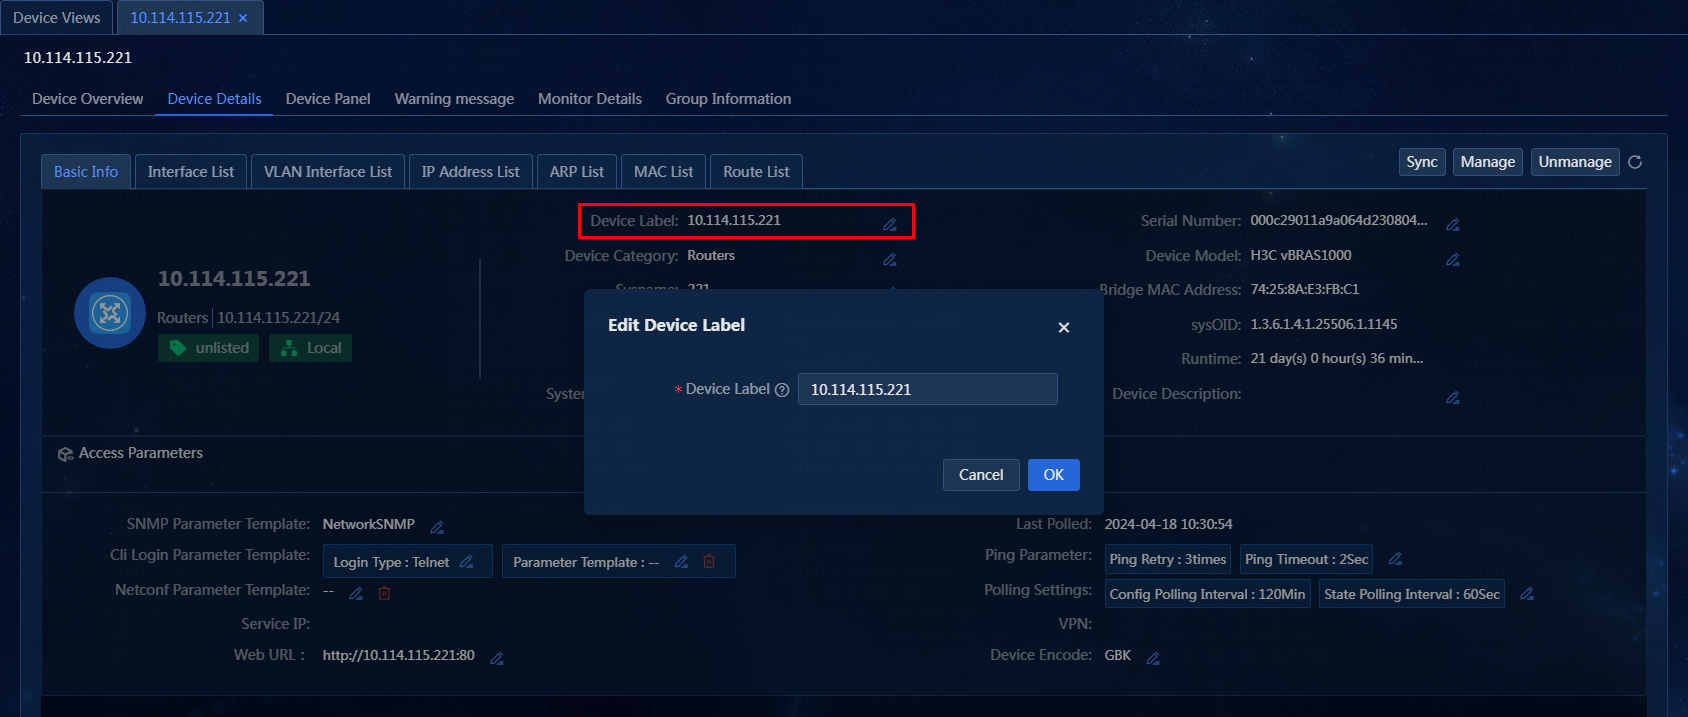
3. Enter a new device label, which can contain a maximum of 64 characters. In this example, the device label is not edited. The edited device label is only displayed on the page instead of being deployed to the device.
4. Click OK.
Edit system group attributes on the Device Details page
Perform the following tasks:
1. On the top navigation bar, click Management. From the left navigation pane, select Device Management > Device Views,
2. On the Device Views
page, click the label of a device. Click the Device
Details tab. On the Basic Info tab, click
the ![]() tab for the sysname, contact, or location. The Edit System Group Attributes window opens, as shown in Figure 42.
tab for the sysname, contact, or location. The Edit System Group Attributes window opens, as shown in Figure 42.
Figure 42 Editing system group attributes
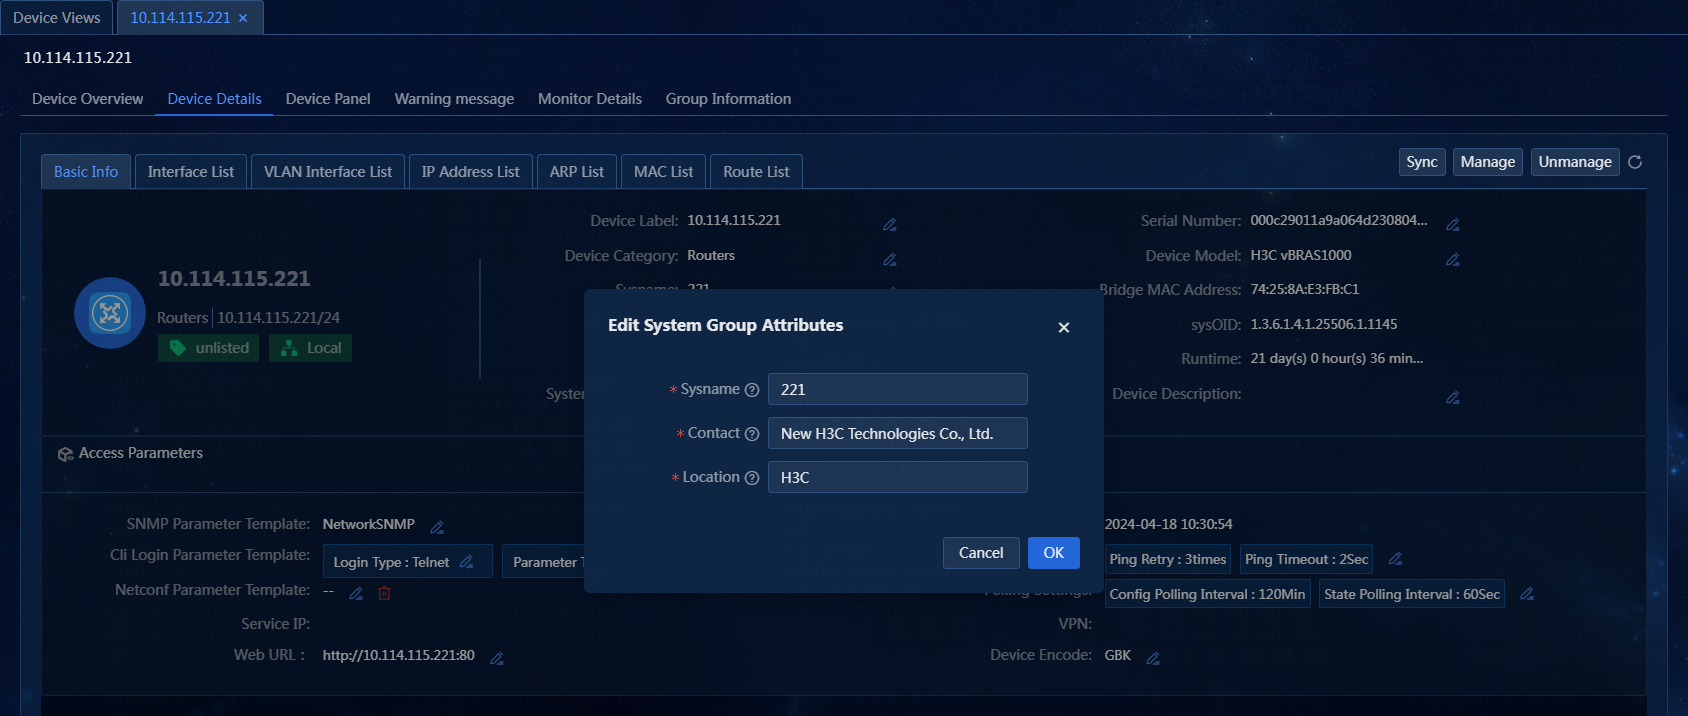
3. Edit system group attributes as needed. In this example, no system group attributes are edited.
¡ Sysname: Only digits, letters, spaces, and the following special characters are allowed: !"#$%&'()*+,-./:;<=>@[\]^_`{|}~ Vendors might have limitations on the length and special characters supported. For more information, see the product manual of the corresponding vendor. The edited sysname will be deployed to the device (SNMP set permission is required).
¡ Contact: Only digits, letters, spaces, and the following special characters are allowed: !"#$%&'()*+,-./:;<=>@[\]^_`{|}~ Vendors might have limitations on the length and special characters supported. For more information, see the product manual of the corresponding vendor. The edited contact is not deployed to the device and is only displayed on the page.
¡ Location: Only digits, letters, spaces, and the following special characters are allowed: !"#$%&'()*+,-./:;<=>@[\]^_`{|}~ Vendors might have limitations on the length and special characters supported. For more information, see the product manual of the corresponding vendor. The edited location is not deployed to the device and is only displayed on the page.
4. Click OK.
Edit polling settings on the Device Details page
Perform the following tasks:
1. On the top navigation bar, click Management. From the left navigation pane, select Device Management > Device Views,
2. On the Device Views
page, click the label of a device. Click the Device
Details tab. In the Basic Info > Access Parameters area, click the ![]() tab
for polling settings. The Polling Settings window
opens, as shown in Figure 43.
tab
for polling settings. The Polling Settings window
opens, as shown in Figure 43.
Figure 43 Editing polling settings
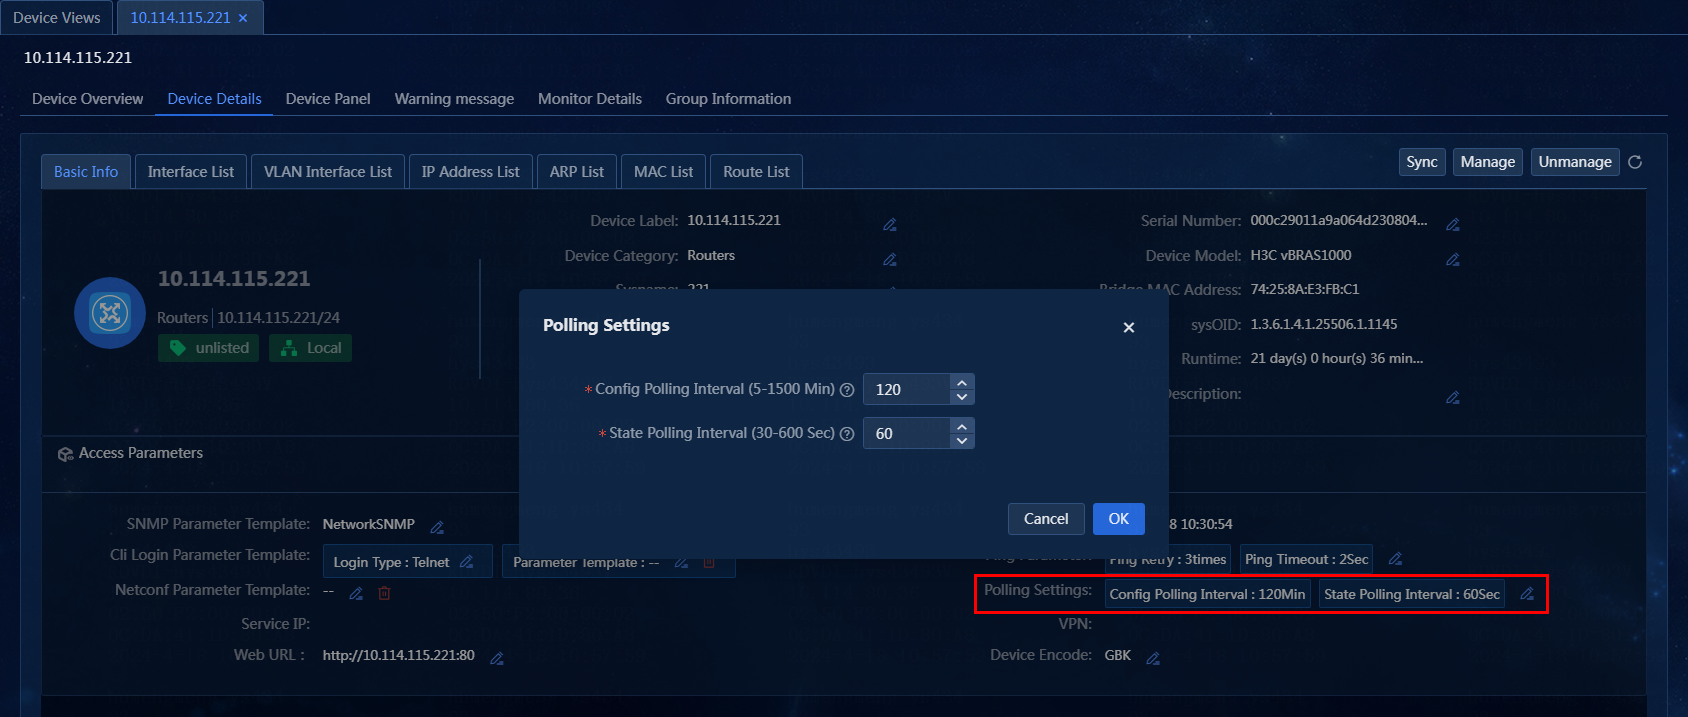
3. Edit the configuration polling interval and state polling interval as needed. In this example, no polling intervals are edited.
¡ Config Polling Interval (5-1500 min): Enter a new configuration polling interval. The default is 120. The value must be an integer.
¡ State Polling Interval (30-600 sec): Enter a new state polling interval. The default is 60. The value must be an integer.
4. Click OK.
Edit the device category on the Device Details page
Perform the following tasks:
1. On the top navigation bar, click Management. From the left navigation pane, select Device Management > Device Views,
2. On the Device Views
page, click the label of a device. Click the Device
Details tab. On the Basic Info tab, click
the ![]() tab for the device category. The Edit Device
Category window opens, as shown in Figure 44.
tab for the device category. The Edit Device
Category window opens, as shown in Figure 44.
Figure 44 Editing the device category
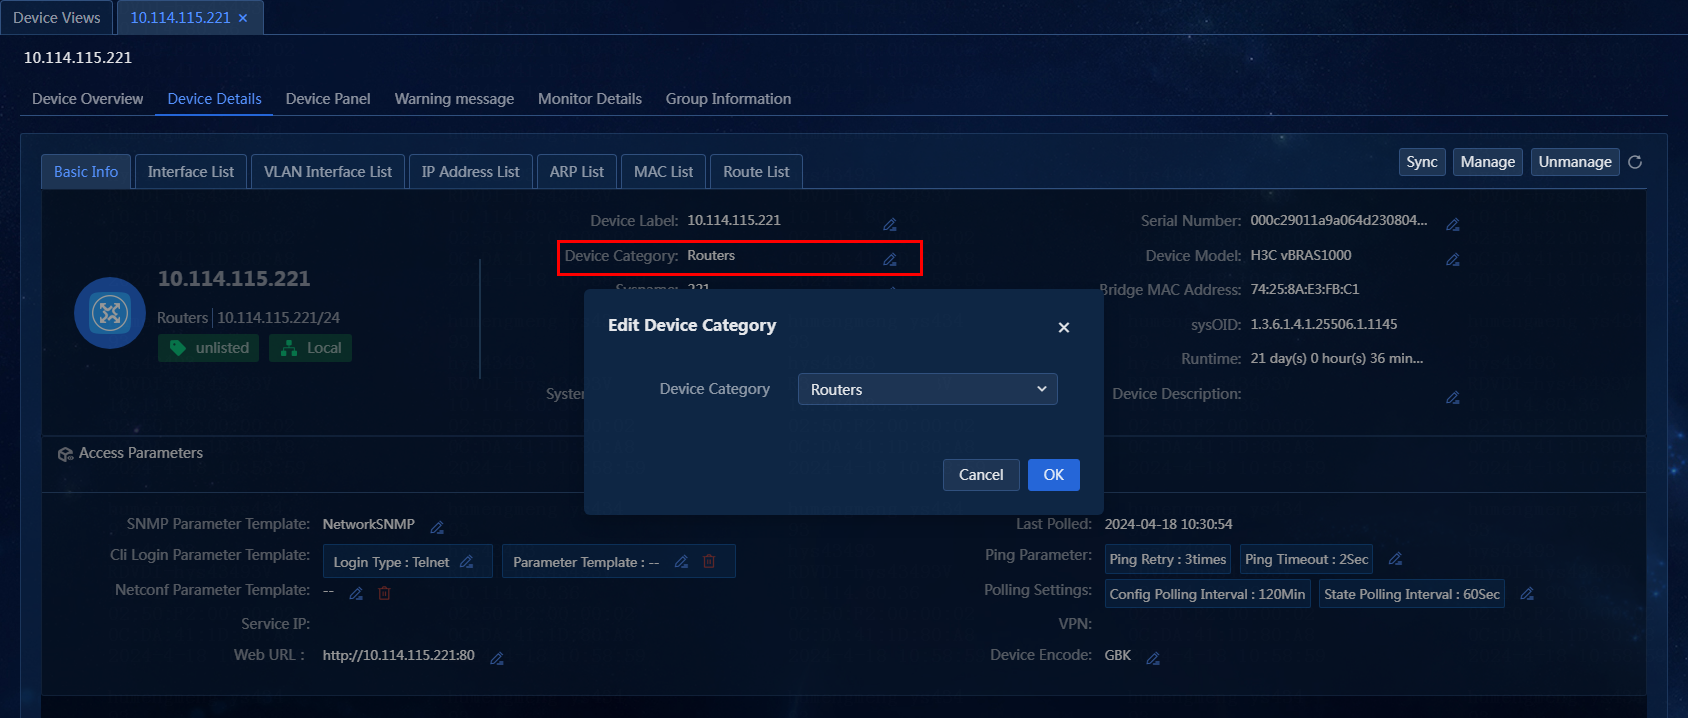
3. Select a new device category. In this example, the device category is not edited.
4. Click OK.
Edit the login type on the Device Details page
Perform the following tasks:
1. On the top navigation bar, click Management. From the left navigation pane, select Device Management > Device Views,
2. On the Device Views
page, click the label of a device. Click the Device
Details tab. In the Basic Info > Access Parameters area, click the ![]() tab
for the login type. The Edit Login Type window
opens, as shown in Figure 45.
tab
for the login type. The Edit Login Type window
opens, as shown in Figure 45.
Figure 45 Editing the login type
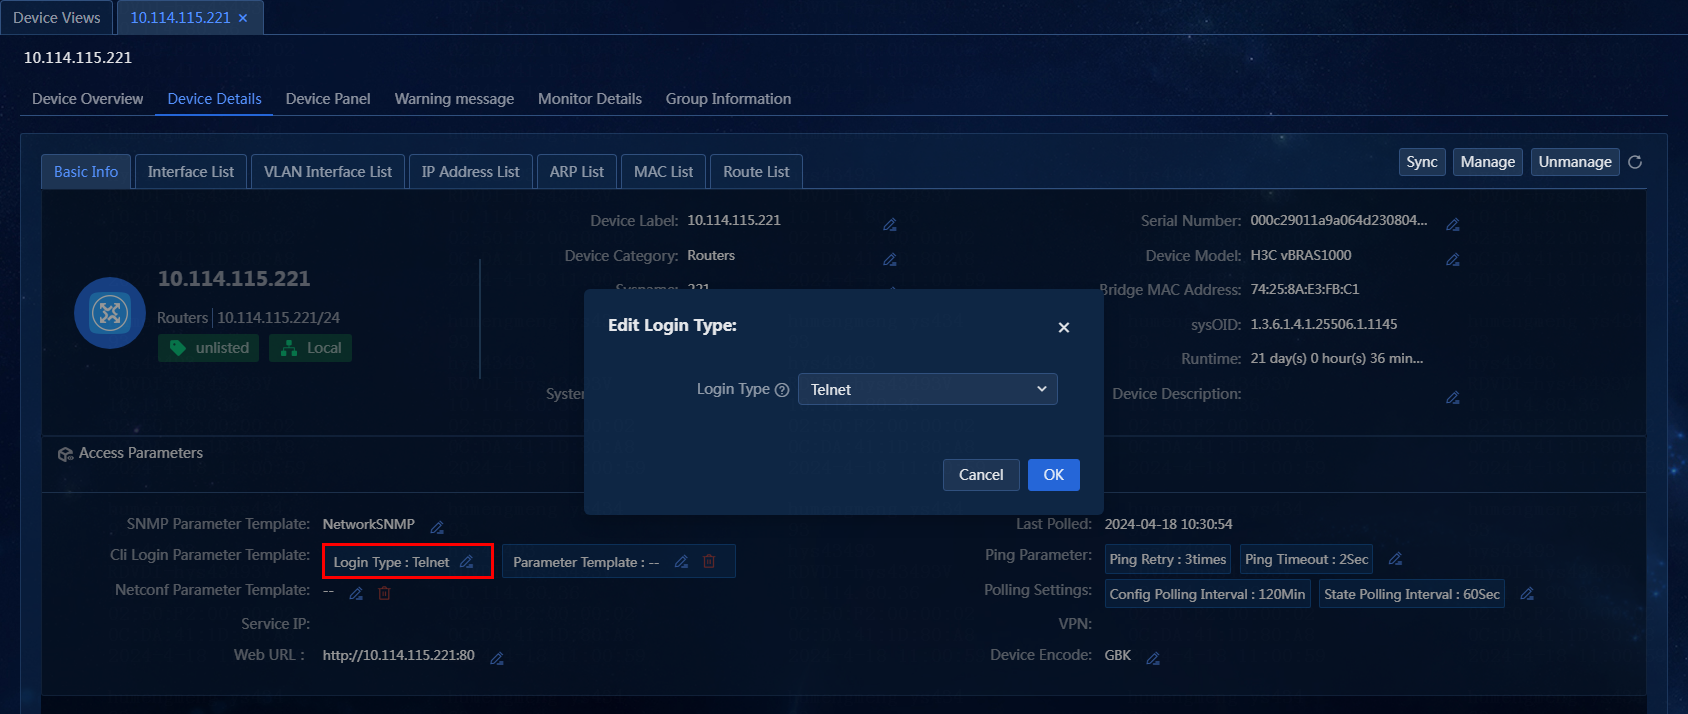
3. Select a new login type. The login type indicates the protocol used by the system to log in to the device at the CLI. In this example, the login type is not edited.
4. Click OK.
Verify the configuration
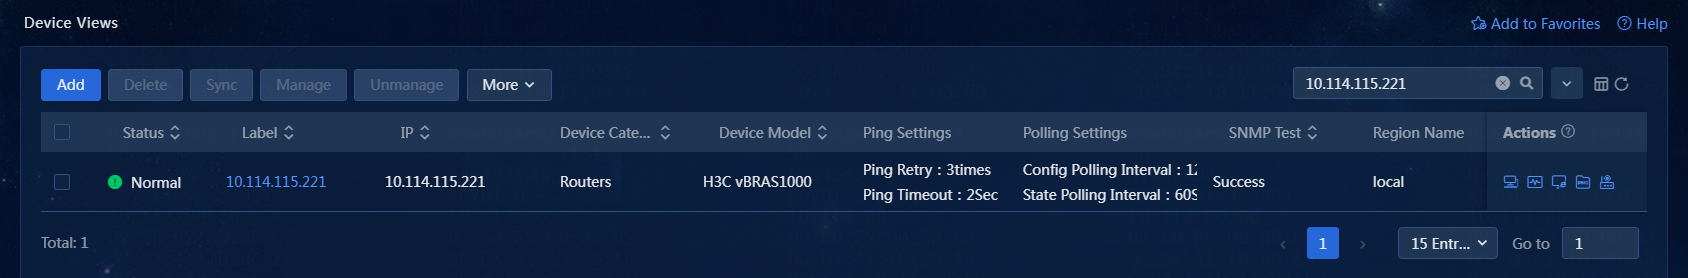
View device details
1. On the top navigation bar, click Management. From the left navigation pane, select Device Management > Device Views. The page displays summary information about each network device, including the device status, device label, IP address, device category, device model, and SNMP test result.
2. On the Device Views page, click the label of a device, and then click the Device Details tab to enter the Device Details page, as shown in Figure 47.
Figure 47 Viewing device details

3. Click the corresponding tab to view the basic information, interface list, device panel, alarm information, monitor details, group information, CI information, associated CI type, and relationship topology. CI information, associated CI type, and relationship topology are displayed only if the required license is installed.
View the interface list
1. On the top navigation bar, click Management. From the left navigation pane, select Device Management > Device Views.
2. On the Device Views page, click the label of a device, and then select Device Details > Interface List. The interface list displays information about each interface, including interface status, interface name, interface description, last change time, interface type, and peer device type, as shown in Figure 48.
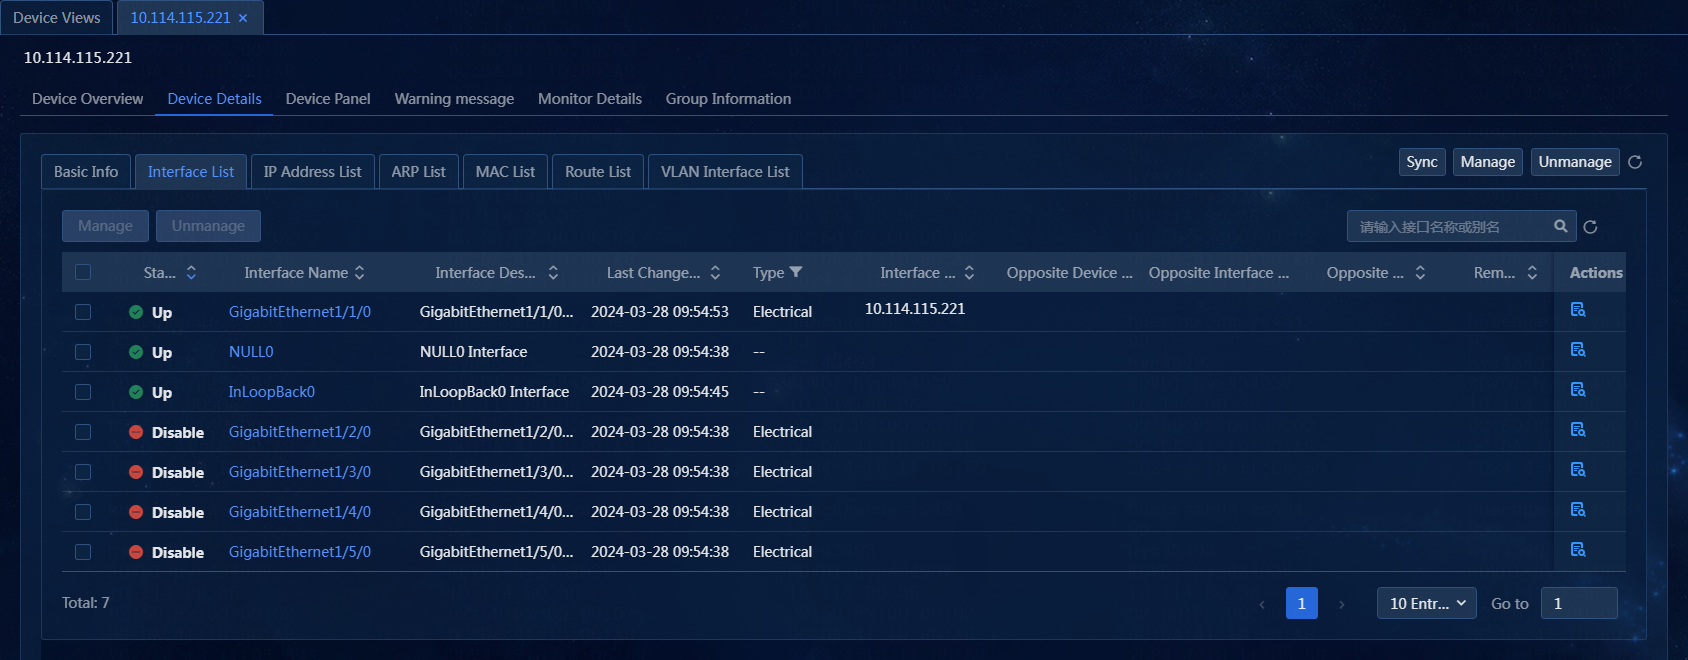
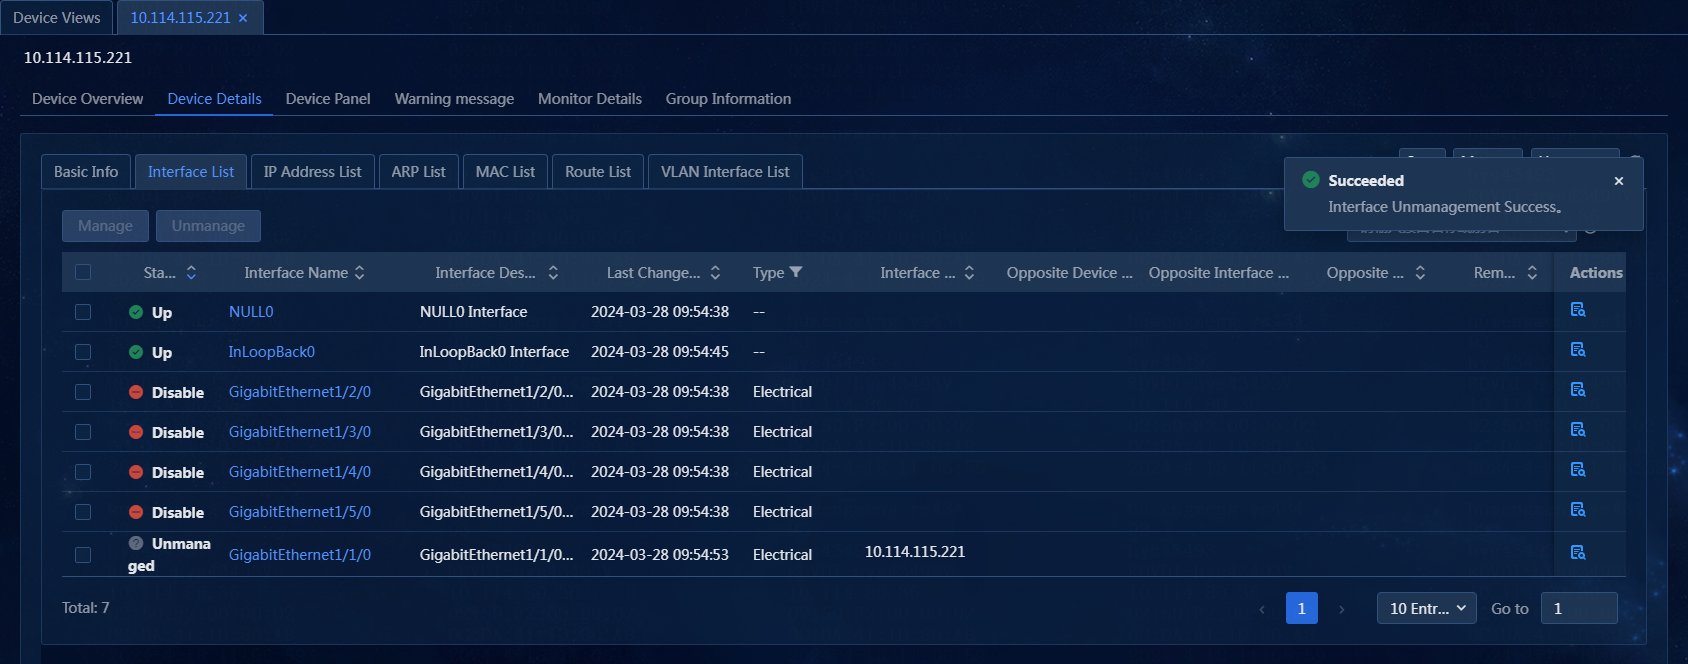
3. To manage or unmanage interfaces, select one or more interfaces. In this example, GigabitEthernet1/1/0 is selected.
4. Click Unmanage. The system will no longer poll the unmanaged interface, but you can still configure the interface, as shown in Figure 49.
Figure 49 Unmanaging an interface
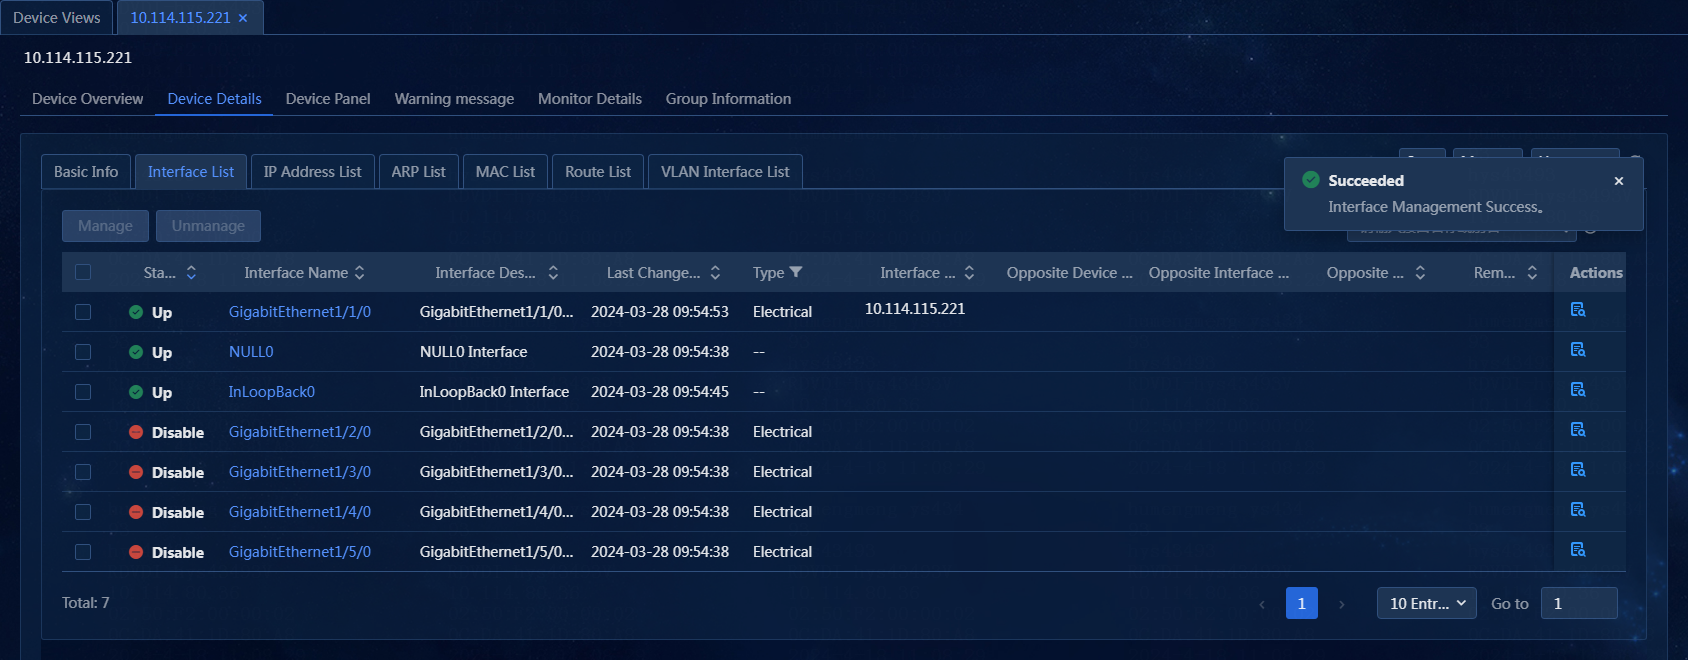
5. Select the unmanaged interface, and click Manage. The system will immediately obtain the status information of the interface, as shown in Figure 50.
Figure 50 Managing an interface
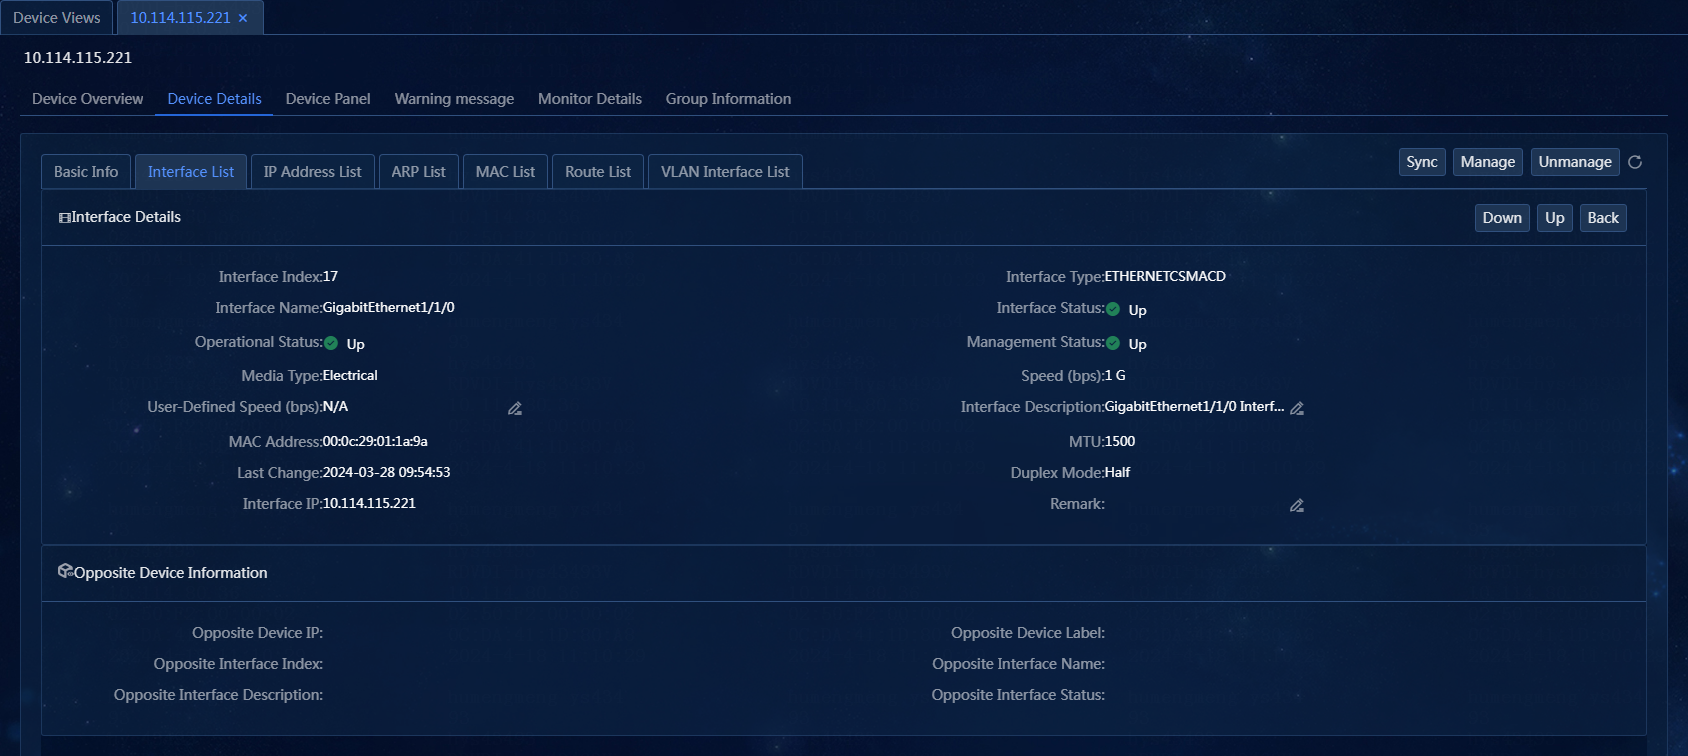
6. Click the interface name to view the interface details, including the index, type, speed, and MAC address of the interface, as shown in Figure 51.
¡ Edit
the interface speed: Click the ![]() icon for the
interface speed. In this example, the interface speed is not edited.
icon for the
interface speed. In this example, the interface speed is not edited.
¡ Edit
the interface description: Click the ![]() icon for the
interface description. The interface description can contain a maximum of 64
characters. In this example, the interface description is not edited.
icon for the
interface description. The interface description can contain a maximum of 64
characters. In this example, the interface description is not edited.
¡ Edit
the remark: Click the ![]() icon for the interface remark. The edited remark is not deployed to
the device and is only displayed on the page.
icon for the interface remark. The edited remark is not deployed to
the device and is only displayed on the page.
View the device panel
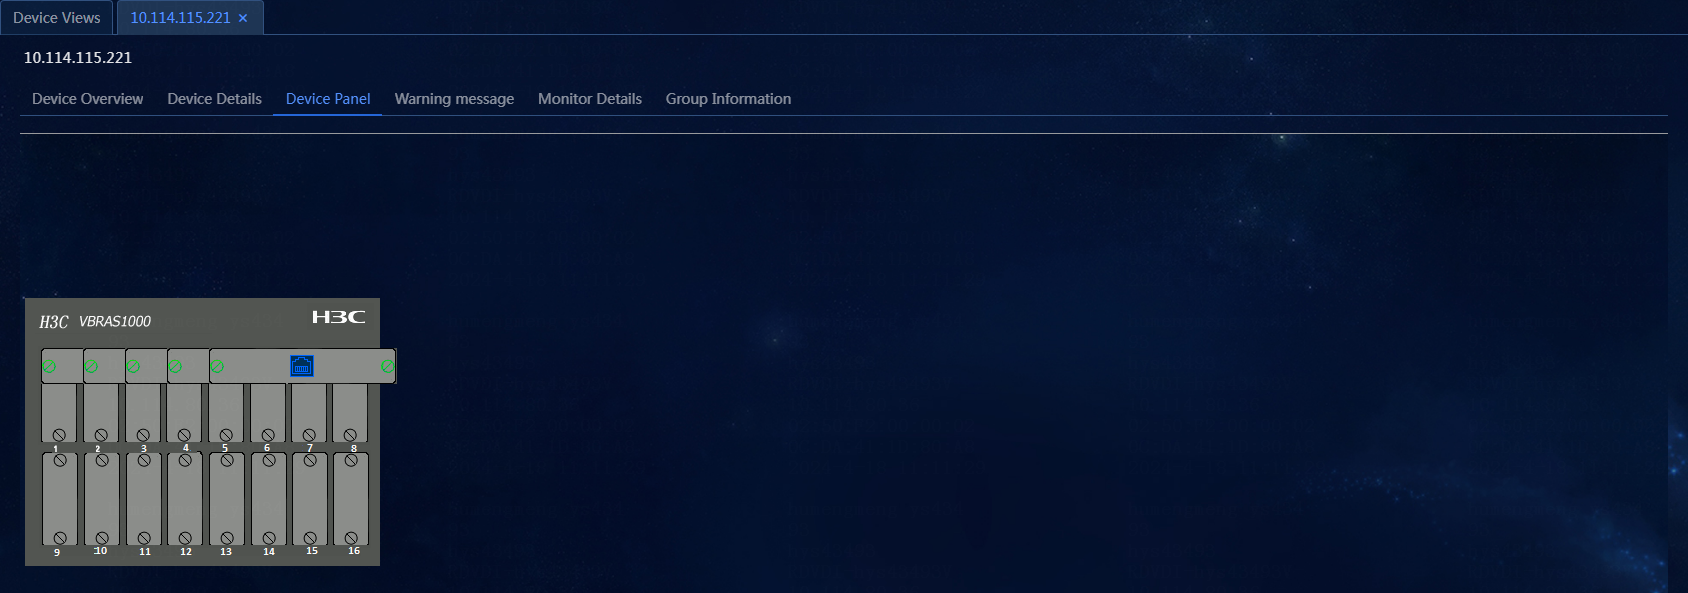
1. On the top navigation bar, click Management. From the left navigation pane, select Device Management > Device Views.
2. On the Device Views page, click the label of a device, and then click the Device Panel tab to enter the Device Panel page, as shown in Figure 52.
View alarm information
1. On the top navigation bar, click Management. From the left navigation pane, select Device Management > Device Views,
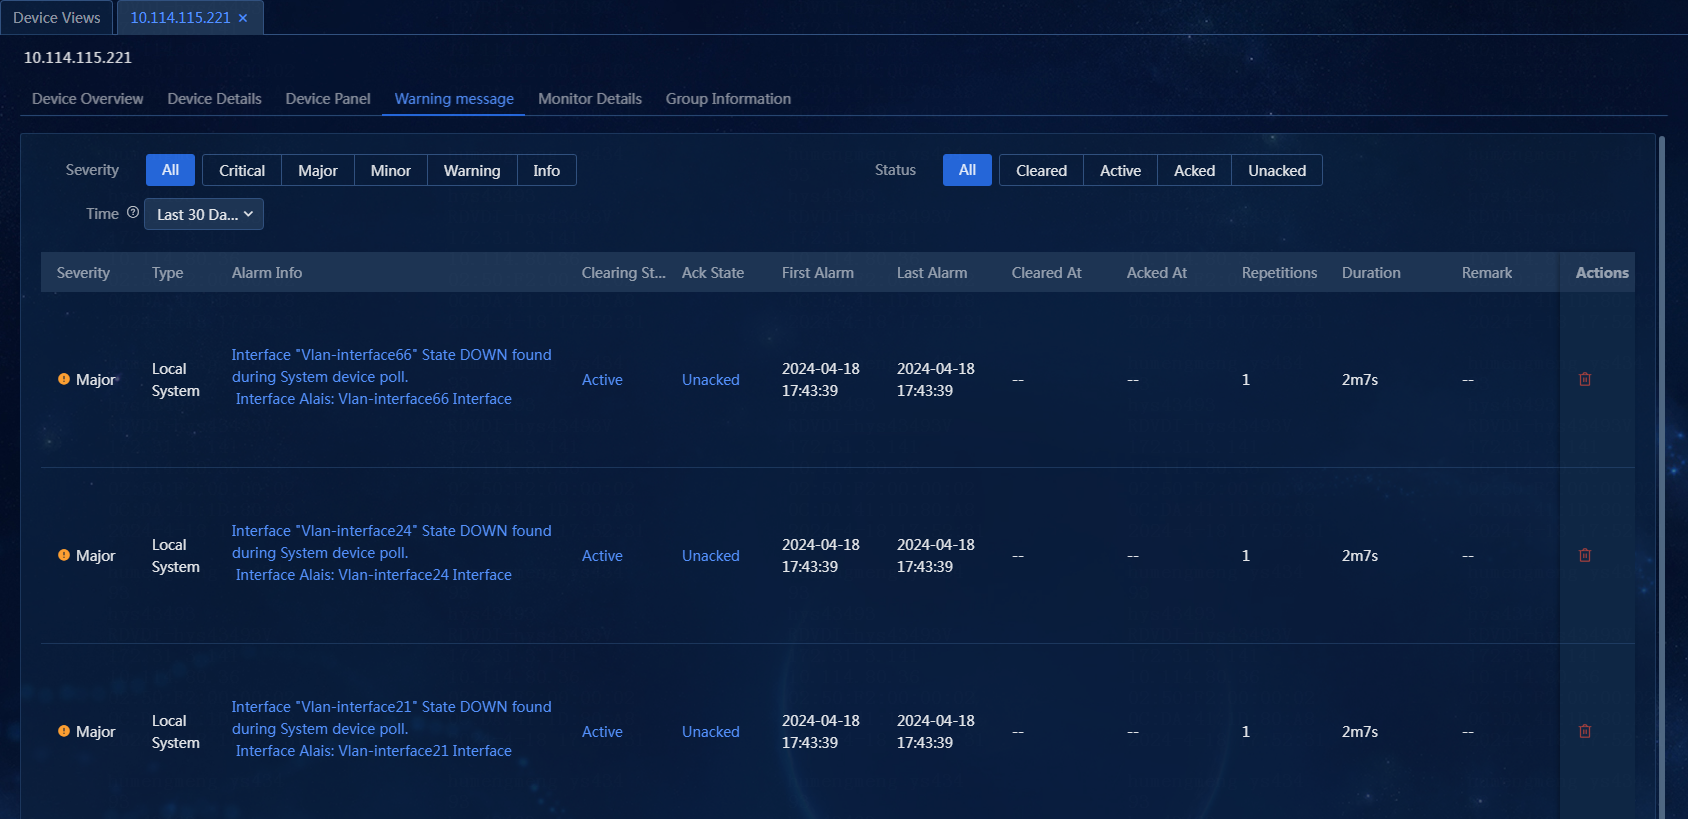
2. On the Device Views page, click the label of a device, and then click the Warning message tab. You can filter alarms by alarm severity, alarm status, and alarm generation time, as shown in Figure 53.
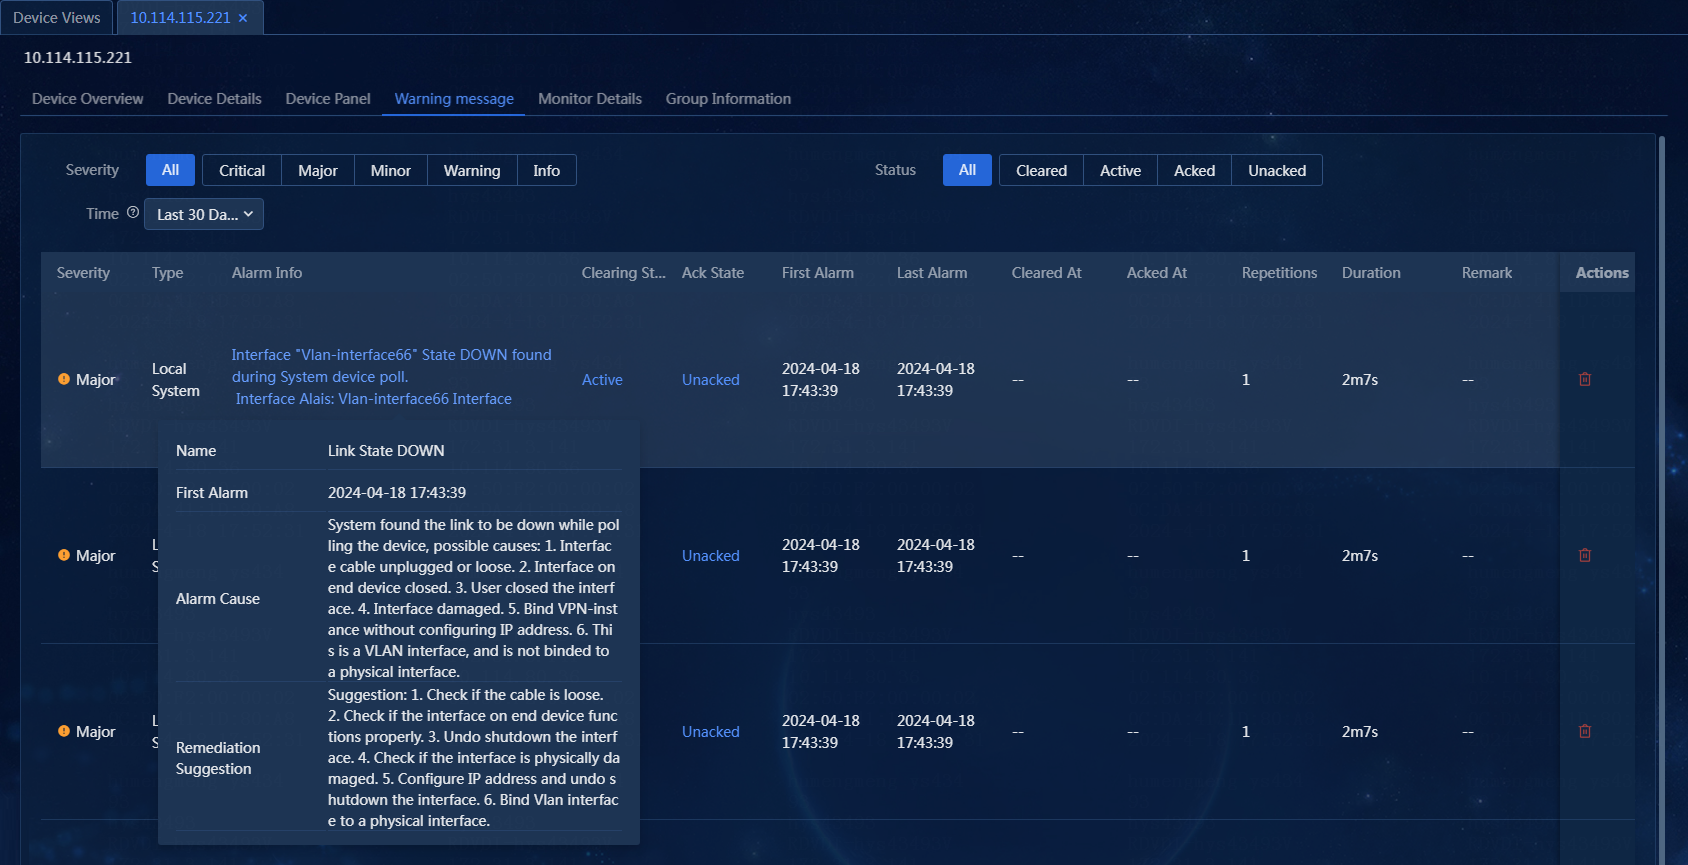
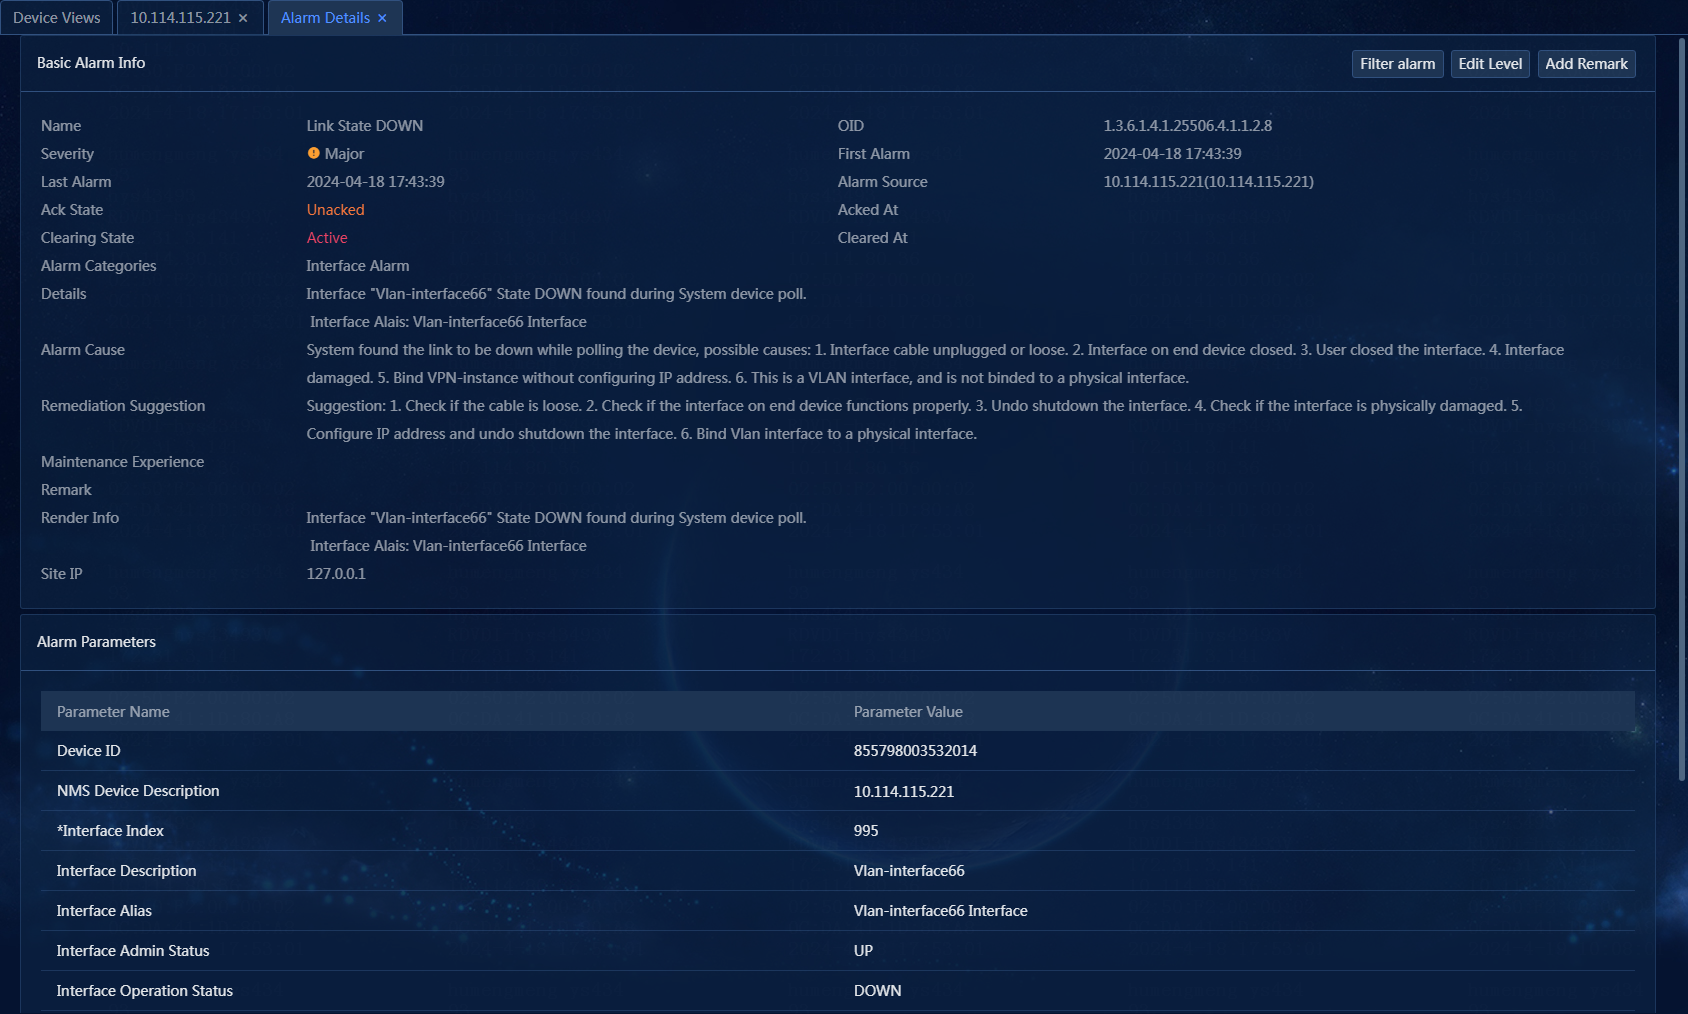
3. Hover over the Alarm Info link to view the alarm name, first alarm time, alarm cause, and remediation suggestion. Click the Alarm Info link. On the window that opens, you can view the alarm details, including the basic alarm information and alarm parameters. The trap cause and remediation suggestion provide the cause for the alarm and how to recover the alarm, which helps the administrator to process the failure, as shown in Figure 54 and Figure 55.
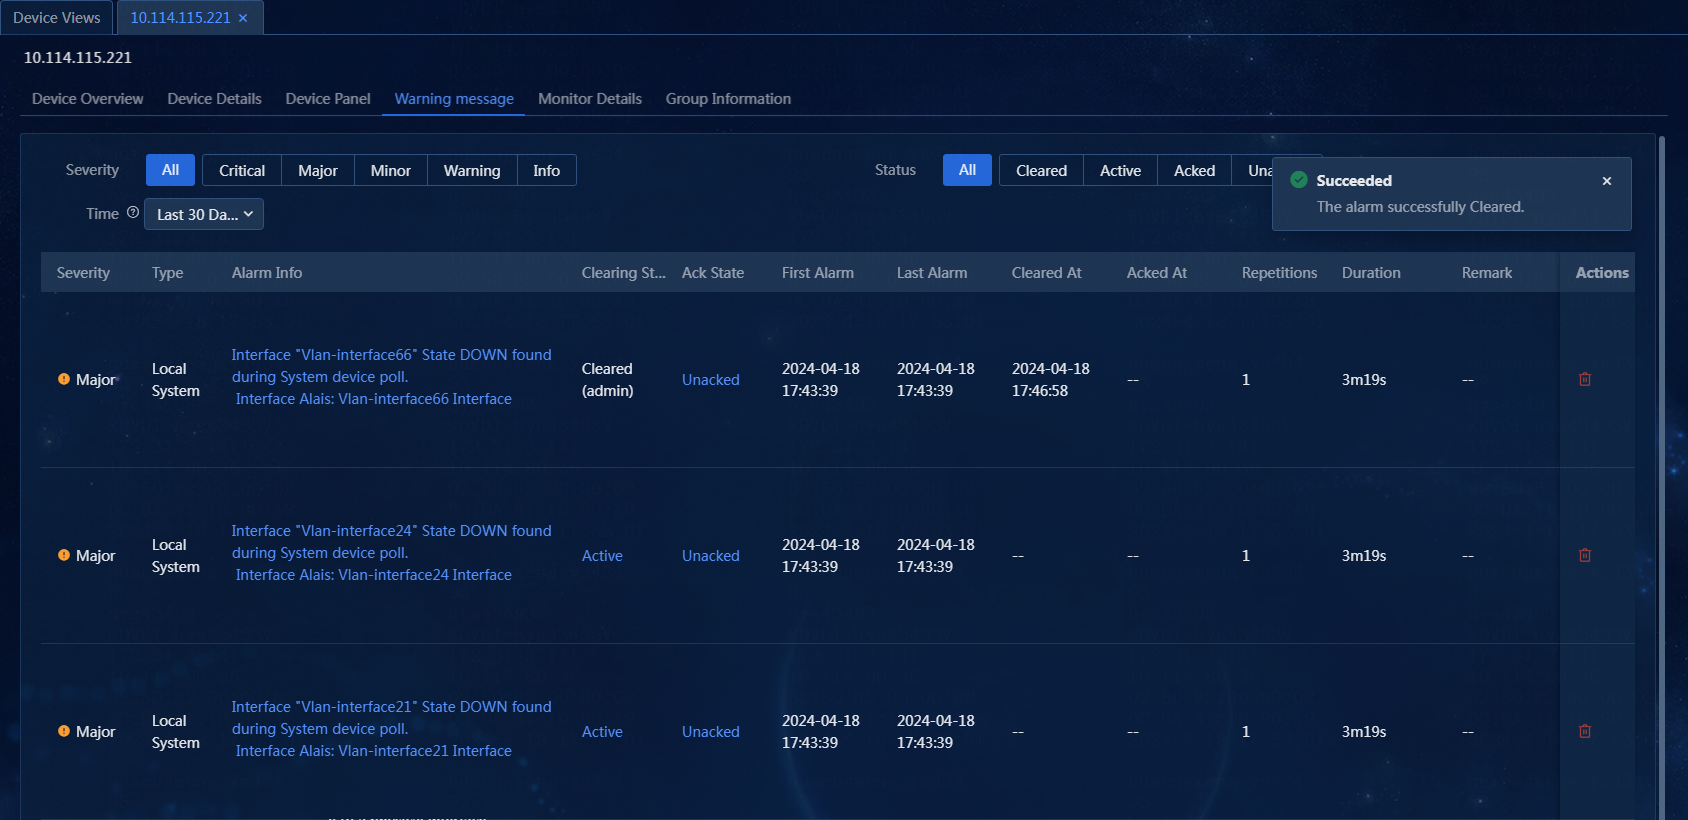
4. To clear an alarm, click the Active link in the Clearing State column, as shown in Figure 56.
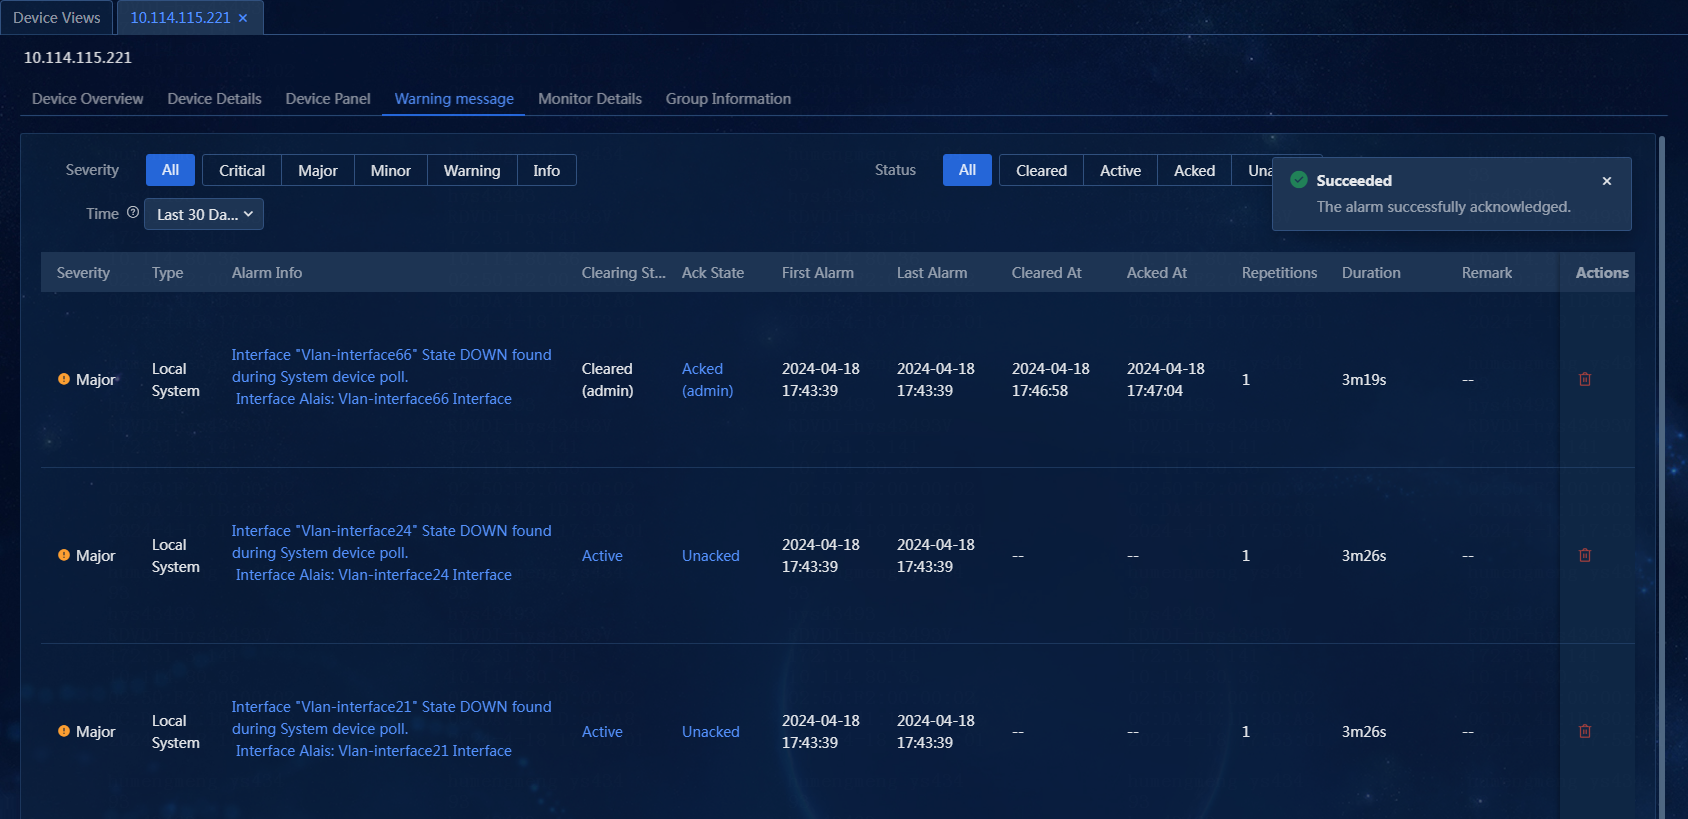
5. To acknowledge an alarm, click the Unacked link in the Ack State column for that alarm, as shown in Figure 57.
Figure 57 Acknowledging an alarm
View monitor details
1. On the top navigation bar, click Management. From the left navigation pane, select Device Management > Device Views.
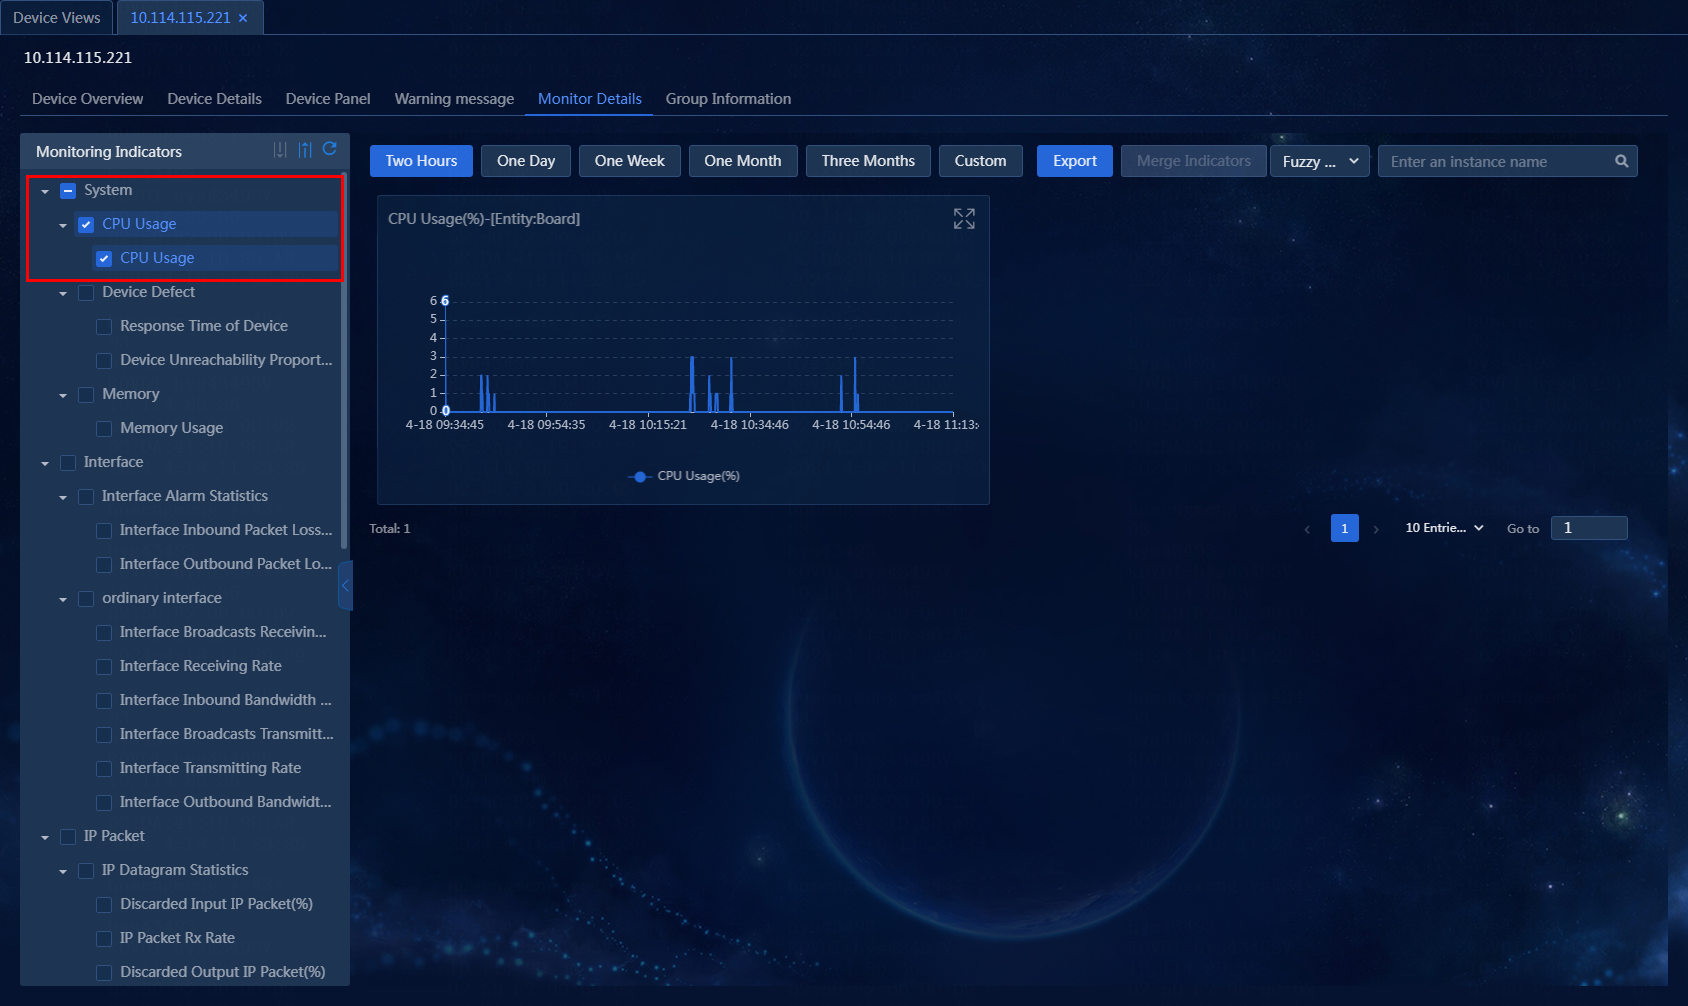
2. In this example, device with IP address 10.114.115.221 is used as an example. On the Device Views page, click the label of a device, and then click the Monitor Details tab to enter the Monitor Details page, as shown in Figure 58.
Figure 58 Viewing monitor details

3. If a large number of monitor instances exist, reduce monitoring indicators on the left of the page. In this example, Memory and Device Defect are deselected, and related contents are not displayed. You can also specify the time span for the monitor information to be displayed, as shown in Figure 59.
Figure 59 Filtering monitor indicators
View group information
1. On the top navigation bar, click Management. From the left navigation pane, select Device Management > Device Views.
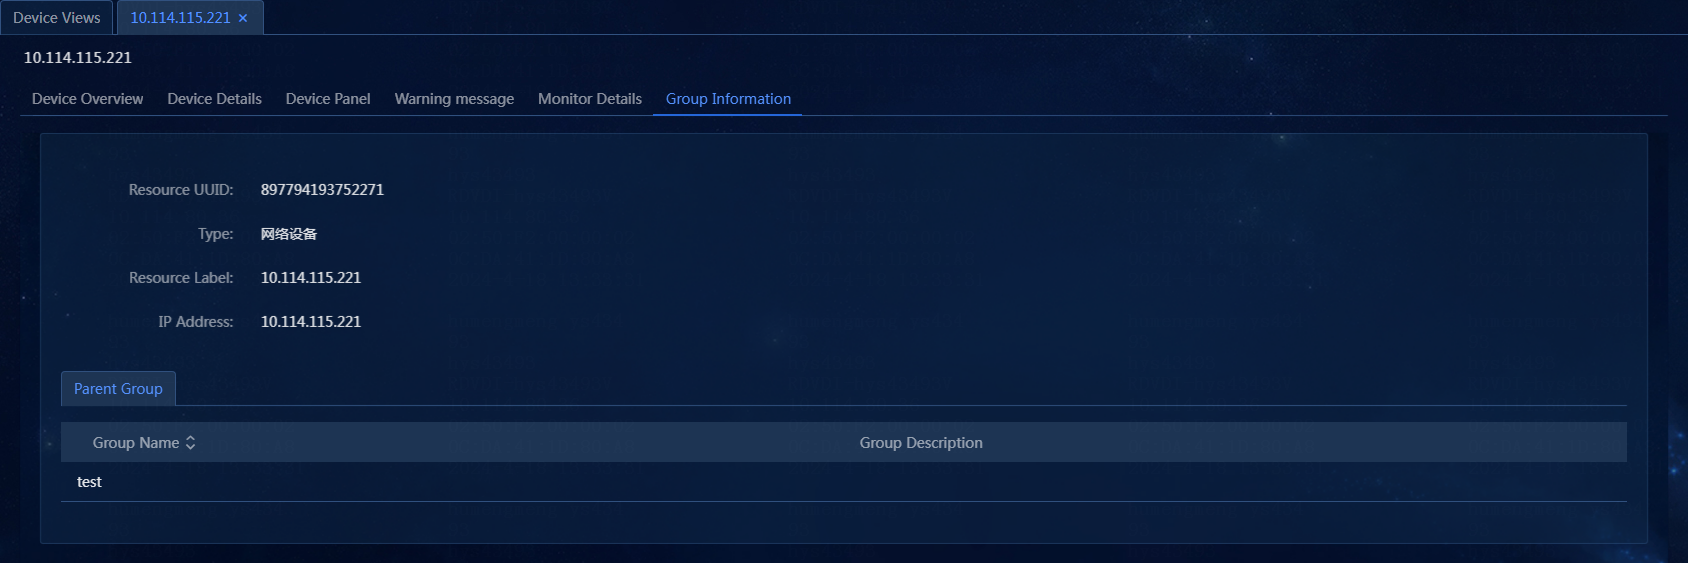
2. In this example, device with IP address 10.114.115.221 is used as an example. On the Device Views page, click the label of a device, and then click the Group Information tab to view the group to which the device belongs, as shown in Figure 60.
Figure 60 Viewing group information