- Table of Contents
-
- 11-Network Management and Monitoring Configuration Guide
- 00-Preface
- 01-System maintenance and debugging configuration
- 02-NQA configuration
- 03-iNQA configuration
- 04-NTP configuration
- 05-PTP configuration
- 06-Network synchronization configuration
- 07-SNMP configuration
- 08-RMON configuration
- 09-Event MIB configuration
- 10-NETCONF configuration
- 11-Ansible configuration
- 12-Puppet configuration
- 13-Chef configuration
- 14-CWMP configuration
- 15-EAA configuration
- 16-Process monitoring and maintenance configuration
- 17-Mirroring configuration
- 18-sFlow configuration
- 19-Information center configuration
- 20-Packet capture configuration
- 21-VCF fabric configuration
- 22-eMDI configuration
- 23-SQA configuration
- Related Documents
-
| Title | Size | Download |
|---|---|---|
| 22-eMDI configuration | 138.27 KB |
Configuring eMDI
About eMDI
Enhanced Media Delivery Index (eMDI) is a solution to audio and video service quality monitoring and fault locating. It is intended to solve problems caused by packet loss, packet sequence errors, and jitters.
eMDI monitors and analyzes specific TCP or RTP packets on each node of an IP network in real time, providing data for you to quickly locate network faults.
eMDI implementation
The eMDI feature is implemented on the basis of eMDI instances. Each eMDI instance monitors one data flow as defined by its parameters. It inspects fields of packets, periodically collects statistics, and reports to the NMS.
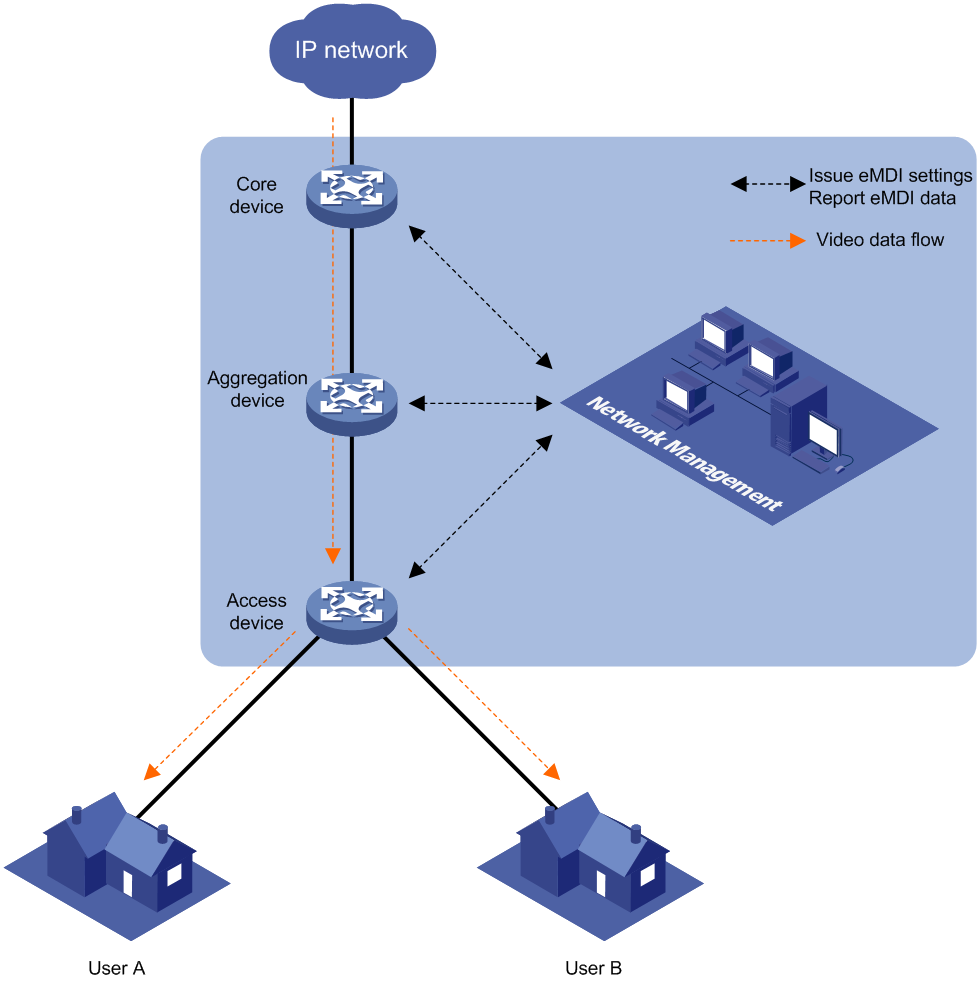
Figure 1 shows the eMDI deployment and operating process.
1. Upon service quality deterioration, you can obtain the data flow characteristics from the headers of interested packets, such as the source and destination IP addresses.
2. You deploy eMDI on each device that the data flow traverses by using the NMS or CLI.
3. The devices monitor the data flows, collect statistics, and report monitoring data to the NMS.
4. The NMS collects and analyzes the monitoring data and displays the analysis results graphically.
5. Based on the analysis results, you can quickly locate the network faults.
Monitored items
Table 1 and Table 2 list the monitored items for TCP packets and UDP packets. RTP packets are carried in UDP packets.
Table 1 Monitored items for TCP packets
|
Item |
Description |
Calculation formula |
Remarks |
|
Rate |
Packet input rate, in bps or pps. |
· Rate (bps) = Total length of packets received within a monitoring period / Monitoring period · Rate (pps) = Number of packets received within a monitoring period / Monitoring period |
This item is intended for unidirectional flows. |
|
UPLR |
Upstream packet loss rate, in units of one hundred thousandth. |
UPLR = (Number of lost upstream packets / (Number of received packets + Number of lost upstream packets)) / 100000 |
If no packets are lost, the sequence number of the current packet plus the length of the current packet is the expected sequence number of the next packet. If the sequence number of the next packet is greater than the expected sequence number, packet loss has occurred on an upstream device. The number of lost packets can be calculated based on the average packet size. This item is intended for unidirectional flows. |
|
DPLR |
Downstream packet loss rate, in units of one hundred thousandth. |
· Number of lost downstream packets = Total number of lost packets – Number of lost upstream packets · DPLR = (Number of lost downstream packets / Number of received packets) / 100000 |
If no packets are lost, the sequence number of the current packet plus the length of the current packet is the expected sequence number of the next packet. If the sequence number of the next packet is smaller than the expected sequence number, the packet is considered to be a retransmitted packet. The number of retransmitted packets is considered to be the total number of lost packets. This item is intended for unidirectional flows. |
|
DRTT |
Average downstream round trip time, in microseconds. |
DRTT = T2 – T1 |
The timestamp for a received non-retransmitted packet is recorded as T1. The sequence number of the packet plus the length of the packet is the expected sequence number of the next packet. If the sequence number of an ACK packet received from a downstream device is greater than or equal to the expected number, the timestamp of the ACK packet is recorded as T2. DRTT is equal to the average value of the differences between the T2 values and the corresponding T1 values. This item is intended for bidirectional flows. |
|
URTT |
Average upstream round trip time, in microseconds. |
URTT = T2 – T1 |
T1 indicates the timestamp when the device finds a SYN packet sent by the client for a connection. T2 indicates the timestamp when the device finds a SYN ACK packet returned by the server. Because URTT calculation depends on TCP control packets, it might not be calculated within a monitoring period. This item is intended for bidirectional flows. |
Table 2 Monitored items for UDP packets
|
Item |
Description |
Calculation formula |
Remarks |
|
RTP-LR |
RTP packet loss rate, in units of one hundred thousandth. |
RTP-LR = (Number of lost packets / (Number of received packets + Number of lost packets – Number of out-of-order packets)) / 100000 |
If the difference between the sequence number of current RTP packet and the greatest sequence number of earlier RTP packets is greater than 1, packet loss has occurred. If the sequence number of the current RTP packet is smaller than the sequence numbers of all earlier RTP packets, the packet is an out-of-order packet. This item is intended for unidirectional flows. |
|
RTP-SER |
RTP packet sequence error rate, in units of one hundred thousandth. |
RTP-SER = (Number of out-of-order packets / (Number of received packets + Number of lost packets – Number of out-of-order packets)) / 100000 |
This item is intended for unidirectional flows. |
|
Jitter |
RTP packet jitter, in microseconds. |
Jitter = T2 – T1 |
T1 represents the interval between the time when the sender sends the first packet and the time when the sender sends the last packet. T2 represents the interval between the time when the receiver receives the first packet and the time when the receiver receives the last packet. This item is intended for unidirectional flows. |
|
RTP-LP |
Maximum number of continuously lost RTP packets. |
The RTP-LP value uses the maximum number of continuously lost RTP packets within a monitoring period. |
On a service provider network with the retransmission threshold set, you can compare the RTP-LP value with the retransmission threshold to identify the existence of faults. The retransmission mechanism can address loss of a small number of packets. The greater the RTP-LP value is, the less the retransmission mechanism can help. This item is intended for unidirectional flows. |
|
RTP-ELF |
RTP effective loss factor for Forward Error Correct (FEC), in units of one hundred thousandth. |
The RTP-ELF value is calculated based on the FEC sliding window and packet loss threshold. After each window slide, the system identifies whether the number of lost data packets in the window within the monitoring period is greater than the threshold. If yes, the system increases RTP-ELF by 1. The window sliding stops when the monitoring period expires. |
If the total number of packet loss windows is greater than 0 within a monitoring period, a video fault exists. |
Restrictions and guidelines
eMDI is required on each node that monitored data flows traverse.
An eMDI instance can monitor only one data flow. The data flows for different eMDI instances cannot be the same or overlapped.
The following data flows are overlapped:
· flow ipv4 tcp source 1.1.1.1 destination 2.2.2.2
· flow ipv4 tcp source 1.1.1.1 destination 2.2.2.2 destination-port 20
The following data flows are not overlapped:
· flow ipv4 tcp source 1.1.1.1 destination 2.2.2.2 destination-port 10
· flow ipv4 tcp source 1.1.1.1 destination 2.2.2.2 destination-port 20
The clock-rate keyword for the flow ipv4 udp command does not result in UDP flow overlapping.
A started eMDI instance automatically stops upon a master/subordinate or active/standby switchover. You must execute the start command again to start the instance.
To modify the configuration for an eMDI instance that is already started, stop the instance first by executing the stop command.
Incomplete eMDI data might cause deviations in the monitoring results. The eMDI data is incomplete in the following situations:
· Not all packets of the monitored data flow pass through the device.
· All packets of the monitored data flow pass through the device, but not all of the packets are forwarded by the same member device.
Prerequisites
Identify the characteristics of the data flows to be monitored so you can specify data flows for eMDI instances.
Configure eMDI
Configuring an eMDI instance
1. Enter system view.
system-view
2. Enable eMDI and enter its view.
emdi
By default, eMDI is disabled.
3. Create an eMDI instance and enter its view.
instance instance-name
By default, no eMDI instance exists.
4. (Optional.) Configure a description for the eMDI instance.
description text
By default, an eMDI instance does not have a description.
5. Specify the data flow to be monitored by using the eMDI instance.
Choose one option as needed:
¡ Specify a TCP data flow.
flow ipv4 tcp source source-ip-address destination destination-ip-address [ destination-port destination-port-number | source-port source-port-number | vlan vlan-id | vni vxlan-id ] *
¡ Specify a UDP data flow.
flow ipv4 udp source source-ip-address destination destination-ip-address [ destination-port destination-port-number | source-port source-port-number | vlan vlan-id | vni vxlan-id | pt pt-value | clock-rate clock-rate-value ] *
By default, no data flow is specified for an eMDI instance.
Specifying more options defines a more granular data flow and provides more helpful monitoring data and analysis results. For example, to monitor the data from 10.0.0.1 to 10.0.1.1/100, specify the destination port number. If you do not specify the destination port number, the instance monitors the flow that the first received matching packet represents, which might cause deviations on the monitoring results.
6. (Optional.) Set the alarm thresholds for the eMDI instance.
alarm { dplr | rtp-lr | rtp-ser | uplr } threshold threshold-value
By default, the alarm thresholds for an eMDI instance are all 100.
A TCP data flow supports only the dplr and uplr keywords and a UDP data flow supports only the rtp-lr and rtp-ser keywords.
7. (Optional.) Set the eMDI alarm logging threshold, that is, the number of consecutive alarms to be suppressed before logging the event.
alarm suppression times times-value
By default, the eMDI alarm logging threshold is 3.
8. (Optional.) Specify the sliding window size and packet loss threshold for the UDP data flow to be monitored.
fec { window window-size | threshold threshold-value } *
By default, the sliding window size and packet loss threshold for the UDP data flow is 100 and 5, respectively.
9. (Optional.) Specify the eMDI instance lifetime.
lifetime { seconds seconds | minutes minutes | hours hours | days days }
By default, the eMDI instance lifetime is 1 hour.
10. (Optional.) Specify the monitoring period for the eMDI instance.
monitor-period period-value
By default, the monitoring period for an eMDI instance is 60 seconds.
Starting an eMDI instance
1. Enter system view.
system-view
2. Enter eMDI view.
emdi
3. Enter eMDI instance view.
instance instance-name
4. Start the eMDI instance.
Start
Stopping an eMDI instance
To stop a single eMDI instance:
1. Enter system view.
system-view
2. Enter eMDI view.
emdi
3. Enter eMDI instance view.
instance instance-name
4. Stop the eMDI instance.
Stop
To stop all eMDI instances:
1. Enter system view.
system-view
2. Enter eMDI view.
emdi
3. Stop all eMDI instances.
stop all
Display and maintenance commands for eMDI
Execute display commands in any view and reset commands in user view.
|
Task |
Command |
|
Display eMDI instance information. |
display emdi instance [ name instance-name | id instance-id ] [ verbose ] |
|
Display eMDI instance resource information. |
display emdi resource |
|
Display monitoring statistics for an eMDI instance. |
display emdi statistics { instance-name instance-name | instance-id instance-id } [ number number ] [ abnormal | verbose ] |
|
Clear eMDI statistics. |
reset emdi statistics [ instance-name instance-name | instance-id instance-id-value ] |
eMDI configuration examples
Example: Configuring an eMDI instance for a UDP data flow
Network configuration
As shown in Figure 2, the camera sends an RTP video data flow to the server through Device A, Device B, and Device C. The server is experiencing an erratic video display problem. Configure eMDI on Device A, Device B, and Device C to locate the faulty link or device.

Prerequisites
Assign IP addresses to the devices. Make sure all devices can reach each other.
Procedure
1. Configure Device A:
# Enable eMDI.
<DeviceA> system-view
[DeviceA] emdi
# Create an eMDI instance named as test.
[DeviceA-emdi] instance test
# Specify the UDP data flow for the instance to monitor. Set the source and destination IP addresses to 192.168.1.2 and 10.1.1.2, respectively.
[DeviceA-emdi-instance-test] flow ipv4 udp source 192.168.1.2 destination 10.1.1.2
# Set the monitoring period to 10 seconds.
[DeviceA-emdi-instance-test] monitor-period 10
# Set the eMDI instance lifetime to 30 minutes.
[DeviceA-emdi-instance-test] lifetime minutes 30
# Start the eMDI instance.
[DeviceA-emdi-instance-test] start
2. Configure Device B and Device C as Device A is configured. (Details not shown.)
Verifying the configuration
After the eMDI instance runs for a while, display brief monitoring statistics for the eMDI instance on each device to locate the fault.
# Display brief monitoring statistics for eMDI instance test on Device A.
<DeviceA> display emdi statistics instance-name test
Instance name : test
Instance ID : 1
Monitoring period: 10 sec
Protocol : UDP
Unit for RTP-LR, RTP-SER and RTP-ELF is 1/100000
Timestamp Status RTP-LR RTP-SER Jitter(us) RTP-LP RTP-ELF
2019/09/17 16:17:20 Normal 0 0 2560 0 0
2019/09/17 16:17:10 Abnormal 50000 0 2459 1 100000
2019/09/17 16:17:00 Abnormal 12634 33333 5236 3 23356
