Manage logs
Logs management enables you to view the users' operation logs and system-generated logs, which helps you to understand the working mechanism of the cluster. You can also debug and troubleshoot the system through logs, which greatly shortens the system operation and maintenance time.
The system supports operation logs, system logs, and diagnosis logs. Operation logs are available by default. System logs and diagnosis logs are available after you "Deploy the system log component." The AR version of the system does not support system logs and diagnosis logs.
Operation logs—Operation logs are the access record logs generated by specific applications. An operation log records all information about a user action, including time, operator name, operator IP address, object, severity, result, and description, which is necessary in subsequent audits and statistics. Operation logs are mainly used to audit user behaviors.
System logs—System logs record software problems and monitor system events. You can view system errors, discover the causes of abnormal events, and find problems exposed when the system is abnormal.
System logs are mainly used to record system internal faults, including system software logs, application logs, and system security logs.
Diagnosis logs—Diagnosis logs are the basic logs for program running and the main way for program developers to troubleshoot problems and discover causes. Diagnosis logs contain the following information: time, functional module, functional operation, error threads, error classes, functions, and lines of codes, error stack information, and error service information printed by the developer.
Diagnosis logs are mainly used by developers for troubleshooting.
You can also obtain gateway-level logs, real-time component operation logs, and container logs, and store the logs on a remote server.
Mechanism
Operation logs
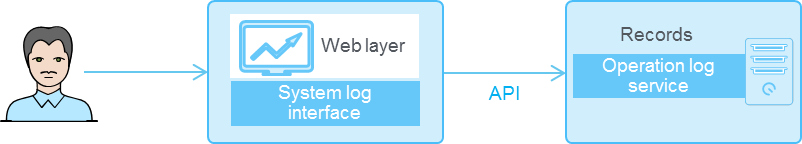
When a user performs operations in the system, such as logging in and configuring services, the system calls the interface of the operation log service and records the operation request. The logs are displayed on the operation log page.
Figure-1 Operation log mechanism
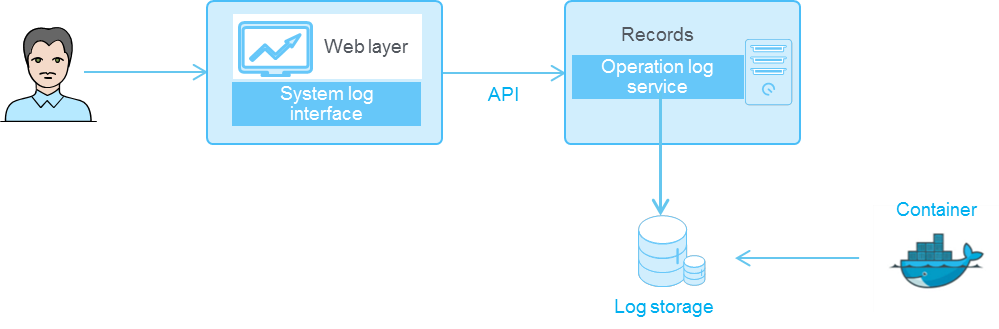
System logs and diagnosis logs
System logs and diagnosis logs use the Kubernetes log architecture, in which the system stores the logs in a fixed node directory and displays them on the log page for users to view. You can view more Kubernetes log architecture information on the Internet.
Figure-2 System log/diagnosis log mechanism