View the application O&M dashboard
On the top navigation bar, click Cloud Services, and then select Application Diagnostics from the App Service menu.
From the left navigation pane, select Apps Diagnostics.
Click App O&M Dashboard on the top right of the page.
The application O&M dashboard displays the following information in a visualized and dynamic manner:
Health statistics data for application groups.
Real-time health state and alarm quantity for each application.
Alarm statistics data.
Health statistics data for applications.
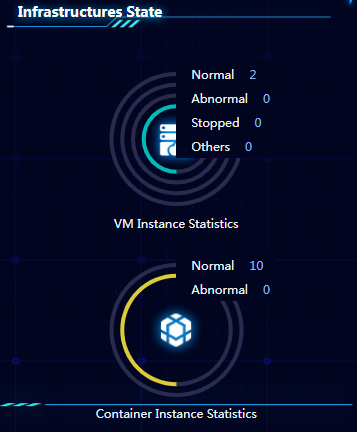
Infrastructure state statistics.
The five applications with the highest error rates, the five applications with highest throughputs, the slowest five applications, and the five applications with the lowest health scores.
Figure-1 Health statistics data for application group
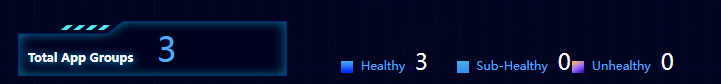
Figure-2 Application health information

Figure-3 Alarm statistics
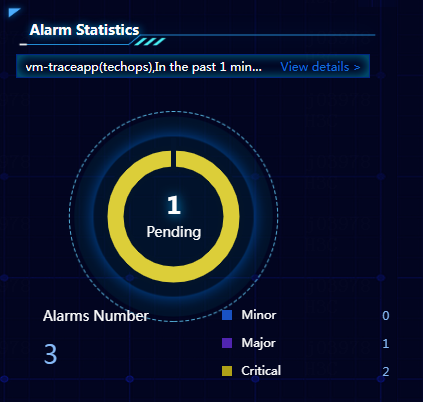
Figure-4 Application statistics
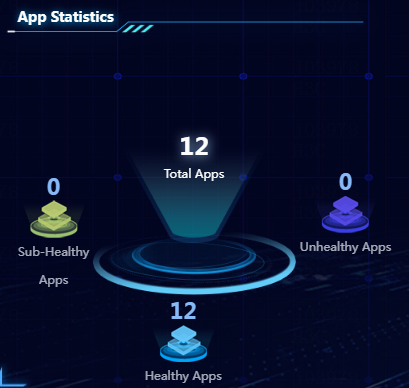
Figure-5 Infrastructure statistics