| Title | Size | Downloads |
|---|---|---|
| H3C S12500-X & S12500X-AF Switch Series Troubleshooting Guide-6W100-book.pdf | 415.71 KB |
- Table of Contents
- Related Documents
-
H3C S12500-X & S12500X-AF Switch Series
Troubleshooting Guide
Document version: 6W100-20190610
Copyright © 2019 New H3C Technologies Co., Ltd. All rights reserved.
No part of this manual may be reproduced or transmitted in any form or by any means without prior written consent of New H3C Technologies Co., Ltd.
Except for the trademarks of New H3C Technologies Co., Ltd., any trademarks that may be mentioned in this document are the property of their respective owners.
The information in this document is subject to change without notice
Contents
Collecting log and operating information· 1
Collecting common log messages· 2
Collecting operating statistics· 5
Contacting technical support 8
Newly installed standby MPU boot failure· 16
Newly installed LPU boot failure· 18
Operating power supply failure· 20
Newly installed power supply failure· 22
Troubleshooting system management 26
High CPU utilization on a card· 26
High memory utilization on a card· 28
1G/10G Base-T copper port fails to come up· 32
1000-Mbps SFP fiber port fails to come up· 34
10-Gigabit SFP+ fiber port fails to come up· 35
40-GE QSFP+ fiber port fails to come up· 37
100-GE QSFP28 fiber port fails to come up· 39
100-GE CFP/CFP2 fiber port fails to come up· 40
100-GE CXP fiber port fails to come up· 42
Non-H3C transceiver module error message· 43
Transceiver module does not support digital diagnosis· 44
Error frames (for example, CRC errors) on a port 45
Failure to receive packets· 48
Troubleshooting QoS and ACL· 62
ACL application failure for unsupported ACL rules· 62
ACL application failure for insufficient resources· 63
ACL application failure without an error message· 64
Interface assignment failure (for Release 10xx) 69
Interface assignment failure (for Releases 11xx, 26xx, and 27xx) 72
Introduction
This document provides information about troubleshooting common software and hardware issues with H3C S12500-X and S12500X-AF switches.
General guidelines
| IMPORTANT: To prevent an issue from causing loss of configuration, save the configuration each time you finish configuring a feature. For configuration recovery, regularly back up the configuration to a remote server. |
When you troubleshoot H3C S12500-X and S12500X-AF switches, follow these general guidelines:
· To help identify the cause of the issue, collect system and configuration information, including:
¡ Symptom, time of failure, and configuration.
¡ Network topology information, including the network diagram, port connections, and points of failure.
¡ Log messages and diagnostic information. For more information about collecting this information, see "Collecting log and operating information."
¡ Physical evidence of failure:
- Photos of the hardware.
- Status of the card, power, and fan status LEDs.
¡ Steps you have taken, such as reconfiguration, cable swapping, and reboot.
¡ Output from the commands executed during the troubleshooting process.
· To ensure safety, wear an ESD wrist strap when you replace or maintain a hardware component.
· If hardware replacement is required, use the release notes to verify the hardware and software compatibility.
Collecting log and operating information
| IMPORTANT: By default, the information center is enabled. If the feature is disabled, you must use the info-center enable command to enable the feature for collecting log messages. |
Table 1 shows the types of files that the system uses to store operating log and status information. You can export these files by using FTP, or TFTP.
These files are stored on the active MPU (in standalone mode) or global active MPU (in IRF mode). Multiple MPUs will have log files if active/standby or master/subordinate switchovers have occurred. You must collect log files from all these MPUs. To more easily locate log information, use a consistent rule to categorize and name files. For example, save log files to a separate folder for each MPU, and include their chassis and slot numbers in the folder names.
Table 1 Log and operating information
Category | File name format | Content |
Common log | logfile.log | Command execution and operational log messages. |
Diagnostic log | diagfile.log | Diagnostic log messages about device operation, including the following items: · Parameter settings in effect when an error occurs. · Information about a card startup error. · Handshaking information between the MPU and interface cards when a communication error occurs. |
Operating statistics | file-basename.gz | Current operating statistics for feature modules, including the following items: · Device status. · CPU status. · Memory status. · Configuration status. · Software entries. · Hardware entries. |
Collecting common log messages
Collecting common log messages from the log buffer
1. Save common log messages from the log buffer to a log file:
By default, the log file is saved in the logfile directory of the flash memory on the active MPU (in standalone mode) or global active MPU (in IRF mode).
# Save log messages to the log file on the default MDC (Admin).
<Sysname> logfile save
The contents in the log file buffer have been saved to the file flash:/logfile/lo
Gfile.log
# Identify non-default MDCs created on the device.
<Sysname> display mdc
ID Name Status
---------------------------------
1 Admin active
2 mdc2 active
3 mdc3 active
# Save log messages to the log file on each non-default MDC.
<Sysname> system-view
[Sysname] switchto mdc mdc2
******************************************************************************
* Copyright (c) 2004-2018 New H3C Technologies Co., Ltd. All rights reserved.*
* Without the owner's prior written consent, *
* no decompiling or reverse-engineering shall be allowed. *
******************************************************************************
<Sysname> logfile save
The contents in the log file buffer have been saved to the file flash:/logfile/logfile.log
<Sysname> switchback
[Sysname] switchto mdc 3
******************************************************************************
* Copyright (c) 2004-2018 New H3C Technologies Co., Ltd. All rights reserved.*
* Without the owner's prior written consent, *
* no decompiling or reverse-engineering shall be allowed. *
******************************************************************************
<Sysname> logfile save
The contents in the log file buffer have been saved to the file flash:/logfile/logfile.log
<Sysname> switchback
2. On the default MDC, identify the log file on each MPU for each MDC:
# Display the log file on the active MPU (in standalone mode) or global active MPU (in IRF mode) for the default MDC.
<Sysname> dir flash:/logfile/
Directory of flash:/logfile
0 -rw- 97764 Apr 27 2018 15:55:32 logfile.log
1021104 KB total (421552 KB free)
# Display the log file on each standby MPU for the default MDC:
¡ In standalone mode, display the log file on the standby MPU.
<Sysname> dir slot16#flash:/logfile/
Directory of slot16#flash:/logfile
0 -rw- 21863 Apr 27 2018 16:00:37 logfile.log
1021104 KB total (421552 KB free)
¡ In IRF mode, display the log file on each standby MPU.
<Sysname> dir chassis2#slot17#flash:/logfile/
Directory of chassis2#slot17#flash:/logfile
0 -rw- 21863 Apr 27 2018 16:00:37 logfile.log
1021104 KB total (421552 KB free)
| NOTE: If a subordinate chassis has two MPUs, make sure you identify and export the log files on both MPUs. |
# Display the log file on each MPU for each non-default MDC.
<Sysname> dir flash:/mdc/
Directory of flash:/mdc
0 drw- - Apr 27 2018 14:56:50 mdc2
1 drw- - Apr 27 2018 16:48:04 mdc3
<Sysname> dir flash:/mdc/mdc2/logfile/
Directory of flash:/mdc/mdc2/logfile
0 -rw- 465 Apr 27 2018 16:08:51 logfile.log
1021104 KB total (421476 KB free)
<Sysname> dir flash:/mdc/mdc3/logfile/
Directory of flash:/mdc/mdc3/logfile
0 -rw- 465 Apr 27 2018 16:10:39 logfile.log
1021104 KB total (421476 KB free)
3. Transfer the files to the desired destination by using FTP or TFTP. (Details not shown.)
Collecting diagnostic log messages from the diagnostic log file buffer
1. Save diagnostic log messages from the diagnostic log file buffer to a diagnostic log file:
By default, the diagnostic log file is saved in the diagfile directory of the flash memory on the active MPU (in standalone mode) or global active MPU (in IRF mode).
# Save diagnostic log messages to the diagnostic log file on the default MDC (Admin).
<Sysname> diagnostic-logfile save
The contents in the diagnostic log file buffer have been saved to the file flash:/diagfile/diagfile.log
# Identify non-default MDCs created on the device.
<Sysname> display mdc
ID Name Status
---------------------------------
1 Admin active
2 mdc2 active
3 mdc3 active
# Save diagnostic log messages to the diagnostic log file on each non-default MDC.
<Sysname> system-view
[Sysname] switchto mdc mdc2
******************************************************************************
* Copyright (c) 2004-2018 New H3C Technologies Co., Ltd. All rights reserved.*
* Without the owner's prior written consent, *
* no decompiling or reverse-engineering shall be allowed. *
******************************************************************************
<Sysname> diagnostic-logfile save
The contents in the diagnostic log file buffer have been saved to the file flash:/diagfile/diagfile.log
<Sysname> switchback
[Sysname] switchto mdc 3
******************************************************************************
* Copyright (c) 2004-2018 New H3C Technologies Co., Ltd. All rights reserved.*
* Without the owner's prior written consent, *
* no decompiling or reverse-engineering shall be allowed. *
******************************************************************************
<Sysname> diagnostic-logfile save
The contents in the diagnostic log file buffer have been saved to the file flash:/diagfile/diagfile.log
<Sysname> switchback
2. On the default MDC, identify the diagnostic log file on each MPU for each MDC:
# Display the diagnostic log file on the active MPU (in standalone mode) or global active MPU (in IRF mode) for the default MDC.
<Sysname> dir flash:/diagfile/
Directory of flash:/diagfile
0 -rw- 161321 Apr 27 2018 16:16:00 diagfile.log
1021104 KB total (421416 KB free)
# Display the diagnostic log file on each standby MPU for the default MDC:
¡ In standalone mode, display the diagnostic log file on the standby MPU.
<Sysname> dir slot16#flash:/diagfile/
Directory of slot16#flash:/diagfile
0 -rw- 161321 Apr 27 2018 16:16:00 diagfile.log
1021104 KB total (421416 KB free)
¡ In IRF mode, display the diagnostic log file on each standby MPU.
<Sysname> dir chassis2#slot17#flash:/diagfile/
Directory of chassis2#slot17#flash:/diagfile
0 -rw- 161321 Apr 27 2018 16:16:00 diagfile.log
1021104 KB total (421416 KB free)
| NOTE: If a subordinate chassis has two MPUs, make sure you identify and export the diagnostic log files on both MPUs. |
# Display the diagnostic log file on each MPU for each non-default MDC.
<Sysname> dir flash:/mdc/
Directory of flash:/mdc
0 drw- - Apr 27 2018 14:56:50 mdc2
1 drw- - Apr 27 2018 16:48:04 mdc3
<Sysname> dir flash:/diagfile/
Directory of flash:/diagfile
0 -rw- 349 Apr 27 2018 16:21:38 diagfile.log
1021104 KB total (421352 KB free)
<Sysname> dir flash:/diagfile/
Directory of flash:/diagfile
0 -rw- 349 Apr 27 2018 16:24:41 diagfile.log
1021104 KB total (421308 KB free)
3. Transfer the files to the desired destination by using FTP, or TFTP. (Details not shown.)
Collecting operating statistics
You can collect operating statistics by saving the statistics to a file or displaying the statistics on the screen.
When you collect operating statistics, follow these guidelines:
· Log in to the device through a network or management port instead of the console port, if possible. Network and management ports are faster than the console port.
· Do not execute commands while operating statistics are being collected.
· H3C recommends saving operating statistics to a file to retain the information.
| NOTE: The amount of time to collect statistics increases along with the number of cards. |
To collect operating statistics:
1. Disable pausing between screens of output if you want to display operating statistics on the screen. Skip this step if you are saving statistics to a file.
<Sysname> screen-length disable
2. Display CPU and memory usage. Verify that the CPU usage is less than 100% and the memory usage is less than 90% before going to the next step.
<Sysname> display cpu-usage
...
<Sysname> display memory
...
3. Collect operating statistics for multiple feature modules.
<Sysname> display diagnostic-information
Save or display diagnostic information (Y=save, N=display)? [Y/N] :
4. At the prompt, choose to save or display operating statistics:
# To save operating statistics, enter y at the prompt and then specify the destination file path.
Save or display diagnostic information (Y=save, N=display)? [Y/N]:y
Please input the file name(*.tar.gz)[flash:/diag_H3C_20180523-151204.tar.gz]:
Diagnostic information is outputting to flash:/diag_H3C_20180523-151204.tar.gz.
Please wait...
Save successfully.
<Sysname> dir flash:/
Directory of flash:
…
9 -rw- 236011 May 23 2018 14:56:45 diag_H3C_20180523-151204.tar.gz
1021808 KB total (259072 KB free)
# To display operating statistics on the monitor terminal, enter n at the prompt. The output from this command varies by software version.
Save or display diagnostic information (Y=save, N=display)? [Y/N] :n
===============================================
===============display clock===============
10:27:16 UTC Wed 05/23/2018
=================================================
===============display version===============
H3C Comware Software, Version 7.1.070, Feature 2711P01
Copyright (c) 2004-2018 New H3C Technologies Co., Ltd. All rights reserved.
H3C S12508X-AF uptime is 0 weeks, 0 days, 6 hours, 29 minutes
Last reboot reason : Cold reboot
Boot image: flash:/S12500X-CMW710-BOOT-F2711P01.bin
Boot image version: 7.1.070P2211, Feature 2711P01
Compiled Apr 20 2018 11:00:00, DEBUG SOFTWARE
System image: flash:/S12500X-CMW710-SYSTEM-F2711P01.bin
System image version: 7.1.070, Feature 2711P01
Compiled Apr 20 2018 11:00:00, DEBUG SOFTWARE
Feature image(s) list:
flash:/S12500X-CMW710-DEVKIT-F2711P01.bin, version: 7.1.070
Compiled Apr 20 2018 11:00:00, DEBUG SOFTWARE
flash:/S12500X-CMW710-MANUFACTURE-F2711P01.bin, version: 7.1.070
Compiled Apr 20 2018 11:00:00, DEBUG SOFTWARE
MPU(M) Chassis 1 Slot 1:
Uptime is 0 weeks,0 days,6 hours,29 minutes
H3C S12508X-AF MPU(M) with 1 XLP316 Processor
BOARD TYPE: LSXM1SUPB1
DRAM: 8192M bytes
FLASH: 1024M bytes
NVRAM: 512K bytes
PCB 1 Version: VER.A
Bootrom Version: 154
CPLD 1 Version: 004
CPLD 2 Version: 004
CPLD 3 Version: 004
Release Version: H3C S12508X-AF-2711P01
Patch Version: None
Reboot Cause: ColdReboot
LPU Chassis 1 Slot 2:
Uptime is 0 weeks,0 days,6 hours,24 minutes
H3C S12508X-AF LPU with 1 XLP308 Processor
BOARD TYPE: LSXM1TGS48C2HB1
DRAM: 8192M bytes
FLASH: 0M bytes
NVRAM: 0K bytes
PCB 1 Version: VER.A
PCB 2 Version: VER.A
Bootrom Version: 125
CPLD 1 Version: 000
CPLD 2 Version: 000
FPGA 1 Version: 006
Release Version: H3C S12508X-AF-2711P01
Patch Version: None
Reboot Cause: ColdReboot
NPU Chassis 1 Slot 14:
Uptime is 0 weeks,0 days,6 hours,23 minutes
H3C S12508X-AF NPU with 1 XLP208 Processor
BOARD TYPE: LSXM1SFH08D1
DRAM: 4096M bytes
FLASH: 0M bytes
NVRAM: 0K bytes
PCB 1 Version: VER.A
Bootrom Version: 125
CPLD 1 Version: 001
Release Version: H3C S12508X-AF-2711P01
Patch Version: None
Reboot Cause: ColdReboot
……
Contacting technical support
· Information described in "General guidelines."
· Product serial numbers.
This information will help the support engineer assist you as quickly as possible.
The following is the contact information for H3C Support:
· Telephone number—400-810-0504.
· E-mail—service@h3c.com.
Removing deployment errors
Use the deployment checklist in Table 2 to eliminate issues that might be introduced at the deployment stage. Select items that are suitable for your site.
Question | Command or method | Result | Remarks |
Environment and card hardware status |
|
|
|
Is the switch temperature at least 20°C (68°F) lower than the warning temperature threshold? | display environment | □OK □Not OK □Not related | Make sure the temperature of the switch is 20°C (68°F) lower than the warning temperature threshold. |
Are the fan trays operating correctly? | display fan | □OK □Not OK □Not related | Make sure the fan trays are operating correctly. |
Are sufficient power supplies installed and are they operating correctly? | display power | □OK □Not OK □Not related | Make sure the following conditions are met: · You have installed sufficient power supplies to provide power redundancy. · The power supplies are operating correctly. The display power command shows that their state is Normal. |
Are the LEDs all displaying correct statuses? | Visually check the RUN LED and alarm LED on each card | □OK □Not OK □Not related | Verify that the RUN LED flashes slowly, and the alarm LED is off. |
Are all cards operating correctly? | display device | □OK □Not OK □Not related | Make sure all cards are operating correctly. · All service cards are in Normal state. · The active MPU is in Master state. · The standby MPUs are in Standby state. |
Active and standby MPUs |
|
|
|
Are the software versions of the active and standby MPUs the same? | display boot-loader | □OK □Not OK □Not related | Make sure the software versions of the active and standby MPUs are the same. |
Do the standby MPUs have a startup configuration file? | dir | □OK □Not OK □Not related | If any standby MPUs do not have a startup configuration file, execute the save command without specifying any parameters. This command enables you to save the running configuration to a configuration file and specifies the file as the next-startup configuration file on each MPU. |
CPU and memory usage |
|
|
|
Does the CPU usage change rate of any cards (MPUs and LPUs) exceed 10%? Does the sustained CPU usage exceed 60%? | display cpu-usage | □OK □Not OK □Not related | Execute the display cpu-usage command repeatedly. If the CPU of a card sustains a usage level of over 60% or has a change rate higher than 10%, execute the debug ip packet command to view the packets delivered to the CPU for analysis. |
Does the memory usage of the MPUs and LPUs exceed 60%? | display memory | □OK □Not OK □Not related | If memory usage exceeds 60%, execute the display system internal kernel memory pool slot command in probe view to identify the module that is using the most memory. |
Ports |
|
|
|
Is flow control unnecessarily enabled on ports? | display current-configuration interface | □OK □Not OK □Not related | Execute the undo flow-control command if flow control is not needed on a port. |
Are large numbers of error packets generated continuously in the outbound or inbound direction of the port? | display interface | □OK □Not OK □Not related | If an error counter displays a non-zero value and the value is increasing, check for the following errors: · Link and optical-electrical converter errors. · Port setting inconsistencies with the peer port. |
Does the port change between an up and down state frequently? | display logbuffer | □OK □Not OK □Not related | If the port state flaps, check for the following errors: · Link and optical-electrical converter errors. · Optical power threshold crossing events if the port is a fiber port. · Port setting inconsistencies with the peer port. |
Fiber ports |
|
|
|
Do the ports at the two ends use the same port settings? | display current-configuration interface | □OK □Not OK □Not related | To connect an H3C device to a device from another vendor, H3C recommends that you set the same port rate and duplex mode settings at the two ends. |
Are CRC errors present on any fiber port? Is the number of CRC errors increasing? | display interface | □OK □Not OK □Not related | If CRC errors persist, replace the transceiver module or pigtail fiber, or clean the transceiver module connector. |
Trunk port configuration |
|
|
|
Do the peer trunk ports use the same PVID? | display current-configuration interface | □OK □Not OK □Not related | Make sure the same PVID is configured on the trunk ports between two devices. |
Are the peer ports assigned to the same VLANs? | display current-configuration interface | □OK □Not OK □Not related | Make sure the trunk ports between two devices are assigned to the same VLANs. For example, if you assign a trunk port to all VLANs, also assign its peer port to all VLANs. |
Are the peer ports set to the same link type? | display current-configuration interface | □OK □Not OK □Not related | Make sure the ports between two devices use the same link type. |
Is a loop present in VLAN 1? | loopback-detection global enable vlan 1 | □OK □Not OK □Not related | Remove ports from VLAN 1 as needed. |
Spanning tree feature |
|
|
|
Is the timeout factor correctly set? | display current-configuration | □OK □Not OK □Not related | H3C recommends that you set a timeout factor in the range of 5 to 7 on a stable network to avoid unnecessary recalculations. |
Are ports connected to end-user devices configured as edge ports? | display current-configuration interface | □OK □Not OK □Not related | Verify that the output from the display current-configuration interface command contains the "stp edged-port enable" string for ports connected to end-user devices. H3C recommends that you configure ports connected to end-user devices (PCs, for example) as edge ports, or disable the spanning tree feature on the ports. |
Is the spanning tree feature disabled on ports connected to devices that do not support spanning tree protocols? | display current-configuration interface | □OK □Not OK □Not related | Disable the spanning tree feature on ports connected to devices that do not support spanning tree protocols. Make sure the output from the display current-configuration interface command contains the "undo stp enable" string for these ports. |
Is the device running MSTP, STP, or RSTP, and working with a Cisco PVST+ device? | display stp | □OK □Not OK □Not related | To avoid interoperability issues, H3C recommends you set up a Layer 3 connection to the Cisco device. |
Do the topologies of MSTIs meet the design? Are there as few overlapping paths as possible among MSTIs? | display current-configuration interface | □OK □Not OK □Not related | If the topologies deviate from the design, reassign ports to VLANs and revise the VLAN and instance mappings. For optimal load balancing, plan VLANs and VLAN-to-instance mappings to minimize overlapping paths among different MSTIs. |
Does a TC attack exist to cause frequent STP status changes on any ports? | display stp tc display stp history | □OK □Not OK □Not related | Examine the following items in the command output for TC attacks: · Incoming and outgoing TC/TCN BPDU statistics. · Historical port role calculation information. There is a risk of TC attack if frequent STP status changes occur on a stable network. Make sure you have configured the following settings: · Configure ports connected to end-user devices as edge ports, and enable BPDU guard. Alternatively, disable the spanning tree feature on the ports. · Disable the spanning tree feature on ports connected to devices that do not support spanning tree protocols. · Do not disable TC-BPDU guard. |
VRRP |
|
|
|
Is the handshake interval correctly set? Are the handshake intervals of the two ends the same? | display vrrp | □OK □Not OK □Not related | Change the handshake interval to 3 seconds if the number of VRRP groups is less than five. If five or more VRRP groups exist, assign three or five VRRP groups into one group, and configure the handshake interval as 3 seconds, 5 seconds, and 7 seconds for each group. |
ARP |
|
|
|
Are there ARP conflicts? | display logbuffer | □OK □Not OK □Not related | If the log contains ARP conflict records, verify that the hosts in conflict are legitimate, and remove the conflicts. |
OSPF |
|
|
|
Is the router ID of the device unique on the network? | display ospf peer | □OK □Not OK □Not related | Change the router ID if it is not unique on the network. To restart route learning after you remove the router ID conflict, you must execute the reset ospf process command. |
Are there a lot of errors in the output from the display ospf statistics error command? | display ospf statistics error | □OK □Not OK □Not related | If a large number of OSPF errors has occurred and the number continues to increase, collect the error information for further analysis. |
Are there severe route flappings? | display ip routing-table statistics | □OK □Not OK □Not related | Examine the statistics for added and deleted routes during the system uptime. If route flapping occurs, locate the flapping route and the source device to analyze the cause. You can use the display ospf lsdb command multiple times to view the age of routes and locate the flapping route. |
Is the OSPF status stable? | display ospf peer | □OK □Not OK □Not related | View the up time of the OSPF neighbor. |
Routes |
|
|
|
Is the default route correct? Are there any routing loops? | tracert debug ip packet | □OK □Not OK □Not related | Use the tracert command to trace the path to a nonexistent network (1.1.1.1, for example) to check for routing loops. If a routing loop exists, check the configuration of the involved devices for errors. Adjust the route to remove the loop. Use the debug ip packet command to check for packets with TTL 0 or 1. If TTL exceeded packets are received, check for network route errors. |
CPU security |
|
|
|
Are there packet attacks on CPU? | debug rxtx softcar show | □OK □Not OK □Not related | Execute the debug rxtx softcar show command in probe view to view packet rate limit information for cards. The CPU is under attack if the number of packets of a type keeps increasing unusually. |
Records in the local log buffer |
|
|
|
Does the local log buffer contain exception records? | · In standalone mode: · In IRF mode: | □OK □Not OK □Not related | Execute the local logbuffer display command in probe view. If the local log buffer contains exception records, contact H3C Support to troubleshoot the exceptions. Use the following commands in probe view to clear the history records after the exceptions are removed: · In standalone mode: · In IRF mode: |
Troubleshooting hardware
This section provides troubleshooting information for common hardware issues.
| NOTE: This section describes how to troubleshoot MPUs, LPUs, power supplies, and fan trays. To troubleshoot transceiver modules, ports, and temperature alarms, see "Troubleshooting ports" and "Troubleshooting system management." |
MPU reboot failure
Symptom
An MPU fails to reboot.
Troubleshooting flowchart
Figure 1 Troubleshooting MPU reboot failure
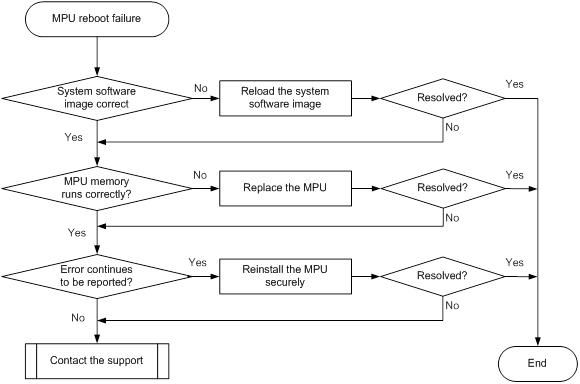
Solution
To resolve the issue:
1. Verify that the system software image on the MPU is correct.
a. Log in to the MPU through the console port and restart the switch. If the system reports that a CRC error occurs or that no system software image is available during the BootWare loading process, reload the system software image.
b. Verify that the system software image in the flash memory is the same size as the one on the server. If no system software image is available in the flash memory, or if the image size is different from the one on the server, reload the system software image. Then set the reloaded system software image to the current system software image.
The system software image in the flash memory is automatically set to the current system software image during the BootWare loading process.
2. Verify that the MPU memory is running correctly.
Reboot the MPU, and immediately press CTRL+T to examine the memory. If a memory fault is detected, replace the MPU.
3. Verify that no error is reported during the BootWare loading process.
If there are still errors reported during the BootWare loading process, identify the faulty module and verify that the MPU is installed securely.
¡ If the MPU is not installed securely, remove and reinstall the MPU.
¡ If the MPU is installed securely, replace the MPU.
4. If the issue persists, contact H3C Support.
Newly installed standby MPU boot failure
Symptom
An MPU designated as the standby MPU fails to boot after installation.
Troubleshooting flowchart
Figure 2 Troubleshooting newly installed standby MPU boot failure
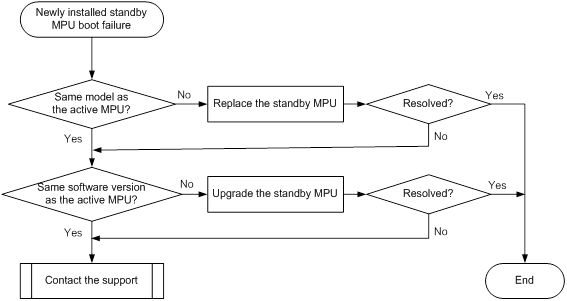
Solution
To resolve the issue:
1. Verify that the newly installed standby MPU is the same model as the active MPU. If they are not the same model, replace the standby MPU with one that is the same model as the active MPU.
2. Verify that the standby MPU runs the same software version as the active MPU. If the two MPUs run different software versions, upgrade the software version of the standby MPU to make sure the two MPUs run the same software version.
3. If the issue persists, contact H3C Support.
LPU reboot failure
Symptom
An LPU fails to reboot.
Troubleshooting flowchart
Figure 3 Troubleshooting LPU reboot failure
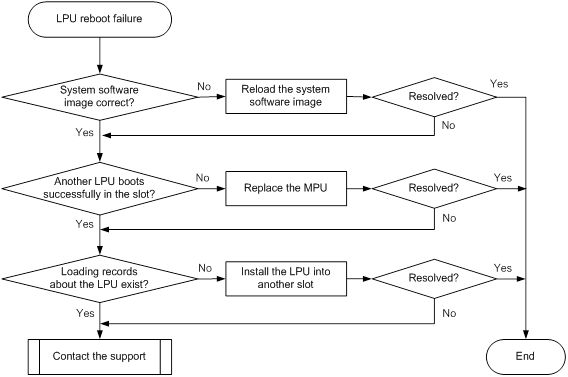
Solution
To resolve the issue:
1. Verify that the system software image is available and that the image is the same size as the one on the server. If no system software image is available, or the system software image size is different from the one on the server, reload the system software image.
Software images on slot 16:
Current software images:
flash:/S12500-X-CMW710-BOOT-D1031.bin
flash:/S12500-X-CMW710-SYSTEM-D1031.bin
Main startup software images:
flash:/S12500-X-CMW710-BOOT-D1031.bin
flash:/S12500-X-CMW710-SYSTEM-D1031.bin
Backup startup software images:
None
<Sysname> dir
Directory of flash:
0 drw- - Sep 26 2013 16:18:06 core
1 drw- - Jun 30 2013 11:32:34 diagfile
2 -rw- 7122 Dec 23 2013 10:02:46 ifindex.dat
3 drw- - Aug 30 2013 11:51:15 logfile
4 -rw- 20529152 Dec 22 2013 14:28:40 S12500-X-cmw710-boot-d1031.bin
5 -rw- 178325504 Dec 22 2013 14:39:02 S12500-X-cmw710-system-d1031.bin
6 drw- - Jun 30 2013 11:32:34 seclog
7 -rw- 17175 Dec 23 2013 10:02:48 startup.cfg
8 -rw- 276535 Dec 23 2013 10:02:48 startup.mdb
9 drw- - Nov 12 2013 11:11:54 versionInfo
503808 KB total (125896 KB free)
2. Install another LPU into the slot.
¡ If the new LPU boots successfully, the MPU and backplane run correctly. Go to step 3.
¡ If the new LPU fails to boot, replace the MPU.
3. Verify that the LPU has loaded files.
<Sysname> display logbuffer
%May 3 13:27:17:086 2013 H3C DEVM/4/BOARD_LOADING: Board is loading file on Chassis 1 Slot 7.
%May 3 13:27:17:647 2013 H3C DEVM/5/LOAD_FINISHED: Board has finished loading file on Chassis 1 Slot 7.
¡ If there are loading records about the LPU, install the LPU into another slot to verify that the LPU can boot successfully.
¡ If there are no loading records about the LPU, go to step 4.
4. If the issue persists, contact H3C Support.
Newly installed LPU boot failure
Symptom
A newly installed LPU fails to boot.
Troubleshooting flowchart
Figure 4 Troubleshooting newly installed LPU boot failure
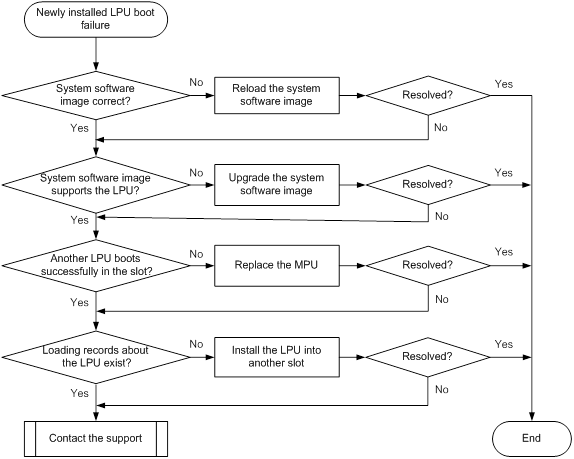
Solution
To resolve the issue:
1. Verify that the system software image is available and that the image is the same size as the one on the server. If no system software image is available, or the system software image size is different from the one on the server, reload the system software image.
<Sysname> display boot-loader
Software images on slot 16:
Current software images:
flash:/S12500-X-CMW710-BOOT-D1031.bin
flash:/S12500-X-CMW710-SYSTEM-D1031.bin
Main startup software images:
flash:/S12500-X-CMW710-BOOT-D1031.bin
flash:/S12500-X-CMW710-SYSTEM-D1031.bin
Backup startup software images:
None
<Sysname> dir
Directory of flash:
0 drw- - Sep 26 2013 16:18:06 core
1 drw- - Jun 30 2013 11:32:34 diagfile
2 -rw- 7122 Dec 23 2013 10:02:46 ifindex.dat
3 drw- - Aug 30 2013 11:51:15 logfile
4 -rw- 20529152 Dec 22 2013 14:28:40 S12500-X-cmw710-boot-d1031.bin
5 -rw- 178325504 Dec 22 2013 14:39:02 S12500-X-cmw710-system-d1031.bin
6 drw- - Jun 30 2013 11:32:34 seclog
7 -rw- 17175 Dec 23 2013 10:02:48 startup.cfg
8 -rw- 276535 Dec 23 2013 10:02:48 startup.mdb
9 drw- - Nov 12 2013 11:11:54 versionInfo
503808 KB total (125896 KB free)
¡ If the LPU boots successfully, the MPU is running correctly. Go to step 4.
¡ If the LPU fails to boot, replace the MPU.
4. Verify that the LPU has loaded files.
[Sysname]display logbuffer
%May 3 13:27:17:086 2013 H3C DEVM/4/BOARD_LOADING: Board is loading file on Chassis 1 Slot 7.
%May 3 13:27:17:647 2013 H3C DEVM/5/LOAD_FINISHED: Board has finished loading file on Chassis 1 Slot 7.
¡ If there are loading records about the LPU, install the LPU into another slot to verify that the LPU can boot successfully.
¡ If there are no loading records about the LPU, go to step 5.
5. If the issue persists, contact H3C Support.
Operating power supply failure
Symptom
An operating power supply fails.
Troubleshooting flowchart
Figure 5 Troubleshooting operating power supply failure
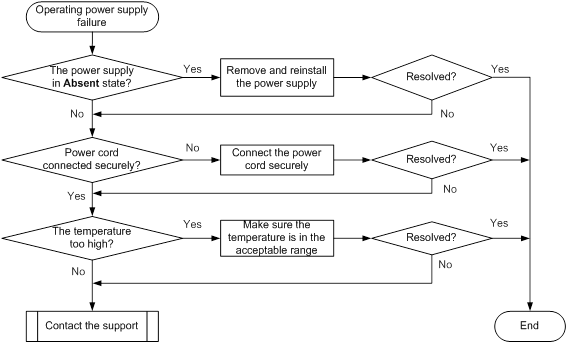
Solution
To resolve the issue:
1. Identify the operating state of the power supply.
¡ Execute the display power command to view the operating state of the power supply.
<Sysname> display power
PowerID State Current(A) Voltage(V) Power(W)
1 Normal 7.80 54.02 421.35
2 Normal 9.20 53.99 496.70
3 Absent -- -- --
4 Absent -- -- --
5 Absent -- -- --
6 Absent -- -- --
7 Absent -- -- --
8 Absent -- -- --
¡ Execute the display alarm command to view alarm information about the power supply.
<Sysname> display alarm
Slot CPU Level Info
- - INFO Power 3 is absent.
- - INFO Power 4 is absent.
- - INFO Power 5 is absent.
- - INFO Power 6 is absent.
- - INFO Power 7 is absent.
- - INFO Power 8 is absent.
If the power supply is in Absent state, go to step 2. If the power supply is in Fault state, go to step 3.
2. Verify that the power supply is installed securely.
Remove and reinstall the power supply to make sure the power supply is installed securely. Then execute the display power command to verify that the power supply has changed to Normal state. If the power supply remains in Absent state, replace the power supply.
3. Verify that the power supply is operating correctly.
a. Verify that the power cord is connected to the power supply securely.
<Sysname> display power
PowerID State Mode Current(A) Voltage(V) Power(W)
1 Normal AC 2.60 53.81 139.90
2 Fault AC 0 0 0
If the voltage and current of the power supply are 0 and the power supply state is Fault, the power cord is disconnected. Connect the power cord securely to the power supply. Then execute the display power command to verify that the power supply has changed to Normal state.
b. Determine whether the power supply is in high temperature. If dust accumulation on the power supply causes the high temperature, remove the dust. Then remove and reinstall the power supply. Execute the display power command to verify that the power supply has changed to Normal state.
c. Install the power supply into an empty power supply slot. Then execute the display power command to verify that the power supply has changed to Normal state in the new slot. If the power supply remains in Fault state, replace the power supply.
4. If the issue persists, contact H3C Support.
Newly installed power supply failure
Symptom
A newly installed power supply fails.
Troubleshooting flowchart
Figure 6 Troubleshooting newly-installed power supply failure
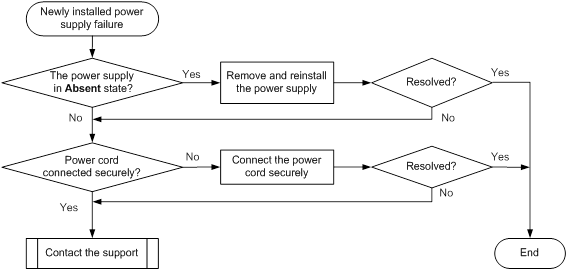
Solution
To resolve the issue:
1. Identify the operating state of the power supply.
¡ Execute the display power command to view the operating state of the power supply.
<Sysname> display power
PowerID State Current(A) Voltage(V) Power(W)
1 Normal 7.80 54.02 421.35
2 Normal 8.80 53.99 475.11
3 Absent -- -- --
4 Absent -- -- --
5 Absent -- -- --
6 Absent -- -- --
7 Absent -- -- --
8 Absent -- -- --
¡ Execute the display alarm command to view alarm information about the power supply.
<Sysname> display alarm
Slot CPU Level Info
- - INFO Power 3 is absent.
- - INFO Power 4 is absent.
- - INFO Power 5 is absent.
- - INFO Power 6 is absent.
- - INFO Power 7 is absent.
- - INFO Power 8 is absent.
If the power supply is in Absent state, go to step 2. If the power supply is in Fault state, go to step 3.
2. Verify that the power supply is installed securely.
a. Remove and reinstall the power supply to make sure the power supply is installed securely. Then execute the display power command to verify that the power supply has changed.
b. Remove and install the power supply into an empty power supply slot. Then execute the display power command to verify that the power supply has changed to Normal state in the new slot. If the power supply remains in Absent state, go to step 4.
3. Verify that the power supply is operating correctly.
a. Verify that the power supply is connected to the power source correctly. If it is not, connect it to the power source correctly. Then execute the display power command to verify that the power supply has changed.
b. Remove and install the power supply into an empty power supply slot. Then execute the display power command to verify that the power supply has changed to Normal state in the new slot. If the power supply remains in Fault state, go to step 4.
4. If the issue persists, contact H3C Support.
Fan tray failure
Symptom
An operating fan tray or a newly installed fan tray fails.
Troubleshooting flowchart
Figure 7 Troubleshooting fan tray failure
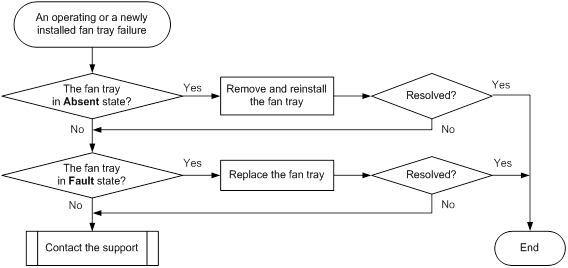
Solution
To resolve the issue:
1. Identify the operating state of the fan tray.
¡ Execute the display fan command to view the operating state of the fan tray.
<Sysname> display fan
Fan-tray 1:
Status : Normal
Fan number: 5
Fan mode : Auto
Airflow Direction: Front-to-back
Fan Status Speed(rpm)
--- ---------- ----------
1 Normal 3881
2 Normal 1690
3 Normal 1693
4 Normal 1563
5 Normal 1645
Fan-tray 2:
Status : Absent
¡ Execute the display alarm command to view alarm information about the fan tray.
<Sysname> display alarm
Slot CPU Level Info
- - ERROR Fan 2 is faulty.
- - INFO Power 3 is absent.
- - INFO Power 4 is absent.
- - INFO Power 5 is absent.
- - INFO Power 6 is absent.
- - INFO Power 7 is absent.
- - INFO Power 8 is absent.
If the fan tray is in Absent state, go to step 2. If the fan tray is in Fault state, go to step 3.
2. Verify that the fan tray is installed securely.
Remove and reinstall the fan tray to make sure the fan tray is installed securely. Then execute the display fan command to verify that the fan tray has changed to Normal state. If the fan tray remains in Absent state, replace the fan tray.
3. Verify that the fan tray is operating correctly.
a. Identify whether the fan tray is faulty.
- Execute the display environment command to view temperature information.
If the temperature continues to rise, put your hand at the air outlet to feel if air is being expelled out of the air outlet. If no air is being expelled out of the air outlet, the fan tray is faulty.
- Execute the display fan command to view the fan speed information.
If the fan speed is less than 500 rpm, the fan tray is faulty.
b. If the fan tray is faulty, remove and reinstall the fan tray to make sure the fan tray is installed securely. Then execute the display fan command to verify that the fan tray has changed to Normal state.
c. If the fan tray remains in Fault state, replace the fan tray.
You must make sure the switching operating temperature is below 60°C (140°F) while you replace the fan tray. If a new fan tray is not readily available, power off the switch to avoid damage caused by high temperature.
4. If the issue persists, contact H3C Support.
Related commands
This section lists the commands that you might use for troubleshooting the hardware.
Command | Description |
dir | Displays information about files and directories. |
display alarm | Displays alarm information. |
display boot-loader | Displays current configuration files and system software images. |
display environment | Displays temperature information. |
display fan | Displays the operating states of the fan tray. |
display logbuffer | Displays the state of the log buffer and the log information in the log buffer. |
display power | Displays power supply information. |
display process slot slot-id | Displays process state information. |
probe | Enters probe view |
Troubleshooting system management
This section provides troubleshooting information for common system management issues.
High CPU utilization on a card
Symptom
The sustained CPU utilization is over 80% on a card.
Troubleshooting flowchart
Figure 8 Troubleshooting high CPU utilization
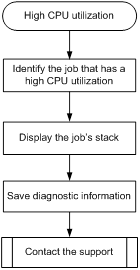
Solution
To resolve the issue:
1. Identify the job that has a high CPU utilization. For example:
[Sysname-probe] display process cpu slot 1
CPU utilization in 5 secs: 2.4%; 1 min: 2.5%; 5 mins: 2.4%
JID 5Sec 1Min 5Min Name
1 0.0% 0.0% 0.0% scmd
2 0.0% 0.0% 0.0% [kthreadd]
3 0.0% 0.0% 0.0% [migration/0]
4 0.0% 0.0% 0.0% [ksoftirqd/0]
5 0.0% 0.0% 0.0% [watchdog/0]
6 0.0% 0.0% 0.0% [migration/1]
7 0.0% 0.0% 0.0% [ksoftirqd/1]
8 0.0% 0.0% 0.0% [watchdog/1]
9 0.0% 0.0% 0.0% [migration/2]
10 0.0% 0.0% 0.0% [ksoftirqd/2]
11 0.0% 0.0% 0.0% [watchdog/2]
The output shows the average CPU usage values of jobs for the last 5 seconds, 1 minute, and 5 minutes. Typically, the average CPU usage of a job is less than 5%.
2. Display the job's stack. In this example, the job uses the ID of 145.
[Sysname-probe] follow job 145 slot 1
Attaching to process 145 ([mIPC])
Iteration 1 of 5
------------------------------
Kernel stack:
[<ffffffff8045e858>] schedule+0x738/0x1050
[<ffffffff8045f418>] schedule_timeout+0x98/0xe0
[<ffffffff8030d084>] ep_poll+0x4b4/0x5e0
[<ffffffffc01e7640>] drv_mac_async_ipc_process+0x70/0x100 [system]
[<ffffffffc3f4d344>] thread_boot+0x84/0xa0 [system]
[<ffffffff80260730>] kthread+0x130/0x140
[<ffffffff8021aec0>] kernel_thread_helper+0x10/0x20
Iteration 2 of 5
------------------------------
Kernel stack:
[<ffffffff8045e858>] schedule+0x738/0x1050
[<ffffffff8045f418>] schedule_timeout+0x98/0xe0
[<ffffffff8030d084>] ep_poll+0x4b4/0x5e0
[<ffffffffc01e7640>] drv_mac_async_ipc_process+0x70/0x100 [system]
[<ffffffffc3f4d344>] thread_boot+0x84/0xa0 [system]
[<ffffffff80260730>] kthread+0x130/0x140
[<ffffffff8021aec0>] kernel_thread_helper+0x10/0x20
Iteration 3 of 5
------------------------------
Kernel stack:
[<ffffffff8045e858>] schedule+0x738/0x1050
[<ffffffff8045f418>] schedule_timeout+0x98/0xe0
[<ffffffff8030d084>] ep_poll+0x4b4/0x5e0
[<ffffffffc01e7640>] drv_mac_async_ipc_process+0x70/0x100 [system]
[<ffffffffc3f4d344>] thread_boot+0x84/0xa0 [system]
[<ffffffff80260730>] kthread+0x130/0x140
[<ffffffff8021aec0>] kernel_thread_helper+0x10/0x20
Iteration 4 of 5
------------------------------
Kernel stack:
[<ffffffff8045e858>] schedule+0x738/0x1050
[<ffffffff8045f418>] schedule_timeout+0x98/0xe0
[<ffffffff8030d084>] ep_poll+0x4b4/0x5e0
[<ffffffffc01e7640>] drv_mac_async_ipc_process+0x70/0x100 [system]
[<ffffffffc3f4d344>] thread_boot+0x84/0xa0 [system]
[<ffffffff80260730>] kthread+0x130/0x140
[<ffffffff8021aec0>] kernel_thread_helper+0x10/0x20
Iteration 5 of 5
------------------------------
Kernel stack:
[<ffffffff8045e858>] schedule+0x738/0x1050
[<ffffffff8045f418>] schedule_timeout+0x98/0xe0
[<ffffffff8030d084>] ep_poll+0x4b4/0x5e0
[<ffffffffc01e7640>] drv_mac_async_ipc_process+0x70/0x100 [system]
[<ffffffffc3f4d344>] thread_boot+0x84/0xa0 [system]
[<ffffffff80260730>] kthread+0x130/0x140
[<ffffffff8021aec0>] kernel_thread_helper+0x10/0x20
3. Save the information displayed in the previous steps.
4. Contact H3C Support.
High memory utilization on a card
Symptom
The memory utilization on a card is over 60% for more than 30 minutes.
Troubleshooting flowchart
Figure 9 Troubleshooting high memory utilization
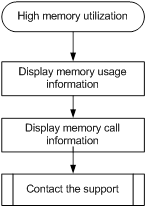
Solution
To resolve the issue:
1. Execute the display system internal kernel memory pool command multiple times to display memory usage information.
[Sysname-probe] display system internal kernel memory pool slot 1
Active Number Size Align Slab Pg/Slab ASlabs NSlabs Name
9126 9248 64 8 32 1 289 289 kmalloc-64
105 112 16328 0 2 8 54 56 kmalloc-16328
14 14 2097096 0 1 512 14 14 kmalloc-2097096
147 225 2048 8 15 8 12 15 kmalloc-2048
7108 7232 192 8 32 2 226 226 kmalloc-192
22 22 524232 0 1 128 22 22 kmalloc-524232
1288 1344 128 8 21 1 64 64 kmalloc-128
0 0 67108808 0 1 16384 0 0 kmalloc-67108808
630 651 4096 8 7 8 93 93 kmalloc-4096
68 70 131016 0 1 32 68 70 kmalloc-131016
1718 2048 8 8 64 1 31 32 kmalloc-8
1 1 16777160 0 1 4096 1 1 kmalloc-16777160
2 15 2048 0 15 8 1 1 sgpool-64
0 0 40 0 42 1 0 0 inotify_event_cache
325 330 16328 8 2 8 165 165 kmalloc_dma-16328
0 0 72 0 30 1 0 0 LFIB_IlmEntryCache
0 0 1080 0 28 8 0 0 LFIB_IlmEntryCache
0 0 1464 0 21 8 0 0 MFW_FsCache
1 20 136 0 20 1 1 1 L2VFIB_Ac_cache
0 0 240 0 25 2 0 0 CCF_JOBDESC
0 0 88 0 26 1 0 0 NS4_Aggre_TosSrcPre
0 0 128 0 21 1 0 0 IPFS_CacheHash_cachep
---- More ----
Each value line shows the memory information for a slab. The Number field shows the number of objects (memory blocks) allocated to the module. The Active field shows the number of objects used. If the percentage of the used objects keeps increasing, the slab might have memory leakage issues.
2. Display the memory call information for the slabs that might have leak issues. This example uses the kmalloc-2048 slab.
[Sysname-probe] view /sys/kernel/slab/kmalloc-2048/alloc_calls
23 kque_create+0x58/0x260 age=4262117/4404939/4692659 pid=128-372 cpus=0,2-3
2 sys_init_module+0x1bdc/0x1e50 age=4746250/4748179/4750108 pid=109-128 cpus=9,12
4 __vmalloc_area_node+0x154/0x1b0 age=4652363/4677089/4747310 pid=128-166
cpus=0-1,12
16 percpu_populate+0x3c/0x60 age=4322758/4322758/4322758 pid=128 cpus=0
21 alloc_pipe_info+0x24/0x60 age=4/3888025/4320768 pid=1-564 cpus=0-4,9,11
29 alloc_pci_dev+0x18/0x40 age=4758366/4758366/4758368 pid=1 cpus=15
2 init_dev+0x1c0/0x870 age=510128/2630142/4750157 pid=1-542 cpus=0,2
1 init_dev+0x4dc/0x870 age=510128 pid=542 cpus=2
2 kobj_map_init+0x2c/0xd0 age=4758371/4758535/4758700 pid=0-1 cpus=0,15
2 usb_alloc_dev+0x38/0x200 age=4750540/4750605/4750671 pid=1 cpus=15
1 usb_create_hcd+0x34/0x120 age=4750540 pid=1 cpus=15
16 exception_notifier_init+0x298/0x4f8 age=4750380/4750380/4750381 pid=1 cpus=15
1 drv_port_module_varialbe_init+0x24/0x80 [system] age=4651959 pid=128 cpus=0
1 DRV_VLAN_BasicFunc_Init+0x1ec/0x700 [system] age=4651871 pid=128 cpus=0
1 drv_vlan_maccash_init+0x124/0x240 [system] age=4651869 pid=128 cpus=0
1 drv_ipmc_spec_init+0x54/0x840 [system] age=4650355 pid=128 cpus=0
1 drv_evb_add_broadcast_group+0x964/0xa50 [system] age=4264182 pid=312 cpus=1
2 DRV_EVB_MAP_AddRec+0x160/0x2a0 [system] age=4264142/4264175/4264209 pid=288 cpus=9
1 drv_evi_localmac_init+0x160/0x650 [system] age=4651896 pid=128 cpus=0
1 DRV_QINQ_Init+0x278/0x890 [system] age=4650270 pid=128 cpus=0
1 DRV_QINQ_Init+0x478/0x890 [system] age=4650270 pid=128 cpus=0
1 Drv_Qacl_InitAddUdfTemplate+0x68/0xb30 [system] age=4651968 pid=128 cpus=0
1 drv_qacl_sal_rsc_init+0xc8/0x210 [system] age=4651968 pid=128 cpus=0
---- More ----
The first field of the output shows the number of objects. The remaining fields show the call information.
3. Save the information displayed in the previous steps.
4. Contact H3C Support.
| IMPORTANT: H3C recommends not rebooting the device before you contact H3C Support. You might lose critical diagnostic information if you reboot the device. |
Temperature alarms
Symptom
Temperature alarms occur.
Troubleshooting flowchart
Figure 10 Troubleshooting temperature alarms
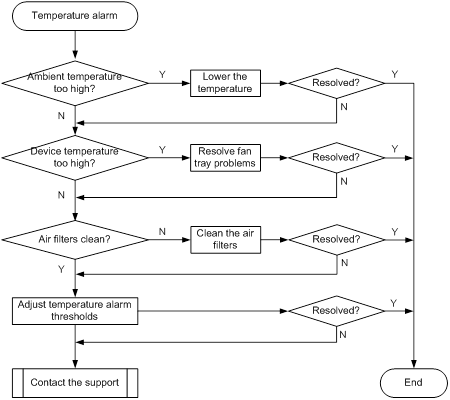
Solution
To resolve the issue:
1. Check the ambient temperature. If the ambient temperature is higher than 22 °C (71.6°F), lower the temperature by adding air conditioners or taking other heat dissipation measures.
2. Check the device temperature. If the device temperature is higher than the high-temperature warning threshold, use the display fan command to verify that the fan tray is operating correctly. If the system displays Fault, see H3C S12500-X Switch Series Installation Guide or H3C S12500X-AF Switch Series Installation Guide to resolve the issue.
3. Check whether the air filters are clean. If they are not, clean them.
4. Use the temperature-limit command to adjust the temperature alarm thresholds.
5. Use the display environment command to identify whether the temperature alarm thresholds are adjusted successfully. If the thresholds are not adjusted, replace the card.
6. If the issue persists, contact H3C Support.
Related commands
This section lists the commands that you might use for troubleshooting system management.
Command | Description |
display cpu-usage | Displays the current CPU usage statistics. |
display environment | Displays temperature information, including the current temperature and the temperature alarm thresholds. |
display fan | Displays the operating status of all fans on the switch. |
display memory | Displays memory usage statistics. |
display process cpu | Displays the CPU usage statistics for jobs. This command is available in probe view. |
display system internal kernel memory pool | Displays memory block usage statistics. This command is available in probe view. |
follow job job-id | Displays the stack of a job. This command is available in probe view. |
temperature-limit | Sets temperature alarm thresholds. |
view /sys/kernel/slab/<modulename>/alloc_calls | Displays the number of allocated memory blocks and the call information. |
Troubleshooting ports
This section provides troubleshooting information for common port issues.
1G/10G Base-T copper port fails to come up
Symptom
A 1G/10G Base-T copper port fails to come up.
Troubleshooting flowchart
Figure 11 Troubleshooting link up failure on a port
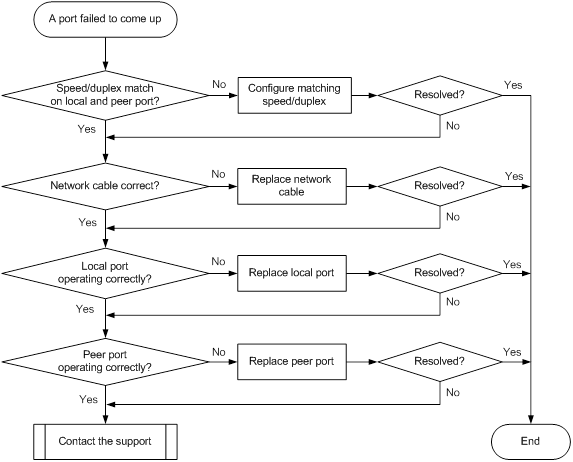
Solution
To resolve the issue:
1. Verify that the speed and duplex mode of the local port match the speed and duplex mode of the peer port:
a. Execute the display interface brief command to examine whether the speed and duplex mode of the port match the speed and duplex mode of the peer port.
b. If they do not match, use the speed command and the duplex command to set the speed and duplex mode for the port.
2. Replace the network cable with a new one to verify that the network cable is in good condition. For a 10G Base-T copper port, use a class 6A or 7 twisted pair cable.
3. Replace the local port with a new one (on a card of the same type, if possible) to verify that the local port is operating correctly.
4. Replace the peer port with a new one (on a card of the same type, if possible) to verify that the peer port is operating correctly.
5. If the issue persists, contact H3C Support.
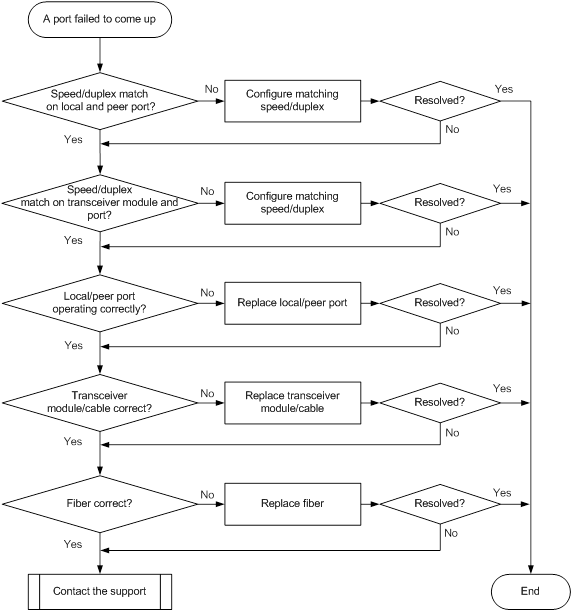
1000-Mbps SFP fiber port fails to come up
Symptom
A 1000-Mbps SFP fiber port fails to come up.
Troubleshooting flowchart
Figure 12 Troubleshooting link up failure on a port
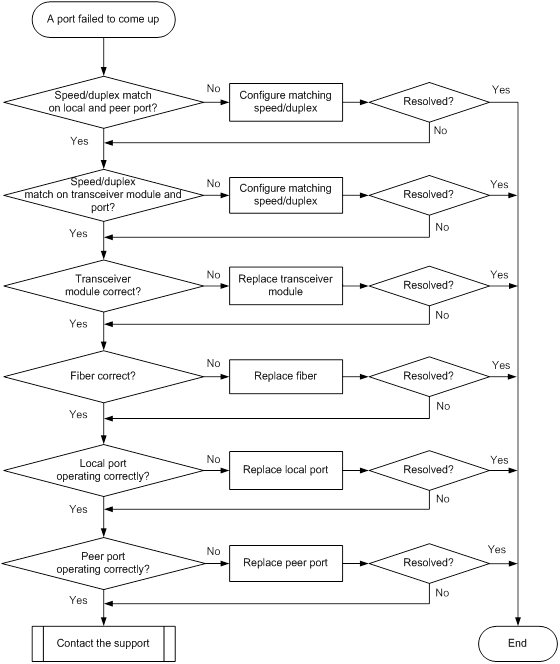
Solution
To resolve the issue:
1. Verify that the speed and duplex mode of the local port match the speed and duplex mode of the peer port:
a. Execute the display interface brief command to examine whether the speed and duplex mode of the port match the speed and duplex mode of the peer port.
b. If they do not match, use the speed command and the duplex command to set the speed and duplex mode for the port.
2. Verify that the speed and duplex mode of the port match the speed and duplex mode of the transceiver module:
a. Execute the display interface brief command to examine whether the speed and duplex mode of the port match the speed and duplex mode of the transceiver module.
b. If they do not match, use the speed command and the duplex command to set the speed and duplex mode for the port.
3. Verify that the transceiver module is operating correctly:
a. Execute the display transceiver alarm interface command to check for alarms on the transceiver module.
- The device displays None if no error has occurred.
- The device displays alarms if the transceiver module has failed or if the type of the transceiver module does not match the port type.
b. Use an optical power meter to verify that the Tx power and Rx power of the transceiver module are stable and are within the correct range.
c. Execute the display transceiver interface command to verify that the local transceiver module has the same wavelength and transmission distance as the peer transceiver module.
d. If the transceiver module is not operating correctly, replace it with a new H3C transceiver module that matches the fiber port.
For more information about transceiver modules, see the installation guide for the switch.
4. Replace the fiber with a new one to verify that the fiber is in good condition.
5. Replace the local port with a new one (on a card of the same type, if possible) to verify that the local port is operating correctly.
6. Replace the peer port with a new one (on a card of the same type, if possible) to verify that the peer port is operating correctly.
7. If the issue persists, contact H3C Support.
10-Gigabit SFP+ fiber port fails to come up
Symptom
A 10-Gigabit SFP+ fiber port fails to come up.
Troubleshooting flowchart
Figure 13 Troubleshooting link up failure on a port
Solution
To resolve the issue:
1. Verify that the speed and duplex mode of the local port match the speed and duplex mode of the peer port:
a. Execute the display interface brief command to examine whether the speed and duplex mode of the port match the speed and duplex mode of the peer port.
b. If they do not match, use the speed command and the duplex command to set the speed and duplex mode for the port.
2. Verify that the speed and duplex mode of the port match the speed and duplex mode of the transceiver module:
a. Execute the display interface brief command to examine whether the speed and duplex mode of the port match the speed and duplex mode of the transceiver module.
b. If they do not match, use the speed command and the duplex command to set the speed and duplex mode for the port.
3. Verify that the local and peer ports are operating correctly:
Use a 10-Gigabit SFP+ cable to connect the local port directly to another 10-Gigabit SFP+ fiber port on the same card.
¡ If the local port can come up, replace the peer port with a new one (on a card of the same type, if possible).
¡ If the local port cannot come up, replace the local port with a new one (on a card of the same type, if possible).
4. Verify that the transceiver module and cable are operating correctly:
a. Execute the display transceiver alarm interface command to check for alarms on the transceiver module.
- The device displays None if no error has occurred.
- The device displays alarms if the transceiver module has failed or if the type of the transceiver module does not match the port type.
b. Use an optical power meter to verify that the Tx power and Rx power of the transceiver module are stable and are within the correct range.
c. Execute the display transceiver interface command to verify that the local transceiver module has the same wavelength and transmission distance as the peer transceiver module.
d. If the transceiver module or cable is not operating correctly, replace it with a new H3C transceiver module or cable that matches the fiber port.
For more information about transceiver modules and cables, see the installation guide for the switch.
5. Verify that the fiber matches the transceiver module. If they do not match, replace the fiber with a new one that matches the transceiver module.
6. If the issue persists, contact H3C Support.
40-GE QSFP+ fiber port fails to come up
Symptom
A 40-GE QSFP+ fiber port fails to come up.
Troubleshooting flowchart
Figure 14 Troubleshooting link up failure on a port
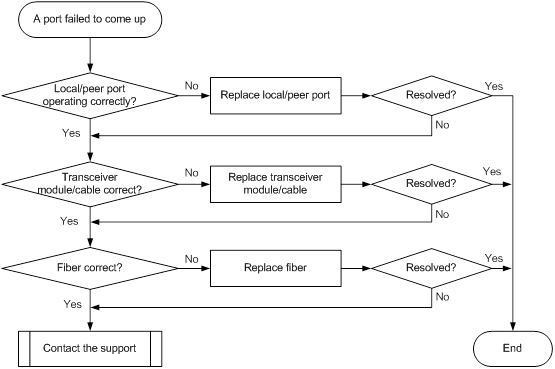
Solution
To resolve the issue:
1. Verify that the local and peer ports are operating correctly:
Use a QSFP+ cable to connect the local port directly to another 40-GE QSFP+ fiber port on the same card.
¡ If the local port can come up, replace the peer port with a new one (on a card of the same type, if possible).
¡ If the local port cannot come up, replace the local port with a new one (on a card of the same type, if possible).
2. Verify that the transceiver module and cable are operating correctly:
a. Execute the display transceiver alarm interface command to check for alarms on the transceiver module.
- The device displays None if no error has occurred.
- The device displays alarms if the transceiver module has failed or if the type of the transceiver module does not match the port type.
b. Use an optical power meter to verify that the Tx power and Rx power of the transceiver module are stable and are within the correct range.
c. Execute the display transceiver interface command to verify that the local transceiver module has the same wavelength and transmission distance as the peer transceiver module.
d. If the transceiver module or cable is not operating correctly, replace it with a new H3C transceiver module or cable that matches the fiber port.
For more information about transceiver modules and cables, see the installation guide for the switch.
| IMPORTANT: If a QSFP+ to SFP+ cable is used, use an optical attenuator to make sure the Tx power of the QSFP+ module stays below the Rx power of the SFP+ module. |
3. Verify that the fiber matches the transceiver module. If they do not match, replace the fiber with a new one that matches the transceiver module.
4. If the issue persists, contact H3C Support.
100-GE QSFP28 fiber port fails to come up
Symptom
A 100-GE QSFP28 fiber port fails to come up.
Troubleshooting flowchart
Figure 15 Troubleshooting link up failure on a port
Solution
To resolve the issue:
1. Verify that the local and peer ports are operating correctly:
Use a QSFP28 cable to connect the local port directly to another 100-GE QSFP28 fiber port on the same card.
¡ If the local port can come up, replace the peer port with a new one (on a card of the same type, if possible).
¡ If the local port cannot come up, replace the local port with a new one (on a card of the same type, if possible).
2. Verify that the transceiver module and cable are operating correctly:
a. Execute the display transceiver alarm interface command to check for alarms on the transceiver module.
- The device displays None if no error has occurred.
- The device displays alarms if the transceiver module has failed or if the type of the transceiver module does not match the port type.
b. Use an optical power meter to verify that the Tx power and Rx power of the transceiver module are stable and are within the correct range.
c. Execute the display transceiver interface command to verify that the local transceiver module has the same wavelength and transmission distance as the peer transceiver module.
d. If the transceiver module or cable is not operating correctly, replace it with a new H3C transceiver module or cable that matches the fiber port.
For more information about transceiver modules and cables, see the installation guide for the switch.
3. Verify that the fiber matches the transceiver module. If they do not match, replace the fiber with a new one that matches the transceiver module.
4. If the issue persists, contact H3C Support.
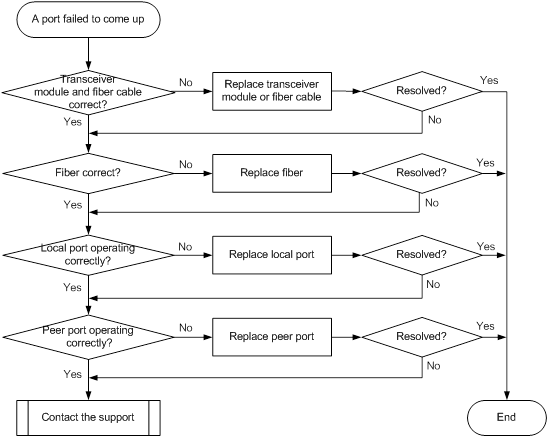
100-GE CFP/CFP2 fiber port fails to come up
Symptom
A 100-GE CFP/CFP2 fiber port fails to come up.
Troubleshooting flowchart
Figure 16 Troubleshooting link up failure on a port

Solution
To resolve the issue:
1. Verify that the transceiver module is operating correctly:
a. Execute the display transceiver alarm interface command to check for alarms on the transceiver module.
- The device displays None if no error has occurred.
- The device displays alarms if the transceiver module has failed or if the type of the transceiver module does not match the port type.
b. Use an optical power meter to verify that the Tx power and Rx power of the transceiver module are stable and are within the correct range.
c. Execute the display transceiver interface command to verify that the local transceiver module has the same wavelength and transmission distance as the peer transceiver module.
d. If the transceiver module is not operating correctly, replace it with a new H3C transceiver module that matches the fiber port.
For more information about transceiver modules, see the installation guide for the switch.
2. Verify that the fiber matches the transceiver module. If they do not match, replace the fiber with a new one that matches the transceiver module.
3. Replace the local port with a new one (on a card of the same type, if possible) to verify that the local port is operating correctly.
4. Replace the peer port with a new one (on a card of the same type, if possible) to verify that the peer port is operating correctly.
5. If the issue persists, contact H3C Support.
100-GE CXP fiber port fails to come up
Symptom
A 100-GE CXP fiber port fails to come up.
Troubleshooting flowchart
Figure 17 Troubleshooting link up failure on a port
Solution
To resolve the issue:
1. Verify that the transceiver module is operating correctly:
a. Execute the display transceiver alarm interface command to check for alarms on the transceiver module.
- The device displays None if no error has occurred.
- The device displays alarms if the transceiver module has failed or if the type of the transceiver module does not match the port type.
b. Use an optical power meter to verify that the Tx power and Rx power of the transceiver module are stable and are within the correct range.
c. Execute the display transceiver interface command to verify that the local transceiver module has the same wavelength and transmission distance as the peer transceiver module.
d. If the transceiver module is not operating correctly, replace it with a new H3C transceiver module that matches the fiber port.
For more information about transceiver modules, see the installation guide for the switch.
2. Verify that the fiber matches the transceiver module. If they do not match, replace the fiber with a new one that matches the transceiver module.
3. Replace the local port with a new one (on a card of the same type, if possible) to verify that the local port is operating correctly.
4. Replace the peer port with a new one (on a card of the same type, if possible) to verify that the peer port is operating correctly.
5. If the issue persists, contact H3C Support.
Non-H3C transceiver module error message
Symptom
The output from the display logbuffer command shows that the transceiver module is not an H3C transceiver module.
<Sysname> display logbuffer
FortyGigE1/0/5: This transceiver is NOT sold by H3C. H3C therefore shall NOT guarantee the normal function of the device or assume the maintenance responsibility thereof!
Troubleshooting flowchart
Figure 18 Troubleshooting non-H3C transceiver module error message
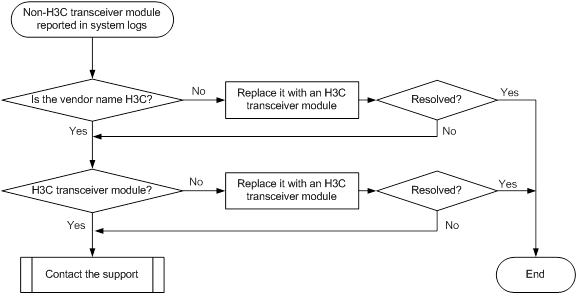
Solution
To resolve the issue:
1. Verify that the transceiver module is an H3C transceiver module:
Execute the display transceiver interface command to view the vendor name of the transceiver module.
¡ If the vendor name field does not display H3C, replace the transceiver module with an H3C transceiver module.
¡ If the vendor name field displays H3C, perform the following tasks:
- Execute the debug port optical-eeprom command in probe view to save the transceiver module information.
- Provide the information to H3C Support to verify that the transceiver module is an H3C transceiver module. If it is not, replace it with an H3C transceiver module.
2. If the issue persists, contact H3C Support.
Transceiver module does not support digital diagnosis
Symptom
The output from the display transceiver diagnosis interface command shows that the transceiver module does not support the digital diagnosis function.
<Sysname> display transceiver diagnosis interface ten-gigabitethernet 1/0/1
Error: The transceiver does not support this function.
Troubleshooting flowchart
Figure 19 Troubleshooting digital diagnosis failure on a transceiver module
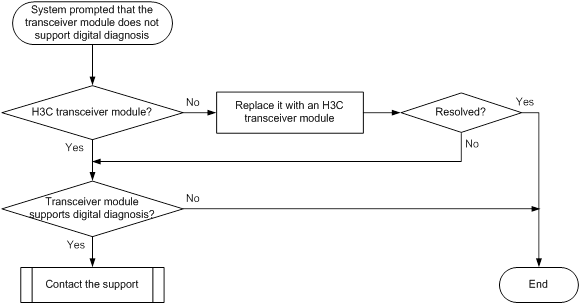
Solution
To resolve the issue:
1. Verify that the transceiver module is an H3C transceiver module:
Execute the display transceiver interface command to view the vendor name of the transceiver module.
¡ If the vendor name field does not display H3C, replace the transceiver module with an H3C transceiver module.
¡ If the vendor name field displays H3C, perform the following tasks:
- Execute the display transceiver manuinfo interface command to save the transceiver module information.
- Provide the information to H3C Support to verify that the transceiver module is an H3C transceiver module. If it is not, replace it with an H3C transceiver module.
2. Execute the display transceiver interface command to save the transceiver module information, and contact H3C Support to verify that the transceiver module supports the digital diagnosis function.
3. If the issue persists, contact H3C Support.
Error frames (for example, CRC errors) on a port
Symptom
Troubleshooting flowchart
Figure 20 Troubleshooting error frames (for example, CRC errors) on a port
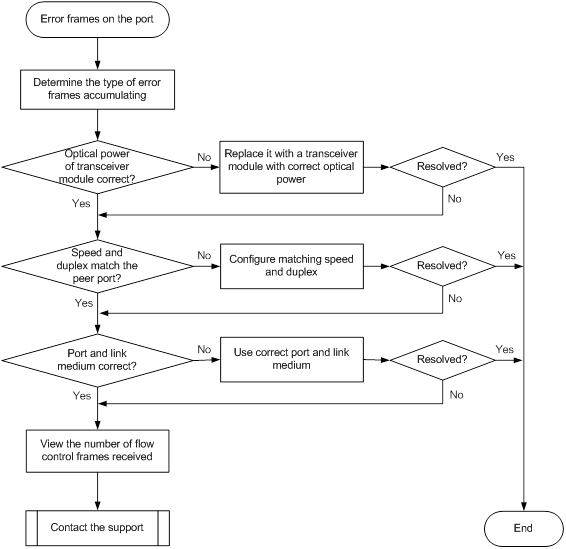
Solution
To resolve the issue:
1. Examine the error frame statistics and identify the error frame type:
a. (Optional.) Use the reset counter interface command in user view to clear the packet statistics of the port.
This command resets all packet counters to 0, so that you can view the statistics changes more clearly.
b. Use the display interface command to display the incoming packet statistics and outgoing packet statistics of the port.
c. Determine the type of error frames that are accumulating.
2. If the port is a fiber port, verify that the optical power of the transceiver module is operating correctly:
a. Use the display transceiver diagnosis interface command in probe view to view the present measured values of the digital diagnosis parameters for the transceiver module.
[Sysname-probe] display transceiver diagnosis interface ten-gigabitethernet 1/0/1
Ten-GigabitEthernet1/0/1 transceiver diagnostic information:
Current diagnostic parameters:
[module] Temp.(°C)
1stTX 2ndTX 1stRX 2ndRX
N/A N/A N/A N/A
Voltage(V)
3.3VTX 12VTX 3.3VRX 12VRX
3.29 N/A 3.40 N/A
[channel] TX Bias(mA) RX power(dBm) TX power(dBm)
1 6.09 0.91 -0.77
2 5.95 1.09 -0.16
3 6.05 1.58 -0.17
4 5.85 1.58 -0.14
5 6.07 2.23 -0.30
6 5.72 2.85 -0.47
7 6.11 3.01 -0.08
8 5.50 1.17 -0.02
9 5.89 -0.85 -0.17
10 5.94 -40.00 0.29
11 6.05 -40.00 0.18
12 5.78 -40.00 -0.30
Alarm thresholds:
[module] Temp.(°C) Voltage(V) Bias(mA) RX power(dBM) TX power(dBM)
High 0 3.63 10.00 1.58 5.44
Low 0 2.97 0.50 3.13 -11.61
[Sysname-probe]
b. If the optical power of the transceiver module is not within the correct range, replace the transceiver module with a transceiver module of the same model that is operating correctly.
3. Verify that the port configurations are correct:
a. Execute the display interface brief command.
b. Determine whether the speed and duplex mode of the port match the speed and duplex mode of the peer port.
c. If they do not match, use the speed command and the duplex command to set the speed and duplex mode for the port.
4. Verify that the link medium connected to the port is operating correctly.
Plug the link medium into a new port that is operating correctly. If error frames still exist, replace the link medium.
5. Verify that the port is operating correctly:
¡ If the port is a copper port, connect the port directly to a PC.
¡ If the port is a fiber port, replace the transceiver module in the port.
If error frames do not exist, troubleshoot the remaining possible points of failure on the transmission path. The troubleshooting process is beyond the scope of this document.
6. Determine whether the port has received a large amount of flow control frames:
a. Use the display interface command to view the number of pause frames.
If the number of pause frames is accumulating, you can determine that the port has sent or received a large amount of flow control frames.
b. Verify that the incoming traffic and outgoing traffic have not exceeded the maximum traffic processing capability of the local device and the peer device.
7. If the issue persists, contact H3C Support.
Failure to receive packets
Symptom
A port is up, but it cannot receive packets.
Troubleshooting flowchart
Figure 21 Troubleshooting failure to receive packets

Solution
To resolve the issue:
1. Verify that the ports at both ends are up.
2. Examine the packet statistics of the port:
a. (Optional.) Use the reset counter interface command in user view to clear the packet statistics of the port.
This command resets all packet counters to 0, so that you can view the statistics changes more clearly.
b. Use the display interface command to verify that the number of incoming packets is accumulating.
c. Verify that the number of error frames is not accumulating.
If the number of error frames is accumulating, remove the errors. For more information, see "Error frames (for example, CRC errors) on a port."
3. Verify that the port configurations do not affect packet receiving:
a. Use the display interface brief command to verify that the port configurations are correct.
The port configurations include the duplex mode, speed, port type, and VLAN configurations of the ports at both ends of the link. If configuration errors exist, modify the port configurations. If the port still fails to receive packets, use the shutdown command and then the undo shutdown command to re-enable the port.
b. If the port is configured with the spanning tree feature, use the display stp brief command to verify that the port is not in the discarding state.
If the port is set to the discarding state by the spanning tree feature, examine and modify the spanning tree feature configurations to resolve the issue.
H3C recommends that you configure the port as an edge port or disable the spanning tree feature on the port if it is directly connected to a terminal.
c. If the port is in an aggregation group, use the display link-aggregation summary command to verify that the status of the port is Selected.
If the status of the port is Unselected, the port cannot send or receive data packets. Determine the reasons why the port becomes Unselected, for example, the attribute configurations of the port are different from the reference port. Modify the attribute configurations of the port to make the port become Selected.
4. Verify that the link medium connected to the port is operating correctly.
Plug the link medium into a new port that is operating correctly. If the new port cannot receive packets, replace the link medium.
5. Verify that the port is operating correctly:
¡ If the port is a copper port, connect the port directly to a PC.
¡ If the port is a fiber port, replace the transceiver module in the port.
If the port can receive packets, troubleshoot the remaining possible points of failure on the transmission path. The troubleshooting process is beyond the scope of this document.
6. If the issue persists, contact H3C Support.
Failure to send packets
Symptom
A port is up, but it cannot send packets.
Troubleshooting flowchart
Figure 22 Troubleshooting failure to send packets
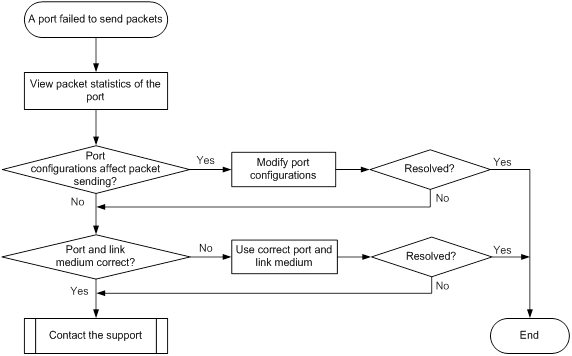
Solution
To resolve the issue:
1. Verify that the ports at both ends are up.
2. Examine the packet statistics of the port:
a. (Optional.) Use the reset counter interface command in user view to clear the packet statistics of the port.
This command resets all packet counters to 0, so that you can view the statistics changes more clearly.
b. Use the display interface command to verify that the number of outgoing packets is accumulating.
c. Verify that the number of error frames is not accumulating.
If the number of error frames is accumulating, remove the errors. For more information, see "Error frames (for example, CRC errors) on a port."
3. Verify that the port configurations do not affect packet sending:
a. Use the display interface brief command to verify that the port configurations are correct.
The port configurations include the duplex mode, speed, port type, and VLAN configurations of the ports at both ends of the link. If configuration errors exist, modify the port configurations. If the port fails to send packets, use the shutdown command and then the undo shutdown command to re-enable the port.
b. If the port is configured with the spanning tree feature, use the display stp brief command to verify that the port is not in the discarding state.
If the port is set to the discarding state by the spanning tree feature, examine and modify the spanning tree feature configurations to resolve the issue.
H3C recommends that you configure the port as an edge port or disable the spanning tree feature on the port if it is directly connected to a terminal.
c. If the port is in an aggregation group, use the display link-aggregation summary command to verify that the status of the port is Selected.
If the status of the port is Unselected, the port cannot send or receive data packets. Determine the reasons why the port becomes Unselected, for example, the attribute configurations of the port are different from the reference port. Modify the attribute configurations of the port to make the port become Selected.
4. Verify that the link medium connected to the port is operating correctly.
Plug the link medium into a new port that is operating correctly. If the new port cannot send packets, replace the link medium.
5. Verify that the port is operating correctly:
¡ If the port is a copper port, connect the port directly to a PC.
¡ If the port is a fiber port, replace the transceiver module in the port.
If the port can send packets, troubleshoot the remaining possible points of failure on the transmission path. The troubleshooting process is beyond the scope of this document.
6. If the issue persists, contact H3C Support.
Related commands
This section lists the commands that you might use for troubleshooting ports.
Command | Description |
display diagnostic-information | Displays or saves running status data for multiple feature modules. |
display interface | Displays Ethernet interface information. |
display interface brief | Displays brief interface information. |
display link-aggregation summary | Displays the summary information for all aggregation groups. |
display logbuffer | Displays the state of the log buffer and the log information in the log buffer. |
display stp brief | Displays brief spanning tree status and statistics. |
display transceiver alarm interface | Displays the current transceiver module alarms. |
display transceiver diagnosis | Displays the present measured values of the digital diagnosis parameters for transceiver modules. |
display transceiver interface | Displays the key parameters of transceiver modules. |
Troubleshooting IRF
This section provides troubleshooting information for common IRF issues.
IRF fabric setup failure
Symptom
A chassis cannot be added to an IRF fabric.
Troubleshooting flowchart
Figure 23 Troubleshooting IRF fabric setup failure
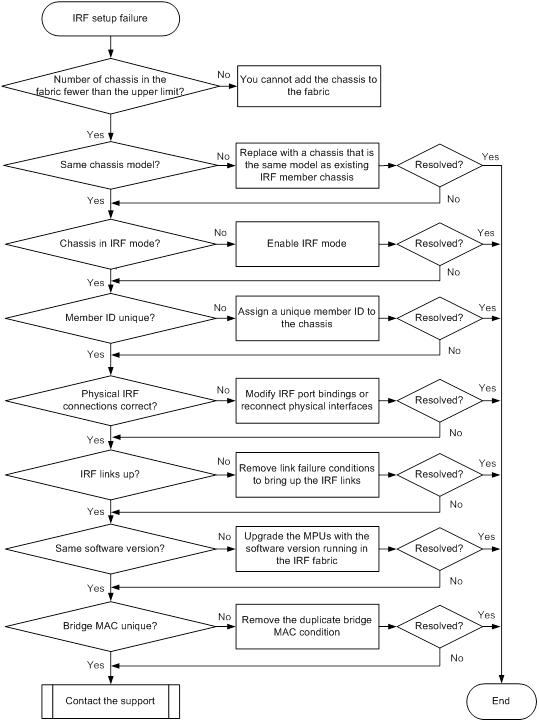
Solution
1. Execute the display irf command to verify that the number of member chassis in the IRF fabric does not reach the upper limit.
If the upper limit is reached, you cannot add new chassis to the IRF fabric. The upper limit varies by software version. For information about the upper limit, see IRF configuration in the configuration guides for your software version.
2. Verify that the chassis is the same model as the chassis in the IRF fabric.
The H3C S12500X-AF or S12500-X switches must be the same model to form an IRF fabric. In addition, an H3C S12500X-AF switch that uses type-F service modules cannot form an IRF fabric with an H3C S12500X-AF switch that uses type-H service modules.
3. Verify that the chassis is operating in IRF mode:
a. Execute the display interface brief command to verify that the physical interface numbers on the chassis have changed from three segments to four segments. In IRF mode, the member ID is added to physical interface numbers as the first segment (for example, 10-GigabitEthernet 1/4/0/1).
b. Execute the chassis convert mode irf command to change the operating mode to IRF.
4. Verify that the member ID of the chassis is unique in the IRF fabric and meets other relevant requirements (see the configuration guide for the software release):
a. Execute the display irf command to view member IDs.
b. Execute the irf member renumber command to assign a new member ID to the chassis if necessary.
5. Verify that the physical IRF links are connected correctly:
| IMPORTANT: When you connect two neighboring IRF members, you must connect the physical interfaces of IRF-port 1 on one member to the physical interfaces of IRF-port 2 on the other. |
a. Execute the display irf configuration command on each member chassis, and check the IRF-Port1 and IRF-Port2 fields for IRF port bindings.
b. Verify that the physical IRF connections are consistent with the IRF port bindings.
c. If there are inconsistencies, reconfigure the IRF port bindings or reconnect the IRF physical interfaces.
6. Verify that all IRF links are up:
a. Execute the display irf topology command, and then check the Link field.
b. If the Link field for an IRF port displays DOWN, execute the display interface command.
c. Check the current state field for each physical interface bound to the IRF port.
- If the field displays DOWN ( Administratively ), execute the undo shutdown command to bring up the interface.
- If the field displays DOWN, verify that the transceiver modules and cables are operating correctly.
| NOTE: Supported transceiver modules and cables might vary depending on the software version and card model. For more information, see the most recent installation guide or IRF configuration in the configuration guides for your software version. |
d. If the IRF port is down when it contains a minimum of one up link, verify that the MPUs of the chassis are operating correctly.
7. Verify that the member chassis is running the same software version as the IRF fabric:
a. Execute the display version command to identify the software version.
b. Upgrade the MPUs in the chassis to use the same software version as the IRF fabric.
| NOTE: Typically, the software auto-update feature can automatically synchronize a member chassis with the software version of the master chassis. However, the synchronization might fail when the gap between the software versions is large. |
| IMPORTANT: In addition to the same software version, all member devices in an IRF fabric must have the same settings for specific features. For example, all member devices must have the same setting for the ECMP enhanced mode (set by using the ecmp mode enhanced command). For more information about the feature requirements, see IRF configuration in the configuration guides for your software version. |
8. Verify that the chassis has a unique bridge MAC address:
a. Execute the display interface vlan-interface 1 command, and then check the Hardware Address field.
[Sysname] display interface vlan-interface 1
Vlan-interface1 current state: UP
Line protocol current state: UP
Description: Vlan-interface1 Interface
The Maximum Transmit Unit is 1500
Internet protocol processing : disabled
IP Packet Frame Type: PKTFMT_ETHNT_2, Hardware Address: 0023-8912-3d07
IPv6 Packet Frame Type: PKTFMT_ETHNT_2, Hardware Address: 0023-8912-3d07
b. If the chassis has the same bridge MAC address as the IRF fabric, remove the bridge MAC conflict.
9. If the issue persists, contact H3C Support.
IRF split
Symptom
An IRF fabric splits.
Troubleshooting flowchart
Figure 24 Troubleshooting IRF split
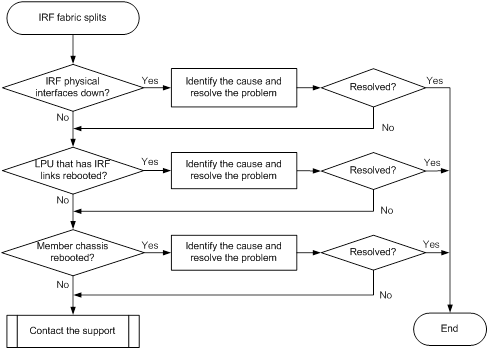
Solution
To resolve the issue:
1. Verify that the IRF physical interfaces are operating correctly:
a. Execute the display trapbuffer command or view system logs to check for physical IRF link down events that occurred around the split time.
b. If the split followed an IRF link down event, execute the display interface command to check port statistics for CRC errors.
c. If transceiver modules and fibers are used, execute the display transceiver diagnosis command. Make sure the transmit and receive power has not exceeded the power specifications of the fiber module.
2. Remove hardware issues that might cause recurring IRF split events:
a. Execute the display version command to identify the uptime of MPUs and LPUs that have IRF links.
b. Compare the uptime of MPUs and LPUs to determine whether a member chassis or LPU had rebooted before the IRF split.
c. If the IRF split is caused by a chassis or LPU reboot, perform one of the following tasks:
- If the split is caused by recurring LPU reboots, use the methods described in "LPU reboot failure" to resolve the issue.
- If the split is caused by a chassis reboot, use the methods described in "MPU reboot failure" to resolve the issue.
- If the reboot is caused by power failures, use the methods described in "Operating power supply failure" to resolve the issue.
3. If the issue persists, contact H3C Support.
BFD MAD failure
Symptom
BFD MAD fails to detect an IRF split event. Two IRF fabrics are operating with the same Layer 3 configurations, including the same IP address.
Troubleshooting flowchart
Figure 25 Troubleshooting BFD MAD failure
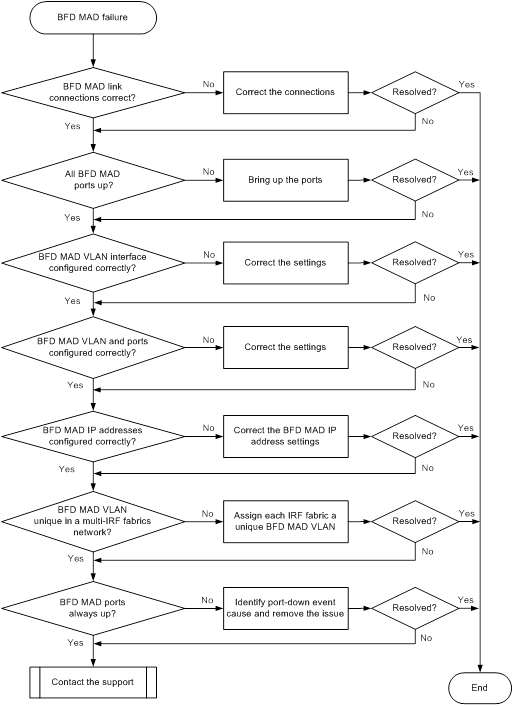
Solution
To resolve the issue:
1. Verify that BFD MAD link connections are correct:
¡ If you do not use an intermediate device, verify that each pair of member chassis has a dedicated BFD MAD link.
¡ If you use an intermediate device, verify that each member chassis has a dedicated BFD MAD link with the intermediate device.
2. Verify that all physical ports used for BFD MAD are up:
a. Execute the display interface command.
b. Check the current state field in the command output:
- If the field displays DOWN ( Administratively ) for a port, execute the undo shutdown command to bring up the port.
- If the field displays DOWN for a port, check the physical link for a link failure.
3. Verify that the BFD MAD VLAN interface is configured correctly:
a. Execute the display mad verbose command.
b. Check the MAD BFD enabled interface field to verify that VLAN-interface 1 is not used for BFD MAD.
c. If VLAN-interface 1 is used for BFD MAD, disable BFD MAD on VLAN-interface 1, and then enable BFD MAD on another VLAN interface.
d. Verify that the BFD MAD-enabled VLAN interface does not have any other features, including VPN.
e. Execute the display interface command to verify that the interface does not have the following IP addresses:
- IP address assigned by using the ip address command.
- VRRP virtual IP address.
4. Verify that the BFD MAD VLAN and physical ports in the VLAN are configured correctly:
a. Execute the display vlan command to verify the following items:
- The BFD VLAN contains all physical ports used for BFD MAD.
- The BFD VLAN does not contain physical ports that are not used for BFD MAD.
If an intermediate device is used, you must also perform this step on the intermediate device.
b. Execute the display interface command to verify that the physical ports in the BFD VLAN are not configured with any features.
For BFD MAD to operate correctly, you must disable all features on the physical ports in the BFD MAD VLAN, including the spanning tree feature, ARP, and LACP.
5. Verify that the MAD IP addresses are correct:
a. Execute the display mad verbose command.
b. Check the mad ip address field to verify the following items:
- Each member chassis has a MAD IP address.
- All MAD IP addresses are on the same subnet.
- The MAD IP addresses are not addresses being used on the IRF fabric.
6. If the network has multiple IRF fabrics, execute the display mad verbose command to verify that their BFD MAD VLANs are different.
7. Verify that the physical ports in the BFD MAD VLAN are always up:
a. Execute the display trapbuffer command or use system logs to check for BFD MAD port-down events that occurred around the split time.
b. Identify the cause of the events, and remove the issue.
8. If the issue persists, contact H3C Support.
LACP MAD failure
Symptom
LACP MAD fails to detect an IRF split event. Two IRF fabrics are operating with the same Layer 3 configurations, including the same IP address.
Troubleshooting flowchart
Figure 26 Troubleshooting LACP MAD failure
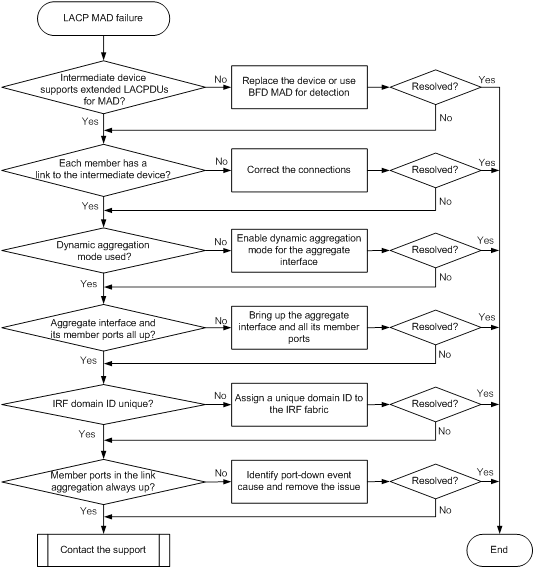
Solution
To resolve the issue:
1. Verify that the intermediate device is an H3C device that supports extended LACPDUs for MAD.
If the intermediate device does not support extended LACPDUs for MAD, replace the intermediate device, or use BFD MAD for split detection.
2. Verify that each member chassis has a link in the link aggregation with the intermediate device.
3. Verify that the link aggregation is operating in dynamic mode.
To enable dynamic aggregation mode, use the link-aggregation mode dynamic command.
4. Verify that the aggregate interface and its member ports are up:
a. Execute the display interface command.
b. Check the current state field of the aggregate interface:
- If the field displays DOWN ( Administratively ), execute the undo shutdown command to bring up the interface.
- If the field displays DOWN, check the state of all its physical ports.
An aggregate interface goes down only if all its physical ports are down.
c. Check the current state field of each member port:
- If the field displays DOWN ( Administratively ), execute the undo shutdown command to bring up the port.
- If the field displays DOWN, check the physical link of the port for a link failure.
5. If the intermediate device is also an IRF fabric, verify that the IRF domain IDs of the two IRF fabrics are unique:
| CAUTION: The IRF member devices send extended LACPDUs with TLVs that convey the domain ID and the active ID of the IRF fabric. To avoid split detection failure, make sure the IRF fabric has a unique domain ID. |
a. Execute the display irf command to identify the domain ID of each IRF fabric.
b. If the IRF fabrics use the same domain ID, execute the irf domain command to change the domain ID on one IRF fabric.
6. Verify that the physical ports in the link aggregation are always up:
a. Execute the display trapbuffer command or use system logs to check for port-down events around the split time.
b. Identify the event cause and remove the issue.
7. If the issue persists, contact H3C Support.
Related commands
This section lists the commands that you might use for troubleshooting IRF:
Command | Description |
display diagnostic-information | Displays or saves the operating statistics for multiple feature modules. |
display interface | Displays interface information. |
display interface brief | Displays brief interface information. |
display irf | Displays IRF fabric information, including the member ID, role, priority, bridge MAC address, and description of each IRF member. |
display irf configuration | Displays the IRF configuration on each member chassis. |
display irf topology | Displays the IRF topology. |
display mad verbose | Displays detailed MAD configuration. |
display transceiver diagnosis | Displays the present measured values of the digital diagnosis parameters for transceiver modules. |
display trapbuffer | Displays trap data in the trap buffer. |
display version | Displays system version information. |
display vlan | Displays VLAN information. |
Troubleshooting QoS and ACL
This section provides troubleshooting information for common QoS and ACL issues.
ACL application failure for unsupported ACL rules
Symptom
The system fails to apply a packet filter or an ACL-based QoS policy to the hardware. It displays an error message that an unsupported rule exists in the ACL. The following is a sample error message:
Troubleshooting flowchart
Figure 27 Troubleshooting ACL application failure

Solution
To resolve the issue:
1. Identify the unsupported match criterion in the rule:
a. Split the rule into multiple rules such that each rule contains one match criterion.
b. Apply the packet filter or QoS policy again.
c. Identify the unsupported criterion according to the new error message.
If the rule contains only one criterion, the criterion is not supported.
2. If the issue persists, contact H3C Support.
ACL application failure for insufficient resources
Symptom
The system fails to apply a packet filter or an ACL-based QoS policy to the hardware. It displays an error message that the hardware resources are not sufficient. The following are sample error messages:
Error: Slot=2 Fail to apply or refresh packet filter policy 3001 rule 25 on interface Vlan-interface6 due to lack of resources.
Warning: Classifier-behavior test in policy test applied on vlan 4079 failed in slot 2.
Reason: Not enough hardware resource.
Troubleshooting flowchart
Figure 28 Troubleshooting ACL application failure
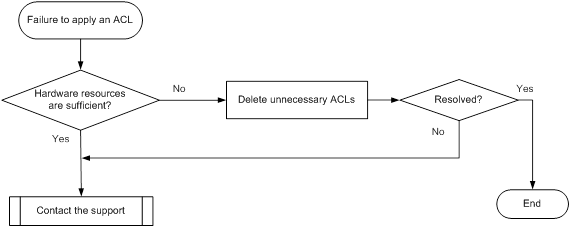
Solution
Insufficient hardware resources might be insufficient Counter, Meter, or ACL resources.
To resolve the issue:
1. Check the ACL, Counter, and Meter resource usage for insufficiency.
Execute the display qos-acl resource command to display the resource usage. If the number of ACLs to be applied is higher than the value of the Remaining field, resources are insufficient. If the ACLs are to be applied globally, check the resource usage on all cards.
[Sysname] display qos-acl resource
Interfaces: XGE2/1/0/1 to XGE2/1/0/21, XGE2/1/0/22
XGE2/1/0/23 to XGE2/1/0/24
---------------------------------------------------------------------
Type Total Reserved Configured Remaining Usage
---------------------------------------------------------------------
VFP ACL 1024 768 0 256 75%
IFP ACL 2048 1792 1 255 87%
IFP Meter 1024 896 0 128 87%
IFP Counter 1024 896 0 128 87%
EFP ACL 1024 0 0 1024 0%
EFP Meter 512 0 0 512 0%
EFP Counter 512 0 0 512 0%
Interfaces: XGE2/1/0/25 to XGE2/1/0/48
---------------------------------------------------------------------
Type Total Reserved Configured Remaining Usage
---------------------------------------------------------------------
VFP ACL 1024 768 0 256 75%
IFP ACL 2048 1536 1 511 75%
IFP Meter 1024 768 0 256 75%
IFP Counter 1024 768 0 256 75%
EFP ACL 1024 0 0 1024 0%
EFP Meter 512 0 0 512 0%
EFP Counter 512 0 0 512 0%
¡ IFP—Resource usage for inbound traffic.
¡ EFP—Resource usage for outbound traffic.
2. Delete unnecessary ACLs to release resources if the failure is caused by ACL resource insufficiency. Delete unnecessary ACLs that use Meter or Counter resources if the failure is caused by Meter or Counter resource insufficiency. If the ACL resources are sufficient, go to step 4.
3. Apply the packet filter or QoS policy again.
4. If the issue persists, contact H3C Support.
ACL application failure without an error message
Symptom
Troubleshooting flowchart
Figure 29 Troubleshooting ACL application failure
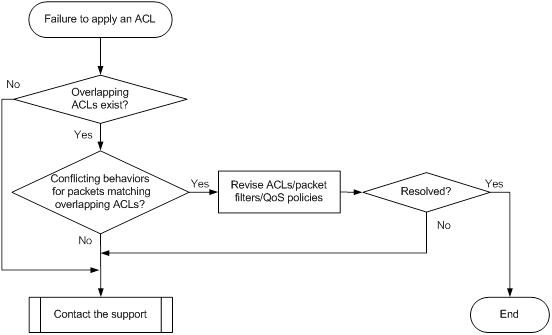
Solution
To resolve the issue:
1. Check the ACLs used by QoS policies and packet filters for overlapping rules:
a. Use the following commands to display ACLs that are used by QoS policies and packet filters:
- display packet-filter
- display qos policy user-defined
- display traffic classifier user-defined
b. Execute the display acl command to check for overlapping rules in the ACLs.
For example, the following sample output shows that rule 0 in ACL 3100 and rule 0 in ACL 3009 can both match traffic sourced from 2.2.2.1.
ACL number 3100
rule 0 permit ip source 2.2.2.2 0.0.255.255
ACL number 3009
rule 0 permit ip source 2.2.2.2 0.0.0.255
2. Check the filters and policies that use overlapping ACLs for a behavior conflict.
If two behaviors conflict, the device performs the behavior that has higher priority, as shown in Table 3.
Table 3 Rules for selecting a higher priority behavior from conflicting behaviors
Conflicting behaviors | Higher priority behavior |
· redirect · filter permit | redirect |
· redirect · filter deny | filter deny |
· filter permit · filter deny | The behavior configured first. |
3. Revise ACLs, packet filters, or QoS policies to remove the behavior conflict.
4. If the issue persists, contact H3C Support.
Related commands
This section lists the commands that you might use for troubleshooting QoS and ACLs.
Command | Description |
display acl | Displays configuration and match statistics for ACLs. |
display diagnostic-information | Displays operating statistics for multiple feature modules in the system. |
display packet-filter | Displays ACL application information for packet filtering. |
display qos-acl resource | Displays ACL resource usage. |
display qos policy interface | Displays QoS policies applied to interfaces. |
display qos policy user-defined | Displays user-defined QoS policies. |
display traffic classifier user-defined | Displays user-defined traffic classes. |
Troubleshooting MDC
This section provides troubleshooting information for common MDC issues.
LPU authorization failure
Symptom
The location command fails to authorize an MDC to use an LPU.
Troubleshooting flowchart
Figure 30 Troubleshooting LPU authorization failure
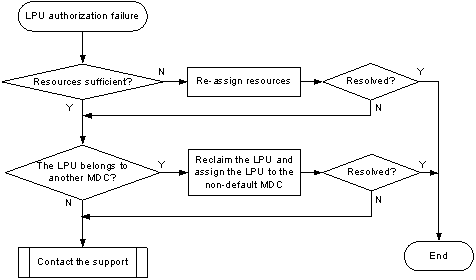
| NOTE: · The troubleshooting flowchart in Figure 30 applies only to Release 10xx. · In Release 26xx and Release 27xx, an LPU can be assigned to multiple MDCs. You only need to identify whether the resources are sufficient. You do not need to identify whether the LPU belongs to the default MDC or another non-default MDC. · This document provides the solution for Release 10xx. |
Solution
Typical reasons for LPU authorization failures include:
· The available hardware resources are insufficient. For example, the number of MDCs that are authorized to use the LPU has reached the limit.
· The device does not support the command.
If the available hardware resources are insufficient, you must adjust the configuration.
To resolve the issue:
1. Display the CPU, disk space, and memory usage of MDCs.
[Sysname]display mdc resource
Memory:
Chassis 3 Slot 0:
Used 262.3MB, Free 2409.3MB, Total 2671.6MB:
ID Name Quota(MB) Used(MB) Available(MB)
----------------------------------------------------------------
1 Admin 2671.6 211.3 2409.3
2 mdcA 2671.6 51.0 2409.3
Chassis 3 Slot 3:
Used 17.1MB, Free 663.6MB, Total 680.7MB:
ID Name Quota(MB) Used(MB) Available(MB)
----------------------------------------------------------------
1 Admin 680.7 17.1 663.6
Chassis 3 Slot 4:
Used 16.9MB, Free 663.8MB, Total 680.7MB:
ID Name Quota(MB) Used(MB) Available(MB)
----------------------------------------------------------------
1 Admin 680.7 16.9 663.8
Chassis 3 Slot 5:
Used 16.9MB, Free 663.8MB, Total 680.7MB:
ID Name Quota(MB) Used(MB) Available(MB)
----------------------------------------------------------------
1 Admin 680.7 16.9 663.8
Chassis 3 Slot 9:
Used 16.9MB, Free 663.9MB, Total 680.8MB:
ID Name Quota(MB) Used(MB) Available(MB)
----------------------------------------------------------------
1 Admin 680.8 16.9 663.9
CPU:
Chassis 3 Slot 0:
ID Name Weight Usage(%)
-------------------------------------------------
1 Admin 10 0
2 mdcA 10 0
Chassis 3 Slot 3:
ID Name Weight Usage(%)
-------------------------------------------------
1 Admin 10 3
Chassis 3 Slot 4:
ID Name Weight Usage(%)
-------------------------------------------------
1 Admin 10 3
Chassis 3 Slot 5:
ID Name Weight Usage(%)
-------------------------------------------------
1 Admin 10 6
Chassis 3 Slot 9:
ID Name Weight Usage(%)
-------------------------------------------------
1 Admin 10 5
Disk:
Chassis 3 Slot 0:
flash:: Used 108.8MB, Free 383.2MB, Total 492.0MB:
ID Name Quota(MB) Used(MB) Available(MB)
--------------------------------------------------------------
1 Admin 492.0 108.8 383.2
2 mdcA 492.0 0.0 383.2
If the resources assigned to an MDC are insufficient, re-assign resources to the MDC.
2. Display which MDC is authorized to use the LPU.
[Sysname] display current-configuration configuration mdc
#
mdc Admin id 1
#
mdc mdcA id 2
location chassis 3 slot 3
mdc start
#
Return
The output shows the following information:
¡ The undo location command has not been executed for any LPU on the default MDC, and all LPUs belong to the default MDC. To assign an LPU to a non-default MDC, you must reclaim the LPU from the default MDC.
¡ The LPU in slot 3 of member device 3 belongs to mdcA. To assign the LPU to a different MDC, you need to reclaim the LPU from mdcA.
3. Reclaim the LPU.
In this example, the LPU belongs to the default MDC.
[Sysname] mdc Admin
[Sysname-mdc-1-Admin]undo location chassis 3 slot 3
The configuration associated with the specified slot of MDC will be lost. Continue? [Y/N]:y
4. Verify that the LPU does not belong to the default MDC anymore.
[Sysname-mdc-1-Admin]display this
#
mdc Admin id 1
undo location chassis 3 slot 3
#
Return
5. Authorize the MDC (mdcB in this example) to use the LPU.
[Sysname-mdc-2-mdcA]mdc mdcB
[Sysname-mdc-3-mdcB]location chassis 3 slot 3
6. Verify that the LPU belongs to mdcB.
[Sysname-mdc-3-mdcB]display this
#
mdc mdcB id 3
location chassis 3 slot 3
mdc start
#
Return
7. If the issue persists, contact H3C Support.
Interface assignment failure (for Release 10xx)
Symptom
After an LPU is assigned to an MDC, the allocate command fails to assign interfaces on the LPU or the interfaces are not available in MDC view.
Troubleshooting flowchart
Figure 31 Troubleshooting interface assignment failure
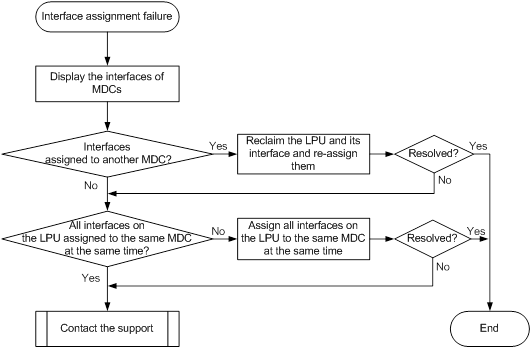
Solution
In Release 10xx, an LPU can belong to only one MDC. If you cannot assign interfaces on an LPU that belongs to an MDC to the MDC, check whether you specified all interfaces on the LPU for the allocate command.
To reclaim an LPU from the default MDC, only the undo location command is required. You do not need to use the undo allocate command.
In the following example, GigabitEthernet 3/3/0/1 through GigabitEthernet 3/3/0/24 and Ten-GigabitEthernet 3/3/0/25 through Ten-GigabitEthernet 3/3/0/26 belong to mdcA. It is required to assign these interfaces to mdcB.
To resolve the issue:
1. Display the interfaces of MDCs.
[Sysname]display mdc interface
MDC Admin's interface(s):
M-GigabitEthernet1/0/0/0 FortyGigE3/4/0/1
FortyGigE3/4/0/2 FortyGigE3/4/0/3
FortyGigE3/4/0/4 FortyGigE3/5/0/1
FortyGigE3/5/0/2 FortyGigE3/5/0/3
FortyGigE3/5/0/4
MDC mdcA's interface(s):
M-GigabitEthernet1/0/0/0 GigabitEthernet3/3/0/1
GigabitEthernet3/3/0/2 GigabitEthernet3/3/0/3
GigabitEthernet3/3/0/4 GigabitEthernet3/3/0/5
GigabitEthernet3/3/0/6 GigabitEthernet3/3/0/7
GigabitEthernet3/3/0/8 GigabitEthernet3/3/0/9
GigabitEthernet3/3/0/10 GigabitEthernet3/3/0/11
GigabitEthernet3/3/0/12 GigabitEthernet3/3/0/13
GigabitEthernet3/3/0/14 GigabitEthernet3/3/0/15
GigabitEthernet3/3/0/16 GigabitEthernet3/3/0/17
GigabitEthernet3/3/0/18 GigabitEthernet3/3/0/19
GigabitEthernet3/3/0/20 GigabitEthernet3/3/0/21
GigabitEthernet3/3/0/22 GigabitEthernet3/3/0/23
GigabitEthernet3/3/0/24 Ten-GigabitEthernet3/3/0/25
Ten-GigabitEthernet3/3/0/26
MDC mdcB's interface(s):
M-GigabitEthernet1/0/0/0
[Sysname-mdc-2-mdcA]display this
#
mdc mdcA id 2
location chassis 3 slot 3
mdc start
allocate interface GigabitEthernet3/3/0/1 to GigabitEthernet3/3/0/24 Ten-GigabitEthernet3/3/0/25 Ten-GigabitEthernet3/3/0/26
The output shows that the LPU in slot 3 on member device 3 and its interfaces belong to mdcA.
2. Reclaim the LPU in slot 3 on member device 3 and its interfaces from mdcA.
[Sysname-mdc-2-mdcA]undo allocate interface GigabitEthernet 3/3/0/1 to GigabitEthernet 3/3/0/24 Ten-GigabitEthernet 3/3/0/25 Ten-GigabitEthernet 3/3/0/26
Configuration of the interfaces will be lost. Continue? [Y/N]:y
[Sysname-mdc-2-mdcA]undo location chassis 3 slot 3
[Sysname-mdc-2-mdcA]display this
#
mdc mdcA id 2
mdc start
#
return
3. Assign the LPU in slot 3 on member device 3 and its interface to mdcB.
On the switch, an LPU can belong to only one MDC. You must assign all interfaces on an LPU to an MDC by using a single command.
[Sysname]mdc mdcB
[Sysname-mdc-3-mdcB]allocate interface GigabitEthernet 3/3/0/1 to GigabitEthernet 3/3/0/24 Ten-GigabitEthernet 3/3/0/25 Ten-GigabitEthernet 3/3/0/26
Configuration of the interfaces will be lost. Continue? [Y/N]:y
[Sysname-mdc-3-mdcB]quit
[Sysname-mdc-3-mdcB]location chassis 3 slot 3
[Sysname-mdc-3-mdcB]display this
#
mdc mdcB id 3
location chassis 3 slot 3
mdc start
allocate interface GigabitEthernet3/3/0/1 to GigabitEthernet3/3/0/24 Ten-GigabitEthernet3/3/0/25 to Ten-GigabitEthernet3/3/0/26
#
return
[Sysname-mdc-3-mdcB]quit
[Sysname]display mdc interface
MDC Admin's interface(s):
M-GigabitEthernet1/0/0/0 FortyGigE3/4/0/1
FortyGigE3/4/0/2 FortyGigE3/4/0/3
FortyGigE3/4/0/4 FortyGigE3/5/0/1
FortyGigE3/5/0/2 FortyGigE3/5/0/3
FortyGigE3/5/0/4
MDC mdcA's interface(s):
M-GigabitEthernet1/0/0/0
MDC mdcB's interface(s):
M-GigabitEthernet1/0/0/0 GigabitEthernet3/3/0/1
GigabitEthernet3/3/0/2 GigabitEthernet3/3/0/3
GigabitEthernet3/3/0/4 GigabitEthernet3/3/0/5
GigabitEthernet3/3/0/6 GigabitEthernet3/3/0/7
GigabitEthernet3/3/0/8 GigabitEthernet3/3/0/9
GigabitEthernet3/3/0/10 GigabitEthernet3/3/0/11
GigabitEthernet3/3/0/12 GigabitEthernet3/3/0/13
GigabitEthernet3/3/0/14 GigabitEthernet3/3/0/15
GigabitEthernet3/3/0/16 GigabitEthernet3/3/0/17
GigabitEthernet3/3/0/18 GigabitEthernet3/3/0/19
GigabitEthernet3/3/0/20 GigabitEthernet3/3/0/21
GigabitEthernet3/3/0/22 GigabitEthernet3/3/0/23
GigabitEthernet3/3/0/24 Ten-GigabitEthernet3/3/0/25
Ten-GigabitEthernet3/3/0/26
4. If the issue persists, contact H3C Support.
Interface assignment failure (for Releases 11xx, 26xx, and 27xx)
Symptom
After an MDC is created, the allocate command fails to assign interfaces or the interfaces are not available in MDC view.
Troubleshooting flowchart
Figure 32 Troubleshooting interface assignment failure
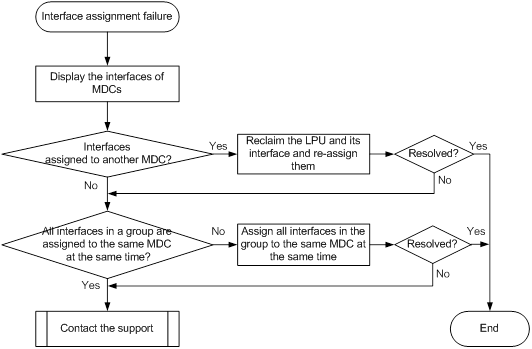
Solution
In Release 11xx, Release 26xx, and Release 27xx, interfaces on an LPU can be assigned to multiple MDCs. When you assign interfaces to an MDC or reclaim interfaces from an MDC, make sure the following requirements are met:
· The interfaces to be assigned do not belong to any other non-default MDC.
· The LPUs where the interfaces reside do not belong to the MDC or the default MDC.
· All interfaces in a group are assigned to the same MDC or reclaimed by using a single command.
In the following example, MDC test has just been created. The plan is to assign Ten-GigabitEthernet 1/6/0/1 through Ten-GigabitEthernet 1/6/0/12 to MDC test. However, the interfaces are not available in the view of MDC test.
To resolve the issue:
1. Display the interfaces of MDCs.
[Sysname] display mdc interface
MDC Admin's interface(s):
M-GigabitEthernet1/0/0/0 Ten-GigabitEthernet1/6/0/25
Ten-GigabitEthernet1/6/0/26 Ten-GigabitEthernet1/6/0/27
Ten-GigabitEthernet1/6/0/28 Ten-GigabitEthernet1/6/0/29
Ten-GigabitEthernet1/6/0/30 Ten-GigabitEthernet1/6/0/31
Ten-GigabitEthernet1/6/0/32 Ten-GigabitEthernet1/6/0/33
Ten-GigabitEthernet1/6/0/34 Ten-GigabitEthernet1/6/0/35
Ten-GigabitEthernet1/6/0/36 Ten-GigabitEthernet1/6/0/37
Ten-GigabitEthernet1/6/0/38 Ten-GigabitEthernet1/6/0/39
Ten-GigabitEthernet1/6/0/40 Ten-GigabitEthernet1/6/0/41
Ten-GigabitEthernet1/6/0/42 Ten-GigabitEthernet1/6/0/43
Ten-GigabitEthernet1/6/0/44 Ten-GigabitEthernet1/6/0/45
Ten-GigabitEthernet1/6/0/46 Ten-GigabitEthernet1/6/0/47
Ten-GigabitEthernet1/6/0/48
MDC A's interface(s):
Ten-GigabitEthernet1/6/0/1 Ten-GigabitEthernet1/6/0/2
Ten-GigabitEthernet1/6/0/3 Ten-GigabitEthernet1/6/0/4
Ten-GigabitEthernet1/6/0/5 Ten-GigabitEthernet1/6/0/6
Ten-GigabitEthernet1/6/0/7 Ten-GigabitEthernet1/6/0/8
Ten-GigabitEthernet1/6/0/9 Ten-GigabitEthernet1/6/0/10
Ten-GigabitEthernet1/6/0/11 Ten-GigabitEthernet1/6/0/12
Ten-GigabitEthernet1/6/0/13 Ten-GigabitEthernet1/6/0/14
Ten-GigabitEthernet1/6/0/15 Ten-GigabitEthernet1/6/0/16
Ten-GigabitEthernet1/6/0/17 Ten-GigabitEthernet1/6/0/18
Ten-GigabitEthernet1/6/0/19 Ten-GigabitEthernet1/6/0/20
Ten-GigabitEthernet1/6/0/21 Ten-GigabitEthernet1/6/0/22
Ten-GigabitEthernet1/6/0/23 Ten-GigabitEthernet1/6/0/24
MDC test's interface(s):
The output shows that Ten-GigabitEthernet 1/6/0/1 through Ten-GigabitEthernet 1/6/0/12 belong to MDC A. To assign the interfaces to MDC test, you must reclaim the interfaces from MDC A.
[Sysname-mdc-2-A] undo allocate interface Ten-GigabitEthernet1/6/0/1 to Ten-GigabitEthernet1/6/0/12
Configuration of the interfaces will be lost. Continue? [Y/N]:y
Can't allocate the interface(s), Please check Destination mdc 1 and undo location the slot first, then allocate the interface(s)!
In Release 11xx, the command displays the following message: Can't allocate the interface(s), Please check Destination mdc 1 and undo location the slot first, then allocate the interface(s)! In Release 26xx and Release 27xx, the command displays the following message: Can't allocate the interfaces. Please undo location the interface card to which the interfaces belong in the current MDC or default MDC. Both messages show that the LPU where the interfaces reside belong to the default MDC (the MDC ID is 1). To reclaim the interfaces, you must reclaim the LPU from the default MDC first.
2. Reclaim the LPU where Ten-GigabitEthernet 1/6/0/1 through Ten-GigabitEthernet 1/6/0/12 reside from the default MDC and MDC A.
# Reclaim the LPU from the default MDC.
[Sysname-mdc-2-A] quit
[Sysname] mdc Admin
[Sysname-mdc-1-Admin] undo location chassis 1 slot 6
The configuration associated with the specified slot of MDC will be lost. Continue? [Y/N]:y
# Reclaim the interfaces from MDC A.
[Sysname-mdc-1-Admin] quit
[Sysname] mdc A
[Sysname-mdc-2-A] undo allocate interface Ten-GigabitEthernet1/6/0/1 to Ten-GigabitEthernet1/6/0/12
Configuration of the interfaces will be lost. Continue? [Y/N]:y
Can't allocate the interface(s), Please check Source mdc 2 and undo location the slot first, then allocate the interface(s)!
In Release 11xx, the command displays the following message: Can't allocate the interface(s), Please check Source mdc 2 and undo location the slot first, then allocate the interface(s)! In Release 26xx and Release 27xx, the command displays the following message: Can't allocate the interfaces. Please undo location the interface card to which the interfaces belong in the current MDC or default MDC. Both messages show that the LPU where the interfaces reside belong to MDC A (the MDC ID is 2). To reclaim the interfaces, you must reclaim the LPU from MDC A first.
# Reclaim the LPU from MDC A.
[Sysname-mdc-2-A] undo location chassis 1 slot 6
The configuration associated with the specified slot of MDC will be lost. Continue? [Y/N]:y
# Reclaim Ten-GigabitEthernet 1/6/0/1 through Ten-GigabitEthernet 1/6/0/12 from MDC A.
[Sysname-mdc-2-A] undo allocate interface Ten-GigabitEthernet1/6/0/1 to Ten-GigabitEthernet1/6/0/12
Configuration of the interfaces will be lost. Continue? [Y/N]:y
Group error: all interfaces of one group must be allocated to the same mdc.
Ten-GigabitEthernet1/6/0/1 Ten-GigabitEthernet1/6/0/2
Ten-GigabitEthernet1/6/0/3 Ten-GigabitEthernet1/6/0/4
Ten-GigabitEthernet1/6/0/5 Ten-GigabitEthernet1/6/0/6
Ten-GigabitEthernet1/6/0/7 Ten-GigabitEthernet1/6/0/8
Ten-GigabitEthernet1/6/0/9 Ten-GigabitEthernet1/6/0/10
Ten-GigabitEthernet1/6/0/11 Ten-GigabitEthernet1/6/0/12
Port list of group 1:
Ten-GigabitEthernet1/6/0/1 Ten-GigabitEthernet1/6/0/2
Ten-GigabitEthernet1/6/0/3 Ten-GigabitEthernet1/6/0/4
Ten-GigabitEthernet1/6/0/5 Ten-GigabitEthernet1/6/0/6
Ten-GigabitEthernet1/6/0/7 Ten-GigabitEthernet1/6/0/8
Ten-GigabitEthernet1/6/0/9 Ten-GigabitEthernet1/6/0/10
Ten-GigabitEthernet1/6/0/11 Ten-GigabitEthernet1/6/0/12
Ten-GigabitEthernet1/6/0/13 Ten-GigabitEthernet1/6/0/14
Ten-GigabitEthernet1/6/0/15 Ten-GigabitEthernet1/6/0/16
Ten-GigabitEthernet1/6/0/17 Ten-GigabitEthernet1/6/0/18
Ten-GigabitEthernet1/6/0/19 Ten-GigabitEthernet1/6/0/20
Ten-GigabitEthernet1/6/0/21 Ten-GigabitEthernet1/6/0/22
Ten-GigabitEthernet1/6/0/23 Ten-GigabitEthernet1/6/0/24
The output shows that Ten-GigabitEthernet 1/6/0/1 through Ten-GigabitEthernet 1/6/0/24 belong to the same group and must be reclaimed by using a single command.
[Sysname-mdc-2-A] undo allocate interface Ten-GigabitEthernet 1/6/0/1 to Ten-GigabitEthernet 1/6/0/24
Configuration of the interfaces will be lost. Continue? [Y/N]:y
| NOTE: Interface grouping varies by card model. For interface grouping information, see the output from the allocate interface command. |
3. Assign Ten-GigabitEthernet 1/6/0/1 through Ten-GigabitEthernet 1/6/0/24 to MDC test.
[Sysname-mdc-2-A] quit
[Sysname] mdc test
[Sysname-mdc-3-test] allocate interface Ten-GigabitEthernet1/6/0/1 to Ten-GigabitEthernet1/6/0/24
Configuration of the interfaces will be lost. Continue? [Y/N]:y
Execute the location slot command in this view to make the configuration take effect.
4. Assign the LPU where the interfaces reside to MDC test.
[Sysname-mdc-3-test] location chassis 1 slot 6
[Sysname-mdc-3-test] quit
5. Because the default MDC still needs to use Ten-GigabitEthernet 1/6/0/25 through Ten-GigabitEthernet 1/6/0/48, reassign the LPU to the default MDC.
[Sysname] mdc Admin
[Sysname-mdc-1-Admin] location chassis 1 slot 6
[Sysname-mdc-1-Admin] quit
[Sysname] display mdc interface
MDC Admin's interface(s):
M-GigabitEthernet1/0/0/0 Ten-GigabitEthernet1/6/0/25
Ten-GigabitEthernet1/6/0/26 Ten-GigabitEthernet1/6/0/27
Ten-GigabitEthernet1/6/0/28 Ten-GigabitEthernet1/6/0/29
Ten-GigabitEthernet1/6/0/30 Ten-GigabitEthernet1/6/0/31
Ten-GigabitEthernet1/6/0/32 Ten-GigabitEthernet1/6/0/33
Ten-GigabitEthernet1/6/0/34 Ten-GigabitEthernet1/6/0/35
Ten-GigabitEthernet1/6/0/36 Ten-GigabitEthernet1/6/0/37
Ten-GigabitEthernet1/6/0/38 Ten-GigabitEthernet1/6/0/39
Ten-GigabitEthernet1/6/0/40 Ten-GigabitEthernet1/6/0/41
Ten-GigabitEthernet1/6/0/42 Ten-GigabitEthernet1/6/0/43
Ten-GigabitEthernet1/6/0/44 Ten-GigabitEthernet1/6/0/45
Ten-GigabitEthernet1/6/0/46 Ten-GigabitEthernet1/6/0/47
Ten-GigabitEthernet1/6/0/48
MDC A's interface(s):
MDC test's interface(s):
M-GigabitEthernet1/0/0/0 Ten-GigabitEthernet1/6/0/1
Ten-GigabitEthernet1/6/0/2 Ten-GigabitEthernet1/6/0/3
Ten-GigabitEthernet1/6/0/4 Ten-GigabitEthernet1/6/0/5
Ten-GigabitEthernet1/6/0/6 Ten-GigabitEthernet1/6/0/7
Ten-GigabitEthernet1/6/0/8 Ten-GigabitEthernet1/6/0/9
Ten-GigabitEthernet1/6/0/10 Ten-GigabitEthernet1/6/0/11
Ten-GigabitEthernet1/6/0/12 Ten-GigabitEthernet1/6/0/13
Ten-GigabitEthernet1/6/0/14 Ten-GigabitEthernet1/6/0/15
Ten-GigabitEthernet1/6/0/16 Ten-GigabitEthernet1/6/0/17
Ten-GigabitEthernet1/6/0/18 Ten-GigabitEthernet1/6/0/19
Ten-GigabitEthernet1/6/0/20 Ten-GigabitEthernet1/6/0/21
Ten-GigabitEthernet1/6/0/22 Ten-GigabitEthernet1/6/0/23
Ten-GigabitEthernet1/6/0/24
6. If the issue persists, contact H3C Support.
Related commands
This section lists the commands that you might use for troubleshooting MDC.
Command | Description |
allocate interface | Assigns a physical interface to an MDC. |
display diagnostic-information | Displays operating statistics for multiple feature modules in the system. |
display mdc interface | Displays the interfaces of MDCs. |
display mdc resource | Displays CPU, disk space, and memory usage of MDCs. |
location | Authorizes an MDC to use an LPU |
