- Released At: 08-02-2021
- Page Views:
- Downloads:
- Table of Contents
- Related Documents
-
|
|
|
H3C S6300 Switch Series |
|
Troubleshooting Guide |
|
|
Copyright © 2021 New H3C Technologies Co., Ltd. All rights reserved.
No part of this manual may be reproduced or transmitted in any form or by any means without prior written consent of New H3C Technologies Co., Ltd.
Except for the trademarks of New H3C Technologies Co., Ltd., any trademarks that may be mentioned in this document are the property of their respective owners.
The information in this document is subject to change without notice
Contents
Operating power supply failure
Newly-installed power supply failure
ACL application failure with an error message
ACL application failure without an error message
IRF fabric establishment failure
Troubleshooting Ethernet link aggregation
A 10-GE SFP+ fiber port or 40-GE QSFP+ fiber port fails to go up
A 1/10GBASE-T copper port fails to go up
Introduction
Troubleshooting hardware
This section provides troubleshooting information for common hardware issues.
|
|
NOTE: This section describes how to troubleshoot unexpected switch reboot, power supply failure, and fan tray failure. To troubleshoot ports, see "Troubleshooting ports." |
Unexpected switch reboot
Symptom
The switch reboots unexpectedly when it is operating.
Troubleshooting flowchart
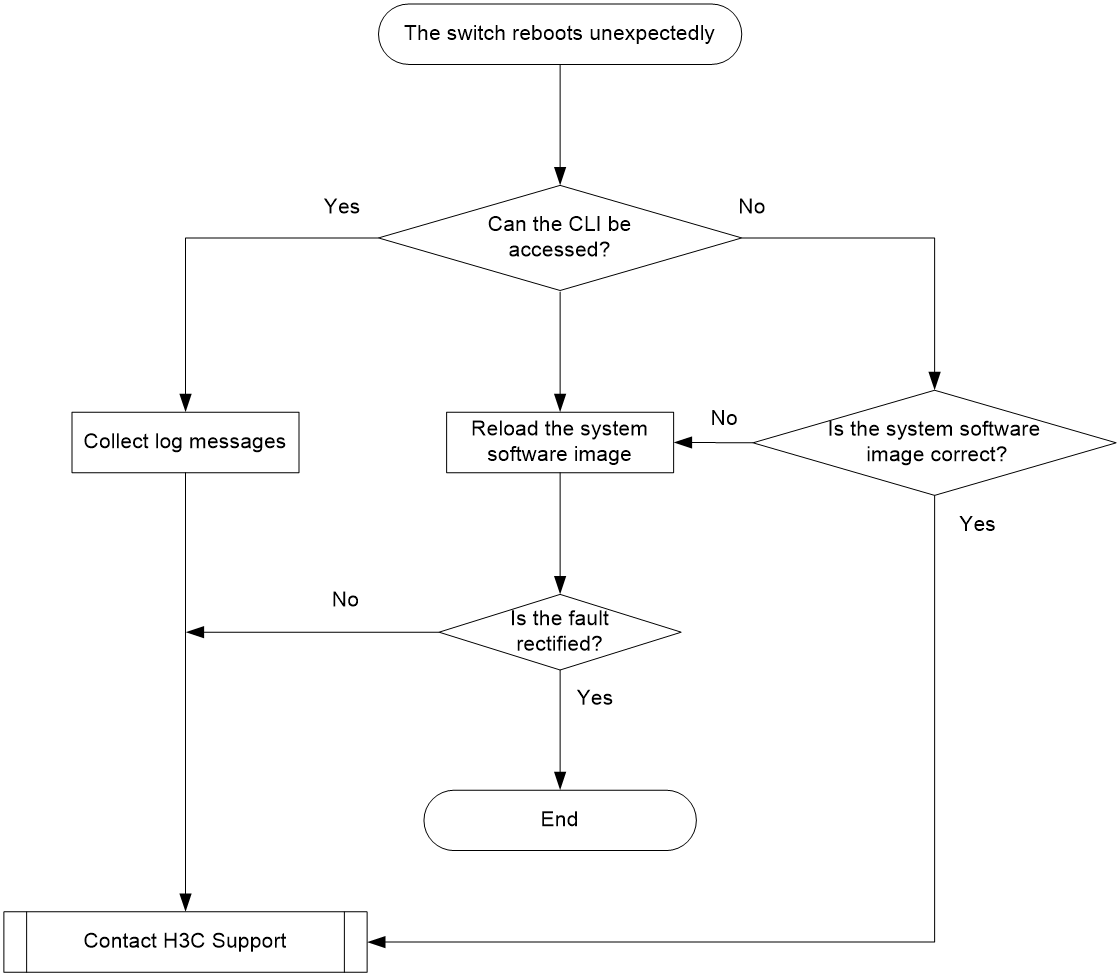
Figure 1 Troubleshooting unexpected switch reboot
Solution
To resolve the issue:
1. Verify that you can access the CLI after the switch reboots.
¡ If you can access the CLI, execute the display diagnostic-information command to collect log messages.
¡ If you cannot access the CLI, go to step 2.
2. Verify that the system software image on the switch is correct.
Log in to the switch through the console port and restart the switch. If the system reports that a CRC error has occurred or that no system software image is available, reload the system software image. The system software image is automatically set to the current system software image during the Boot ROM image running process.
3. If the issue persists, contact H3C Support.
Operating power supply failure
Symptom
A trap or log is generated indicating that an operating power supply is faulty.
Solution
To resolve the issue:
1. Execute the display power command to display power supply information.
<H3C> display power
Slot 1:
Input Power: 78(W)
PowerID State Mode Current(A) Voltage(V) Power(W)
1 Normal AC -- -- --
2 Absent -- -- -- --
If the power supply is in Absent state, go to step 2. If the power supply is in Fault state, go to step 3.
2. Remove and reinstall the power supply to make sure the power supply is installed correctly. Then, execute the display power command to verify that the power supply has changed to Normal state. If the power supply remains in Absent state, replace the power supply.
3. When the power supply is in Fault state, do the following:
b. Verify that the power supply surface is clean. If there is dust accumulated on the power supply, remove the dust. Then remove and reinstall the power supply. Execute the display power command to verify that the power supply has changed to Normal state. If the power supply remains in Fault state, go to step c.
c. Install the power supply into an empty power supply slot. Then execute the display power command to verify that the power supply has changed to Normal state in the new slot. If the power supply remains in Fault state, replace the power supply.
4. If the issue persists, contact H3C Support.
Newly-installed power supply failure
Symptom
A trap or log is generated indicating that a newly-installed power supply is faulty.
Solution
To resolve the issue:
1. Execute the display power command to display power supply information.
<H3C> display power
Slot 1:
Input Power: 78(W)
PowerID State Mode Current(A) Voltage(V) Power(W)
1 Normal AC -- -- --
2 Absent -- -- -- --
If the power supply is in Absent state, go to step 2. If the power supply is in Fault state, go to step 3.
2. When the power supply is in Absent state, do the following:
a. Remove and reinstall the power supply to make sure the power supply is installed securely. Then execute the display power command to verify that the power supply has changed to Normal state. If the power supply remains in Absent state, go to step b.
b. Remove and install the power supply into an empty power supply slot. Then execute the display power command to verify that the power supply has changed to Normal state in the new slot. If the power supply remains in Absent state, go to step 4.
3. Remove and install the power supply into an idle power supply slot. Then execute the display power command to verify that the power supply has changed to Normal state in the new slot. If the power supply remains in Fault state, go to step 4.
4. If the issue persists, contact H3C Support.
Fan tray failure
Symptom
A trap or log is generated indicating that an operating fan tray or a newly-installed fan tray is faulty.
Solution
To resolve the issue:
1. Execute the display fan command to display the operating state of the fan tray.
<H3C> display fan
Slot 1:
Fan 1:
State : Normal
Airflow Direction: Port-to-power
Prefer Airflow Direction: Port-to-power
Fan 2:
State : Normal
Airflow Direction: Port-to-power
Prefer Airflow Direction: Port-to-power
¡ If the Airflow Direction value is different from the Prefer Airflow Direction value, replace the fan tray with one that has an airflow direction as the preferred airflow direction, or execute the fan prefer-direction command to configure the preferred airflow direction as that of the fan tray.
¡ If the fan tray is in Absent state, go to step 2.
¡ If the fan tray is in Fault state, go to step 3.
2. Remove and reinstall the fan tray to make sure the fan tray is securely installed. Then execute the display fan command to verify that the fan tray has changed to Normal state. If the fan tray remains in Absent state, replace the fan tray.
3. Execute the display environment command to display temperature information. If the temperature continues to rise, put your hand at the air outlet vents to verify that air is being exhausted from the air outlet vents. If there is no air being exhausted from the air outlet vents, remove and reinstall the fan tray. Then execute the display fan command to verify that the fan tray has changed to Normal state. If the fan tray remains in Fault state, replace the fan tray.
¡ If there is no new fan tray, power off the switch to avoid damage caused by high temperatures.
¡ If there are cooling measures to maintain the switch operating temperature below 60°C (140°F), the switch can be used temporarily.
4. If the issue persists, contact H3C Support.
Related commands
This section lists the commands that you might use for troubleshooting the hardware.
|
Command |
Description |
|
dir |
Displays information about files and directories. |
|
display boot-loader |
Displays current configuration files and system software images. |
|
display environment |
Displays temperature information. |
|
display fan |
Displays the operating states of the fan tray. |
|
display logbuffer |
Displays the state of the log buffer and the log information in the log buffer. |
|
display power |
Displays power supply information. |
Troubleshooting ACL
This section provides troubleshooting information for common issues with ACLs.
ACL application failure with an error message
Symptom
The system fails to apply a packet filter or an ACL-based QoS policy to the hardware. It also displays the "Reason: Not enough hardware resource" message.
Solution
To resolve the issue:
1. Execute the display qos-acl resource command, and then check the Remaining field for ACL resources insufficiency.
If this field displays 0, the ACL hardware resources are exhausted.
2. To free hardware resources for packet filtering or QoS classification, remove unused ACLs.
3. If the issue persists, contact H3C Support.
ACL application failure without an error message
Symptom
The system applies a packet filter or an ACL-based QoS policy to the hardware. However, the ACL does not take effect.
Troubleshooting flowchart
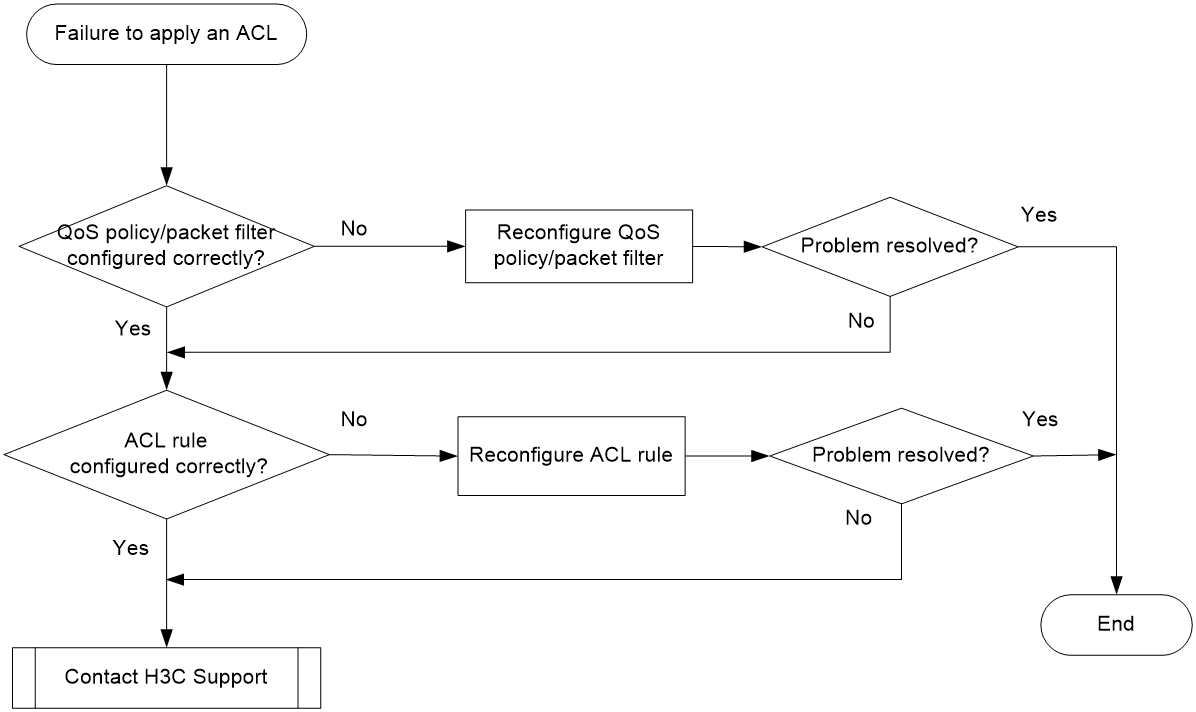
Figure 2 Troubleshooting an ACL application failure
Solution
Choose a solution depending on the module that uses the ACL.
ACL used in a QoS policy
To resolve the issue when the ACL is used in a QoS policy:
1. Verify that the QoS policy is configured correctly:
a. Use one of the following commands to check the QoS policy for configuration errors, depending on the policy application destination:
|
Destination |
Command |
|
Interface |
display qos policy interface |
|
VLAN |
display qos vlan-policy |
|
Global |
display qos policy global |
|
Control plane |
display qos policy control-plane slot slot-number |
b. If the QoS policy does not contain a class-behavior association, associate the traffic behavior with the traffic class.
c. If the QoS policy contains a class-behavior association, execute the display traffic classifier user-defined command and the display traffic behavior user-defined command to check for traffic class and behavior configuration errors, respectively.
- If they are configured incorrectly, reconfigure them.
- If they are configured correctly, go to step 2.
2. Verify that the ACL is configured correctly.
Execute the display acl command to check whether the ACL is configured correctly.
¡ If the ACL is configured incorrectly, reconfigure it.
¡ If the ACL is configured correctly, go to step 3.
3. If the issue persists, contact H3C Support.
ACL used in a packet filter
To resolve the issue when the ACL is used in a packet filter:
1. Verify that the packet filter is configured correctly.
Execute the display packet-filter command to check whether the packet filter is configured correctly.
¡ If there are any configuration errors, reconfigure the packet filter.
¡ If there is no configuration error, go to step 2.
2. Verify that the ACL is configured correctly.
Execute the display acl command to check whether the ACL is configured correctly.
¡ If the ACL is configured incorrectly, reconfigure it.
¡ If the ACL is configured correctly, go to step 3.
3. If the issue persists, contact H3C Support.
Related commands
This section lists the commands that you might use for troubleshooting ACLs.
|
Command |
Description |
|
display packet-filter |
Displays whether an ACL has been successfully applied to an interface for packet filtering. |
|
display qos-acl resource |
Displays QoS and ACL resource usage. |
|
display qos policy control-plane |
Displays information about the QoS policies applied to the specified control plane. |
|
display qos policy global |
Displays information about global QoS policies. |
|
display qos policy interface |
Displays information about the QoS policies applied to an interface or to all interfaces. |
|
display qos vlan-policy |
Displays information about QoS policies applied to VLANs. |
|
display traffic classifier user-defined |
Displays traffic class configuration. |
|
display traffic behavior user-defined |
Displays traffic behavior configuration. |
Troubleshooting IRF
This section provides troubleshooting information for common issues with IRF.
IRF fabric establishment failure
Symptom
An IRF fabric cannot be established.
Troubleshooting flowchart
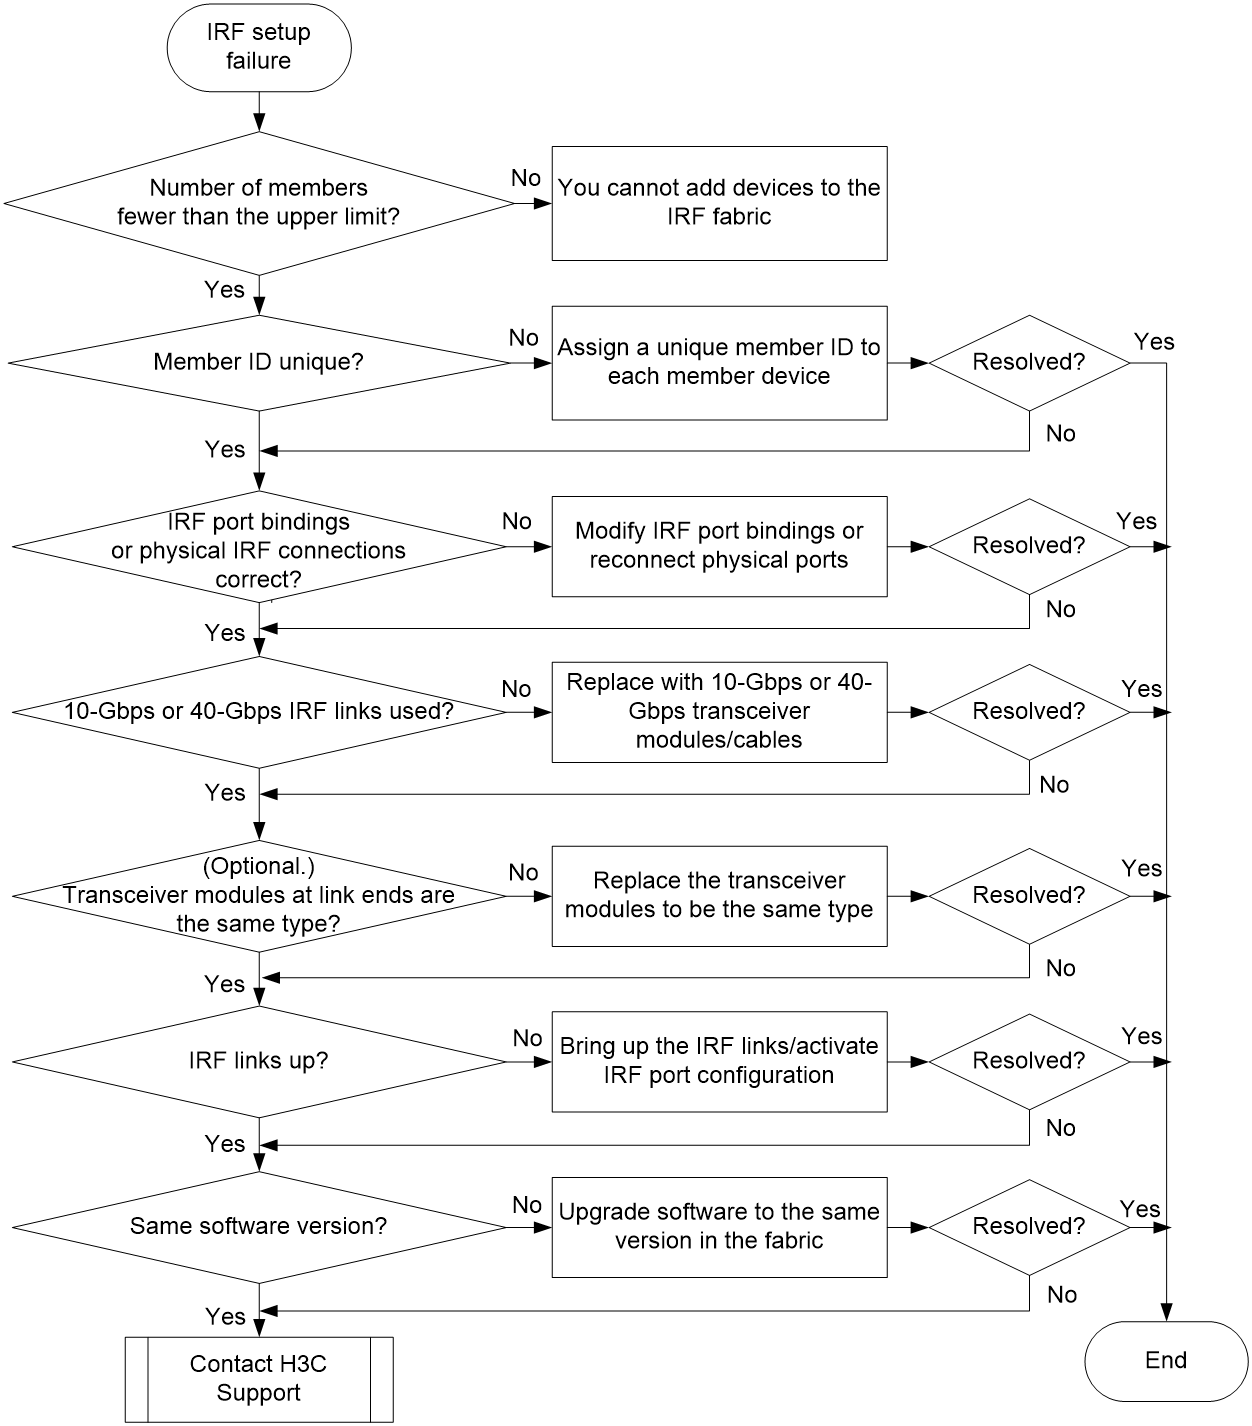
Figure 3 Troubleshooting IRF fabric establishment failure
Solution
To resolve the issue:
1. Verify that the number of member devices does not exceed the upper limit.
If you are adding a new member device to an existing IRF fabric or merging IRF fabrics, use the display irf command to identify the number of member devices in the IRF fabrics. If the total number of member devices exceeds the upper limit, the IRF setup will fail.
2. Verify that the member ID of each member device is unique:
a. Execute the display irf command to view the member ID of each member device.
b. Assign a unique member ID to each member.
- If you are adding a new member device to an existing IRF fabric, assign the member device a member ID that is not being used in the IRF fabric.
- If you are merging IRF fabrics, make sure each member device in these IRF fabrics has a unique member ID.
3. Verify that the IRF port bindings and physical IRF link connections are correct:
|
|
IMPORTANT: When you connect two neighboring IRF members, you must connect the physical ports of IRF-port 1 on one member to the physical ports of IRF-port 2 on the other. |
a. Execute the display irf configuration command on each member device, and check the IRF-Port1 and IRF-Port2 fields for IRF port bindings.
b. Verify that all or none of the physical ports in a port group are used for IRF connection.
The following are physical port grouping rules:
- The 10GBASE-T ports or SFP+ ports are grouped by port number in order, starting from 1. Each port group contains four ports.
- The 10-GE interfaces split from a QSFP+ port belong to the same port group.
c. Verify that the physical IRF connections are consistent with the IRF port bindings.
d. If there are binding errors or connection inconsistencies, reconfigure the IRF port bindings or reconnect the physical IRF ports.
4. Verify that the IRF links are 10 Gbps or 40 Gbps:
a. Verify that the transceiver modules or cables for IRF connection are labeled with 10Gbps, SFP+, 40Gbps, or QSFP+.
b. Replace a transceiver module or cable if it is not for 10-Gbps or 40-Gbps connection.
5. (Optional.) Verify that transceiver modules at the two ends of an IRF link are the same type.
If the transceiver modules are not the same type, replace them to be the same type.
Skip this step if you are using SFP+ or QSFP+ cables to connect IRF member devices.
6. Verify that all IRF links are up:
a. Execute the display irf topology command, and then check the Link field.
- If the Link field for each IRF port does not display DOWN, go to step 7.
- If the Link field for an IRF port displays DOWN, go to step b.
b. Execute the display irf link command, and then check the Status field of the physical ports bound to the IRF port.
- If the field displays DOWN or ADM (administratively down) for all the physical ports, remove the link failures or use the undo shutdown command to bring up the administratively down ports.
- If the field displays UP for at least one of the physical ports, go to step c.
c. Save the configuration, and then execute the irf-port-configuration active command in system view to activate the IRF port configuration.
|
|
IMPORTANT: Activating IRF port configuration requires a reboot. To prevent configuration loss, you must save the configuration before you execute the irf-port-configuration active command. |
7. Verify that all member devices use the same software version:
a. Execute the display version command to identify the software version of each member device.
b. Upgrade the software of all member devices to the same version.
|
|
NOTE: Typically, the irf auto-update enable command can automatically synchronize a member device with the software version of the master device. However, the synchronization might fail when the gap between the software versions is too large. For more information, see the release notes. |
8. If the issue persists, contact H3C Support.
Related commands
This section lists the commands that you might use for troubleshooting IRF.
|
Command |
Description |
|
display interface |
Displays interface information. Use this command to verify that each IRF port has at least one physical port in up state. |
|
display irf |
Displays IRF fabric information, including the member ID, role, priority, bridge MAC address, and description of each IRF member. |
|
display irf configuration |
Displays basic IRF settings, including the current member ID, new member ID, and physical ports bound to the IRF ports on each IRF member device. The new member IDs take effect at reboot. |
|
display irf topology |
Displays the IRF fabric topology, including the member IDs, IRF port state, and adjacencies of IRF ports. |
|
display version |
Displays system version information. |
|
irf-port-configuration active |
Activates IRF configuration on IRF ports. |
|
undo shutdown |
Brings up an Ethernet interface or subinterface. |
Troubleshooting Ethernet link aggregation
This section provides troubleshooting information for common issues with Ethernet link aggregation.
Link aggregation failure
Symptom
Some member ports fail to be placed in Selected state, and link aggregation does not operate correctly.
Troubleshooting flowchart
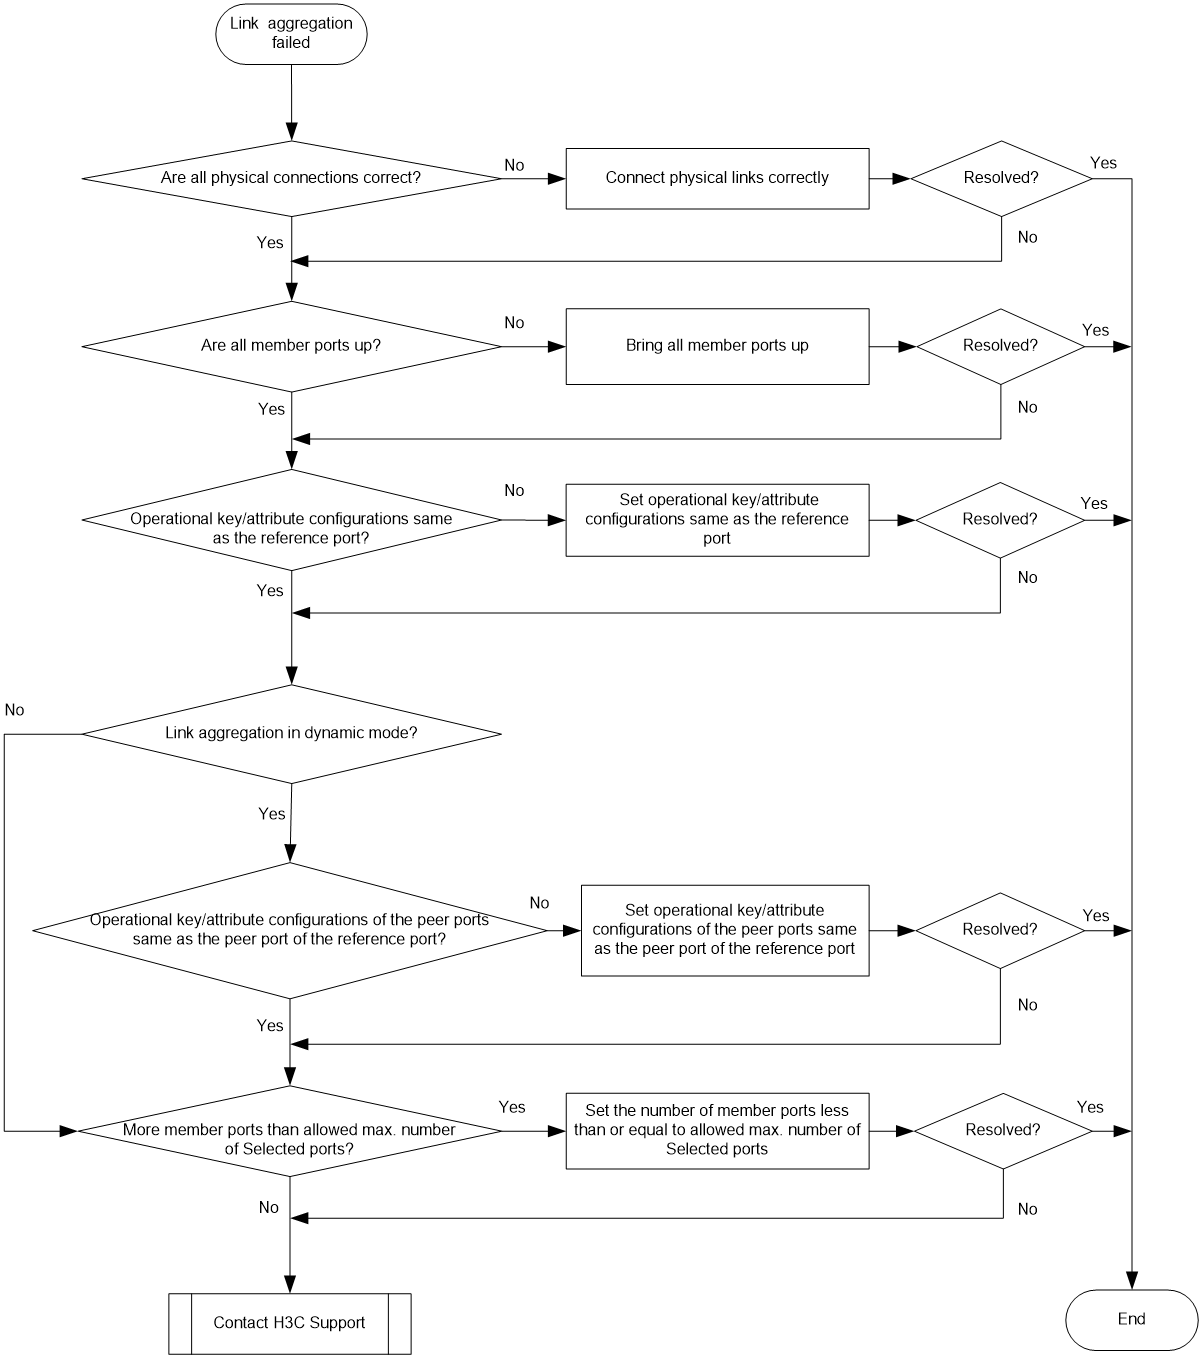
Figure 4 Troubleshooting link aggregation failure
Solution
To resolve the issue:
1. Verify that all physical connections are correct.
You can verify the physical connections against your network plan.
2. Verify that all member ports are up:
a. Execute the display interface command to display the status of the member ports.
b. If the member ports are down, follow the solution in "Troubleshooting ports" to troubleshoot the issue.
3. Verify that the member ports have the same operational key and attribute configurations as the reference port:
a. Execute the display link-aggregation verbose command to display the Selected state of the member ports.
b. Execute the display current-configuration interface command to display the configurations of the aggregate interface and the Unselected ports.
c. Configure the Unselected ports to make sure they have the same operational key and attribute configurations as the reference port.
4. Identify the aggregation mode of the aggregation group.
¡ If the aggregation mode is static, proceed to step 6.
¡ If the aggregation mode is dynamic, proceed to step 5.
5. Verify that the peer member ports have the same operational key and attribute configurations as the peer port of the reference port:
a. Execute the display current-configuration interface command on the peer device to display the configurations of the peer member ports.
b. Configure the peer member ports to make sure the peer ports have the same operational key and attribute configurations as the peer port of the reference port.
6. Verify that the number of member ports in the aggregation group does not exceed the configured maximum number of Selected ports.
a. Execute the link-aggregation selected-port maximum command to set the maximum number of Selected ports allowed in the aggregation group. The value range is 1 to 16.
b. Execute the display link-aggregation verbose command to verify that the number of member ports does not exceed the configured maximum number of Selected ports.
If the number of member ports exceeds the maximum number of Selected ports, the ports with higher port numbers are in Unselected state.
c. Use the undo port link-aggregation group command to remove undesired member ports from the aggregation group.
This makes sure all member ports you assign to the aggregation group can become Selected ports.
7. If the issue persists, contact H3C Support.
Related commands
This section lists the commands that you might use for troubleshooting Ethernet link aggregation.
|
Commands |
Description |
|
display current-configuration interface |
Displays interface configuration. |
|
display interface |
Displays Ethernet interface information. |
|
display link-aggregation verbose |
Display detailed information about the aggregation groups that correspond to the existing aggregate interfaces. |
|
link-aggregation selected-port maximum |
Configure the maximum number of Selected ports allowed in an aggregation group. |
Troubleshooting ports
This section provides troubleshooting information for common port issues.
A 10-GE SFP+ fiber port or 40-GE QSFP+ fiber port fails to go up
Symptom
A 10-GE SFP+ fiber port or 40-GE QSFP+ fiber port fails to go up.
Troubleshooting flowchart
Figure 5 Troubleshooting link up failure on a copper port
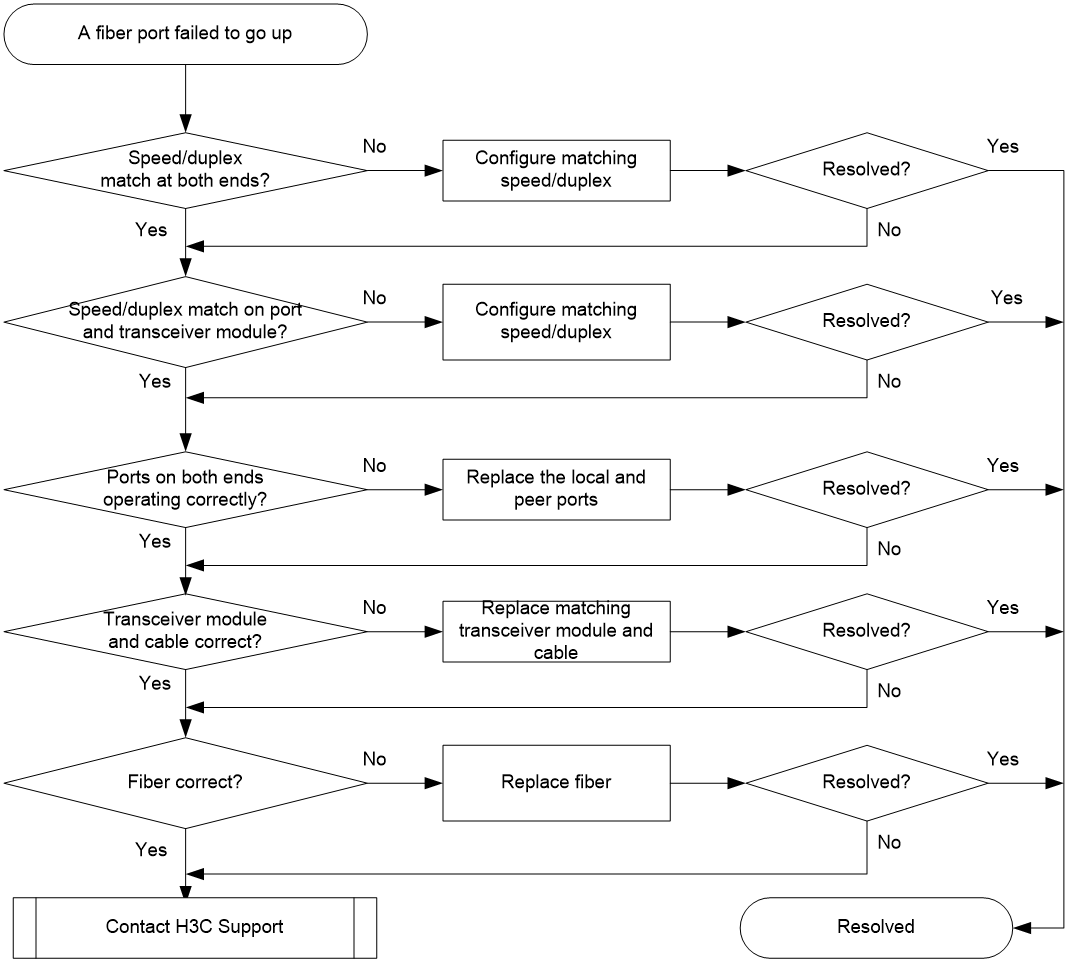
Solution
To resolve the issue:
1. Verify that the speed and duplex mode of the local port match the speed and duplex mode of the peer port:
a. Execute the display interface brief command to examine whether the speed and duplex mode of the port match the speed and duplex mode of the peer port.
b. If they do not match, use the speed command and the duplex command to set the rate and duplex mode for the port.
2. Verify that the speed and duplex mode of the local port match the speed and duplex mode of the transceiver module:
a. Execute the display interface brief command to examine whether the speed and duplex mode of the port match the speed and duplex mode of the transceiver module.
b. If they do not match, use the speed command and the duplex command to set the rate and duplex mode for the port.
3. Verify that the ports at both ends are operating correctly:
a. For a 10-GE SFP+ fiber port, use an SFP+ cable (used for short-haul connection) to directly connect it to another 10-GE SFP+ fiber port on the local end. For a 40-GE QSFP+ port, use a QSFP+ cable (used for short-haul connection) to directly connect it to another 40-GE QSFP+ port on the local end.
b. Identify whether the port can go up:
- If the port can go up, you can determine that the peer port fails. Replace the peer port with a new port operating correctly.
- If the port cannot go up, you can determine that the local port fails. Replace the local port with a new port operating correctly.
4. Verify that the transceiver module and cable are operating correctly:
a. Use the display transceiver alarm interface command to display the alarms present on the transceiver module:
- The device displays None if no error occurs.
- The device displays alarms if the transceiver module fails or the type of the transceiver module does not match the port type.
b. Use an optical power meter to verify that the Tx power and Rx power of the transceiver module are stable and are within the correct range.
c. Execute the display transceiver interface command to verify that the wavelength and transmission distance of the local transceiver module are consistent with the wavelength and transmission distance of the peer transceiver module.
d. If the transceiver module is not operating correctly, replace it with a H3C transceiver module that matches the fiber port.
For more information about transceiver modules and cables, see the installation guide.
|
|
NOTE: When you use a QSFP+ to SFP+ cable to connect a 40-GE QSFP+ fiber port, you must use an optical attenuator because the Tx optical power of the QSFP+ transceiver module exceeds the upper Rx optical power limit of the SFP+ transceiver module. |
5. Verify that the fiber matches the transceiver module. If they do not match, replace the fiber with a new one that matches the transceiver module.
For more information about fibers, see the installation guide.
6. If the issue persists, contact H3C Support, and provide the following information:
<H3C> display diagnostic-information
Save or display diagnostic information (Y=save, N=display)? [Y/N]:Y
A 1/10GBASE-T copper port fails to go up
Symptom
A 1/10GBASE-T copper port fails to go up.
Troubleshooting flowchart
Figure 6 Troubleshooting link up failure on a copper port
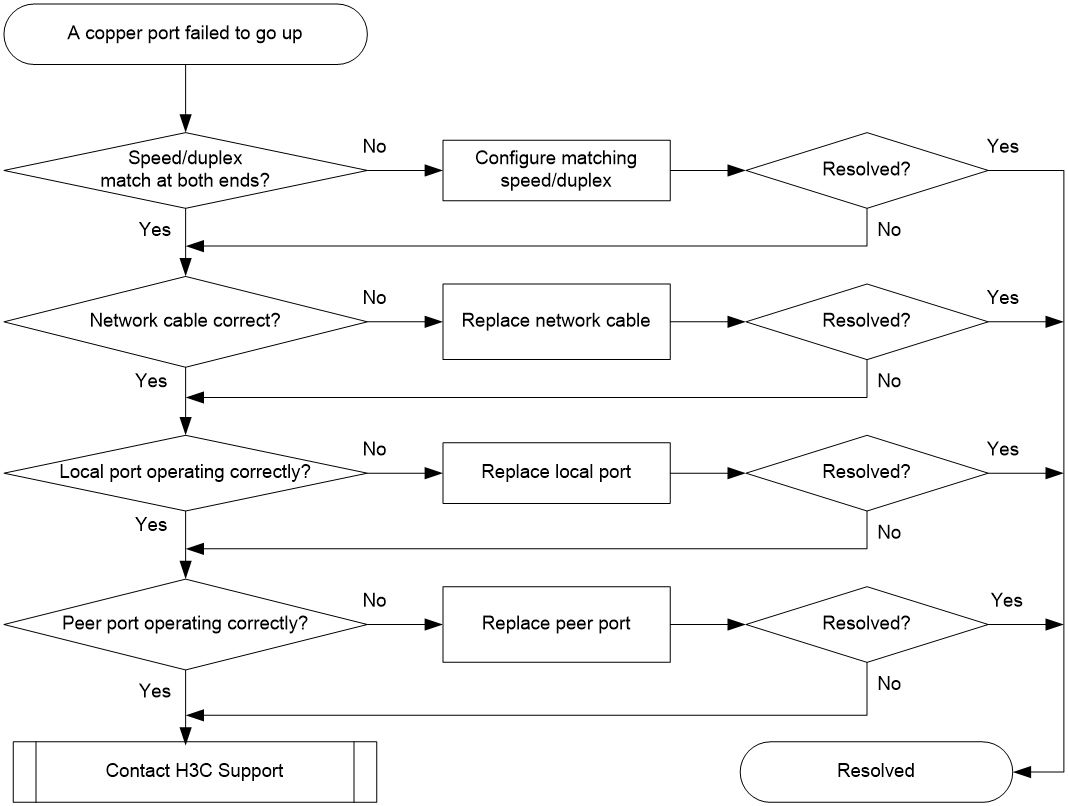
Solution
To resolve the issue:
1. Verify that the speed and duplex mode of the local port match the speed and duplex mode of the peer port:
a. Execute the display interface brief command to examine whether the speed and duplex mode of the port match the speed and duplex mode of the peer port.
b. If they do not match, use the speed command and the duplex command to set the rate and duplex mode for the port.
2. Replace the network cable with a new one to verify that the network cable is in good condition.
3. Replace the local port with a new one to verify that the local port is operating correctly.
4. Replace the peer port with a new one to verify that the peer port is operating correctly.
5. If the issue persists, contact H3C Support.
Related commands
This section lists the commands that you might use for troubleshooting ports.
|
Command |
Remarks |
|
display diagnostic-information |
Displays or saves running status data for multiple feature modules. |
|
display interface brief |
Displays brief interface information. |
|
display transceiver alarm interface |
Displays alarms present on transceiver modules. |
|
display transceiver interface |
Displays key parameters of the transceiver module installed in an interface. |
Troubleshooting other issues
Layer 2 forwarding failure
Symptom
Layer 2 packet loss occurs when the switch forwards packets to a peer on the same network segment and in the same VLAN.
Troubleshooting flowchart
Figure 7 Troubleshooting Layer 2 packet loss failure
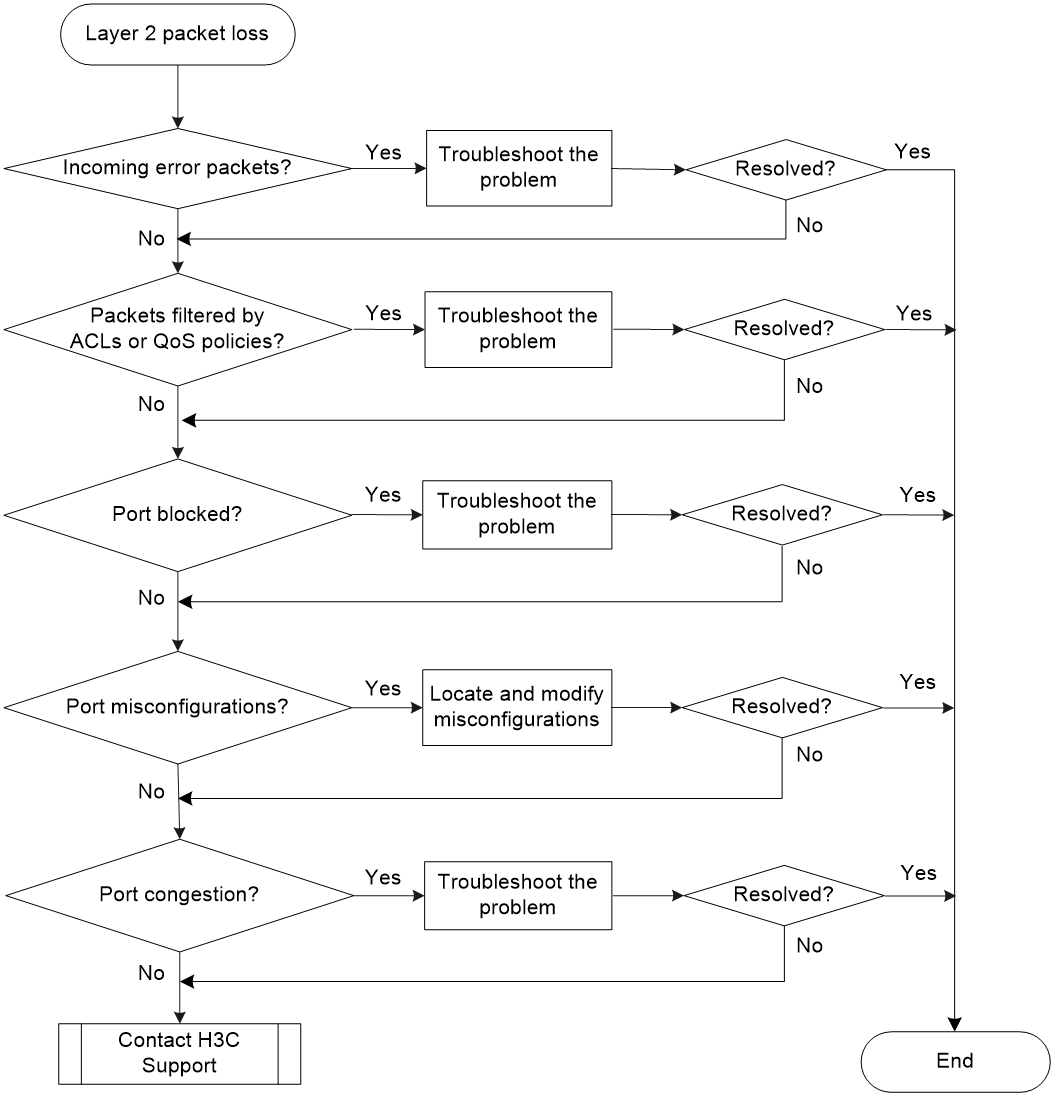
Solution
To resolve the issue:
1. Verify that no error packets have been received on the local port:
a. Execute the display interface command and check for error packets.
<H3C>display interface Ten-GigabitEthernet1/0/36
Ten-GigabitEthernet1/0/36
Current state: Administratively DOWN
Line protocol state: DOWN
IP packet frame type: Ethernet II, hardware address: 00e0-fc20-6334
Description: Ten-GigabitEthernet1/0/36 Interface
Bandwidth: 10000000 kbps
Loopback is not set
Media type is not sure, port hardware type is No connector
Unknown-speed mode, unknown-duplex mode
Link speed type is autonegotiation, link duplex type is autonegotiation
Flow-control is not enabled
Maximum frame length: 10000
Allow jumbo frames to pass
Broadcast max-ratio: 100%
Multicast max-ratio: 100%
Unicast max-ratio: 100%
PVID: 13
MDI type: Automdix
Port link-type: Access
Tagged VLANs: None
Untagged VLANs: 13
Port priority: 0
Last link flapping: Never
Last clearing of counters: Never
Peak input rate: 0 bytes/sec, at 2011-01-01 01:59:36
Peak output rate: 0 bytes/sec, at 2011-01-01 01:59:36
Last 300 second input: 0 packets/sec 0 bytes/sec -%
Last 300 second output: 0 packets/sec 0 bytes/sec -%
Input (total): 0 packets, 0 bytes
0 unicasts, 0 broadcasts, 0 multicasts, 0 pauses
Input (normal): 0 packets, - bytes
0 unicasts, 0 broadcasts, 0 multicasts, 0 pauses
Input: 0 input errors, 0 runts, 0 giants, 0 throttles
0 CRC, 0 frame, - overruns, 0 aborts
- ignored, - parity errors
Output (total): 0 packets, 0 bytes
0 unicasts, 0 broadcasts, 0 multicasts, 0 pauses
Output (normal): 0 packets, - bytes
0 unicasts, 0 broadcasts, 0 multicasts, 0 pauses
Output: 0 output errors, - underruns, - buffer failures
0 aborts, 0 deferred, 0 collisions, 0 late collisions
0 lost carrier, - no carrier
b. If the statistics are not zero, the following failures might occur:
- Interface hardware failure—To test such a failure, connect the cable that is connected to the local port to a correctly operating port (for example, Port A) with the same configurations as the local port. If Port A forwards traffic correctly, you can determine that the hardware of the local port fails. In this event, you must replace the local port with a correctly operating port.
- Transceiver module, fiber, or twisted pair failure—To test and resolve such a failure, replace the transceiver module, fiber, or twisted pair with a good one.
- Inconsistent configurations—Verify that the configurations (including speed and duplex mode) of the peer are consistent with the local port. If they are inconsistent, modify the configurations of the local port.
c. If the issue persists, contact H3C Support.
When you contact H3C Support, provide the following diagnostic information if packet loss occurs on the chip port with which the interface is associated:
# Execute the debug port mapping slot 1 command in probe view to identify the chip port with which the interface is associated.
[H3C-probe] debug port mapping slot 1
[Interface] [Unit] [Port] [Name] [Combo?] [Active?] [IfIndex] [MID] [Link]
===============================================================================
XGE1/0/1 0 1 xe0 no no 0x1 4 up
XGE1/0/2 0 2 xe1 no no 0x2 4 down
XGE1/0/3 0 3 xe2 no no 0x3 4 down
XGE1/0/4 0 4 xe3 no no 0x4 4 down
XGE1/0/5 0 5 xe4 no no 0x5 4 down
XGE1/0/6 0 6 xe5 no no 0x6 4 down
XGE1/0/7 0 7 xe6 no no 0x7 4 down
XGE1/0/8 0 8 xe7 no no 0x8 4 down
XGE1/0/9 0 9 xe8 no no 0x9 4 down
XGE1/0/10 0 10 xe9 no no 0xa 4 down
XGE1/0/11 0 11 xe10 no no 0xb 4 down
XGE1/0/12 0 12 xe11 no no 0xc 4 down
XGE1/0/13 0 13 xe12 no no 0xd 4 down
XGE1/0/14 0 14 xe13 no no 0xe 4 down
XGE1/0/15 0 15 xe14 no no 0xf 4 down
The output shows that Ten-GigabitEthernet 1/0/1 is associated with chip port xe0.
# Execute the bcm slot 1 chip 0 show/c/xe0 command to check the RDBGC and TDBGC fields for Rx and Tx dropped packet statistics, respectively. The statistics displayed were generated between the last and the current execution of the command. To view the change in dropped packet statistics, execute the command twice or more.
[H3C-probe] bcm slot 1 chip 0 show/c/xe0
RDBGC2.xe0 : 8,118 +8,118
R511.xe0 : 8,118 +8,118
RPKT.xe0 : 8,118 +8,118
RMCA.xe0 : 8,118 +8,118
RPOK.xe0 : 8,118 +8,118
RBYT.xe0 : 2,726,553 +2,726,553
T511.xe0 : 8,208 +8,208
TPOK.xe0 : 8,208 +8,208
TPKT.xe0 : 8,208 +8,208
TMCA.xe0 : 8,208 +8,208
TBYT.xe0 : 2,741,472 +2,741,472
PERQ_PKT(3).xe0 : 8,208 +8,208
PERQ_BYTE(3).xe0 : 2,741,472 +2,741,472 330/s
As shown in the command output, multicast packet loss has occurred as indicated by the statistics in the RDBGC2 field. If multicast packet loss statistics is displayed repeatedly when you execute the command two or more times, collect statistics about packet loss including the service module, port, and port settings and contact technical support.
2. Verify that packets are not mistakenly filtered out by ACLs:
a. Examine the ACL and QoS policy configurations for packet filtering on the port, on the VLAN of the port, or globally. If packets are mistakenly filtered out, modify the ACL or QoS policy configuration.
- To display the ACL configuration on the port for packet filtering, execute the display packet-filter command.
- To display the QoS policy configuration on the port, execute the display qos policy command.
- To display the QoS policy configuration on the VLAN of the port, execute the display qos vlan-policy command.
- To display the global QoS policy configuration, execute the display qos policy global command.
b. Verify that packets are not filtered out by automatically created ACLs.
The IP source guard feature creates ACLs automatically.
Execute the display this command in Ethernet interface view to verify that the ip source binding or ip verify source command is configured on the port. To display source guard binding entries, execute the display ip source binding or display ipv6 source binding command. If IP source guard is configured but the packets match no entry, further troubleshoot the issue based on the way the binding entries are created.
3. Verify that the port is not blocked:
¡ Execute the display stp brief command to verify that STP does not set the state of the port to discarding. When the port is in discarding state, it cannot forward traffic. H3C recommends disabling STP on the port, or configuring the port as an edge port if the port is connected to a terminal device.
¡ If the port belongs to an aggregation group, execute the display link-aggregation verbose command to identify the port status. When the port is an Unselected port, it cannot forward traffic. Locate the reasons why the port is in Unselected state. For example, the attribute configurations of the port are different from the configurations of the reference port.
4. Examine the following configurations that might cause packet loss:
¡ VLAN configuration—Execute the display this command in Ethernet interface view to verify that the port is in the VLAN of the packets. If it is not, add the port to the VLAN.
¡ Blackhole MAC address entries—Execute the display mac-address blackhole command to display blackhole MAC address entries. If the packets are discarded because they match a blackhole MAC address entry, delete the entry. To delete the blackhole MAC address entry, execute the undo mac-address blackhole mac-address vlan vlan-id command.
¡ Rate limit—Execute the display qos lr interface command to display the rate limit configuration on the port. If rate limit is configured on the port, make sure the committed information rate (CIR) and the committed burst size (CBS) are appropriate. To adjust the CIR and CBS values, execute the qos lr { inbound | outbound } cir committed-information-rate [ cbs committed-burst-size ] command.
¡ Storm suppression—Execute the display this command in Ethernet interface view to display the configuration of storm suppression. Storm suppression includes broadcast suppression, multicast suppression, and unknown unicast suppression. To adjust the suppression thresholds, execute the broadcast-suppression, multicast-suppression, and unicast-suppression commands, respectively.
5. Verify that no congestion occurs by using the display qos queue-statistics interface command.
If congestion occurs, locate and resolve the issue by referencing related congestion management documents.
6. If the issue persists, contact H3C Support.
Related commands
This section lists the commands that you might use for troubleshooting Layer 2 packet loss failure.
|
Command |
Description |
|
display interface |
Displays Ethernet interface information. |
|
display packet-filter |
Displays whether an ACL has been successfully applied to an interface for packet filtering. |
|
display qos policy |
Displays user-defined QoS policy configuration information. |
|
display qos policy interface |
Displays information about the QoS policies applied to an interface or all interfaces. |
|
display qos vlan-policy |
Displays information about QoS policies applied to VLANs. |
|
display qos policy global |
Displays information about global QoS policies. |
|
display this |
Displays the running configuration in the current view. |
|
display ip source binding/display ipv6 source binding |
Displays source guard binding entries. |
|
display link-aggregation verbose |
Displays detailed information about the aggregation groups that correspond to the aggregate interfaces. |
|
display mac-address blackhole |
Displays blackhole MAC address entries. |
|
display qos lr interface |
Displays the rate limit configuration and statistics on a specified interface or all the interfaces. |
|
display qos queue-statistics interface |
Displays traffic statistics collected for an interface on a per-queue basis. |
Layer 3 forwarding failure
Symptom
Packet loss occurs when the switch forwards packets to a different network.
Troubleshooting flowchart
Figure 8 Troubleshooting Layer 3 forwarding failure
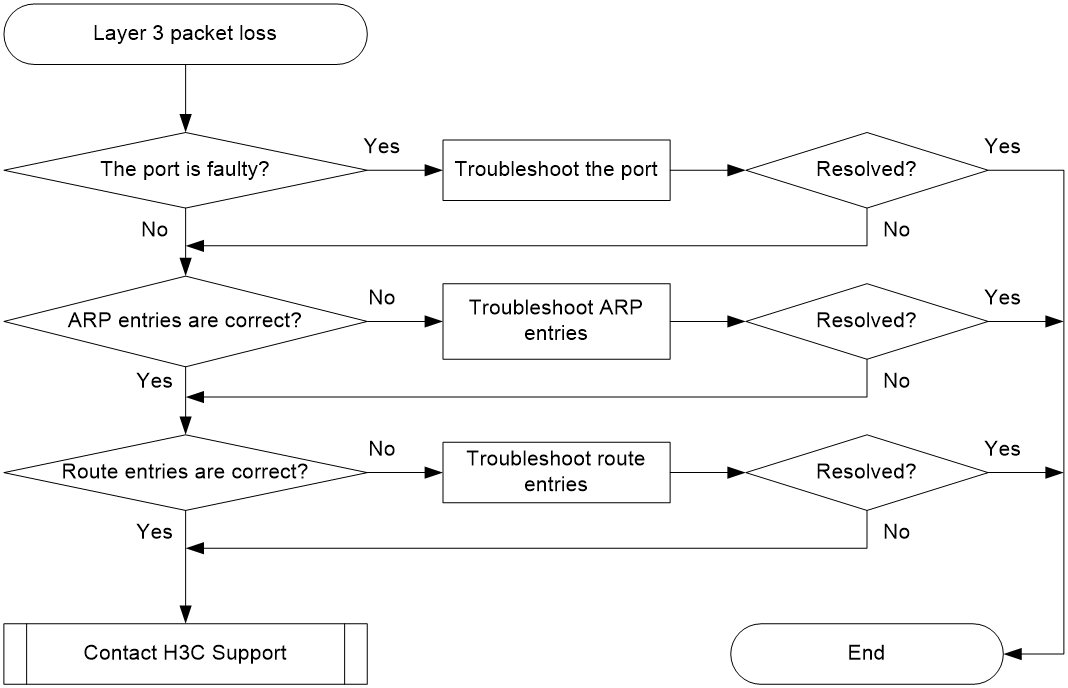
Solution
To resolve the issue:
1. Verify that the port is not faulty (due to hardware or configuration issues).
If the port is faulty, follow the solution in "Layer 2 forwarding failure" to troubleshoot the issue.
2. Verify that ARP entries are correct:
a. Execute the display arp command in user view to verify that ARP entries are correct.
- If incorrect ARP entries exist, execute the debugging arp packet command to locate the issue.
- If the switch learns no ARP entries, you can execute the arp static command to configure static ARP entries.
b. Execute the display mac-address command to verify that the output interfaces in the MAC address entries and ARP entries are the same by using the display mac-address command.
If the output interfaces are not the same, execute the reset command to clear the ARP entries. Then the switch can learn ARP entries again.
3. Verify that route entries are correct:
a. Execute the display ip routing-table command to verify that route entries are correct.
If incorrect route entries exist, troubleshoot the protocol that learns the route entries.
b. Execute the display fib command to verify that the output interfaces in the FIB entries and route entries are the same.
If the output interfaces are not the same, execute the reset command to clear the route entries. Then the switch can learn route entries again.
4. If the issue persists, contact H3C Support.
Related commands
This section lists the commands that you might use for troubleshooting Layer 3 forwarding failure.
|
Command |
Description |
|
debugging arp packet |
Enables ARP packet debugging. |
|
display arp |
Displays ARP entries. |
|
display ip routing-table |
Displays brief information about active routes in the routing table. |
|
display mac-address |
Display MAC address entries |
|
display fib |
Display FIB entries |
Protocol flapping
Symptom
The switch cannot send or receive protocol packets.
Troubleshooting flowchart
Figure 9 Troubleshooting protocol flapping
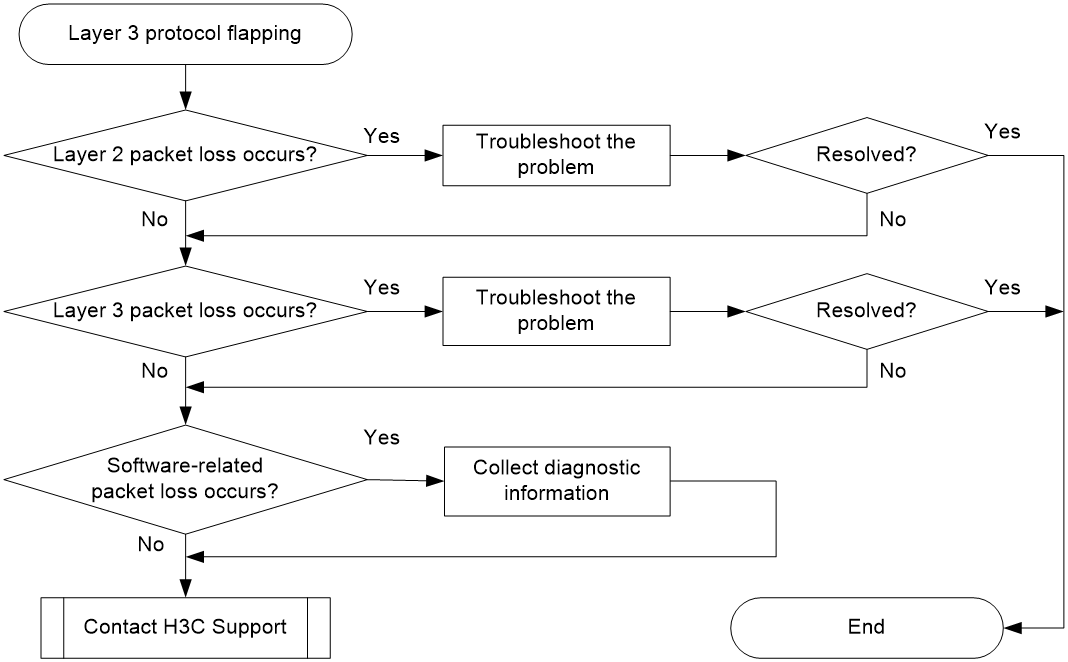
Solution
To resolve the issue:
1. Verify that Layer 2 is operating correctly, as described in "Layer 2 forwarding failure."
2. Verify that Layer 3 is operating correctly, as described in "Layer 3 forwarding failure."
3. Execute the debug rxtx softcar show slot 1 command in probe view to check for software-related packet loss.
[H3C-Probe] debug rxtx softcar show slot 1
ID Type RcvPps Rcv_All DisPkt_All Pps Dyn Swi Hash ACLmax
0 ROOT 0 0 0 300 S On SMAC 0
1 ISIS 0 0 0 200 D On SMAC 8
2 ESIS 0 0 0 100 S On SMAC 8
3 CLNP 0 0 0 100 S On SMAC 8
4 VRRP 0 0 0 1024 S On SMAC 8
5 UNKNOWN_IPV4MC 0 0 0 100 S On SMAC 8
6 UNKNOWN_IPV6MC 0 0 0 100 S On SMAC 8
7 IPV4_MC_RIP 0 0 0 150 D On SMAC 8
8 IPV4_BC_RIP 0 0 0 150 D On SMAC 8
The meanings of the above fields are as follows:
¡ DisPkt_All—Number of discarded packets.
¡ Rcv_All—Number of received packets.
¡ RcvPps—Packet receiving rate.
4. If the issue persists, contact H3C Support.
When you contact H3C Support, provide diagnostic information if software-related packet loss occurred.
Fan failure
Symptom
The fans do not operate correctly.
Troubleshooting flowchart
Figure 10 Flowchart for troubleshooting fan failure
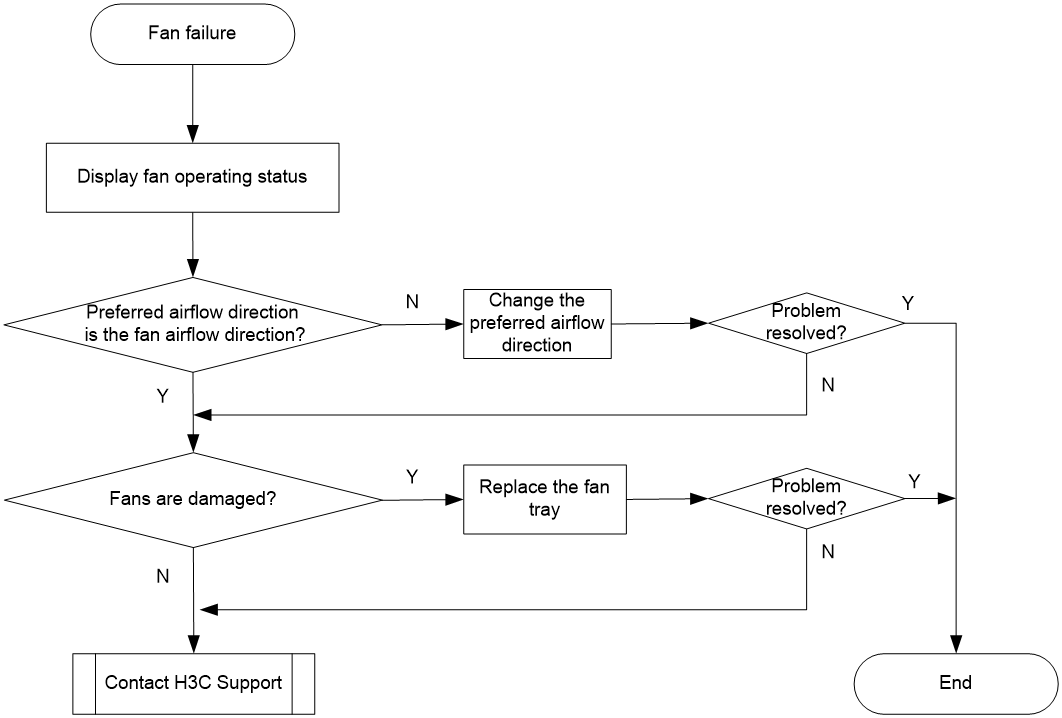
Solution
To resolve the issue:
1. Verify that the preferred airflow direction specified for the fans is the same as the airflow direction of the fans:
a. Display fan operating status.
[Sysname] display fan
Slot 1:
Fan 1:
State : FanDirectionFault
Airflow Direction: Port-to-power
Prefer Airflow Direction: Power-to-port
Fan 2:
State : FanDirectionFault
Airflow Direction: Port-to-power
Prefer Airflow Direction: Power-to-port
b. If the preferred airflow direction is different, use the fan prefer-direction slot slot-number { power-to-port | port-to-power } command to change the setting.
[Sysname] fan prefer-direction slot 1 port-to-power
c. Verify the modification.
[Sysname]display fan
Slot 1:
Fan 1:
State : Normal
Airflow Direction: Port-to-power
Prefer Airflow Direction: Port-to-power
Fan 2:
State : Normal
Airflow Direction: Port-to-power
Prefer Airflow Direction: Port-to-power
2. If the fans still cannot operate correctly, check whether the fans are damaged. If the fan status is fault, replace the fan tray.
3. If the issue persists, contact H3C Support.
Related commands
This section lists the commands that you might use for troubleshooting fans.
|
Command |
Description |
|
display fan |
Displays fan operating status. |
|
fan prefer-direction slot slot-number { power-to-port | port-to-power } |
Specifies the preferred airflow direction. |
