- Released At: 19-11-2019
- Page Views:
- Downloads:
- Table of Contents
- Related Documents
-
|
|
|
H3C S5560X-EI Switch Series |
|
Troubleshooting Guide |
|
|
Document version: 6W100-20170602
|
Copyright © 2017 New H3C Technologies Co., Ltd. All rights reserved. No part of this manual may be reproduced or transmitted in any form or by any means without prior written consent of New H3C Technologies Co., Ltd. The information in this document is subject to change without notice. |
|
Contents
Collecting log and operating information
Collecting common log messages
Collecting diagnostic log messages
Collecting operating statistics
Operating power module failure
Newly installed power module failure
ACL application failure with an error message
ACL application failure without an error message
Packet loss or forwarding failure
IRF fabric establishment failure
Troubleshooting Ethernet link aggregation
Fiber port remains in down state
Copper port remains in down state
Transceiver module does not support digital diagnosis
Error frames (for example, CRC errors) on a port
Troubleshooting system management
Troubleshooting other problems
Introduction
This document provides information about troubleshooting common software and hardware problems with S5560X-EI Switch Series.
This document is not restricted to specific software or hardware versions.
General guidelines
|
|
IMPORTANT: To prevent a failure from causing loss of configuration, save the configuration each time you finish configuring a feature. For configuration recovery, regularly back up the configuration to a remote server. |
When you troubleshoot xxx, follow these general guidelines:
· To help identify the failure cause, collect system and configuration information, including:
¡ Symptom, time of failure, and configuration.
¡ Network topology information, including the network diagram, port connections, and points of failure.
¡ Log messages and diagnostic information. For more information about collecting this information, see "Collecting log and operating information."
¡ Physical evidence of failure:
- Photos of hardware.
- Status of the LEDs.
¡ Measures you have taken, such as reconfiguration, cable swapping, and reboot.
¡ Output from the commands executed during the troubleshooting process.
· To ensure safety, wear an ESD-preventive wrist strap when you replace or maintain a hardware component.
· If hardware replacement is required, use the release notes to verify the hardware and software compatibility.
Collecting log and operating information
|
|
IMPORTANT: By default, the information center is enabled. If the feature is disabled, you must use the info-center enable command to enable the feature for collecting log messages. |
Table 1 shows the types of files that the system uses to store operating log and status information. You can export these files by using FTP, TFTP, or USB.
In an IRF system, these files are stored on the master device. Multiple devices will have log files if master/subordinate switchovers have occurred. You must collect log files from all these devices. To more easily locate log information, use a consistent rule to categorize and name files. For example, save log files to a separate folder for each member device, and include their slot numbers in the folder names.
Table 1 Log and operating information
|
Category |
File name format |
Content |
|
Common log |
logfile.log |
Command execution and operational log messages. |
|
Diagnostic log |
diagfile.log |
Diagnostic log messages about device operation, including the following items: · Parameter settings used when an error occurs. · Information about a card startup error. · Handshaking information between member devices when a communication error occurs. |
|
Operating statistics |
file-basename.tar.gz |
Current operation statistics for feature modules, including the following items: · Device status. · CPU status. · Memory status. · Configuration status. · Software entries. · Hardware entries. |
Collecting common log messages
1. Save the common log messages from the log buffer to a log file.
By default, the log file is saved in the logfile directory of the Flash memory on each member device.
<Sysname> logfile save
The contents in the log file buffer have been saved to the file flash:/logfile/logfile.log
2. Identify the log file on each member device:
# Display the log file on the master device.
<Sysname> dir flash:/logfile/
Directory of flash:/logfile
0 -rw- 21863 Jul 11 2013 16:00:37 logfile.log
514048 KB total (107944 KB free)
# Display the log file on a subordinate device:
<Sysname> dir slot2#flash:/logfile/
Directory of slot2#flash:/logfile
0 -rw- 21863 Jul 11 2013 16:00:37 logfile.log
514048 KB total (107944 KB free)
3. Transfer the files to the desired destination by using FTP, TFTP, or USB. (Details not shown.)
Collecting diagnostic log messages
1. Save the diagnostic log messages from the diagnostic log file buffer to a diagnostic log file.
By default, the diagnostic log file is saved in the diagfile directory of the Flash memory on each member device.
<Sysname> diagnostic-logfile save
The contents in the diagnostic log file buffer have been saved to the file flash:/diagfile/diagfile.log
2. Identify the diagnostic log file on each member device:
# Display the diagnostic log file on the master device.
<Sysname> dir flash:/diagfile/
Directory of flash:/diagfile
0 -rw- 161321 Jul 11 2013 16:16:00 diagfile.log
514048 KB total (107944 KB free)
# Display the diagnostic log file on a subordinate device:
<Sysname> dir slot2#flash:/diagfile/
Directory of slot2#flash:/diagfile
0 -rw- 161321 Jul 11 2013 16:16:00 diagfile.log
514048 KB total (107944 KB free)
3. Transfer the files to the desired destination by using FTP, TFTP, or USB. (Details not shown.)
Collecting operating statistics
You can collect operating statistics by saving the statistics to a file or displaying the statistics on the screen.
When you collect operating statistics, follow these guidelines:
· Log in to the device through a network port or management port (if any) instead of the console port as long as possible. Network and management ports are faster than the console port.
· Do not execute commands during operating statistics collection.
· To ensure information completeness, H3C recommends that you save the statistics to a file.
|
|
NOTE: The amount of time to collect statistics increases along with the number of IRF member devices. |
To collect operating statistics:
1. Collect operating statistics for multiple feature modules.
<Sysname> display diagnostic-information
Save or display diagnostic information (Y=save, N=display)? [Y/N] :
2. At the prompt, choose to save or display operating statistics:
# To save operating statistics, enter y at the prompt and then specify the destination file path.
Save or display diagnostic information (Y=save, N=display)? [Y/N] :y
Please input the file name(*.tar.gz)[flash:/diag_Sysname_20160101-000704.tar.gz] :flash:/diag.tar.gz
Diagnostic information is outputting to flash:/diag.tar.gz.
Please wait...
Save successfully.
<Sysname> dir flash:/
Directory of flash:
…
6 -rw- 898180 Jun 26 2013 09:23:51 diag.tar.gz
514048 KB total (107944 KB free)
# To display operating statistics on the monitor terminal, enter n at the prompt. (The output from this command varies by software version.)
Save or display diagnostic information (Y=save, N=display)? [Y/N] :N
===============================================
===============display clock===============
23:49:53 UTC Tue 01/01/2016
=================================================
===============display version===============
H3C Comware Software, Version 7.1.070, ESS 1106
Copyright (c) 2004-2016 Hangzhou H3C Tech. Co., Ltd. All rights reserved.
H3C S5560X-30C-PWR-EI uptime is 0 weeks, 0 days, 23 hours, 50 minutes
Last reboot reason : Cold reboot
Boot image: flash:/s5560x_ei-cmw710-boot-e1106.bin
Boot image version: 7.1.070, ESS 1106
Compiled Jul 21 2016 16:00:00
Boot image: flash:/s5560x_ei-cmw710-system-e1106.bin
Boot image version: 7.1.070, ESS 1106
Compiled Jul 21 2016 16:00:00
……
3. Display the content of the operating statistics file:
# Extract and decompress the operating statistics file.
<Sysname> tar extract archive-file diag_Sysname_20160101-000704.tar.gz
Extracting archive flash:/diag_Sysname_20160101-000704.tar.gz Done.
<Sysname> gunzip diag_Sysname_20160101-000704.gz
Decompressing file flash:/diag_Sysname_20160101-000704.gz.... Done.
# Display the content of the operating statistics file.
<Sysname> more diag_Sysname_20160101-000704
===============================================
===============display clock===============
23:49:53 UTC Tue 01/01/2016
=================================================
===============display version===============
H3C Comware Software, Version 7.1.070, ESS 1106
Copyright (c) 2004-2016 Hangzhou H3C Tech. Co., Ltd. All rights reserved.
H3C S5560X-30C-PWR-EI uptime is 0 weeks, 0 days, 23 hours, 50 minutes
Last reboot reason : Cold reboot
Boot image: flash:/s5560x_ei-cmw710-boot-e1106.bin
Boot image version: 7.1.070, ESS 1106
Compiled Jul 21 2016 16:00:00
Boot image: flash:/s5560x_ei-cmw710-system-e1106.bin
Boot image version: 7.1.070, ESS 1106
Compiled Jul 21 2016 16:00:00
---- More ----
Contacting technical support
· Information described in "General guidelines."
· Product serial numbers.
This information will help the support engineer assist you as quickly as possible.
You can contact H3C Support at service@h3c.com.
Troubleshooting hardware
This section provides troubleshooting information for common hardware problems.
|
|
NOTE: This section describes how to troubleshoot unexpected switch reboot, power module failure, and fan tray failure. To troubleshoot ports, see "Troubleshooting ports." |
Unexpected switch reboot
Symptom
The switch reboots unexpectedly while it is operating.
Troubleshooting flowchart
Figure 1 Troubleshooting unexpected switch reboot
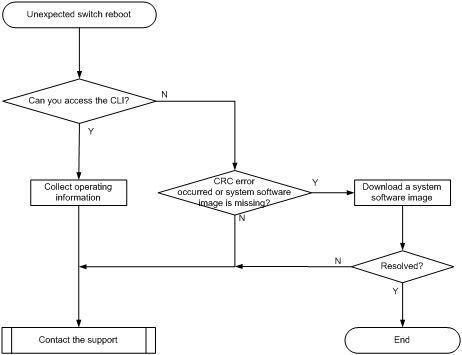
Solution
To resolve the problem:
1. Check whether you can access the CLI after the switch reboots.
¡ If you can access the CLI, execute the display diagnostic-information command to collect operating information.
¡ If you cannot access the CLI, go to step 2.
2. Verify that the system software image on the switch is correct:
Log in to the switch through the console port and restart the switch. If the system reports that a CRC error has occurred or that no system software image is available, use the BootWare menu to download the system software image and reboot the switch. The switch loads the system software image.
3. If the problem persists, contact H3C Support.
Operating power module failure
Symptom
An operating power module fails.
Troubleshooting flowchart
Figure 2 Troubleshooting operating power module failure
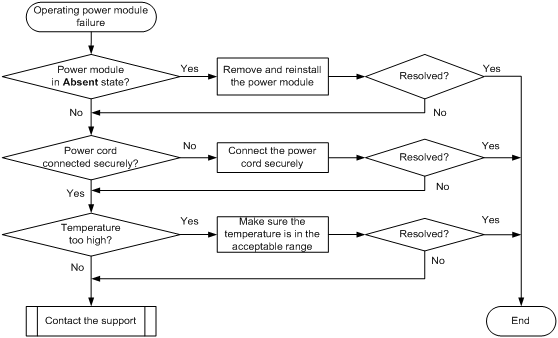
Solution
To resolve the problem:
1. Identify the operating state of the power module.
<Sysname> display power
Slot 2:
PowerID State Mode Current(A) Voltage(V) Power(W)
1 Normal AC -- -- --
2 Absent -- -- -- --
If the power module is in Absent state, go to step 2. If the power module is in Fault state, go to step 3.
2. Remove and reinstall the power module to make sure the power module is installed securely. Then, execute the display power command to verify that the power module has changed to Normal state. If the power module remains in Absent state, replace the power module.
3. When the power module is in Fault state, perform the following tasks:
a. Verify that the power module is connected to the power source securely. If it has been disconnected from the power source (The switch is being powered up with another power module.), connect the power source to it.
b. Verify that the power module surface is clean. Dust buildup might cause high temperature. If dust is accumulated on the power module, remove the dust. Then remove and reinstall the power module. Execute the display power command to verify that the power module has changed to Normal state. If the power module remains in Fault state, go to step c.
c. Install the power module into an empty power module slot. Then execute the display power command to verify that the power module has changed to Normal state in the new slot. If the power module remains in Fault state, replace the power module.
4. If the problem persists, contact H3C Support.
Newly installed power module failure
Symptom
A newly installed power module fails.
Troubleshooting flowchart
Figure 3 Troubleshooting newly installed power module failure
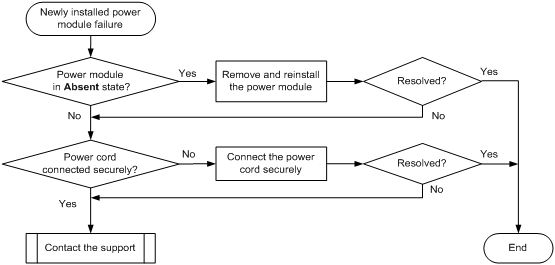
Solution
To resolve the problem:
1. Identify the operating state of the power module.
<Sysname> display power
Slot 1:
PowerID State Mode Current(A) Voltage(V) Power(W)
1 Normal AC -- -- --
2 Absent -- -- -- --
If the power module is in Absent state, go to step 2. If the power module is in Fault state, go to step 3.
2. When the power module is in Absent state, perform the follow tasks:
a. Remove and reinstall the power module to make sure the power module is installed securely. Then execute the display power command to verify that the power module has changed to Normal state. If the power module remains in Absent state, go to step b.
b. Remove and install the power module into an empty power module slot. Then execute the display power command to verify that the power module has changed to Normal state in the new slot. If the power module remains in Absent state, go to step 4.
3. Remove and install the power module into an idle power module slot. Then execute the display power command to verify that the power module has changed to Normal state in the new slot. If the power module remains in Fault state, go to step 4.
4. If the problem persists, contact H3C Support.
Fan tray failure
Symptom
An operating fan tray or a newly installed fan tray fails.
Troubleshooting flowchart
Figure 4 Troubleshooting fan tray failure
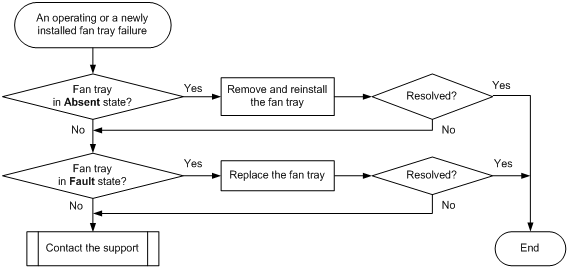
Solution
To resolve the problem:
1. Display fan tray information.
<Sysname> display fan
Slot 1:
Fan 1:
State : Normal
Airflow Direction: Port-to-power
Prefer Airflow Direction: Port-to-power
Fan 2:
State : Normal
Airflow Direction: Port-to-power
Prefer Airflow Direction: Port-to-power
¡ If the Airflow Direction value is different from the Prefer Airflow Direction value, replace the fan tray with one that has an airflow direction as required, or execute the fan prefer-direction command to configure the preferred airflow direction as required.
¡ If the fan tray is in Absent state, go to step 2.
¡ If the fan tray is in Fault state, go to step 3.
2. Remove and reinstall the fan tray to make sure the fan tray is installed securely. Then execute the display fan command to verify that the fan tray has changed to Normal state. If the fan tray remains in Absent state, replace the fan tray.
3. If the fan tray is in Fault state, perform the following tasks:
a. Execute the display environment command to display temperature information. If the temperature continues to rise, put your hand at the air outlet vents to feel if air is being expelled out of the air outlet.
b. If no air is being expelled out of the air outlet vents, remove and reinstall the fan tray. Then execute the display fan command to verify that the fan tray has changed to Normal state. If the fan tray remains in Fault state, replace the fan tray.
You must make sure the switch operating temperature is below 60°C (140°F) while you replace the fan tray. If a new fan tray is not readily available, power off the switch to avoid damage caused by high temperature.
4. If the problem persists, contact H3C Support.
Related commands
This section lists the commands that you might use for troubleshooting the hardware.
|
Command |
Description |
|
display environment |
Displays temperature information. |
|
display fan |
Displays the operating states of the fan tray. |
|
display logbuffer |
Displays the state of the log buffer and the log information in the log buffer. |
Troubleshooting ACL
This section provides troubleshooting information for common problems with ACLs.
ACL application failure with an error message
Symptom
The system fails to apply a packet filter or an ACL-based QoS policy to the hardware. It also displays the "Reason: Not enough hardware resource" message.
Troubleshooting flowchart
Figure 5 Troubleshooting an ACL application failure
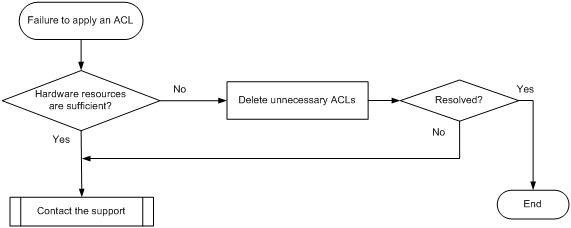
Solution
To resolve the problem:
1. Execute the display qos-acl resource command, and then check the Remaining field for ACL resources insufficiency.
If this field displays 0, the ACL hardware resources are exhausted.
2. To free hardware resources, delete unnecessary ACLs.
3. If the problem persists, contact H3C Support.
ACL application failure without an error message
Symptom
The system applies a packet filter or an ACL-based QoS policy to the hardware. However, the ACL does not take effect.
Troubleshooting flowchart
Figure 6 Troubleshooting an ACL application failure
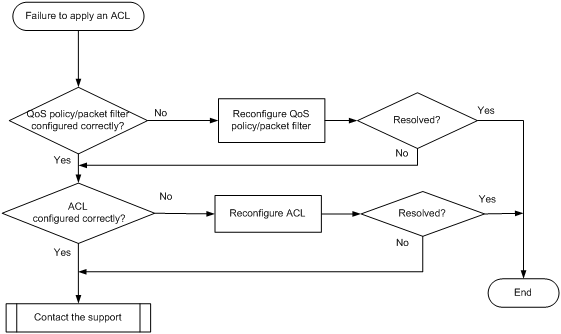
Solution
Choose a solution depending on the module that uses the ACL.
ACL used in a QoS policy
To resolve the problem when the ACL is used in a QoS policy:
1. Verify that the QoS policy is configured correctly:
a. Use one of the following commands to check the QoS policy for configuration errors, depending on the policy application destination:
|
Destination |
Command |
|
Interface |
display qos policy interface |
|
VLAN |
display qos vlan-policy |
|
Global |
display qos policy global |
b. If the QoS policy contains a class-behavior association, execute the display traffic classifier user-defined command and the display traffic behavior user-defined command to check for traffic class and behavior configuration errors, respectively.
- If they are configured incorrectly, reconfigure them.
- If they are configured correctly, go to step 2.
2. Verify that the ACL is configured correctly.
Execute the display acl command to check whether the ACL is configured correctly.
¡ If the ACL is configured incorrectly, reconfigure it.
¡ If the ACL is configured correctly, go to step 3.
3. If the problem persists, contact H3C Support.
ACL used in a packet filter
To resolve the problem when the ACL is used in a packet filter:
1. Verify that the packet filter is configured correctly.
Execute the display packet-filter command to check whether the packet filter is configured correctly.
¡ If there are any configuration errors, reconfigure the packet filter.
¡ If there is no configuration error, go to step 2.
2. Verify that the ACL is configured correctly.
Execute the display acl command to check whether the ACL is configured correctly.
¡ If the ACL is configured incorrectly, reconfigure it.
¡ If the ACL is configured correctly, go to step 3.
3. If the problem persists, contact H3C Support.
Packet loss or forwarding failure
Symptom
The network experiences packet loss or packet forwarding failure. You can use ACLs to count traffic statistics to determine the location of the fault.
Troubleshooting flowchart
Figure 7 Troubleshooting a forwarding failure
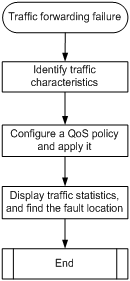
Solution
To resolve the problem:
1. Identify the characteristics of the packets that are not forwarded correctly.
Use a packet capture tool to identify the characteristics of the traffic, such as the IP address, MAC address, or VLAN. Make sure the characteristics are unique among traffic to be forwarded.
2. Configure a QoS policy and apply it to interfaces:
Figure 8 Traffic path

a. Configure a QoS policy according to the traffic characteristics. This example uses destination IP address 2.2.2.2.
<Sysname> system-view
System View: return to User View with Ctrl+Z.
[Sysname] time-range t1 from 12:00 11/11/2013 to 12:01 11/11/2013
[Sysname] acl number 3000 name geliACL
[Sysname-acl-adv-3000-geliACL] rule 0 permit ip destination 2.2.2.2 0 time-range t1
[Sysname-acl-adv-3000-geliACL] quit
[Sysname] traffic classifier count
[Sysname-classifier-count] if-match acl 3000
[Sysname-classifier-count] quit
[Sysname] traffic behavior count
[Sysname-behavior-count] accounting packet
[Sysname-behavior-count] quit
[Sysname] qos policy count
[Sysname-qospolicy-count] classifier count behavior count
b. Apply the QoS policy to interfaces on devices along the forwarding path. In this example, apply the QoS policy to the incoming traffic on GigabitEthernet 1/0/1 on Device B and GigabitEthernet 2/0/1 on Device C.
The following shows the application on Device B:
[Sysname-qospolicy-count] quit
[Sysname] interface gigabitethernet 1/0/1
[Sysname-GigabitEthernet1/0/1] qos apply policy count inbound
3. After the time range, execute the display qos policy interface command to display traffic statistics on the interfaces:
¡ On GigabitEthernet 1/0/1 of Device B:
[Sysname-GigabitEthernet1/0/1] display qos policy interface gigabitethernet 1/0/1
Interface: GigabitEthernet1/0/1
Direction: Inbound
Direction: Inbound
Policy: count
Classifier: count
Operator: AND
Rule(s) : If-match ACL 3000
Behavior: count
Accounting Enable:
251 (Packets)
The output shows that a total of 251 packets match ACL 3000.
¡ On GigabitEthernet 2/0/1 of Device C:
[Sysname-GigabitEthernet2/0/1] display qos policy interface gigabitethernet 2/0/1
Interface:GigabitEthernet2/0/1
Direction: Inbound
Direction: Inbound
Policy: count
Classifier: count
Operator: AND
Rule(s) : If-match ACL 3000
Behavior: count
Accounting Enable:
50 (Packets)
The output shows that a total of 50 packets match ACL 3000.
4. Compare the traffic statistics on the two interfaces. Packet loss or forwarding fault exists between Device B and Device C.
Related commands
This section lists the commands that you might use for troubleshooting ACLs.
|
Command |
Description |
|
display acl |
Displays configuration and match statistics for ACLs. |
|
display diagnostic-information |
Displays operating statistics for multiple feature modules in the system. |
|
display packet-filter |
Displays whether an ACL has been successfully applied to an interface for packet filtering. |
|
display qos-acl resource |
Displays QoS and ACL resource usage. |
|
display qos policy global |
Displays information about global QoS policies. |
|
display qos policy interface |
Displays information about the QoS policies applied to an interface or to all interfaces. |
|
display qos policy user-defined |
Displays user-defined QoS policies. |
|
display qos vlan-policy |
Displays information about QoS policies applied to VLANs. |
|
display traffic classifier user-defined |
Displays traffic class configuration. |
|
display traffic behavior user-defined |
Displays traffic behavior configuration. |
Troubleshooting IRF
This section provides troubleshooting information for common problems with IRF.
IRF fabric establishment failure
Symptom
An IRF fabric cannot be established.
Troubleshooting flowchart
Figure 9 Troubleshooting IRF fabric establishment failure

Solution
To resolve the problem:
1. Verify that the number of member devices does not exceed 9.
If you are adding a new member device to an existing IRF fabric or merging IRF fabrics, use the display irf command to identify the number of member devices in the IRF fabrics. If the total number of member devices exceeds the upper limit, the IRF setup will fail.
2. Verify that the member ID of each member device is unique:
a. Execute the display irf command to view the member ID of each member device.
b. Assign a unique member ID to each member.
- If you are adding a new member device to an existing IRF fabric, assign the member device a member ID that is not being used in the IRF fabric.
- If you are merging IRF fabrics, make sure each member device in these IRF fabrics has a unique member ID.
3. Verify that the IRF port bindings and physical IRF link connections are correct:
|
|
IMPORTANT: When you connect two neighboring IRF members, you must connect the physical ports of IRF-port 1 on one member to the physical ports of IRF-port 2 on the other. |
a. Execute the display irf configuration command on each member device, and check the IRF-Port1 and IRF-Port2 fields for IRF port bindings.
b. Verify that the physical IRF connections are consistent with the IRF port bindings.
c. If there are binding errors or connection inconsistencies, reconfigure the IRF port bindings or reconnect the physical IRF ports.
4. Verify that the IRF links are 10 Gbps or 40 Gbps.
Verify that the IRF physical interfaces are 10GBase-T Ethernet ports, SPF+ ports, or QSFP+ ports.
¡ If the IRF physical interfaces are 10GBase-T Ethernet ports, verify that 6A or higher-class twisted pairs are used for IRF connection.
¡ If the IRF physical interfaces are SPF+ ports, verify that the transceiver modules or cables for IRF connection have the 10Gbps or SFP+ label. If fiber cables are used for IRF connection, verify that the peer transceiver modules are the same model and the fiber cables are connected correctly.
¡ If the IRF physical interfaces are QSFP+ ports, verify that the transceiver modules or cables for IRF connection have the 40Gbps or QSFP+ label. If fiber cables are used for IRF connection, verify that the peer transceiver modules are the same model and the fiber cables are connected correctly. QSFP+ to SFP+ cables cannot be used for IRF connection.
5. Verify that all IRF links are up:
a. Execute the display irf topology command, and then check the Link field.
- If the Link field for each IRF port does not display DOWN, go to step 6.
- If the Link field for an IRF port displays DOWN, go to step b.
b. Execute the display irf link command, and then check the Status field of the physical ports bound to the IRF port.
- If the field displays DOWN or ADM (administratively down) for all the physical ports, remove the link failures or use the undo shutdown command to bring up the administratively down ports.
- If the field displays UP for at least one of the physical ports, go to step c.
c. Save the configuration, and then execute the irf-port-configuration active command in system view to activate the IRF port configuration.
|
|
IMPORTANT: Activating IRF port configuration requires a reboot. To prevent configuration loss, you must save the configuration before you execute the irf-port-configuration active command. |
6. Verify that all member devices use the same software version:
a. Execute the display version command to identify the software version of each member device.
b. Upgrade the software of all member devices to the same version.
|
|
NOTE: Typically, the irf auto-update enable command can automatically synchronize a member device with the software version of the master device. However, the synchronization might fail when the gap between the software versions is too large. For more information, see the release notes. |
7. If the problem persists, contact H3C Support.
Related commands
This section lists the commands that you might use for troubleshooting IRF.
|
Command |
Description |
|
display interface |
Displays interface information. Use this command to verify that each IRF port has at least one physical port in up state. |
|
display irf |
Displays IRF fabric information, including the member ID, role, priority, bridge MAC address, and description of each IRF member. |
|
display irf configuration |
Displays basic IRF settings, including the current member ID, new member ID, and physical ports bound to the IRF ports on each IRF member device. The new member IDs take effect at reboot. |
|
display irf topology |
Displays the IRF fabric topology, including the member IDs, IRF port state, and adjacencies of IRF ports. |
|
display version |
Displays system version information. |
|
irf-port-configuration active |
Activates IRF configuration on IRF ports. |
|
undo shutdown |
Brings up an Ethernet interface or subinterface. |
Troubleshooting Ethernet link aggregation
This section provides troubleshooting information for common problems with Ethernet link aggregation.
Link aggregation failure
Symptom
Some member ports fail to be placed in Selected state, and link aggregation does not operate correctly.
Troubleshooting flowchart
Figure 10 Troubleshooting link aggregation failure
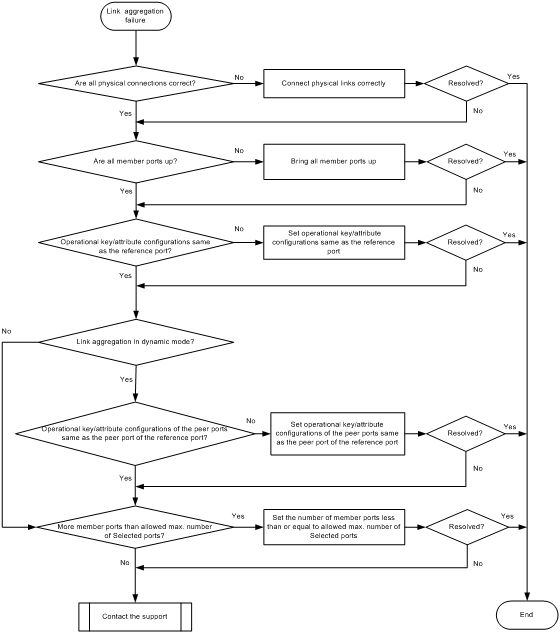
Solution
To resolve the problem:
1. Verify that all physical connections are correct.
You can verify the physical connections against your network plan.
2. Verify that all member ports are up:
a. Execute the display interface command to display the status of the member ports.
b. If the member ports are down, follow the solution in "Troubleshooting ports" to troubleshoot the problem.
3. Verify that the member ports have the same operational key and attribute configurations as the reference port:
a. Execute the display link-aggregation verbose command to display the Selected state of the member ports.
b. Execute the display current-configuration interface command to display the configurations of the aggregate interface and the Unselected ports.
c. Configure the Unselected ports to make sure they have the same operational key and attribute configurations as the reference port.
4. Identify the aggregation mode of the aggregation group.
¡ If the aggregation mode is static, proceed to step 6.
¡ If the aggregation mode is dynamic, proceed to step 5.
5. Verify that the peer member ports have the same operational key and attribute configurations as the peer port of the reference port:
a. Execute the display current-configuration interface command on the peer device to display the configurations of the peer member ports.
b. Configure the peer member ports to make sure the peer ports have the same operational key and attribute configurations as the peer port of the reference port.
6. Verify that the number of member ports in the aggregation group does not exceed the configured maximum number of Selected ports.
a. Execute the link-aggregation selected-port maximum command to set the maximum number of Selected ports allowed in the aggregation group. The value range is 1 to 16.
b. Execute the display link-aggregation verbose command to verify that the number of member ports does not exceed the configured maximum number of Selected ports.
If the number of member ports exceeds the maximum number of Selected ports, the ports with higher port numbers are in Unselected state.
c. Use the undo port link-aggregation group command to remove undesired member ports from the aggregation group.
This makes sure all member ports you assign to the aggregation group can become Selected ports.
7. If the problem persists, contact H3C Support.
Related commands
This section lists the commands that you might use for troubleshooting Ethernet link aggregation.
|
Commands |
Description |
|
display current-configuration interface |
Displays interface configuration. |
|
display interface |
Displays Ethernet interface information. |
|
display link-aggregation verbose |
Display detailed information about the aggregation groups that correspond to the existing aggregate interfaces. |
|
link-aggregation selected-port maximum |
Configure the maximum number of Selected ports allowed in an aggregation group. |
Troubleshooting ports
This section provides troubleshooting information for common port problems.
Fiber port remains in down state
Symptom
A fiber port (SFP port, SFP+ port, or QSFP+ port) remains in down state.
Troubleshooting flowchart
Figure 11 Troubleshooting fiber port's failure to come up
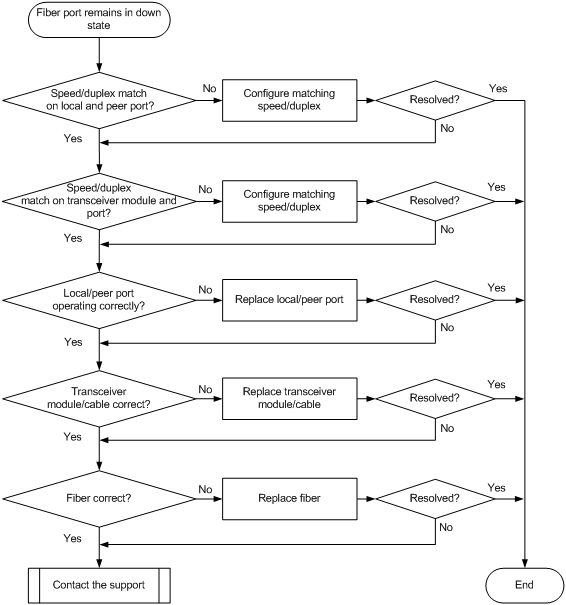
Solution
To resolve the problem:
1. Verify that the speed and duplex mode of the local port match the speed and duplex mode of the peer port:
a. Execute the display interface brief command to examine whether the speed and duplex mode of the port match the speed and duplex mode of the peer port.
b. If they do not match, use the speed command and the duplex command to set the rate and duplex mode for the port.
2. Verify that the speed and duplex mode of the local port match the speed and duplex mode of the transceiver module:
a. Execute the display interface brief command to examine whether the speed and duplex mode of the port match the speed and duplex mode of the transceiver module.
b. If they do not match, use the speed command and the duplex command to set the rate and duplex mode for the port.
3. Verify that the ports at both ends are operating correctly:
a. For a GE SFP port, use an SFP transceiver module and a fiber to connect it to another SFP port on the local end. For a 10-GE SFP+ fiber port, use an SFP+ cable (used for short-haul connection) to directly connect it to another 10-GE SFP+ fiber port on the local end. For a 40-GE QSFP+ port, use a QSFP+ cable (used for short-haul connection) to directly connect it to another 40-GE QSFP+ port on the local end.
b. Identify whether the port comes up:
- If the port comes up, the peer port fails. Replace the peer port with a new port operating correctly.
- If the port remains in down state, the local port fails. Replace the local port with a new port operating correctly.
4. Verify that the transceiver module and cable are operating correctly:
a. Use the display transceiver alarm interface command to display the alarms present on the transceiver module:
- The device displays None if no error occurs.
- The device displays alarms if the transceiver module fails or the type of the transceiver module does not match the port type.
b. Use an optical power meter to verify that the Tx power and Rx power of the transceiver module are stable and are within the correct range.
c. Execute the display transceiver interface command to verify that the wavelength and transmission distance of the local transceiver module are consistent with the wavelength and transmission distance of the peer transceiver module.
d. If the transceiver module is not operating correctly, replace it with a H3C transceiver module that matches the fiber port.
For more information about transceiver modules and cables, see the installation guide.
|
|
NOTE: When you use a QSFP+ to SFP+ cable to connect a 40-GE QSFP+ fiber port, you must use an optical attenuator because the Tx optical power of the QSFP+ transceiver module exceeds the upper Rx optical power limit of the SFP+ transceiver module. |
5. Verify that the fiber matches the transceiver module. If they do not match, replace the fiber with a new one that matches the transceiver module.
For more information about fibers, see the installation guide.
6. If the problem persists, contact H3C Support, and provide the following information:
<Sysname> display diagnostic-information
Save or display diagnostic information (Y=save, N=display)? [Y/N]:Y
Copper port remains in down state
Symptom
A 10/100/1000Base-T GE copper port or 1/10GBase-T 10-GE copper port remains in down state.
Troubleshooting flowchart
Figure 12 Troubleshooting copper port's failure to come up
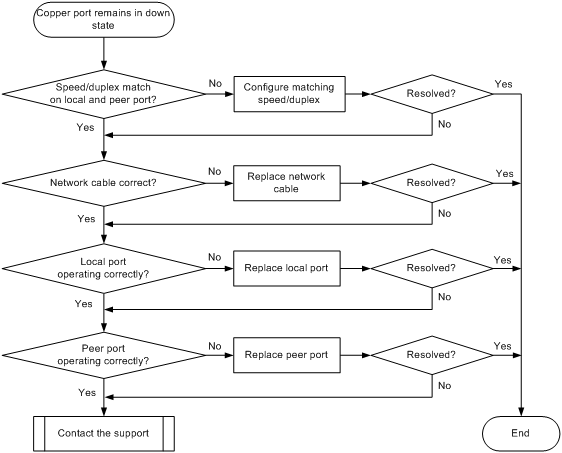
Solution
To resolve the problem:
1. Verify that the speed and duplex mode of the local port match the speed and duplex mode of the peer port:
a. Execute the display interface brief command to examine whether the speed and duplex mode of the port match the speed and duplex mode of the peer port.
b. If they do not match, use the speed command and the duplex command to set the rate and duplex mode for the port.
2. Replace the network cable with a new one to verify that the network cable is in good condition.
3. Replace the local port with a new one to verify that the local port is operating correctly.
4. Replace the peer port with a new one to verify that the peer port is operating correctly.
5. If the problem persists, contact H3C Support.
Non-H3C transceiver module
Symptom
The output from the display logbuffer command shows that the transceiver module is not an H3C transceiver module.
<Sysname> display logbuffer
Ten-GigabitEthernet1/0/25: This transceiver is NOT sold by H3C. H3C therefore shall NOT guarantee the normal function of the device or assume the maintenance responsibility thereof!
Troubleshooting flowchart
Figure 13 Troubleshooting non-H3C transceiver module
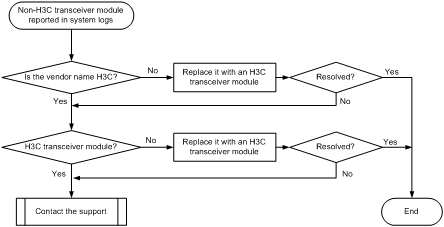
Solution
To resolve the problem:
1. Execute the display transceiver interface command to view the vendor name of the transceiver module.
[Sysname] display transceiver interface ten-gigabitethernet 1/0/51
Ten-GigabitEthernet1/0/51 transceiver information:
Transceiver Type : 10G_BASE_SR4_SFP
Connector Type : MPO
Wavelength(nm) : 850
Transfer Distance(m) : 100(OM3),150(OM4)
Digital Diagnostic Monitoring : YES
Vendor Name : H3C
2. Perform either of the following tasks:
¡ If the vendor name field does not display H3C, replace the transceiver module with an H3C transceiver module.
¡ If the vendor name field displays H3C, execute the display hardware internal transceiver register interface command in probe view. Provide the transceiver module information to H3C Support to verify that the transceiver module is an H3C transceiver module. If it is not an H3C transceiver module, replace it with an H3C transceiver module.
[Sysname-probe]display hardware internal transceiver register interface Ten-GigabitEthernet 2/0/25 device a0 address 0 le 128
Ten-GigabitEthernet2/0/25 transceiver device a0 register information:
0000: 03 04 07 00 00 00 02 00
0008: 00 00 00 03 0d 00 64 00
0010: 00 00 00 00 48 69 73 65
0018: 6e 73 65 20 20 20 20 20
0020: 20 20 20 20 00 00 00 00
0028: 4c 54 44 31 35 33 31 2d
0030: 42 43 2b 2d 48 33 43 20
0038: 57 20 20 20 06 0e 00 d4
0040: 00 1a 14 14 5a 57 35 30
0048: 39 43 30 30 30 30 38 20
0050: 20 20 20 20 30 39 31 32
0058: 30 31 20 20 68 b0 01 f2
0060: 48 33 43 00 00 00 00 00
0068: 00 00 00 00 00 00 00 00
0070: 00 00 00 00 00 06 0e 05
0078: 00 00 00 9e 00 89 00 fe
3. If the problem persists, contact H3C Support.
Transceiver module does not support digital diagnosis
Symptom
The output from the display transceiver diagnosis interface command shows that the transceiver module does not support the digital diagnosis function.
<Sysname> display transceiver diagnosis interface ten-gigabitethernet 1/0/51
The transceiver does not support this function.
Troubleshooting flowchart
Figure 14 Troubleshooting digital diagnosis failure on a transceiver module
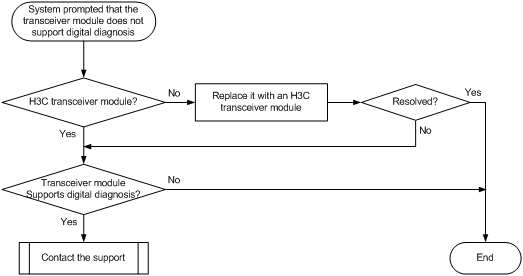
Solution
To resolve the problem:
1. Verify that the transceiver module is an H3C transceiver module:
Execute the display transceiver interface command to view the vendor name of the transceiver module.
¡ If the vendor name field does not display H3C, replace the transceiver module with an H3C transceiver module.
¡ If the vendor name field displays H3C, execute the display hardware internal transceiver register interface command in probe view. Provide the transceiver module information to H3C Support to verify that the transceiver module is an H3C transceiver module. If it is not, replace it with an H3C transceiver module.
2. Execute the display transceiver interface command to save the transceiver module information, and contact H3C Support to verify that the transceiver module supports the digital diagnosis function.
<Sysname> display transceiver interface ten-gigabitethernet 1/0/51
Ten-GigabitEthernet1/0/51 transceiver information:
Transceiver Type : 10G_BASE_SR4_SFP
Connector Type : MPO
Wavelength(nm) : 850
Transfer Distance(m) : 100(OM3),150(OM4)
Digital Diagnostic Monitoring : YES
Vendor Name : H3C
3. If the problem persists, execute the display diagnostic-information command to save the diagnostic information, and contact H3C Support.
<Sysname> display diagnostic-information
Save or display diagnostic information (Y=save, N=display)? [Y/N]:Y
Error frames (for example, CRC errors) on a port
Symptom
The output from the display interface command shows that error frames exist (for example, CRC error frames) on a port.
Troubleshooting flowchart
Figure 15 Troubleshooting error frames (for example, CRC errors) on a port
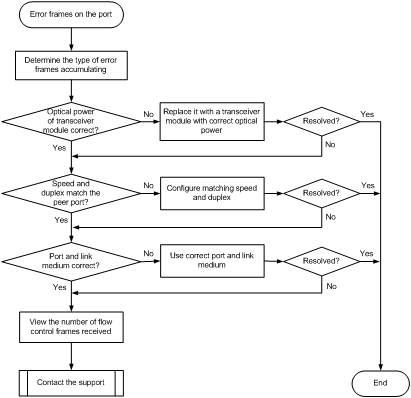
Solution
To resolve the problem:
1. Examine the error frame statistics and identify the error frame type:
a. (Optional.) Use the reset counter interface command in user view to clear the packet statistics of the port.
This command resets the values of each statistical field to 0, so that you can view the statistics changes more clearly.
b. Use the display interface command to display the incoming packet statistics and outgoing packet statistics of the port.
c. Determine the type of error frames that are accumulating.
2. If the port is a fiber port, verify that the optical power of the transceiver module is operating correctly:
a. Use the display transceiver diagnosis interface command to view the present measured values of the digital diagnosis parameters for the transceiver module.
[Sysname] display transceiver diagnosis interface ten-gigabitethernet 1/0/51
Ten-GigabitEthernet1/0/51 transceiver diagnostic information:
Current diagnostic parameters:
[module] Temp.(°C)
1stTX 2ndTX 1stRX 2ndRX
N/A N/A N/A N/A
Voltage(V)
3.3VTX 12VTX 3.3VRX 12VRX
3.29 N/A 3.40 N/A
[channel] TX Bias(mA) RX power(dBm) TX power(dBm)
1 6.09 0.91 -0.77
2 5.95 1.09 -0.16
3 6.05 1.58 -0.17
4 5.85 1.58 -0.14
5 6.07 2.23 -0.30
6 5.72 2.85 -0.47
7 6.11 3.01 -0.08
8 5.50 1.17 -0.02
Alarm thresholds:
[module] Temp.(°C) Voltage(V) Bias(mA) RX power(dBM) TX power(dBM)
High 0 3.63 10.00 1.58 5.44
Low 0 2.97 0.50 3.13 -11.61
b. If the optical power of the transceiver module is not within the correct range, replace the transceiver module with a transceiver module of the same model that is operating correctly.
3. Verify that the port configurations are correct:
a. Execute the display interface brief command.
b. Determine whether the speed and duplex mode of the port match the speed and duplex mode of the peer port.
c. If they do not match, use the speed command and the duplex command to set the speed and duplex mode for the port.
4. Verify that the port and the link medium are operating correctly:
a. Plug the link medium into another port that is operating correctly, and determine whether the same problem occurs.
b. If the problem still occurs, verify that the following items are operating correctly:
- Intermediate links and devices, including optical-to-electrical converters, cable terminal racks, and transmission devices.
- Transmission medium, including network cables, optical fibers, and transceiver modules.
c. Examine the port:
- If the port is a copper port, directly connect the port to a PC.
- If the port is a fiber port, replace the transceiver module plugged into the port.
5. Determine whether the port has received a large amount of flow control frames:
a. Use the display interface command to view the number of pause frames.
If the number of pause frames is accumulating, you can determine that the port has sent or received a large amount of flow control frames.
b. Verify that the incoming traffic and outgoing traffic have not exceeded the maximum traffic processing capability of the local device and the peer device.
6. If you determine that the configurations, the peer port, and the link are correct but the problem persists, perform the following tasks:
a. Use the display diagnostic-information command to collect the diagnostic information.
b. Contact H3C Support.
<Sysname> display diagnostic-information
Save or display diagnostic information (Y=save, N=display)? [Y/N]:Y
Failure to receive packets
Symptom
A port is up, but it cannot receive packets.
Troubleshooting flowchart
Figure 16 Troubleshooting the failure to receive packets
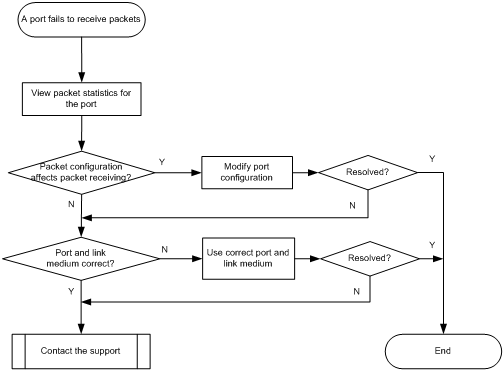
Solution
To resolve the problem:
1. Examine the packet statistics of the port:
a. (Optional.) Use the reset counter interface command to clear the packet statistics of the port.
This command resets the values of each statistical field to 0, so that you can view the statistics changes more clearly.
b. Determine whether the ports at both ends are always up, and use the display interface command to determine whether the number of incoming packets is accumulating. At the same time, examine the outgoing packet statistics of the peer port.
c. View the values of the error packet fields and determine whether the number of error packets is accumulating.
2. Verify that the port configurations do not affect packet receiving:
a. Use the display interface brief command to verify that the port configurations are correct.
The port configurations include the duplex mode, speed, port type, and VLAN configurations of the ports at both ends of the link.
b. If configuration errors exist, modify the port configurations. If the number of incoming packets in the output from the display interface command is accumulating, you can determine that the port can receive packets.
c. If the port fails to receive packets, use the shutdown command and then the undo shutdown command to re-enable the port. If the number of incoming packets in the output from the display interface command is accumulating, you can determine that the port can receive packets.
d. If the port is configured with STP, use the display stp brief command to verify that the port is not in the discarding state.
e. If a port is set to the discarding state by STP, examine and modify the STP-related configurations to resolve the problem.
H3C recommends that you configure the port as an edge port or disable STP on the port if it is directly connected to a terminal.
f. If the port is assigned to an aggregation group, use the display link-aggregation summary command to verify that the status of the port is Selected.
g. If the status of the port is Unselected, the port cannot send or receive data packets.
h. Determine the reasons why the port becomes Unselected, for example, the attribute configurations of the port are different from the reference port. Modify the attribute configurations of the port to make the port become Selected.
3. Verify that the port and the link medium are operating correctly:
a. Plug the link medium into another port that is operating correctly, and determine whether the same problem occurs.
b. If the problem still occurs, verify that the following items are operating correctly:
- Intermediate links and devices, including optical-to-electrical converters, cable terminal racks, and transmission devices.
- Transmission medium, including network cables, optical fibers, and transceiver modules.
c. Examine the port.
- If the port is a copper port, directly connect the port to a PC.
- If the port is a fiber port, replace the transceiver module plugged into the port.
4. If you determine that the configurations, the peer port, and the link are correct but the problem persists, perform the following tasks:
a. Use the display diagnostic-information command to collect the diagnostic information.
b. Contact H3C Support.
<Sysname> display diagnostic-information
Save or display diagnostic information (Y=save, N=display)? [Y/N]:Y
Failure to send packets
Symptom
A port is up, but it cannot send packets.
Troubleshooting flowchart
Figure 17 Troubleshooting the failure to send packets
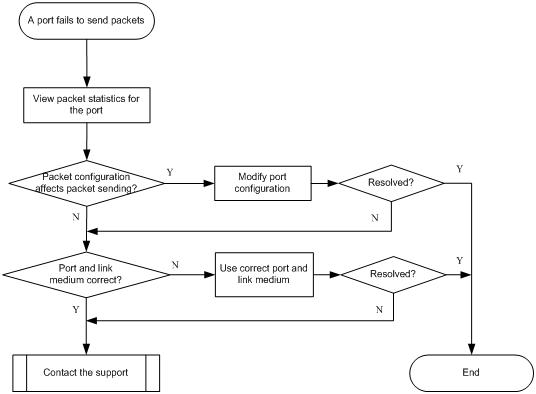
Solution
To resolve the problem:
1. Examine the packet statistics of the port:
a. (Optional.) Use the reset counter interface command to clear the packet statistics of the port.
This command resets the values of each statistical field to 0, so that you can view the statistics changes more clearly.
b. Determine whether the ports at both ends are always up, and use the display interface command to determine whether the number of outgoing packets is accumulating.
c. Determine whether the number of error packets is accumulating.
2. Verify that the port configurations do not affect packet sending:
a. Use the display interface brief command to verify that the port configurations are correct.
The port configurations include the duplex mode, speed, port type, and VLAN configurations of the ports at both ends of the link.
b. If configuration errors exist, modify the port configurations. If the number of outgoing packets in the output from the display interface command is accumulating, you can determine that the port can send packets.
c. If the port fails to send packets, use the shutdown command and then the undo shutdown command to re-enable the port. If the number of outgoing packets in the output from the display interface command is accumulating, you can determine that the port can send packets.
d. If the port is configured with STP, use the display stp brief command to verify that the port is not in the discarding state.
e. If a port is set to the discarding state by STP, examine and modify the STP-related configurations to resolve the problem.
H3C recommends that you configure the port as an edge port or disable STP on the port if it is directly connected to a terminal.
f. If the port is assigned to an aggregation group, use the display link-aggregation summary command to verify that the status of the port is Selected.
g. If the status of the port is Unselected, the port cannot send or receive data packets.
h. Determine the reasons why the port becomes Unselected, for example, the attribute configurations of the port are different from the reference port. Modify the attribute configurations of the port to make the port become Selected.
3. Verify that the port and the link medium are correct:
a. Plug the link medium into another port that is operating correctly, and determine whether the same problem occurs.
b. If the problem still occurs, verify that the following items are operating correctly:
- Intermediate links and devices, including optical-to-electrical converters, cable terminal racks, and transmission devices.
- Transmission medium, including network cables, optical fibers, and transceiver modules.
c. Examine the port.
- If the port is a copper port, directly connect the port to a PC.
- If the port is a fiber port, replace the transceiver module plugged into the port.
4. If you determine that the configurations, the peer port, and the link are correct but the problem persists, perform the following tasks:
a. Use the display diagnostic-information command to collect the diagnostic information.
b. Contact H3C Support.
<Sysname> display diagnostic-information
Save or display diagnostic information (Y=save, N=display)? [Y/N]:Y
Related commands
This section lists the commands that you might use for troubleshooting ports.
|
Command |
Description |
|
display diagnostic-information |
Displays or saves running status data for multiple feature modules. |
|
display interface |
Displays Ethernet interface information. |
|
display interface brief |
Displays brief interface information. |
|
display link-aggregation summary |
Displays the summary information for all aggregation groups. |
|
display logbuffer |
Displays the state of the log buffer and the log information in the log buffer. |
|
display stp brief |
Displays brief spanning tree status and statistics. |
|
display transceiver alarm interface |
Displays the current transceiver module alarms. |
|
display transceiver diagnosis |
Displays the present measured values of the digital diagnosis parameters for transceiver modules. |
|
display transceiver interface |
Displays the key parameters of transceiver modules. |
Troubleshooting system management
This section provides troubleshooting information for common system management problems.
High CPU utilization
Symptom
The display cpu-usage command shows that the CPU utilization of the device is continuously higher than 80%.
Troubleshooting flowchart
Figure 18 Troubleshooting high CPU utilization
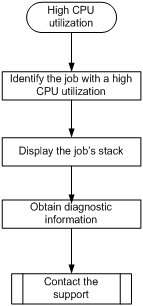
Solution
To resolve the problem:
1. Execute the display cpu-usage command multiple times to display CPU usage information. (Details not shown.)
2. Identify the job with a high CPU utilization.
<Sysname> display process cpu
CPU utilization in 5 secs: 5.8%; 1 min: 7.9%; 5 mins: 7.8%
JID 5Sec 1Min 5Min Name
1 0.0% 0.0% 0.0% scmd
2 0.0% 0.0% 0.0% [kthreadd]
3 0.0% 0.0% 0.0% [migration/0]
4 0.0% 0.0% 0.0% [ksoftirqd/0]
5 0.0% 0.0% 0.0% [watchdog/0]
6 0.0% 0.0% 0.0% [migration/1]
7 0.0% 0.0% 0.0% [ksoftirqd/1]
8 0.0% 0.0% 0.0% [watchdog/1]
9 0.0% 0.0% 0.0% [events/0]
10 0.0% 0.0% 0.0% [events/1]
11 0.0% 0.0% 0.0% [khelper]
12 0.0% 0.0% 0.0% [kblockd/0]
13 0.0% 0.0% 0.0% [kblockd/1]
14 0.0% 0.0% 0.0% [khubd]
15 0.0% 0.0% 0.0% [kseriod]
16 0.0% 0.0% 0.0% [vzmond]
17 0.0% 0.0% 0.0% [pdflush]
18 0.0% 0.0% 0.0% [pdflush]
19 0.0% 0.0% 0.0% [kswapd0]
20 0.0% 0.0% 0.0% [aio/0]
21 0.0% 0.0% 0.0% [aio/1]
……
The output shows the average CPU usage values of jobs during the last 5-second, 1-minute, and 5-minute intervals. Typically, the average CPU usage of a job is approximately 5%.
3. Display the job's stack.
The following example was created for job 14 in probe view.
<Sysname> system-view
[Sysname] probe
[Sysname-probe] follow job 14
Attaching to process 14 ([khubd])
Iteration 1 of 5
------------------------------
Kernel stack:
[<c01d54a8>] hub_thread+0x88c/0xa64
[<c006ce28>] kthread+0xfc/0x12c
[<c00588d0>] do_exit+0x0/0x818
[<ffffffff>] 0xffffffff
Iteration 2 of 5
------------------------------
Kernel stack:
[<c01d54a8>] hub_thread+0x88c/0xa64
[<c006ce28>] kthread+0xfc/0x12c
[<c00588d0>] do_exit+0x0/0x818
[<ffffffff>] 0xffffffff
Iteration 3 of 5
------------------------------
Kernel stack:
[<c01d54a8>] hub_thread+0x88c/0xa64
[<c006ce28>] kthread+0xfc/0x12c
[<c00588d0>] do_exit+0x0/0x818
[<ffffffff>] 0xffffffff
Iteration 4 of 5
------------------------------
Kernel stack:
[<c01d54a8>] hub_thread+0x88c/0xa64
[<c006ce28>] kthread+0xfc/0x12c
[<c00588d0>] do_exit+0x0/0x818
[<ffffffff>] 0xffffffff
Iteration 5 of 5
------------------------------
Kernel stack:
[<c01d54a8>] hub_thread+0x88c/0xa64
[<c006ce28>] kthread+0xfc/0x12c
[<c00588d0>] do_exit+0x0/0x818
[<ffffffff>] 0xffffffff
[Sysname-probe]
4. Use the display diagnostic-information command to collect diagnostic information.
5. Save the information displayed in the previous steps.
6. Contact H3C Support.
High memory utilization
Symptom
The display memory command shows that the memory utilization of the device is higher than 60% during a period of time (typically 30 minutes).
Troubleshooting flowchart
Figure 19 Troubleshooting high memory utilization
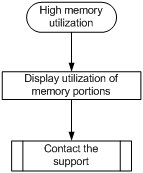
Solution
To resolve the problem:
1. Execute the display system internal kernel memory pool command multiple times to identify the memory portions that show an unexceptionally utilization increase.
<Sysname> system-view
[Sysname] probe
[Sysname-probe] display system internal kernel memory pool slot 1
Active Number Size Align Slab Pg/Slab ASlabs NSlabs Name
0 0 80 0 32 1 0 0 ARP_MFFACL_Cachep
0 0 120 0 24 1 0 0 LFIB_IlmEntryCache2
0 0 216 0 15 1 0 0 mfib_source_route_cache
28 28 524240 0 1 128 28 28 kmalloc-524240
2 12 256 0 12 1 1 1 sgpool-16
48 51 32 0 51 1 1 1 SYNC_Chn_Object
0 0 64 0 36 1 0 0 LFIB_FTNSTAT_MplsBasCache
0 0 40 0 46 1 0 0 LFIB_IlmEntryCache0
0 0 680 0 22 4 0 0 LFIB_IlmEntryCache16
0 0 144 8 21 1 0 0 kiocb
137 150 2048 8 15 8 10 10 kmalloc-2048
0 0 72 0 34 1 0 0 LFIB_IlmHash_cache14
0 0 208 0 16 1 0 0 L2VFIB_Ntf_Cache
0 0 4232 0 7 8 0 0 FVN_FwdCache30
282 306 912 32 17 4 18 18 task_struct
0 0 1080 0 14 4 0 0 IPCIM_ENTRY_EXT_cachep
0 0 40 0 46 1 0 0 mfib_nbma_if_cache
0 0 476 0 15 2 0 0 LFIB_NhlfeEntryCache16
0 0 1080 0 14 4 0 0 LFIB_IlmEntryCache26
0 0 32 0 51 1 0 0 L2VFIB_Ac_Srv_Cache
3 18 392 4 18 2 1 1 tcpinp
0 0 2296 0 13 8 0 0 MFW_FsCache14
---- More ----
Each value line shows the memory information for a memory portion. The product of the Number and Size fields shows the capacity of the memory portion. If the capacity of a memory portion continually increases, the memory portion is being continually used. To determine whether there is a problem with the memory portion, you must observe the capacity change and change speed of a memory portion for a period of time. The memory leak process might be slow and you might need to spend a long time (even weeks) observing the leak symptom.
2. Save the information displayed in the previous step and contact H3C Support.
|
|
IMPORTANT: For quick troubleshooting, do not reboot the device before you contact H3C Support. The previous step only identifies the memory portions that have problems. Further information is required to locate the code section that has problems. |
Related commands
This section lists the commands that you might use for troubleshooting system management.
|
Command |
Description |
|
display cpu-usage |
Displays the current CPU usage statistics. |
|
display memory |
Displays memory usage statistics. |
|
display process cpu |
Displays the CPU usage statistics for jobs. |
|
display system internal kernel memory pool |
Displays memory block usage statistics. |
|
follow job job-id |
Displays the stack of a job. |
Troubleshooting other problems
Layer 2 forwarding failure
Symptom
Layer 2 packet loss occurs when the switch forwards packets to a peer on the same network segment and in the same VLAN.
Troubleshooting flowchart
Figure 20 Troubleshooting Layer 2 packet loss failure
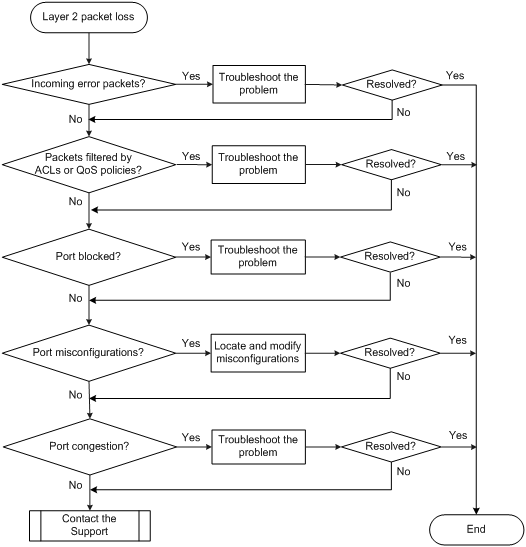
Solution
To resolve the problem:
1. Verify that no error packets have been received on the local port:
Execute the display interface command and check for error packets.
[Sysname-probe]display interface GigabitEthernet 1/0/17
GigabitEthernet1/0/17
Current state: UP
Line protocol state: UP
IP Packet Frame Type: PKTFMT_ETHNT_2, Hardware Address: 00e0-fc00-5139
Description: GigabitEthernet1/0/17 Interface
Bandwidth: 100000kbps
Loopback is not set
Media type is twisted pair
Port hardware type is 1000_BASE_T
100Mbps-speed mode, full-duplex mode
Link speed type is autonegotiation, link duplex type is autonegotiation
Flow-control is not enabled
The Maximum Frame Length is 10000
Allow jumbo frame to pass
Broadcast MAX-ratio: 100%
Multicast MAX-ratio: 100%
Unicast MAX-ratio: 100%
PVID: 1
Mdi type: automdix
Port link-type: access
Tagged Vlan: none
UnTagged Vlan: 1
Port priority: 0
Last link flapping: 0 hours 0 minutes 6 seconds
Last clearing of counters: Never
Peak value of input: 3 bytes/sec, at 2013-01-01 01:59:12
Peak value of output: 0 bytes/sec, at 2013-01-01 00:01:24
Last 300 seconds input: 0 packets/sec 3 bytes/sec 0%
Last 300 seconds output: 0 packets/sec 0 bytes/sec 0%
Input (total): 17 packets, 2344 bytes
0 unicasts, 4 broadcasts, 13 multicasts, 0 pauses
Input (normal): 17 packets, - bytes
0 unicasts, 4 broadcasts, 13 multicasts, 0 pauses
Input: 0 input errors, 0 runts, 0 giants, 0 throttles
0 CRC, 0 frame, - overruns, 0 aborts
- ignored, - parity errors
Output (total): 0 packets, 0 bytes
0 unicasts, 0 broadcasts, 0 multicasts, 0 pauses
Output (normal): 0 packets, - bytes
0 unicasts, 0 broadcasts, 0 multicasts, 0 pauses
Output: 0 output errors, - underruns, - buffer failures
0 aborts, 0 deferred, 0 collisions, 0 late collisions
0 lost carrier, - no carrier
a. If the statistics are not zero, the following problems might have occurred:
- Inconsistent configuration—Verify that the local and peer ports have the same configuration (including speed and duplex mode). If they are not the same, modify the configuration of the local port.
- Interface hardware failure—To test such a failure, connect the cable that is connected to the local port to a correctly operating port (for example, Port A) with the same configurations as the local port. If Port A forwards traffic correctly, you can determine that the hardware of the local port fails. In this event, you must replace the local port with a correctly operating port.
- Transceiver module, fiber, or twisted pair failure—To test and resolve such a failure, replace the transceiver module, fiber, or twisted pair with a good one.
b. If the problem persists, contact H3C Support.
When you contact H3C Support, provide the following diagnostic information if packet loss occurs on the chip port with which the interface is associated:
2. Verify that packets are not mistakenly filtered out by ACLs:
a. Examine the ACL and QoS policy configurations for packet filtering on the port, on the VLAN of the port, or globally. If packets are mistakenly filtered out, modify the ACL or QoS policy configuration.
- To display the ACL configuration on the port for packet filtering, execute the display packet-filter command.
- To display the QoS policy configuration on the port, execute the display qos policy command.
- To display the QoS policy configuration on the VLAN of the port, execute the display qos vlan-policy command.
- To display the global QoS policy configuration, execute the display qos policy global command.
b. Verify that packets are not filtered out by ACLs automatically created by some features.
- Execute the display this command in Ethernet interface view to verify that the ip source binding or ip verify source command is configured on the port. To display source guard binding entries, execute the display ip source binding or display ipv6 source binding command. If IP source guard is configured but the packets match no entry, further troubleshoot the problem based on the way the binding entries are created.
- Determine whether the port is configured with the portal authentication. If portal authentication is configured, packets of users that fail to pass the portal authentication will be dropped by the port. Use the display portal interface command to display the portal configuration information of the specified VLAN interface. Determine whether the portal authentication can be disabled based on the network conditions. To disable the portal authentication at Layer 3, use the undo portal server server-name command in VLAN interface view of the VLAN to which the port belongs.
- Use the display dot1x command to check whether 802.1X EAD assistant is enabled on the interface.
If 802.1X EAD assistant is enabled on the interface, packets will be discarded for unauthenticated users who access the network segments other than the Free IP.
- Determine whether MFF is configured on the VLAN to which the port belongs. Use the display mac-forced-forwarding vlan command to display the MFF information of the specified VLAN. If no gateway information is displayed in the output, verify that ARP snooping is correctly configured based on the MFF operation mode.
3. Verify that the port is not blocked:
¡ Execute the display stp brief command to verify that STP does not set the state of the port to discarding. When the port is in discarding state, it cannot forward traffic. H3C recommends disabling STP on the port, or configuring the port as an edge port if the port is connected to a terminal device.
¡ If the port belongs to an aggregation group, execute the display link-aggregation verbose command to identify the port status. When the port is an Unselected port, it cannot forward traffic. Locate the reasons why the port is in Unselected state. For example, the attribute configurations of the port are different from the configurations of the reference port.
¡ Identify whether the port is blocked by smart link. Use the display smart-link group command to view the port status. If the state of the port is STANDBY or DOWN, the port cannot forward traffic.
- If the state of the port is DOWN, locate the reason for the port to be down. The possible reasons include: its uplink device is configured with monitor link, the link of the port fails, or the port is shut down. Further troubleshoot the problem based on the reason for the port to be down.
- If the state of the port is STANDBY, perform an active/standby switchover in the smart link group.
4. Examine the following configurations that might cause packet loss:
¡ VLAN configuration—Execute the display this command in Ethernet interface view to verify that the port is in the VLAN of the packets. If it is not, add the port to the VLAN.
¡ Blackhole MAC address entries—Execute the display mac-address blackhole command to display blackhole MAC address entries. If the packets are discarded because they match a blackhole MAC address entry, delete the entry. To delete the blackhole MAC address entry, execute the undo mac-address blackhole mac-address vlan vlan-id command.
¡ Rate limit—Execute the display qos lr interface command to display the rate limit configuration on the port. If rate limit is configured on the port, make sure the committed information rate (CIR) and the committed burst size (CBS) are appropriate. To adjust the CIR and CBS values, execute the qos lr { inbound | outbound } cir committed-information-rate [ cbs committed-burst-size ] command.
¡ Storm suppression—Execute the display this command in Ethernet interface view to display the configuration of storm suppression. Storm suppression includes broadcast suppression, multicast suppression, and unknown unicast suppression. To adjust the suppression thresholds, execute the broadcast-suppression, multicast-suppression, and unicast-suppression commands, respectively.
5. Verify that no congestion occurs by using the display qos queue-statistics interface command.
If congestion occurs, locate and resolve the problem by referencing related congestion management documents.
6. If the problem persists, contact H3C Support.
Related commands
This section lists the commands that you might use for troubleshooting Layer 2 packet loss failure.
|
Command |
Description |
|
display interface |
Displays Ethernet interface information. |
|
display dot1x |
Displays information about 802.1X. |
|
display packet-filter |
Displays whether an ACL has been successfully applied to an interface for packet filtering. |
|
display qos policy |
Displays user-defined QoS policy configuration information. |
|
display qos policy interface |
Displays information about the QoS policies applied to an interface or all interfaces. |
|
display qos vlan-policy |
Displays information about QoS policies applied to VLANs. |
|
display qos policy global |
Displays information about global QoS policies. |
|
display this |
Displays the running configuration in the current view. |
|
display ip source binding/display ipv6 source binding |
Displays source guard binding entries. |
|
display portal interface |
Displays portal configuration and portal running state on an interface. |
|
display dot1x |
Displays information about 802.1X. |
|
display link-aggregation verbose |
Displays detailed information about the aggregation groups that correspond to the aggregate interfaces. |
|
display smart-link group |
Displays information about the specified or all smart link groups. |
|
display mac-address blackhole |
Displays blackhole MAC address entries. |
|
display qos lr interface |
Displays the rate limit configuration and statistics on a specified interface or all the interfaces. |
|
display qos queue-statistics interface |
Displays traffic statistics collected for an interface on a per-queue basis. |
Layer 3 forwarding failure
Symptom
Packet loss occurs when the switch forwards packets to a different network.
Troubleshooting flowchart
Figure 21 Troubleshooting Layer 3 forwarding failure
Solution
To resolve the problem:
1. Verify that the port is not faulty (due to hardware or configuration problems).
If the port is faulty, follow the solution in "Layer 2 forwarding failure" to troubleshoot the problem.
2. Verify that the ARP entries are correct:
a. Execute the display arp command to verify that the ARP entries are correct.
If the switch has not learned the APR entries or incorrect ARP entries exist, execute the debugging arp packet command to locate the problem.,For the APR entries that are still not learned, execute the arp static command to configure static ARP entries.
b. Execute the display mac-address command to verify that the output interfaces in the MAC address entries and ARP entries are the same.
If the output interfaces are not the same, execute the reset command to clear the ARP entries. Then the switch can learn ARP entries again.
3. Verify that route entries are correct:
a. Execute the display ip routing-table command to verify that route entries are correct.
If incorrect route entries exist, troubleshoot the protocol that learns the route entries.
b. Execute the display fib command to verify that the output interfaces in the FIB entries and route entries are the same.
If the output interfaces are not the same, execute the reset command to clear the route entries. Then the switch can learn route entries again.
4. If the problem persists, contact H3C Support.
Related commands
This section lists the commands that you might use for troubleshooting Layer 3 forwarding failure.
|
Command |
Description |
|
debugging arp packet |
Enables ARP packet debugging. |
|
display arp |
Displays ARP entries. |
|
display ip routing-table |
Displays brief information about active routes in the routing table. |
|
display mac-address |
Display MAC address entries |
|
display fib |
Display FIB entries |
Protocol flapping
Symptom
The switch cannot send or receive protocol packets.
Troubleshooting flowchart
Figure 22 Troubleshooting protocol flapping
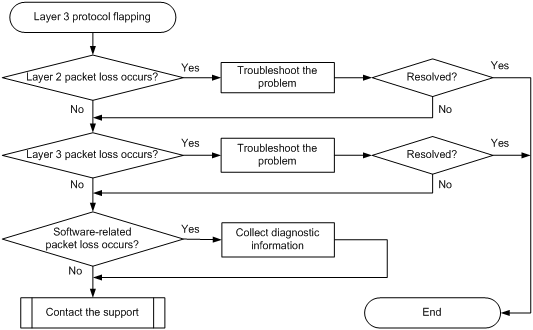
Solution
To resolve the problem:
1. Verify that Layer 2 is operating correctly, as described in "Layer 2 forwarding failure."
2. Verify that Layer 3 is operating correctly, as described in "Layer 3 forwarding failure."
Execute the debug rxtx softcar show 1 command in en_diag view to check for software-related packet loss.
[Sysname-probe] debug rxtx softcar show slot 1
ID Type RcvPps Rcv_All DisPkt_All Pps Dyn Swi Hash ACLmax
0 ROOT 0 0 0 200 S On SMAC 0
1 ISIS 0 0 0 200 D On SMAC 8
2 ESIS 0 0 0 100 S On SMAC 8
3 CLNP 0 0 0 100 S On SMAC 8
4 VRRP 0 0 0 1024 S On SMAC 8
5 UNKNOWN_IPV4MC 0 0 0 100 S On SMAC 8
6 UNKNOWN_IPV6MC 0 0 0 100 S On SMAC 8
7 IPV4_MC_RIP 0 0 0 150 D On SMAC 8
8 IPV4_BC_RIP 0 0 0 150 D On SMAC 8
9 MCAST_NTP 0 0 0 100 S On SMAC 8
10 BCAST_NTP 0 0 0 100 S On SMAC 8
11 IPV4_MC_OSPF_5 0 0 0 100 S On SMAC 8
12 IPV4_MC_OSPF_6 0 0 0 100 S On SMAC 8
13 IPV4_UC_OSPF 0 0 0 200 S On SMAC 8
14 IPV4_MC_PIM 0 0 0 100 S On SMAC 8
15 IPV4_UC_PIM 0 0 0 100 S On SMAC 8
16 IPV4_IGMP 0 0 0 100 S On SMAC 8
17 LDP 0 0 0 100 S On SMAC 8
18 IPV6_MC_PIM 0 0 0 100 S On SMAC 8
19 IPV6_UC_PIM 0 0 0 100 S On SMAC 8
20 IPV6_MLD 0 0 0 100 S On SMAC 8
21 IPV6_RIPNG 0 0 0 100 D On SMAC 8
……
3. If the problem persists, contact H3C Support.
When you contact H3C Support, provide diagnostic information if software-related packet loss occurred.
PoE failure
Symptom
PDs are not powered.
Troubleshooting flowchart
Figure 23 Flowchart for troubleshooting PoE failure
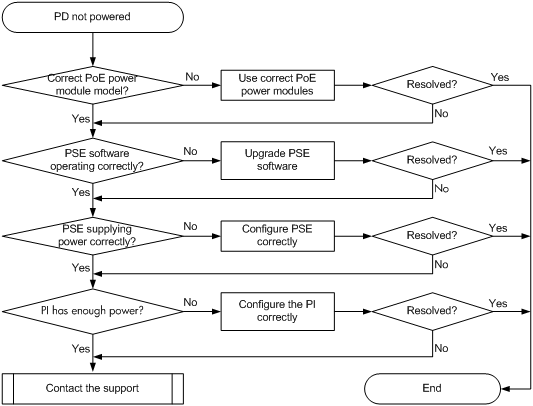
Solution
To resolve the problem:
1. Verify that the installed PoE power modules are supported. For information about PoE power module compatibility, see H3C S5560X-EI Switch Series Installation Guide.
2. Verify that the PSE is operating correctly:
a. Display general PSE information.
<Sysname> display poe device
Slot 1:
PSE ID SlotNo SubSNo PortNum MaxPower(W) State Model
4 1 0 24 370 faulty LSP8POED
b. If the operating status of the PSE is faulty, upgrade the PSE software.
<Sysname> system-view
[Sysname] poe update full ver_3_9_0_release.bin pse 4
This command will fully update firmware on the specific PSE(s), Continue? [Y/N]:y
System is downloading firmware into the hardware. Please wait ..................
Update firmware on the specific PSE(s) successfully!
c. Display general PSE information again. If the operating status is on or off, the PSE problem is resolved.
[Sysname] display poe device
Slot 1:
PSE ID SlotNo SubSNo PortNum MaxPower(W) State Model
4 1 0 24 370 off LSP8POED
3. Verify that the PSE is providing enough power and the PSE is enabled to detect nonstandard PDs.
a. Display detailed PSE information.
[Sysname] display poe pse
PSE ID : 4
Slot No. : 1
SSlot No. : 0
PSE Model : LSP8POEB
PSE Status : Enabled
Power Priority : Low
Current Power : 162.6 W
Average Power : 163.0 W
Peak Power : 163.0 W
Max Power : 180.0 W
Remaining Guaranteed Power : 180.0 W
PSE CPLD Version : -
PSE Software Version : 172
PSE Hardware Version : 0
Legacy PD Detection : Disabled
Power Utilization Threshold : 80
PD Power Policy : Disabled
PD Disconnect-Detection Mode : DC
b. If the current power, average power, and peak power of the PSE have reached or are near to the maximum power of the PSE, the PSE is running out of power. Use higher-power power modules to replace the currect power modules.
c. If the PSE Pd-policy Mode field displays disable, execute the poe legacy enable pse command to enable the PSE to detect nonstandard PDs. (Details not shown.)
4. Verify that each PI has enough power.
a. Display detailed PSE information.
[Sysname] display poe interface GigabitEthernet 1/0/2
PoE Status : Disabled
Power Priority : Low
Oper : Off
IEEE Class : 0
Detection Status : Disabled
Power Mode : Signal
Current Power : 0 mW
Average Power : 0 mW
Peak Power : 0 mW
Max Power : 30000 mW
Electric Current : 0 mA
Voltage : 56.2 V
PD Description :
b. If the current power, average power, and peak power of the PI have reached or are near to the maximum power of the PI, the PI does not have enough power. Use the poe max-power command to re-set the maximum PI power.
5. If the problem persists, contact H3C Support.
Related commands
This section lists the commands that you might use for troubleshooting PoE.
|
Command |
Description |
|
display poe device |
Displays general PSE information. |
|
display poe pse |
Displays detailed PSE information. |
|
display poe interface interface-type interfece-number |
Displays power supplying information for PIs. |
|
poe legacy enable pse |
Enables the PSE to detect nonstandard PDs. |
|
Sets the maximum PI power. |
