- Released At: 27-07-2021
- Page Views:
- Downloads:
- Table of Contents
- Related Documents
-
|
|
|
H3C SecCenter SMP |
|
Configuration Examples |
|
|
|
|
Document version: 5W100-20210723
Software version: E1704
Copyright © 2021 New H3C Technologies Co., Ltd. All rights reserved.
No part of this manual may be reproduced or transmitted in any form or by any means without prior written consent of New H3C Technologies Co., Ltd.
Except for the trademarks of New H3C Technologies Co., Ltd., any trademarks that may be mentioned in this document are the property of their respective owners.
The information in this document is subject to change without notice.
Contents
Security Management Platform configuration examples
Example: Configuring basic functions for SMP and device communication
Configuring SNMP and SOAP on devices
Enabling NETCONF over SOAP on a device
Configuring service logging on devices
Configuring threat logs (fast log output)
Example: Configuring security analytics
Displaying security event statistics by attack trend
Displaying security event statistics by event severity
Displaying security event statistics by destination port
Displaying security event statistics by event type
Displaying security event statistics by event protocol
Displaying security event statistics by source IP
Displaying security event statistics by destination IP
Displaying security event statistics by signature hit count
Example: Configuring report tasks
Example: Configuring device groups
Viewing device system information
Examples: Managing security services
About security policy management
Managing security policies for a single device
Managing security policies for multiple devices
About IPS allowlist management
Managing an IPS allowlist for a single device
Managing an IPS allowlist for multiple devices
Adding an IPS allowlist from the Vulnerability Attack Log page
Examples: Managing signature libraries
Updating a signature library manually
Synchronizing signature libraries to the SMP
Rolling back a signature library manually
Managing signature library files
Uploading a signature library file
Uploading a signature library file
Examples: Performing hierarchical management
Registering a subplatform with the parent platform
Viewing hierarchical management information.
Security Management Platform configuration examples
The following information provides the Security Management Platform (SMP) configuration examples.
Software Version Used
The configuration examples were created and verified on E1110P01.
Example: Configuring basic functions for SMP and device communication
Configuring SNMP and SOAP on devices
Introduction
SMP supports configuring SNMP and SOAP templates to obtain and monitor the states of the security devices on the network and deploy configuration to the devices. SNMP is used to obtain device CPU and memory information. NETCONF over SOAP is used to upgrade and roll back signature library versions for devices.
To use SMP to manage security devices on the network, you must enable SNMP and NETCONF over SOAP, and configure SMP as the log host on the devices.
Restrictions and guidelines
· The SNMP or SOAP template settings configured on SMP must be consistent with the SNMP or NETCONF over SOAP settings on the devices. Otherwise, SMP and the devices cannot exchange information successfully.
· This example uses SNMPv2c.
Enabling SNMP on a device
Whether Web configuration is supported depends on the device model.
The Web interface might vary with the device model and software version.
Enabling SNMP from the CLI
1. Execute the display current-configuration | include snmp command to identify whether SNMP has been configured. The following information indicates that SNMP has been configured:
<sysname> display current-configuration | include SNMP
SNMP-agent
SNMP-agent local-engineid 800063A280586AB108779500000001
SNMP-agent community write private
SNMP-agent community read public
SNMP-agent sys-info version v2c v3
2. If SNMP is not enabled, execute the following commands in sequence to enable SNMP:
a. Configure the SNMP version as v2c.
[Sysname] SNMP-agent sys-info version v2c
b. Configure the read community string as needed. The default is public.
[Sysname] SNMP-agent community read public
c. Configure the write community string as needed. The default is private.
[Sysname] SNMP-agent community write private
Enabling SNMP from the Web interface
1. On the top navigation bar, click System. From the left navigation tree, select Maintenance > SNMP.
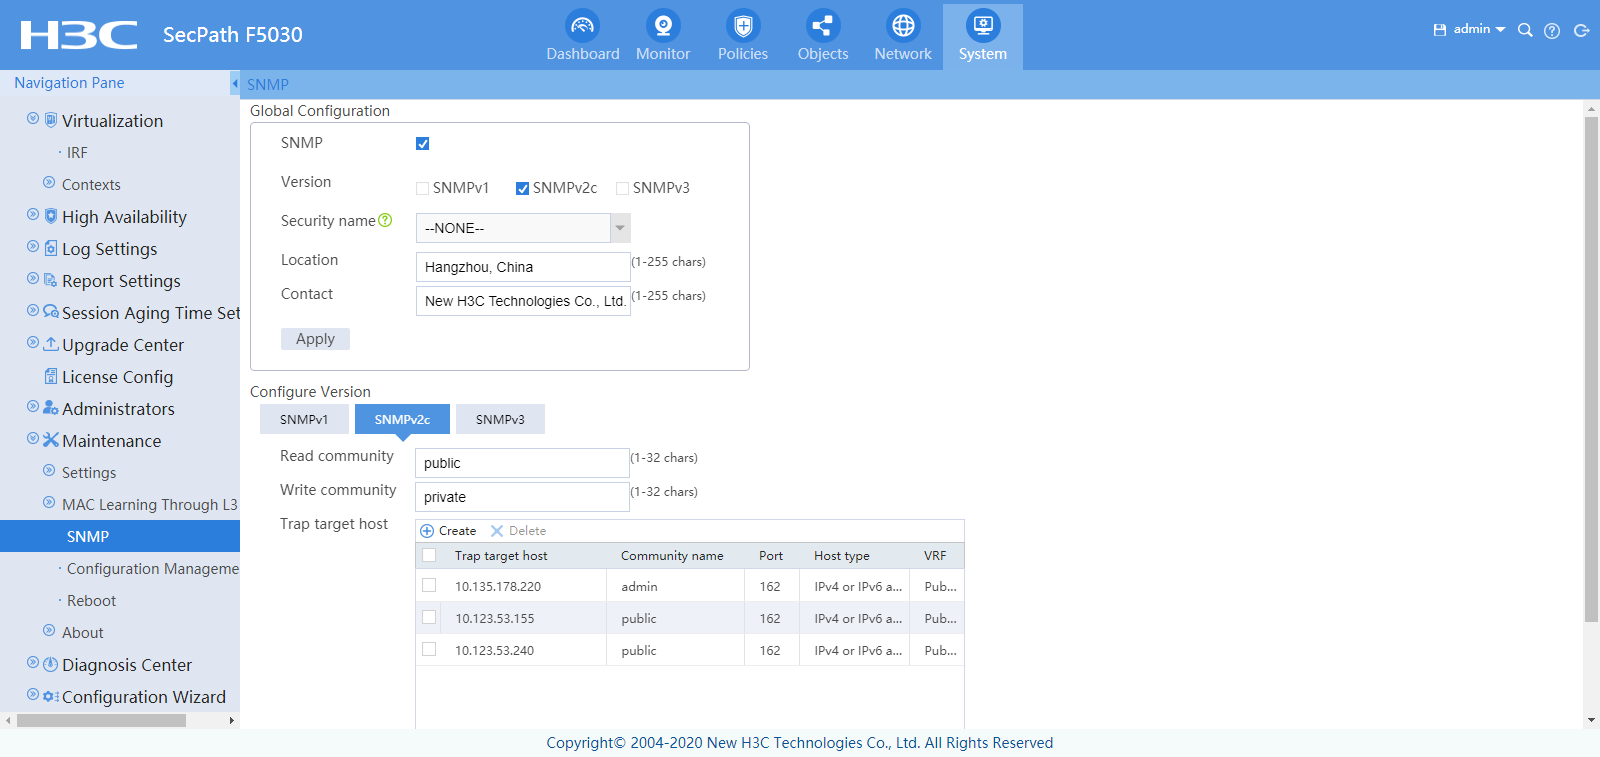
Configure the global parameters:
¡ SNMP: Select the check box to enable SNMP.
¡ Version: Select SNMPv2c.
¡ Trap packet source address: Use the default setting.
¡ Location: Use the default setting.
¡ Contact: Use the default setting.
2. Click Apply.
3. Configure the SNMP version parameters:
¡ Read community: Configure the read community string as needed. The default is public. Please configure the read community, write community, or both.
¡ Write community: Configure the write community string as needed. The default is private. Please configure the read community, write community, or both.
¡ Trap target host: Use the default setting.
4. Click Apply.
Enabling NETCONF over SOAP on a device
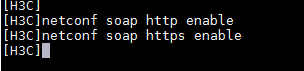
Enabling NETCONF over SOAP from the CLI
1. Execute the display current-configuration | include soap command to identify whether NETCONF over SOAP. The following output indicates that this function has been enabled:
<sysname> display current-configuration | include soap
netconf soap http enable
netconf soap https enable

2. If NETCONF over SOAP is not enabled, execute the following commands in sequence to enable it:
a. Enable HTTP-based NETCONF over SOAP.
[Sysname] netconf soap http enable
b. Enable HTTPS-based NETCONF over SOAP.
[Sysname] netconf soap https enable
Configuring service logging on devices
Introduction
For SMP to receive logs from devices, you must configure the following configurations on the devices:
· Configure the service module log output parameters.
· Configure SMP as the log host that receives the device logs.
Restrictions and guidelines
· If a service module supports fast output of logs, configure fast log output for the service as a best practice.
· Configure the log host IP address as the IP address of the SMP, and configure the port as 514 or 30514.
Configuring threat logs (fast log output)
Web interface configuration
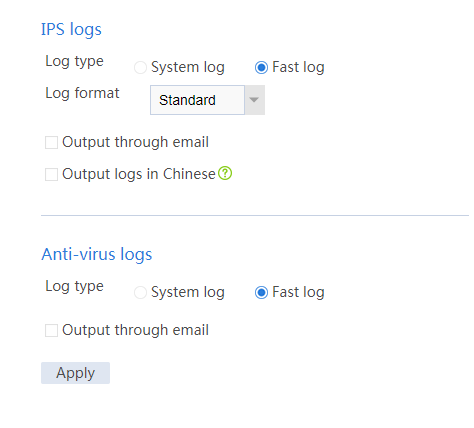
1. Configure log output:
Navigate to System > Log Settings > Threat Log Settings. Select Fast log for IPS logs and anti-virus logs. Click Apply.
Figure 1 Configuring threat logs
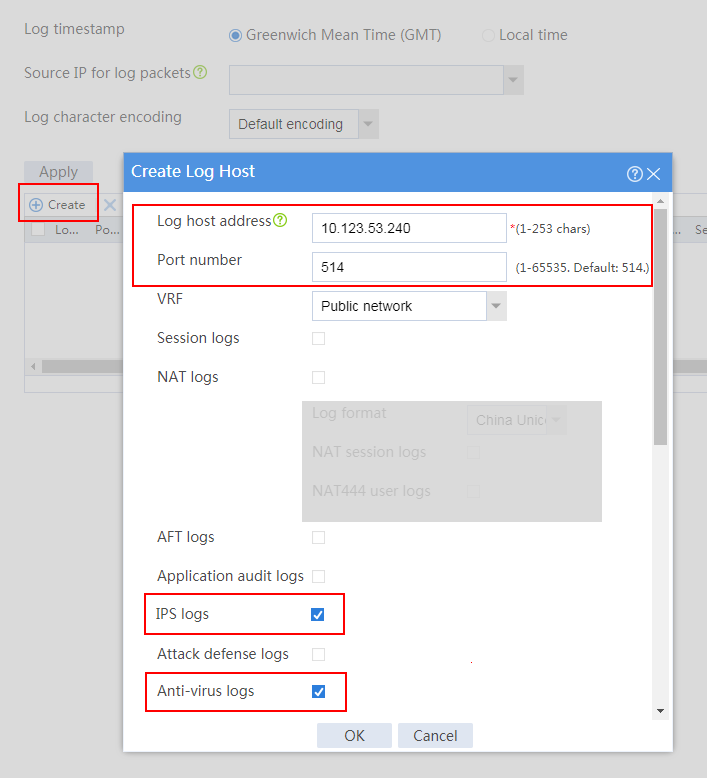
2. Configure the log host:
a. Navigate to System > Log Settings > Basic Settings.
b. Click the Fast Log Output tab. Click Create to add a lost host.
c. Configure the log host address as the address of SMP and the port number as 514. (Please specify the actual IP address and port number.)
d. Select the logs to be output.
e. Click OK.
Figure 2 Configuring the log host
CLI configuration
From the CLI of the device, execute the following commands (please specify the actual the log host parameters):
[Sysname] customlog format dpi anti-virus
[Sysname] customlog format dpi ips
[Sysname] customlog host 10.123.53.240 port 514 export dpi anti-virus ips
Configuring templates on SMP
Introduction
You can manage SNMP and SOAP templates for asset management and monitoring.
Adding an SNMP template
1. On the Monitored Assets page, click Manage Templates on top right of the page.
2. Click Add to add an SNMP template.
Figure 3 Adding an SNMP template
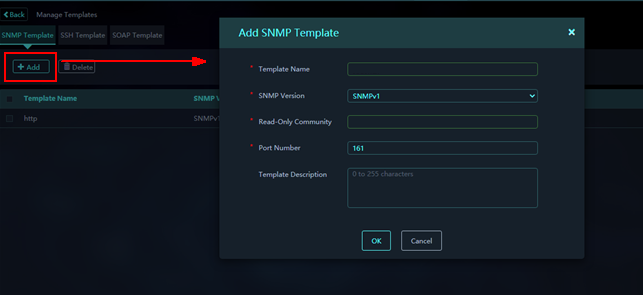
3. Configure the SNMP template as needed.
Parameters:
¡ Template Name: Name of the template.
¡ SNMP Version: Supported SNMP versions, including SNMPv1, SNMPv2, and SNMPv3.
¡ Read-Only Community: If configured, this value must be the same as that set on the device.
¡ Port Number: Port number on which SMP listens for SNMP packets. The default port number is 161.
¡ Template Description: Description for the template.
4. Click OK.
Adding an SSH template
1. On the Monitored Assets page, click Manage Templates on top right of the page.
2. Click Add to add an SSH template.
Figure 4 Adding an SSH template
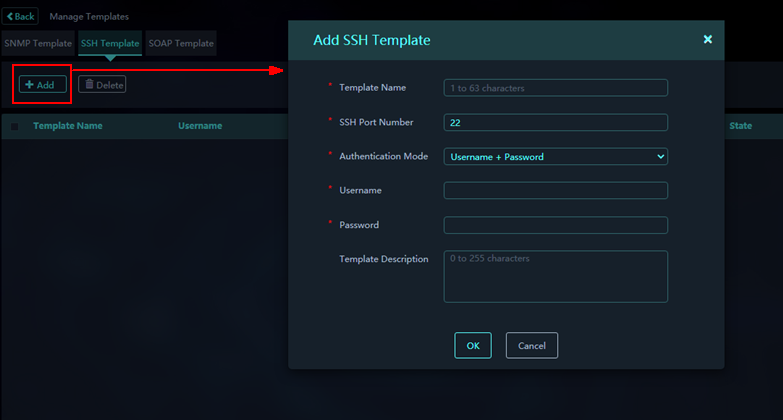
3. Configure the template as needed.
Parameters:
¡ Template Name: Name of the template.
¡ SSH Port Number: Port number used by SSH.
¡ Authentication Mode: Authentication mode for the SSH user. Only Username + Password is supported.
¡ Username: Username used to log in to the device through SSH.
¡ Password: Password used to log in to the device through SSH.
¡ Template Description: Description for the template.
4. Click OK.
Adding an SOAP template
1. On the Monitored Assets page, click Manage Templates on top right of the page.
2. Click the SOAP Templates tab, and then click Add to add an SOAP template.
Figure 5 Adding an SOAP template
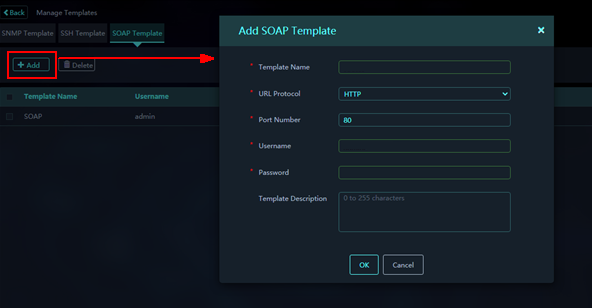
3. Configure the template as needed.
Parameters:
¡ Template Name: Name of the template.
¡ URL Protocol: Select HTTP or HTTPS to enable the HTTP- or HTTPS-based NETCONF over SOAP feature.
¡ Port Number: For HTTP-based NETCONF over SOAP, the port number is 80 by default. For HTTPS-based NETCONF over SOAP, this port number is 832.
¡ Username: Username used by SMP to log in to the device.
¡ Password: Password used by SMP to log in to the device.
¡ Template Description: Description for the template.
4. Click OK.
Example: Configuring security analytics
Introduction
This feature analyzes security events based on the vulnerability attack logs and virus attack logs reported from the devices managed by SMP and its subplatforms. You can display security event statistics by multiple criteria, including the attack trend, event severity, and event type.
Displaying security event statistics by attack trend
The attack trend analysis tab displays security event statistics by attack trend based on the logs reported to SMP and its subplatforms within the specified time span.
Click a number in the Total Events or Blocked Events column to open a details page for events.
Parameters:
· Time: End time of an analysis period. The security events occurred during the period are analyzed and counted to produce an analysis entry. For example, if the time span is last 24 hours, each analysis period is 15 minutes long.
· Total Events: Total number of attack events occurred during the current analysis period.
· Blocked Events: Number of events blocked during the current analysis period.
· Blocked Percentage (%): Percentage of blocked events to the total events during the current analysis period.
Displaying security event statistics by event severity
The event severity analysis tab displays security event statistics by event severity based on the logs reported to SMP and its subplatforms within the specified time span.
To display security event statistics by event severity:
1. On the top navigation bar, click Security Analysis.
2. On the Security Event
Analysis page, click the ![]() icon in the upper-right corner of the work pane.
icon in the upper-right corner of the work pane.
3. In the dialog box that opens, configure the analysis options and set the analysis object to Event Severity.
4. Click OK.
The security event statistics will be displayed by event severity on the Event Severity Analysis tab of the Security Event Analysis page.
5. Click a number in the Critical, High, Medium, or Low column to open a details page for events.
Parameters:
· Time: End time of an analysis period. The security events occurred during the period are analyzed and counted to produce an analysis entry. For example, if the time span is last 24 hours, each analysis period is 15 minutes long.
· Critical: Number of attack events with critical risks occurred during the current analysis period.
· High: Number of attack events with high risks occurred during the current analysis period.
· Medium: Number of attack events with medium risks occurred during the current analysis period.
· Low: Number of attack events with low risks occurred during the current analysis period.
Displaying security event statistics by destination port
The destination port analysis tab displays security event statistics by destination port based on the logs reported to SMP and its subplatforms within the specified time span.
To display security event statistics by destination port:
1. On the top navigation bar, click Security Analysis.
2. On the Security Event
Analysis page, click the ![]() icon in the upper-right corner of the work pane.
icon in the upper-right corner of the work pane.
3. In the dialog box that opens, configure the analysis options and set the analysis object to Destination Port.
4. Click OK.
The security event statistics will be displayed by destination port on the Destination Port Analysis tab of the Security Event Analysis page.
5. Click a number in the Destination Port
or Event Count column or click the ![]() icon in the Actions column for an entry
to open a details page for events.
icon in the Actions column for an entry
to open a details page for events.
Parameters:
· Destination Port: Destination port of attack events occurred within the specified time span.
· Event Count: Total number of attack events occurred on the destination port within the specified time span.
· Percentage (%): Percentage of the attack events on the destination port to the total number of attack events on all destination ports within the specified time span.
Displaying security event statistics by event type
The event type analysis tab displays security event statistics by event type based on the logs reported to SMP and its subplatforms within the specified time span.
To display security event statistics by event type:
1. On the top navigation bar, click Security Analysis.
2. On the Security Event
Analysis page, click the ![]() icon in the upper-right corner of the work pane.
icon in the upper-right corner of the work pane.
3. In the dialog box that opens, configure the analysis options and set the analysis object to Event Type.
4. Click OK.
The security event statistics will be displayed by event type on the Event Type Analysis tab of the Security Event Analysis page.
5. Click a type in the Event Type
column, click a number in the Event
Count column, or click the ![]() icon in the Actions column for an entry. Any of the operations opens
a details page for events.
icon in the Actions column for an entry. Any of the operations opens
a details page for events.
Parameters:
· Event Type: Type of attack events occurred within the specified time span.
· Event Count: Number of times that this type of events occurred within the specified time span.
· Percentage (%): Percentage of the number of occurrence times for this type of events to the total number of occurrence times for all events within the specified time span.
Displaying security event statistics by event protocol
The event protocol analysis tab displays security event statistics by event protocol based on the logs reported to SMP and its subplatforms within the specified time span.
To display security event statistics by event protocol:
1. On the top navigation bar, click Security Analysis.
2. On the Security Event
Analysis page, click the ![]() icon in the upper-right corner of the work pane.
icon in the upper-right corner of the work pane.
3. In the dialog box that opens, configure the analysis options and set the analysis object to Event Protocol.
4. Click OK.
The security event statistics will be displayed by event protocol on the Event Protocol Analysis tab of the Security Event Analysis page.
5. Click a protocol in the Event Protocol
column, click a number in the Event
Count column, or click the ![]() icon in the Actions column for an entry. Any of the operations opens
a details page for events.
icon in the Actions column for an entry. Any of the operations opens
a details page for events.
Parameters:
· Event Protocol: Protocol based on which attack events occurred within the specified time span.
· Event Count: Number of attack events based on the protocol within the specified time span.
· Percentage (%): Percentage of the attack events based on the protocol to the total number of attack events within the specified time span.
Displaying security event statistics by source IP
The source IP analysis tab displays security event statistics by source IP based on the logs reported to SMP and its subplatforms within the specified time span.
To display security event analysis by source IP:
1. On the top navigation bar, click Security Analysis.
2. On the Security Event
Analysis page, click the ![]() icon in the upper-right corner of the work pane.
icon in the upper-right corner of the work pane.
3. In the dialog box that opens, configure the analysis options and set the analysis object to Source IP.
4. Click OK.
The security event statistics will be displayed by source IP on the Source IP Analysis tab of the Security Event Analysis page.
5. Click an IP address in the Source IP
column, click a number in the Event
Count column, or click the ![]() icon in the Actions column for an entry. Any of the operations opens
a details page for events.
icon in the Actions column for an entry. Any of the operations opens
a details page for events.
Parameters:
· Source IP: Source IP address of attack events occurred within the specified time span.
· Event Count: Number of attack events sourced from the IP address within the specified time span.
· Percentage (%): Percentage of the attack events sourced from the IP address to the total number of attack events within the specified time span.
Displaying security event statistics by destination IP
The destination IP analysis tab displays security event statistics by destination IP based on the logs reported to SMP and its subplatforms within the specified time span.
To display security event statistics by destination IP:
1. On the top navigation bar, click Security Analysis.
2. On the Security Event
Analysis page, click the ![]() icon in the upper-right corner of the work pane.
icon in the upper-right corner of the work pane.
3. In the dialog box that opens, configure the analysis options and set the analysis object to Destination IP.
4. Click OK.
The security event statistics will be displayed by destination IP on the Destination IP Analysis tab of the Security Event Analysis page.
5. Click an IP address in the Destination IP
column, click a number in the Event
Count column, or click the ![]() icon in the Actions column for an entry. Any of the operations opens
a details page for events.
icon in the Actions column for an entry. Any of the operations opens
a details page for events.
Parameters:
· Destination IP: Destination IP address of attack events occurred within the specified time span.
· Events: Number of attack events destined for the IP address within the specified time span.
· Percentage (%): Percentage of the attack events destined for the IP address to the total number of attack events within the specified time span.
Displaying security event statistics by signature hit count
The signature hit count analysis tab displays security event statistics by signature hit count based on the vulnerability attack logs reported to SMP within the specified time span.
To display security event statistics by signature hit count:
1. On the top navigation bar, click Security Analysis.
2. On the Security Event
Analysis page, click the ![]() icon in the upper-right corner of the work pane.
icon in the upper-right corner of the work pane.
3. In the dialog box that opens, configure the analysis options and set the analysis object to Signature Hit Count.
4. Click OK.
The security event statistics will be displayed by signature hit count on the Signature Hit Count tab of the Security Event Analysis page.
5. Click a number in the Hit Count column
or click the ![]() icon in the Actions column for an entry
to open a details page for events.
icon in the Actions column for an entry
to open a details page for events.
Parameters:
· Attack ID: Attack ID in the vulnerability attack logs reported to SMP within the specified time span.
· Hit Count: Number of times the attack ID was hit within the specified time span.
· Hit Count Percentage (%): Percentage of the number of times that the attack ID was hit to the total number of times that all attack IDs were hit within the specified time span.
Example: Configuring report tasks
Introduction
Use this feature to generate report files on schedule or immediately. You can configure the report type, report task execution time, and report template as required when you configure a report task.
Procedure
1. On the top navigation bar, select Reports.
2. From the left navigation pane, select Reports > Report Tasks.
3. Click Add.
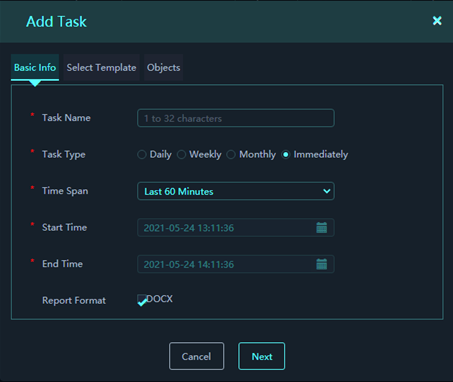
4. On the Basic Info tab, configure basic parameters as needed.
Basic info parameters:
¡ Task Name: Enter the name of the report task.
¡ Task Type: Select a task type, which can be daily, weekly, monthly, or immediately. The parameters vary by task type.
- If you select Daily, you need to specify the task execution time. For example, if the task execution time is 20:30:00, SMP will execute this task at 20:30:00 every day to collect security event statistics of last day. Then, SMP will generate a report file for the statistics.
- If you select Weekly, you need to specify the task execution time and the execution day. For example, if the task execution time is 20:30:00 and the task execution day is Monday, SMP will execute this task at 20:30:00 every Monday to collect statistics. The statistics include information about the security events occurred within last 7 days (not including the current day). The platform will generate a report file for the statistics.
- If you select Monthly, you need to specify the task execution time. For example, if the task execution time is 20:30:00, SMP will execute this task at 20:30:00 on the 1st day of each month to collect statistics. The statistics include information about the security events occurred within last month. The platform will generate a report file for the statistics.
- If you select Immediate, you need to specify the time span. Supported options include last 60 minutes, last 24 hours, last 7 days, last 30 days, and custom. The task will be executed immediately after you finish the task configuration. The platform will generate a statistics report file for the security events occurred within the specified time span.
¡ Report Format: Select a report file format. In the current software version, SMP supports only the .docx format.
Figure 6 Adding a report task (basic info)
5. Click Next.
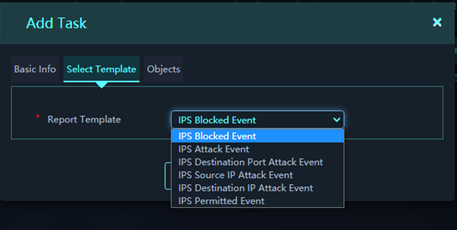
6. Select a report template as required. The platform will collect security event statistics and generate report files based on the selected report template.
Figure 7 Adding a report task (template selection)
7. Click Next.
8. Select statistical objects. The platform will collect security event statistics and generate report files based on the selected report template and statistical objects.
Figure 8 Adding a report task (statistical objects)
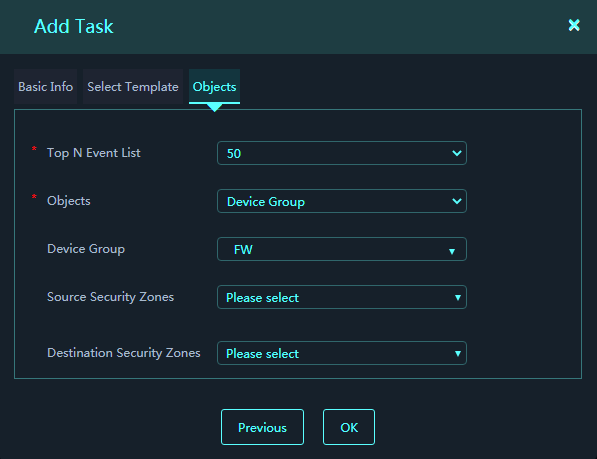
Parameters:
¡ Top N Event List: Specify the number of top events to be collected.
¡ Objects: Select objects from which to collect statistics. Only Device is supported.
¡ Device: Select devices.
¡ Source Security Zone: Collect statistics for security events sourced from the select security zones. This field is available after you select Device from the Objects field.
¡ Destination Security Zone: Collect statistics for security events destined for the select security zones. This field is available after you select Device from the Objects field.
9. Click OK.
10. On the Report Tasks page, view the state of the report task.
Figure 9 Viewing the state of the report task
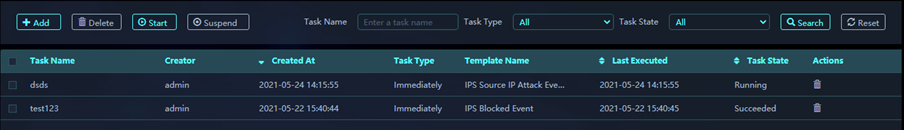
To delete a report task, click the Delete icon in the Actions column for that report task. To delete report tasks in bulk, select multiple report tasks in the report task list and click Delete.
To start or suspend report tasks in bulk, select multiple report tasks in the report task list and click Start or Suspend, respectively.
|
|
IMPORTANT: You can start or suspend only periodic report tasks. |
Example: Configuring areas
Introduction
Use this feature to divide the user network into areas, configure subareas for the areas, and assign assets and collectors to the areas and subareas. An area can contain a maximum of five layers of subareas. At the same layer, an area can contain multiple subareas. Assets in an area can communicate with SMP through the collectors in the area.
Procedure
Adding an area
1. On the top navigation bar, click O&M.
2. From the left navigation pane, select Areas.
3. Click Add.
Figure 10 Add Area page
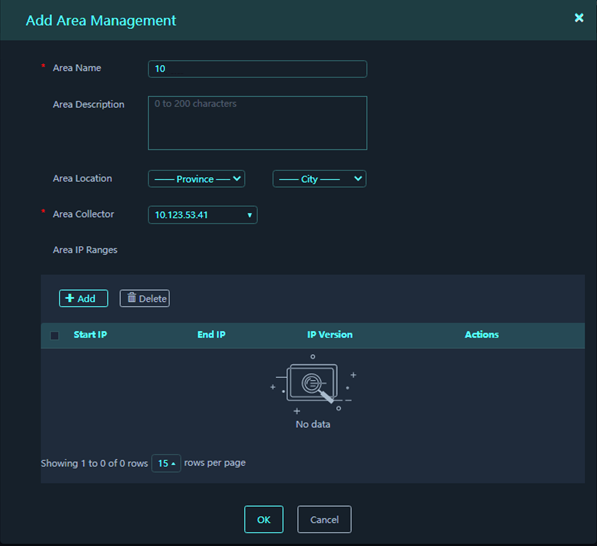
4. Configure parameters for the area, and then click OK.
Parameters:
¡ Area Name: Name of the area.
¡ Area Description: Description for the area.
¡ Area Location: Province and city information for the area.
¡ Area Collector: IP address of the collector deployed for the area. The platform exchanges information with assets through area collectors.
¡ Area IP Ranges: IP ranges contained in the area. Click Add to add an IP range.
- Start IP: Start IPv4 or IPv6 address of the IP range.
- End IP: End IPv4 or IPv6 address of the IP range. The end IP address must be higher than or equal to the start IP address.
- IP Version: IPv4 or IPv6.
Adding subareas
On the Areas
page, click the ![]() icon in the Actions
column for an area to add subareas for the area. You can configure a subarea in
the same way an area is configured.
icon in the Actions
column for an area to add subareas for the area. You can configure a subarea in
the same way an area is configured.
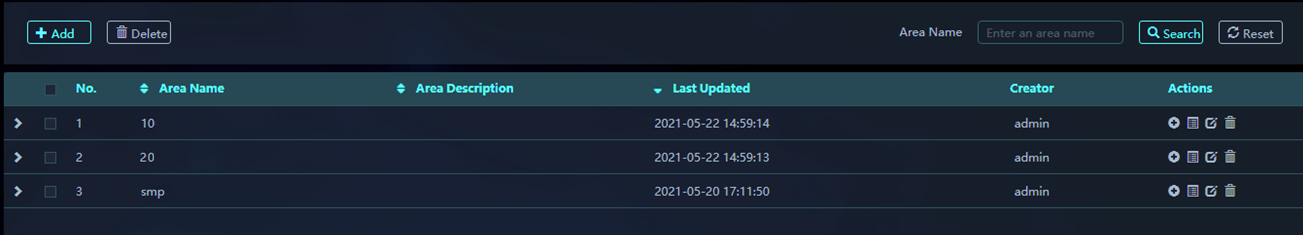
Viewing area information
1. On the top navigation bar, click O&M.
2. From the left navigation pane, select Areas.
3. View area information, including the area
name, type, and creator. To view subarea information for an area, click the ![]() icon for that
area.
icon for that
area.
Figure 11 Areas page
Deleting areas
Restrictions and guidelines
Deleting an area also deletes its subareas.
You cannot delete an area if that area has assets.
Procedure
1. On the top navigation bar, click O&M.
2. From the left navigation pane, select Areas.
3. Use one of the following methods to delete areas:
¡ Delete areas one by one—On the Areas page, click the Delete
icon ![]() in the Actions column for an area. In
the dialog box that opens, click OK.
in the Actions column for an area. In
the dialog box that opens, click OK.
¡ Delete areas in bulk—Select multiple areas in the area list, and click Delete. In the dialog box that opens, click OK.
Example: Configuring device groups
Introduction
Use this feature to divide assets into groups. The platform can analyze security events, filter logs, and generate reports for the assets in a group in a centralized manner.
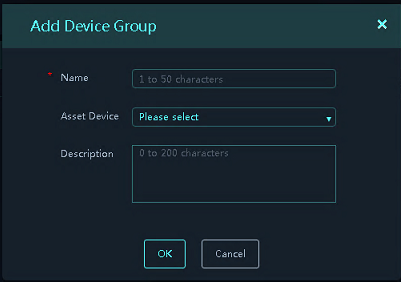
Adding a device group
1. On the top navigation bar, click O&M.
2. From the left navigation pane, select Device Groups.
3. Click Add.
4. Configure the parameters, and then click OK.
Parameters:
¡ Name: Name of the device group.
¡ Asset Device: Devices (assets) included in the device group.
¡ Description: Description for the device group. Set proper descriptions for device groups to facilitate usage of them.
Figure 12 Add Device Group page
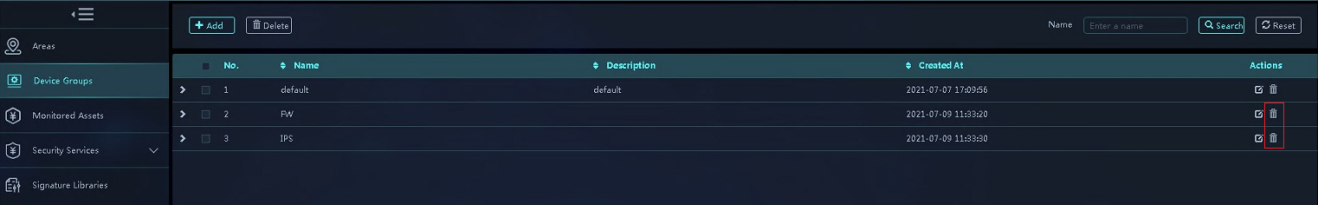
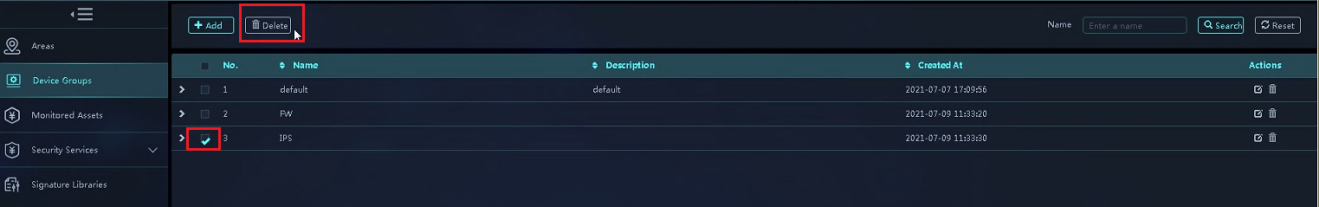
Deleting device groups
Restrictions and guidelines
The default device group cannot be deleted.
A device group cannot be deleted if that device group has devices.
Procedure
1. On the top navigation bar, click O&M.
2. From the left navigation pane, select Device Groups.
3. On the Device Groups page, use one of the following methods to delete device groups:
¡ Delete device groups in bulk—Select the device groups to be deleted, and then click Delete. In the dialog box that opens, click OK.
¡ Delete device groups one by one—Click the Delete icon in the Actions column for a device group. In the dialog box that opens, click OK.
Figure 13 Deleting device groups
Example: Managing devices
Introduction
This feature is used to manage and monitor device information, including adding, editing and deleting devices. You can add devices to SMP one by one or import devices in bulk to SMP.
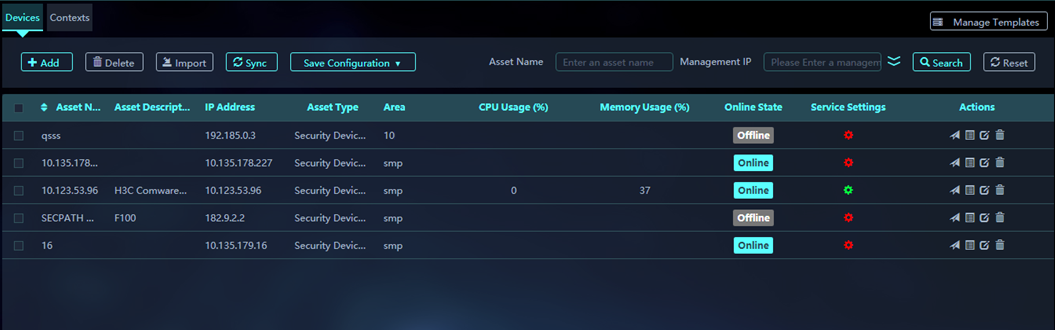
Viewing device system information
1. On the top navigation bar, click O&M.
2. From the left navigation pane, select Monitored Assets.
3. On the Devices tab, you can view the CPU usage and memory usage of the devices added to SMP.
Figure 14 Viewing asset CPU usage and memory usage information
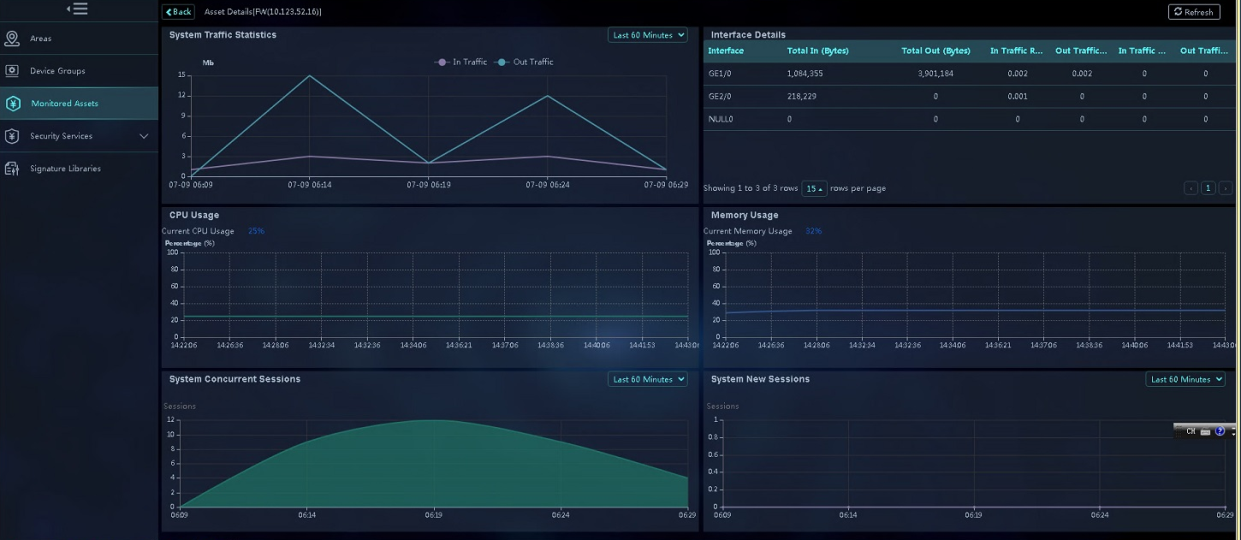
4. Click the ![]() icon in the Actions column for an asset. You can view traffic statistics, new session establishment and
concurrent session trends, CPU
and memory usage trends for that asset within a time span.
icon in the Actions column for an asset. You can view traffic statistics, new session establishment and
concurrent session trends, CPU
and memory usage trends for that asset within a time span.
Figure 15 Viewing asset details
5. Click Back.
6. Click the ![]() icon in the Actions column for an asset. You are placed at the Web login page of that asset.
icon in the Actions column for an asset. You are placed at the Web login page of that asset.
Figure 16 Accessing an asset

Adding assets
About this task
You can manually add assets one by one or import assets in bulk.
Restrictions and guidelines
The SNMP or SOAP parameters configured for an asset on SMP must be the same as those configured for SNMP or NETCONF over SOAP on that asset. This ensures successful information exchange between SMP and that asset.
Prerequisites
Configure authentication template parameters before you add assets.
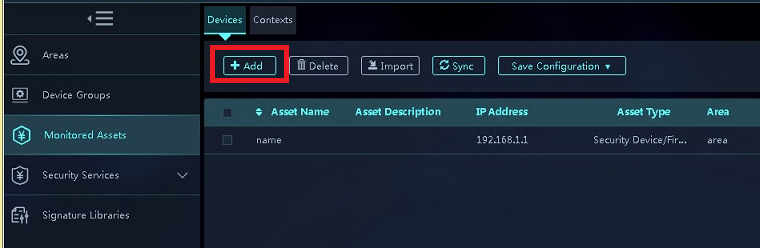
Manually adding an asset
1. On the top navigation bar, click O&M.
2. From the left navigation pane, select Monitored Assets.
3. On the Devices tab, click Add.
Figure 17 Adding an asset
4. On the Add Asset page, configure parameters as needed. Make sure all required parameters are configured.
Figure 18 Configuring asset parameters
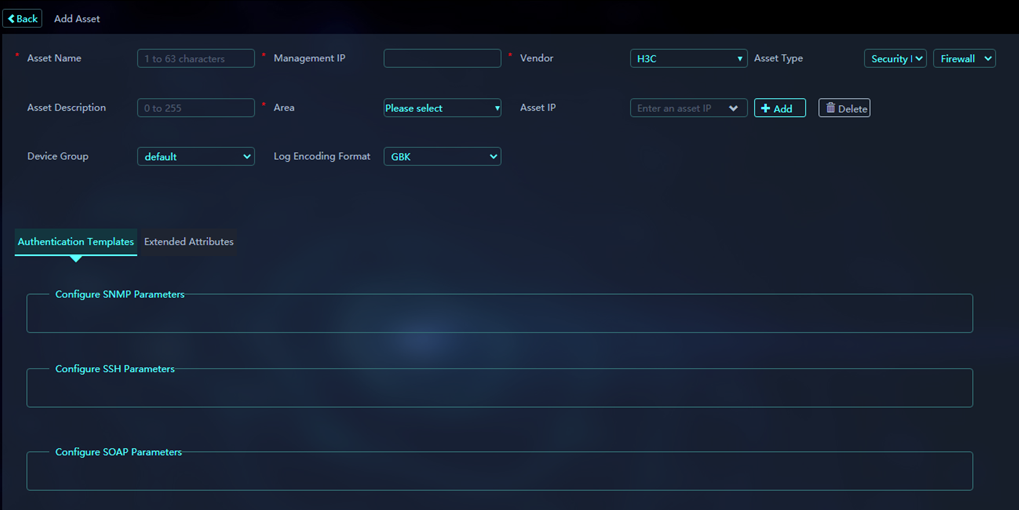
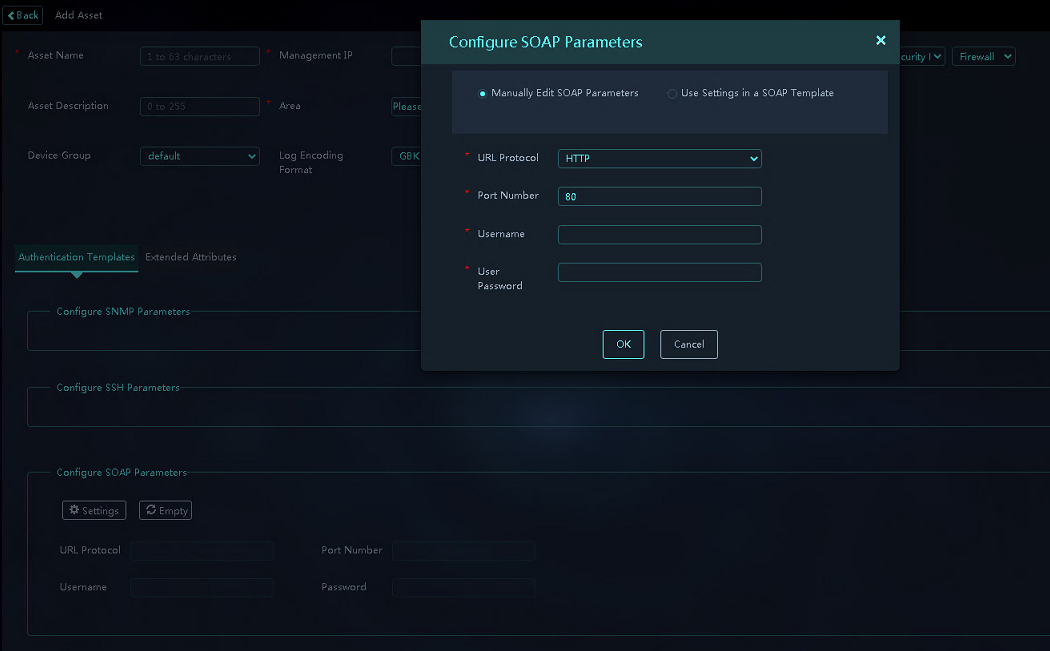
5. Open the configuration area of an authentication template, and click Settings. In the dialog box that opens, configure the authentication template parameters for the device. You can manually edit the template parameters or select an existing template. You must configure SNMP and SOAP parameters. SSH parameters are optional.
Figure 19 Configuring authentication templates
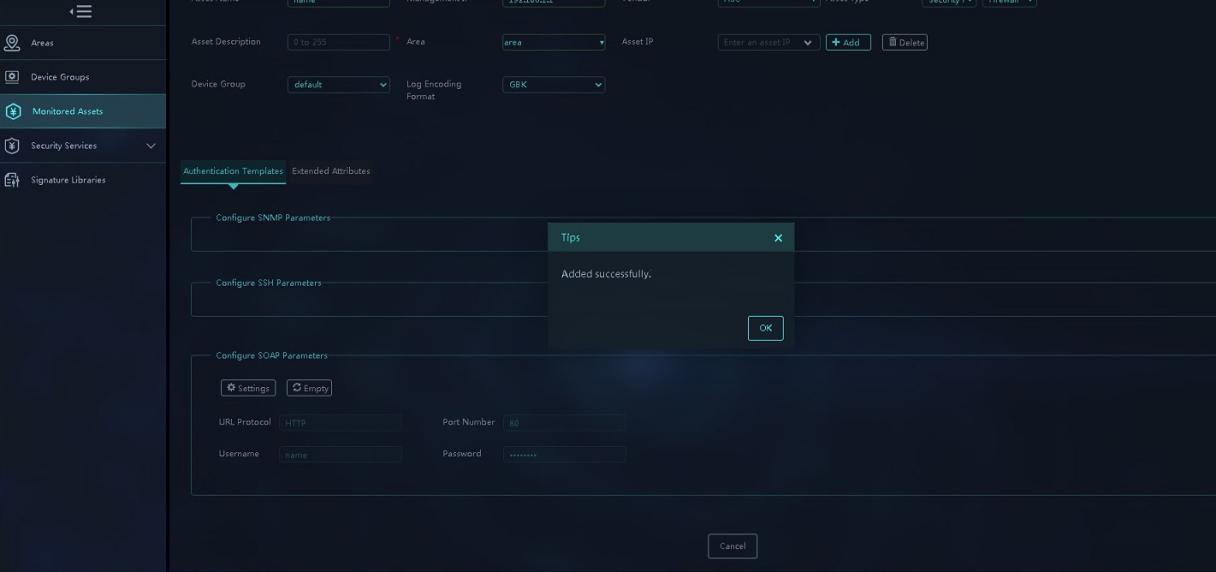
6. Click OK.
Figure 20 Submitting the configuration
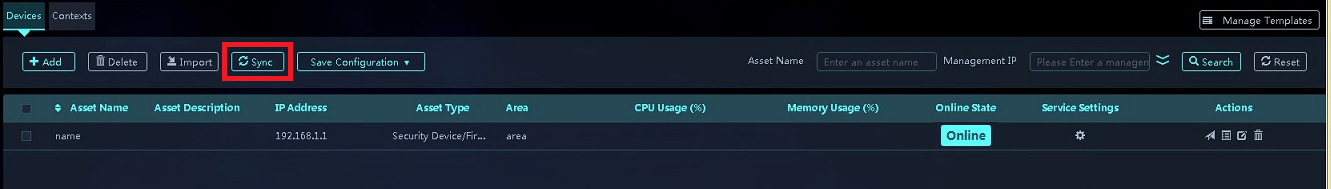
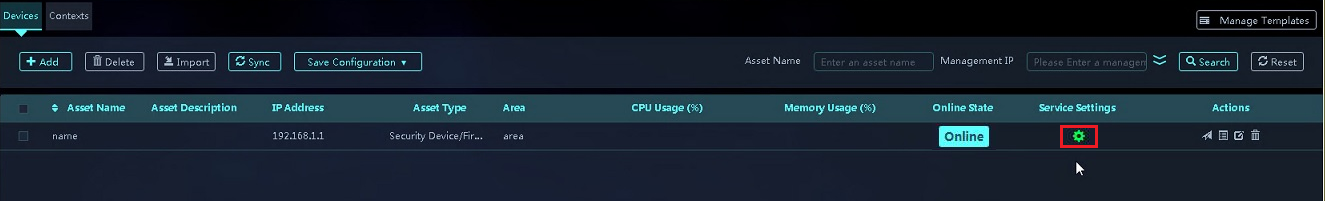
7. View the asset in the device list. The icon in the Service Settings column is in grey, which indicates that the asset on SMP has not been synchronized with the device itself. To synchronize information with the device, select the asset corresponding to the device and click Sync.
Figure 21 Selecting the device and clicking Sync
During the synchronization, the icon in the Service Settings column is in blue. After the synchronization is completed, the icon color changes to green. When the icon is in green, you can configure services and manage signature libraries for the device.
Figure 22 The platform is synchronizing data with the device
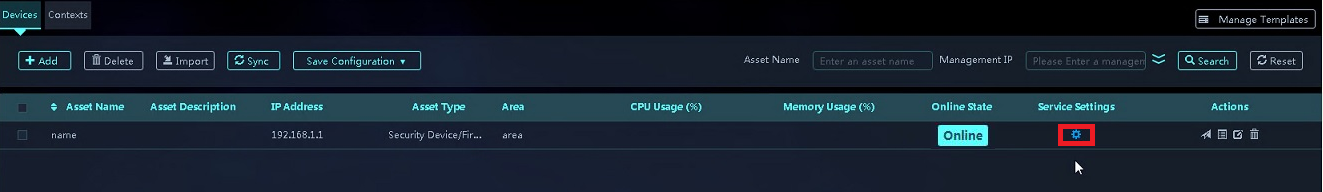
Figure 23 The platform synchronized data successfully with the device
Import assets in bulk
1. On the top navigation bar, click O&M.
2. From the left navigation pane, select Monitored Assets.
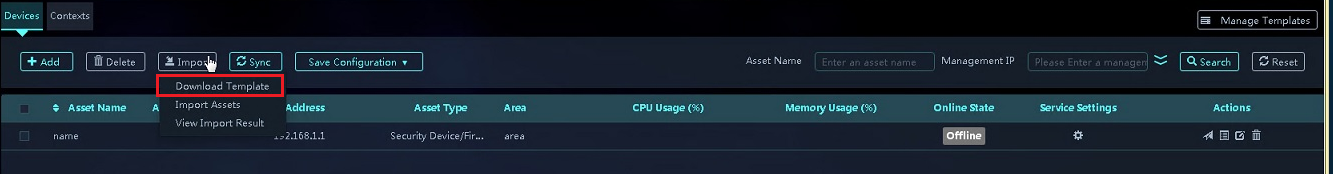
3. On the Devices tab, click Import. Then, select Download Template.
Figure 24 Downloading the template for importing assets
4. Enter device information as required in the template.
Figure 25 Adding device information to the template file
![]()
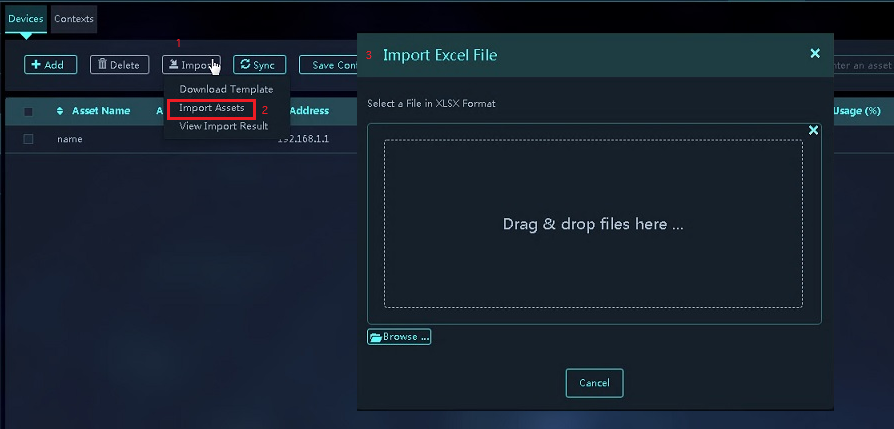
5. Click Import and select Import Assets. Select the template where you have edited device information and then upload it to import the devices in bulk.
After the import is finished, the device list displays the imported devices. You can click Import and select View Import Result to view the asset import result.
Figure 26 Importing assets from the edited configuration file
Examples: Managing security services
Managing security policies
About security policy management
You can manage security policies for a single device or multiple devices.
Managing security policies for a single device
1. On the top navigation bar, click O&M.
2. From the left navigation pane, select Monitored Assets.
3. On the Devices tab, select an asset and click Sync.

4. Click the green icon in the Service Settings column to access the Configure Services page.
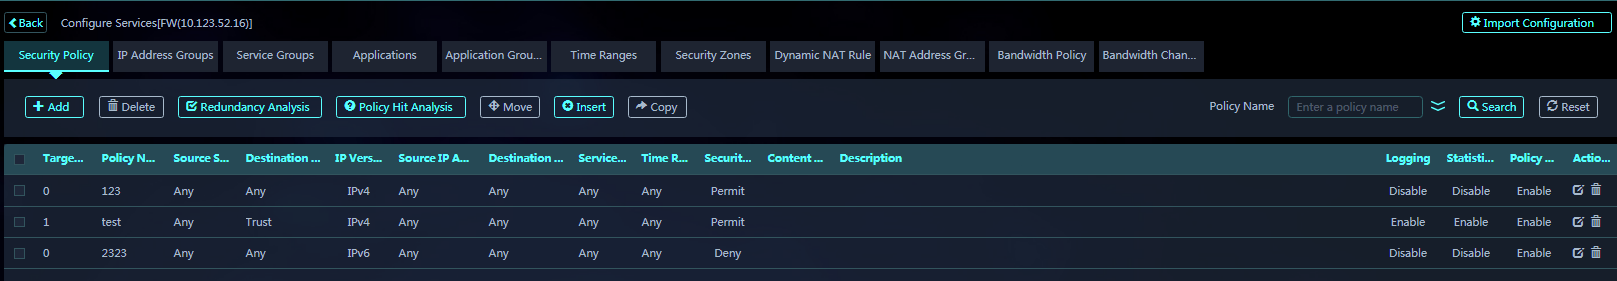
5. On the Security Policy tab, you can manage security policies.
Managing security policies for multiple devices
1. On the top navigation bar, click O&M.
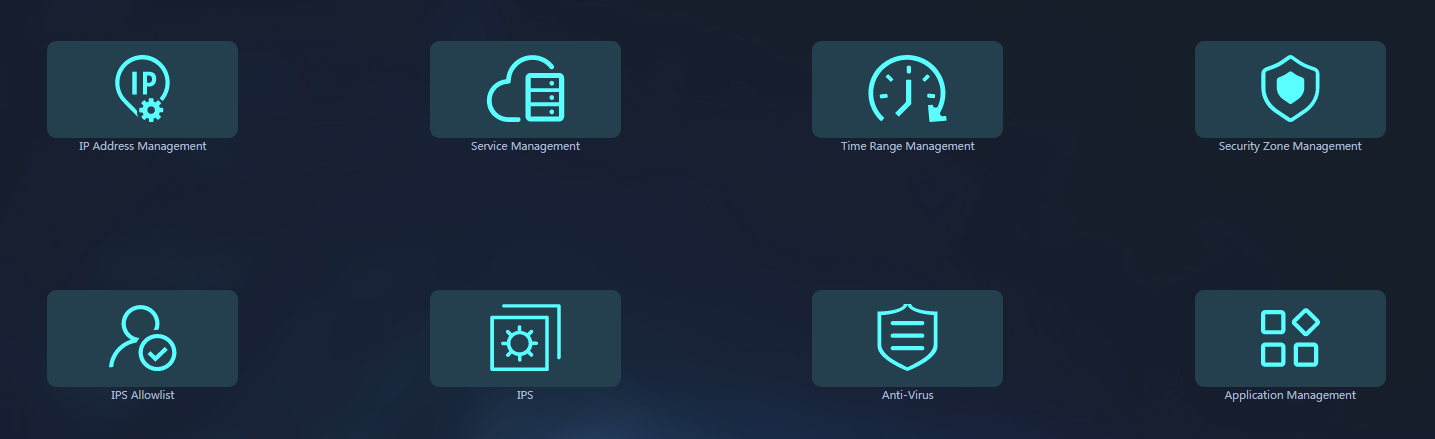
2. From the left navigation pane, select Security Services > Global Resources.
3. Click an icon to create the resources to be used by security policies.
4. Access the Security Services > Security Policies page.
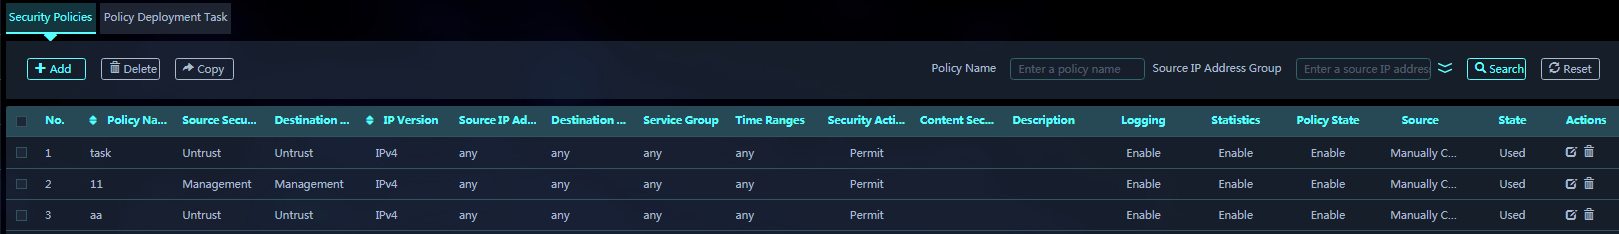
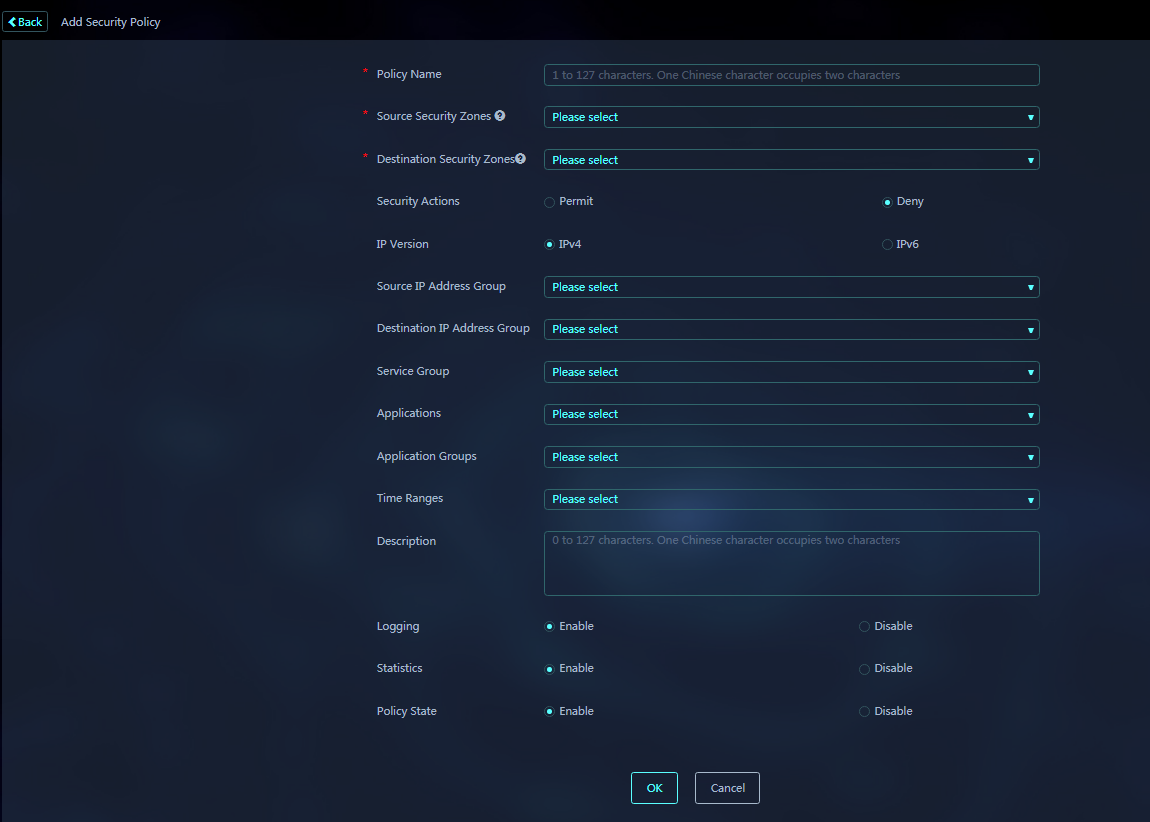
5. Click Add to create a security policy.
6. Click the Policy Deployment Task tab, and click Add to create a policy deployment task.
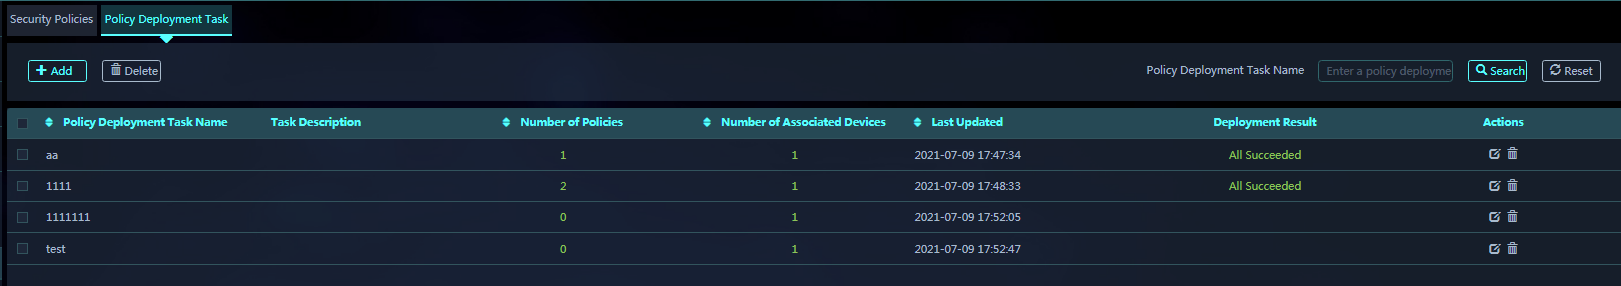
7. Click OK. The policy deployment task configuration is finished and the policy details page opens.
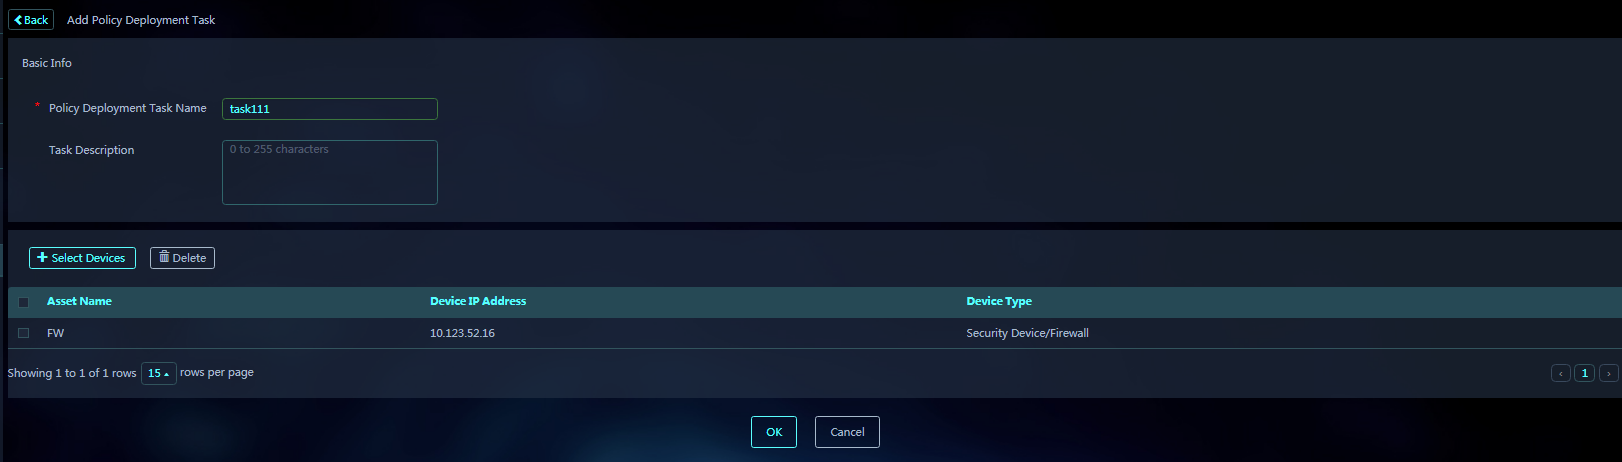
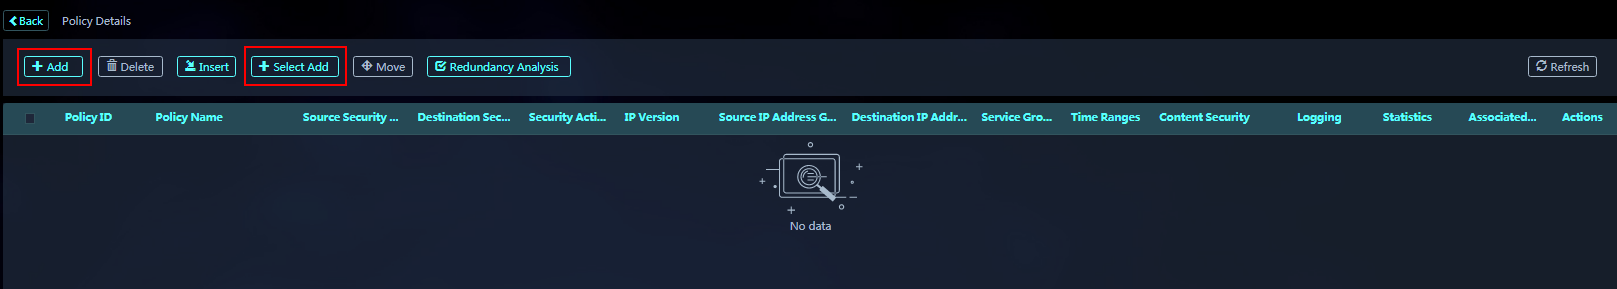
8. On the policy details page, add the security policies to be deployed to target devices. You can create new security policies or select existing security policies.
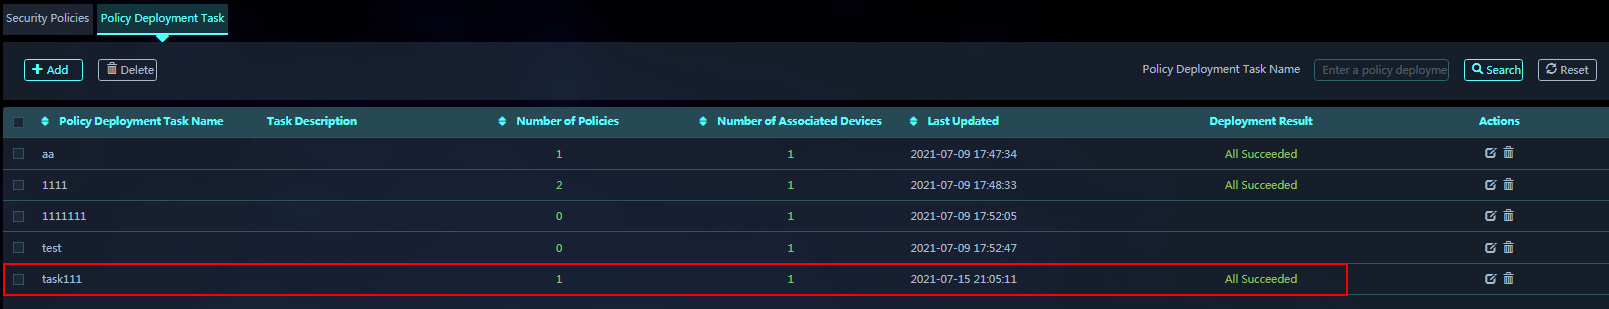
9. You can view the deployment results in the deployment task list.
Managing IPS allowlists
About IPS allowlist management
You can manage an IPS allowlist from the following pages:
· Configure Services > IPS Allowlist.
· Global Resources > IPS Allowlist.
· Security Logs > Vulnerability Attack Log.
Prerequisites
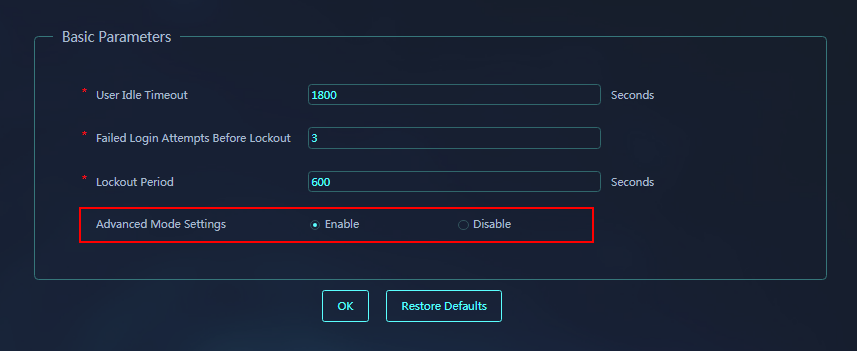
Enable Advanced Mode Settings from the System Settings > Global Settings > System Parameters.
Managing an IPS allowlist for a single device
1. On the top navigation bar, click O&M.
2. From the left navigation pane, select Monitored Assets.
3. On the Devices tab, select an asset and click Sync.
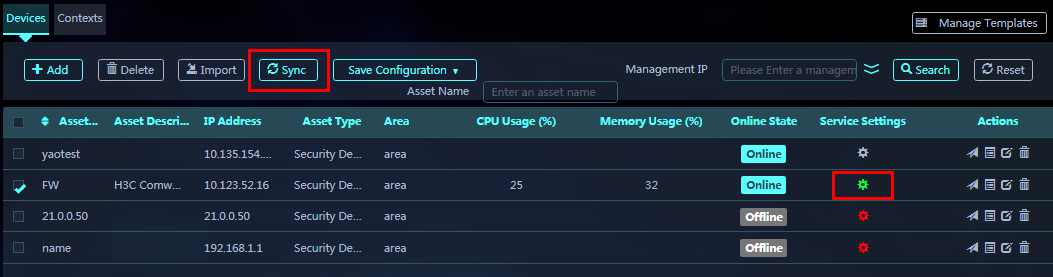
4. Click the green icon in the Service Settings column to access the Configure Services page.
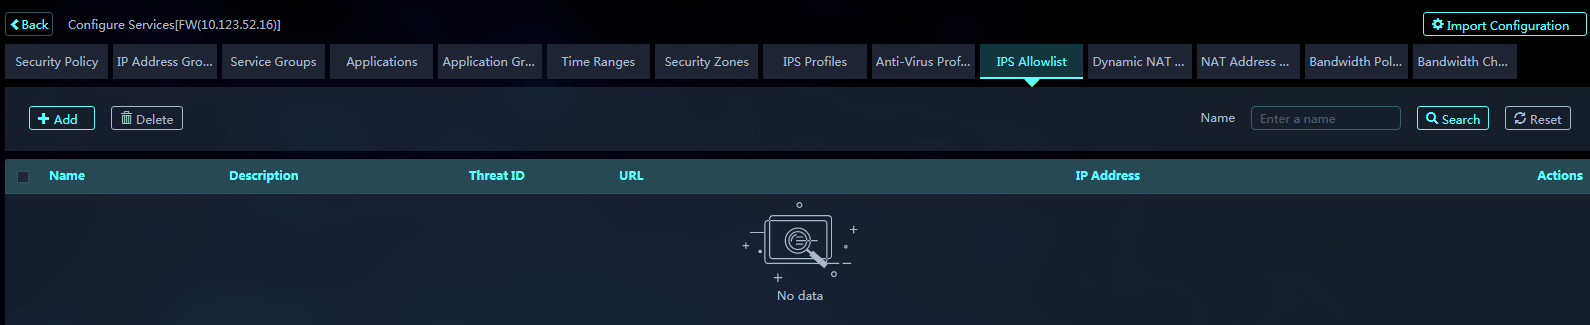
5. Click the IPS Allowlist tab, and you can add, delete, edit, or view an IPS allowlist.
Managing an IPS allowlist for multiple devices
1. On the top navigation bar, click O&M.
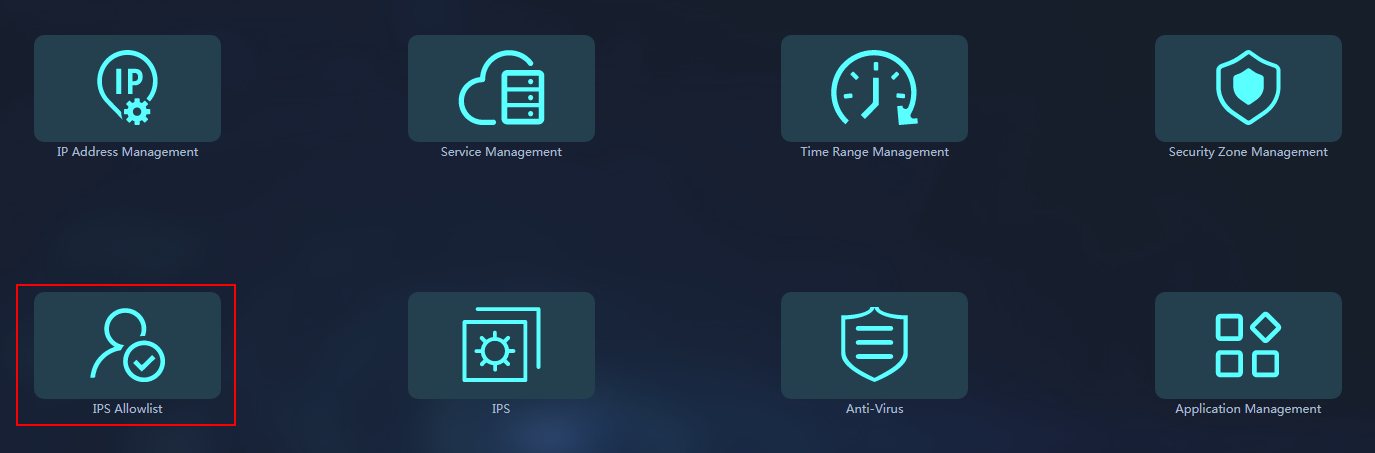
2. From the left navigation pane, select Security Services > Global Resources.
3. Click the IPS Allowlist icon to manage IPS allowlists.
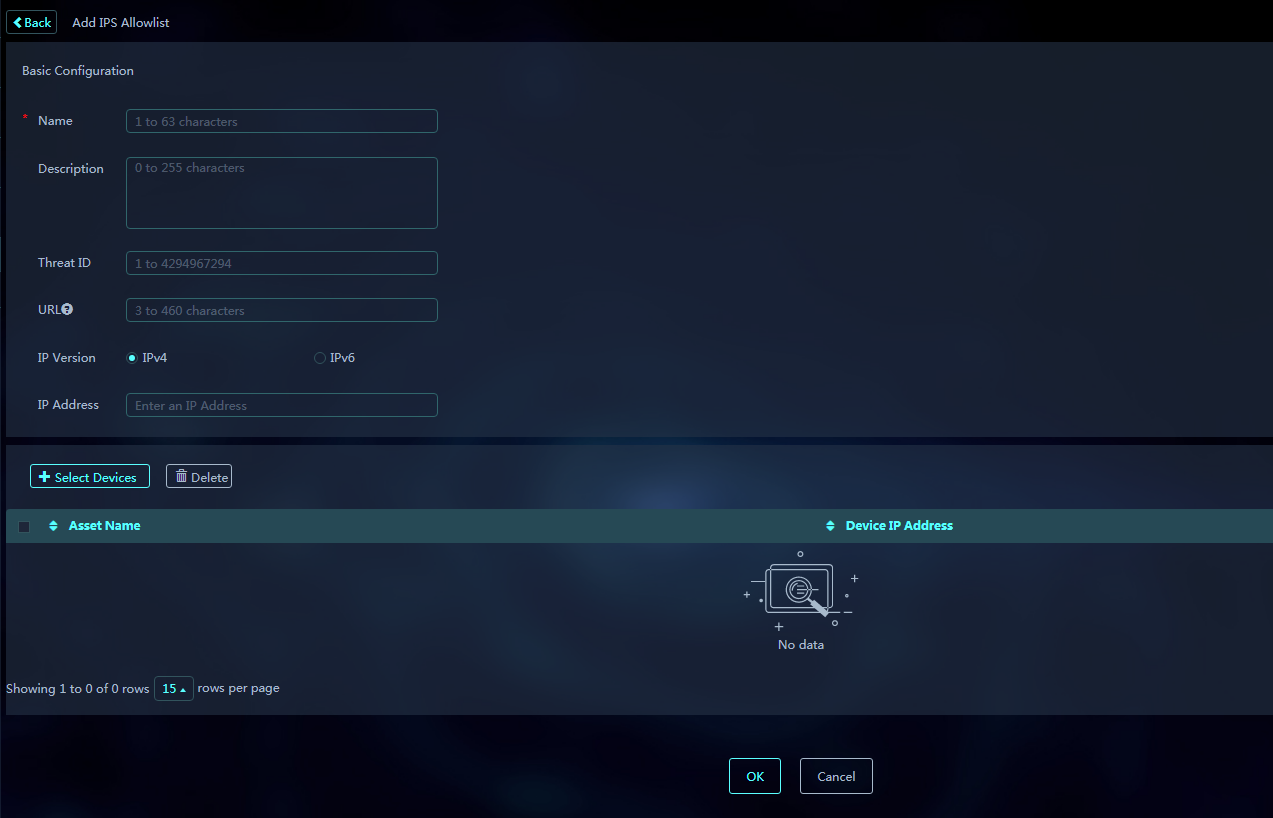
4. Click Add to add an IPS allowlist, and select the devices to deploy the IPS allowlist.
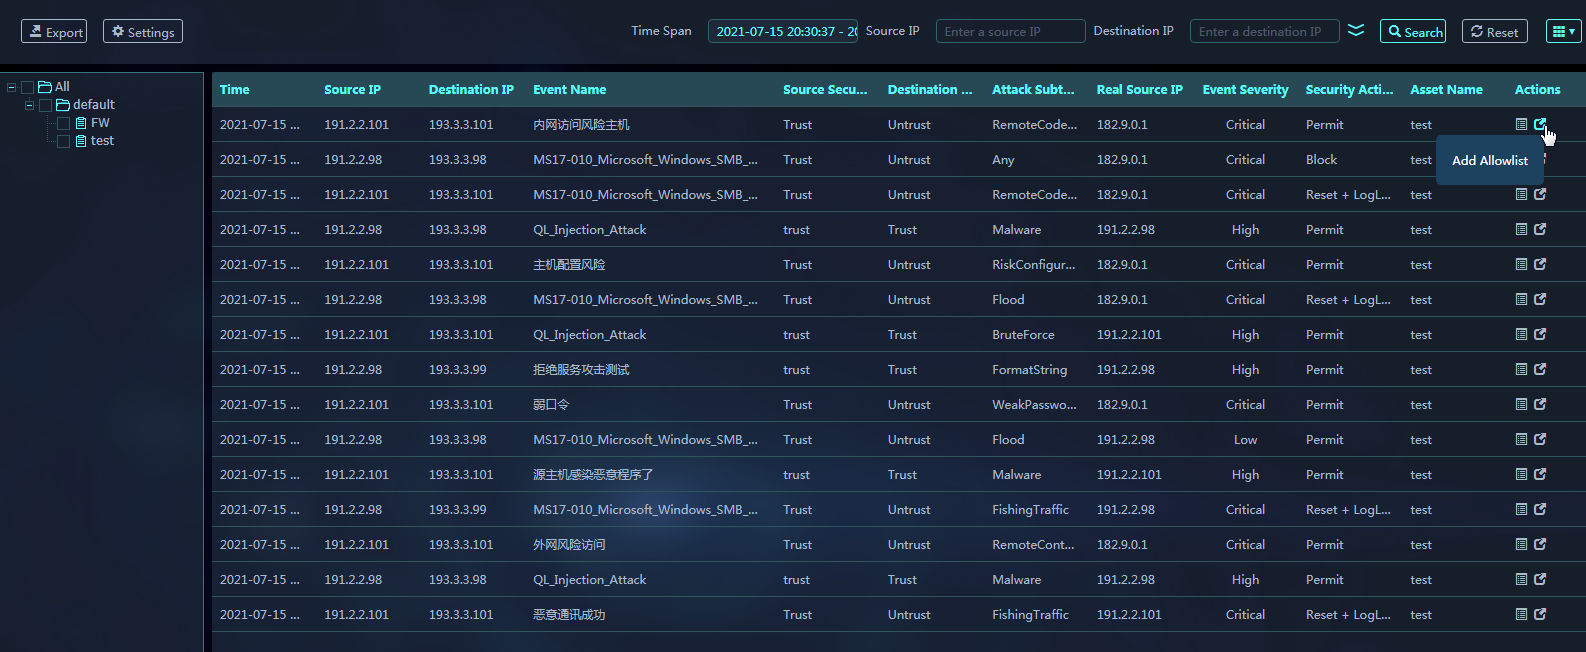
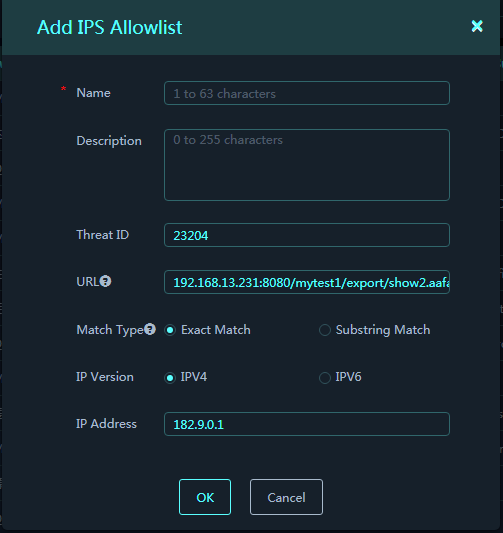
Adding an IPS allowlist from the Vulnerability Attack Log page
1. On the top navigation bar, click Log Audit.
2. From the left navigation pane, select Security Logs > Vulnerability Attack Log.
3. Click Add Allowlist in the Actions column for a log entry to add an IPS allowlist for the related device.
Examples: Managing signature libraries
Updating a signature library manually
1. On the top navigation bar, click O&M.
2. From the left navigation pane, select Signature Libraries.
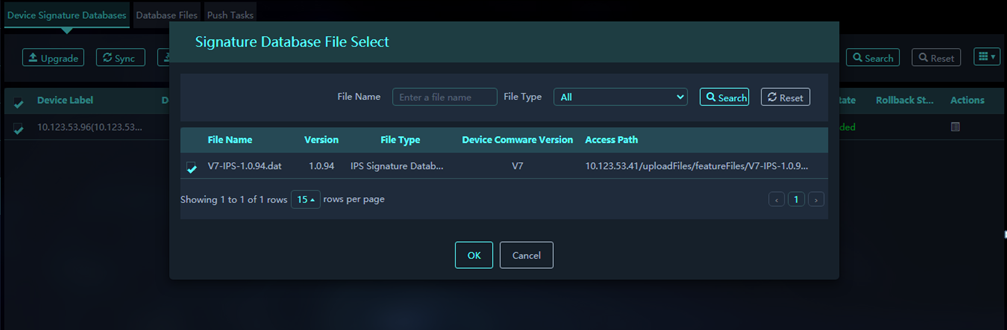
3. On the Device Signature Databases tab, select target devices, click Upgrade, and select a signature database file.
Synchronizing signature libraries to the SMP
1. On the Device Signature Databases tab, select target devices and click Sync to synchronize all signature libraries of each selected device to the SMP.
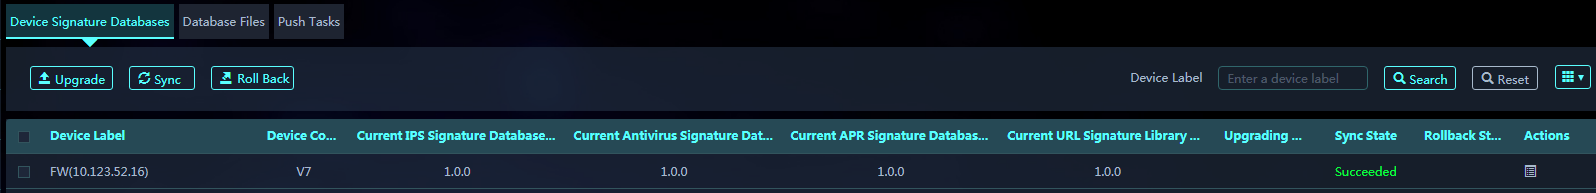
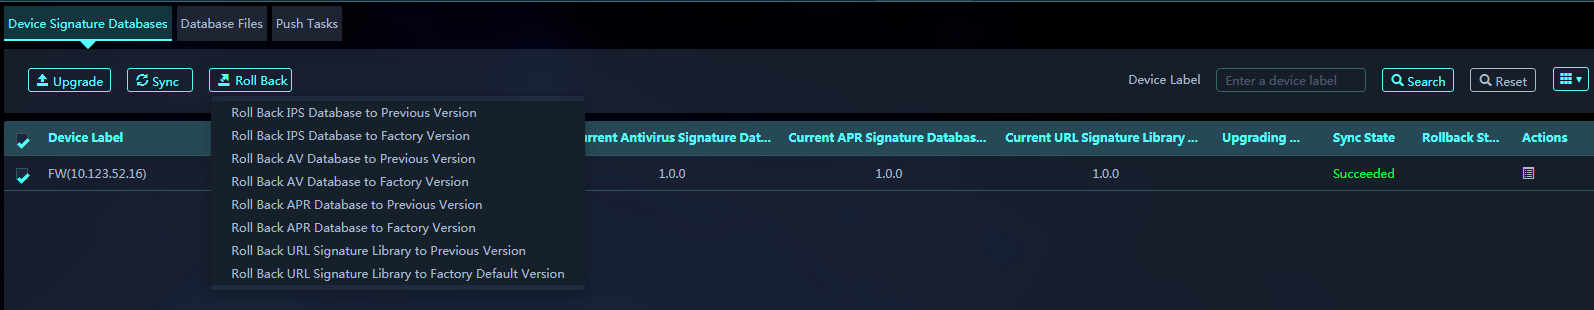
Rolling back a signature library manually
1. On the Device Signature Databases tab, select target devices, and click Roll Back to roll back a signature library to the previous or factory version.
Managing signature library files
Uploading a signature library file
1. On the top navigation bar, click O&M.
2. From the left navigation pane, select Signature Libraries.
3. Click the Database Files tab.
On this tab, you can upload or delete a database file.
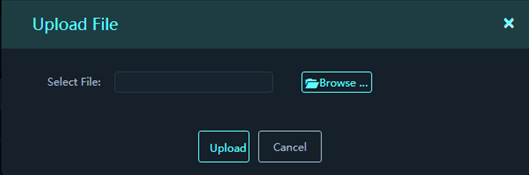
4. On the Database Files tab, click Upload File, and select the file to be uploaded.
The file type, library version, and applicable device series are automatically identified when the file is parsed.
Uploading a signature library file
You can push a signature library file to subplatforms. Two options are available: Push Now and Scheduled Push.
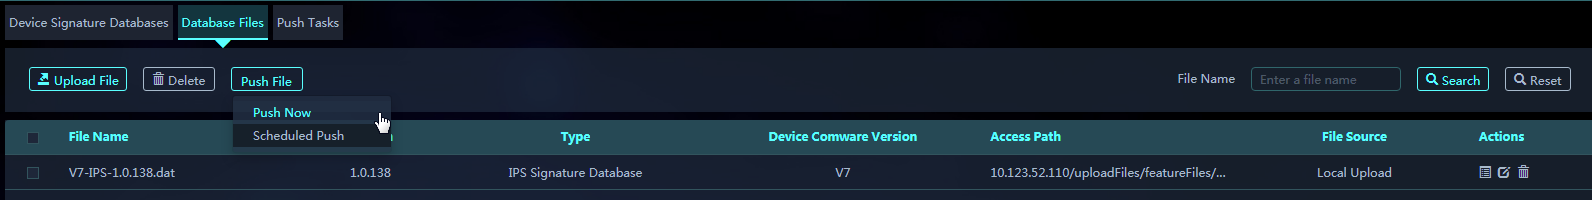
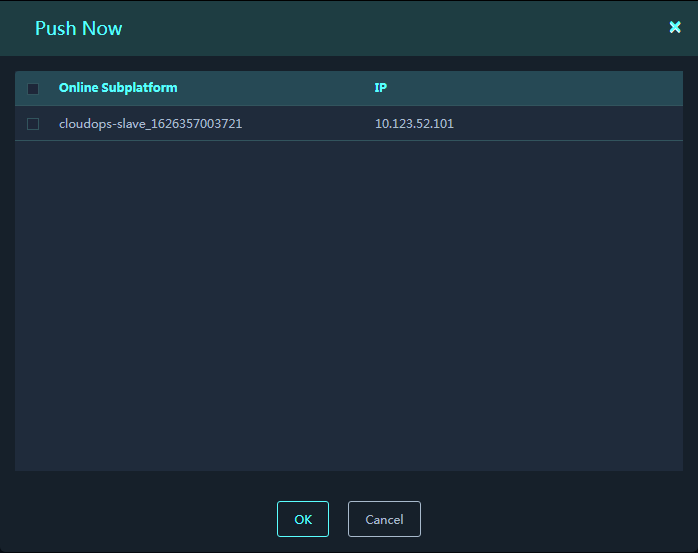
Pushing signature library files now
1. On the Database Files tab, select the files to be pushed.
2. Click Push File, and select Push Now.
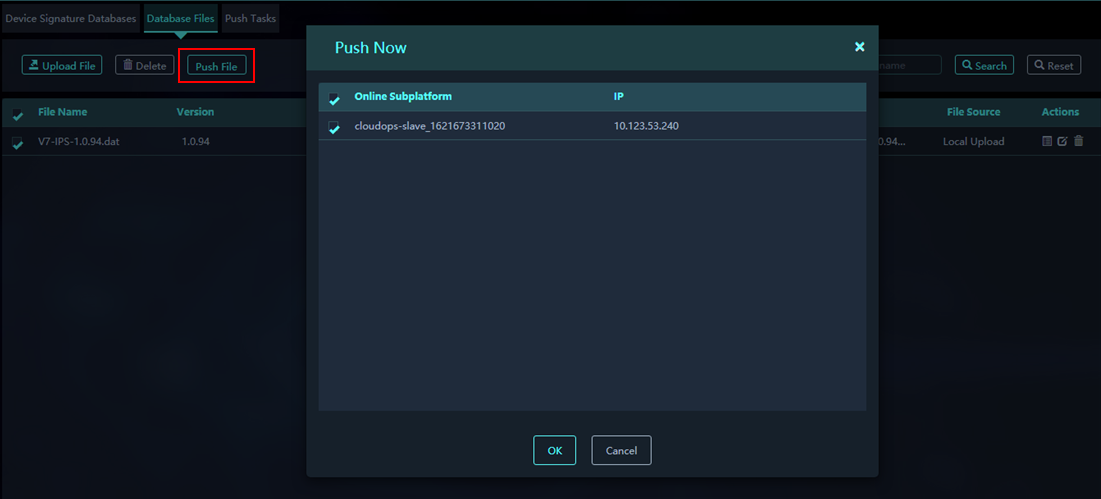
3. Select the target subplatforms to push the files immediately.
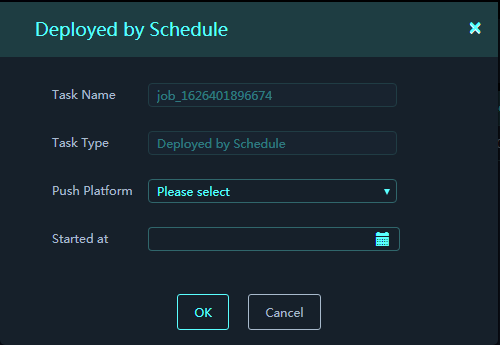
Pushing signature library files at a schedule time
1. On the Database Files tab, select the files to be pushed.
2. Click Push File, and select Scheduled Push.
3. Select the target subplatforms and select the push time.
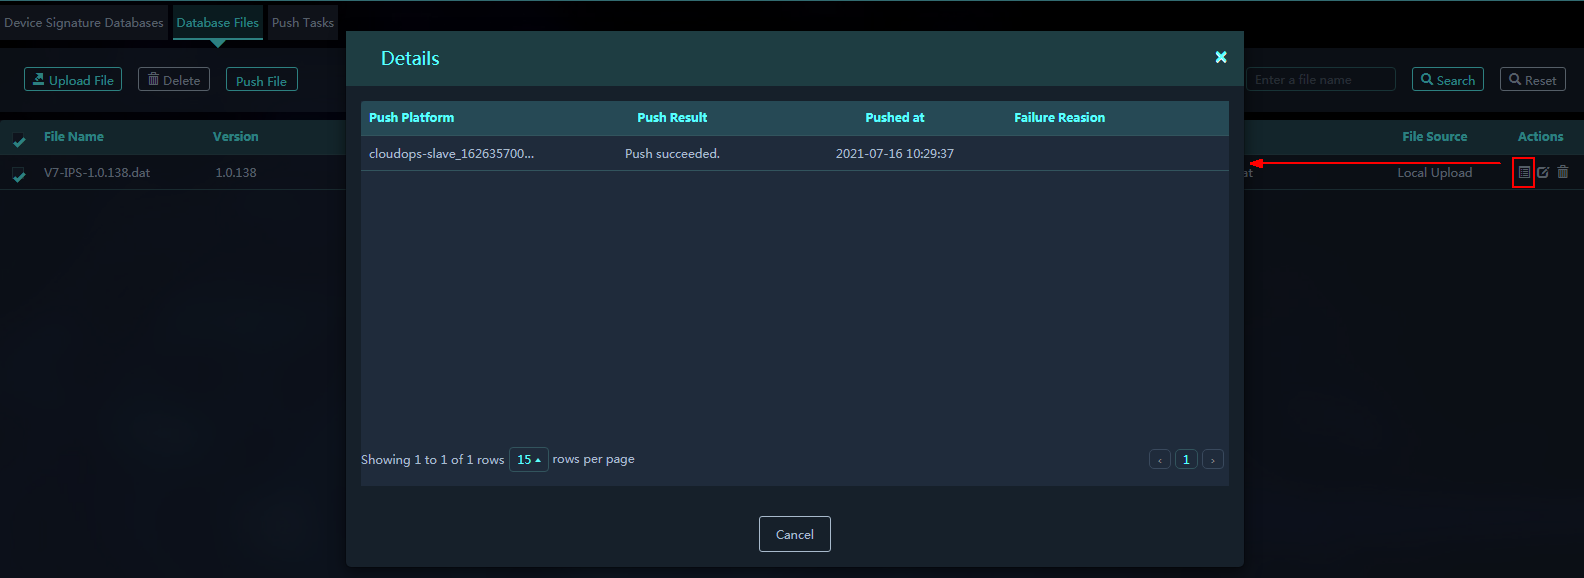
Viewing file push details
1. To view the push details of a file, click the Details icon in the Actions column for the file on the Database Files tab.
Examples: Performing hierarchical management
About hierarchical management
Use this feature to monitor the subplatforms and collectors managed by the platform. If the network is divided into multiple areas, you can deploy an SMP platform in each area. To centrally monitor all platforms, you can use one of the platforms as the parent platform and register the other platforms as subplatforms with the parent platform. The subplatforms report their resource usage information (including the CPU, memory, and disk usage information) to the parent platform every 1 minute.
Restrictions and guidelines
You can register multiple subplatforms with a parent platform. No subplatform can be attached to a subplatform. Only the parent platform displays subplatform information on the Hierarchy page.
For information about registering subplatforms with a parent platform, see the SMP installation guide. On the Web interface, you cannot add or delete a parent platform for a platform or add or delete subplatforms for the platform.
Registering a subplatform with the parent platform
1. Use to log in to the background of the subplatform through SSH as an administrator.
|
|
NOTE: The default username and password of the H3linux system are both root. You can change the default username and password. |
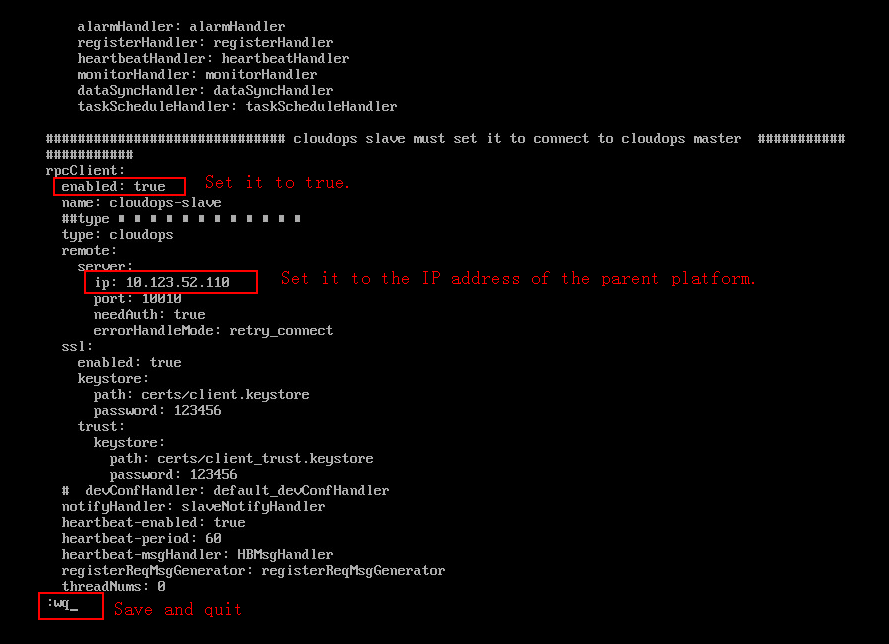
2. Access the /opt/ipsm/csap_com/config path.
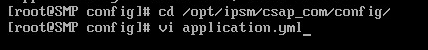
3. Modify the configuration file application.yml as follows:
a. Set the enabled parameter to true.
b. Set the IP address to the IP address of the parent platform.
c. Save the configuration and quit.
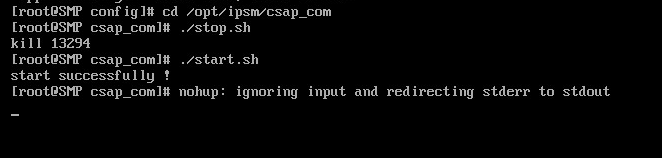
4. Restart the cloudops service in the /opt/ipsm/csap_com/ path for the subplatform to connect to the parent platform.
Viewing hierarchical management information.
After registering a subplatform, you can access the System Settings > Hierarchy page to view information about the subplatform.
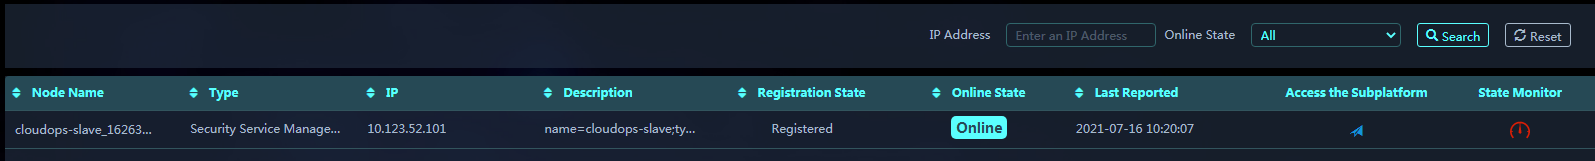
Parameters:
· Node Name: Name of a subplatform.
· Type: Security management subplatform.
· IP: IP address of the subplatform.
· Description: Description of the subplatform or collector.
· Registration State: Whether the subplatform has been registered with the platform.
· Online State: State of the subplatform, which can be online or offline.
· Last Reported: Last time when the subplatform reported resource usage information.
· Access the Subplatform: Click the ![]() icon to open the login page
of the subplatform.
icon to open the login page
of the subplatform.
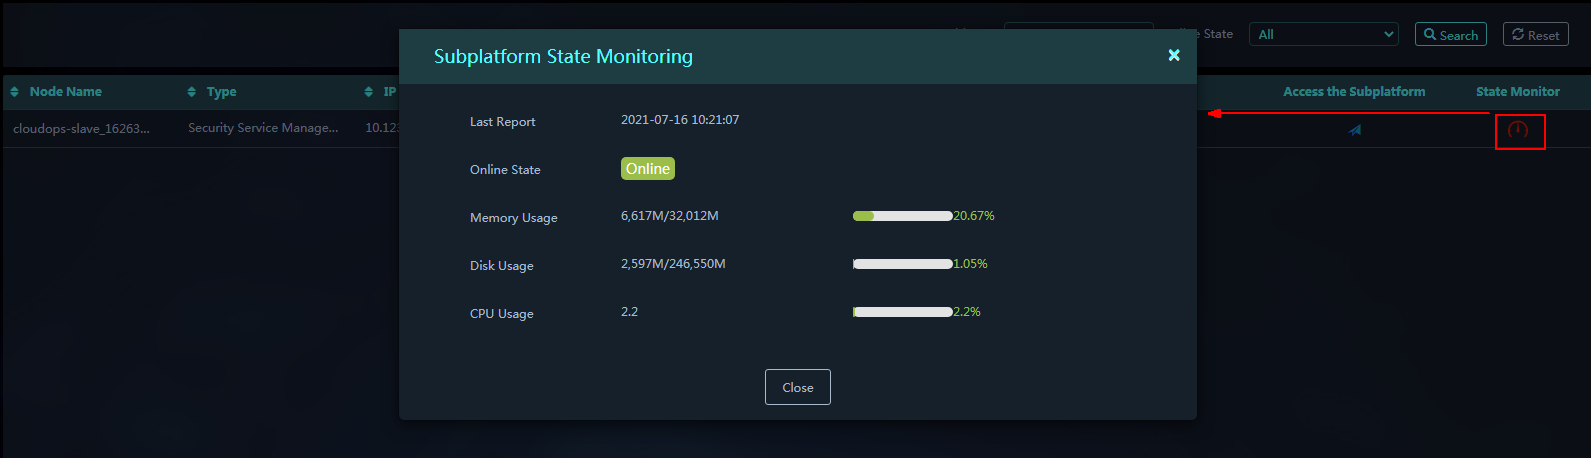
· State Monitor: Click the ![]() icon to view resource usage
of the subplatform.
icon to view resource usage
of the subplatform.
Parameters:
¡ Last Reported: Last time when the subplatform reported information.
¡ Online State: Display whether the subplatform is online.
¡ Memory Usage: Display memory usage of the subplatform.
¡ Disk Usage: Display disk usage of the subplatform.
¡ CPU Usage: Display CPU usage of the subplatform.
