| Title | Size | Downloads |
|---|---|---|
| H3C IMC VAN Software Defined Network Manager Administrator Guide-7.3-5PW102.pdf | 1.83 MB |
- Related Documents
-
|
H3C Intelligent Management Center |
|
Virtual Application Networking Software Defined |
|
|
|
Hangzhou H3C Technologies Co., Ltd. http://www.h3c.com
Software version: IMC SDNM 7.3 (E0501) Document version: 5PW102-20170105 |
Copyright ? 2014-2017, Hangzhou H3C Technologies Co., Ltd. and its licensors
No part of this manual may be reproduced or transmitted in any form or by any means without prior written consent of Hangzhou H3C Technologies Co., Ltd.
H3C, ![]() , H3CS, H3CIE, H3CNE, Aolynk,
, H3CS, H3CIE, H3CNE, Aolynk, ![]() , H3Care,
, H3Care, ![]() , IRF, NetPilot, Netflow, SecEngine,
SecPath, SecCenter, SecBlade, Comware, ITCMM and HUASAN are trademarks of
Hangzhou H3C Technologies Co., Ltd.
, IRF, NetPilot, Netflow, SecEngine,
SecPath, SecCenter, SecBlade, Comware, ITCMM and HUASAN are trademarks of
Hangzhou H3C Technologies Co., Ltd.
All other trademarks that may be mentioned in this manual are the property of their respective owners
The information in this document is subject to change without notice. Every effort has been made in the preparation of this document to ensure accuracy of the contents, but all statements, information, and recommendations in this document do not constitute the warranty of any kind, express or implied.
Preface
The H3C IMC Virtual Application Networking Software Defined Network Manager Administrator Guide includes 10 chapters, which describe how to configure SDNM to manage OpenFlow-Based SDN.
This preface includes:
· Audience.
· Conventions.
· About the H3C IMC documentation set.
Audience
This documentation is intended for:
· Network planners.
· Field technical support and servicing engineers.
· Network administrators working with the H3C IMC.
Conventions
This section describes the conventions used in the documentation.
Port numbering in examples
The port numbers in the documentation are for illustration only and might be unavailable on your device.
Command conventions
|
Convention |
Description |
|
Boldface |
Bold text represents commands and keywords that you enter literally as shown. |
|
Italic |
Italic text represents arguments that you replace with actual values. |
|
# |
A line that starts with a pound (#) sign is comments. |
GUI conventions
|
Convention |
Description |
|
Boldface |
Window names, button names, field names, and menu items are in Boldface. For example, the New User window appears; click OK. |
|
> |
Multi-level menus are separated by angle brackets. For example, File > Create > Folder. |
Symbols
|
Convention |
Description |
|
|
An alert that calls attention to important information that if not understood or followed can result in personal injury. |
|
|
An alert that calls attention to important information that if not understood or followed can result in data loss, data corruption, or damage to hardware or software. |
|
|
An alert that calls attention to essential information. |
|
NOTE: |
An alert that contains additional or supplementary information. |
|
|
An alert that provides helpful information. |
About the H3C IMC documentation set
The H3C IMC documentation set includes the following categories of documents:
|
Documents |
Purpose |
|
|
|
|
Quickly guides you through the IMC main features and troubleshooting common problems. |
|
|
H3C IMC Centralized Deployment Guide with Embedded Database |
Provides a complete guide to IMC platform and components installation and centralized deployment using embedded database. |
|
H3C IMC Centralized Deployment Guide with Local Database |
Provides a complete guide to IMC platform and components installation and centralized deployment using local database. |
|
H3C IMC Centralized Deployment Guide with Remote Database |
Provides a complete guide to IMC platform and components installation and centralized deployment using remote database. |
|
H3C IMC Distributed Deployment Guide with Local Database |
Provides a complete guide to IMC platform and components installation and distributed deployment using local database. |
|
H3C IMC Distributed Deployment Guide with Remote Database |
Provides a complete guide to IMC platform and components installation and distributed deployment using remote database. |
|
H3C IMC Probe Installation Guide |
Provides a complete guide to IMC Probe installation and deployment. |
|
H3C IMC RSM Installation Guide |
Provides a complete guide to IMC RSM installation and deployment. |
|
H3C IMC iHATool Installation Guide |
Provides a complete guide to IMC iHATool installation. |
|
SQL Server 2008 Installation and Configuration Guide |
Guides you through installing SQL Server 2008 for IMC. |
|
SQL Server 2008 R2 Installation and Configuration Guide |
Guides you through installing SQL Server 2008 R2 for IMC. |
|
SQL Server 2012 Installation and Configuration Guide |
Guides you through installing SQL Server 2012 for IMC. |
|
SQL Server 2014 Installation and Configuration Guide |
Guides you through installing SQL Server 2014 for IMC. |
|
Oracle 11g Installation and Configuration Guide(for Linux) |
Guides you through installing Oracle 11g on Linux for IMC. |
|
Oracle 11g R2 Installation and Configuration Guide(for Linux) |
Guides you through installing Oracle 11g R2 on Linux for IMC. |
|
Oracle 12c Installation and Configuration Guide(for Linux) |
Guides you through installing Oracle 12c on Linux for IMC. |
|
Red Hat Enterprise Linux 6.4 Installation Guide |
Guides you through installing Red Hat Enterprise Linux 6.4 for IMC. |
|
Red Hat Enterprise Linux 7.0 Installation Guide |
Guides you through installing Red Hat Enterprise Linux 7.0 for IMC. |
|
Software configuration |
|
|
H3C IMC Enterprise and Standard Platform Administrator Guide |
Describes operation procedures on the IMC platform. |
|
H3C IMC Quality of Service Manager Administrator Guide |
Describes operation procedures on the IMC Quality of Service Manager. |
|
H3C IMC Resource Automation Manager Administrator Guide |
Describes operation procedures on the Resource Automation Manager. |
|
H3C IMC Service Health Manager Administrator Guide |
Describes operation procedures on the Service Health Manager. |
|
H3C IMC VAN Connection Manager Administrator Guide |
Describes operation procedures on the IMC VAN Connection Manager. |
|
H3C IMC VAN Software Defined Network Manager Administrator Guide |
Describes operation procedures on the IMC VAN Software Defined Network Manager. |
|
H3C IMC VAN Fabric Manager Administrator Guide |
Describes operation procedures on the IMC VAN Fabric Manager. |
|
H3C IMC Application Manager Administrator Guide |
Describes operation procedures on the IMC Application Manager. |
|
H3C IMC Branch Intelligent Management System Administrator Guide |
Describes operation procedures on the IMC Branch Intelligent Management System. |
|
H3C IMC Business Service Manager Administrator Guide |
Describes operation procedures on the IMC Business Service Performance. |
|
H3C IMC IPsec VPN Manager Administrator Guide |
Describes operation procedures on the IMC IPsec VPN Manager. |
|
H3C IMC MPLS VPN Manager Administrator Guide |
Describes operation procedures on the IMC MPLS VPN Manager. |
|
H3C IMC Network Traffic Analyzer Administrator Guide |
Describes operation procedures on the IMC Network Traffic Analyzer. |
|
H3C IMC Service Operation Manager Administrator Guide |
Describes operation procedures on the IMC Service Operation Manager. |
|
H3C IMC User Behavior Auditor Administrator Guide |
Describes operation procedures on the IMC User Behavior Auditor. |
|
H3C IMC UC Health Manager Admin Guide |
Describes operation procedures on the IMC UC Health Manager. |
|
H3C IMC Wireless Service Manager Administrator Guide |
Describes operation procedures on the IMC Wireless Service Manager. |
|
H3C IMC User Access Manager Administrator Guide |
Describes operation procedures on the IMC User Access Manager. |
|
H3C IMC TACACS+ Authentication Manager Administrator Guide |
Describes operation procedures on the IMC TACACS+ Authentication Manager. |
|
H3C IMC EAD Security Policy Administrator Guide |
Describes operation procedures on the IMC EAD Security Policy Manager. |
|
Online Help |
Helps you properly use IMC. |
|
Operations and maintenance |
|
|
Readme |
Provides most recent IMC release information. |
Obtaining documentation
Access the most up-to-date H3C product documentation on the World Wide Web at http://www.h3c.com.
Click the following links to obtain different categories of product documentation:
[Technical Documents]—Provides hardware installation, software upgrading, and software feature configuration and maintenance documentation.
[Products & Solutions]—Provides information about products and technologies.
[Software Download]—Provides the documentation released with the software version.
Technical support
service@h3c.com
Documentation feedback
You can e-mail your comments about product documentation to info@h3c.com.
We appreciate your comments.
Contents
Copyright © 2014-2017, Hangzhou H3C Technologies Co., Ltd. and its licensors
About the H3C IMC documentation set
SDNM breadcrumb navigation menu
Configuring controller connection parameters
Viewing the OpenFlow device status statistics
Viewing the controller traffic rate chart
Viewing today's top N controller traffic·
Viewing the controller alert statistics
Viewing the tenant traffic rate chart
Viewing today's top N tenant traffic
Viewing today's top 5 service flows
Viewing today's top 5 flow entries
Querying controllers by using a basic query
Querying controllers by using an advanced query
Managing a controller on the controller details page
Viewing controller configurations
Viewing a controller's alert listener list
Adding an alert listener to a controller
Viewing the OpenFlow instance list
Querying OpenFlow instances by using a basic query
Querying OpenFlow instances by using an advanced query
Synchronizing OpenFlow instances
Managing an OpenFlow instance on the OpenFlow instance details page
Viewing the OpenFlow switch list
Querying OpenFlow switches by using a basic query
Querying OpenFlow switches by using an advanced query
Managing an OpenFlow switch on the OpenFlow switch details page
Managing controller configurations for an OpenFlow switch
Viewing the controller configuration list
Querying controller configurations
Adding the configuration of a controller
Modifying the configuration of a controller
Deleting the configuration of a controller
Querying flow tables by using a basic query
Querying flow tables by using an advanced query
Querying flow entries by using a basic query
Querying flow entries by using an advanced query
Configuring the instruction set for a flow entry
Configuring actions for the Apply-Actions or Write-Actions instruction
Viewing the flow entry history
Querying groups by using a basic query·
Querying groups by using an advanced query
Querying meters by using a basic query·
Querying meters by using an advanced query
Querying service flows by using a basic query
Querying service flows by using an advanced query
Modifying the path name of a service flow
Viewing the service flow history
Managing OpenFlow alerts and troubleshooting service flows
Querying alerts by using a basic query·
Querying alerts by using an advanced query
Acknowledging, recovering, and deleting alerts
Accessing the trouble analysis page
Querying service flows by using a basic query
Querying service flows by using an advanced query
Troubleshooting a service flow
Managing virtual OpenFlow devices
Viewing the virtual OpenFlow device list
Querying virtual OpenFlow devices by using a basic query
Querying virtual OpenFlow devices by using an advanced query
Adding virtual OpenFlow devices
Modifying a virtual OpenFlow device
Deleting virtual OpenFlow devices
Viewing tenant network statistics charts
Querying apps by using basic query
Querying apps by using advanced query·
Deploying or undeploying an app
Querying app licenses by using basic query
Querying app licenses by using advanced query
Activating or deactivating controllers by license
Managing licenses in the license library·
Viewing license deployment history
Viewing app deployment information
Deploying or undeploying an app
Setting the device label display mode
Viewing OpenFlow devices by controller
Switching topology layout modes
Viewing OpenFlow instances by controller
Setting the DPID and endpoint label display mode
Viewing the shortest path between two OpenFlow endpoints
Managing the OpenFlow virtual network
Viewing OpenFlow instance information·
Modifying an OpenFlow instance
Enabling or disabling ports for an OpenFlow instance
Controller Packet Loss Statistics Report
Controller Traffic Statistic Report
Group Traffic Statistic Report
OF Instance Traffic Statistic Report
Flow Table Traffic Statistic Report
Flow Entry Traffic Statistic Report
Controller Packet Loss Statistics Report
Controller Traffic Statistic Report
Group Traffic Statistic Report
OF Instance Traffic Statistic Report
Flow Table Traffic Statistic Report
Flow Entry Traffic Statistic Report
Today Controller Traffic Rate Chart
Today Tenant Traffic Rate Chart
VAN SDN Manager overview
Virtual Application Networking (VAN) is a network solution on virtualization, automation, and software-defined networks.
SDN is a new networking architecture that separates the control plane from the data plane of a network device. SDN is mainly implemented by using the OpenFlow technology.
SDNM is an IMC service component used to manage OpenFlow-based SDN.
OpenFlow
OpenFlow keeps the flow-based forwarding function. A non-OpenFlow switch matches five or seven tuples only, while an OpenFlow switch can match more tuples, including VLAN tag, MPLS tag, PBB tag, and so on.
To improve network resource usage, use the controller to create multiple OpenFlow instances on a single OpenFlow switch. Each instance operates as an independent virtual OpenFlow device. By creating and deploying flow entries to one or more virtual OpenFlow devices, the controller directly controls the packet forwarding to set up different forwarding paths for different network users.
The OpenFlow specification defines contents of the OpenFlow technology, including:
· OpenFlow switch components.
· OpenFlow ports.
· OpenFlow tables.
· OpenFlow channel.
· OpenFlow protocol.
The OpenFlow specification includes multiple versions; SDNM uses OpenFlow 1.3.1.
OpenFlow network
OpenFlow switch
An OpenFlow switch may be a physical switch or a virtual switch (vSwitch) that supports the OpenFlow protocol.
OpenFlow switches consist of two types:
· OpenFlow-only, which supports only OpenFlow operation.
· OpenFlow-hybrid, which supports both OpenFlow operation and Ethernet switching operations.
Controller
A controller is typically a dedicated Linux server on which controller applications are deployed. The controller controls various resources in the OpenFlow network and provides APIs for applications to control packets forwarding.
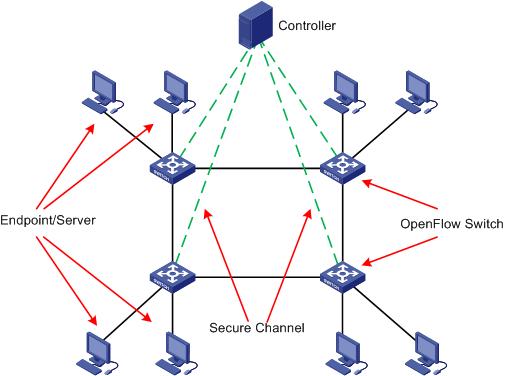
OpenFlow network
In an OpenFlow network, as shown in Figure 1, the controller directly controls the packet forwarding for OpenFlow switches. The control packets (defined by the OpenFlow protocol) between OpenFlow switches and controller are transmitted through a secure channel.
The controller provides centralized control on the data plane of OpenFlow switches through the OpenFlow protocol.
An OpenFlow switch can communicate with multiple controllers. The OpenFlow channel between the OpenFlow switch and each controller can have only one main connection.
An OpenFlow switch communicates with the controller through a secure channel; the connection must use TCP or SSL.
An OpenFlow switch forwards packets between endpoints and servers according forwarding rules deployed by the controller.
OpenFlow instance
For OpenFlow switches that support multiple OpenFlow instances, each OpenFlow instance is considered a separate logical OpenFlow switch and is identified by a unique DataPath ID (DPID).
For OpenFlow switches that do not support multiple OpenFlow instances, such as vSwitches, the OpenFlow switch itself is considered an OpenFlow instance and is identified by a unique DPID.
A DPID is 64 bits in length. By default, the lower 48-bits are for the MAC address of the network bridge of the device to which the OpenFlow instance belongs; the upper 16-bits are vendor-defined.
OpenFlow table
Each OpenFlow instance includes the following elements:
· One or more flow tables.
· One group table.
· One meter table.
For more information about the flow table, pipeline, meter, and group, see "Managing OpenFlow."
Flow table
Flow tables in an OpenFlow instance are identified by flow table IDs. An OpenFlow switch matches packets against one or more flow tables in the pipeline. Each flow table includes one or more flow entries.
A flow entry consists of the following fields:
![]()
For more information about the flow entry referenced in Figure 2, see version 1.3.1 of the Open Networking Foundation "OpenFlow Switch Specification" located at:
The field descriptions are as follows:
· Match Fields—Match fields contained in a flow entry.
· Priority—Priority of a flow entry. The larger this number, the higher the priority.
· Counters—Counter for a flow entry.
· Instructions—A set of instructions contained in a flow entry. When a packet matches the flow entry, the instructions are executed.
· Timeouts—Timeout time for a flow entry.
· Cookie—Cookie for a flow entry.
|
|
NOTE: One or more of the links above take you outside the Hewlett Packard Enterprise website. Hewlett Packard Enterprise does not control and is not responsible for information outside of the Hewlett Packard Enterprise website. |
Group table
Groups are used for multicasting and broadcasting. An OpenFlow instance has only one group table. The group table has zero or more group entries. Any flow entry can add an action that points to a group and to its instructions set, and executes the action bucket according to the group type.
A group entry consists of the following fields:
![]()
For more information about the group entry referenced in Figure 3, see version 1.3.1 of the Open Networking Foundation "OpenFlow Switch Specification" located at:
The field descriptions are as follows:
· Group ID—A unique identifier for a group.
· Group Type—Type of the group:
? All
? Indirect
? Select
? Fast Failover
· Counters—Counter for a group.
· Action Buckets—An ordered action bucket list for a group. Each action bucket contains a set of actions to be executed along with associated parameters. Algorithms performed for an action bucket vary with group types.
|
|
NOTE: One or more of the links above take you outside the Hewlett Packard Enterprise website. Hewlett Packard Enterprise does not control and is not responsible for information outside of the Hewlett Packard Enterprise website. |
Meter table
Meters are used for OpenFlow to support Quality of Service (QoS). An OpenFlow instance has only one meter table. A meter table has zero or more meter entries. Any flow entry can specify a meter in its instructions set; the meter measures and controls the rates of flows assigned to it.
A meter entry consists of the following fields:
![]()
For more information about the meter entry referenced in Figure 4, see version 1.3.1 of the Open Networking Foundation "OpenFlow Switch Specification" located at:
The field descriptions are as follows:
· Meter ID—A unique identifier for a meter.
· Meter Bands—An unordered meter band list. Each meter band specifies a flow rate and a processing mode.
· Counters—Counter for a meter.
|
|
NOTE: One or more of the links above take you outside the Hewlett Packard Enterprise website. Hewlett Packard Enterprise does not control and is not responsible for information outside of the Hewlett Packard Enterprise website. |
SDNM homepage
Figure 5 shows the SDNM homepage.
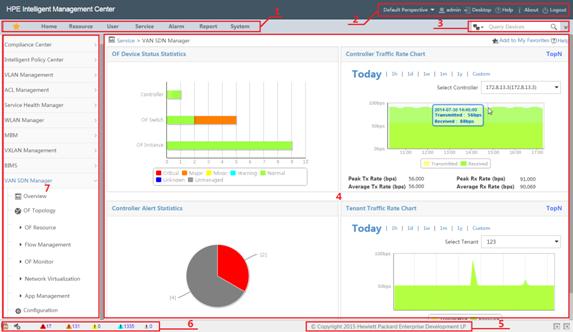
Table 1 describes the panes labeled in Figure 5.
Table 1 SDNM homepage introduction
|
Item |
Description |
|
1 |
Top navigation bar |
|
2 |
Help and logout toolbar |
|
3 |
Quick search bar |
|
4 |
Widgets |
|
5 |
Copyright notice |
|
6 |
Network health status bar |
|
7 |
Left navigation tree |
SDNM functions
SDNM enables you to manage an OpenFlow network through RESTful APIs provided by HP SDN controllers. Combined with the device management, reports, and homepage widgets function in the IMC platform, SDNM also provides visual management and monitoring on the OpenFlow network.
SDNM provides the following functions:
· Resource Management—Manages controllers, OpenFlow switches, and OpenFlow instances. For more information, see "Managing resources."
· OpenFlow Management—Manages elements that are involved in the forwarding process, including flow tables, flow entries, groups, meters, and service flows constituted by these elements. For more information, see "Managing OpenFlow."
· OpenFlow Monitoring—Manages alerts associated with OpenFlow. You can also test the service flows and analyze the failures that occur during the tests. For more information, see "Managing OpenFlow alerts and troubleshooting service flows."
· Network Virtualization—Manages virtual OpenFlow devices and tenants that rent virtual OpenFlow devices. Each OpenFlow instance can be considered a virtual OpenFlow device. A tenant rents different OpenFlow instances to forward traffic. For more information, see "Network virtualization."
· App management—Manages and monitors apps deployed on controllers, and manages apps and licenses added to SDNM. For more information, see "Managing apps."
· OpenFlow Topology—Displays the physical and logical architecture of the OpenFlow network in topology. You can also manage the OpenFlow network based on topology. For more information, see "Managing topologies."
· SDN Report—Collects statistics on running data about the OpenFlow network. SDN reports depend on the reporting function in the IMC platform. SDNM provides multiple report templates that you can use to generate real-time reports and schedule reports. For more information, see "Managing reports."
· SDN Widget—Displays the real-time data about the OpenFlow network. It depends on the homepage widgets function in the IMC platform. SDNM provides multiple widgets that you can customize in the SDNM homepage. For more information, see "SDNM widgets."
SDNM networking
As shown in Figure 6, make sure IMC communicates with the controllers and OpenFlow switches correctly.
SDNM is deployed and managed based on the IMC platform. IMC supports various deployment methods; you can choose one according to your network size. For more information about deploying IMC and its service components, see H3C IMC deployment guides.
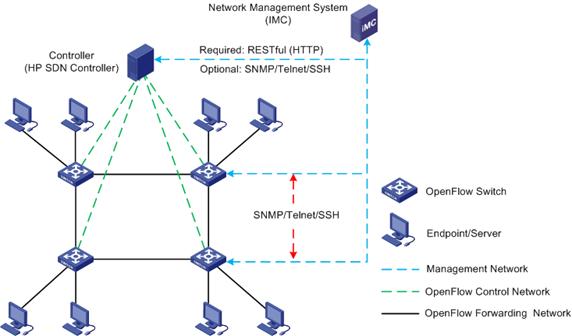
SDNM manages an OpenFlow network through RESTful interfaces provided by controllers. With SNMP, Telnet, or SSH enabled on controllers, you can monitor the performance of the controllers through the IMC Platform.
SDNM manages OpenFlow switches through SNMP, Telnet, or SSH. For the OpenFlow devices with these protocols enabled, you can not only monitor the device performance, but also create OpenFlow instances on the OpenFlow switches by using the network virtualization function of the SDNM.
Quick start
SDNM navigation menu
SDNM provides a breadcrumb navigation menu and a navigation tree. By default, the navigation tree is used.
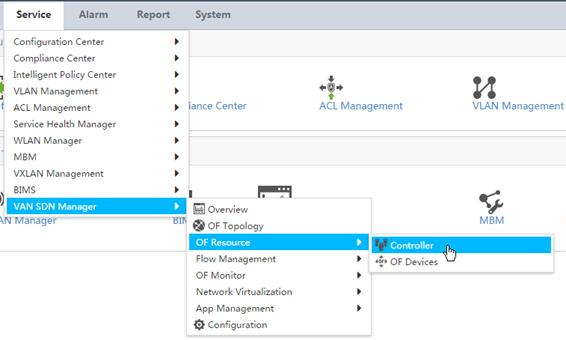
SDNM breadcrumb navigation menu
As shown in Figure 7, the breadcrumb navigation menu has three levels. Point to a menu item to display its submenus.
Figure 7 SDNM breadcrumb navigation menu
SDNM navigation tree
Figure 8 shows the navigation tree.
To access the SDNM navigation tree:
1. Click the Service tab on the top navigation bar.
2. From the left navigation tree, click VAN SDN Manager to expand the SDNM navigation menu.
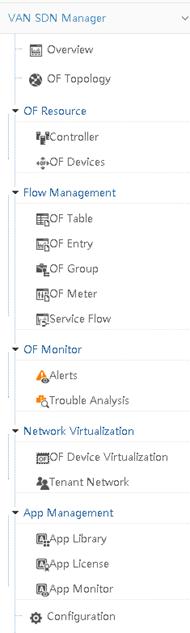
Table 2 SDNM navigation menu items
|
Navigation menu option |
Task |
|
Overview |
View the overview page for the statistics of services in SDNM. |
|
OF Topology |
View physical or logical topologies, add OpenFlow instances, and add service flows. |
|
OF Resource |
Navigate to the following OF resource pages: · Controllers—Manage controllers and their alert listeners. · OF Devices—Manage OpenFlow devices. OpenFlow devices include OpenFlow switches and OpenFlow instances. |
|
Flow Management |
Navigate to the following flow management pages: · OF Table—View and query flow tables. · OF Entry—View, query, add, modify, and delete flow entries. · OF Group—View, query, add, modify, and delete groups. · OF Meter—View, query, add, modify, and delete OpenFlow meters. · Service Flow—View, query, add, modify, and delete service flows. |
|
OF Monitor |
Navigate to the following OpenFlow monitor pages: · Alerts—View, query, acknowledge, recover, and delete OpenFlow alerts. · Trouble Analysis—View, query, and analyze troubles in an OpenFlow network. |
|
Network virtualization |
Navigate to the following network virtualization pages: · OF Device Virtualization—View, query, add, modify, and delete OpenFlow instances. An OpenFlow instances can be considered a virtual OpenFlow device. · Tenant Network—View, query, add, modify, and delete tenants. A tenant can rent one or more OpenFlow instances to forward traffic. |
|
App Management |
Navigate to the following app management pages: · App Library—Query, view, import, delete, and deploy apps on the SDNM. · App License—Query, view, import, delete, deploy, and activate app licenses. · App Monitor—Query, view, deploy, undeploy, enable, and disable apps on controllers. |
|
Configuration |
View the connection parameters configuration page for the controllers. |
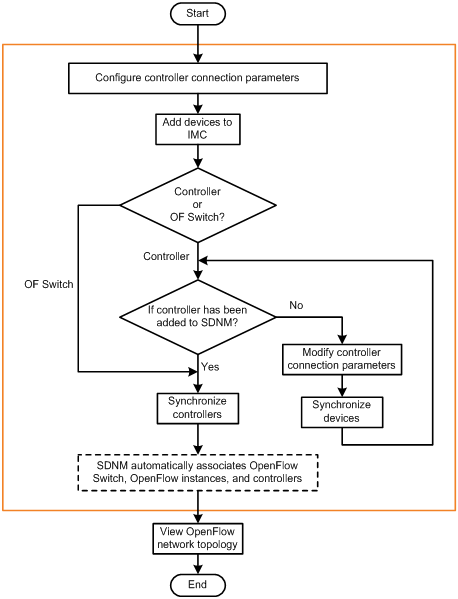
SDNM service flow
Service flows vary with OpenFlow network services. Figure 9 shows a typical flow for the OpenFlow network services that use OpenFlow topology.
Configuring controller connection parameters
By using SDNM, you can configure global connection parameters for controllers. IMC uses the configured connection parameters to connect to the controller and initiate an authentication when a controller is added to IMC. If IMC passes the authentication, the controller is identified as a controller by SDNM.
To configure controller connection parameters:
1. Click the Service tab.
2. From the navigation tree, select VAN SDN Manager > Configuration.
The configuration page appears.
3. Configure the following controller connection parameters:
? User Name—Enter the username authorized to access the RESTful interfaces. By default, the username is sdn.
? Password—Enter the password authorized to access the RESTful interfaces. By default, the password is skyline.
? Confirm Password—Enter the password again.
? Connection Protocol—Select the protocol used for SDNM to connect to the controller, including HTTP and HTTPS. By default, HTTPS is used.
? HTTP Port—Enter the authorized HTTP port number that RESTful interfaces can use. By default, the HTTP port number is 8080 and the HTTPS port number is 8443.
Adding devices to IMC
Add controllers and OpenFlow switches to IMC. If the SNMP, Telnet, or SSH protocol is enabled on the devices, the IMC Platform identifies the device type and device model.
For more information about adding devices to IMC, see H3C Intelligent Management Center v7.2 Enterprise and Standard Platform Administrator Guide.
For more information about enabling the SNMP, Telnet, or SSH protocol on devices, see configuration guides of corresponding devices.
Synchronizing devices
Checking the device type
After adding a controller to IMC, check whether the controller exists in the resource management module of SDNM. If the controller does not exist, modify the global connection parameters for controllers. For more information about modifying global connection parameters, see "Configuring controller connection parameters."
After adding an OpenFlow switch to IMC, synchronize all controllers that control the OpenFlow switch.
Synchronizing controllers
SDNM provides the following ways to synchronize controllers:
· Automatic—SDNM synchronizes controllers when it polls devices periodically. The default polling interval is 2 hours. For more information about modifying the polling interval, see H3C Intelligent Management Center Enterprise and Standard Platform Administrator Guide.
· Manual—SDNM can be manually triggered to synchronize controllers by using the SDNM resource management function.
To manually synchronize controllers:
1. Click the Service tab.
2. From the navigation tree, select VAN SDN Manager > OF Resource > Controller.
The Controller page appears.
3. In the controller list, select the controllers to be synchronized.
4. Click Synchronize.
In the controller list, the Last Sync Time and Sync Result columns display the time of the most recent synchronization and the synchronization result for each controller.
Associating OpenFlow switches, OpenFlow instances, and controllers
After the synchronization of controllers, SDNM obtains all OpenFlow switches and OpenFlow instances from the controllers and associates the OpenFlow switches, OpenFlow instances, and controllers as follows:
· An OpenFlow instance is associated with the OpenFlow switch that it belongs to.
· A controller is associated with the OpenFlow switches and OpenFlow instances that it controls.
· An OpenFlow Switch is associated with a network device that is added to IMC.
Viewing the OpenFlow network topology
After the OpenFlow switches, OpenFlow instances, and controllers are associated, you can view the following information about the OpenFlow network in the OpenFlow topology management page of SDNM:
· Physical topology of the OpenFlow network
· Logical topology of the OpenFlow network
· Status information about OpenFlow switches and OpenFlow instances
Viewing the Overview page
The overview page displays a variety of statistics about OpenFlow network services in pie charts, column charts, and lists.
Accessing the Overview page
1. Click the Service tab.
2. From the navigation tree, select VAN SDN Manager > Overview.
The overview page appears.
Viewing the OpenFlow device status statistics
OF Device Status Statistics displays the status of controllers, OpenFlow switches, and OpenFlow instances, as shown in Figure 10. Table 3 explains the color coding in Figure 10.
The horizontal axis represents the number of devices. The vertical axis represents the device names.
In this page, you can perform the following tasks:
· Point to a colored column to display the number of OpenFlow devices in that state.
· Click a colored column to display the list of OpenFlow devices in that status.
For more information about OpenFlow device status, see "Managing resources."
Figure 10 OpenFlow device status statistics
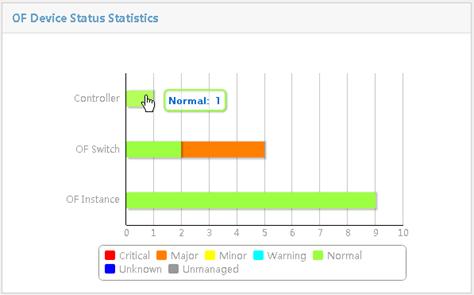
Table 3 Device status and colors
|
Status |
Icon |
Color |
|
Unmanaged |
|
Gray |
|
Unknown |
|
Blue |
|
Normal |
|
Green |
|
Warning |
|
Cyan |
|
Minor |
|
Yellow |
|
Major |
|
Orange |
|
Critical |
|
Red |
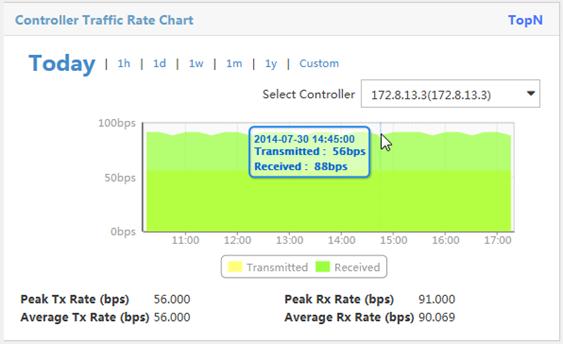
Viewing the controller traffic rate chart
By default, the Controller Traffic Rate Chart displays the receiving and transmitting rate trend of a controller with the highest traffic volume from 00:00:00 of the day to the current time. Figure 11 provides an example of the chart.
On the chart, you can perform the following tasks:
· Select a controller from the Select Controller list to display its rate trend.
· Click 1h, 1d, 1w, 1m, or 1y to view the rate trend of the controller in the corresponding time range.
· Click Custom, select a start time and end time in the calendar that appears, and then click Query to view the rate trend of the controller in the specified time range.
· Click the legend in the illustration to hide or display a rate trend area.
· Point to an edge of the transmitted or received area to view the rate at a specified time.
Figure 11 Controller traffic rate chart
Viewing today's top N controller traffic
Today's Top N Controller Traffic displays the top N controllers with the highest traffic volume from 00:00:00 of the day to the current time, as shown in Figure 12.
From the TopN list, select the number of controllers to display in the list. Options are:
· 5
· 10
· 20
· 50
· 100
Figure 12 Today's top N controller traffic
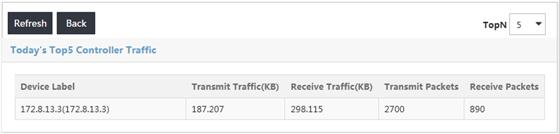
Today's Top N Controller Traffic list contents
· Device Label—Device label of the controller.
· Transmit Traffic—Traffic volume (in KB) transmitted by the controller from 00:00:00 of the day to the current time.
· Receive Traffic—Traffic volume (in KB) received by the controller from 00:00:00 of the day to the current time.
· Transmit Packets—Number of the packets transmitted by the controller from 00:00:00 of the day to the current time.
· Receive Packets—Number of the packets received by the controller from 00:00:00 of the day to the current time.
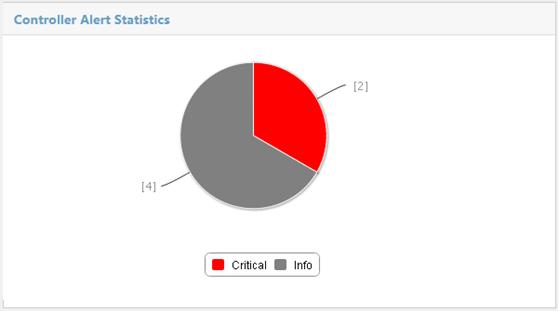
Viewing the controller alert statistics
Controller Alert Statistics displays the number of unrecovered controller alerts at different levels, as shown in Figure 13. Table 4 explains the color coding used in the Controller Alert Statistics pie chart.
Point to a slice of the pie chart to view the number of alerts at that level. Click a slice to view the list of alerts at that level.
Figure 13 Controller alert statistics
|
Status |
Icon |
Color |
|
Info |
|
Gray |
|
Warning |
|
Cyan |
|
Minor |
|
Yellow |
|
Major |
|
Orange |
|
Critical |
|
Red |
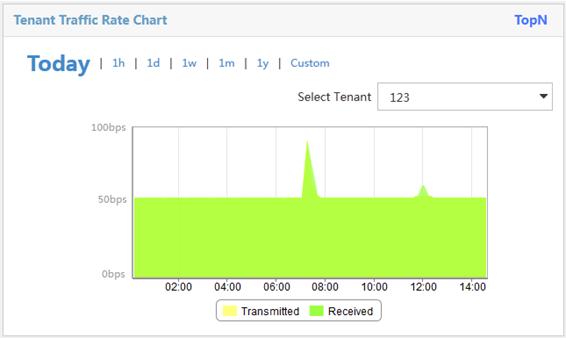
Viewing the tenant traffic rate chart
By default, the Tenant Traffic Rate Chart displays the receiving and transmitting rate trend of a tenant with the highest traffic volume from 00:00:00 of the day to the current time. Figure 14 provides an example of the chart.
On the chart, you can perform the following tasks:
· Select a tenant from the Select Tenant list to display its rate trend.
· Click 1h, 1d, 1w, 1m, or 1y to view the rate trend of the tenant in the corresponding time range.
· Click Custom, select a start time and end time in the calendar that appears, and click Query to view the rate trend of the tenant in the specified time range.
· Point to an edge of the transmitted or received area to view the rate at a specified time.
Figure 14 Tenant traffic rate chart
Viewing today's top N tenant traffic
Today's Top N Tenant Traffic displays the top N tenants with the highest traffic volume from 00:00:00 of the day to the current time, as shown in Figure 15.
From the TopN list, select the maximum number of tenants to display in the list. Options are:
· 5
· 10
· 20
· 50
· 100
Figure 15 Today's top N tenant traffic
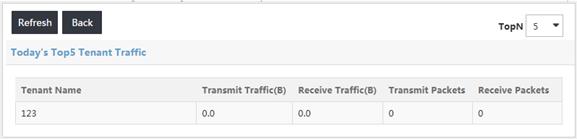
Today's top N Tenant Traffic list contents
· Tenant Name—Name of the tenant that rents virtual OF devices (OpenFlow instances).
· Transmit Traffic—Traffic volume (in KB) transmitted by the tenant from 00:00:00 of the day to the current time. It is the sum of the traffic volume transmitted by each virtual OF device rented by the tenant.
· Receive Traffic—Traffic volume received (in KB) by the tenant from 00:00:00 of the day to the current time. It is the sum of the traffic volume received by each virtual OF device rented by the tenant.
· Transmit Packets—Number of the packets transmitted by the tenant from 00:00:00 of the day to the current time. It is the sum of the packets transmitted by each virtual OF device rented by the tenant.
· Receive Packets—Number of the packets received by the tenant from 00:00:00 of the day to the current time. It is the sum of the packets received by each virtual OF device rented by the tenant.
For more information about tenants, see "Managing the tenant network."
Viewing today's top 5 service flows
Today Service Flow Traffic-Top5 displays the top five service flows with the highest traffic volume from 00:00:00 of the day to the current time, as shown in Figure 16.
Figure 16 Today's top 5 service flows
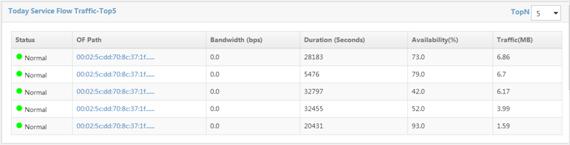
Today Service Flow Traffic-Top5 list contents
· Status—State of the service flow.
· OF Path—Path name of the service flow.
· Bandwidth—Bandwidth (in bps) of the service flow. A service flow consists of multiple flow entries. The bandwidth of the service flow is the bandwidth of the flow entry with the lowest rate.
· Duration—Duration (in seconds) of the service flow from 00:00:00 of the day to the current time. It is the sum of the duration of each flow entry of the service flow.
· Availability—Availability of the service flow from 00:00:00 of the day to the current time. It is equal to the service flow duration divided by the time from 00:00:00 of the day to the current time, and then multiplied by 100.
· Traffic—Traffic of the service flow from 00:00:00 of the day to the current time. It is equal to the minimum traffic forwarded by one of the flow entries that constitute the service flow.
Viewing today's top 5 flow entries
Today Entry Traffic-Top5 displays the top five flow entries with the highest traffic volume from 00:00:00 of the day to the current time, as shown in Figure 17.
Figure 17 Today's top 5 flow entries
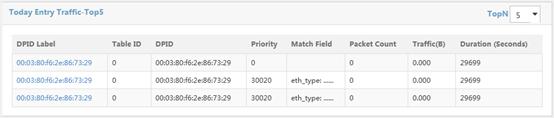
Today Entry Traffic-Top5 list contents
· DPID Label—DPID label of the OpenFlow instance to which the flow entry belongs.
· Table ID—Table ID of the flow table to which the flow entry belongs.
· DPID—DPID of the OpenFlow instance to which the flow entry belongs.
· Priority—Matching precedence of the flow entry.
· Match Field—Match fields of the flow entry.
· Packet Count—Number of the packets that match the flow entry from 00:00:00 of the day to the current time.
· Traffic—Traffic forwarded by the flow entry from 00:00:00 of the day to the current time.
· Duration—Duration of the flow entry from 00:00:00 of the day to the current time.
For more information about flow entries, see "Managing flow entries."
Common operations
Sorting a list
Sort a list by every field that contains a Sort icon ![]() in the column label.
in the column label.
· When the list is sorted by a field in ascending
order, the column label of the selected field is blue and contains an Ascending icon ![]() .
.
· When the list is sorted by a field in descending
order, the column label of the selected field is blue and contains a Descending icon ![]() .
.
Navigating a list
If a list contains enough entries, use the following aids to navigate the list:
· Click the Next Page
icon ![]() to page forward in
the list.
to page forward in
the list.
· Click the Last Page
icon ![]() to page forward to
the end of the list.
to page forward to
the end of the list.
· Click the Previous Page
icon ![]() to page backward in
the list.
to page backward in
the list.
· Click the First Page
icon ![]() to page backward to
the front of the list.
to page backward to
the front of the list.
· Click a page number to display the page in the list.
· Select 8, 15, 50, 100, or 200 at the bottom of the list to configure how many items per page to display.
Selecting devices
When adding a flow entry, group, or meter, select virtual OpenFlow devices to which the flow entry, group, or meter is deployed. For more information about adding groups and meter, see "Managing OpenFlow."
Accessing the page for selecting devices
1. Access the Add OF Entry page.
2. In the Select Device area, click Add.
The page for selecting devices appears. On this page, you can filter devices by view or advanced query.
Filtering devices
1. In the Query area, specify one or more of the following query criteria:
? Device Label—Enter a complete or partial device label of the OpenFlow instance.
? DPID—Enter a complete or partial DPID of the OpenFlow instance.
? Device Status—Select the device status of the OpenFlow instance you want to search for. Options are:
- Unknown
- Unmanaged
- Normal
- Warning
- Minor
- Major
- Critical
- Unlimited
? Controller—Select a controller connected to the OpenFlow instance from the list. Unlimited can also be selected.
Empty fields are ignored.
2. Click Query.
All matching OpenFlow instances are displayed in the device list. To reset the query criteria to default value, click Reset.
Selecting devices
1. In the device list, select OpenFlow instances to receive flow entries.
Device list contents
? Device status—Device state of the OpenFlow instance.
? Device Label—Device label of the OpenFlow instance.
? DPID—DPID of the OpenFlow instance.
? IP Address—IP address of the OpenFlow switch to which the OpenFlow instance belongs.
? Controller—Controller connected to the OpenFlow instance.
2. Click OK.
To remove a device, click the Delete icon ![]() for the device.
for the device.
Managing resources
An OpenFlow network has the following resources:
· Controller—Typically a Linux server that has the controller application deployed. It controls forwarding of OpenFlow switches and provides ports for applications to send packets.
· OpenFlow switch—A physical switch or a virtual switch running the OpenFlow protocol. An OpenFlow switch can include one or more OpenFlow instances and forward OpenFlow traffic for the instances at the physical network layer.
· OpenFlow instance—A virtual instance that is created on an OpenFlow switch. It operates as a separate OpenFlow switch, includes its own flow, group, and meter tables, and forwards OpenFlow traffic at the logical network layer.
SDNM resource management provides the following functions:
· Controller management—Manages all controllers on the OpenFlow network.
· OpenFlow management—Manages all OpenFlow switches and OpenFlow instances on the OpenFlow network.
Managing controllers
SDNM provides the following functions:
· Query, view, and synchronize controllers.
· Manage the alert listener functions of the controllers.
Applications register alert listeners with controllers for indicating interested OpenFlow alerts. When an OpenFlow alert is generated or received, a controller sends it only to the applications that concern this alert, according to the alert listeners.
Viewing the controller list
1. Click the Service tab.
2. From the navigation tree, select VAN SDN Manager > OF Resource > Controller.
Controller list contents
? Device Status—Status of the controller:
- Critical
- Major
- Minor
- Warning
- Normal
- Unknown
- Unmanaged
? Device Label—Device label of
the controller. Click the label to view detailed information about the
controller. If the controller is operating in team mode, this field includes a Team icon ![]() .
.
? Model—Device model of the controller.
? IP Address—Management IP address of the controller.
? OF Instances—Number of OpenFlow instances connected to the controller. Click the link to view the list of OpenFlow instances.
? Version—Version of the controller application.
? Last Sync Time—Time when the controller was most recently synchronized.
? Sync Result—Result of the most recent synchronization.
? Operation—Click the Operation icon ![]() to
display the Operation menu of the controller.
to
display the Operation menu of the controller.
The menu includes the following options:
- Add OF Instance—Access the VAN SDN Manager > OF Device Virtualization > Add OF Instance page, through which an OpenFlow instance can be added to connect to this controller. For more information about adding OpenFlow instances, see "Adding virtual OpenFlow devices."
- Configuration Info—View configurations of the components on the controller.
- Alert Listener Manager—Manage alert listeners on the controller, including query, add, modify, and delete an alert listener.
- App Info—View information about applications deployed on the controller, including the application name and application status.
- Ping—Ping the controller from the local host.
- TraceRoute—Execute the tracert command on the controller from the local host.
- Open Web Manager—Open the Web Manager page of the controller.
- Telnet—Telnet to the controller from the local host.
The Ping, TraceRoute, Open Web Manager, and Telnet functions are provided by the IMC Platform. For more information about using these functions, see H3C Intelligent Management Center Enterprise and Standard Platform Administrator Guide.
Querying controllers by using a basic query
1. Access the controller list page.
2. In the query box on the top right of the controller list area, enter a partial or complete device label of the controller.
3. Click the Query icon ![]() .
.
The controller list displays all controllers that match the query criterion.
Querying controllers by using an advanced query
1. Access the controller list page.
2. Click the Advanced icon ![]() to the top right of the
controller list area to expand the query area.
to the top right of the
controller list area to expand the query area.
3. Specify one or more of the following query criteria:
? Device Label—Enter a partial or complete device label of the controller.
? IP Address—Enter a partial or complete IP address of the controller.
? Device Status—Select the controller state.
Empty fields are ignored.
4. Click Query.
The controller list displays all controllers that match the query criteria.
5. Click Reset to restore the default values of all query criteria and display all controllers in the list.
Synchronizing controllers
SDNM provides the synchronization function to obtain the latest information about all OpenFlow switches and OpenFlow instances from each controller.
SDNM supports the following types of synchronization:
· Automatic—Synchronization is triggered by regular polling of IMC. By default, the synchronization interval is 2 hours. For more information about configuring the synchronization interval for automatic synchronization, see H3C Intelligent Management Center Enterprise and Standard Platform Administrator Guide.
· Manual—Synchronization is manually triggered by an operator at any time.
To synchronize controllers manually:
a. Select one or more controllers to be synchronized on the controller list.
b. Click Synchronize.
c. Click Refresh to view the synchronization results.
Creating a controller team
After you create a controller team, add the team to IMC.
To create a controller team:
1. Access the controller list page.
2. Click Create Team.
The Create Team page appears.
3. In the Select Device area, configure member controllers for the team:
a. Click Add.
The Select Device page appears.
b. Select at least three controllers.
You can quickly locate controllers by querying controllers in the Query area.
c. Click OK to return to the Create Team page.
To delete a member controller from the list,
click the delete icon ![]() for the controller.
for the controller.
To delete all member controllers, click Delete All.
4. In the Team IP field, enter an IP address that is in the same network segment as those of the member controllers.
5. Click OK.
|
|
NOTE: This function supports only HP Controller 2.3 and later versions. For the other controllers, create controller teams by logging in to controllers. |
Managing a controller on the controller details page
The detailed information about a controller includes common device information and SDNM-specific information.
The common device information is obtained, managed, and maintained by the IMC Platform. For more information, see H3C Intelligent Management Center Enterprise and Standard Platform Administrator Guide. This section describes SDNM-specific information only.
Accessing the controller details page
You can access the detailed information page of a controller through one of the following methods:
· Controller list
a. Click the Service tab.
b. From the navigation tree, select VAN SDN Manager > OF Resource > Controller.
c. Click the device label for a controller.
· OpenFlow topology
a. Click the Service tab.
b. From the navigation tree, select VAN SDN Manager > OF Topology. By default, the Overall Topology page appears.
c. Right-click a controller and select Device Information from the shortcut menu.
As shown in Figure 18, SDNM-specific information includes the SDN Info tab and the SDN Management menu.
Figure 18 Detailed information about a controller
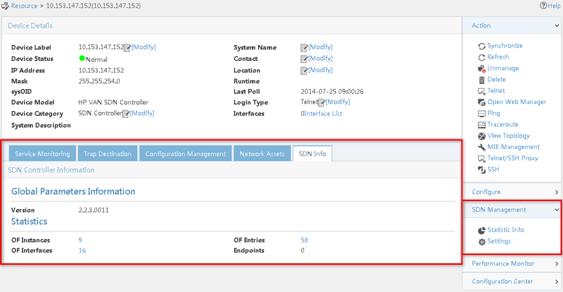
Viewing SDN controller information
The SDN Info tab displays the following SDN controller information:
· Global Parameters Information
? ARP Aging Time (Minutes)—ARP aging time configured on the controller, in minutes.
? Flow Mod Idle Timeout (Seconds)—Flow idle timeout configured on the controller, in seconds.
? Version—Version number of the controller.
· Team (OF Team)
The Team (OF Team) area appears only when the controller is operating in team mode. For more information about configuring a controller to operate in team mode, see the controller's configuration guide.
? Status—Status of the controller in the OpenFlow team.
? Role—Role of the controller in the OpenFlow team: Master or Member.
? IP Address—IP address of the controller in the OpenFlow team.
? Version—Software version of the controller in the OpenFlow team.
· Statistics
? OF Instances—Number of OpenFlow instances managed by the controller. Click the link to view the OpenFlow instance list.
? OF Entries—Number of flow entries managed by the controller. Click the link to view the OpenFlow entry list.
? OF Interfaces—Number of OpenFlow interfaces managed by the controller. Click the link to view the OpenFlow port list.
? Endpoints—Number of endpoints that are connected to the OpenFlow instances managed by the controller.
Modifying global parameters of the controller
1. On the controller details page, select Settings from the SDN Management menu.
2. In the Global Parameters Configuration area, modify the following parameters:
? ARP Aging Time (Minutes)—Modify the ARP aging time in minutes.
? Flow Mod Idle Timeout (Seconds)—Modify the flow idle timeout in seconds.
3. Click OK in this area.
4. Click Back to go back to the controller details page.
To view the current and default settings of global parameters, see "Viewing controller configurations."
|
|
NOTE: When the controller does not support modifying the ARP Aging Time and Flow Mod Idle Timeout parameters, SDNM does not display the Global Parameters Configuration area and the SDN Info tab on the controller details page does not display the ARP Aging Time and Flow Mod Idle Timeout parameters. |
Viewing OpenFlow instances managed by the controller
1. On the SDN Info tab, click the numeral next to the OF Instances field.
The OpenFlow instance list displays all OpenFlow instances managed by the controller.
OpenFlow instance list contents
? Device Status—Status of the OpenFlow instance.
? DPID Label—Device label of the OpenFlow instance.
? DPID—DPID of the OpenFlow instance.
? IP Address—IP address of the OpenFlow switch to which the OpenFlow instance belongs.
? Controller—Device label of the controller.
? OF Ports—Number of OpenFlow ports in the OpenFlow instance.
? Flow Entries—Number of flow entries in the OpenFlow instance.
? Endpoint—Number of endpoints connected to the OpenFlow instance.
2. Click Close.
Viewing the flow list managed by the controller
1. On the SDN Info tab, click the numeral next to the OF Entries field.
The OpenFlow entry list displays all OpenFlow entries managed by the controller.
OpenFlow entry list contents
? Table ID—ID of the flow table to which the flow entry belongs.
? Match Field—Packet field that the flow entry matches.
? Priority—Priority of the flow entry.
? Hard Timeout—Hard timeout of the flow entry. When the timeout expires, the OpenFlow entry is deleted from the OpenFlow instance, whether or not it matches a data flow.
? Idle Timeout—Idle timeout of the flow entry. When the timeout expires, the OpenFlow entry is deleted from the OpenFlow instance if it does not match any data flows.
? DPID—DPID of the OpenFlow instance to which the OpenFlow entry is deployed.
? Creation Time—Time when the OpenFlow entry was created.
2. Click Close.
Viewing OpenFlow ports managed by the controller
1. On the SDN Info tab, click the numeral next to the OF Interfaces field.
The OpenFlow port list displays all OpenFlow ports managed by the controller.
OpenFlow port list contents
? Port Index—Index of the OpenFlow port. The value is decided by the OpenFlow switch that is managed by the controller.
? Port Name—Name of the port. Ports with names beginning with OFPP represent reserved ports that are defined by the OpenFlow standard.
? MAC Address—MAC address of the OpenFlow port.
? DPID—DPID of the OpenFlow instance to which the port belongs.
? Port Status—Status of the OpenFlow port: link_down, live, or blocked.
? Current Speed (bps)—Current speed of the OpenFlow port, in bps.
? Max Speed (bps)—Maximum speed of the OpenFlow port, in bps.
2. Click Close.
Viewing endpoints managed by the controller
1. On the SDN Info tab, click the numeral next to the Endpoints field.
The endpoint list displays all endpoints discovered by the controller.
Endpoint list contents
? IP Address—IP address of the endpoint.
? MAC Address—MAC address of the endpoint.
? Port Index—Index of the OpenFlow port to which the endpoint is connected. You can view the port and port index in the OpenFlow port list.
? DPID—DPID of the OpenFlow instance that forwards traffic for the endpoint.
? Discovery Time—Time when the controller discovered the endpoint.
2. Click Close.
Modifying connection parameters of the controller
When the connection parameters are changed on a controller, modify its parameters in SDNM accordingly. Otherwise, SDNM cannot manage the controller.
To modify connection parameters of the controller:
1. On the controller details page, select Settings from the SDN Management menu.
2. In the Connection Parameters Configuration area, configure the following parameters:
? User Name—Enter the username to access the RESTful interface of the controller.
? Password/Confirm Password—Enter and confirm the password to access the RESTful interface of the controller. The two passwords must be identical.
? Connection Protocol—Select the protocol that SDNM uses to connect to the controller, including HTTP and HTTPS.
? Port—Enter the port to access the RESTful interface of the controller. The default values for protocols HTTP and HTTPS are 8080 and 8443, respectively.
3. Click OK in this area.
4. Click Back to return to the controller details page.
Viewing statistics of the controller
Use this function to view the controller's traffic rate for today and unrecovered alert statistics.
To view controller statistics:
1. In the SDN Management menu, select Statistic Info.
The page displays the following information:
? Controller Traffic Rate of Today—Variation trend of flow rate received and sent by the controller today.
? Unrecovered Alert Statistics—Unrecovered alerts. SDNM classifies alerts by alarm levels.
2. Click Close.
Viewing controller configurations
Use this function to view the components and component configurations for a controller.
To view controller configurations:
1. In the controller list, click the Operation icon ![]() for
a controller and select Configuration
Info.
for
a controller and select Configuration
Info.
The Configuration Info page appears, as shown in Figure 19. This page contains the following parameters:
? Component Name—Name of the component.
? Package Name—Name of the program package for the component.
? Configuration Item Name—Includes a Details icon ![]() . Point to the icon to view the names of all configuration items the component includes.
. Point to the icon to view the names of all configuration items the component includes.
? Current Value—Includes a Details icon ![]() . Point
to the icon to view the current values of all configuration items the component
includes.
. Point
to the icon to view the current values of all configuration items the component
includes.
? Default Value—Includes a Details icon ![]() . Point
to the icon to view the default values of all configuration items the component
includes.
. Point
to the icon to view the default values of all configuration items the component
includes.
? Description—Includes a Details icon ![]() . Point
to the icon to view the descriptions of all configuration items the component includes.
. Point
to the icon to view the descriptions of all configuration items the component includes.
2. Click the Expand
icon ![]() for a component to expand the list of all configuration items included in
the component.
for a component to expand the list of all configuration items included in
the component.
Figure 19 Controller configuration information
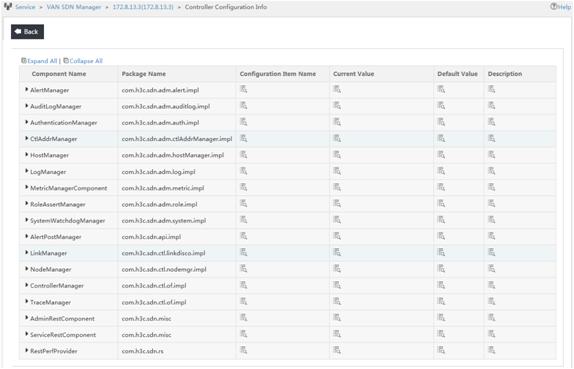
|
|
NOTE: The components vary with the model and version of SDN controllers. |
Viewing a controller's alert listener list
The alert listener list displays all alert listeners of a controller, including alert listeners registered with SDNM.
To view a controller's alert listener list:
1. Click the Service tab.
2. From the navigation tree, select VAN SDN Manager > OF Resource > Controller.
3. On the page that appears, click the Operation icon ![]() for a controller and
select Alert Listener Manager.
for a controller and
select Alert Listener Manager.
Alert listener list contents
? APP ID—ID of the SDN application with registered alert listener.
? Name—Name of the alert listener. The name also includes the IP address of the SDN application.
? URI—URI the SDN application used to register with the controller. The controller sends OpenFlow alerts to this URI. The URI includes the IP address of the SDN application.
? Modify—Click the Modify icon ![]() to modify
the alert listener.
to modify
the alert listener.
? Delete—Click the Delete icon ![]() to delete
the alert listener.
to delete
the alert listener.
Querying alert listeners
1. Access a controller's alert listener list page.
2. In the query box on the top right corner of the alert listener list area, enter a partial or a complete name of the alert listener.
3. Click the Query icon ![]() .
.
The alert listener list displays all alert listeners that match the criterion.
Adding an alert listener to a controller
1. Access a controller's alert listener list page.
2. In the alert listener list, click Add.
3. On the page that appears, configure the following parameters:
? IP Address—Enter the IP address of SDNM.
? Port—Enter the number of the port that SDNM uses to receive OpenFlow alerts.
4. Select an alert topic. When an alert is generated, the controller checks the alert topic and sends it to the SDN applications that concern this topic. For more information about alert topics, see HPE VAN SDN Controller 2.2 Administrator Guide.
5. Click OK.
Modifying an alert listener
The alert topic of an alert listener can be modified. The SDNM IP address and port in the alert listener cannot be modified.
To modify an alert listener:
1. Access a controller's alert listener list page.
2. In the alert listener list, click the Modify icon ![]() for an alert listener.
for an alert listener.
3. On the page that appears, select the topic to be modified. When an alert is generated, the controller checks the alert topic and sends it to the SDN applications that concern this topic.
4. Click OK.
Deleting alert listeners
Delete alert listeners individually or in batches.
Deleting a single alert listener
1. Access a controller's alert listener list page.
2. In the alert listeners list, click the Delete icon ![]() for an alert listener.
for an alert listener.
A confirmation dialog box appears.
3. Click OK.
Deleting alert listeners in batches
1. Access a controller's alert listener list page.
2. In the alert listeners list, select one or more alert listeners.
3. Click Delete.
A confirmation dialog box appears.
4. Click OK.
Managing OpenFlow instances
SDNM provides multiple functions to manage OpenFlow instances, including viewing, querying, adding, modifying, and deleting an OpenFlow instance. An OpenFlow instance is a virtual OpenFlow device.
For more information about adding and modifying a virtual OpenFlow device, see "Managing virtual OpenFlow devices."
Viewing the OpenFlow instance list
OpenFlow instances in the OpenFlow instance list come from the following resources:
· Virtual OpenFlow devices that are synchronized from the controllers in SDNM.
· OpenFlow instances that are created by SDNM operators.
To view the OpenFlow instance list:
1. Click the Service tab.
2. From the navigation tree, select VAN SDN Manager > OF Resource > OF Devices.
By default, the OF Instance page appears.
OpenFlow instance list contents
? Status—Status of the OpenFlow instance:
- Critical
- Major
- Minor
- Warning
- Normal
- Unknown
- Unmanaged
? OF Switch—Device label of the OpenFlow switch to which the OpenFlow instance belongs. Click the device label to view detailed information about the OpenFlow switch.
? DPID Label—DPID label of the OpenFlow instance:
- If the OpenFlow instance is synchronized from a controller, this field is the same as the DPID of the OpenFlow instance.
- If the OpenFlow instance is created by an operator, this field displays the device label that is configured by the operator.
Click the DPID label to view detailed information about the OpenFlow instance.
? DPID—DPID that uniquely identifies the OpenFlow instance.
? IP Address—IP address of the OpenFlow switch to which the OpenFlow instance belongs.
? Controller—Controller to which the OpenFlow instance is connected.
? OF Ports—Number of ports the OpenFlow switch assigns to the OpenFlow instance.
Click the link to view the OF Port List. For more information about enabling interfaces of an OpenFlow instance, see "Enabling or disabling ports for an OpenFlow instance."
The OpenFlow port list includes the following parameters:
- Port Index—Index of the OpenFlow port to which the endpoint is connected. You can view the port and port index in the OpenFlow port list.
- Port Name—Name of the port. Ports with names beginning with OFPP represent reserved ports that are defined by the OpenFlow standard.
- MAC Address—MAC address of the OpenFlow port.
- Port Status—Status of the OpenFlow port.
- Current Speed (bps)—Current speed of the OpenFlow port, in bps.
- Max Speed (bps)—Maximum speed of the OpenFlow port, in bps.
? Flow Entries—Total number of flow entries in the OpenFlow instance.
Click the link to view the list of flow entries in the OpenFlow instance. For more information, see "Viewing the OpenFlow instance list."
? Endpoints—Number of endpoints to which the OpenFlow instance is connected. Click the link to display the endpoint list page. The endpoint list includes the following parameters:
- IP Address—IP address of the endpoint.
- MAC Address—MAC address of the endpoint.
- Port Index—Index of the OpenFlow port to which the endpoint is connected. You can view the port by index in the OpenFlow port list.
- DPID—DPID of the OpenFlow instance that forwards traffic for the endpoint.
- Discovery Time—Time when the OpenFlow instance discovered this endpoint.
? Operation—Click the Operation icon ![]() to display the Operation menu of the controller.
to display the Operation menu of the controller.
The menu includes the following options:
- Delete—Delete the OpenFlow instance.
- View OF Table—Enter the flow table management page to view flow tables in the OpenFlow instance.
- View OF Group—Enter the group management page to view groups in the OpenFlow instance.
- View OF Meter—Enter the meter management page to view meters in the OpenFlow instance. For more information about meters, see "Managing meters."
Querying OpenFlow instances by using a basic query
1. Access the OpenFlow instance list page.
2. In the query box on the top right corner of the OpenFlow instance list area, enter a partial or a complete DPID label of the OpenFlow instance.
3. Click the Query icon ![]() .
.
The OpenFlow instance list displays all OpenFlow instances that match the criterion.
Querying OpenFlow instances by using an advanced query
1. Access the OpenFlow instance list page.
2. Click the Advanced
icon ![]() to the top right of
the OpenFlow instance list area to expand the query
area.
to the top right of
the OpenFlow instance list area to expand the query
area.
3. Specify one or more of the following query criteria:
? DPID Label—Enter a partial or complete DPID label of the OpenFlow instance.
? DPID—Enter a partial or complete DPID of the OpenFlow instance.
? IP Address—Enter a partial or complete IP address of the OpenFlow switch to which the OpenFlow instance belongs.
? Device Status—Select the OpenFlow instance status:
- Critical
- Major
- Minor
- Warning
- Normal
- Unmanaged
- Unknown
- Unlimited
? Controller—Select the controller to which the OpenFlow instance is connected.
Empty fields are ignored.
4. Click Query.
The OpenFlow instance list displays all OpenFlow instances that match the criteria.
5. Click Reset to restore the default values of all query criteria and display all OpenFlow instances in the list.
Synchronizing OpenFlow instances
SDNM provides the synchronization function to obtain latest information about all OpenFlow switches and OpenFlow instances from each controller.
To synchronize OpenFlow instances:
1. Select one or more OpenFlow instances to be synchronized on the OpenFlow instance list.
2. Click Synchronize.
3. Click Refresh to view the synchronization result.
Managing an OpenFlow instance on the OpenFlow instance details page
The details page contains the following information about an OpenFlow instance:
· Device Details
· Flow Table
· OF Port List
· Statistics
· Open Flow Features
· Open Flow Meter Features
· Open Flow Group Features
Accessing the OpenFlow instance details page
Access detailed information page of an OpenFlow instance through one of the following methods:
· OpenFlow instance list
a. Click the Service tab.
b. From the navigation tree, select VAN SDN Manager > OF Resource > OF Devices. By default the OF Instance page appears.
c. Click the DPID label for a device.
· OpenFlow topology
a. Click the Service tab.
b. From the navigation tree, select VAN SDN Manager > OF Topology. By default, the Overall Topology page appears.
c. Double-click an OpenFlow switch to view all OpenFlow instances of the device.
d. Right-click an OpenFlow instance and select View OF Instance Information from the shortcut menu.
· Logic topology
a. Click the Service tab.
b. From the navigation tree, select VAN SDN Manager > OF Topology. By default, the Overall Topology page appears.
c. Click the Logical Topology tab.
d. Right-click an OpenFlow instance and select View OF Instance Information from the shortcut menu.
· Virtual OpenFlow devices list
a. Click the Service tab.
b. From the navigation tree, select VAN SDN Manager > Network Virtualization > OF Device Virtualization.
c. On the page that appears, click the DPID label of a device.
Device details of an OpenFlow instance
· DPID Label—DPID label of the OpenFlow instance. Click Modify to modify the DPID label of the instance.
· OF Switch—Device label of the OpenFlow switch to which the OpenFlow instance is located. Click the device label to view detailed information about the OpenFlow switch.
· Device Status—Status of the OpenFlow instance.
· Connected Since—Time when the OpenFlow instance established a connection with the controller.
· DPID—DPID that uniquely identifies the OpenFlow instance.
· Last Polling Time— Time when the OpenFlow instance was most recently synchronized.
· IP Address—IP address of the OpenFlow switch to which the OpenFlow instance is located.
· Controller—Controller to which the OpenFlow instance is connected.
· Endpoints—Number of endpoints connected to the OpenFlow instance.
· Negotiated Version—Version of the OpenFlow standard that the OpenFlow instance matches.
· Member VLAN/VLAN Mask—Determines the range of VLANs on which the OpenFlow instance takes effect.
· In-Band Management VLAN—In-band management VLAN of the OpenFlow instance. In this VLAN, the OpenFlow instance is connected to the controller.
· Description—Description of the OpenFlow instance.
Flow table items of an OpenFlow instance
· Table ID—ID of the flow table. The flow table with an ID of 0 is the default flow table that was created along with the OpenFlow instance.
· OF Entry—Number of OpenFlow entries. Click the link to view detailed information about OpenFlow entries in the flow table.
OF port list of an OpenFlow instance
· Port Index—Index of the OpenFlow port. The value is decided by the OpenFlow switch to which the OpenFlow instance belongs.
· Port Name—Name of the OpenFlow port. Ports with names beginning with OFPP represent reserved ports that are defined by the OpenFlow standard.
· MAC Address—MAC address of the OpenFlow port.
· Port Status—Status of the OpenFlow port.
· Current Speed (bps)—Current speed of the OpenFlow port, in bps.
· Max Speed (bps)—Maximum speed of the OpenFlow port, in bps.
Statistics of an OpenFlow instance
· OF Group—Number of groups in the OpenFlow instance. Click the link to view detailed information about all groups. For more information, see "Viewing the group list."
· OF Meter—Number of meters in the OpenFlow instance. Click the link to view detailed information about all meters. For more information, see "Viewing the meter list."
OpenFlow features of an OpenFlow instance
· Max Buffered Packets—Maximum number of packets that the OpenFlow instance can buffer before it sends them to the controller.
· Supported Flow Tables—Maximum number of flow tables the OpenFlow instance supports.
· Traffic Object Statistics—Whether or not the OpenFlow instance supports traffic object statistics.
· Flow Table Statistics—Whether or not the OpenFlow instance supports flow table statistics.
· Port Statistics—Whether or not the OpenFlow instance supports port statistics.
· Group Statistics—Whether or not the OpenFlow instance supports group statistics.
· Queue Statistics—Whether or not the OpenFlow instance supports queue statistics.
OpenFlow meter features of an OpenFlow instance
· Max Meters—Maximum number of meters the OpenFlow instance supports.
· Types—Band types the OpenFlow instance supports.
· Flags—Meter flags the OpenFlow instance supports.
· Max Bands per Meter—Maximum number of bands that each meter supports in the OpenFlow instance. Meters enable OpenFlow devices to support QoS.
· Max Color Value—Maximum number of colors the OpenFlow instance supports. Colors are used for the coloring-algorithm of QoS.
OpenFlow group features of an OpenFlow instance
· Types—Group types the OpenFlow instance supports.
· Capabilities—Group capabilities the OpenFlow instance supports.
· Max Groups—Maximum number of groups the OpenFlow instance supports for each group type.
· Actions—Actions supported by the bucket in the group.
Deleting an OpenFlow instance
In SDNM, only one OpenFlow instance can be deleted at a time. To delete OpenFlow instances in batches, see "Deleting virtual OpenFlow devices." Virtual OpenFlow devices are the same as OpenFlow instances.
To delete an OpenFlow instance:
1. Access the OpenFlow instance list page.
2. In the OpenFlow instance list, click the Operation icon ![]() for an OpenFlow
instance and select Delete.
for an OpenFlow
instance and select Delete.
A confirmation dialog box appears.
3. Click OK.
Managing OpenFlow switches
SDNM allows you to manage OpenFlow switches and their controller configurations.
Before you can manage an OpenFlow switch in SDNM, you must complete the following tasks:
1. Configure SNMP and Telnet/SSH parameters on the OpenFlow switch. For more information, see the configuration guide for the switch.
2. Add the OpenFlow switch to IMC manually or through the auto-discovery function of the IMC Platform. For more information, see H3C Intelligent Management Center Enterprise and Standard Platform Administrator Guide.
SDNM checks whether the new device supports OpenFlow features. If the device supports OpenFlow features, SDNM displays the device on the VAN SDN Manager > OF Resource > Controller page. View SDN service information for the OpenFlow switch from the device details page.
The following information describes how to view and query OpenFlow switches. For information about adding, modifying, or deleting OpenFlow switches in IMC, see H3C Intelligent Management Center Enterprise and Standard Platform Administrator Guide.
Viewing the OpenFlow switch list
1. Click the Service tab.
2. From the navigation tree, select VAN SDN Manager > OF Resource > OF Devices. By default, the OF Instance page appears.
3. Click the OF Switch tab.
OpenFlow switch list contents
? Device Status—Status of the OpenFlow switch:
- Critical
- Major
- Minor
- Warning
- Normal
- Unmanaged
- Unknown
? Device Label—Device label of the OpenFlow switch. Click the device label to view detailed device information.
? OF Instances—Number of OpenFlow instances included in the OpenFlow switch. Click the numeral next to the OF Instance field to view all OpenFlow instances on the OpenFlow switch.
? Model—Model of the OpenFlow switch.
? IP Address—IP address of the OpenFlow switch.
? Interfaces—Number of interfaces on all OpenFlow instances that are assigned by the OpenFlow switch. Click the numeral next to the Interfaces field to view the interface list.
The interface list contains the following parameters:
- Interface Status—Status of the interface: Up or Down.
- Interface—Index of the interface, the unique identifier of the interface assigned by the OpenFlow switch.
- Interface Type—Type of the interface, such as ETHERNETCSMACD.
- Interface Description—Description of the interface, such as Ten-GigabitEthernet2/0/1.
- MAC Address—MAC address of the OpenFlow interface.
- Speed (bps)—Rate of the OpenFlow interface in bps.
? Operation—Click the Operation icon ![]() to
display the Operation menu of the controller.
to
display the Operation menu of the controller.
The menu includes the following options:
- Add OF Instance—Add new OpenFlow instances to the OpenFlow switch. For more information about how to add new OpenFlow instances, see "Adding virtual OpenFlow devices."
- Controller Setting—Manage controller settings, including querying, adding, modifying, and deleting controllers.
- Ping—Ping the OpenFlow switch from the SDNM server.
- TraceRoute—Execute the tracert command from the SDNM server.
- Open Web Manager—Access the Web manager of the OpenFlow switch locally.
- Telnet—Telnet the OpenFlow switch from the local host.
Querying OpenFlow switches by using a basic query
1. Access the OpenFlow switch list page.
2. In the query box on the top right corner of the OpenFlow switch list area, enter a partial or complete device label of the OpenFlow switch.
3. Click the Query icon ![]() .
.
Querying OpenFlow switches by using an advanced query
1. Access the OpenFlow switch list page.
2. Click the Advanced
icon ![]() in the top right of the OpenFlow
switch list area to expand the query area.
in the top right of the OpenFlow
switch list area to expand the query area.
3. Specify one or more of the following query criteria:
? Device Label—Enter a partial or complete device label of the OpenFlow switch.
? Device Status—Select the device status of the OpenFlow switch, Critical, Major, Minor, Warning, Normal, Unmanaged, or Unknown.
? IP Address—Enter a partial or complete IP address of the OpenFlow switch.
Empty fields are ignored.
4. Click Query.
The OpenFlow switch list displays all OpenFlow switches that match the criteria.
5. Click Reset to restore the default values of all query criteria and display all OpenFlow switches.
Managing an OpenFlow switch on the OpenFlow switch details page
The detailed information about an OpenFlow switch includes common device information and SDNM-specific information.
The common device information is obtained, managed, and maintained by the IMC Platform. For more information, see H3C Intelligent Management Center Enterprise and Standard Platform Administrator Guide. The following describes SDNM-specific information only.
Accessing the OpenFlow switch details page
Access the OpenFlow switch details page through one of the following methods:
· OpenFlow switches list
a. Click the Service tab.
b. From the navigation tree, select VAN SDN Manager > OF Resource > OF Devices.
c. Click the OF Switch tab.
d. Click the device label for an OpenFlow switch.
· OpenFlow topology
a. Click the Service tab.
b. From the navigation tree, select VAN SDN Manager > OF Topology. By default, the Overall Topology page appears.
c. Right-click an OpenFlow switch and select Device Information from the shortcut menu.
As shown in Figure 20, SDNM-specific information includes the SDN Info.
Figure 20 Detailed information about an OpenFlow switch
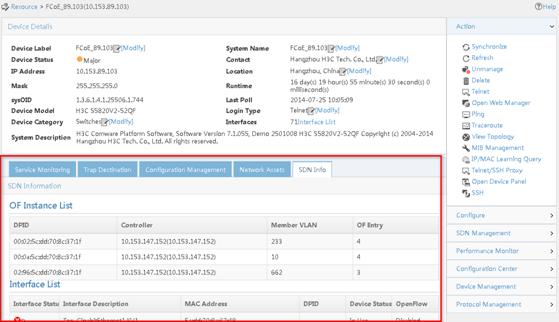
Viewing the SDN information
The SDN Info tab displays the following parameters for an OpenFlow switch:
· OF Instance List
? DPID—DPID of the OpenFlow switch.
? Controller—Controller to which the OpenFlow switch is connected.
? Member VLAN—VLAN on which the OpenFlow switch takes effect.
? OF Entry—Number of flow entries in the OpenFlow switch.
· Interface List
? Interface Status—Status of the physical or logical interface on the OpenFlow switch: Up, Down, or Disabled.
? Interface Description—Description of the interface on the OpenFlow switch, such as Ten-GigabitEthernet2/0/1 or Vlan-interface2.
? MAC Address—MAC address of the OpenFlow interface.
? DPID—DPIDs
of OpenFlow instances that use this interface. Click the Details icon ![]() to view the list of
OpenFlow instances.
to view the list of
OpenFlow instances.
? Device Status—Active condition of the interface: In Use or Unused.
? OpenFlow—Whether or not the OpenFlow forwarding is enabled for the interface.
· Endpoint list
? IP Address—IP address of the endpoint.
? MAC Address—MAC address of the endpoint.
? Port Index—Index of the port to which the endpoint is connected.
? Discovery Time—Time when the OpenFlow instance discovered the endpoint.
Managing controller configurations for an OpenFlow switch
This function enables you to manage IP addresses, ports, and device interfaces for controllers. A controller is uniquely identified by an ID for connections.
Viewing the controller configuration list
To view the controller configuration list of an OpenFlow switch:
1. Click the Service tab.
2. From the navigation tree, select VAN SDN Manager > OF Resource > OF Devices.
3. On the page that appears, click the OF Switch tab.
4. Click the Operation
icon ![]() for a switch and select Controller Setting.
for a switch and select Controller Setting.
The controller configuration list includes all controller configurations on the OpenFlow switch.
Controller configuration list contents
? ID—ID of the controller. OpenFlow instances use the ID to communicate with the controller.
? IP Address—IP address of the controller. Click the link to view detailed information about the controller.
? Controller Interface—VLAN port or OOBM port through which the OpenFlow instance is connected to the controller.
? Port—Listening port of the controller, with a fixed value of 6633.
? OF Instances—Number of OpenFlow instances managed by the controller.
? Modify—Click the Modify icon ![]() to modify
configurations of the controller. The icon does not appear if the controller is
connected to OpenFlow instances.
to modify
configurations of the controller. The icon does not appear if the controller is
connected to OpenFlow instances.
? Delete—Click the Delete icon ![]() to delete
configurations of the controller. The icon does not appear if the controller is
connected to OpenFlow instances.
to delete
configurations of the controller. The icon does not appear if the controller is
connected to OpenFlow instances.
Querying controller configurations
1. In the query box on the top right corner of the controller list area, enter a partial or a complete IP address of the controller.
2. Click the Query icon ![]() .
.
The controller list displays controllers that match the criterion.
Adding the configuration of a controller
Add configurations of new controllers to an OpenFlow switch after they are added to SDNM. The new configurations cannot be the same as any existing configurations on the switch. The maximum number of supported controllers on an HP ProCurve device varies with the device model. When the maximum number is reached, no additional configurations can be added to the device.
To add a controller configuration to an OpenFlow switch:
1. On the Controller Setting page, click Add.
2. On the page that appears, configure the following parameters:
? IP Address—Select an IP address for the controller from the list.
? Port—Configure the listening port of the controller with a fixed value of 6633.
? Management VLAN—Enter the ID of the VLAN in which OpenFlow instances are connected to the controller.
? Use OOBM Port—Configure a port for out-of-band management on blade switches.
3. Click OK.
When a virtual OpenFlow device is added on the switch, SDNM adds the controller configurations on the switch to the virtual OpenFlow device. For more information about managing virtual OpenFlow devices, see "Managing virtual OpenFlow devices."
Modifying the configuration of a controller
This function modifies the management VLAN of a controller on an OpenFlow switch when the controller is not connected to any OpenFlow instances.
To modify the configuration of a controller on an OpenFlow switch:
1. On the Controller
Setting page, click the Modify icon ![]() for a controller.
for a controller.
2. Modify the management VLAN.
3. Click OK.
Deleting the configuration of a controller
You can delete the configuration of a controller from an OpenFlow switch when the controller is not connected to any OpenFlow instance.
1. On the Controller
Setting page, click the Delete icon ![]() for a controller.
for a controller.
A confirmation dialog box appears.
2. Click OK.
Managing OpenFlow
OpenFlow uses a flow-based forwarding method. SDNM manages the elements involved in the OpenFlow forwarding process, including flow tables, flow entries, groups, meters, and service flows.
Managing flow tables
In an OpenFlow network, each packet is processed by the OpenFlow pipeline of every OpenFlow switch that the packet passes through. Each OpenFlow instance maintains a set of flow tables, which are uniquely identified by their table IDs. A flow table contains one or multiple flow entries for matching and processing packets.
To better understand OpenFlow forwarding rules, view and query flow tables by using the flow management module of SDNM.
Pipeline processing
As shown in Figure 21, the pipeline of every OpenFlow switch can contain multiple flow tables. An OpenFlow switch uses the flow entries in the flow tables to match and process received packets.
Figure 21 OpenFlow pipeline of an OpenFlow switch
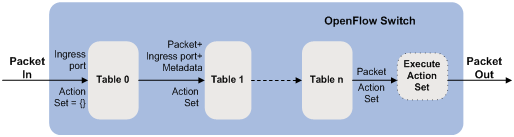
For more information about the OpenFlow Switch diagram, referenced in Figure 21, see version 1.3.1 of the Open Networking Foundation "OpenFlow Switch Specification" located at:
OpenFlow pipeline processing can only go forward. Flow tables in the OpenFlow switch are sequentially numbered starting at 0. When a packet arrives at the switch, the pipeline starts packet matching at table 0. The packet is first matched against the flow entries in table 0. Then the packet is forwarded to another flow table based on the match result of table 0. A flow entry can pass the packet only to a flow table whose ID is larger than its table ID.
The OpenFlow pipeline defines how each flow entry acts on a packet. If a packet does not match any flow entry, a table miss occurs. A table-miss flow entry defines how to process an unmatched packet.
As shown in Figure 22, the OpenFlow pipeline processes a packet by following these steps:
1. Match the packet against the flow entries of a flow table in descending order of priority. The greater the priority value, the higher the priority.
2. Execute the instruction set if the packet is matched:
a. Modify the packet and update its match fields by using the Apply-Actions instruction.
b. Update the action set by using the Clear-Actions and Write-Actions instructions.
c. Update metadata by using the Write-Metadata instruction.
d. Send the matched packet and action set to the next flow table by using the Goto-Table instruction.
|
|
NOTE: The flow entries in the last flow table do not contain the Goto-Table instruction. |
3. Execute the action set of the packet when pipeline processing stops.
Figure 22 OpenFlow packet matching process
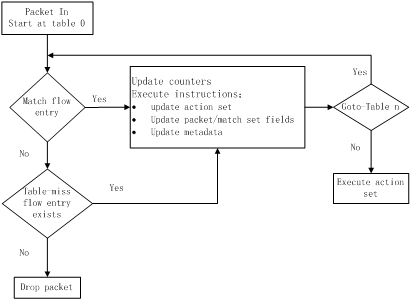
For more information about the OpenFlow packet matching process, referenced in Figure 22, see version 1.3.1 of the Open Networking Foundation "OpenFlow Switch Specification" located at:
|
|
NOTE: One or more of the links above take you outside the Hewlett Packard Enterprise website. Hewlett Packard Enterprise does not control and is not responsible for information outside of the Hewlett Packard Enterprise website. |
Viewing the flow table list
2. From the navigation tree, select VAN SDN Manager > Flow Management > OF Table.
Flow table list contents
? Table ID—ID of the flow table in its OpenFlow instance. A table ID uniquely identifies a flow table in an OpenFlow instance (a logical OpenFlow switch).
? OF Entry—Number of flow entries in the flow table. Click the numeral to view the flow entries on the flow entry management page for the flow table. For more information about flow entries, see "Managing flow entries."
? DPID—DPID of the OpenFlow instance to which the flow table belongs. A DPID uniquely identifies an OpenFlow instance. Click the DPID to view detailed information about the OpenFlow instance. For more information about OpenFlow instance details, see "Managing an OpenFlow instance on the OpenFlow instance details page."
Querying flow tables by using a basic query
1. Access the flow table list page.
2. In the query box on the top right of the flow table list area, enter a complete table ID.
3. Click the Query
icon ![]() .
.
The flow table list displays all flow tables that match the query criterion.
Querying flow tables by using an advanced query
1. Access the flow table list page.
2. Click the Advanced icon ![]() on the top right of the flow table list area to
expand the query area.
on the top right of the flow table list area to
expand the query area.
3. Specify one or more of the following query criteria:
? Table ID—Enter a complete flow table ID.
? Controller—Select a controller device label from the list.
? DPID—Enter a partial or complete DPID.
Empty fields are ignored.
4. Click Query.
The flow table list displays all flow tables that match the query criteria.
5. Click Reset.
The flow entry list displays all flow tables.
Managing flow entries
OpenFlow uses flow entries to match and process packets. Figure 23 shows the main components of a flow entry.
Figure 23 Main flow entry components
![]()
For more information about the flow entry components, referenced in Figure 23, see version 1.3.1 of the Open Networking Foundation "OpenFlow Switch Specification" located at:
In a flow table, a flow entry is uniquely identified by its match fields and priority. A table-miss flow entry's match fields are omitted, and its priority is 0. In a flow table, the fields of a packet are matched against the match fields of flow entries in order of priority. If the packet matches a flow entry, the instruction set of the flow entry is executed on the packet.
The flow entry management module of SDNM views, queries, adds, modifies, and deletes flow entries, which helps when making OpenFlow forwarding rules.
|
|
NOTE: One or more of the links above take you outside the Hewlett Packard Enterprise website. Hewlett Packard Enterprise does not control and is not responsible for information outside of the Hewlett Packard Enterprise website. |
Viewing the flow entry list
2. From the navigation tree, select VAN SDN Manager > Flow Management > OF Entry.
Flow entry list contents
? Table ID—ID of the flow table to which the flow entry belongs.
? Match Field—Match fields of the flow entry. For more information about match fields, see "Match fields."
? Priority—Matching precedence of the flow entry. A flow entry with a higher priority matches first.
? Hard Timeout—Lifetime of the flow entry after it is added to a flow table. When the hard timeout expires, the flow entry is automatically deleted.
? Idle Timeout—Maximum idle time of the flow entry. If the flow entry matches no packet within the idle timeout, it is deleted.
? DPID—DPID of the OpenFlow instance to which the flow entry belongs. A DPID uniquely identifies an OpenFlow instance. Click the DPID to view detailed information about the OpenFlow instance. For more information about OpenFlow instance details, see "Managing an OpenFlow instance on the OpenFlow instance details page."
? Creation Time—Time when the flow entry is created.
? View Topology—Click the Topology icon ![]() to view the topology of the OpenFlow instance on the OpenFlow
topology management page. For more information about OpenFlow topology, see
"Managing the logical
topology."
to view the topology of the OpenFlow instance on the OpenFlow
topology management page. For more information about OpenFlow topology, see
"Managing the logical
topology."
? Details—Click the Details icon ![]() to view detailed information about the flow entry. For more
information about flow entry details, see "Viewing flow entry details."
to view detailed information about the flow entry. For more
information about flow entry details, see "Viewing flow entry details."
? Modify—Click the Modify icon ![]() to modify the flow entry. For more information about the
configuration procedure, see "Modifying a flow entry."
to modify the flow entry. For more information about the
configuration procedure, see "Modifying a flow entry."
? Delete—Click the Delete icon ![]() to delete the flow entry.
to delete the flow entry.
Querying flow entries by using a basic query
1. Access the flow entry list page.
2. In the query box on the top right of the flow entry list area, enter a partial or complete DPID.
3. Click the Query
icon ![]() .
.
The flow entry list displays all flow entries that match the query criterion.
Querying flow entries by using an advanced query
1. Access the flow entry list page.
2. Click the Advanced icon ![]() in the top right of the flow entry list area to
expand the query area.
in the top right of the flow entry list area to
expand the query area.
3. Specify one or more of the following query criteria:
? Table ID—Enter a complete flow table ID.
? Match Field—Enter a partial or complete match field name.
? Priority—Enter a complete flow entry priority.
? Controller—Select a controller device label from the list.
? DPID—Enter a partial or complete DPID.
Empty fields are ignored.
The flow entry list displays all flow entries that match the query criteria.
5. Click Reset.
The flow entry list displays all flow entries.
Viewing flow entry details
1. Access the flow entry list page.
2. In the flow entry list, click the Details icon ![]() for a flow entry.
for a flow entry.
The flow entry details page displays the following information:
? Table ID—ID of the flow table to which the flow entry belongs.
? Match Field—Match fields of the flow entry. For more information about match fields, see "Match fields." This parameter is optional and can be empty.
? Priority—Matching precedence of the flow entry. A flow entry with a higher priority matches first.
? Hard Timeout—Lifetime of the flow entry after it is added to a flow table. When the hard timeout expires, the flow entry is deleted.
? Idle Timeout—Maximum idle time of the flow entry. If the flow entry matches no packet within the idle timeout, the flow entry is deleted.
? Cookie—Cookie value for the flow entry. A controller uses this opaque value to filter packets, and modify and delete flows. The cookie value is not used in packet processing. This parameter is optional and can be Null.
? Flags—Flags of the flow entry. If a flag is selected, the flag is set for the flow entry. Flags of a flow entry are as follows:
- send_flow_rem—Send a notification message when the flow entry is deleted.
- check_overlap—Check for duplicate flow entries.
- reset_counts—Reset flow entry statistics.
- no_packet_counts—Disable the packet counter.
- no_byte_counts—Disable the byte counter.
? Instructions—Instruction set of the flow entry. The instruction set of a flow entry might not include all instruction types. An instruction type can contain only one instruction.
The instruction set specifies the actions to be executed on a packet that matches the flow entry. The following instructions are in descending order of priority:
- Meter—Forward the packet to a specified meter for processing.
- Apply-Actions—Execute specified actions in the action list.
- Clear-Actions—Clear the action set of the packet.
- Write-Actions—Add specified actions to the action set of the packet. If an action of the specified type exists in the action set, the added action overrides the original action. For more information about the action set and the action list, see "Configuring actions."
- Write-Metadata—Write metadata into the metadata field of the packet. Metadata transmits information between flow tables in a switch. It is used in packet matching.
- Goto-Table—Forward the packet to a specified flow table that has a larger ID than the current flow table. The last flow table in the pipeline does not have this instruction.
Adding a flow entry
1. Access the flow entry list page.
2. In the flow entry list, click Add.
3. Specify the parameters in the Basic Information area:
? Table ID—Enter the ID of the flow table to which the flow entry is added.
? Match Field—Select match fields and specify the value of each match field. For more information about match fields, see "Match fields." This parameter is optional.
? Priority—Enter the priority of the flow entry.
? Hard Timeout—Enter the lifetime of the flow entry in a flow table.
? Idle Timeout—Enter the maximum idle time of the flow entry when no traffic matches the flow entry.
- If the hard timeout is 0 and the idle timeout is set, the flow entry is deleted after the idle timeout expires.
- If the hard timeout is set and the idle timeout is 0, the flow entry is deleted after the hard timeout expires.
- If both the hard timeout and the idle timeout are set, the flow entry is deleted after either timeout expires.
- If both the hard timeout and the idle timeout are 0, the flow entry never expires, but it can be deleted by a controller.
? Cookie—Enter a cookie value in hexadecimal format for the flow entry, in the range of 0x0 to 0x7fffffffffffffff. This parameter is optional.
? Flags—Select flags for the flow entry. This parameter is optional.
- send_flow_rem—Send a notification message when the flow entry is deleted.
- check_overlap—Check for duplicate flow entries.
- reset_counts—Reset flow entry statistics.
- no_packet_counts—Disable the packet counter.
- no_byte_counts—Disable the byte counter.
? Instructions—Select instruction types and specify an action for each selected instruction type. For more information about instruction set configuration, see "Configuring the instruction set for a flow entry." This parameter is optional.
4. Click Add in the Select Device area, select devices, and then click OK. For more information about device selection in the IMC Platform, see "Selecting devices."
5. Click OK on the Add OF Entry page.
6. Click Back.
Match fields
Match fields of a flow entry are used in packet matching. If a packet matches a flow entry, the instruction set of the flow entry is executed on the packet. Match fields originate from packet fields, including the input port, physical input port, inter-table metadata, Layer 2 header, Layer 3 header, and Layer 4 header fields. Table 5 shows detailed information about each match field.
Table 5 Match fields
|
Match field |
Form |
Value |
Prerequisite |
Function |
|
Input Port |
in_port: interface index |
An integer in the range of 0 to 4294967295. |
N/A |
Matches the ingress port. |
|
Physical Input Port |
in_phy_port: interface index |
An integer in the range of 0 to 4294967295. |
The Input Port field is configured. |
Matches the ingress physical port. |
|
Metadata |
metadata: metadata |
A hexadecimal number in the range of 0x0 to 0x7fffffffffffffff. |
N/A |
Matches the metadata. |
|
Ethernet Destination Address |
eth_dst: MAC address |
A MAC address in the format of hh:hh:hh:hh:hh:hh. |
N/A |
Matches the destination MAC address. |
|
Ethernet Source Address |
eth_src: MAC address |
A MAC address in the format of hh:hh:hh:hh:hh:hh. |
N/A |
Matches the source MAC address. |
|
Ethernet Frame Type |
eth_type: ipv4, arp, rarp, vlan, snmp, ipv6, mpls_m, mpls_u, prv_brdg, lldp, pbb, bddp |
Available values are: IPv4, ARP, RARP, VLAN, SNMP, IPv6, MPLS_U, MPLS_M, PRV_BRDG, LLDP, PBB, and BDDP. |
N/A |
Matches the Ethernet frame payload type. |
|
VLAN ID |
vlan_vid: none, present, vlan-id |
Available values are none, present, and exact. Select exact to enter an integer in the range of 0 to 4095. |
N/A |
Matches the VLAN ID. |
|
VLAN Priority |
vlan_pcp: value |
An integer in the range of 0 to 7. |
The VLAN ID field is configured. |
Matches the VLAN priority. |
|
IP DSCP |
ip_dscp: dscp-value |
An integer in the range of 0 to 63. |
Ethernet Frame Type = IPv4 or IPv6 |
Matches the DSCP value in the IP header. |
|
IP ECN |
ip_ecn: ecn-value |
An integer in the range of 0 to 3. |
Ethernet Frame Type = IPv4 or IPv6 |
Matches the ECN value in the IP header. |
|
IP Protocol |
ip_proto: tcp, udp, icmp, icmpv6, sctp |
Available values are: TCP, UDP, ICMP, ICMPv6, and SCTP. |
Ethernet Frame Type = IPv4 or IPv6 |
Matches the IPv4 or IPv6 protocol number. |
|
IPv4 Source Address |
ipv4_src: IPv4 address, Mask: Mask |
An IPv4 address. The mask is in the format of XXX.XXX.XXX.XXX. |
Ethernet Frame Type = IPv4 |
Matches the source IPv4 address. |
|
Mask |
||||
|
IPv4 Destination Address |
ipv4_dst: IPv4 address, Mask: Mask |
An IPv4 address. The mask is in the format of XXX.XXX.XXX.XXX. |
Ethernet Frame Type = IPv4 |
Matches the destination IPv4 address. |
|
Mask |
||||
|
TCP Source Port |
tcp_src: port number |
An integer in the range of 0 to 65535. |
IP Protocol = TCP |
Matches the TCP source port number. |
|
TCP Destination Port |
tcp_dst: port number |
An integer in the range of 0 to 65535. |
IP Protocol = TCP |
Matches the TCP destination port number. |
|
UDP Source Port |
udp_src: port number |
An integer in the range of 0 to 65535. |
IP Protocol = UDP |
Matches the UDP source port number. |
|
UDP Destination Port |
udp_dst: port number |
An integer in the range of 0 to 65535. |
IP Protocol = UDP |
Matches the UDP destination port number. |
|
SCTP Source Port |
sctp_src: port number |
An integer in the range of 0 to 65535. |
IP Protocol = SCTP |
Matches the SCTP source port number. |
|
SCTP Destination Port |
sctp_dst: port number |
An integer in the range of 0 to 65535. |
IP Protocol = SCTP |
Matches the SCTP destination port number. |
|
ICMP Type |
icmpv4_type: echo_rep |
ECHO_REP |
IP Protocol = ICMP |
Matches the ICMPv4 packet type. |
|
ICMP Code |
icmpv4_code: code-value |
An integer in the range of 0 to 255. |
IP Protocol = ICMP |
Matches the ICMPv4 code. |
|
ARP Opcode |
arp_op: value |
An integer in the range of 0 to 65535. |
Ethernet Frame Type = ARP |
Matches the ARP opcode. |
|
ARP Source IPv4 Address |
arp_sha: IPv4 address |
An IPv4 address. |
Ethernet Frame Type = ARP |
Matches the ARP source IP address. |
|
ARP Target IPv4 Address |
arp_tha: IPv4 address |
An IPv4 address. |
Ethernet Frame Type = ARP |
Matches the ARP target IP address. |
|
ARP Source Hardware Address |
arp_spa: MAC address |
A MAC address in the format of hh:hh:hh:hh:hh:hh. |
Ethernet Frame Type = ARP |
Matches the ARP source MAC address. |
|
ARP Target Hardware Address |
arp_tpa: MAC address |
A MAC address in the format of hh:hh:hh:hh:hh:hh. |
Ethernet Frame Type = ARP |
Matches the ARP target MAC address. |
|
IPv6 Source Address |
ipv6_src: IPv6 address |
An IPv6 address. |
Ethernet Frame Type = IPv6 |
Matches the source IPv6 address. |
|
IPv6 Destination Address |
ipv6_dst: IPv6 address |
An IPv6 address. |
Ethernet Frame Type = IPv6 |
Matches the destination IPv6 address. |
|
IPv6 Flow Label |
ipv6_flabel: label-value |
A hexadecimal number in the range of 0x0 to 0xfffff. |
Ethernet Frame Type = IPv6 |
Matches the IPv6 flow label. |
|
ICMPv6 Type |
icmpv6_type: nbr_adv or nbr_sol |
Available values are: NBR_SOL, NBR_ADV. |
IP Protocol = ICMPv6 |
Matches the ICMPv6 packet type. |
|
ICMPv6 Code |
icmpv6_code: code-value |
An integer in the range of 0 to 255. |
IP Protocol = ICMPv6 |
Matches the ICMPv6 code. |
|
Target Address for ND |
ipv6_nd_tll: IPv6 address |
An IPv6 address. |
ICMPv6 Type = NBR_SOL or NBR_ADV |
Matches the ND target IPv6 address. |
|
Source Link-layer for ND |
ipv6_nd_sll: MAC address |
A MAC address in the format of hh:hh:hh:hh:hh:hh. |
ICMPv6 Type = NBR_SOL |
Matches the ND source MAC address. |
|
Target Link-layer for ND |
ipv6_nd_target: MAC address |
A MAC address in the format of hh:hh:hh:hh:hh:hh. |
ICMPv6 Type = NBR_ADV |
Matches the ND target MAC address. |
|
MPLS Label |
mpls_label: label-value |
A hexadecimal number in the range of 0x0 to 0xfffff. |
Ethernet Frame Type = MPLS_U or MPLS_M |
Matches the label value in the first MPLS shim header. |
|
MPLS TC |
mpls_tc: tc-value |
An integer in the range of 0 to 7. |
Ethernet Frame Type = MPLS_U or MPLS_M |
Matches the TC field in the first MPLS shim header. |
|
MPLS Bos Bit |
mpls_bos: bos-value |
An integer in the range of 0 to 1. |
Ethernet Frame Type = MPLS_U or MPLS_M |
Matches the bottom of stack flag in the first shim MPLS header. |
|
PBB I-SID |
pbb_isid: i-sid |
A hexadecimal number in the range of 0x0 to 0xfffff. |
Ethernet Frame Type = PBB |
Matches the I-SID in the first PBB service instance tag. |
|
Tunnel ID |
tunnel_id: metadata |
A hexadecimal number in the range of 0x0 to 0x7fffffffffffffff. |
N/A |
Matches the metadata associated with a logical port. |
|
IPv6 Extension Header Pseudo-field |
ipv6_exthdr: [no_next,esp,auth,dest,frag,router,hop,un_rep,un_seq] |
Available values are: No Next, Encrypted Sec Payload, Authentication, Dest, Fragment, Router, Hop-by-hop, Unexpected Repeats, and Unexpected Sequencing. |
Ethernet Frame Type=IPv6 |
Matches the IPv6 extension header pseudo-field. |
Configuring the instruction set for a flow entry
The instruction set of a flow entry defines the actions to be executed on a matched packet. It can contain multiple types of instructions, but each instruction type can contain only one instruction. When a packet matches the flow entry, the instruction set is executed on the packet. The instructions affect the contents and action set of the packet, and the pipeline processing flow.
|
Instruction |
Function |
|
Meter |
Forward the packet to a specified meter for processing. |
|
Apply-Actions |
Execute specified actions in the action list. |
|
Clear-Actions |
Clear the action set of the packet. |
|
Write-Actions |
Add specified actions to the action set of the packet. |
|
Write metadata into the metadata field of the packet. |
|
|
Goto-Table |
Forward the packet to a specified flow table for processing. |
To configure the instruction set for a flow entry:
1. Access the Add OF Entry page.
2. Configure the following instructions. These instructions are in descending order of priority:
? Meter—Select Meter, and enter a meter ID.
? Apply-Actions—Select Apply-Actions. Click Add for this instruction, and specify an action. For more information about the configuration procedure, see "Configuring actions." You can add multiple actions for each action type. Information about the action is displayed after the action is added.
? Clear-Actions—Select Clear-Actions.
? Write-Actions—Select Write-Actions. Click Add for this instruction, and specify an action. For more information about the configuration procedure, see "Configuring actions." Only one action can be added for each action type. Information of the action is displayed after the action is added. The added action overrides the original action, if the action of the specified type already exists.
? Write-Metadata—Select Write-Metadata, and enter metadata.
? Goto-Table—Select Goto-Table, and enter a flow table ID. The table ID must be larger than the table ID of the flow entry. The flow entries of the last flow table do not have the Goto-Table instruction.
Configuring actions
The Apply-Actions instruction specifies a sequence of actions to be immediately executed on a packet. The action set of the packet is not affected when the action list is executed. The Write-Actions instruction adds actions to the action set of a packet.
Action set
An action set is bound to each packet. Initially, the action set does not contain any actions, but as the packet is processed by flow tables, actions accumulate in the action set. A flow entry can use the Write-Actions or Clear-Actions instruction to modify or clear the action set. The action set does not immediately change contents of the packet after the packet is processed by a flow entry. After the packet is processed by a flow entry that does not contain the Goto-Table instruction, the pipeline processing ends. Then the action set of the packet is executed.
In an action set, each action type includes only one action. If the action set contains groups, actions in each group are executed in order.
The actions in an action set or group are executed in the following order:
1. Copy TTL Inwards
2. Pop VLAN/MPLS/PBB Tag
3. Push MPLS Tag
4. Push PBB Tag
5. Push VLAN Tag
6. Copy TTL Outwards
7. Decrement MPLS/IP TTL
8. Set MPLS TTL/IP TTL/Field
9. Set Queue
10. Group
11. Output
Action list
The Apply-Actions instruction modifies a packet by applying an action list to the packet. The actions in an action list are the same as those in an action set, except that the actions in the action list immediately modify the contents of a packet. Effects of the actions are cumulative. The actions are executed in the order specified by the action list.
Table 7 shows the actions supported by an OpenFlow switch.
|
Action |
Function |
|
Send the packet out of a specified port. |
|
|
Copy TTL Outwards |
Copy the TTL from the next-to-outermost header to the outermost header. |
|
Copy the TTL from the outermost header to the next-to-outermost header. |
|
|
Set the MPLS TTL. |
|
|
Push VLAN Tag |
|
|
Pop VLAN Tag |
|
|
Push MPLS Tag |
|
|
Pop MPLS Tag |
|
|
Push PBB Tag |
|
|
Pop PBB Tag |
Remove the outermost PBB I-Tag. |
Configuring actions for the Apply-Actions or Write-Actions instruction
1. Access the Add OF Entry page.
2. Select Apply-Actions or Write-Actions.
3. Click Add for the selected instruction.
4. Specify an action:
? Select Output and enter a port index.
? Select Copy TTL Inwards.
? Select Set MPLS TTL and enter a TTL value.
? Select Decrement MPLS TTL.
? Select Push VLAN Tag and then select a type from VLAN and PRV_BRDG in the list.
? Select Pop VLAN Tag.
? Select Push MPLS Tag and then select a type from MPLS_U and MPLS_M in the list.
? Select Pop MPLS Tag and then select a type from MPLS_U and MPLS_M in the list.
? Select Set Queue and enter a queue ID.
? Select Group and enter a group ID.
? Select Set IP TTL and enter a TTL value.
? Select Decrement IP TTL.
? Select Set Field, select a field from the list, and configure the field value. For more information about the fields, see "Match fields."
? Select Push PBB Tag and select PBB from the list.
? Select Pop PBB Tag.
5. Click OK.
6. Repeat step 3 through step 5 to add all required actions.
The following information is displayed for the added actions:
? Action Type—Type of the action.
? Value—Detailed information of the action.
? Modify—Modify
icon ![]() . You can click this
icon to modify the action in the same way as an action is added.
. You can click this
icon to modify the action in the same way as an action is added.
? Delete—Delete
icon ![]() . You can click this
icon to delete the action.
. You can click this
icon to delete the action.
Modifying a flow entry
Only the instruction set of a flow entry can be modified.
To modify a flow entry:
1. Access the flow entry list page.
2. In the flow entry list, click the Modify icon ![]() for a flow entry.
for a flow entry.
3. Modify the instruction type and contents for the flow entry. For more information about the configuration procedure, see "Configuring the instruction set for a flow entry."
4. Click OK.
Deleting flow entries
Delete flow entries individually or in batches.
Deleting a single flow entry
1. Access the flow entry list page.
2. In the flow entry list, click the Delete icon ![]() for a flow entry.
for a flow entry.
A confirmation dialog box appears.
3. Click OK.
Deleting flow entries in batches
1. Access the flow entry list page.
2. Select one or more flow entries on the flow entry list.
3. Click Delete.
A confirmation dialog box appears.
Viewing the flow entry history
Perform this task to view the history information of a flow entry. The following events are recorded in the history of a flow entry:
· The flow entry is deleted because it has expired.
· An IMC operator or controller deletes the flow entry.
To view the history of a flow entry:
1. Access the flow entry list page.
2. In the flow entry list, click History.
OF entry history list contents
? Table ID—ID of the flow table to which the flow entry belongs.
? Match Field—Match fields of the flow entry. For more information about match fields, see "Match fields."
? Priority—Matching precedence of the flow entry. A flow entry with a higher priority matches first.
? Hard Timeout—Lifetime of the flow entry after it is added to a flow table. When the hard timeout expires, the flow entry is deleted.
? Idle Timeout—The maximum idle time of the flow entry. If the flow entry matches no packet within the idle timeout, the flow entry is deleted.
? DPID—DPID of the OpenFlow instance to which the flow entry belongs. A DPID uniquely identifies an OpenFlow instance.
? Creation Time—Time when the flow entry is created.
? Clearing Time—Time when the flow entry is deleted.
? Deleted By—If the flow entry is deleted by an operator in IMC, the operator name is displayed. Otherwise this field is Null.
? Details—Click the Details icon ![]() to
view detailed information about the flow entry. For more information about flow
entry details, see "Viewing
flow entry details."
to
view detailed information about the flow entry. For more information about flow
entry details, see "Viewing
flow entry details."
Managing groups
The ability of a flow entry to point to a group enables OpenFlow devices to apply additional forwarding methods. A group table consists of group entries. An OpenFlow switch can have only one group table. Figure 24 shows the components of a group entry.
Figure 24 Group entry components
![]()
For more information about the group entry components, referenced in Figure 24, see version 1.3.1 of the Open Networking Foundation "OpenFlow Switch Specification" located at:
Each group includes multiple buckets where each action bucket contains a set of actions to execute and associated parameters. The group type determines which action buckets are to be executed when packets match a group.
The group management module of SDNM views, queries, adds, modifies, and deletes groups, which helps create extra OpenFlow forwarding rules.
|
|
NOTE: One or more of the links above go outside the Hewlett Packard Enterprise website. Hewlett Packard Enterprise does not control and is not responsible for information outside of the Hewlett Packard Enterprise website. |
Viewing the group list
1. Click the Service tab.
2. From the navigation tree, select VAN SDN Manager > Flow Management > OF Group.
The group management page appears.
Group list contents
? Group ID—Integer uniquely identifying the group.
? Group Type—Type of the group:
- All—Execute all buckets in the group. This group is used for multicast or broadcast forwarding. The packet is cloned for each bucket, and one packet is processed for each bucket of the group.
- Select—Execute one bucket in the group. Packets are processed by a single bucket in the group, based on a switch-computed selection algorithm. The selection algorithm implements equal load sharing and can reduce the disruption of a downed link or switch.
- Indirect—Execute the one defined bucket in the group. This group supports only a single bucket. Multiple flow entries or groups are allowed to point to a common group identifier, supporting faster, more efficient convergence.
- Fast Failover—Execute the first live bucket. This group type enables the switch to change forwarding without requiring a round trip to the controller. Each action bucket is associated with a specific port, group, or both that control its liveness.
? DPID—DPID of the OpenFlow instance to which the group belongs. DPID uniquely identifies an OF instance. Click a DPID to view the OpenFlow instance details. For more information, see "Managing an OpenFlow instance on the OpenFlow instance details page."
? Modify—Click the Modify icon ![]() to
modify the group. For more information about the configuration procedure, see
"Modifying a group."
to
modify the group. For more information about the configuration procedure, see
"Modifying a group."
? Delete—Click the Delete icon ![]() to
delete the group.
to
delete the group.
Querying groups by using a basic query
1. Access the group list page.
2. In the query box on the top right of the group list area, enter a complete group ID.
3. Click the Query
icon ![]() .
.
The group list displays all groups that match the query criterion.
Querying groups by using an advanced query
1. Access the group list page.
2. Click the Advanced
icon ![]() on the top right of the
group list area to expand the query area.
on the top right of the
group list area to expand the query area.
3. Specify one or more of the following query criteria:
? Group ID—Enter a complete group ID.
? Group Type—Select a group type from the list. Options are:
- Unlimited
- All
- Select
- Indirect
- Fast Failover
? Controller—Select a device label of the controller to which the group belongs Unlimited can also be selected.
? DPID—Enter a partial or complete DPID of the OpenFlow instance to which the group belongs.
Empty fields are ignored.
4. Click Query.
The group list displays all groups that match the query criteria.
5. Click Reset.
The group list displays all groups.
Viewing group details
1. Access the group list page.
2. In the group list, click the group ID of the group to be viewed.
The group details page displays the following information:
? Group ID—Integer uniquely identifying the group in an OpenFlow instance.
? Group Type—Type of the group: All, Select, Indirect, Fast Failover.
? Bucket List:
- Weights—Weights of the bucket. This field is required only for a group whose type is Select.
- Watch Group—Watch group of the bucket. This field is required only for a group whose type is Fast Failover. A bucket is considered live if either its watch group or watch port is live.
- Watch Port—Watch port of the bucket. This field is required only for a group whose type is Fast Failover. A bucket is considered live if either its watch group or watch port is live.
? Details—Click the Details icon ![]() for the bucket to view. The bucket details page appears.
for the bucket to view. The bucket details page appears.
Viewing bucket details
1. Access the bucket list page.
2. In the bucket list, click the Details icon ![]() for the bucket to view.
for the bucket to view.
The bucket details page displays the following information:
? Weights—Weights of the bucket. This field is required only for a group whose type is Select.
? Watch Group—Watch group value of the bucket. This field is required only for a group whose type is Fast Failover. A bucket is considered live if either its watch group or watch port is live.
? Watch Port—Watch port value of the bucket. This field is required only for a group whose type is Fast Failover. A bucket is considered live if either its watch group or watch port is live.
? Action List—Displays the actions contained in the bucket. For more information, see Table 7.
Adding a group
1. In the group list, click Add.
The Add OF Group page appears.
2. In the Basic Information area, specify the following parameters:
? Group ID—Enter a group ID.
? Group Type—Select a group type from the list. Options are:
- All
- Select
- Indirect
- Fast Failover
? Bucket List—Click Add. The Add Bucket page appears. Specify the following parameters:
- Weight—Enter a weight for the bucket. This parameter takes effect for a group of the Select type.
- Watch Group—Enter a watch group value for the bucket. This parameter takes effect for a group of the Fast Failover type.
- Watch Port—Enter a watch port value for the bucket. This parameter takes effect for a group of the Fast Failover type.
- Action List—Click Add. The Add Action page appears. You can add multiple actions of the same type. For more information, see "Configuring actions."
3. In the Select Device area, click Add.
The Select Device page appears. For more information about adding and selecting devices, see "Selecting devices."
4. Click OK.
Modifying a group
Use the group management function to modify the group type and the bucket list.
To access the Modify OF Group page:
1. Access the group list page.
2. Click the Modify
icon ![]() for the group to modify.
for the group to modify.
The Modify OF Group page appears.
Modifying the group type
Select a new group type from the list. Options are:
· All
· Select
· Indirect
· Fast Failover
Modifying the bucket list
There are several ways to modify the bucket list, including adding a new bucket, modifying an existing bucket, and deleting an existing bucket.
Adding a bucket
1. In the Bucket List area, click Add.
The Add Bucket page appears.
2. Specify the following parameters:
? Weights—Enter a weight for the bucket.
? Watch Group—Enter a watch group value for the bucket.
? Watch Port—Enter a watch port value for the bucket.
? Action List—Click Add. The Add Action page appears. For more information, see "Configuring actions."
3. Click OK.
Modifying a bucket
1. In the bucket list, click the Modify icon ![]() for the bucket to modify.
for the bucket to modify.
The Modify Bucket page appears.
2. Modify the following parameters:
? Weights—Enter a new weight for the bucket.
? Watch Group—Enter a new watch group value for the bucket.
? Watch Port—Enter a new watch port value for the bucket.
? Action List—Click the Modify icon ![]() for the action to modify. The Modify Action
page appears. For more
information, see "Configuring
actions."
for the action to modify. The Modify Action
page appears. For more
information, see "Configuring
actions."
3. Click OK.
Deleting a bucket
1. In the bucket list, click the Delete icon ![]() for the bucket to delete.
for the bucket to delete.
The confirmation dialog box appears.
2. Click OK.
Deleting groups
Delete groups individually or in batches.
Deleting a single group
1. In the group list, click the Delete icon
![]() for the
group to delete.
for the
group to delete.
The confirmation dialog box appears.
2. Click OK.
Deleting groups in batches
1. In the group list, select one or more groups.
2. Click Delete.
The confirmation dialog box appears.
3. Click OK.
Managing meters
Meters enable OpenFlow to implement various simple QoS operations, such as rate-limiting. A meter table consists of meter entries. An OpenFlow switch can have only one meter table. Figure 25 shows the components of a meter entry.
Figure 25 Meter entry components
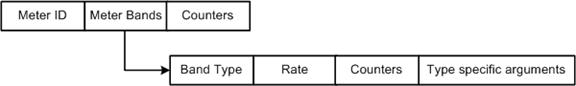
For more information about the meter entry components, referenced in Figure 25, see version 1.3.1 of the Open Networking Foundation "OpenFlow Switch Specification" located at:
Each meter includes one or more bands. Only a single band is used at a time. Each band specifies the rate at which the band applies and the way packets should be processed. If the current rate of packets exceeds the rate of multiple bands, the band with the highest configured rate is used.
The meter management module of SDNM views, queries, adds, modifies, and deletes meters, which helps create traffic control rules.
|
|
NOTE: One or more of the links above goes outside the Hewlett Packard Enterprise website. Hewlett Packard Enterprise does not control and is not responsible for information outside of the Hewlett Packard Enterprise website. |
Viewing the meter list
1. Click the Service tab.
2. From the navigation tree, select VAN SDN Manager > Flow Management > OF Meter.
The meter management page appears.
Meter list contents
? Meter ID—Integer that uniquely identifies the group.
? DPID—DPID of the OpenFlow instance to which the meter belongs. A DPID uniquely identifies an OpenFlow instance. Click a DPID to view the OpenFlow instance details. For more information, see "Managing an OpenFlow instance on the OpenFlow instance details page."
? Modify—Click the Modify icon ![]() to
modify the meter. For more information about the configuration procedure, see
"Modifying a meter."
to
modify the meter. For more information about the configuration procedure, see
"Modifying a meter."
? Delete—Click the Delete icon ![]() to
delete the meter.
to
delete the meter.
Querying meters by using a basic query
1. Access the meter list page.
2. In the query box on the top right of the meter list area, enter a complete meter ID.
3. Click the Query
icon ![]() .
.
The meter list displays all meters that match the query criterion.
Querying meters by using an advanced query
1. Access the meter list page.
2. Click the Advanced
icon ![]() on the top right of
the meter list area to expand the query area.
on the top right of
the meter list area to expand the query area.
3. Specify one or more of the following query criteria:
? Meter ID—Enter a complete meter ID.
? Controller—Select a device label of the controller to which the meter belongs from the list. You can also select Unlimited.
? DPID—Enter a partial or complete DPID of the OpenFlow instance to which the meter belongs.
Empty fields are ignored.
4. Click Query.
The meter list displays all meters that match the query criteria.
5. Click Reset.
The meter list displays all meters.
Viewing meter details
1. Access the meter list page.
2. In the meter list, click the meter ID of the meter to view.
The meter details page displays the following information:
? Meter ID—Integer uniquely identifying the meter in an OpenFlow instance.
? Flags—Flags configured for the meter. If no option is selected, it indicates that no flag is configured for the meter. Options are:
- KBPS—The rate value is in kbps and the burst size value is in kb.
- PKTPS—The rate value is in pps and the burst size value is in packets.
- BURST—The burst size field in the band is used and the length of the packet or byte burst is determined by the burst size.
- STATS—Meter statistics are collected.
? Bands
- Rate—Rate value above which the corresponding band may apply to packets. If the current rate of packets exceeds the configured rates of multiple bands, the band with the highest configured rate is used.
- Burst Size—Length of the packet or byte burst to consider for applying the meter.
- Band Type—Ways packets are processed. Options are Drop and DSCP Remark.
- Details—Click
the Details icon ![]() for the band to view. The band details page
appears.
for the band to view. The band details page
appears.
Viewing band details
In the band list, click the Details icon ![]() for the band you want to view. The band
details page displays the following information:
for the band you want to view. The band
details page displays the following information:
· Rate—Rate value above which the corresponding band may apply to packets. If the current rate of packets exceeds the configured rates of multiple bands, the band with the highest configured rate is used.
· Burst Size—Length of the packet or byte burst to consider for applying the meter.
· Band Type—Ways packets are processed. Options are:
? Drop—Drop the packets.
? DSCP Remark—Modify the drop precedence of the DSCP field in the IP header of the packets. Configure the required Precedence Level field.
Adding a meter
1. In the meter list, click Add.
The Add OF Meter page appears.
2. In the Basic Information area, specify one or more of the following parameters:
? Meter ID—Enter a meter ID.
? Flags—Select flags for the meter. Options are:
- KBPS—The rate value is in kbps and the burst size value is in kb.
- PKTPS—The rate value is in pps and the burst size value is in packets.
- BURST—The burst size field in band is used and the length of the packet or byte burst is determined by the burst size.
- STATS—Statistics about the meter list are collected.
? Bands—Click Add. The Add Band page appears. Specify the following parameters:
- Rate—Enter a rate value for the band.
- Burst Size—Enter a burst size value for the band.
? Band Type—Select a band type from the list. Options are:
- Drop—Drop the packets.
- DSCP Remark—Modify the drop precedence of the DSCP field in the IP header of the packets. Configure the required Precedence Level field.
3. In the Select Device area, click Add.
The Select Device page appears. For more information about adding and selecting devices, see "Selecting devices."
4. Click OK.
Modifying a meter
Use the meter management function to modify the flags and the bands.
To access the Modify OF Meter page:
1. Access the meter list page.
2. Click the Modify
icon ![]() for the meter to modify.
for the meter to modify.
The Modify OF Meter page appears.
Modifying the flags
Select or clear the flags for the meter. Options are:
· KBPS
· PKTPS
· BURST
· STATS
Modifying the bands
There are several ways to modify bands, including adding a new band and modifying or deleting an existing band.
Adding a band
1. In the Bands area, click Add.
The Add Band page appears.
2. Specify the following parameters:
? Rate—Enter a rate value for the band.
? Burst Size—Enter a burst size value for the band.
? Band Type—Select a band type from the list. Options are:
- Drop—Drop the packets.
- DSCP Remark—Modify the drop precedence of the DSCP field in the IP header of the packets. Configure the required Precedence Level field.
3. Click OK.
Modifying a band
1. In the band list, click the Modify icon ![]() for the band to modify.
for the band to modify.
The Modify Band page appears.
2. Modify the following parameters:
? Rate—Enter a new rate value for the band.
? Burst Size—Enter a new burst size value for the band.
? Band Type—Select a band type from the list. Options are:
- Drop—Drop the packets.
- DSCP Remark—Modify the drop precedence of the DSCP field in the IP header of the packets. Configure the required Precedence Level field.
3. Click OK.
Deleting a band
1. In the band list, click the
Delete icon ![]() for the band to delete.
for the band to delete.
The confirmation dialog box appears.
2. Click OK.
Deleting meters
Delete meters individually or in batches.
Deleting a single meter
1. In the meter list, click the Delete icon
![]() for the
meter to delete.
for the
meter to delete.
The confirmation dialog box appears.
2. Click OK.
Deleting meters in batches
1. In the meter list, select one or more meters.
2. Click Delete.
The confirmation dialog box appears.
3. Click OK.
Managing service flows
A service flow is a data path established between two OpenFlow instances. It might go through none, one, or more OpenFlow instances. A service flow consists of multiple flow entries.
The service flow management module of SDNM configures flow entries to different services.
Viewing the service flow list
1. Click the Service tab.
2. From the navigation tree, select VAN SDN Manager > Flow Management > Service Flow.
The service flow management page appears.
Service flow list contents
? Status—Status of the service flow:
- Normal—All corresponding flow entries for the service flow exist.
- Critical—At least one of the corresponding flow entries for the service flow is missing.
? Path Name—Path name of the service flow. It is generated based on the source node DPID and the destination node DPID.
Click the link to view the flow entries of the service flow. For information about the flow entry list contents, see "Viewing the flow entry list."
Click the Modify icon ![]() to modify the path name (see "Modifying the path name of a service flow").
to modify the path name (see "Modifying the path name of a service flow").
? Traffic—Traffic of the service flow. A service flow contains multiple flow entries. The traffic of a service flow is determined by the flow entry with the least received traffic.
? Source Node—DPID of the source node.
? Destination Node—DPID of the destination node.
? Creation Time—Time when the service flow was created.
? View Topology—Click the Topology icon ![]() .
The OpenFlow topology management page appears and highlights the service flow.
For more information, see "Viewing service flows."
.
The OpenFlow topology management page appears and highlights the service flow.
For more information, see "Viewing service flows."
? Delete—Click the Delete icon ![]() to delete the service flow.
to delete the service flow.
Querying service flows by using a basic query
1. Access the service flow list page.
2. In the query box on the top right of the service flow list area, enter a partial or complete path name.
3. Click the Query
icon ![]() .
.
The service flow list displays all service flows that match the query criterion.
Querying service flows by using an advanced query
1. Access the service flow list page.
2. Click the Advanced
icon ![]() in the top right of the service flow list
area to expand the query area.
in the top right of the service flow list
area to expand the query area.
3. Specify one or more of the following query criteria:
? Status—Select a status from the list. Options are:
- Unlimited
- Normal
- Critical
? Path Name—Enter a partial or complete path name.
? Source Node—Enter a partial or complete DPID for the source node.
? Destination Node—Enter a partial or complete DPID for the destination node.
Empty fields are ignored.
4. Click Query.
The service flow list displays all service flows that match the query criteria.
5. Click Reset.
The service flow list displays all service flows.
Adding a service flow
1. In the service flow list, click Add.
The OpenFlow topology management page appears.
2. Add a service flow in the topology display area. For more information, see "Adding a service flow."
Modifying the path name of a service flow
1. In the service flow list, click the Modify icon ![]() for a service
flow.
for a service
flow.
The Path Name page appears.
2. Enter a new name in the Path Name field.
3. Click OK.
Deleting service flows
Delete service flows individually or in batches.
Deleting a single service flow
1. In the service flow list, click the Delete icon
![]() for the
service flow to delete.
for the
service flow to delete.
The confirmation dialog box appears.
2. Click OK.
Deleting service flows in batches
1. In the service flow list, select one or more service flows.
2. Click Delete.
The confirmation dialog box appears.
3. Click OK.
Viewing the service flow history
Service flows deleted from IMC are recorded in the service flow history.
To view the service flow history:
1. In the service flow list, click History.
The Service Flow History page appears.
Service flow history contents
? Path Name—Path name of service flow. It is generated based on the source node DPID and the destination node DPID.
? Traffic—Traffic of the service flow. A service flow contains multiple flow entries. The traffic of a service flow is determined by the flow entry with the least received traffic.
? Source Node—DPID of the source node.
? Destination Node—DPID of the destination node.
? Creation Time—Time when the service flow is created.
? Clearing Time—Time when the service flow is deleted.
Service flow history can be queried by using the query function in the Service Flow History page. For more information, see "Querying service flows by using a basic query."
2. Click Return to return to the service flow list page.
Managing OpenFlow alerts and troubleshooting service flows
SDNM manages OpenFlow alerts and troubleshoot SDN service flows.
Managing OpenFlow alerts
When a controller is added to SDNM, SDNM registers an alert listener with the controller so that the controller can send the generated OpenFlow alerts to SDNM.
SDNM enables you to view, query, acknowledge, recover, and delete the following OpenFlow alerts:
· OpenFlow alerts generated by controllers.
· OpenFlow alerts generated by SDNM.
Accessing the alert list page
1. Click the Service tab.
2. From the navigation tree, select VAN SDN Manager > OF Monitor > Alerts.
The alert list displays all alerts in SDNM.
Alert list contents
? Level—Severity level of the alert. Options are:
- Critical
- Major
- Minor
- Warning
- Info
? Recovery Status—Whether or not the alert has been recovered:
- If the alert has not been recovered, this field displays Unrecovered. Click the Unrecovered link to manually recover the alert.
- If the alert has been manually recovered by an operator, this field displays the operator name.
- If the alert has been automatically recovered or was sent to SDNM to clear a previous alert, this field displays "$SYSTEM."
? Acknowledgement Status—Whether or not the alert has been acknowledged:
- If the alert has not been acknowledged, this field displays Unacknowledged. Click the Unacknowledged link to acknowledge the alert.
- If the alert has been acknowledged by an operator, this field displays the operator name.
? Alert Source—IP address of a controller. The alert might be sent by the controller or generated by SDNM for the controller. Click the alert source to view the controller details. For more information, see "Viewing SDN controller information."
? Alert Topic—Topic of the alert, which is predefined by the controller or SDNM.
? Description—Description of the condition that triggered the alert. Click the description to view the alert details. For more information, see "Viewing the alert details."
? Affection Endpoint—Number of affected endpoints. Point to the number link to view the list of affected endpoints.
? Affected Service Flow—Number of affected service flows. Point to the number link to view the list of affected service flows.
? Alert at—Date and time when SDNM received the alert.
? Recovered at—Date and time when the alert was recovered.
? Duration—Time duration when the alert is in the unrecovered state:
- If the alert has been recovered, this field displays the duration from the alert generation time to the recovery time.
- If the alert has not been recovered, this field displays the duration from the alert generation time to the current time.
- For an alert sent to SDNM to clear a previous alert condition, the duration is always 0.
? Topology—If the alert has
affected OpenFlow instances, clicking the Topology
icon ![]() opens the OpenFlow topology with the affected OpenFlow instances
highlighted. If the alert has not affected any OpenFlow instance, clicking the Topology icon
opens the OpenFlow topology with the affected OpenFlow instances
highlighted. If the alert has not affected any OpenFlow instance, clicking the Topology icon ![]() opens the logical topology of the alert
source controller.
opens the logical topology of the alert
source controller.
Viewing the alert details
1. Access the alert list page.
2. In the Description field, click the link for the target alert.
The Alert Details page appears, displaying the following information:
? Alert Details—Displays basic information about the alert:
- Level
- Organization
- Recovery Status
- Alert Source
- Acknowledgement Status
- Alert Topic
- Alert at
- Recovered at
- Duration
- Description
The Organization field displays the controller- or SDNM-defined organization to which the alert belongs. For example, SDNM indicates that the alert is generated by SDNM.
For descriptions of other parameters, see "Accessing the alert list page."
? Affected Endpoint—Displays the following information about the affected endpoints:
- MAC Address—MAC address of the endpoint.
- IP Address—IP address of the endpoint.
- DPID—DPID of the OpenFlow instance with which the endpoint is associated.
? Affected Service Flow—Displays the following information about the affected service flows:
- Status—Status of the service flow.
- Path Name—Name of the data path that carries the service flow. The path name is a combination of the source node DPID and destination node DPID of the service flow.
- Source Node—DPID of the source node of the service flow.
- Destination Node—DPID of the destination node of the service flow.
- Creation Time—Time when the service flow was created.
Querying alerts by using a basic query
1. Access the alert list page.
2. In the query box on the top right of the alert list area, enter a partial or complete alert topic string in the query field.
3. Click the Query
icon ![]() .
.
The alert list displays all alerts that match the query criterion.
Querying alerts by using an advanced query
1. Access the alert list page.
2. Click the Advanced icon ![]() in the top right of the alert list area to expand
the query area.
in the top right of the alert list area to expand
the query area.
3. Specify one or more of the following query criteria in the expanded area:
? Level—Select one or more severity levels. Options are:
- Critical
- Major
- Minor
- Warning
- Info
? Alert Source—Select an alert source from the list. Options are controllers in SDNM.
? Recovery Status—Select an alert recovery state from the list. Options are:
- Unlimited
- Recovered
- Unrecovered
? Acknowledgement Status—Select an acknowledgement state for alerts. Options are:
- Unlimited
- Acknowledged
- Unacknowledged
? Alert Topic—Enter a partial or complete alert topic string.
Fields that are empty or set to Unlimited are ignored.
4. Click Query.
The alert list displays all alerts that match the query criteria.
5. Click Reset to clear the query criteria and display all alerts.
Acknowledging, recovering, and deleting alerts
1. Access the alert list page.
2. Select one or more alerts.
3. Perform one of the following tasks:
? Click Acknowledge to acknowledge the alerts.
? Click Recover to recover the alerts.
? Click Delete to delete the alerts.
Displaying alerts
SDNM presents the alert information to operators in the following ways:
· Device status—The alarm state of a device is determined by the highest level of unrecovered alerts in the device. If the device has no unrecovered alerts, the device state is normal. Operators can view the alarm state of a device on the device list and the device details page. For more information, see "Managing resources." Devices in different states are displayed in different colors on the OpenFlow topology. For more information, see "Network virtualization."
· SDNM Widget and SDNM Overview—Displays OpenFlow alerts and device state information in graphs. For more information, see "Viewing the Overview page" and "SDNM widgets."
· Device details page of a controller—From the device details page of a controller, the ten most recent alerts that have not been recovered. The number and level of all unrecovered alerts can be viewed. For more information, see "Viewing SDN controller information."
Troubleshooting service flows
SDNM provides real-time reachability analysis for service flows and root cause analysis for faulty service flows.
Accessing the trouble analysis page
1. Click the Service tab.
2. From the navigation tree, select VAN SDN Manager > OF Monitor > Trouble Analysis.
The Trouble Analysis page displays all the service flows.
Service flow list contents
? Status—State of the service flow. Options are Normal and Critical.
? Path Name—Name of the data path that carries the service flow. The path name is a combination of the source node DPID and destination node DPID of the service flow.
? Online Time—Time elapsed since the service flow was created.
? Source Node—DPID of the source node of the service flow.
? Destination Node—DPID of the destination node of the service flow.
? Trouble Analysis—Click the Trouble Analysis icon ![]() to enter the trouble
analysis details page. For more information about
trouble analysis, see "Troubleshooting a service
flow."
to enter the trouble
analysis details page. For more information about
trouble analysis, see "Troubleshooting a service
flow."
3. Click Refresh in the top-left corner of the page to view the latest service flow list.
Querying service flows by using a basic query
1. Access the service flow list page.
2. In the query box on the top right of the service flow list area, enter a partial or complete path name in the query field.
3. Click the Query
icon ![]() .
.
The service flow list displays all service flows that match the query criterion.
Querying service flows by using an advanced query
1. Access the service flow list page.
2. Click the Advanced icon ![]() in the top right of the service flow list area to
expand the query area.
in the top right of the service flow list area to
expand the query area.
3. Specify one or more of the following query criteria in the expanded area:
? Path Status—Select a service flow state from the list. Options are:
- Normal
- Critical
- Unlimited
? Path Name—Enter a partial or complete path name for service flows.
? Source Node—Enter a partial or complete source node DPID for service flows.
? Destination Node—Enter a partial or complete destination node DPID for service flows.
Empty fields and fields set to Unlimited are ignored.
4. Click Query.
The service flow list displays all service flows that match the query criteria.
5. Click Reset to clear the query criteria and display all service flows.
Troubleshooting a service flow
1. Access the service flow list page.
2. Click the Trouble
Analysis icon ![]() for the target service flow.
for the target service flow.
The Trouble Analysis Details page appears.
3. Specify the following parameters:
? Path Name—Displays the name of the data path that carries the service flow.
? Status—Displays the state of the service flow.
? Source Endpoint—Select the MAC address of an endpoint associated with the source OpenFlow instance of the service flow.
? Destination Endpoint—Select the MAC address of an endpoint associated with the destination OpenFlow instance of the service flow.
? Message Protocols—Select one or more protocols to construct packets for fault analysis. Options are:
- TCP
- UDP
- ICMP
- DHCP
When multiple protocols are selected, SDNM considers an OpenFlow instance unreachable if packets in the instance failed to be forwarded through any of the protocols.
4. Click Trouble Analysis to start the fault analysis.
The analysis results are displayed in a topology and a list.
? The topology displays the OpenFlow instances in different colors according to their reachability states:
- Green—The OpenFlow instance is reachable.
- Red—The OpenFlow instance is unreachable.
- Blue—The state of the OpenFlow instance is unknown.
The analysis result list displays the analysis result for each OpenFlow instance involved in the service flow. Faulty instances are highlighted in red. Trouble analysis results are:
- Type—Protocol used for fault analysis.
- Analysis Process—Action that is taken to analyze the fault.
- Analysis Result—Result of the action.
5. If the service flow is unreachable, a Root Cause Analysis button is displayed. Click the button to start root cause analysis.
SDN analyzes the faulty service flow in various aspects according to the information reported by the controller, and displays the analysis results in a topology and a list.
? The topology displays the OpenFlow instances in different colors according to their states:
- Green—The OpenFlow instance is normal.
- Red—The OpenFlow instance is faulty.
? The root cause analysis result list displays the analysis results for each OpenFlow instance involved in the service flow. Faulty instances are highlighted in red. Root cause analysis results are:
- Type—Type of the root cause analysis.
- Analysis Process—Action that is taken to analyze the root cause.
- Analysis Result—Result of the action.
Network virtualization
To improve network resource usage for different network users, SDNM provides the network virtualization function. This function virtualizes the physical OpenFlow network in a horizontal view. For example, it can be used to create multiple OpenFlow instances on a single OpenFlow switch. Each instance operates as an independent virtual OpenFlow device. Tenants can use one or more virtual OpenFlow devices to build their respective OpenFlow logical networks.
With network virtualization, the following functions can be implemented:
· Manage virtual OpenFlow devices.
· Manage the tenant's logical network.
Managing virtual OpenFlow devices
SDNM provides an OpenFlow device virtualization module for operators to add virtual OpenFlow devices based on OpenFlow switches and to centrally manage the virtual devices.
Viewing the virtual OpenFlow device list
Virtual OpenFlow devices in the list come from:
· Virtual OpenFlow devices that are synchronized from the controllers in SDNM.
· OpenFlow instances that are created by SDNM operators.
A virtual OpenFlow device takes the DPID as its device label if it is synchronized from a controller.
To view the virtual OpenFlow device list:
1. Click the Service tab.
2. From the navigation tree, select VAN SDN Manager > Network Virtualization > OF Device Virtualization.
Virtual OpenFlow Device list contents
? Device Status—Operating status of the virtual OpenFlow device. The status depends on the level of the most severe alarms on the device.
? DPID Label—DPID label of the virtual OpenFlow device. Click the label to view detailed information about the virtual OpenFlow device. For information about parameters in the virtual OpenFlow device details page, see "Managing an OpenFlow instance on the OpenFlow instance details page."
? DPID—DPID that uniquely identifies an OpenFlow instance.
? Member VLAN—VLANs on which the virtual OpenFlow device takes effect.
? IP Address—IP address of the OpenFlow switch on which the virtual OpenFlow device is located.
? Controller—Device label of the controller that manages the virtual OpenFlow device.
? Modify—Click the Modify icon ![]() to
modify the virtual OpenFlow device. For more information about modifying the
virtual OpenFlow device, see "Modifying a virtual OpenFlow device."
to
modify the virtual OpenFlow device. For more information about modifying the
virtual OpenFlow device, see "Modifying a virtual OpenFlow device."
? Delete—Click the Delete icon ![]() to delete the virtual OpenFlow device. For more information about
deleting the virtual OpenFlow device, see "Deleting
virtual OpenFlow devices."
to delete the virtual OpenFlow device. For more information about
deleting the virtual OpenFlow device, see "Deleting
virtual OpenFlow devices."
Querying virtual OpenFlow devices by using a basic query
1. Access the virtual OpenFlow device list page.
2. In the query box on the top right, enter a partial or complete DPID.
3. Click the Query
icon ![]() .
.
The virtual OpenFlow device list displays virtual OpenFlow devices that match the query criterion.
Querying virtual OpenFlow devices by using an advanced query
1. Access the virtual OpenFlow device list page.
2. Click the Advanced
Query icon ![]() next to the query field to expand the advanced query pane.
next to the query field to expand the advanced query pane.
3. Specify one or more of the following query criteria:
? Controller—Select the controller that manages the virtual OpenFlow device.
? DPID Label—Enter a partial or complete DPID label of the virtual OpenFlow device.
? DPID—Enter a partial or complete DPID of the OpenFlow instance.
Empty fields are ignored.
4. Click Query.
The virtual OpenFlow device list displays all virtual OpenFlow devices that match the query criteria.
5. Click Reset.
The virtual OpenFlow device list page displays all virtual OpenFlow devices in SDNM.
Adding virtual OpenFlow devices
Add one or more virtual OpenFlow devices individually or in batches. When adding virtual OpenFlow devices in batches, make sure the virtual OpenFlow devices to be added do not have overlapping VLANs. Otherwise, traffic cannot be correctly processed in a VLAN on which multiple instances take effect. SDNM uses the following rules:
· SDNM prohibits the addition of a virtual OpenFlow device if it includes a VLAN on which another virtual OpenFlow device has taken effect.
· If non-existent VLANs for a new virtual OpenFlow device are specified, SDNM creates the VLANs after the virtual OpenFlow device is activated.
When a virtual OpenFlow device is added, SDNM assigns an interface to the device. For information about adding or modifying an interface for the virtual OpenFlow device, see "Adding virtual OpenFlow devices."
To add virtual OpenFlow devices:
1. Access the virtual OpenFlow device list page.
2. Click Add in the virtual OpenFlow device list.
3. Configure the following parameters:
? Instance Name—Enter the label of the virtual OpenFlow device. On the OpenFlow switch, multiple virtual OpenFlow instances cannot be configured with the same instance name.
? OF Switch—Select the OpenFlow switch to which the virtual OpenFlow device belongs. The list includes only OpenFlow switches that have been added to SDNM. For information about adding an OpenFlow switch to SDNM, see "Adding devices to IMC."
? Controller—Select the controller that manages the virtual OpenFlow device.
? VLAN (Available)—Specify the ID of the VLAN on which the virtual OpenFlow device takes effect.
? VLAN Mask—Enter the VLAN mask of the OpenFlow switch. The VLANs to be associated are calculated by a bitwise AND operation on the specified VLAN ID and mask. The VLAN mask supports non-contiguous 1s and ignores all 0 bits. If the OpenFlow switch does not support the VLAN mask, this field is grayed out. For example, if the entered VLAN ID is 17 and VLAN mask is 4094, the bitwise AND operation result is 16. Because the lowest-order bit of the VLAN mask is 0, the lowest-order bit of 16 can be 0 or 1. The VLANs in which the OpenFlow device takes effect is VLAN 16 and VLAN 17.
? In-Band Management VLAN—Enter the ID of the in-band management VLAN for the virtual OpenFlow device. In this VLAN, the virtual OpenFlow device establishes connections to the controller.
? Expected DPID—Expected DPID of the virtual OpenFlow device that is populated when an OpenFlow switch and a controller have been selected. The rules for generating the DPID vary with device models.
4. To add more virtual OpenFlow devices, click Add More and configure OpenFlow instance parameters.
5. Click the Delete icon ![]() to delete undesired virtual
OpenFlow devices.
to delete undesired virtual
OpenFlow devices.
6. Click OK.
7. Click Return.
The new devices appear in the virtual OpenFlow device list.
Modifying a virtual OpenFlow device
|
|
IMPORTANT: Modifying the OpenFlow instance might cause forwarding interruption in an OpenFlow instance. For more information, see the configuration guide of the device. |
To modify a virtual OpenFlow device:
1. Access the virtual OpenFlow device list page.
2. Click the Modify
icon ![]() for the OpenFlow device to be modified.
for the OpenFlow device to be modified.
3. Select the controller that manages the virtual OpenFlow device.
4. Click OK.
Deleting virtual OpenFlow devices
Delete Virtual OpenFlow devices individually or in batches.
Deleting a single virtual OpenFlow device
1. Access the virtual OpenFlow device list page.
2. Click the Delete
icon ![]() for the virtual OpenFlow device to be deleted.
for the virtual OpenFlow device to be deleted.
A confirmation dialog box appears.
3. Click OK.
Deleting virtual OpenFlow devices in batches
1. Access the virtual OpenFlow device list page.
2. Select the virtual OpenFlow devices from the list to be deleted.
3. Click Delete.
A confirmation dialog box appears.
4. Click OK.
The Delete Operation Result page appears.
5. Click Return.
Managing the tenant network
With the tenant network module, the tenant network status and manage tenants can be viewed.
Viewing the tenant network
1. Click the Service tab.
2. From the navigation tree, select VAN SDN Manager > Network Virtualization > Tenant Network.
The Tenant Network page appears, including tenant network statistics charts and the tenant list.
Viewing tenant network statistics charts
Tenant network statistics charts include:
· Tenant Status—Displays the proportion of tenants with different statuses in a pie chart. For more information, see "Tenant status."
· Tenant Traffic Rate Chart—Displays the receiving and transmitting rate trend of tenants in a specified time range in a line chart. For more information, see "Tenant traffic rate chart."
· DPID Usage—Displays the numbers of used OpenFlow instances and unused OpenFlow instances. For more information, see "DPID usage."
· Top5 OF Instances—Displays the top five OpenFlow instances that are rent by the most tenants. For more information, see "Top5 OF instances."
Tenant status
The tenant status pie chart displays the number of tenants by status. Each slice represents the number of tenants in a specific state. The state of a tenant depends on the level of the most severe alarms generated on the virtual OpenFlow devices that the tenant rents.
1. Point to a slice to view the number of tenant in the state.
2. Click a legend to hide or show the corresponding slice in the pie chart.
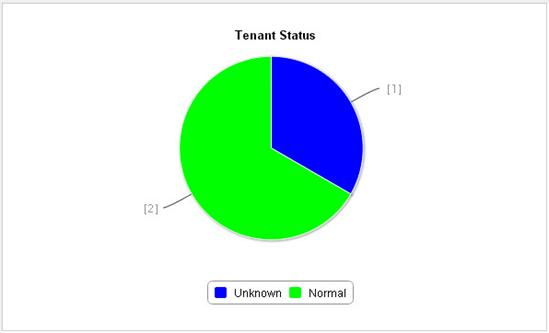
Tenant traffic rate chart
The tenant traffic rate chart displays the receiving and transmitting rate trend of virtual OpenFlow devices rent by a tenant over a time range. The X-axis shows the time. The Y-axis shows the rate. The receiving and transmitting rates are represented in different colors, as shown in Figure 27.
By default, the chart displays the rate trend from 00:00 to the current time.
1. Click 1h, 1d, 1w, 1m, or 1y to view the tenant rate trend over the most recent hour, most recent day, most recent week, most recent month, or most recent year, respectively, or click Customize to set the start time and end time for query.
2. Select the tenant to view from the Select Tenant list.
3. Click a legend to hide or show the rate in the line chart.
Figure 27 Tenant traffic rate chart
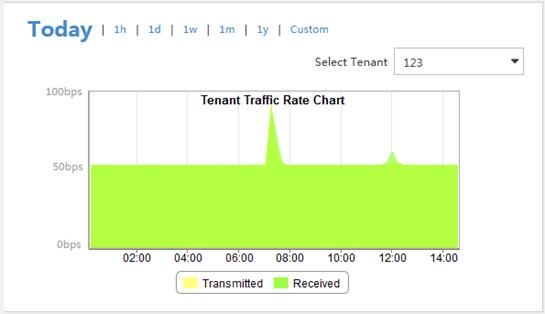
DPID usage
The DPID usage chart displays the numbers of used OpenFlow instances and unused OpenFlow instances. Each slice represents the number of DPID in used or unused state, as shown in Figure 28.
1. Point to a slice to view the number of DPIDs in the state.
2. Click a legend to hide or show the corresponding slice in the pie chart.
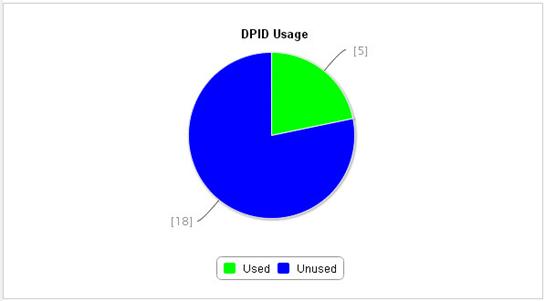
Top5 OF instances
The bar chart displays the top five tenants that rent the most OpenFlow instances. The X-axis shows the number of rented OpenFlow instances. The Y-axis shows the top five tenants in descending order of rented OpenFlow instance numbers. Each color represents a tenant, as shown in Figure 29.
1. Point to a bar to view the number of OpenFlow instances of a tenant.
2. Click a legend to hide or show the corresponding bar.
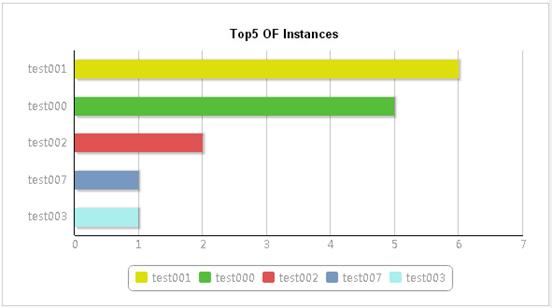
Viewing the tenant list
The tenant list includes the following parameters:
· Status—State of the most severe alarms on the virtual OpenFlow devices that the tenant rents. Options are:
? Unmanaged
? Unknown
? Normal
? Warning
? Minor
? Major
? Critical
· Tenant Name—Name of the tenant.
· Description—Description of the tenant.
· Creation Time—Time when the tenant was created.
· Traffic—Total traffic volume of the virtual OpenFlow devices rent by the tenant.
· Topology—Click the View Topology icon ![]() to view the topology of the tenant network.
For more information about viewing topology of the tenant network, see "Viewing the tenant topology."
to view the topology of the tenant network.
For more information about viewing topology of the tenant network, see "Viewing the tenant topology."
· Modify—Click the Modify icon ![]() to modify the tenant. For information about
modifying the tenant, see "Modifying a tenant."
to modify the tenant. For information about
modifying the tenant, see "Modifying a tenant."
· Delete—Click the Delete icon ![]() to delete the tenant. For information about
deleting the tenant, see "Deleting tenants."
to delete the tenant. For information about
deleting the tenant, see "Deleting tenants."
Querying tenants
1. Access the tenant list page.
2. In the query box on the top right, enter a partial or complete tenant name.
3. Click the Query
icon ![]() .
.
The tenant list displays all tenants that match the query criterion.
Viewing the tenant details
Click the tenant name to view the detailed information of that tenant. The tenant details page includes the following areas and parameters:
· Tenant Details area
? Tenant Name—Name of the tenant.
? Status—State of the most severe alarms on the virtual OpenFlow devices that the tenant rents.
? Description—Description of the tenant.
? Creation Time—Time when the tenant was created.
? Traffic—Total traffic volume of the virtual OpenFlow devices rent by the tenant.
? Instances—Number of OpenFlow instances that are rent by the tenant.
· OF Instance List
The list displays information about rented OpenFlow instances. For information about parameters in the list, see "Viewing the OpenFlow instance list."
? Device Status—State of the device to which the OpenFlow instance belongs:
- Critical
- Major
- Minor
- Warning
- Normal
- Unknown
- Unmanaged
? Device Label—Device label of the OpenFlow instance.
? DPID—DPID that uniquely identifies the OpenFlow instance.
? Member VLAN—Range of VLANs in which the OpenFlow instance takes effect.
? IP Address—IP address of the device to which the OpenFlow instance belongs.
? Controller—Controller to which the OpenFlow instance is connected.
Adding a tenant
1. Access the tenant list page.
2. Click Add.
3. Configure the following parameters:
? Tenant Name—Enter the tenant name to uniquely identify the tenant.
? Description—Enter the description of the tenant.
? Select Device—Configure the virtual OpenFlow devices that the tenant can use. For information about the configuration procedure, see "Selecting devices."
The tenant is in Unknown state when its virtual OpenFlow device list is empty.
4. Click OK.
Modifying a tenant
1. Access the tenant list page.
2. Click the Modify
icon ![]() for the tenant to be
modified.
for the tenant to be
modified.
3. Configure the following parameters:
? Description—Enter a new description for the tenant.
? Select Device—Modify the virtual OpenFlow devices that the tenant can use. For information about the configuration procedure, see "Selecting devices."
4. Click OK.
Deleting tenants
Delete virtual OpenFlow devices individually or in batches.
Deleting a single tenant
1. Access the tenant list page.
2. Click the Delete
icon ![]() for the tenant to be deleted.
for the tenant to be deleted.
3. Click OK.
Deleting tenants in batches
1. Access the tenant list page.
2. Select the tenants you want to delete.
3. Click Delete.
A confirmation dialog box appears.
4. Click OK.
Viewing the tenant topology
Click the View
Topology icon ![]() for the tenant to be viewed. The logical
topology page appears. For information about viewing the tenant topology, see
"Managing the logical topology."
for the tenant to be viewed. The logical
topology page appears. For information about viewing the tenant topology, see
"Managing the logical topology."
Managing apps
SDNM calls the API of controllers to upload, activate, and enable apps on the controllers that have been added to SDNM.
Managing the app library
The app library stores all apps that are uploaded to SDNM.
Viewing the app list
1. Click the Service tab.
2. From the navigation tree, select VAN SDN Manager > App Management > App Library.
The app library page appears, displaying apps in grid view by default.
You can switch between the grid view and list view.
? The Grid View is organized by app name. Each app grid contains a list of controllers on which the app is deployed.
? The List View displays basic information and deployment status for every app on every controller.
Both views provide the same functions. In grid view, some of the buttons or links can be hidden when an app is not selected.
App library list contents
? App Name—Name of the app. Click the name to view its details.
? Version—Version of the app.
? Vendor—Vendor of the app.
? Controllers—Number of the controllers where the app is uploaded or deployed.
? Description—Descriptive information about the app.
? Operation—Click the Operation icon ![]() to
display the Operation menu of the app. The menu
includes the following options:
to
display the Operation menu of the app. The menu
includes the following options:
- Deploy—Deploy the app on the controller.
- Undeploy—Undeploy and delete the app from the controller.
- Enable—Enable the app on the controller.
- Disable—Disable the app on the controller.
- Modify—Modify basic information about the app.
When the controller is operating in team mode, an operation to any app on the team is synchronized to other controllers in active state.
Querying apps by using basic query
1. Access the app list page.
2. Enter a partial or complete app name in the Query field at the upper right corner.
3. Click the Query
icon ![]() .
.
The app list displays all apps that match the query criterion.
Querying apps by using advanced query
1. Access the app list page.
2. Click the Advanced
icon ![]() next to the basic query field. The advanced query panel is unfolded.
next to the basic query field. The advanced query panel is unfolded.
3. Set the following query criteria:
? App Name—Enter a partial or complete app name.
? Vendor—Select an app vendor.
Empty fields are ignored.
4. Click Query.
The app list displays all apps that match the query criteria.
5. Click Reset to clear the query criteria and display all apps.
Importing an app
1. In the app list, click Import.
The Import App page appears.
2. Configure the following parameters:
? Select App File—Select the app file to be imported.
The app file must be a .zip file. The .zip file must include the following items:
- A .descriptor file that include fields such as App_id, App_name, and Version.
- At least one app executable on the controller.
- All dependent programs for each app.
? Remarks—Enter remarks about the app.
? App Icon—Select an icon for the app by using one of the following methods:
- Use Predefined Icon—Select this option and select a file from the Predefined Icon list.
- Upload Image File—Select this option and browse to a custom icon file.
3. Click OK.
Viewing app details
1. Access the app list page.
2. On the app list, click the name of an app to view its details.
The page includes the following areas and parameters:
App Info
For information about parameters in this area, see "Viewing the app list." The value of the Description field is obtained from the app file. The value of the Remarks field is configured by the operator when the app is imported.
Controller List
? App Status—Status of the app on the controller.
? Operation—Deploy, undeploy, enable, and disable the app.
For information about other parameters in this area, see "Viewing the controller list."
Modifying an app
1. Access the app list page.
2. On the app list, click the Operation icon ![]() for the app to be
modified and select Modify.
for the app to be
modified and select Modify.
The Modify App Info page appears.
3. Enter remarks in the Remarks field.
4. Set the app icon.
5. Click OK.
Deleting apps
Deleting an app in SDNM does not delete it from controllers.
To delete apps from SDNM:
1. Access the app list page.
2. On the app list, select one or more apps to be deleted.
3. Click Delete.
A confirmation dialog box appears.
4. Click OK.
Deploying or undeploying an app
1. Access the app list page.
2. On the app list, click the Operation icon ![]() for an app and
select Deploy or Undeploy.
for an app and
select Deploy or Undeploy.
The page for deploying or undeploying the app appears.
3. Configure deployment settings.
To deploy the app, select a deployment model and the controllers to deploy the app to. Options for Deployment Model are Upload and Deploy, Upload Only, and Deploy Only.
To undeploy the app, select an undeployment model and the controller to undeploy the app from. Undeployment Model has a fixed value of Undeploy and Delete.
4. Click OK.
Enabling or disabling an app
1. Access the app list page.
2. On the app list, click the Operation icon ![]() for an app and
select Enable or Disable.
for an app and
select Enable or Disable.
The page for enabling or disabling the app appears.
3. On the controller list, select controllers where the app is located.
4. Click OK.
Managing app licenses
App license management allows you to manage and deploy licenses, and activate and deactivate controllers by the licenses.
Viewing the app license list
1. Click the Service tab.
2. From the navigation tree, select VAN SDN Manager > App Management > App License.
The App License page appears.
App license list contents
? License Status—State of the license. The value can be New, Active, Inactive, or Expired.
? Serial Number—Serial number of the license. Click the serial number to view its details.
? App Name—Name of the product that can be activated by the license.
? License Type—Type of the license. The value can be Production, Test, Demo, Trial/Eval, or INSTALL.
? Controller—Label of the controller where the license is deployed. Click the label to view its details.
? Max. Nodes Allowed—Maximum number of controllers where the license can be deployed.
? Used Nodes—Number of the controllers where the license has been deployed.
? Deployed Time—Time when the license was deployed on the controller.
? Expiration Date—Date when the license expires.
Viewing license details
1. Access the app license list page.
2. On the app license list, click the serial number of a license to view its details.
The page has the following parameters:
? License Status—State of the license. The value can be New, Active, Inactive, or Expired.
? License Key—Key of the license.
? License Type—Type of the license. The value can be Production, Test, Demo, Trial/Eval, or Install-Trial.
? Deployed Time—Time when the license was deployed on the controller.
? Serial Number—Serial number of the license, which uniquely identifies the license.
? App Name—Name of the product that can be activated by the license.
? Controller—Controller where the license is deployed.
? Expiration Date—Date when the license expires.
Querying app licenses by using basic query
1. Access the app license list page.
2. Enter a partial or complete serial number in the Query field at the upper right corner.
3. Click the Query icon ![]() .
.
The app license list displays all app licenses that match the query criterion.
Querying app licenses by using advanced query
1. Access the app license list page.
2. Click the Advanced
icon ![]() next to the basic query field. The advanced query panel is unfolded.
next to the basic query field. The advanced query panel is unfolded.
3. Set the following query criteria:
? Serial Number—Enter a partial or complete serial number.
? License Type—Select a type from the list.
? Controller—Select a controller where the license is deployed from the list.
Empty fields are ignored.
4. Click Query.
The app license list displays all app licenses that match the query criteria.
5. Click Reset to clear the query criteria and display all licenses.
Deploying a license
1. Access the app license list page.
2. On the app license list, click Deploy.
The Deploy page appears.
3. In the Select License area, select the serial number of the license.
4. In the Select Controller area, select the controllers where the license is to be deployed.
a. Click Add.
b. On the controller list, select the controllers and click OK.
The selected controllers appear in the Select Controller area.
To delete a controller, click the
Delete icon ![]() .
.
To clear the Select Controller area and reselect controllers, click Delete All.
5. Click OK.
The license appears on the license list in the Active state.
Activating or deactivating controllers by license
1. Access the app license list page.
2. On the app license list, select controllers to be activated or deactivated.
3. Click Activate or Deactivate.
Managing licenses in the license library
Accessing the license library page
1. Access the app license list page.
2. Click License Library.
The License Library page appears.
License library list contents
? Serial Number—Serial number of the license.
? License Key—Key of the license.
? Description—Descriptive information about the license.
? Creation Time—Time when the license was imported or added.
? Modify—Click the Modify icon ![]() to
modify the license. For more information, see "Modifying a license."
to
modify the license. For more information, see "Modifying a license."
? Delete—Click the Delete icon ![]() to
delete the license. For more information, see "Deleting a single license."
to
delete the license. For more information, see "Deleting a single license."
Querying licenses in basic mode
1. On the License Library page, enter a partial or complete serial number in the Query field at the upper right corner.
2. Click the Query
icon ![]() .
.
The app license list displays all licenses that match the query criterion.
Querying licenses in advanced mode
1. On the License Library
page, click the Advanced icon ![]() next to the basic query field. The advanced query panel is unfolded.
next to the basic query field. The advanced query panel is unfolded.
2. Set the following query criteria:
? Serial Number—Enter a partial or complete serial number.
? Description—Enter partial or complete descriptive information for licenses.
Empty fields are ignored.
3. Click Query.
The app license list displays all licenses that match the query criteria.
4. Click Reset to display all licenses.
Importing a license
1. On the License Library page, click Import.
The Import License page appears.
2. Click Browse in the Select License File field to select a .csv file.
The .csv file includes license keys and serial numbers separated by commas (,).
3. Click OK.
Adding a license
1. On the License Library page, click Add.
The Add License page appears.
2. Configure the license key, serial number, and description.
3. Click OK.
Modifying a license
1. On the License Library page, click the Modify icon ![]() for a license.
for a license.
The Modify License page appears.
2. Enter descriptive information about the license.
3. Click OK.
Deleting a single license
1. On the License List
page, click the Delete icon ![]() for a license.
for a license.
A confirmation dialog box appears.
2. Click OK.
Deleting licenses in batches
1. On the License Library page, select one or more licenses.
2. Click Delete.
A confirmation dialog box appears.
3. Click OK.
The deleting result page appears.
Viewing license deployment history
Deployment history includes records of the app licenses that previously failed to be deployed on controllers.
Accessing the license deployment history page
1. Access the app license list page.
2. On the app license list, click License Library.
The License Library page appears.
3. Click History.
The License History page appears.
License list contents
? Serial Number—Serial number of the license. Click the serial number to view its details.
? License Key—Key of the license.
? Description—Descriptive information about the license.
? Controller—Controller where the license is deployed.
? Deployed Time—Time when the license failed to be deployed on the controller.
Querying license deployment history in basic mode
1. On the license deployment history page, enter a partial or complete serial number in the Query field at the upper right corner.
2. Click the Query
icon ![]() .
.
The license deployment history list displays all records that match the query criterion.
Querying license deployment history in advanced mode
1. On the license deployment history page, click the Advanced icon ![]() next to the basic query field. The advanced
query panel is unfolded.
next to the basic query field. The advanced
query panel is unfolded.
2. Set the following query criteria:
? Serial Number—Enter a partial or complete serial number.
? Controller—Select controllers for deployment records.
Empty fields are ignored.
3. Click Query.
The license deployment history list displays all records that match the query criteria.
4. Click Reset to display all license deployment records.
Redeploying licenses
1. On the App License page, click License Library.
2. Click History.
3. Select licenses to be redeployed.
4. Click Deploy.
Configuring an app monitor
This function allows you to deploy, undeploy, enable, or disable an app on a controller.
Viewing the app monitor list
1. Click the Service tab.
2. From the navigation tree, select VAN SDN Manager > App Management > App Monitor.
The App Monitor page appears.
You can switch between the grid view and list view. The grid view provides app deployment details.
App monitor list contents
? App Name—Name of the app. Click the name to view its details.
? App Status—State of the app:
- Active
- Disabled
- Resolved
- Staged
- Installing
? Version—Version of the app.
? Vendor—Vendor that provides the app.
? Description—Descriptive information about the app.
? Controller—Controller where the app has been uploaded or deployed.
? Deployed Time—Time when the app was deployed on the controller.
Querying monitored apps in basic mode
1. Access the app monitor list page.
2. Enter a partial or complete app name in the Query field at the upper right corner.
3. Click the Query
icon ![]() .
.
The app monitor list displays all monitored apps that match the query criterion.
Querying monitored apps in advanced mode
1. Access the app monitor list page.
2. Click the Advanced icon ![]() next to the basic query field. The advanced
query panel is unfolded.
next to the basic query field. The advanced
query panel is unfolded.
3. Set the following query criteria:
? App Name—Enter a partial or complete app name.
? Controller—Select a controller where the app has been uploaded or deployed.
? App Status—Select a state from the list.
Empty fields are ignored.
4. Click Query.
The app monitor list displays all monitored apps that match the query criteria.
5. Click Reset to clear the query criteria and display all monitored apps.
Viewing app deployment information
1. Access the app monitor list page.
2. On the app monitor list, click the name of an app whose deployment information you want to view.
The App Deployment Info page appears.
The App Info area lists the app name and version.
The Controller Info area lists the device label, model, IP address, and version of the controller where the app is deployed.
Deploying or undeploying an app
1. On the App Monitor page, select apps to be deployed or undeployed.
2. Click Deploy or Undeploy.
The deployment or undeployment result page appears.
3. Click Back to go back to the App Monitor page.
Enabling or disabling an app
1. On the App Monitor page, select apps to be enabled or disabled.
2. Click Enable or Disable.
The operation result page appears.
3. Click Back to go back to the App Monitor page.
Managing topologies
SDNM displays the physical topology and the logical topology of the OpenFlow network. SDNM provides easy methods to perform the following tasks:
· Quickly locate and view network resources.
· Configure OpenFlow instances and service flows.
For more information about basic functions and operations of topology, see H3C Intelligent Management Center Enterprise and Standard Platform Administrator Guide.
Managing the overall topology
The Overall Topology tab displays SDN network controllers, OpenFlow switches, non-OpenFlow switches, and their connection states. The Overall Topology tab is used to perform the following operations to view the following items:
· Overall topology.
· Detailed information about the devices.
· Service flow path.
· Devices by type.
· OpenFlow devices by controller.
Viewing the overall topology
1. Click the Service tab.
2. From the navigation tree, select VAN SDN Manager > OF Topology. By default, the Overall Topology tab is displayed, as shown in Figure 30.
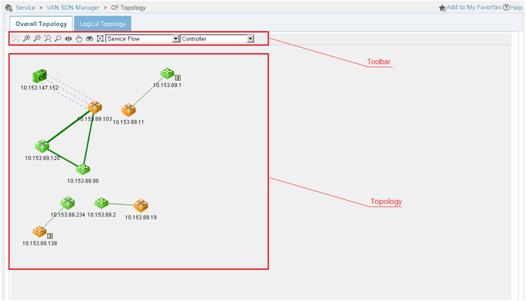
Table 8 describes the toolbar icons.
Table 8 Topology toolbar icons
|
Icon |
Name |
Remarks |
|
|
1:1 |
Displays the topology in its original size. |
|
|
Zoom In |
Zooms in the topology by 10%. |
|
|
Zoom Out |
Zooms out the topology by 10%. |
|
|
Fit Content |
Resizes the topology to fit the current window. |
|
|
Magnifier |
Magnifies the area where the pointer is hovering. |
|
|
Bird's Eye View |
Opens or closes the Bird's Eye View page. |
|
|
Hand/Pointer Tool Switchover |
Switches between the hand tool and the pointer tool. |
|
|
Find |
Finds a device quickly. |
|
|
Layout |
Re-arranges the layout of the topology. |
|
|
Service Flow |
Locates the service flow path quickly. For more information, see "Viewing a service flow path." |
|
|
Controller |
Select a controller from the list to filter the OpenFlow devices it manages. For more information, see "Viewing OpenFlow devices by controller." |
Table 9 describes the device icons in the topology area.
|
Device icon |
Device name |
Remarks |
|
|
Controller |
The controller icon is displayed when the controllers are configured in other modes rather than team mode. |
|
|
Controller Team |
The controller team icon is displayed only when the controllers are configured in team mode. |
|
|
OF device |
Displayed for devices that support only OpenFlow forwarding. |
|
|
OF hybrid device |
Displayed for devices that support both ordinary forwarding and OpenFlow forwarding. |
|
|
OF instance |
Displayed for virtual OpenFlow devices. |
Viewing device information
Select Device Information to view basic information about the devices and information about the controllers or OpenFlow instances configured on the devices.
Viewing device details
On the Overall Topology tab, right-click a device icon and select Device Information. The Device Details page appears.
For more information about the device parameters, see "Managing resources."
Viewing OpenFlow instances on an OpenFlow switch
1. On the Overall Topology tab, double-click an OpenFlow switch icon.
All OpenFlow instances configured on this OpenFlow switch are displayed in the expanded area. The OpenFlow instances can be viewed or modified. For more information, see "Viewing OpenFlow instance information" and "Modifying an OpenFlow instance."
2. To collapse all the OpenFlow instances, double-click the expanded area.
Viewing a controller team
1. On the Overall Topology tab, double-click a controller team icon.
All the controllers in this team are displayed in the expanded area.
2. To collapse all the controllers, double-click the expanded area.
Viewing a service flow path
1. On the Overall Topology tab, click the Service Flow list in the toolbar.
2. Click the path of a service flow. OpenFlow instances are grayed out if the selected service flow does not pass through them.
3. To restore the display of the topology, select Service Flow from the list.
Setting the device label display mode
1. On the Overall Topology tab, right-click a blank area in the topology.
2. Select Device Label from the menu that appears.
3. Select Show IP or Show Label.
The topology displays the device label in the selected mode.
Viewing devices by type
1. On the Overall Topology tab, right-click a blank area in the topology.
2. Select Device Type from the shortcut menu.
The Device Type menu includes the following options:
? All—All types of devices.
? OF-Only—Devices that support only OpenFlow forwarding.
? OF-Hybrid—Devices that support both ordinary forwarding and OpenFlow forwarding.
? Non-OF—Devices that do not support OpenFlow forwarding.
Controllers are categorized as non-OpenFlow devices.
|
|
NOTE: OpenFlow instances are not devices. They are grayed out if you view devices by type. |
3. Select an option from the Device Type menu.
Devices that do not match the selected type are grayed out.
4. To display all the devices, select All from the Device Type menu.
Viewing OpenFlow devices by controller
1. On the Overall Topology tab, click the Controller list.
2. Select a controller.
The OpenFlow devices that are not managed by the controller are grayed out.
3. To restore the display of the topology, select Controller from the list.
Managing the logical topology
The Logical Topology tab displays virtual OpenFlow devices, endpoints, and their connections on the SDN network. It also enables you to perform the following tasks:
· View the logical topology.
· Switch topology layout modes.
· View OpenFlow instances by controller.
· Set the endpoint label display mode.
· View the tenant network.
· View the shortest path between two OpenFlow instances.
Viewing the logical topology
1. Click the Service tab.
2. From the navigation tree, select VAN SDN Manager > OF Topology.
By default, the Overall Topology tab is displayed.
3. Click the Logical Topology tab, as shown in Figure 31.
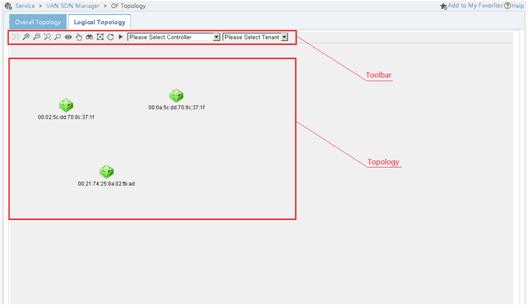
Table 10 describes the toolbar icons.
Table 10 Topology toolbar icons
|
Icon |
Name |
Remarks |
|
|
1:1 |
Displays the topology in its original size. |
|
|
Zoom In |
Zooms in the topology by 10%. |
|
|
Zoom Out |
Zooms out the topology by 10%. |
|
|
Fit Content |
Resizes the topology to fit the current window. |
|
|
Magnifier |
Magnifies the area where the pointer is hovering. |
|
|
Bird's Eye View |
Opens or closes the Bird's Eye View page. |
|
|
Hand/Pointer Tool Switchover |
Switches between the hand tool and the pointer tool. |
|
|
Find |
Finds a device quickly. |
|
|
Layout |
Rearranges the layout of the topology. |
|
|
Reload |
Reloads the topology. |
|
|
Stop/Spring Layout |
Switches the spring layout. For more information, see "Switching topology layout modes." |
|
|
Controller |
Displays the OpenFlow instances by controller. For more information, see "Viewing OpenFlow instances by controller." |
|
|
Tenant |
Displays the OpenFlow instances rented by a tenant. For more information, see "Viewing the tenant network." |
Table 11 describes the device icons in the topology area.
|
Device icon |
Device name |
Remarks |
|
|
Controller |
The controller icon is displayed when the controllers are configured in other modes rather than team mode. |
|
|
Controller Team |
The controller team icon is displayed only when the controllers are configured in team mode. |
|
|
OF instance |
The OF instance icon is displayed for virtual OpenFlow devices. |
|
|
Endpoint |
N/A |
Switching topology layout modes
1. On the Logical Topology tab, the topology is
set to spring layout by default. To switch to the fixed
layout, click the Stop icon ![]() .
.
2. To switch to the spring layout, click the Spring Layout
icon ![]() .
.
Viewing OpenFlow instances by controller
1. On the Logical Topology tab, click the Controller list in the toolbar.
2. Select a controller from the Controller list.
The selected controller and its managed OpenFlow instances (connected with dotted lines) are displayed in the topology.
3. To initiate the display, select Controller from the list.
Setting the DPID and endpoint label display mode
1. On the Logical Topology tab, right-click a blank area.
The shortcut menu includes the following options:
? DPID Label—Includes Show OF Instance DPID and Show OF Instance DPID Label.
? Endpoint Label—Includes Display Endpoint IP, Display Endpoint MAC, and Hide Endpoint Label.
2. Select a display mode.
The topology displays DPIDs and endpoint labels in the selected mode.
Viewing the tenant network
1. On the Logical Topology tab, click the Tenant list in the toolbar.
2. Select a tenant from the Tenant list.
The OpenFlow instances rented by this tenant are displayed in the topology.
3. To display all the OpenFlow instances, select Tenant from the list.
Viewing the shortest path between two OpenFlow endpoints
1. On the Logical Topology tab, select two OpenFlow endpoint icons while pressing Ctrl.
2. Right-click either of the two OpenFlow endpoints and select Display Shortest Path.
The shortest path between the two OpenFlow endpoints is highlighted.
Managing the OpenFlow virtual network
In addition to the previous functions, the OpenFlow topology page manages and configures the SDN network.
Viewing OpenFlow instance information
To view OpenFlow instance information, use either of the following methods:
· To view OpenFlow instance information on the Overall Topology tab:
a. Click the Service tab.
b. From the navigation tree, select VAN SDN Manager > OF Topology.
By default, the Overall Topology tab is displayed.
c. Double-click an OpenFlow switch icon.
All the OpenFlow instances configured on this OpenFlow switch are displayed in the expanded area.
d. Right-click an OpenFlow instance icon and select View OF Instance Information.
The OpenFlow instance information page appears.
· To view OpenFlow instance information on the Logical Topology tab:
a. Click the Service tab.
b. From the navigation tree, select VAN SDN Manager > OF Topology.
By default, the Overall Topology tab is displayed.
c. Click the Logical Topology tab.
d. Right-click an OpenFlow instance icon and select View OF Instance Information.
The OpenFlow instance information page appears.
For more information about the parameters of the OpenFlow instances, see "Managing an OpenFlow instance on the OpenFlow instance details page."
Adding an OpenFlow instance
1. Click the Service tab.
2. From the navigation tree, select VAN SDN Manager > OF Topology.
By default, the Overall Topology tab is displayed.
3. Right-click an OpenFlow switch icon.
4. Select Add OF Instance.
The Add OF Instance page appears.
5. Configure the OpenFlow instance parameters in the Add OF Instance page.
Add OF Instance Window contents
? Instance Name—Enter the name of the OpenFlow instance (the OpenFlow device label).
? Controller—Select a controller to manage this OpenFlow instance.
? VLAN ID—Enter the ID of the VLAN in which the OpenFlow instance operates.
? VLAN Mask—Enter the VLAN mask of the OpenFlow switch. If the OpenFlow switch does not support the VLAN mask, this field is unavailable. The VLANs to be associated are calculated by a bitwise AND operation on the specified VLAN ID and mask. The VLAN mask supports non-contiguous 1s and ignores all 0 bits. For example, if the VLAN ID is 17 and the VLAN mask is 4094, the bitwise AND operation result is 16. Because the lowest-order bit of the VLAN mask is 0, the lowest-order bit of 16 can be 0 or 1. The VLANs in which the OpenFlow device takes effect is VLAN 16 and VLAN 17.
? In-Band Management VLAN—Enter the ID of the in-band management VLAN for the virtual OpenFlow device. Traffic in this VLAN is forwarded in the normal forwarding process instead of the OpenFlow forwarding process.
6. Click OK.
Modifying an OpenFlow instance
To modify an OpenFlow instance, use either of the following methods:
· Using the Overall Topology tab:
a. Click the Service tab.
b. From the navigation tree, select VAN SDN Manager > OF Topology. By default, the Overall Topology tab is displayed.
c. Double-click an OpenFlow switch icon.
All the OpenFlow instances configured on this OpenFlow switch are displayed in the expanded area.
d. Right-click an OpenFlow instance icon and select Modify OF Instance.
The OpenFlow instance modification page appears.
e. Select the controllers to manage this OpenFlow instance.
f. Click OK.
· Using the Logical Topology tab:
a. Click the Service tab.
b. From the navigation tree, select VAN SDN Manager > OF Topology.
By default, the Overall Topology tab is displayed.
c. Click the Logical Topology tab.
d. Right-click the OpenFlow instance icon and select Modify OF Instance.
The OpenFlow instance modification page appears.
e. Select the controllers to manage this OpenFlow instance.
f. Click OK.
Enabling or disabling ports for an OpenFlow instance
1. Click the Service tab.
2. From the navigation tree, select VAN SDN Manager > OF Topology.
By default, the Overall Topology tab is displayed.
3. Right-click an OpenFlow switch icon and select Enable Port.
4. On the page that appears, configure the following parameters:
? Add to DPID—Select a DPID for the port to be added.
? VLAN ID—Select a VLAN on which the OpenFlow instance takes effect.
? Please select the ports you want to add—Select or clear the ports to be configured.
5. Click OK.
Viewing flow entries
1. Click the Service tab.
2. From the navigation tree, select VAN SDN Manager > OF Topology.
By default, the Overall Topology tab is displayed.
3. Click the Logical Topology tab.
4. Right-click an OpenFlow instance icon and select Display Flow Entry.
The Display Flow Entry list appears. The details of the flow entries are displayed in the Display Flow Entry list:
? OF Instance—Unique identifier of the OpenFlow instance.
? Input Port—Input port in the match field of the entry.
? Ethernet Source Address—Ethernet source MAC address/mask in the match field of the entry.
? Ethernet Destination Address—Ethernet destination MAC address/mask in the match field of the entry.
? IPv4 Source Address—Source IP address/mask in the match field of the entry.
? IPv4 Destination Address—Destination IP address/mask in the match field of the entry.
? Flow Table ID—ID of the flow table to which the flow entry belongs.
? Priority—Priority of the flow entry. A higher value means a higher priority.
? Idle Timeout—Idle timeout time of the flow entry in seconds. A value of 0 means the flow entry never expires.
? Hard Timeout—Maximum lifetime of the flow entry in the flow table. A value of 0 means the flow entry never expires.
The flow entries can also be viewed on a link or the flow entries corresponding to a specific endpoint by executing the following operations:
· Right-click a link and select Display Flow Entry. The flow entries of the link between two connected devices are displayed.
· Right-click an endpoint icon and select Display Endpoint Flow Entry. The flow entries corresponding to this endpoint are displayed.
The descriptions of the flow entry parameters are the same as those of the OpenFlow instance flow entry parameters.
Viewing service flows
1. On the Overall Topology tab, highlight a service flow. For more information, see "Viewing a service flow path."
2. Right-click a link between two OpenFlow instances and select Display link information.
All the link information is displayed in the bottom of the Overall Topology tab.
? All the links between the two OpenFlow instances are displayed in the link display area.
? Detailed information about the links is displayed in the Path Information list:
- Status—Status of the selected service flow on the link.
- Link Name—Name of the link that connects two DPIDs.
- Traffic (KB)—Traffic of the selected service flow, in kilobytes.
- Online Time—Online time of the selected service flow.
- Bandwidth (Mbps)—Bandwidth specified in a flow-entry-attached meter in megabytes. This field displays null if it is not associated with the meter.
- Utilization (%)—Utilization rate of the service flow. Utilization rate = Online time / (Current time – Creation time) × 100%.
- OF Entry—Click the Display OF Entry icon ![]() to view more
information about the flow entry.
to view more
information about the flow entry.
For more information about the service flow parameters, see "Viewing the service flow list."
For more information about locating a flow entry, see "Querying flow entries by using a basic query."
3. In the link display area, right-click a link and select Display Traffic Information.
Information about the service flow traffic on the current day is displayed.
Adding a service flow
Accessing the Add Service Flow page
Access the Add Service Flow page by using one of the following methods:
· Access from the overall topology:
a. Click the Service tab.
b. From the navigation tree, select VAN SDN Manager > OF Topology.
By default, the Overall Topology tab is displayed.
c. Double-click an OpenFlow switch to view all OpenFlow instances of the switch.
d. Select one or more links connecting the two OpenFlow instances for which you want to add a service flow.
e. Right-click a selected link and select Add Service Flow from the shortcut menu.
· Access from the logical topology:
a. Click the Service tab.
b. From the navigation tree, select VAN SDN Manager > OF Topology.
By default, the Overall Topology tab is displayed.
c. Click the Logical Topology tab.
d. Select one or more links connecting the two OpenFlow instances for which you want to add a service flow.
e. Right-click a selected link and select Add Service Flow from the shortcut menu.
Configuring the service flow parameters
1. In the Path Name area, enter a path name. The default path name includes the DPIDs of the start and end nodes.
2. In the Add OF Entry area, configure the following parameters:
? OF Instance—Unique identifier of the OpenFlow instance to which the newly added flow entry belongs. This field cannot be edited.
? Input Port—Input port in the match field of the entry. This field cannot be edited.
? Apply-Actions—Actions of the newly added flow entry. For more information about the actions, see "Configuring actions." This field cannot be edited.
? Flow Table ID—Enter the ID of the flow table to which the newly added flow entry belongs.
? Idle Timeout—Enter the idle timeout time for the newly added flow entry in seconds. If the flow entry does not match any packets when the idle timeout timer expires, the flow entry is removed. If the value is set to 0, the newly added flow entry never expires.
? Hard Timeout—Enter the maximum lifetime of the newly added flow entry in seconds. Whether the flow entry matches packets or not, it is removed when this timer expires. If the value is set to 0, the newly added flow entry never expires.
? Burst Size—Enter the maximum size of the packet that the meter can handle. The unit is kilobyte. This field is not associated with the meter table if the value is null.
? Rate—Enter the lowest rate to which the band can apply. The meter applies the band with the highest configured rate that is lower than the current measured rate. This field is not associated with the meter table if the value is null.
? IP Protocol—Select the protocol type of the newly added flow entry in the match field of the entry. Options are:
- TCP
- UDP
- ICMP
- ICMPv6
- SCTP
3. Click OK.
Display the shortest path between two OpenFlow instances to locate the service flow to which the link needs to be added. For more information, see "Viewing the shortest path between two OpenFlow endpoints."
Managing reports
SDNM predefines various types of report templates for displaying asset and traffic statistics in the OpenFlow network. Operators can create real-time and scheduled reports based on these templates.
Predefined report templates include:
· Controller Packet Loss Statistics Report
· Controller Traffic Statistic Report
· Group Traffic Statistic Report
· OF Instance Traffic Statistic Report
· SDN Asset Statistic Report
· Port Traffic Statistic Report
· Flow Table Traffic Statistic Report
· Flow Entry Traffic Statistic Report
SDNM supports basic report functions provided by the IMC Platform, such as adding shortcuts, modifying, deleting, exporting, and printing SDNM reports. For more information about basic report functions, see H3C Intelligent Management Center Enterprise and Standard Platform Administrator Guide.
Managing real-time reports
Real-time reports enable operators to view the current statistics or statistics for a specific time range. Operators can print or save real-time reports to the local device.
Viewing a real-time report
1. Click the Report tab.
2. From the navigation tree, select Reports > Report Template List.
The Report Template List page appears.
3. In the Query Template area, select SDN Service Report from the Type list, and click Query.
The Report Template List displays all SDN service report templates.
4. Click the name of the report to be viewed.
The Set Parameter page appears.
5. Configure the parameters required for report generation and click OK.
Available parameters vary with report templates.
Controller Packet Loss Statistics Report
The controller packet loss statistics report displays the packet loss statistics of controllers in SDNM over a specific time range, as shown in Figure 32.
To view a controller packet loss statistics report, specify the following parameters on the Set Parameter page:
· Begin Time/End Time—Select a statistics collection time range from the list. Options are:
? Last Hour
? Last Day
? Last Week
? Last Month
? Custom Range
Select Custom Range to customize a time range.
· Begin Time—Select a start date and time for the reporting period. This parameter appears when Custom Range is selected.
· End Time—Select an end date and time for the reporting period. This parameter appears when Custom Range is selected.
Figure 32 Controller packet loss statistics report

The controller packet loss statistics report contains the following fields:
· Report Period—Statistics collection time range of the report.
· Top5 Controller Packet Loss—The top five controllers with the highest packet loss rates. The Y-axis shows the packet loss rates. The X-axis shows the controllers by Device Label (IP Address).
· Controller UID—Unique identifier of the controller.
· Device Label—Device label of the controller.
· IP Address—Management IP address of the controller.
· Lost Packets Percent (%)—Ratio of lost packets to the total number of packets received and sent by the controller in the specified time range, expressed as a percentage.
· Lost Packets—Total number of packets lost in the specified time range.
Controller Traffic Statistic Report
The controller traffic statistic report displays the total amount of traffic received and sent by the controllers in SDNM in a specific time range, as shown in Figure 33.
To view a controller traffic statistic report, specify the following parameters on the Set Parameter page:
· Begin Time/End Time—Select a statistics collection time range from the list. Options are:
? Last Hour
? Last Day
? Last Week
? Last Month
? Custom Range
Select Custom Range to customize a time range.
· Begin Time—Select a start date and time for the reporting period. This parameter appears when Custom Range is selected.
· End Time—Select an end date and time for the reporting period. This parameter appears when Custom Range is selected.
Figure 33 Controller traffic statistic report

The controller traffic statistic report contains the following fields:
· Report Period—Statistics collection time range of the report.
· Top5 Controller Traffic—The top five controllers with the highest traffic amount. The Y-axis shows the traffic amount in bytes. The X-axis shows the controllers by Device Label (IP Address).
· Controller UID—Unique identifier of the controller.
· Device Label—Device label of the controller.
· IP Address—Management IP address of the controller.
· Packets—Total number of packets received and sent by the controller in the specified time range.
· Bytes—Total number of bytes received and sent by the controller in the specified time range.
Group Traffic Statistic Report
The group traffic statistic report displays the total amount of traffic received and sent by the groups of OpenFlow instances in SDNM in a specific time range, as shown in Figure 34.
To view a group traffic statistic report, specify the following parameters on the Set Parameter page:
· Begin Time/End Time—Select a statistics collection time range from the list. Options are:
? Last Hour
? Last Day
? Last Week
? Last Month
? Custom Range
Select Custom Range to customize a time range.
· Begin Time—Select a start date and time for the reporting period. This parameter appears when Custom Range is selected.
· End Time—Select an end date and time for the reporting period. This parameter appears when Custom Range is selected.
Figure 34 Group traffic statistic report
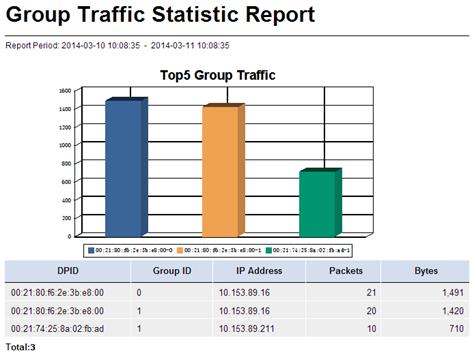
The group traffic statistic report contains the following fields:
· Report Period—Statistics collection time range of the report.
· Top5 Group Traffic—The top five groups with the highest traffic amount. The Y-axis shows the traffic amount in bytes. The X-axis shows the groups by DPID-Group ID.
· DPID—DPID of the OpenFlow instance to which the group belongs.
· Group ID—ID that uniquely identifies the group in the OpenFlow instance.
· IP Address—IP address of the OpenFlow switch hosting the OpenFlow instance to which the group belongs.
· Packets—Total number of packets received and sent by the group in the specified time range.
· Bytes—Total number of bytes received and sent by the group in the specified time range.
OF Instance Traffic Statistic Report
The OF instance traffic statistic report displays the total amount of traffic received and sent by the OpenFlow instances in SDNM in a specific time range, as shown in Figure 35.
To view an OF instance traffic statistic report, specify the following parameters on the Set Parameter page:
· Begin Time/End Time—Select a statistics collection time range from the list. Options are:
? Last Hour
? Last Day
? Last Week
? Last Month
? Custom Range
Select Custom Range to customize a time range.
· Begin Time—Select a start date and time for the reporting period. This parameter appears when Custom Range is selected.
· End Time—Select an end date and time for the reporting period. This parameter appears when Custom Range is selected.
Figure 35 OF instance traffic statistic report
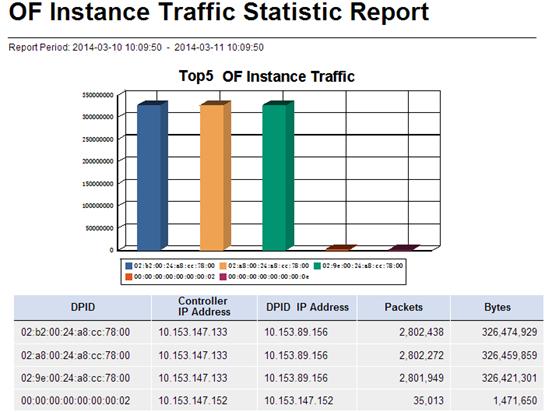
The OF instance traffic statistic report contains the following fields:
· Report Period—Statistics collection time range of the report.
· Top5 OF Instance Traffic—The top five OpenFlow instances with the highest traffic amount. The Y-axis shows the traffic amount in bytes. The X-axis shows the OpenFlow instances by DPID.
· DPID—DPID that uniquely identifies the OpenFlow instance.
· Controller IP Address—IP address of the main controller to which the OpenFlow instance is connected.
· DPID IP Address—IP address of the OpenFlow switch where the OpenFlow instance resides.
· Packets—Total number of packets received and sent by the OpenFlow instance in the specified time range.
· Bytes—Total number of bytes received and sent by the OpenFlow instance in the specified time range.
SDN Asset Statistic Report
The SDN asset statistic report displays information about the controllers, OpenFlow switches, and OpenFlow instances in SDNM and the number of each type of devices, as shown in Figure 36.
Figure 36 SDN asset statistic report

The SDN asset statistic report contains the following fields:
· SDN Asset Statistics—Displays the number and percentage of controllers, OpenFlow switches, and OpenFlow instances in SDNM.
· OF Switch
? Device Label—Device label of the OpenFlow switch.
? Status—State of the OpenFlow switch.
? IP Address—IP address of the OpenFlow switch.
? OF Instances—Number of OpenFlow instances on the OpenFlow switch.
? Interfaces—Total number of interfaces on the OpenFlow switch that are assigned to OpenFlow instances.
· OF Instance
? DPID Label—Device label of the OpenFlow instance.
? Status—State of the OpenFlow instance.
? IP Address—IP address of the OpenFlow switch where the OpenFlow instance resides.
? DPID—Unique identifier of the OpenFlow instance.
? Controller—IP address of the controller to which the OpenFlow instance is connected.
? OF Ports—Total number of ports assigned to OpenFlow instances.
? Flow Entries—Total number of flow entries contained in the flow tables that belong to the OpenFlow instance.
· Controller
? Device Label—Device label of the controller.
? Status—State of the controller.
? IP Address—Management IP address of the controller.
? Device UID—Unique identifier of the controller.
Port Traffic Statistic Report
The port traffic statistic report displays the total amount of traffic received and sent by ports assigned to OpenFlow instances in a specific time range, as shown in Figure 37.
To view a port traffic statistic report, specify the following parameters on the Set Parameter page:
· Begin Time/End Time—Select a statistics collection time range from the list. Options are:
? Last Hour
? Last Day
? Last Week
? Last Month
? Custom Range
Select Custom Range to customize a time range.
· Begin Time—Select a start date and time for the reporting period. This parameter appears when Custom Range is selected.
· End Time—Select an end date and time for the reporting period. This parameter appears when Custom Range is selected.
Figure 37 Port traffic statistic report
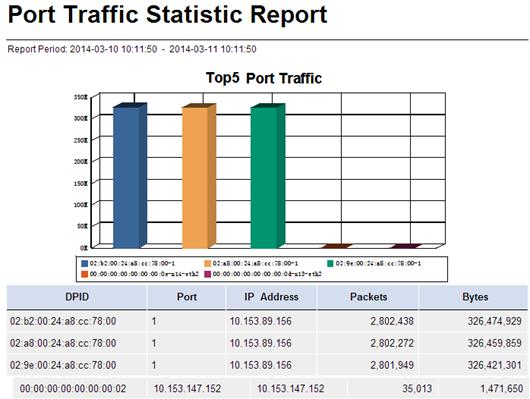
The port traffic statistic report contains the following fields:
· Report Period—Statistics collection time range of the report.
· Top5 Port Traffic—The top five ports with the highest traffic amount. The Y-axis shows the traffic amount in bytes. The X-axis shows the ports by DPID-Port.
· DPID—DPID of the OpenFlow instance to which the port is assigned.
· Port—Port index assigned by the OpenFlow switch to uniquely identify the port in the OpenFlow instance.
· IP Address—IP address of the OpenFlow switch where the port resides.
· Packets—Total number of packets received and sent by the port in the specified time range.
· Bytes—Total number of bytes received and sent by the port in the specified time range.
Flow Table Traffic Statistic Report
The flow table traffic statistic report displays the total amount of traffic received and sent by each flow table in the OpenFlow instances over a specific time range, as shown in Figure 38.
To view a flow table traffic statistic report, specify the following parameters on the Set Parameter page:
· Begin Time/End Time—Select a statistics collection time range from the list. Options are:
? Last Hour
? Last Day
? Last Week
? Last Month
? Custom Range
Select Custom Range to customize a time range.
· Begin Time—Select a start date and time for the reporting period. This parameter appears when Custom Range is selected.
· End Time—Select an end date and time for the reporting period. This parameter appears when Custom Range is selected.
Figure 38 Flow table traffic statistic report
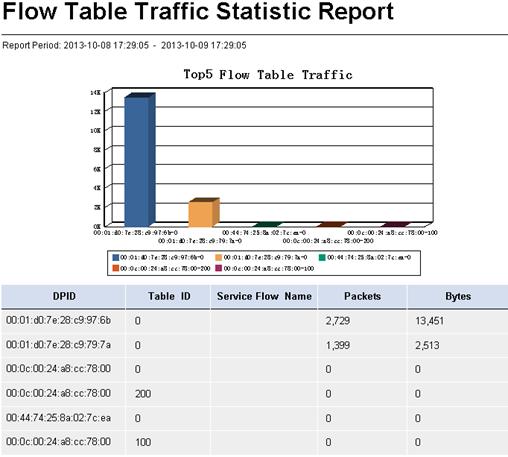
The flow table traffic statistic report contains the following fields:
· Report Period—Statistics collection time range of the report.
· Top5 Flow Table Traffic—The top five flow tables with the highest traffic amount. The Y-axis shows the traffic amount in bytes. The X-axis shows the flow tables by DPID-Table ID.
· DPID—DPID of the OpenFlow instance to which the flow table belongs.
· Table ID—ID of the flow table.
· Service Flow Name—Name of the service flow to which the flow table belongs.
· Packets—Total number of packets received and sent by the flow table in the specified time range.
· Bytes—Total number of bytes received and sent by the flow table in the specified time range.
Flow Entry Traffic Statistic Report
The flow entry traffic statistic report displays the total amount of traffic forwarded by each flow entry in the OpenFlow instances in a specific time range, as shown in Figure 39. A flow entry is uniquely identified by the combination of the DPID, OF Device Label, Table ID, Priority, and Match Field.
To view a flow entry traffic statistic report, specify the following parameters on the Set Parameter page:
· Begin Time/End Time—Select a statistics collection time range from the list. Options are:
? Last Hour
? Last Day
? Last Week
? Last Month
? Custom Range
Select Custom Range to customize a time range.
· Begin Time—Select a start date and time for the reporting period. This parameter appears when Custom Range is selected.
· End Time—Select an end date and time for the reporting period. This parameter appears when Custom Range is selected.
Figure 39 Flow entry traffic statistic report
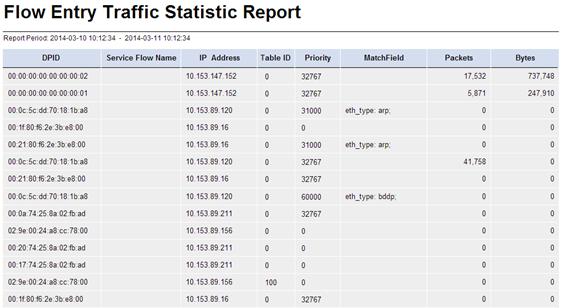
The flow entry traffic statistic report contains the following fields:
· Report Period—Statistics collection time range of the report.
· DPID—DPID of the OpenFlow instance to which the flow entry belongs.
· Service Flow Name—Name of the service flow to which the flow entry belongs. This field is Null if the flow entry does not belong to any service flow.
· IP Address—IP address of the OpenFlow switch hosting the OpenFlow instance to which the flow entry belongs.
· Table ID—ID of the flow table to which the flow entry belongs.
· Priority—Priority of the flow entry.
· Match Field—Matching field of the flow entry.
· Packets—Total number of packets forwarded by the flow entry in the specified time range.
· Bytes—Total number of bytes forwarded by the flow entry in the specified time range.
Managing scheduled reports
SDN can generate scheduled reports according to the user-defined report generation period and template. Operators can view the scheduled reports generated in different time periods for data comparison and analysis.
SDN also supports sending reports to operators by email.
Adding a scheduled report
1. Use one of the following methods to enter the page for adding a scheduled report:
? Click the Report tab and select Reports > Add Scheduled Report from the navigation tree.
? Click the Report tab, select Scheduled Reports > All Scheduled Reports from the navigation tree, and then click Add.
2. Select a template:
a. Click Select to the right of Template Name.
b. From the Type list in the Query Template area, select SDN Service Report and click Query.
c. Select the target report template.
d. Click OK.
3. Enter the report name in the Scheduled Report Name field.
4. Select an operator group that can view the report.
All operators in the selected operator group can view the report.
To view operators in an operator group:
a. Click the Operator
Group Information icon ![]() to the right of the Access
Right field.
to the right of the Access
Right field.
The Operator Group Information page appears.
b. On the Operator Group List area, select one or more operator groups.
All operators contained in the selected operator groups appear on the right.
c. Click Close to the return to the page for adding a report.
5. Specify the frequency at which the report is generated.
A scheduled report period is determined by both the schedule type and schedule time settings.
? Schedule Type—Select a schedule type. Options are:
- Daily
- Weekly
- Monthly
- Quarterly
- Half Yearly
- Yearly
? Report Start Date—Click the box and select a start date from the calendar.
6. (Optional.) Set the time at which a report becomes invalid by using either of the following methods:
? Select End by, and enter an end date and time in the YYYY-MM-DD hh:mm format.
? Select End by and click the field next to the option. On the calendar that appears, select an end date and enter an end time.
After the specified end time, SDN does not generate any scheduled reports.
7. Select a file format from the Report File Format list. Options are:
? CSV
? MS Excel
? MS Excel (Data-only
8. (Optional.) Select Send by Email and enter an email address. Reports can be sent to only one email address.
9. Specify parameters in the Parameter Value area.
The parameters for adding a scheduled report vary with report templates.
10. Click OK.
Viewing a scheduled report
1. Click the Report tab.
2. From the navigation tree, select Scheduled Reports > All Scheduled Reports.
The All Scheduled Reports page appears.
3. Click the History
Report icon ![]() for the target report.
for the target report.
The History Report page appears.
4. Click View to open the report, or click Save to save the report to your local computer.
Controller Packet Loss Statistics Report
The controller packet loss statistics report displays the packet loss percentage of controllers in SDNM over a scheduled time period, as shown in Figure 40.
To add a controller packet loss statistics report, specify the following parameters:
· Begin Time—Click the Set
Parameter icon ![]() . On the Set Parameter
page that appears, select a start date and time for the reporting period and click OK.
. On the Set Parameter
page that appears, select a start date and time for the reporting period and click OK.
· End Time—Click the Set
Parameter icon ![]() . On the Set Parameter
page that appears, select an end date and time for the reporting period and click OK.
. On the Set Parameter
page that appears, select an end date and time for the reporting period and click OK.
Figure 40 Controller packet loss statistics report
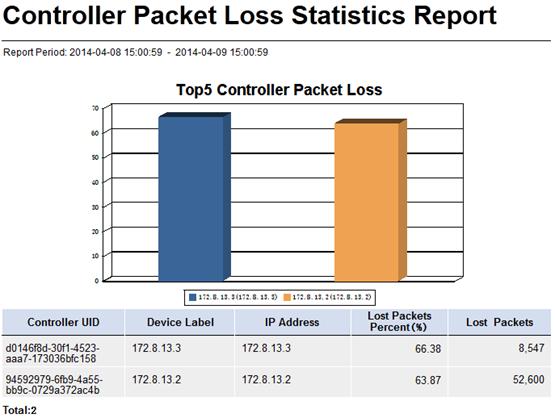
The controller packet loss statistics report contains the following fields:
· Report Period—Statistics collection time range of the report.
· Top5 Controller Packet Loss—The top five controllers with the highest packet loss rates. The Y-axis shows the packet loss rates. The X-axis shows the controllers by Device Label (IP Address).
· Controller UID—Unique identifier of the controller.
· Device Label—Device label of the controller.
· IP Address—Management IP address of the controller.
· Lost Packets Percent (%)—Ratio of lost packets to the total number of packets received and sent by the controller over the scheduled time period, express as a percentage.
· Lost Packets—Total number of packets lost over the scheduled time period.
Controller Traffic Statistic Report
The controller traffic statistic report displays the total amount of traffic received and sent by the controllers in SDNM over a scheduled time period, as shown in Figure 41.
To add a controller traffic statistic report, specify the following parameters:
· Begin Time—Click the Set
Parameter icon ![]() . On the Set Parameter
page that appears, select a start date and time for the reporting period and click OK.
. On the Set Parameter
page that appears, select a start date and time for the reporting period and click OK.
· End Time—Click the Set
Parameter icon ![]() . On the Set Parameter
page that appears, select an end date and time for the reporting period and click OK.
. On the Set Parameter
page that appears, select an end date and time for the reporting period and click OK.
Figure 41 Controller traffic statistic report
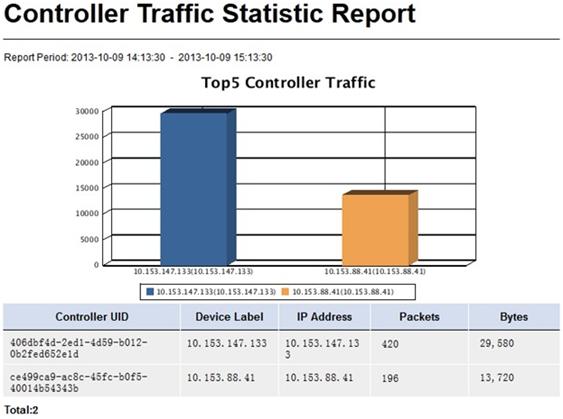
The controller traffic statistic report contains the following fields:
· Report Period—Statistics collection time range of the report.
· Top5 Controller Traffic—The top five controllers with the highest traffic amount. The Y-axis shows the traffic amount in bytes. The X-axis shows the controllers by Device Label (IP Address).
· Controller UID—Unique identifier of the controller.
· Device Label—Device label of the controller.
· IP Address—Management IP address of the controller.
· Packets—Total number of packets received and sent by the controller over the scheduled time period.
· Bytes—Total number of bytes received and sent by the controller over the scheduled time period.
Group Traffic Statistic Report
The group traffic statistic report displays the total amount of traffic received and sent by the groups of OpenFlow instances in SDNM over a scheduled time period, as shown in Figure 42.
To add a group traffic statistic report, specify the following parameters:
· Begin Time—Click the Set
Parameter icon ![]() . On the Set Parameter
page that appears, select a start date and time for the reporting period and click OK.
. On the Set Parameter
page that appears, select a start date and time for the reporting period and click OK.
· End Time—Click the Set
Parameter icon ![]() . On the Set Parameter
page that appears, select an end date and time for the reporting
period and click OK.
. On the Set Parameter
page that appears, select an end date and time for the reporting
period and click OK.
Figure 42 Group traffic statistic report

The group traffic statistic report contains the following fields:
· Report Period—Statistics collection time range of the report.
· Top5 Group Traffic—The top five groups with the highest traffic amount. The Y-axis shows the traffic amount in bytes. The X-axis shows the groups by DPID-Group ID.
· DPID—DPID of the OpenFlow instance to which the group belongs.
· Group ID—ID that uniquely identifies the group in the OpenFlow instance.
· IP Address—IP address of the OpenFlow switch where the OpenFlow instance resides.
· Packets—Total number of packets received and sent by the group over the scheduled time period.
· Bytes—Total number of bytes received and sent by the group over the scheduled time period.
OF Instance Traffic Statistic Report
The OF instance traffic statistic report displays the total amount of traffic received and sent by the OpenFlow instances in SDNM over a scheduled time period, as shown in Figure 43.
To add an OF instance traffic statistic report, specify the following parameters:
· Begin Time—Click the Set
Parameter icon ![]() . On the Set Parameter
page that appears, select a start date and time for the reporting period and click OK.
. On the Set Parameter
page that appears, select a start date and time for the reporting period and click OK.
· End Time—Click the Set
Parameter icon ![]() . On the Set Parameter
page that appears, select an end date and time for the reporting
period and click OK.
. On the Set Parameter
page that appears, select an end date and time for the reporting
period and click OK.
Figure 43 OF instance traffic statistic report
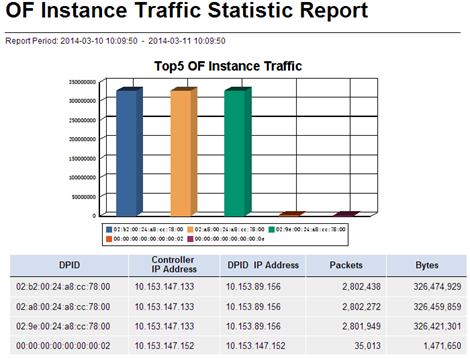
The OF instance traffic statistic report contains the following fields:
· Report Period—Statistics collection time range of the report.
· Top5 OF Instance Traffic—The top five OpenFlow instances with the highest traffic amount. The Y-axis shows the traffic amount in bytes. The X-axis shows the OpenFlow instances by DPID.
· DPID—DPID that uniquely identifies the OpenFlow instance.
· Controller IP Address—IP address of the main controller to which the OpenFlow instance is connected.
· DPID IP Address—IP address of the OpenFlow switch where the OpenFlow instance resides.
· Packets—Total number of packets received and sent by the OpenFlow instance over the scheduled time period.
· Bytes—Total number of bytes received and sent by the OpenFlow instance over the scheduled time period.
SDN Asset Statistic Report
The SDN asset statistic report displays information about the controllers, OpenFlow switches, and OpenFlow instances in SDNM and the number of each type of devices, as shown in Figure 44.
Figure 44 SDN asset statistic report
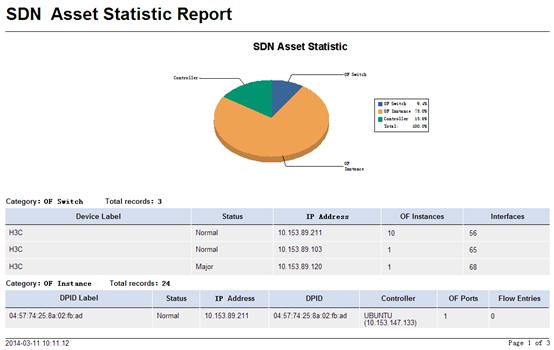
The SDN asset statistic report contains the following fields:
· SDN Asset Statistics—Displays the number and percentage of controllers, OpenFlow switches, and OpenFlow instances in SDNM.
· OF Switch
? Device Label—Device label of the OpenFlow switch.
? Status—State of the OpenFlow switch.
? IP Address—IP address of the OpenFlow switch.
? OF Instances—Number of OpenFlow instances on the OpenFlow switch.
? Interfaces—Total number of interfaces on the OpenFlow switch that are assigned to OpenFlow instances.
· OF Instance
? DPID Label—Device label of the OpenFlow instance.
? Status—State of the OpenFlow instance.
? IP Address—IP address of the OpenFlow switch where the OpenFlow instance resides.
? DPID—Unique identifier of the OpenFlow instance.
? Controller—IP address of the controller to which the OpenFlow instance is connected.
? OF Ports—Total number of ports assigned to OpenFlow instances.
? Flow Entries—Total number of flow entries contained in the flow tables that belong to the OpenFlow instance.
· Controller
? Device Label—Device label of the controller.
? Status—State of the controller.
? IP Address—Management IP address of the controller.
? Device UID—Unique identifier of the controller.
Port Traffic Statistic Report
The port traffic statistic report displays the total amount of traffic received and sent by ports assigned to OpenFlow instances over a scheduled time period, as shown in Figure 45.
To add a port traffic statistic report, specify the following parameters:
· Begin Time—Click the Set
Parameter icon ![]() . On the Set Parameter
page that appears, select a start date and time for the reporting period and click OK.
. On the Set Parameter
page that appears, select a start date and time for the reporting period and click OK.
· End Time—Click the Set
Parameter icon ![]() . On the Set Parameter
page that appears, select an end date and time for the reporting
period and click OK.
. On the Set Parameter
page that appears, select an end date and time for the reporting
period and click OK.
Figure 45 Port traffic statistic report
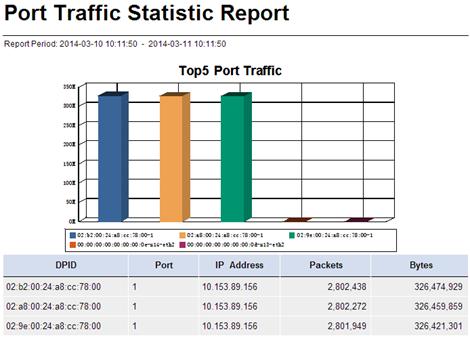
The port traffic statistic report contains the following fields:
· Report Period—Statistics collection time range of the report.
· Top5 Port Traffic—The top five ports with the highest traffic amount. The Y-axis shows the traffic amount in bytes. The X-axis shows the ports by DPID-Port.
· DPID—DPID of the OpenFlow instance to which the port is assigned.
· Port—Port index assigned by the OpenFlow switch to uniquely identify the port in the OpenFlow instance.
· IP Address—IP address of the OpenFlow switch where the port resides.
· Packets—Total number of packets received and sent by the port over the scheduled time period.
· Bytes—Total number of bytes received and sent by the port over the scheduled time period.
Flow Table Traffic Statistic Report
The flow table traffic statistic report displays the total amount of traffic received and sent by each flow tables in the OpenFlow instances over a scheduled time period, as shown in Figure 46.
To add a flow table traffic statistic report, specify the following parameters:
· Begin Time—Click the Set
Parameter icon ![]() . On the Set Parameter
page that appears, select a start date and time for the reporting period and click OK.
. On the Set Parameter
page that appears, select a start date and time for the reporting period and click OK.
· End Time—Click the Set
Parameter icon ![]() . On the Set Parameter
page that appears, select an end date and time for the reporting
period and click OK.
. On the Set Parameter
page that appears, select an end date and time for the reporting
period and click OK.
Figure 46 Flow table traffic statistic report
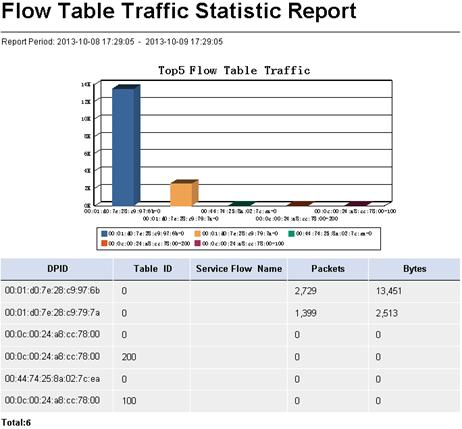
The flow table traffic statistic report contains the following fields:
· Report Period—Statistics collection time range of the report.
· Top5 Flow Table Traffic—The top five flow tables with the highest traffic amount. The Y-axis shows the traffic amount in bytes. The X-axis shows the flow tables by DPID-Table ID.
· DPID—DPID of the OpenFlow instance to which the flow table belongs.
· Table ID—ID of the flow table.
· Service Flow Name—Name of the service flow to which the flow table belongs.
· Packets—Total number of packets received and sent by the flow table over the scheduled time period.
· Bytes—Total number of bytes received and sent by the flow table over the scheduled time period.
Flow Entry Traffic Statistic Report
The flow entry traffic statistic report displays the total amount of traffic forwarded by each flow entry in the OpenFlow instances over a scheduled time period, as shown in Figure 47. A flow entry is uniquely identified by the combination of the DPID, OF Device Label, Table ID, Priority, and Match Field.
To add a flow entry traffic statistic report, specify the following parameters:
· Begin Time—Click the Set
Parameter icon ![]() . On the Set Parameter
page that appears, select a start date and time for the reporting period and click OK.
. On the Set Parameter
page that appears, select a start date and time for the reporting period and click OK.
· End Time—Click the Set
Parameter icon ![]() . On the Set Parameter page that appears, select an end date and time for the reporting period and click OK.
. On the Set Parameter page that appears, select an end date and time for the reporting period and click OK.
Figure 47 Flow entry traffic statistic report
The flow entry traffic statistic report contains the following fields:
· Report Period—Statistics collection time range of the report.
· DPID—DPID of the OpenFlow instance to which the flow entry belongs.
· Service Flow Name—Name of the service flow to which the flow entry belongs. This field is Null if the flow entry does not belong to any service flow.
· IP Address—IP address of the OpenFlow switch hosting the OpenFlow instance to which the flow entry belongs.
· Table ID—ID of the flow table to which the flow entry belongs.
· Priority—Priority of the flow entry.
· Match Field—Matching field of the flow entry.
· Packets—Total number of packets forwarded by the flow entry over the scheduled time period.
· Bytes—Total number of bytes forwarded by the flow entry over the scheduled time period.
SDNM widgets
SDN Manager provides the following widgets for an OpenFlow network:
· Controller Alert Statistics
· OF Device Status Statistics
· Today Controller Traffic Rate Chart
· Today Tenant Traffic Rate Chart
To easily view the running status of the OpenFlow network, customize the widgets on the IMC home page. For more information, see H3C Intelligent Management Center Enterprise and Standard Platform Administrator Guide.
Controller Alert Statistics
As shown in Figure 48, the controller alert statistics widget displays the number of controller alerts of different levels in SDNM. You can perform the following operations:
· Point to a slice of the pie chart to view the number of alerts.
· Click a slice to view the corresponding alert list.
· Click the corresponding alert level legend in the illustration to hide or display an alert slice.
Figure 48 Controller Alert Statistics widget
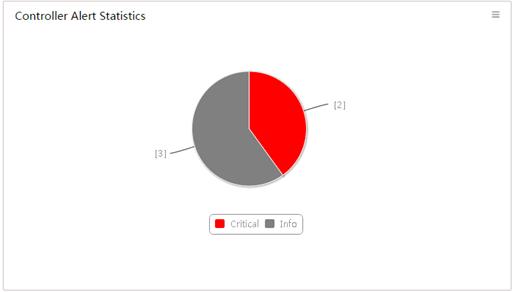
|
Status |
Icon |
Color |
|
Info |
|
Gray |
|
Warning |
|
Cyan |
|
Minor |
|
Yellow |
|
Major |
|
Orange |
|
Critical |
|
Red |
OF Device Status Statistics
As shown in Figure 49, the OF device status statistics widget displays the number and status of OpenFlow devices including controllers, OpenFlow switches, and OpenFlow instances.
Figure 49 OF Device Status Statistics widget
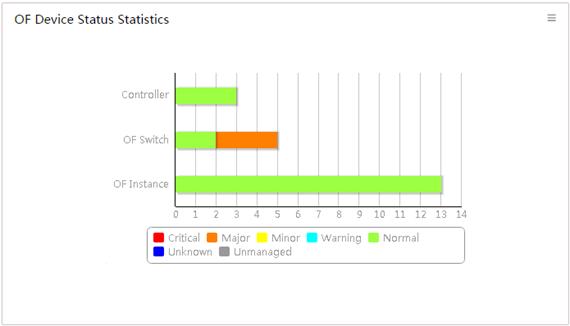
The Y-axis shows the device types in an OpenFlow network. The X-axis shows the number of devices. You can perform the following operations:
· Point to a bar to view the number of corresponding devices.
· Click the bar to view the corresponding device list.
· Click the corresponding alert level legend in the illustration to hide or display a status bar.
Table 13 Device status and colors
|
Status |
Icon |
Color |
|
Unmanaged |
|
Gray |
|
Unknown |
|
Blue |
|
Normal |
|
Green |
|
Warning |
|
Cyan |
|
Minor |
|
Yellow |
|
Major |
|
Orange |
|
Critical |
|
Red |
Today Controller Traffic Rate Chart
As shown in Figure 50, Today Controller Traffic Rate Chart displays the receiving and transmitting rate trend of the controller with the highest traffic volume from 00:00:00 of the day to the current time.
Figure 50 Today controller traffic rate chart
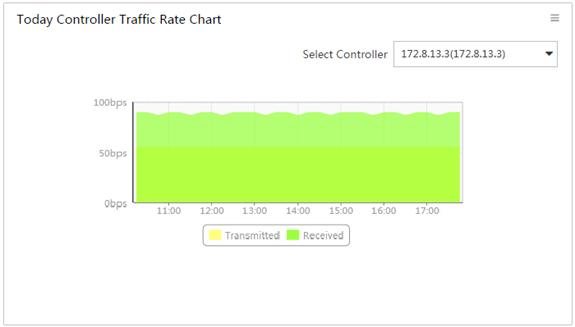
The Select Controller list contains all controllers in SDN Manager. Select one from the list to display its rate trend. By default, the widget displays the rate trend of the controller with the highest traffic volume. You can perform the following operations:
· Point to a peak of the transmitted or received area to view the peak rate at a specified time.
· Click the legend name in the illustration to hide or display a rate trend area.
· Click and drag the pointer to the left or right to view the rate trend in a more specific time range.
· Click Resume to restore the default display.
Today Tenant Traffic Rate Chart
As shown in Figure 51, Today Tenant Traffic Rate Chart displays the rate trend of the tenant with the highest traffic volume from 00:00:00 of the day to the current time.
Figure 51 Today tenant traffic rate chart
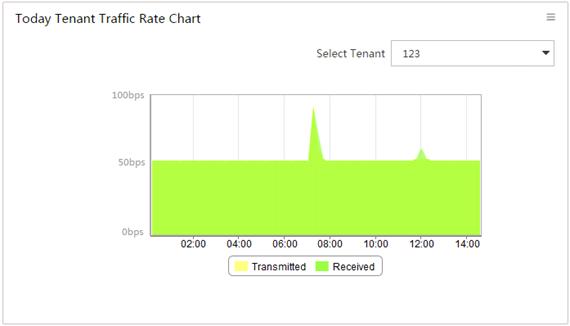
The Select Tenant list contains all tenants in SDN Manager. Select one from the list to display its rate trend. By default, the widget displays the rate trend of the tenant with the highest traffic volume. You can perform the following operations:
· Point to a peak of a transmitted or received area to view the peak rate at a specified time.
· Click the tenant name in the illustration to hide or display a rate trend area.
· Click and drag the pointer to the left or right to view the rate trend in a more specific time range.
· Click Resume to restore the default display.
