- Released At: 24-12-2021
- Page Views:
- Downloads:
- Table of Contents
- Related Documents
-
|
|
|
|
|
H3C HDM |
|
Technology White Paper |
|
|
Software version: V2.2
Copyright © 2021 New H3C Technologies Co., Ltd. All rights reserved.
No part of this manual may be reproduced or transmitted in any form or by any means without prior written consent of New H3C Technologies Co., Ltd.
Except for the trademarks of New H3C Technologies Co., Ltd., any trademarks that may be mentioned in this document are the property of their respective owners.
The information in this document is subject to change without notice.
Setting the power supply operating mode
Viewing power consumption history statistics
Setting the performance mode of power supplies
Configuring processor power states
Configuring automatic power-on
Establishing an insecure VNC session
Importing and exporting configuration
Restoring HDM to the default settings
Feature difference between G3 and G5 servers
Overview
Hardware Device Management (HDM) is a remote server management system. It complies with IPMI, SNMP, and Redfish standards and provides various functions, including keyboard, video, and mouse redirection, text console redirection, SOL connection, remote virtual media, and reliable hardware monitoring and management. HDM supports abundant features as described in Table 1.
|
Description |
|
|
Various management interfaces |
Provides abundant management interfaces, such as IPMI, HTTPS, SNMP, and Redfish, to meet various system integration requirements. |
|
Unified control |
Reduces O&M costs of servers in the small and medium-sized enterprises by implementing the unified control in a small scale. |
|
LCD display |
A touchable 3.5-inch LCD display is optional for some rack servers to facilitate on-site inspection or maintenance. |
|
Fault monitoring and diagnosis |
Provides fault location and diagnosis for maintenance to ensure correct 24×7 device operation. The fault logs can be reported proactively through SNMP traps, SMTP, Redfish event subscription, and syslog messages. |
|
Critical OS event screenshot and video recording |
Takes a screenshot or records a video upon a critical OS event (for example, a crash) for future troubleshooting. |
|
Out-of-band RAID management |
Supports out-of-band RAID monitoring and configuration to improve RAID configuration efficiency and management capability. |
|
Smart power supply management |
Supports power capping to increase deployment density, and provides dynamic power management to reduce operation costs. |
|
KVM, VNC, and virtual media |
Facilitates remote server maintenance. |
|
DNS, LDAP, and AD |
Supports domain management and directory services to simplify server network management and user management. |
|
USB Wi-Fi adapter |
Supports an external Xiaomi portable Wi-Fi adapter to facilitate near-field maintenance and management of the server. |
|
Primary/backup image switchover |
Enables startup by using the backup image if the system crashes, which enhances system availability. |
|
Service USB device |
Supports log downloading to simplify on-site maintenance and management. |
|
Asset management |
Simplifies asset management. |
|
Security management |
Ensures server security concerning service access, user accounts, data transmission, and storage, and supports two-factor authentication, whitelist and blacklist rules (firewall), management interfaces, SSL, silicon root of trust, and custom user privileges. |
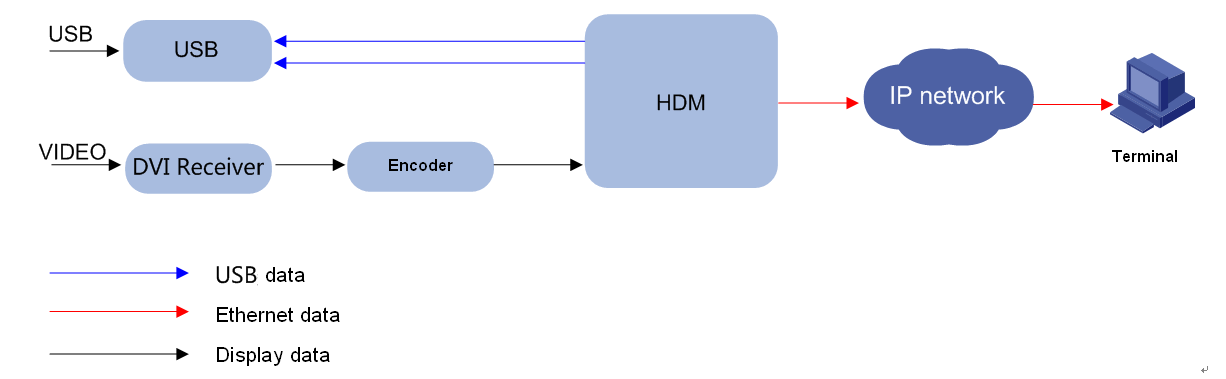
HDM design
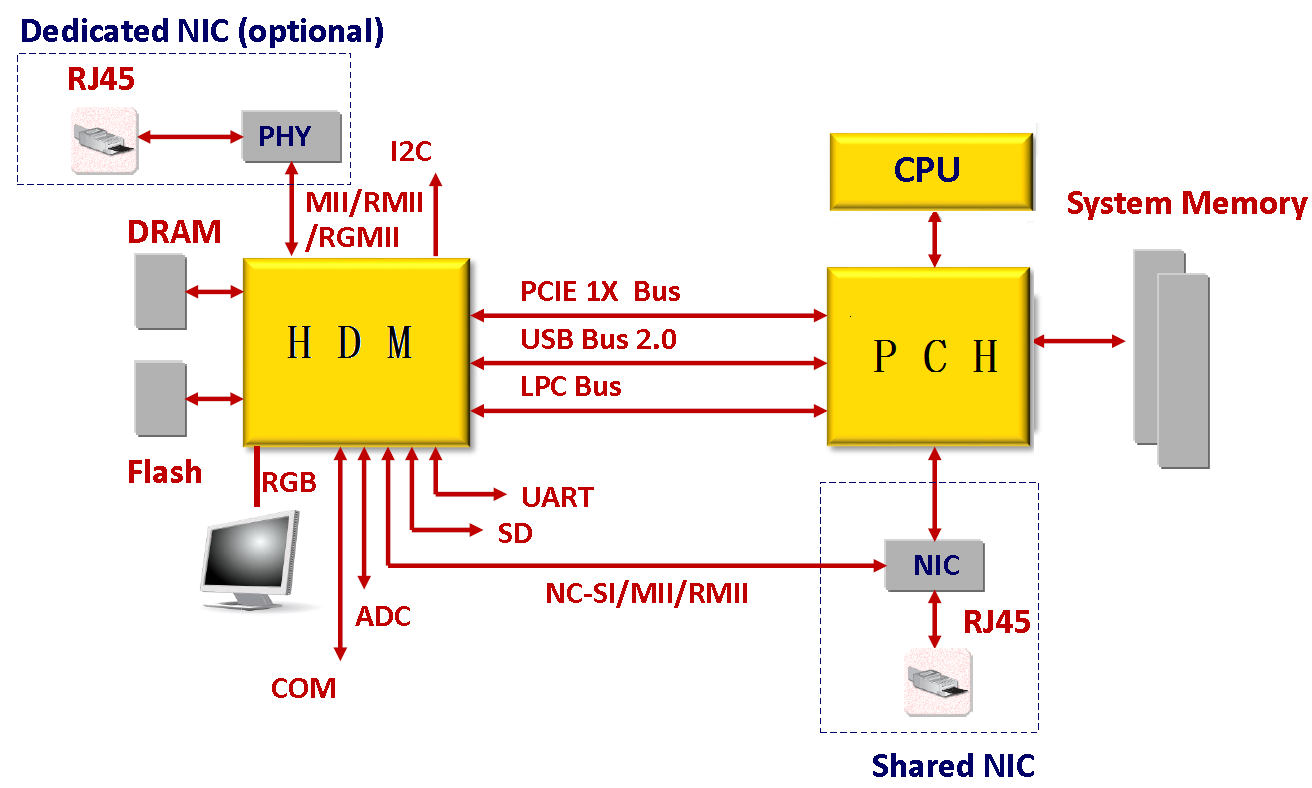
As shown in Figure 1, HDM adopts server-specific system on chip (SoC) to effectively manage server hardware components. The SoC supports KVM, 64MB local VGA display (64MB is available only for G5 series), dedicated and shared network ports, and various board-level management features and peripheral interfaces as follows:
· KVM remote control—Uses the KVM module to process video data and keyboard and mouse data as follows:
a. The KVM module receives video data from the host system through the VGA connector, compresses the video data, and then sends the compressed data to a remote KVM client.
b. The KVM module receives keyboard and mouse data from the remote KVM client, and transmits the data to the host system by using a simulated USB keyboard and mouse device.
· LPC communication and IPMI management—Provides the traditional LPC system interface for communication with a server and supports the standard IPMI management.
· Remote access through GE interfaces—Provides dedicated GE interfaces through which remote management can be implemented by using IPMI, Redfish, or SNMP over the network.
· Sensor-based monitoring and management—Monitors the temperature and voltage in a server through sensors, and also manages fans and power supplies (PSUs) in an intelligent way.
· NCSI and VLAN support—Supports network controller sideband interface (NCSI) and VLANs, allowing for flexible network management.
· Remote consoles—Supports KVM redirection, text console redirection, remote virtual media (used to map optical drivers, drives, and folders of terminals to the server), and IPMI 2.0-based hardware monitoring and management.
· Software redundancy—Supports one primary firmware image and one backup firmware image and allows primary/backup switchover.
· Abundant interfaces—Provides abundant user interfaces, such as the Web-based user interface, CLI, IPMI interface, Redfish interface, and SNMP interface. All interfaces adopt authentication mechanisms and highly secure encryption algorithms to ensure access and transmission security.
· All-round server monitoring—Monitors servers, and provides various alarms and detailed logs, for example, about the processor core temperatures, voltages, fan speed, power supply faults. In addition, HDM allows you to query information about processors, memory, and drives.
· Fault location—Saves the latest screen output at server breakdown for fault location, and supports scheduled screen snapshot controlled by third-party programs. This does not require manual intervention and reduces maintenance time.
HDM features
Various management interfaces
Web management interface
HDM uses HTTPS-based Web interfaces for visual management to simplify server configuration and information filtering. It allows users to monitor OS startup, perform OS operations, and configure driver or floppy driver mappings through a remote console from the GUI.
To sign in to the HDM Web interface:
1. Open the browser, and enter the HDM management IP address or domain name in the address bar.
2. Enter the username and password on the HDM sign-in page.
The supported browsers include Internet Explorer 11 (or higher), Google Chrome 48 (or higher), and Mozilla Firefox 78 (or higher).
IPMI management interface
HDM is compatible with IPMI 1.5 and IPMI 2.0 standards and supports Data Center Manageability Interface (DCMI). It can effectively manage a server by using a third-party tool, such as IPMITool, through the LPC channels or LAN channels.
· For the LPC channels, KCS is used and the third-party tool must operate on the OS of the server.
· For the LAN channels, UDP or IP is used and the third-party tool can remotely manage the server.
The third-party tools must support Windows or Linux.
IPMItool commands are in the ipmitool [interface] [parameter] <command> format. For example, to view all the sensors from HDM, execute the following IPMItool commands:
· LPC-based KCS: ipmitool sensor list
· LAN-based UDP or IP: ipmitool -H *.*.*.* -I lanplus -U <username> -P <password> sensor list
¡ -H *.*.*.*: Specifies the IP address of the HDM network port. The *.*.*.* argument represents the IP address.
¡ -I lanplus: Specifies the encryption status of the transmission. You can specify -I lanplus to encrypt the transmission or specifies -I lan not to encrypt the transmission.
¡ -U <username>: Specifies the HDM username. The <username> argument represents the username.
¡ -P <password>: Specifies the HDM password. The <password> argument represents the password.
¡ -L <user role>: Specifies the user privileges. The default user role is Administrator.
SNMP management interface
Simple Network Management Protocol (SNMP) is a communication protocol between Network Management Services (NMSs) and agents. It defines the standard management framework, common communication languages, and security and access control mechanisms for device monitoring and management in a network.
SNMP has the following advantages:
· TCP/IP-based standard protocol, with UDP as the transmission layer protocol.
· Provides automatic network management. The administrators can query and edit information, identify and diagnose network issues, perform capacity planning, and generate reports on network nodes that use the SNMP platform.
· Shields physical differences between devices to implement automatic management of products from different vendors. SNMP only offers the basic set of functions, which makes the management tasks relatively independent of both physical features of the managed devices and the actual networking technology. Therefore, SNMP accomplishes the management of devices from different vendors.
· Combines the simple request-response mode and active notification mode, and provides a retransmission timeout mechanism.
· Requires few packet types and simple packet formats, which facilitates resolution and implementation.
· Provides authentication and encryption mechanisms and uses the user-based access control function in SNMPv3 for security enhancement.
· HDM provides SNMP-based programming interfaces. SNMP supports GET and SET operations, and trap sending. The third-party management software can manage servers in a centralized manner by using the SNMP interfaces. The SNMP agents support SNMPv1, SNMPv2c, and SNMPv3.
· An SNMP agent supports viewing the following information: system health status, system health events, hardware information, alarm reporting configuration, power statistics, asset information, heat dissipation management, firmware version, and network management.
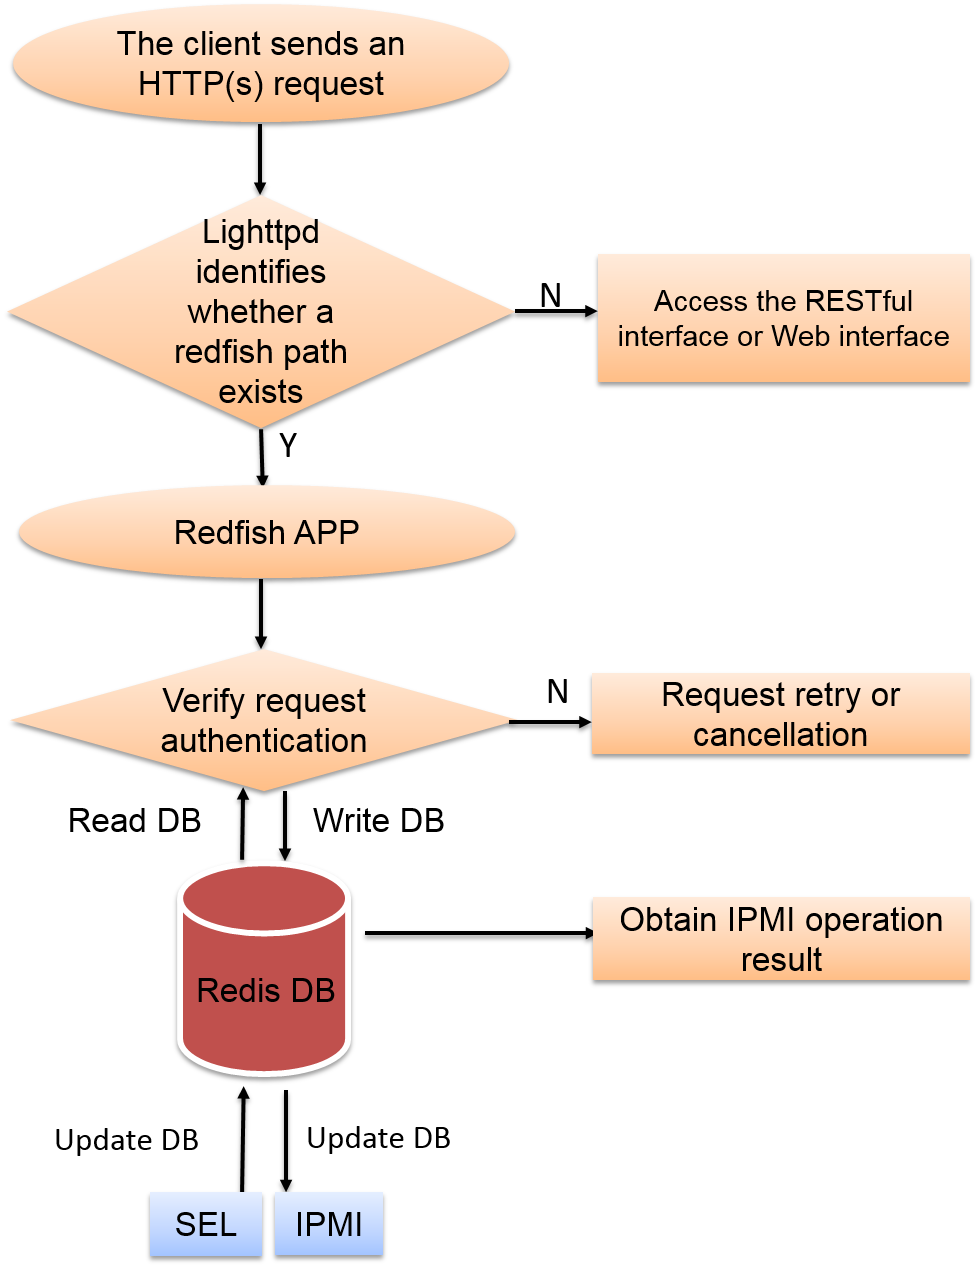
Redfish management interface
Redfish provides HTTPS-based RESTful APIs for device management. Each HTTPS operation submits a resource request or retrieves a UTF-8-encoded resource response in JSON format. This is similar to the process that a Web application returns an HTML file to a browser. Redfish reduces development complexity and is easy to implement, easy to use, and easy to extend. You can use the Redfish interface to implement common HDM and BIOS configurations, including user management, server information query, and management module information query.
Redfish is the combination of a REST API and Software-defined servers (data models), and is defined by DMTF at www.dmtf.org.
As shown in Figure 2, the workflow of Redfish is as follows, and the Redfish database is updated in real time concerning each HTTPS operation through SEL and IPMI:
1. The client sends an HTTPS request.
2. The HTTPS request passes the authentication (authentication token and basic authentication) and obtains data from the database.
3. Lighttpd sends a response to the client.
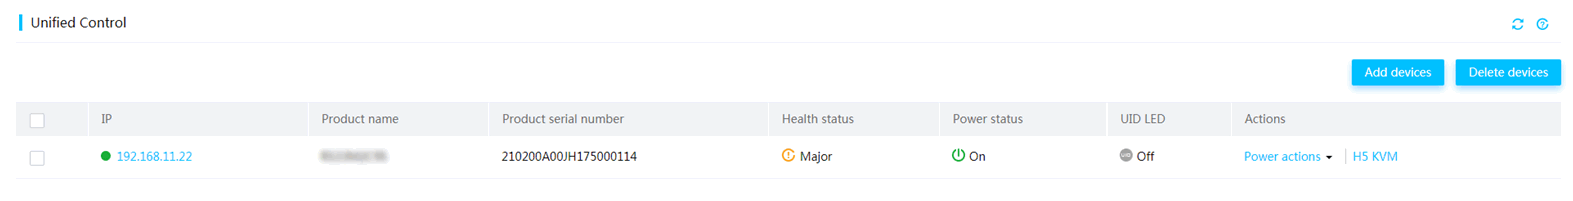
HDM unified control
HDM unified control simplifies O&M of servers in the small and medium-sized enterprises by implementing the unified control in a small scale. You can perform the following tasks through the unified control feature:
· Adding a maximum of ten devices in bulk.
The IPv6 addresses are not supported in the current software version.
· Deleting a single device or devices in bulk.
· Viewing device information, including product name, product serial number, health status, power status, UID LED status.
· Performing power actions, including power-on, power-off, or power-cycle of a server.
· Launching an H5 KVM remote console.
LCD display
A touchable 3.5-inch LCD display is optional for some H3C rack servers to display or configure the server settings. The LCD display improves the convenience of local maintenance and also accelerates fault location and troubleshooting.
You can perform the following tasks on the LCD display:
· Viewing basic server information, including product name, product serial number, and HDM or BIOS firmware version.
· Viewing health state and logs of the server system and subsystems, including processors, memory, storage, fans, power supplies, and temperature sensors.
· Viewing real-time temperature of the air inlet and processors.
· Configuring server settings, including configuring HDM management network settings and restoring the administrator account.
The presence and health state of the server and its components are indicated by colors as follows:
· Green—The server is normal.
· Yellow—A minor alarm occurs.
· Amber—A major alarm occurs.
· Red—A critical alarm occurs.
· Grey—The component is absent.
Monitoring
System health state
HDM presents the health state of the server system and its components, which you can also obtain from the health LEDs, LCD, diagnostic panel, and security bezel.
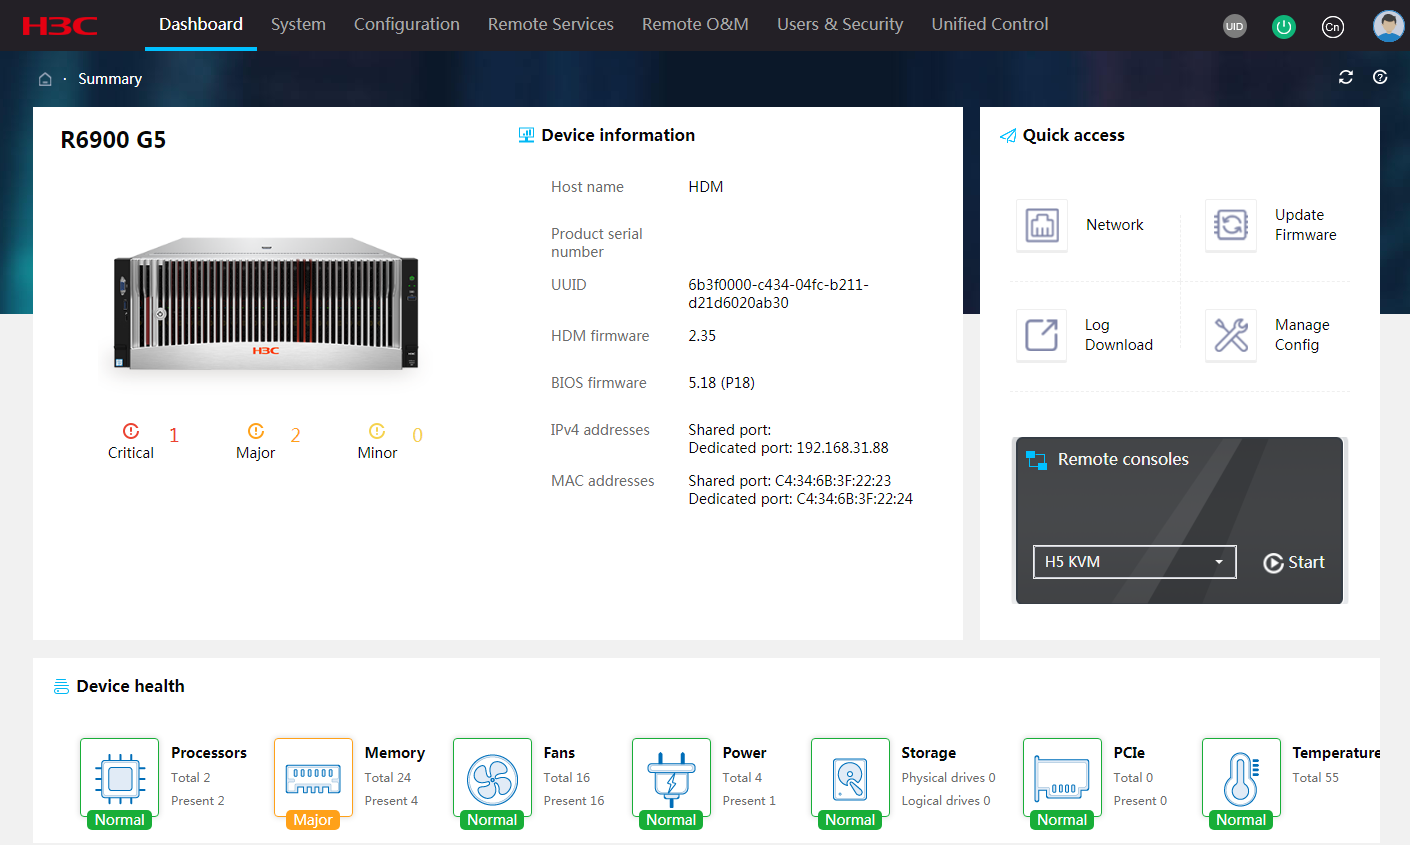
The Dashboard >Summary menu presents the overall health state of the server and alarm summary, as shown in Figure 4 or Figure 5. The health state is determined by the health state of the following components: processors, DIMMs, fans, power supplies, storage devices. PCIe modules, temperature sensors, system board, drive backplanes, and riser cards.
Figure 4 Viewing summary information about a G3 server
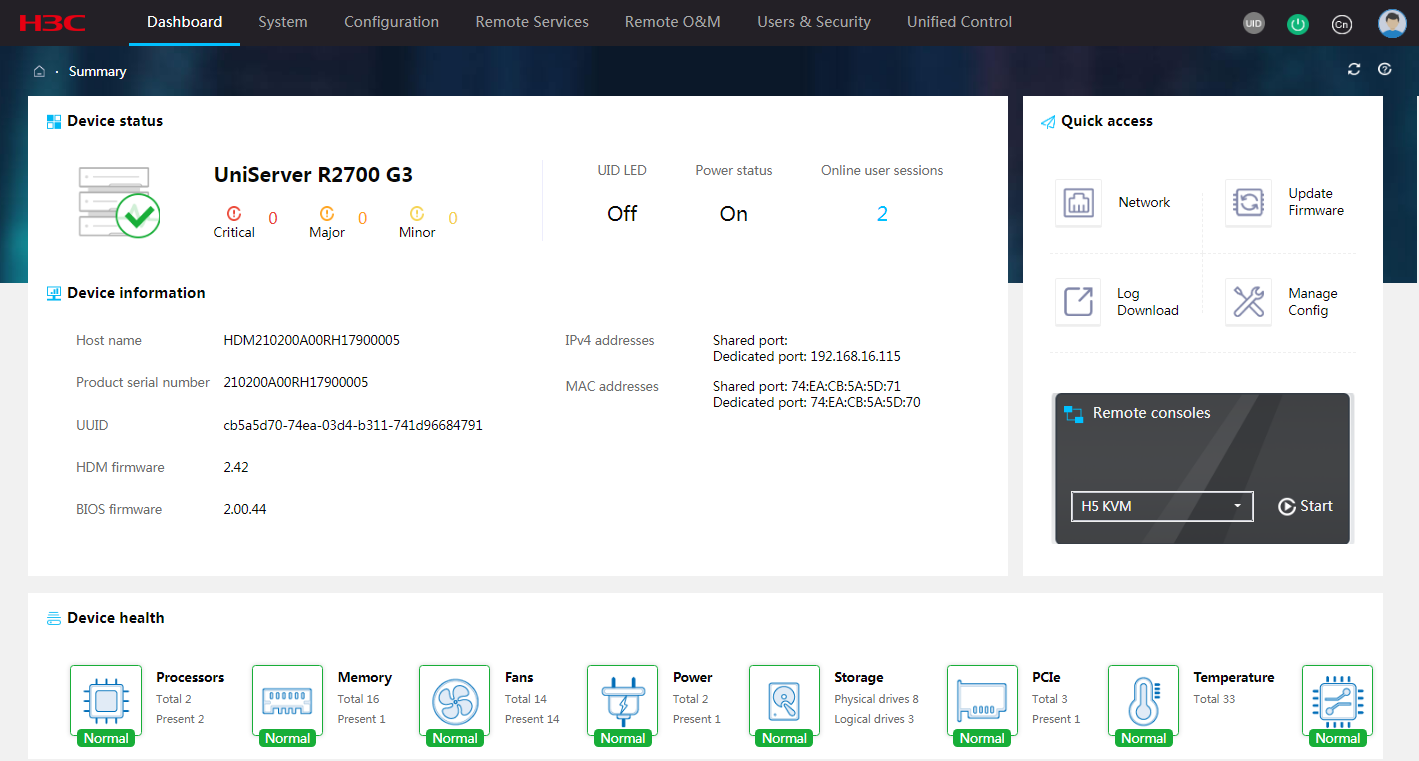
Figure 5 Viewing summary information about a G5 server
Sensors
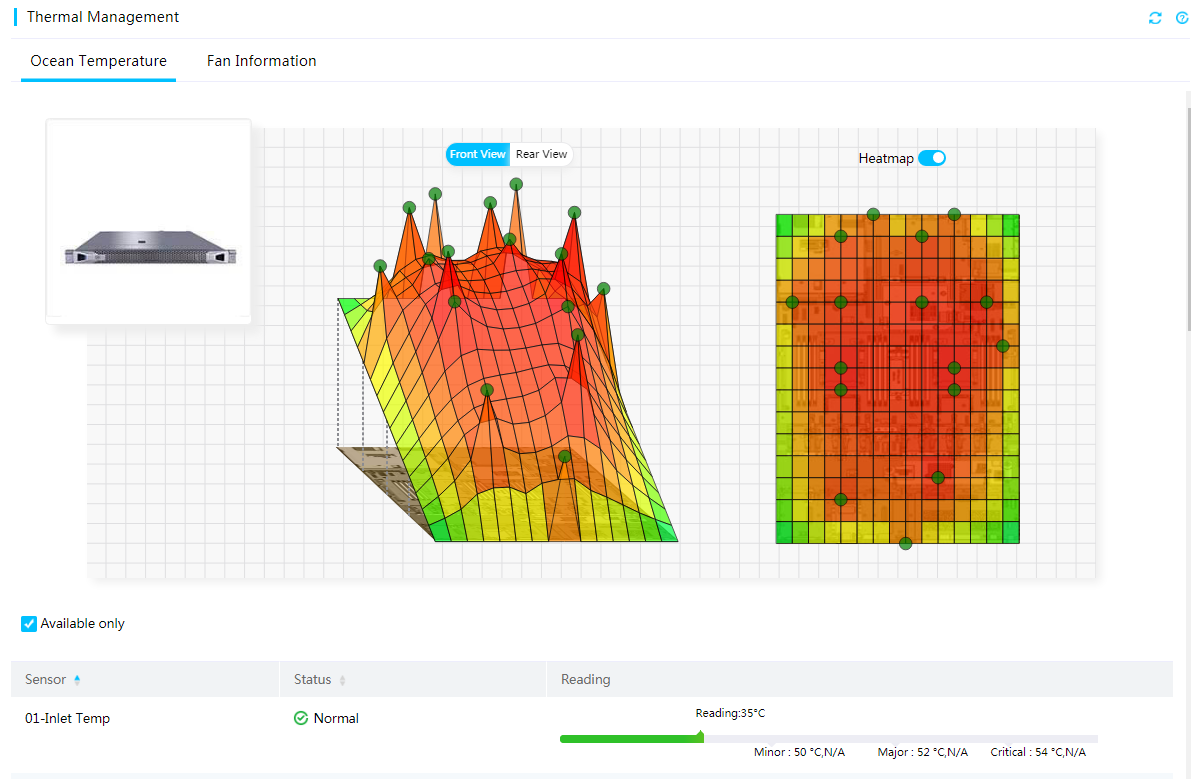
Temperature heatmaps in 3D view
HDM presents temperature data in both heatmap and table formats to help you monitor the cooling performance of the server.
· The temperature heatmaps use colors between green and red to show the temperature distribution inside the server chassis in 3D view and uses circles to represent sensors. Green indicates 0°C (32°F). As the temperature gets higher, the color gets warmer until it changes to red. With the temperature heatmaps, you can quickly identify the component that is in a poor cooling condition.
· The temperature sensor table displays the temperature reading, status, coordinates, and thresholds of each sensor.
¡ X: Location of the sensor on the X axis.
¡ Y: Location of the sensor on the Y axis.
¡ Z: Server in which the sensor is located.
To obtain the name, status, reading, and thresholds of the sensor at a location, hover the mouse over the circle at that location on a temperature heatmap.
Figure 6 Viewing temperature sensor information
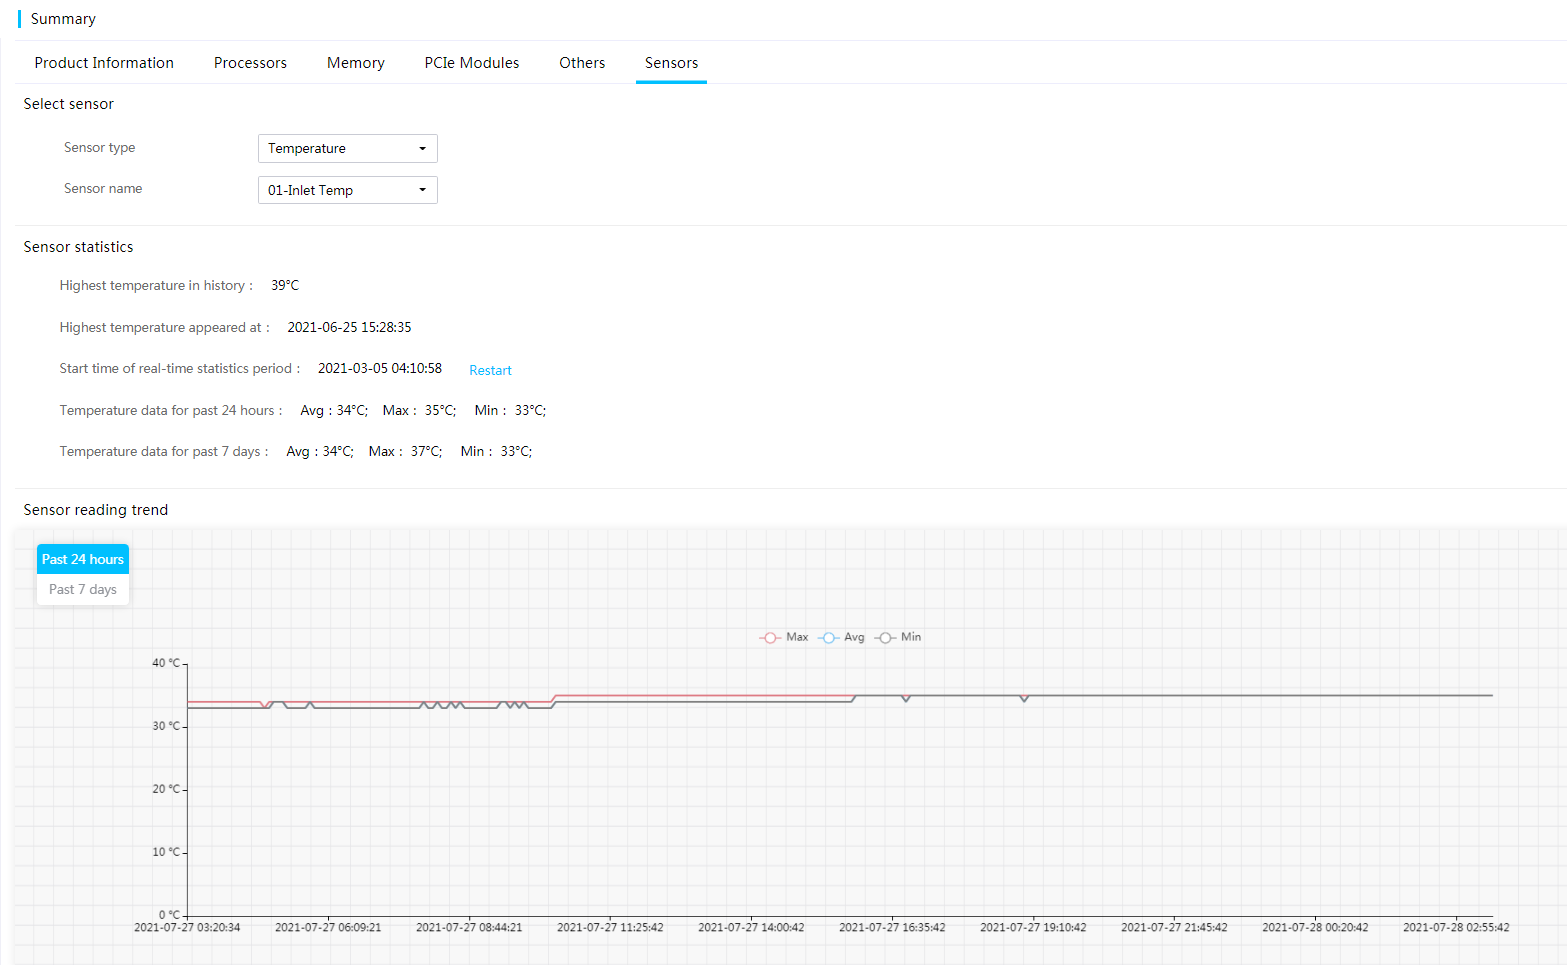
History sensor statistics
HDM supports displaying readings of the linear sensors (voltage, electrical current, temperature, and fan speed sensors) collected every 5 minutes in the past 24 hours or 7 days. You can also view the maximum, average, or minimum sensor readings of a linear sensor at a time point.
Figure 7 Viewing history sensor statistics
Resource summary
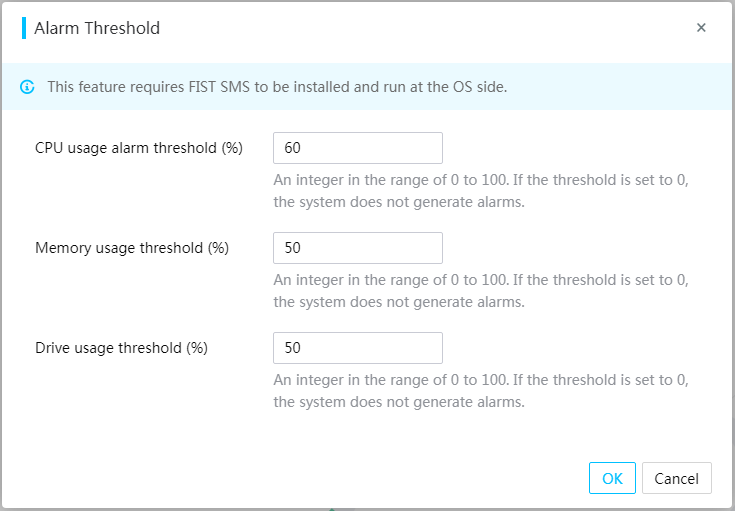
You can view the processor, memory, and disk usage information of the server and set alarm thresholds for the processor, memory, and disk usage, as shown in Figure 8. A log entry is generated when the processor, memory, or disk usage exceeds the thresholds.
You can set the resource usage alarm thresholds, as shown in Figure 9. Before setting the alarm thresholds, make sure you have installed FIST SMS and FIST SMS runs in the operating system of the server. The supported operating systems include Redhat 6.8, Redhat 7.3, and Windows Server 2012 R2.
Figure 8 Viewing resource summary
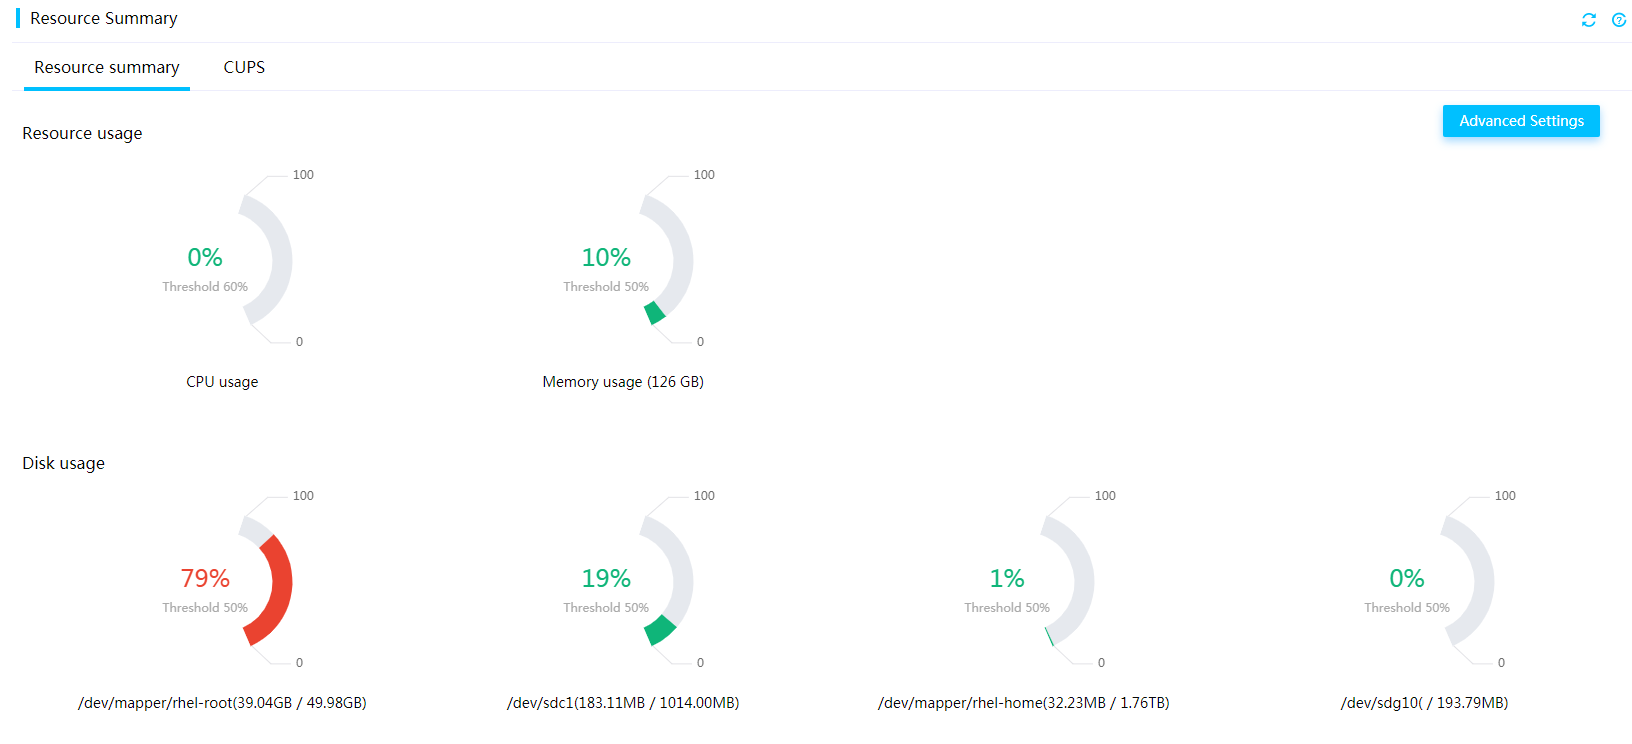
Figure 9 Setting the resource usage alarm thresholds
CUPS
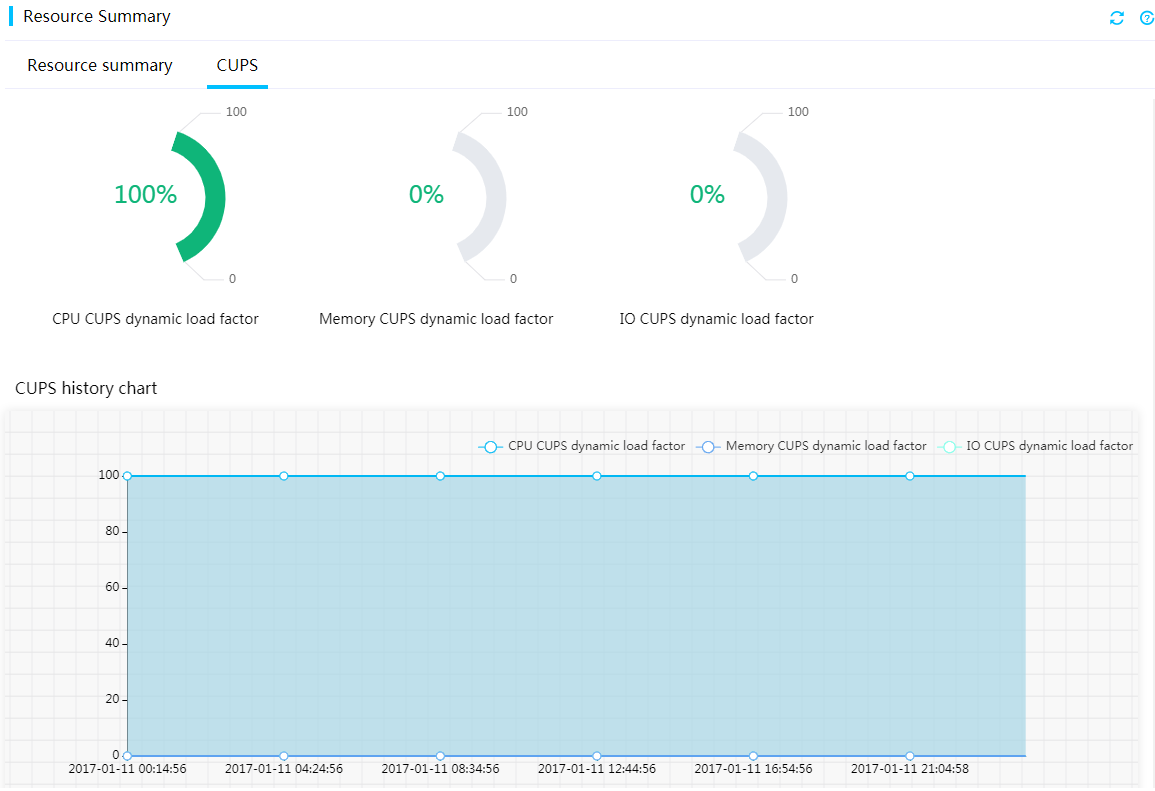
The CUPS feature provides real-time monitoring of processor, memory, and I/O usage in the system. It uses the proportions of dynamic load factors for processor, memory, and I/O usage to indicate the type of main services running on the system. The processor, memory, and I/O CUPS dynamic load factors represent the accumulative CPU core data usage, accumulative transmission rate on the memory bus, and I/O bandwidth usage on the PCIe bus, respectively.
A higher processor, memory, or I/O CUPS dynamic load factor indicates that main services running on the system are compute-intensive, memory-intensive, or I/O-intensive. A higher memory CUPS load factor indicates that the memory bus access rate is high, which is not directly related to memory usage (used memory/total memory). For example, if 2GB memory is used out of total 8GB memory, the memory usage is 25%.
Figure 10 Viewing CUPS information
Alarm management
Alarms
If a server component fails or the server operates incorrectly for some reasons, the system generates alarms of different types for different faulty modules and generates log at the same time.
The alarm severity levels include:
· Info—The event does not affect the system and no action is required. Examples include normal state changes and alarm removed events.
· Minor—The event has minor impact on the system, but it requires prompt action to avoid an escalation in severity.
· Major—The event has serious impact on some subsystems and might result in service interruption. Immediate action is required.
· Critical—The event might result in system crash or shutdown. Immediate action is required.
The following types of faults can be detected:
· Processor faults—IERR errors, self-test errors, configuration errors (including processor UPI errors, IOH UPI errors, processor core errors, and IOH core errors), and MCERR errors.
· Memory faults—Correctable errors, uncorrectable errors, overtemperature errors, and POST training failure.
· Power supply faults— Power presence detected, power supply input lost (AD/DC), predictive failure, and power supply self-test errors.
· Fan faults—Fan presence detected, faulty fan, and downgrading failure.
· Storage faults—Drive presence detected, faulty drive, predictive failure, critical array error, and failed array error.
· Overtemperature faults—Overtemperature conditions on processors, memory, air inlets, power supplies, and drives.
· Voltage faults—Voltage faults on the system board and other server boards.
· Bus faults—Faults on the I2C, IPMB, or QPI/UPI bus.
SDS overview
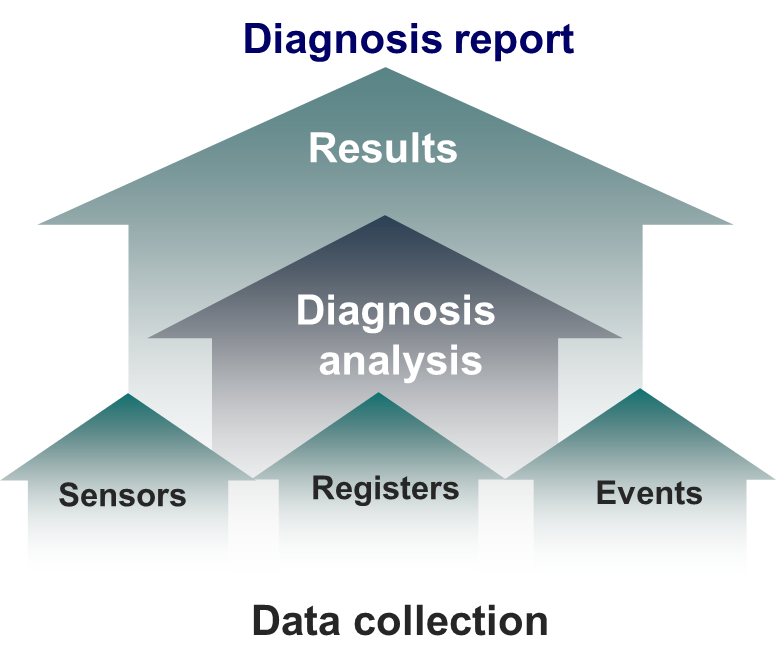
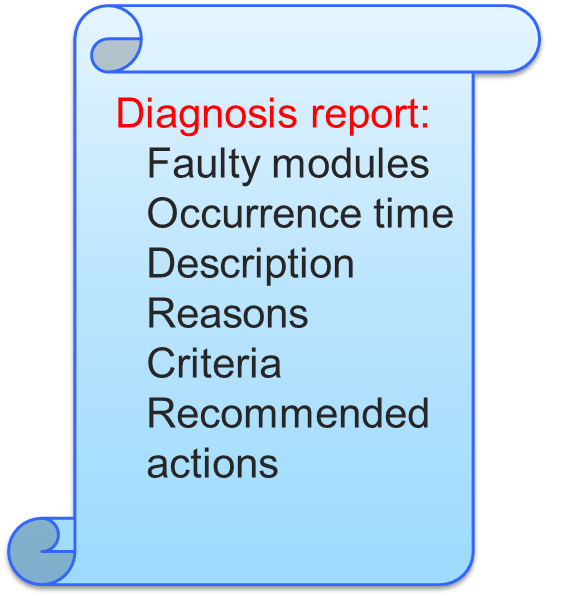
HDM Smart Diagnose System (SDS) is a full life-cycle smart device diagnosis system, which can quickly and accurately identify and diagnose the failures of the main hardware components on a server. As shown in , SDS collects basic hardware fault information, including sensors, CPLDs, registers, and event log, identifies the causes based on history diagnosis database, and generates a diagnosis report. The diagnosis report provides information about the faulty module, time of fault occurrence, fault type, fault description, possible causes, diagnosis criteria, and solutions.
Figure 11 SDS diagram
SDS provides an all-round monitoring on the main components of a server, and the following hardware faults can be detected and diagnosed:
· MCA faults, including faults on processors, memory, or PCIe modules.
· Power supply faults, including faults on current, voltage, temperatures, power supply fans, IIC, and current sharing.
· System board faults, including faults on secondary power supplies, fans, network adapters, electrical current, voltage, and temperature sensors.
· PCIe module faults, including faults on network adapters, riser cards, and NCSI channels.
· Storage controller faults, including faults on storage controllers, cables, expander modules, cache, supercapacitor, and drives.
SDS fault diagnosis
MCA fault diagnosis (for servers with Intel processors)
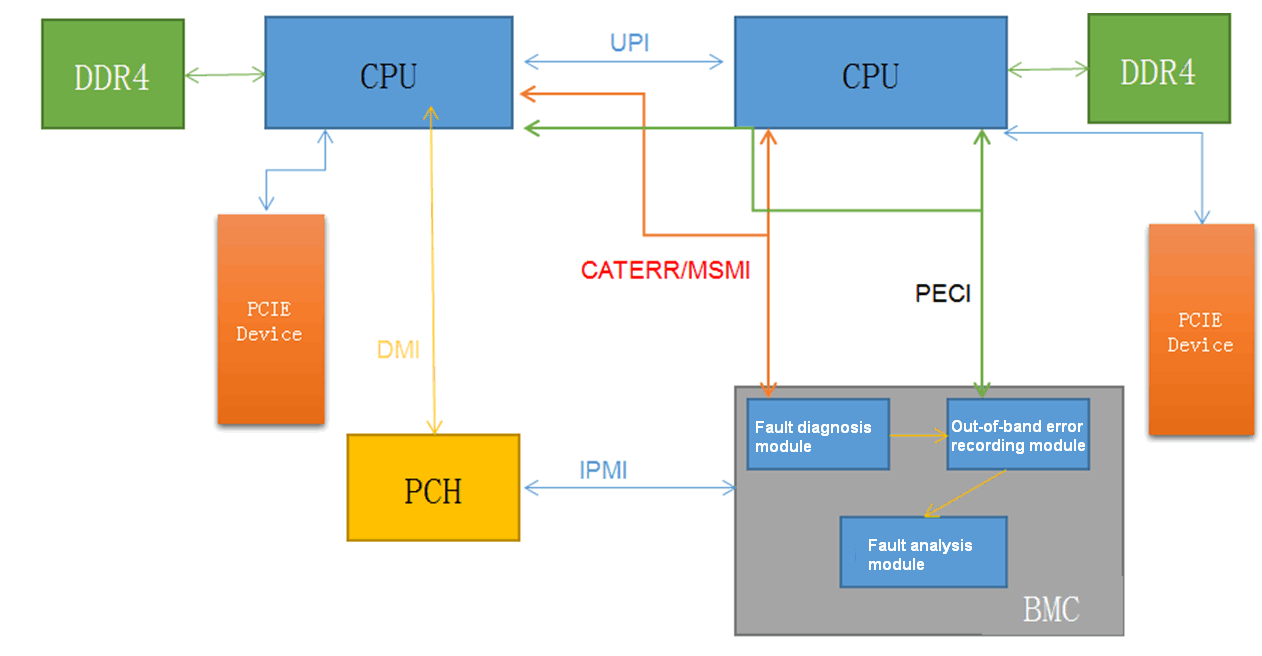
Machine Check Architecture (MCA) is an important part of SDS. MCA fault diagnosis supports fault detection and diagnosis on processors, memory, and PCIe modules. SDS applies a polling detection mechanism to monitor and diagnose MCA errors. That is, after detecting CATERR or MSMI signals during the polling process, SDS collects basic on-site hardware fault information through the PECI channel in an out-of-band manner. The basic information mainly contains information about error-related banks and CSRs. Based on the collected data and history hardware fault diagnosis database, SDS locates and analyses hardware faults, and generates diagnosis reports.
Figure 12 describes the workflow of the MCA fault diagnosis mechanism.
Figure 12 MCA fault diagnosis diagram
The following describes the available types of fault detection:
· Processor fault detection.
Processor faults might be caused by internal errors inside the processors or by external errors from memory and PCIe modules. MCA fault diagnosis can detect errors occurring on the internal modules of the processors, including fetch units (IFUs), data cache units (DCUs), and data translation lookaside buffers (DTLBs).
MCA fault diagnosis can identify error types, comprehensively analyzes suspected error sources, and locates the faulty component. The following are common types of processor faults:
¡ Cache uncorrectable errors, including read errors, write errors, and prefetch errors.
¡ Watchdog timeout errors, such as three-strike timeout errors.
¡ UPI uncorrectable errors.
¡ Power control module errors inside the processors.
¡ Processor access timeout.
· Memory fault detection.
Memory faults include correctable errors and uncorrectable errors. An uncorrectable memory error in the system will seriously affect the services. MCA fault diagnosis focuses on detection and diagnosis of uncorrectable errors. It analyzes memory error addresses recorded by the error recording module, identifies the faulty DIMM, and locates the specific processor, channel, and DIMM. The following is common types of uncorrectable memory errors:
¡ Incorrect memory access addresses or memory access commands.
¡ Memory write or read errors.
¡ Memory cache control errors.
¡ Memory timeout errors.
· PCIe fault detection.
MCA fault diagnosis can analyzes PCIe error addresses recorded by the error recording module, identify the faulty PCIe module, and locate the specific processor and slot. The following is common types of PCIe faults:
¡ Unsupported Request (UR).
¡ Malformed TLP.
¡ Completer Abort (CA).
¡ Completion Timeout (CTO).
¡ Poisoned TLP.
¡ ACS Violation.
¡ Flow Control Protocol errors.
¡ Data Link Protocol errors.
¡ Surprise Down errors.
MCA fault diagnosis (for servers with AMD processors)
HDM accepts the relevant AMD MCA data transmitted by the OBIS and parses the data to obtain the following information:
· Processor fault detection:
¡ Uncorrectable and correctable processor errors.
MCA fault diagnosis can locate an error on a specific socket.
¡ Errors in the SMN registers. An error that might trigger a cold system restart is recorded in the SMN registers.
MCA fault diagnosis can locate an error on a specific socket.
· Memory fault detection:
¡ ECC and non-ECC memory errors.
MCA fault diagnosis can locate an ECC memory error on a DIMM, or a non-ECC memory error on a channel.
¡ MEM training errors and MEM test errors.
MCA fault diagnosis can locate an error on a DIMM.
· PCIe fault detection: PCIe correctable and uncorrectable errors.
MCA fault diagnosis can locate an error on a slot.
Power supply fault diagnosis
SDS uses the interrupt reporting and polling mechanism to monitor power supplies, and can identify 11 of 24 power supply fault types. The 11 fault types include the following:
· Power supply absence.
· Input voltage faults, including input undervoltage alarm and protection, no input and poor power cord connection.
· Power supply fan fault.
· Temperature anomaly in the air inlet, including overtemperature alarm and protection and low-temperature alarm and protection.
· Output voltage faults, including overvoltage alarm and protection and low-voltage alarm and protection.
· Output current faults, including overcurrent alarm and protection.
· Flashing power supply LEDs at 1 Hz, which indicates a power failure.
· Abnormal IIC communication.
· Incorrect EEPROM information, including incorrect FRU information or absence of H3C certification.
· Power supply models not matched.
· Load balancing not achieved.
System board fault diagnosis
The system board integrates server hardware options. SDS identifies more than 70 types of system board-related faults, including:
· Faults on secondary power supplies in the server, including secondary power supplies for processors and other boards.
· Fan absence and abnormal PWM speed control.
· Temperature anomaly on the chassis, processors, or other boards.
· Abnormal voltage or current.
PCIe fault diagnosis
SDS mainly identifies the faults on network adapters and riser cards. More than 40 types of faults can be located, including:
· Network adapter faults, including power supply fault or temperature anomaly absence on H3C mLOM network adapters and 25-GE FLOM network adapters, and network adapter absence.
· Abnormal presence of riser cards.
· Abnormal NCSI channel change.
Storage controller fault diagnosis
SDS identifies and diagnoses the faults on the PMC and LSI storage controllers by analyzing the event log about the storage controllers. A hundred types of faults can be located, including:
· Storage controller startup faults.
· Cable connection faults.
· Memory faults.
· Supercapacitor faults.
· Drive faults.
· Power fail safeguard module faults.
Fault reporting
Fault reporting
HDM monitors hardware and system status in real time and reports event logs to remote destination hosts over SNMP trap, emails through SMTP, Redfish event subscription, or syslog messages.
SDS fault diagnosis
You can download the log entries to an .sds file from HDM, and review the diagnosis files in the downloaded .sds file to obtain hardware fault details.
Predictive alarming
HDM supports proactively reporting alarms on the components such as processors, memory, drive, storage controllers, network adapters, and power supplies.
· Processors—Predictive alarming on correctable configuration errors, overtemperature errors, QPI/UPI bus errors, and DMA errors.
· Memory—Predictive alarming on correctable ECC memory errors.
· Drives—Predictive alarming on predictive failure, media errors, and Prefail for HDDs and SSDs, predictive alarming on bad sectors for HDDs only, and predictive alarming and monitoring on remaining SSD or NVMe life.
· Storage controllers—Detection and predictive alarming on correctable bus errors for PCIe links of network adapters.
· Power supplies—Alarming on predictive faults, including predictive failure, load imbalance, power cap value exceeding correction time limit, and predictive alarming on power supply self-test errors.
· System board—Predictive alarming on voltage and temperature errors on the system board.
Maintenance
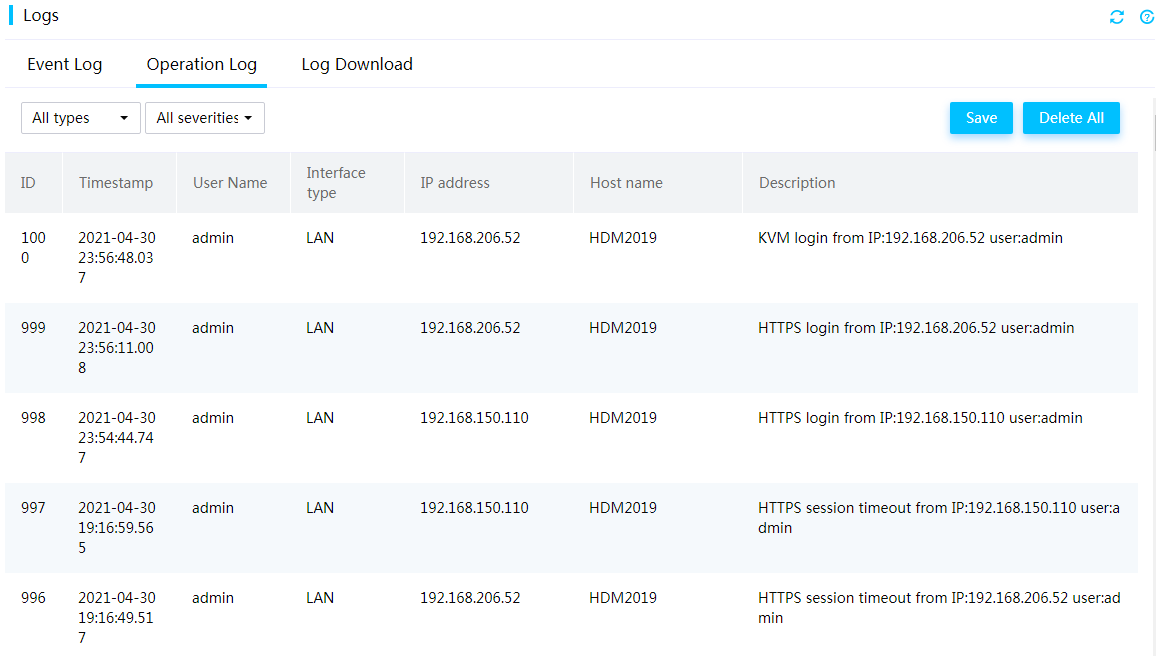
Operation log
The operation log includes audit log entries, firmware update log entries, hardware update log entries, and configuration log entries.
· Audit log entries record HDM administrative events for security auditing.
· Firmware update log entries record HDM firmware updates as well as their results.
· Hardware update log entries record hardware updates as well as their results.
· Configuration log entries record user configuration operations as well as their results.
A log entry contains timestamp, host name, and other details, as shown in Figure 13. The severity levels of the events include Informational and Warning.
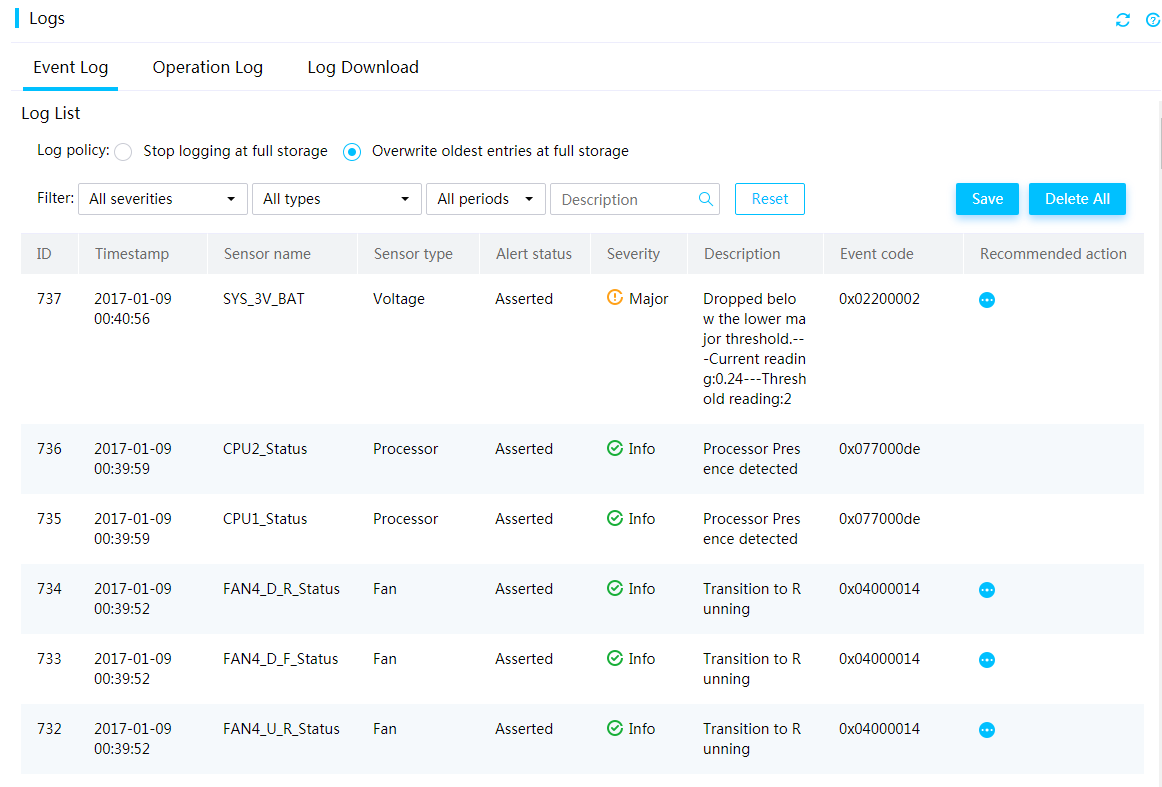
Event log
The event log records events reported by server sensors. The severity levels of events include the following:
· Info—The event does not adversely affect the system. No action is required. Examples of informational events include expected state change events and alarm removed events.
· Minor—The event has minor impacts on the system. Prompt action is required to avoid an escalation in severity.
· Major—The event might cause part of the system to fail and result in service interruption. Immediate action is required.
· Critical—The event might result in system outage or power failure. Immediate action is required.
You can filter events by sensor name, severity level, and log generation time.
Figure 14 Event Log page
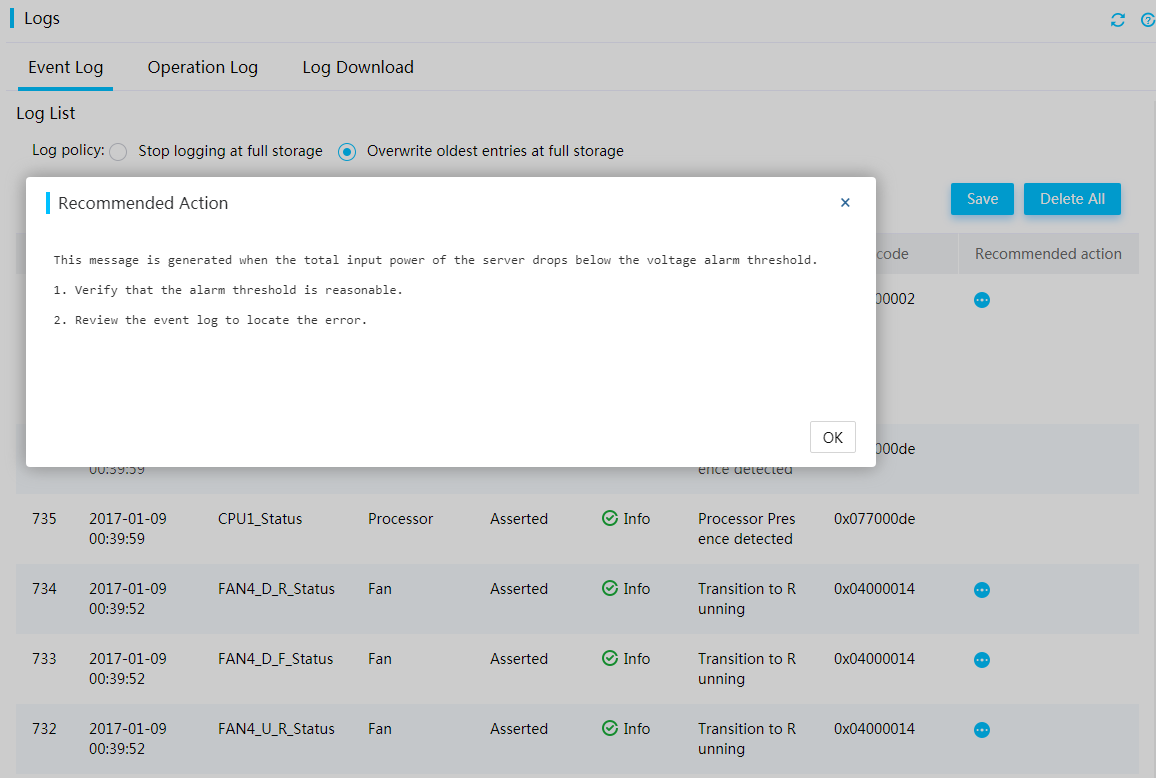
Event code
An event code identifies a unique event log entry in HDM. Users can locate the fault type on the device through an event code for the convenience to query related log manuals for more details.
Recommended action
The HDM Web interface provides the actions recommended for a system event. This facilitates fault location and repair because users can immediately obtain troubleshooting suggestions for related faults.
Figure 15 Viewing recommended actions
Serial port connection
HDM supports selecting the serial port to connect to when the SOL feature is enabled. SOL connection allows the system to redirect access from the local serial port on the server panel to remote access of the specified serial port, and receive the input of the remote network devices. The administrators can view the system serial port output on the local device in real time, and change the SOL connection mode locally.
SOL connection configuration from HDM
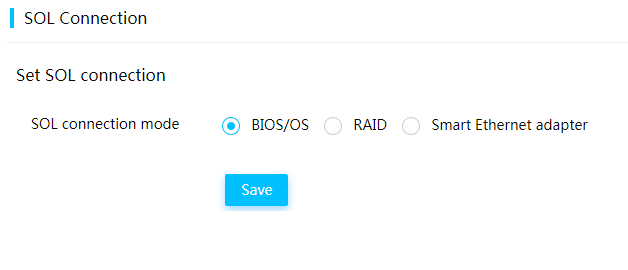
You can set an SOL connection mode on the HDM Web interface, including connection to the serial port of the BIOS or OS, mezzanine storage controller, or smart network adapter.
Figure 16 Setting the SOL connection mode
Recording of serial port information
HDM supports real-time recording of system serial port output and saves the data to the internal storage media. If an error occurs, you can download the data to the local device for analysis.
Sensor data reporting
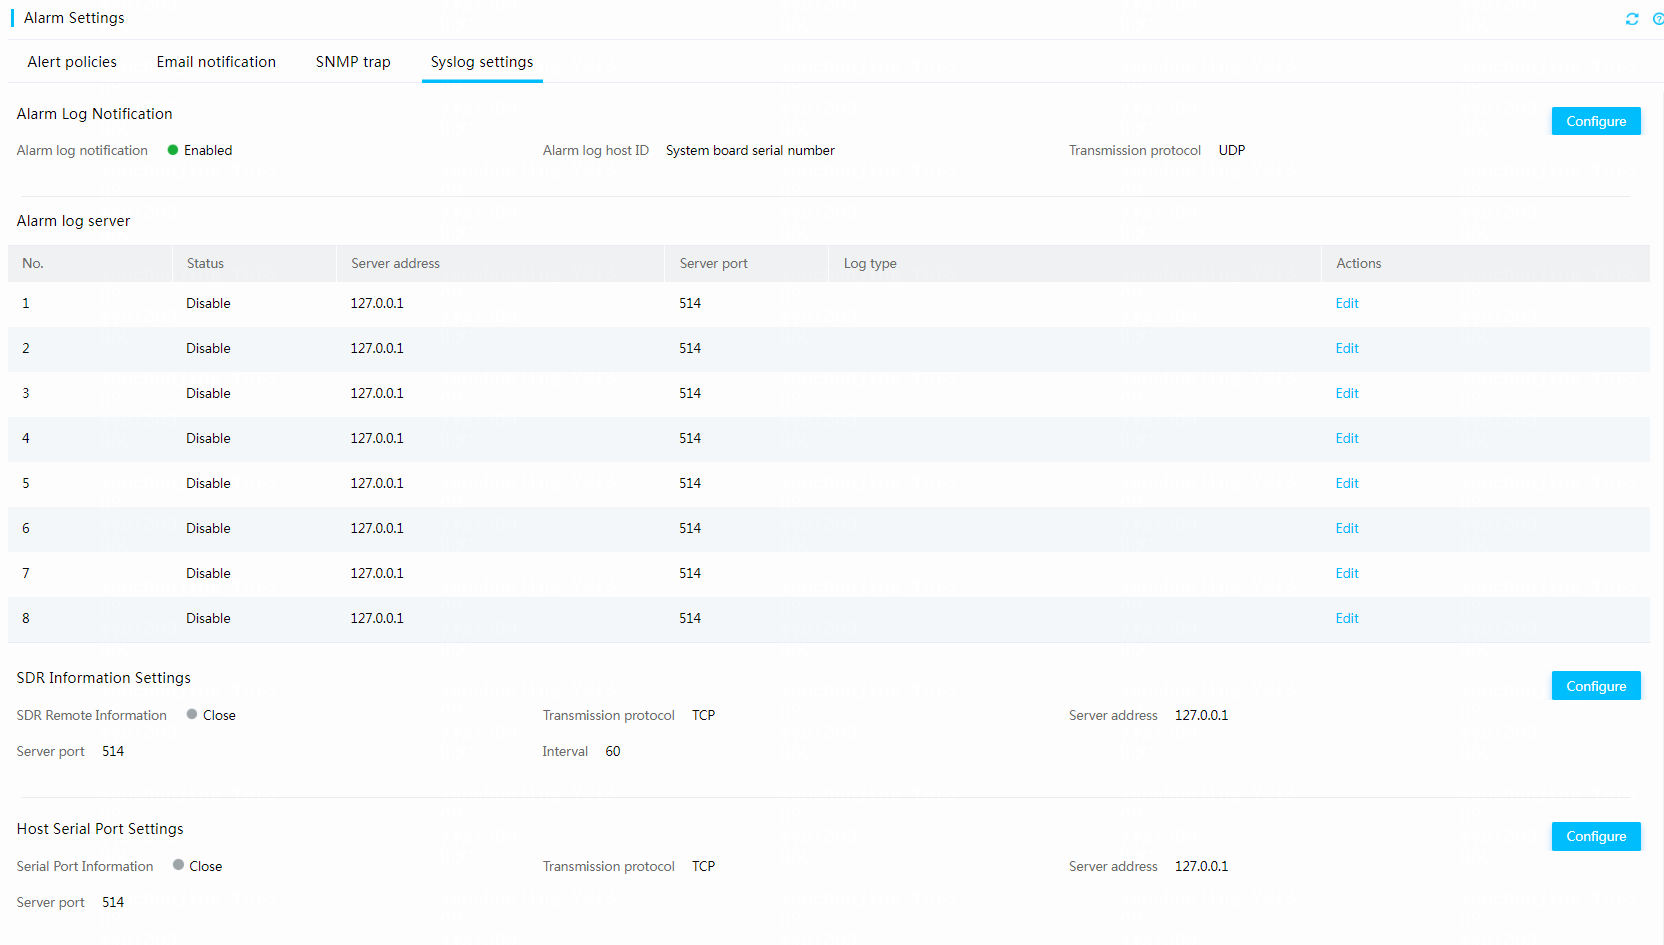
HDM supports periodically reporting the serial port data and sensor data from the IPMI command sdr elist to a syslog server. You can configure the IP address, port number, transmission protocol, sending interval for the syslog server from the SDR Information Settings area, as shown in Figure 17.
Figure 17 Configuring a syslog server
Serial port data monitoring
HDM supports sending logging information about the BIOS or OS serial port to a remote syslog server for data monitoring. For information about how to configure the syslog server, see Host Serial Port Settings in Figure 17.
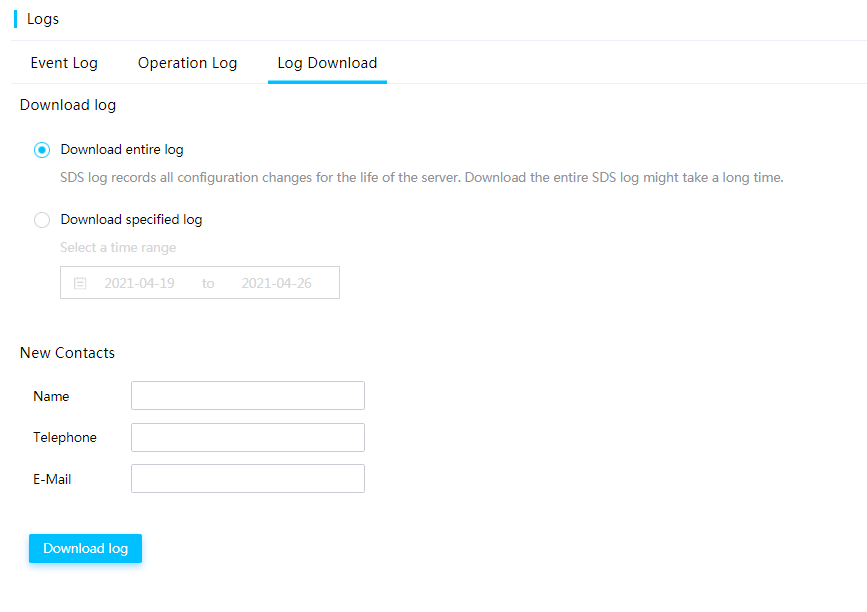
Log download
This feature enables users to download records about event log entries, hardware information, and SDS diagnostic information throughout the lifecycle of the server. You can view the downloaded log and add contact information for log analysis consultation.
Figure 18 Specifying log entries to download
Diagnostic panel
Diagnostic panels (only for G3 servers) display the exceptions that occurred on servers. These component failures are consistent with the event log generated in HDM.
Figure 19 Diagnostic panel view
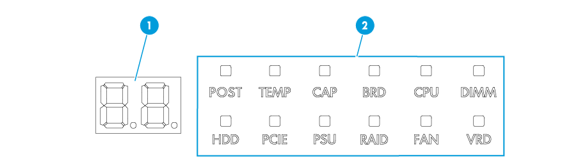
The diagnostic panel provides the following elements:
· Component LED—Indicates the status of a component. Color options include:
¡ Amber/Red—An alarm has occurred on the component.
¡ Green—The component is operating correctly.
· Digital tube—Displays error codes to indicate the failed components.
A diagnostic panel displays only one component failure at a time. When multiple component failures exist, the diagnostic panel displays all these failures in turn at intervals of 4 seconds.
The component LEDs are available for indicating component failures:
· POST—Indicates that the POST process encountered an error and stopped in the displayed phase.
· TEMP—Indicates that the temperature of the component has exceeded the upper threshold or dropped below the lower threshold.
· CAP—Indicates that the system power consumption has exceeded the power cap value.
· BRD—Indicates that an error occurred on the corresponding SMC, PDB, compute module, or mLOM network adapter.
· CPU—Indicates that an error occurred on a processor.
· DIMM—Indicates that an error occurred on a DIMM.
· HDD—Indicates that an error occurred on a drive.
· PCIE—Indicates that an error occurred on the PCIe module in a slot.
· PSU—Indicates that an error occurred on a power supply.
· RAID—Indicates that an error occurred on a storage controller.
· FAN—Indicates that an error occurred on a fan module.
· VRD—Indicates that a power supply error occurred on the corresponding SMC, PDB, or processor.
Intelligent security bezel
The intelligent security bezel is available only for G5 servers.
The decorative LEDs on the intelligent security bezel can operate in three colors, white, amber, and red to indicate the server health status or power load. Users can obtain status or fault information directly from the decorative LEDs to facilitate on-site inspection or fault location.
Figure 20 Intelligent security bezel
BSoD screenshots
This feature automatically takes a bluescreen of death (BSoD) screenshot upon a system crash of Windows and saves the screenshot in the storage space for future troubleshooting. You can view BSoD screenshots from HDM.
HDM can save a maximum of 10 BSoD screenshots in the specified format. Before enabling this feature, make sure the KVM service has been enabled for your user account.
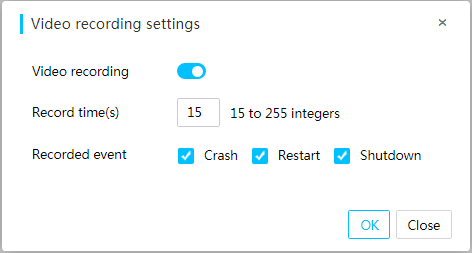
Video replay
With this feature enabled, when a severe OS exception occurs, such as crash, restart, and shutdown, the system records server operations performed before the exception. You can replay these videos to analyze or troubleshoot the recorded events.
On the video replay page of HDM, you can play, download, and delete the recorded videos.
The system supports a maximum of three video files. Before enabling this feature, make sure the KVM service has been enabled for your user account.
Figure 21 Configuring video replay settings
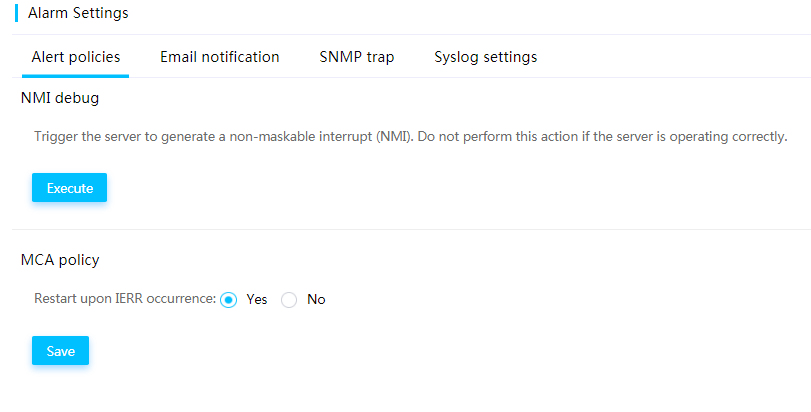
Alert policies
NMI debug
Non Maskable Interrupt (NMI) debug enables HDM to send an NMI to the OS to collect kernel stack information and send the information to the console for locating system exceptions.
MCA policy
Machine Check Architecture (MCA) allow you to configure whether to restart the server automatically when an IERR occurs. IERRs include processor errors, memory errors, and PCIe errors.
Figure 22 Enabling NMI debug and setting the MCA policy
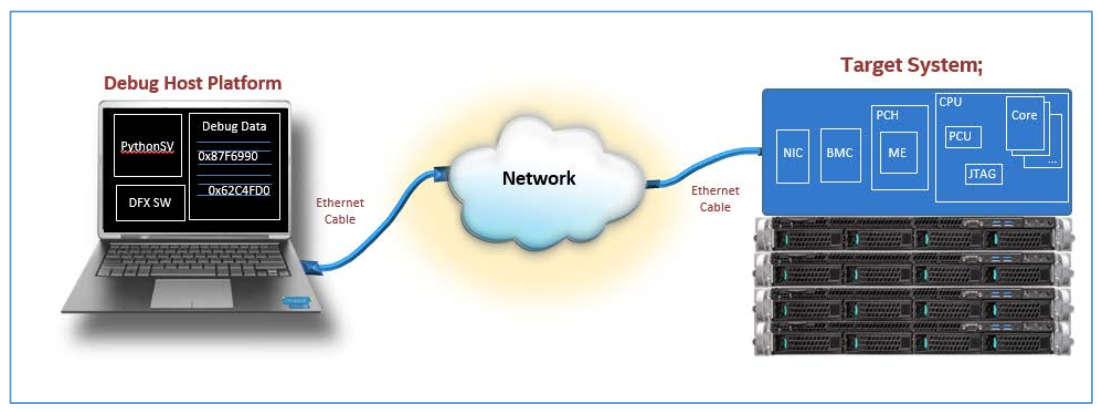
Remote XDP
Users can remotely perform JTAG debugging on Intel processors without purchasing an Intel-specific debugger or connecting the debugger to the target server. JTAG debugging can collect register information about the server components, including processors, memory, PCIe modules, and USB devices, to help locate hardware issues.
This feature is available only for the servers installed with one or two Skylake, Cooperlake, or IceLake processors.
Figure 23 Remote XDP diagram
To set up the debugging environment, perform the following tasks:
1. Enable the remote XDP service from HDM.
2. Install OpenIPC on the local PC.
3. Install Python and download Cscripts provided by Intel.
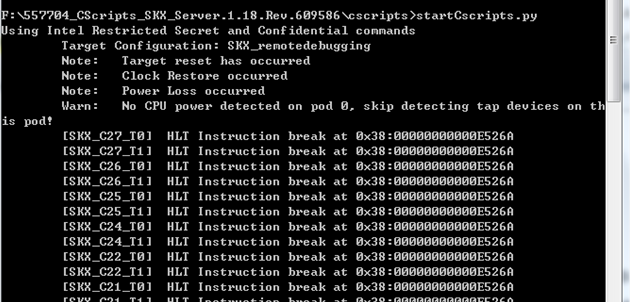
4. Open CMD and execute the commands in the cscripts directory, as shown in Figure 24.
Figure 24 Executing the commands in CMD
ACD
HDM integrates the Intel Autonomous Crash-Dump (ACD) feature for servers with Intel processors. When an MCA error occurs, ACD collects MCA and processor-related register information, including information about processor, memory, and PCIe faults in an out-of-band manner. Then, ACD saves the information in JSON format for CScripts analysis. This enhances the ability to locate MCA errors for the Intel platform.
HDM supports enabling ACD through the IPMI interface.
Figure 25 Intel ACD mechanism

iHDT
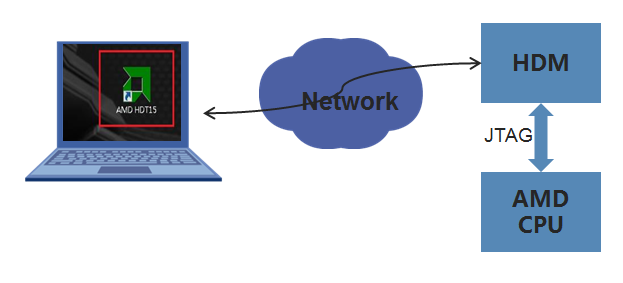
The iHDT service performs JTAG debugging remotely for AMD processors in an out-of-band manner through Hardware Debug Tool (HDT) provided by AMD, and collects processor, memory, and PCIe information.
The iHDT service is available for G5 AMD servers. Before using the iHDT service, enable it from HDM.
Figure 26 iHDT mechanism
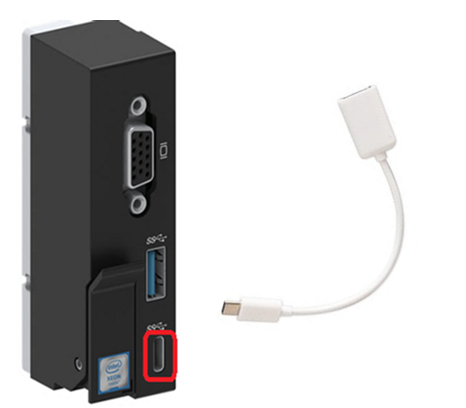
Service USB device
A chassis ear on G5 servers is integrated with a USB Type-C connector that is connected directly to HDM. A USB device connected to the Type-C connector can operate as a service USB device. After HDM identifies the USB device connected to the Type-C connector and determines whether to use the USB device for log download.
A service USB device is a USB device burned with the image file of the USB diagnostic tool. You can use Unitool to make a service USB device.
Figure 27 USB Type-C connector on G5 servers
HDM task status query
HDM supports querying the status of back-end BMC tasks, including firmware update, SDS log download, MCA collection, KVM image mounting, and configuration import and export. The following task information is available:
· Task type.
· Brief description of the task.
· Task status that indicates the task is not started, being processed, or has been completed.
· Trigger condition for the configuration to take effect, including BMC reset, system warm reset, and system power-off).
· Estimated task processing time.
Server management
FRUs and asset management
FRU information contains the factory information coded in hardware about the field replaceable units.
The core of asset management is to obtain the unique product code of a server component. For an H3C product, HDM can obtain the product code from the FRU. For a third-party product, HDM can obtain the product code from the BIOS or through an out-of-band method.
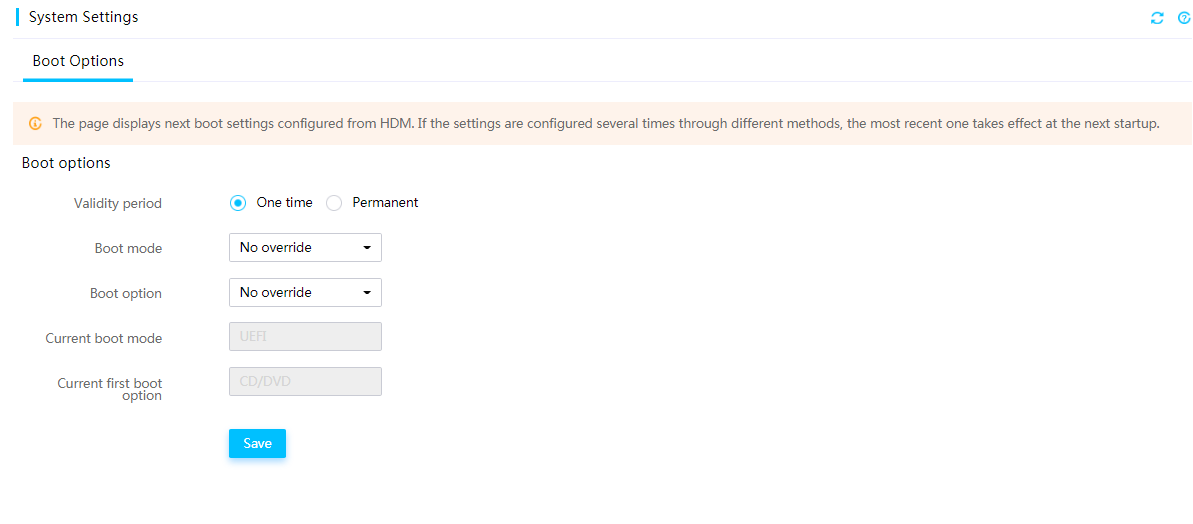
System boot options
The boot options specify one-time boot mode, boot device settings for the server to use at the next reboot as well as the validity period of the next boot mode and option.
Figure 28 Setting the system boot options
Fan management
HDM supports using both MS algorithm and PID controller algorithm to adjust fan speeds. The PID controller algorithm is more precise.
MS algorithm
You can directory use MS algorithm to specify fan speeds at different temperatures in the .xml configuration file, as shown in Figure 29.
Figure 29 Specifying fan speeds in the configuration file

PID algorithm
PID algorithm is used to calculate the optimized fan speed in real time by using sensor speed parameters and sensor temperature readings in the .xml configuration file. It can adjust fan speeds in a more precise way. The PID controller algorithm operates as shown in Figure 30.
Figure 30 PID controller algorithm
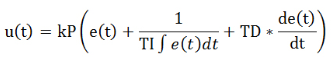
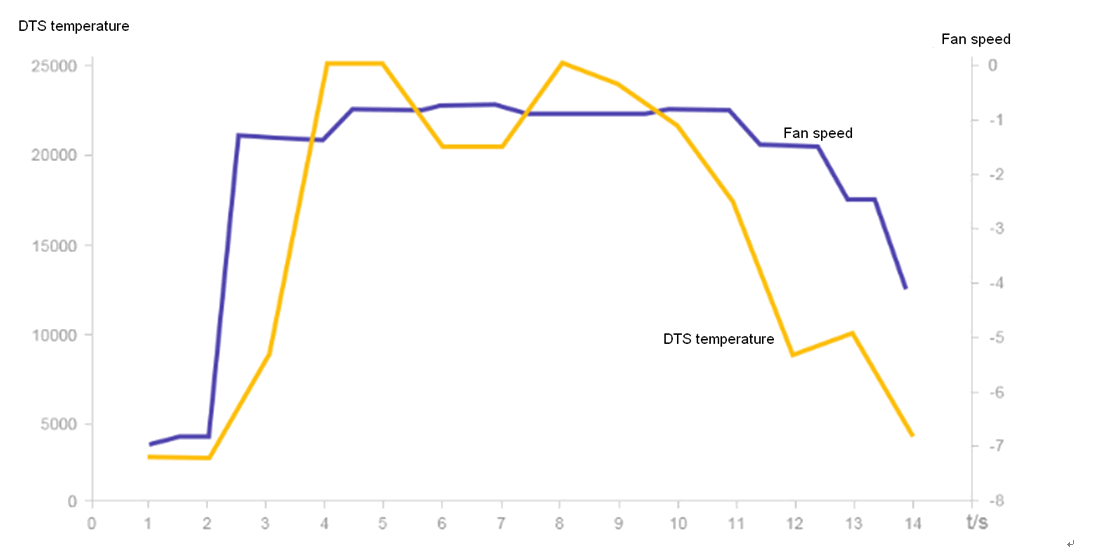
Figure 37 shows the simulation diagram of fan speed adjustment with the PID algorithm. If the DTS temperature increases or decreases, the fan speed will increase or decrease accordingly.
Figure 31 Fan speed adjustment with PID algorithm
Fan speed mode
You can select one of the following fan speed modes as needed:
· Silent—Enables the fans to run at the lowest speed required by heat dissipation of the server. This mode is suitable for scenarios with high noise requirements.
· Balanced—Enables the fans to run at a higher speed to provide balanced noise control and cooling performance.
· Powerful—Enables the fans to run at the highest possible speed. This mode is suitable for scenarios where the server requires high cooling performance. For example, the server is busy and key components, such as processors, are heavily loaded, or the ambient temperature changes frequently.
· Custom—Specifies a customized fan speed level in the range of 1 to 20. A higher level represents a higher speed and larger noise.
DCPMMs
Intel Optane Data Center Persistent Memory Module (DCPMM) is a new type of non-volatile memory device.
HDM can present information about DCPMMs through the BIOS and MCTP over ME, including firmware version of the DCPMM controller, temperature of the DCPMM, temperature of the DCPMM controller, remaining DCPMM life, total power-on time of the DCPMM, capacity of the DCPMM as volatile system memory, and capacity of the DCPMM as persistent memory.
Network adapters
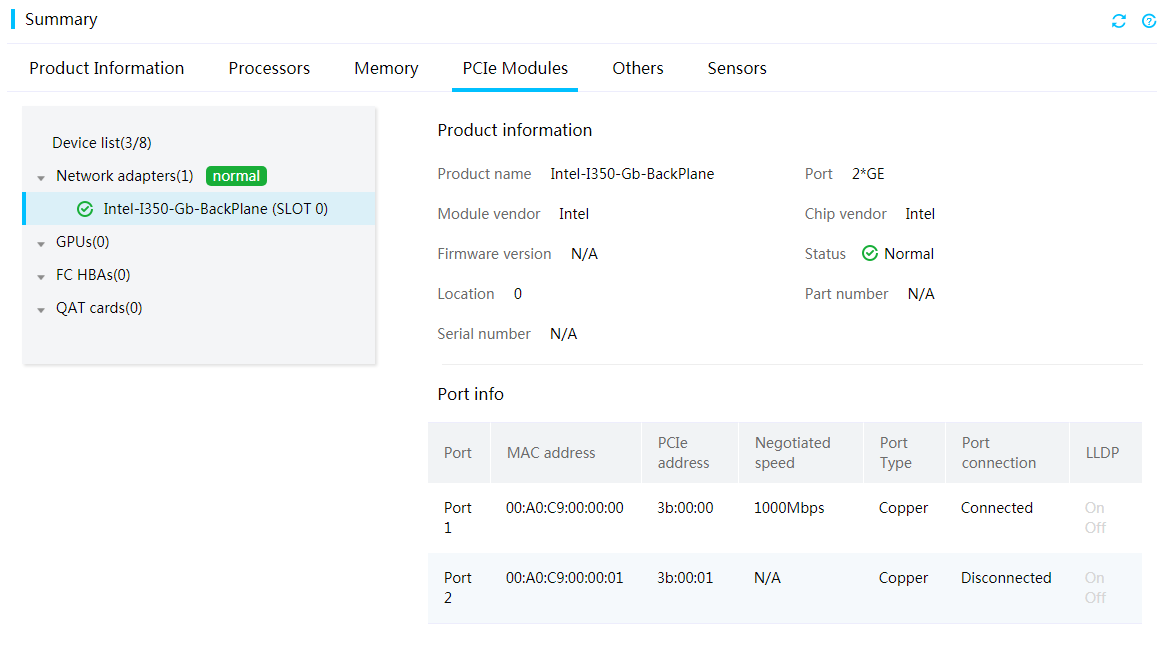
HDM supports out-of-band management of PCIe network adapters and OCP network adapters that support NCSI over MCTP. You can obtain network port information from HDM, including MAC address, port type, connection status, and negotiated speed.
Figure 32 Viewing network adapter information
FC HBAs
HDM supports out-of-band management of FC HBAs through MCTP over PCIe. You can obtain FC HBA information from HDM including WWN, temperature, health status, link status, and speed.
Only Lpe31002, Lpe31000, Lpe32002, and Lpe32000 FC HBAs are supported.
GPU modules
HDM supports out-of-band management of GPU modules. You can obtain GPU module information from HDM, including memory capacity, GPU module cores, rated power, product name, vendor name, vendor ID, firmware version, number of internal GPU modules, and temperature sensor readings for internal GPU modules.
Only NVIDIA GPU modules, Cambricon GPU modules, and some Enflame GPU modules are supported.
Available GPU module information varies by GPU module model.
Hard partitioning
Hard partitioning is supported on H3C UniServer R8900 G3. This feature enables the eight-processor server to operate as two four-processor servers in dual-system partitioning mode. Two four-processor servers are independent to each other in hardware, have their own BIOS, and can be installed with different processors and OSs. The server can utilize the resources as follows:
· Each four-processor server has its own processors, memory, drives, fans, riser cards. The fans in each four-processor server support N+1 redundancy. Each server has its own HDM and can update HDM independently.
· Two four-processor servers share the power supplies and midplane.
Smart network adapters
HDM supports out-of-band management of smart network adapters from the following aspects:
· Displays sensor data to monitor voltage, current, and power of the network adapters.
· Provides smart network adapter information from HDM, including FRU write protection status, network adapter ID, BOM ID, PCB ID, vendor ID, device ID.
· Supports FRU write and read operations on smart network adapters.
· Supports configuring smart network adapter settings, including power-on or power-off of network adapters, network adapter controller resetting, FPGA resetting, enablement status of FRU write protection.
Storage management
Storage controller management
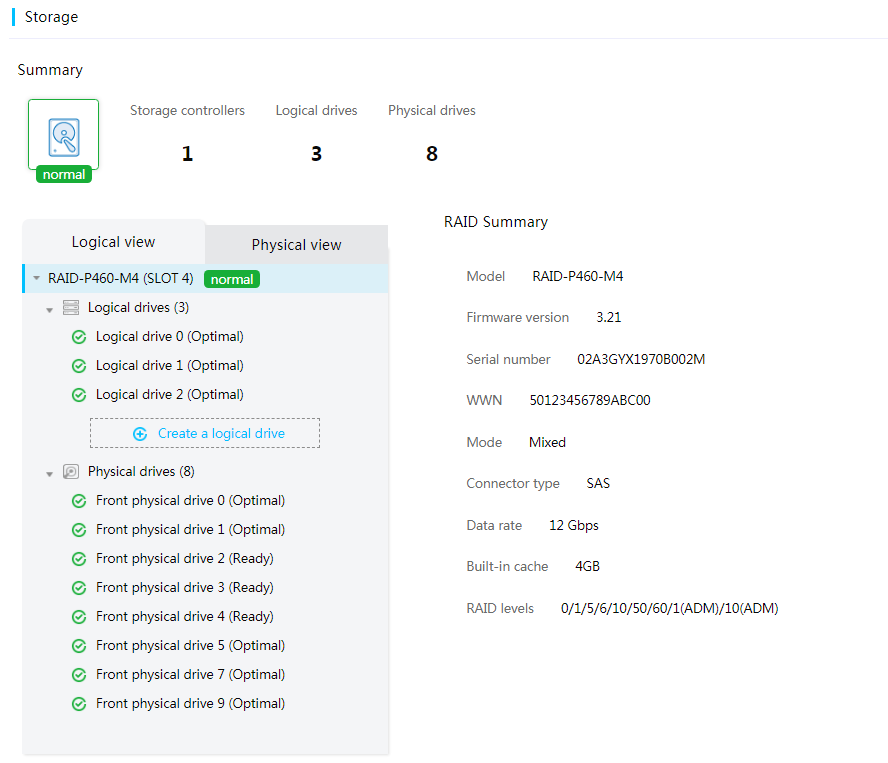
HDM can obtain storage controller information including the number of storage controllers, storage controller model, vendor, firmware version, connector type, data rate, serial number, cache capacity, mode, and supported RAID levels.
Figure 33 Viewing storage controller information
Logical drive management
HDM supports creating logical drives for the following storage controllers:
· LSI storage controllers except for 9300, 9311, and 9400 series storage controllers.
· P460 and H460 series PMC storage controllers that support MCTP over PCIe.
Support for RAID out-of-band management depends on the firmware version of a storage controller.
You can modify the read or write policy of a logical drive attached to an LSI storage controller (except for 9300, 9311, and 9400 series LSI storage controllers).
Figure 34 Managing logical drives
Physical drive management
HDM can obtain physical drive information, including slot number, drive model, serial number, drive status, drive capacity, interface speed, interface type, drive type, and remaining drive life (available only for LSI storage controllers).
You can change the state of physical drives in Unconfigured Good, Unconfigured Bad, or JBOD state attached to an LSI storage controller (except for 9300, 9311, and 9400 series LSI storage controllers).
You can enable the drive UID LED for a drive to locate the drive.
Figure 35 Managing physical drives (logical view)
Figure 36 Managing physical drives (physical view)
Storage maintenance
Alarms
HDM can report alarms on multiple types of faults, including drive presence, drive failure, predictive failure, critical array errors, and storage controller errors. Faults that can be detected and reported vary by component type.
· HDD drives—Drive failure, predictive failure, drive media errors, Prefail, uncorrectable errors, bad sectors, and drive missing status monitoring and alarming.
· SSD drives—Drive failure, predictive failure, drive media errors, Prefail, uncorrectable errors, drive missing status monitoring and alarming, and data collection and alarming on remaining SSD life and remaining reserved blocks.
· NVMe drives—Monitoring and alarming on remaining NVMe life.
· Storage controllers—Storage controller failure and RAID rebuilding failure.
· Supercapacitor—Supercapacitor failure, predictive failure (low voltage), and supercapacitor absence.
SDS log and diagnosis
SDS log
HDM can obtain information about PMC storage controllers through the PBSI channel and records the information to the SDS log. SDS log can record more than 60 types of drive failures.
SDS log obtained through MCTP over I2C transport binding contains log messages about LSI storage controllers. SDS can record more than 200 log messages about RAID controllers, supercapacitor, drives, logical drives, and drive backplanes.
SHD diagnosis
SHD SDS can identify failure reasons depending on log messages about PMC RAID or HBA controllers and LSI RAID or HBA controllers, and provides corresponding solutions. SDS is supported on RAID controllers, cables, supercapacitor, and storage media. SDS provides 100 entries for fault diagnosis.
SMART information
HDM can obtain SMART information about SAS/SATA HDD drives, which can be stored for 30 days and can be obtained one time a day.
The supported LSI storage controllers include 9361, 9460, 9440, 9560, L460, RAID-P5408-Mf, RAID-P5408-Ma, and HBA-H5408-Mf series storage controllers.
Log download is used to obtain SMART information from HDM.
Serial port log of storage controllers
HDM can obtain the serial port log of the mezzanine RAID controller and LSI storage controllers (except for 9300, 9311, and 9400 series LSI storage controllers).
Smart power management
Configuring power status
You can view and change the server's power status remotely as shown in Figure 37.
To control the power status of the server, you can select one of the following options:
· Force system reset—Performs a cold reset of the server. HDM directly resets the server through PCH without shutting down the OS.
· Force power-off—Powers off the server without waiting for the response from the OS. This action is equivalent to pressing and holding the power button on the server.
· Graceful power-off—Powers off a server. HDM sends an ACPI interrupt to the OS. If the OS supports the ACPI interrupt, HDM shuts down the OS by stopping all running processes and then powers off the server. If the OS does not support the ACPI interrupt, HDM powers off the server forcibly after the graceful power-off timer expires. This action is equivalent to pressing the power button on the server to put it in standby mode.
· Power on—Starts up the server.
· Force power-cycle—Powers off and then powers on the server.
Configuring power capping
Typically, excessive power supply is required to ensure service continuity in a traditional data center. HDM provides power capping to precisely control the power consumption of each server, helping save power and eliminate the demand for excessive energy supply.
With power capping configured, if the system power exceeds the power cap value, specific actions are triggered to ensure that power is properly distributed.
If power capping fails, the following operations are performed:
· Event logging—Logs information about the power capping failure in the system event log file by default.
· Shutdown on capping failure—Shuts down the server on a power capping failure. This operation is optional.
HDM supports power capping for both Intel and AMD processors.
Figure 38 Configuring power capping
Setting the power supply operating mode
The system can improve the power conversion efficiency by setting some power supplies to the hot standby state.
You can set the power supply operating mode from HDM. Options include:
· Load balancing—Allows all power supplies to provide power in a balanced way.
· Active/standby—Allows active power supplies to mainly provide power. In this mode, you must specify a minimum of one active power supply and a minimum of one standby power supply. If an active power supply fails, a standby power supply becomes active to supply power. If an actual power consumption of the active power supply exceeds 62% of its maximum rated power consumption, a standby power supply becomes active to supply power.
Figure 39 Setting the power supply operating mode
Viewing power consumption history statistics
HDM displays the power consumption history statistics and chart for the server, which helps you understand power usage and heat dissipation conditions. You can adjust the power consumption based on power consumption history data.
Figure 40 Viewing power consumption history statistics
Setting the performance mode of power supplies
To meet the requirements for different server performance, power consumption, and noise, you can select one of the following performance modes for power supplies:
· Performance—Indicates the performance first mode.
· Balanced Performance.
· Balanced Power.
· Power—Indicates the power saving mode.
Figure 41 Selecting an operating mode
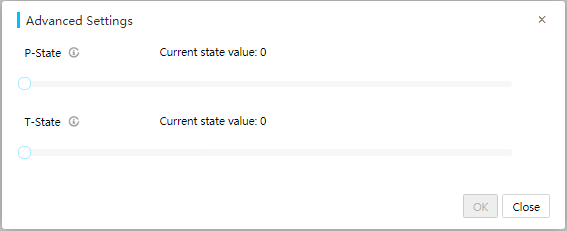
Configuring processor power states
You can adjust the power consumption of processors by changing the preferred P-state or T-state value.
Figure 42 Configuring processor power states
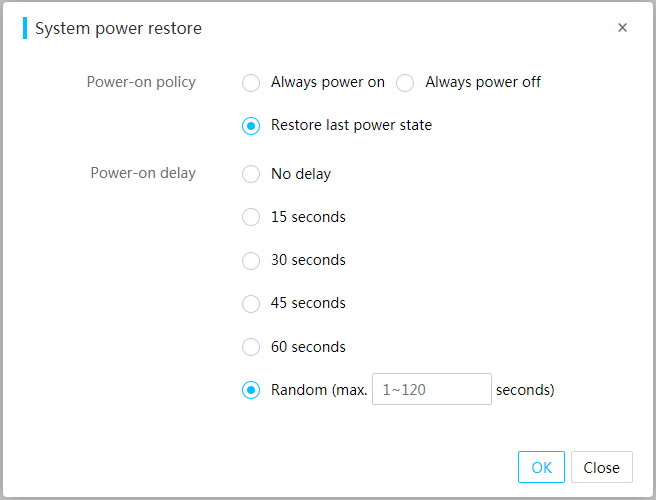
Configuring automatic power-on
Perform this task to configure the power-on policy of the server when the server is connected to the power source.
The following are available fields:
· Power-on policy—Select whether to start the server when the server is connected to the power source. Options are Always power on, Always remain off, and Restore last power state.
¡ To have the server always automatically start up when it is connected to the power source, select Always power on.
¡ To have the server stay off when it is connected to the power source, select Always remain off.
¡ To have the server return to the power state on the previous power-off, select Restore last power state.
· Power-on delay—Set the power-on delay time. Options are No delay, 15 seconds, 30 seconds, 45 seconds, 60 seconds, and Random (max. 120 seconds).
Power-on delay can power on servers through peak shifting to reduce instantaneous power consumption of the server power-on in the equipment room.
Figure 43 Configuring automatic power-on
BMC-controlled server power-on
This feature is available only for some servers.
The power-on of the server is determined by the BMC. After the server is connected to the AC power source, the standby power source of the system board supplies the power first to start up the BMC. Then, the BMC determines whether to start up the server based on the configured power-on policy.
KVM and virtual media
KVM
KVM allows you to monitor and control remote devices in real time by using the local client. You can operate remote devices through KVM.
Figure 44 KVM diagram
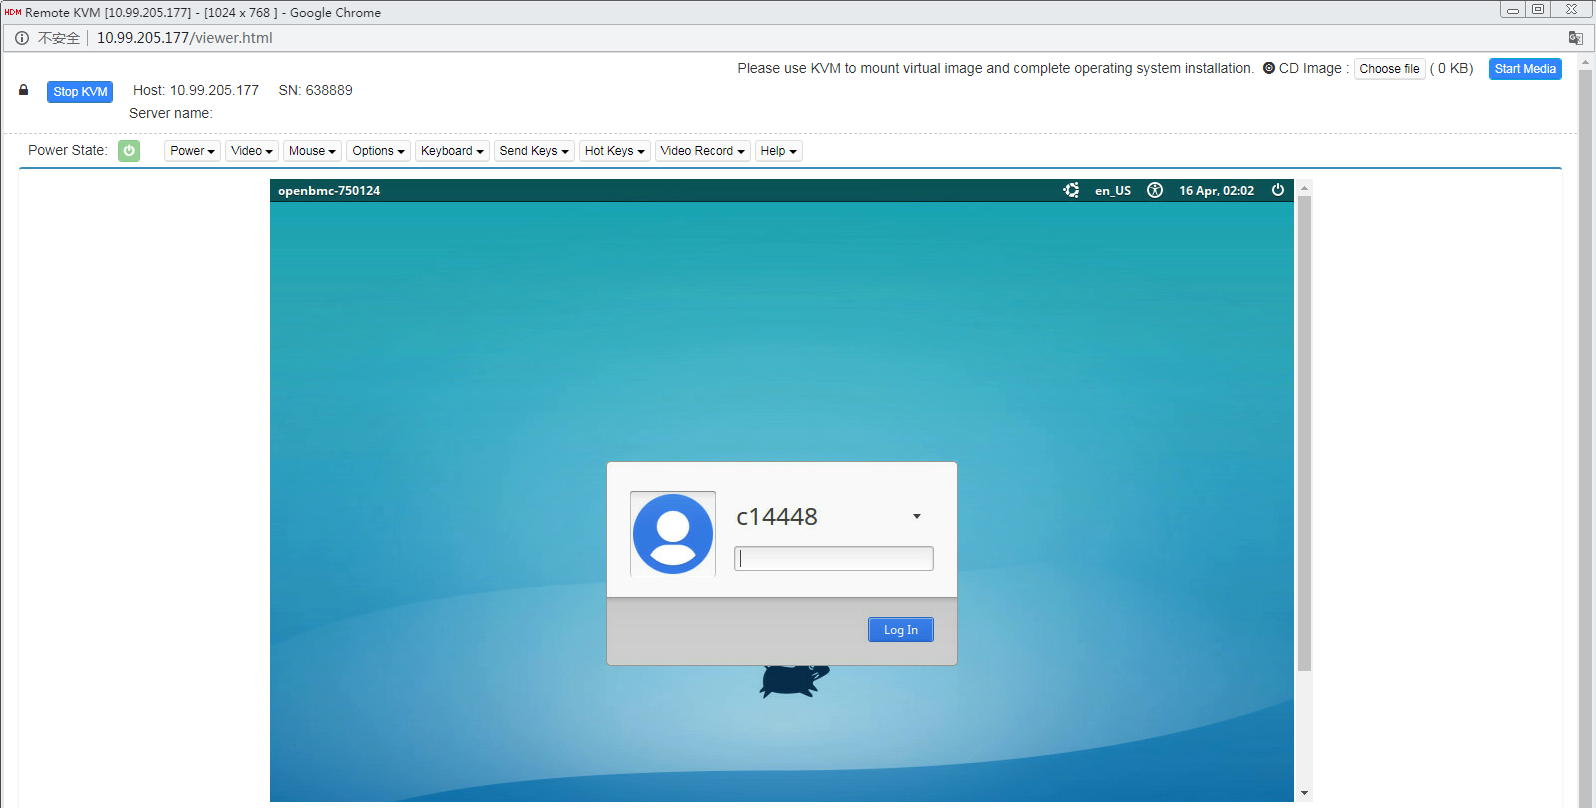
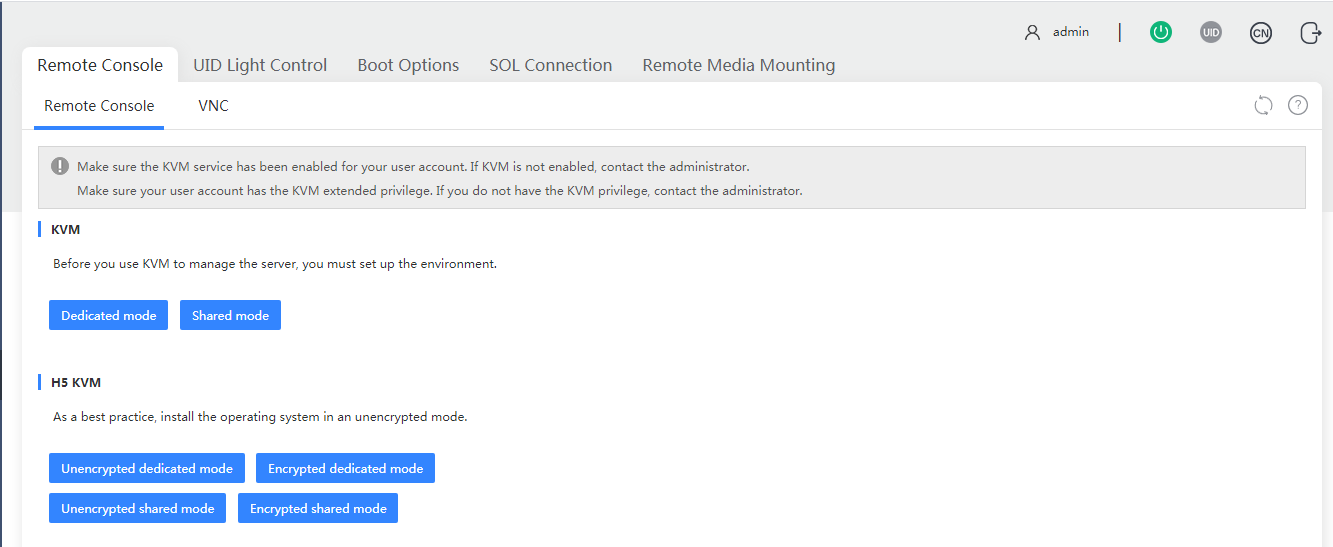
H5 KVM
Compared with KVM, H5 KVM does not require any plug-ins. You can access the H5 KVM remote console over HTTPS to manage the server remotely.
HDM supports access to H5 KVM by entering IP address, username, and password in the format of http://ip_addr/viewer.html?u=user_name&p=user_password in the address bar of a browser.
Figure 45 Example of direct access to H5 KVM
KVM launch mode
The following KVM launch modes are available:
· Dedicated mode—Includes Encrypted dedicated mode and Unencrypted dedicated mode. A dedicated mode allows for only one remote console session and grants the user with the full access permission.
· Shared mode—Includes Encrypted shared mode and Unencrypted shared mode. A shared mode allows for a primary session and multiple secondary sessions. If you are the primary user, the system assigns you with the full access permission. If you are a secondary user, you have only the read-only permission and can only view videos, take screenshots, and record videos.
Encrypted modes are only available for H5 KVM. In encrypted mode, data are transmitted after encryption between the client and the server, which provides better security performance. In unencrypted mode, the system transmits unencrypted data, which provides higher transmission speed. As a best practice, use an unencrypted mode when installing an OS.
Figure 46 Selecting a KVM launch mode
Virtual media
The virtual media feature allows you to use a virtual USB DVD-ROM drive or a floppy disk drive to remotely access the local media over the network. The local media might be the DVD-ROM drive, floppy disk drive, DVD-ROM image file, floppy disk image file, or hard drive folder. The virtual media data can be encrypted by using the aes128-cbc encryption algorithm. To use virtual media is to virtualize the media devices on the local client to the media devices on the remote server over the network.
The following virtual storage media are available:
· CD/DVD drives.
· ISO files and IMG files.
· Virtual folders mounted to the server from the local PC.
· USB keys.
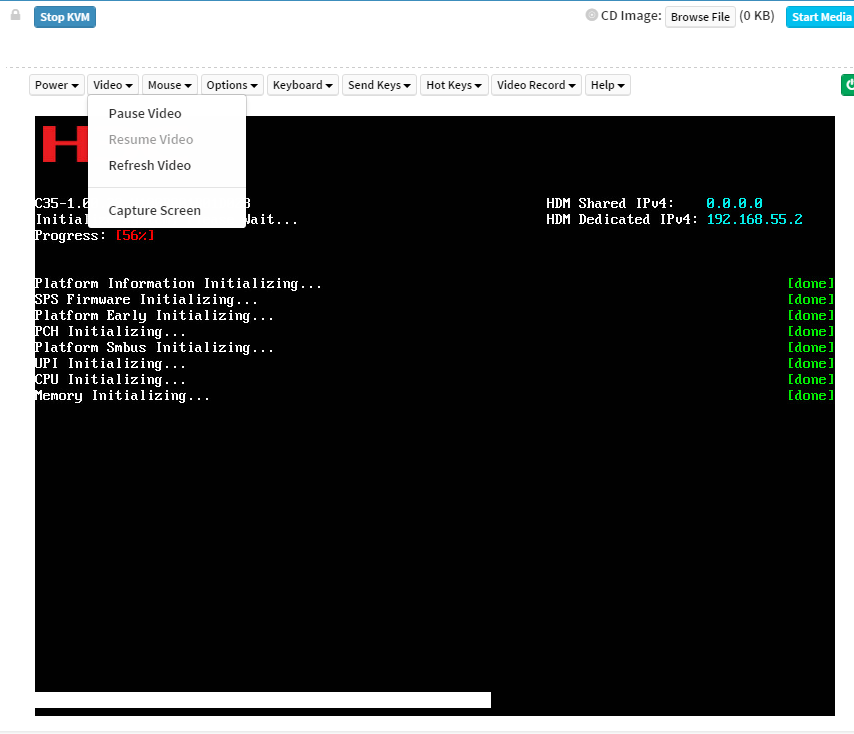
Screen capture from KVM
You can capture the screenshots of a KVM remote console, and save the screenshots in .jpeg format to the local PC.
Figure 47 Capturing the screenshots
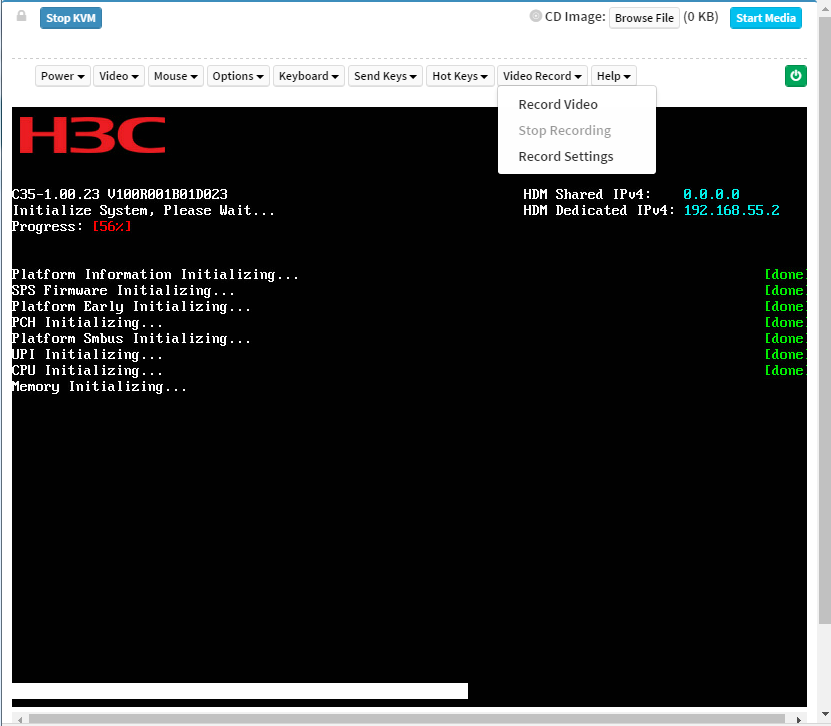
Video recording from KVM
You can record videos on the KVM remote console, and save the screenshots in .avi format on the local PC. The videos can record virtual KVM operations to ensure security or meet other special requirements. When video recording is enabled, the KVM remote console automatically records all information displayed on the screen and all operations that have been performed to a self-defined video file. You can play the videos by using the local player.
Figure 48 Enabling video recording from KVM
VNC sessions
About VNC
Virtual Network Console (VNC) transmits the original images of the server to the client. VNC allows you to access and manage the server from a local PC without logging in to HDM.
A VNC system includes a VNC server, a VNC client, and the VNC protocol:
· VNC server—Runs on the HDM side to capture and share the server screen, and has no relation with the operating system running status.
· VNC client—Also VNC viewer. The VNC client is installed on the local PC and connects remotely to the VNC server. The third-party VNC client can be RealVNC, TightVNC, or NoVNC.
HDM supports both IPv4 and IPv6 VNC sessions.
VNC session modes
HDM supports a maximum of two concurrent VNC sessions, and the following session modes are available:
· Shared mode—Supports a maximum of two concurrent VNC sessions. Both sessions have access to the mouse and keyboard and have the control of the server's OS.
· Exclusive mode—Supports only one VNC session. If a session in shared mode is connected, and you try to establish a session in exclusive mode, the session in the shared mode will be forcibly disconnected. If a VNC session already exists, the subsequent requests for another VNC session will be refused.
The session mode used in a VNC system is determined by the VNC client.
Enabling VNC
By default, the VNC service is disabled.
To enable the VNC service, go to the Security > Services page.
Figure 49 Enabling the VNC service
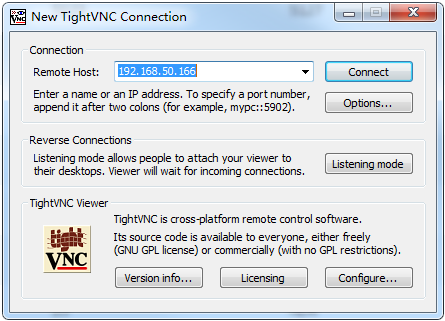
Establishing an insecure VNC session
Enabling VNC from HDM
Log in to HDM and enable the VNC service.
Establishing a VNC session on the VNC client
Open the VNC client (VNC viewer) and then enter the VNC password to establish a VNC session.
Figure 50 Authenticating to VNC server
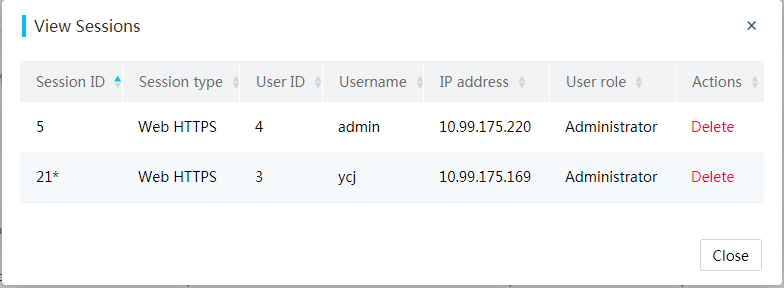
Viewing VNC sessions
You can view the established insecure VNC session from the Security > Services page of HDM. The IP address for the VNC session is the IP address of the VNC client. Both IPv4 and IPv6 addresses are supported by the VNC client.
Figure 51 Viewing VNC sessions
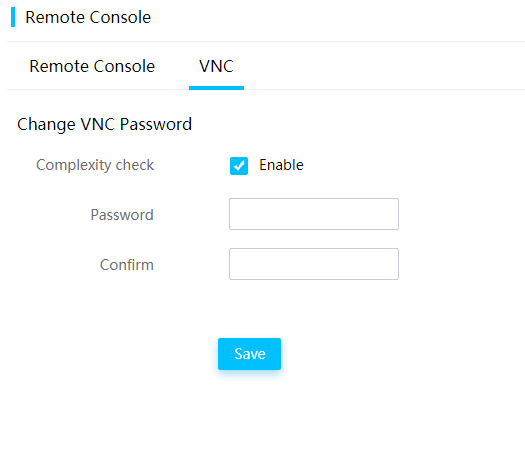
Configuring VNC
This feature allows you to enable or disable password complexity check. If password complexity check is enabled, a password must be 8 characters in length. If password complexity check is disabled, a password must be 1 to 8 characters in length.
Figure 52 Configuring VNC
HDM network
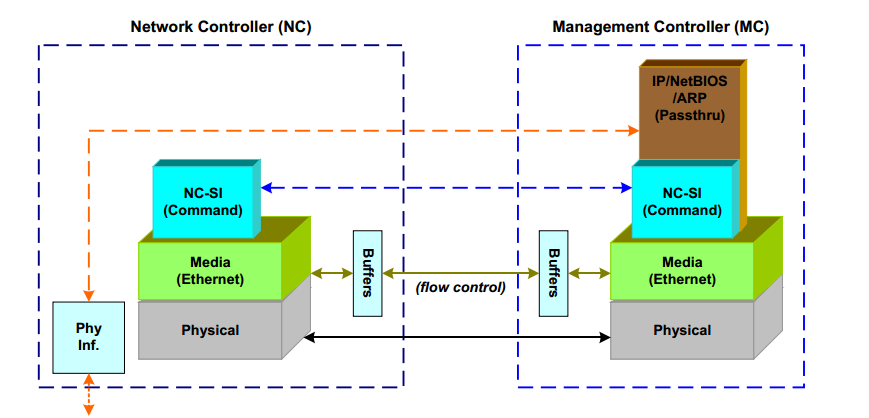
Sideband management and NCSI
Sideband management enables the management system and the server system to share a physical network port on the server by using the NCSI technology. It implements management and service processing, simplifies networking, and reduces port usage on the switch. For security purposes, sideband management divides the management and services in different network segments by using the VLAN technology.
NCSI is an out-of-band management bus protocol based on the physical bus RMII. The common network management bus is the MDC/MDIO bus, which requires additional pins as the physical bus. NCSI shares the bus with the network communication bus RMII, and an NCSI protocol is defined on the basis of the RMII bus, which reduces physical pins.
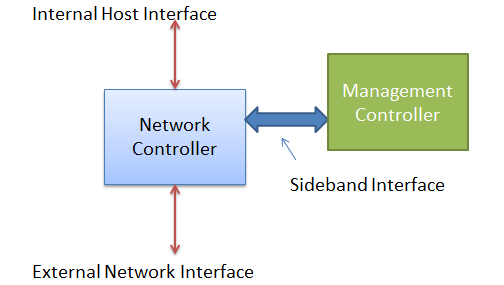
The Network Controller (NC) is divided into the following interfaces for communication:
· Internal host interface—Provides connectivity to the server operating system.
· External network interface—Provides connectivity to the external network, known as a port.
· Sideband interface—Provides connectivity to HDM using NCSI.
After network port configuration, HDM can send packets to the NC.
· In terms of the link layer, the NCSI packets and the network communication packets share the same physical bus, RMII. The RMII bus connects to HDM and acts as an out-of-band management network port (also sideband interface) for the NC.
Figure 53 Sideband management framework
· In terms of data flow, HDM sends a network packet to the physical bus RMII through MAC, and the NC receives the packet through RMII for packet parsing. After parsing, the NC handles the packet depends on the packet type:
¡ If it is an NCSI packet (with ether type coded 0x88F8), the NC sends an NCSI response.
¡ If it is a network packet (with ether type not coded 0x88F8) sent to the external network, the NC forwards the packet to the external network interface.
Figure 54 Sideband management data flow diagram
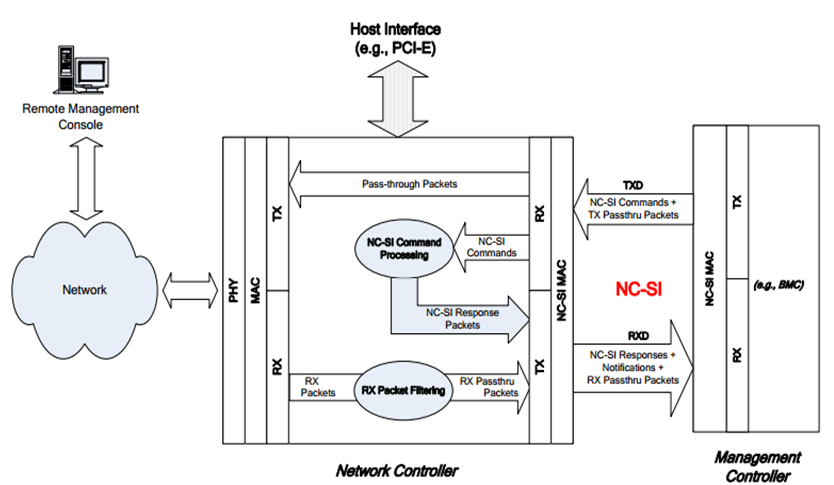
· In terms of protocols, NCSI is a network layer protocol whose network type code is 0x88F8.
Figure 55 NCSI protocol
Network port modes
Normal mode
In normal mode, the HDM dedicated and shared network ports have separate IP addresses and operate in active/active mode. HDM is accessible at both ports.
Figure 56 Enabling the normal mode
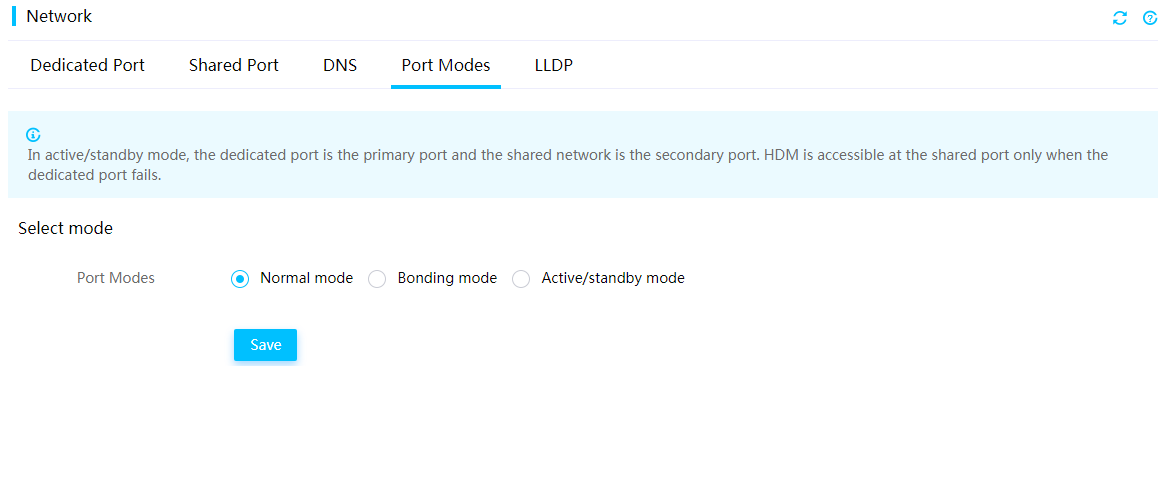
Bonding mode
In bonding mode, HDM binds the HDM dedicated network port and shared network port into a logical bond port that uses the IP address and MAC address of the dedicated port. Users can access HDM as long as the dedicated or shared port is up. This improves HDM access reliability.
Active/standby mode
In active/standby mode, the dedicated port is the primary port and the shared network is the secondary port. HDM is accessible at the dedicated port as long as the dedicated port is up and has network connectivity. After the dedicated port fails, HDM is accessible at the shared port.
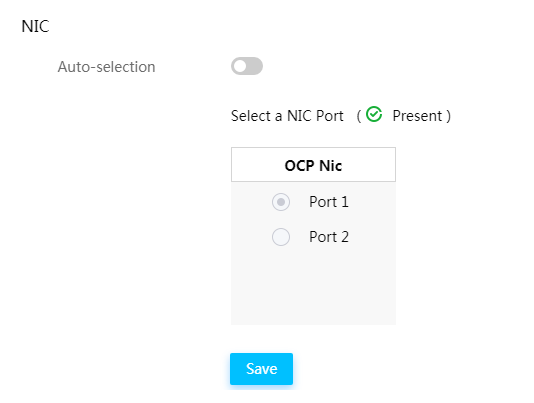
Automatic shared port selection
This feature enables automatic shared port selection for the system to select a port automatically. You can access HDM as long as a shared network port is in up state.
All sLOM, mLOM, FLOM, and OCP network adapters, and NCSI-capable PCIe network adapters support automatic shared port selection.
The automatic shared port selection provides the following advantages:
· Achieves smooth port change without reconfiguring the network settings of the server.
· Retains shared port network settings (IP and VLAN settings) after a port change, improving maintenance efficiency.
To avoid network errors, do not enable both automatic shared port selection and the active/standby mode.
Figure 57 Enabling automatic shared port selection
IPv6
HDM supports IPv6, and both the dedicated network port and the shared network port support IPv6.
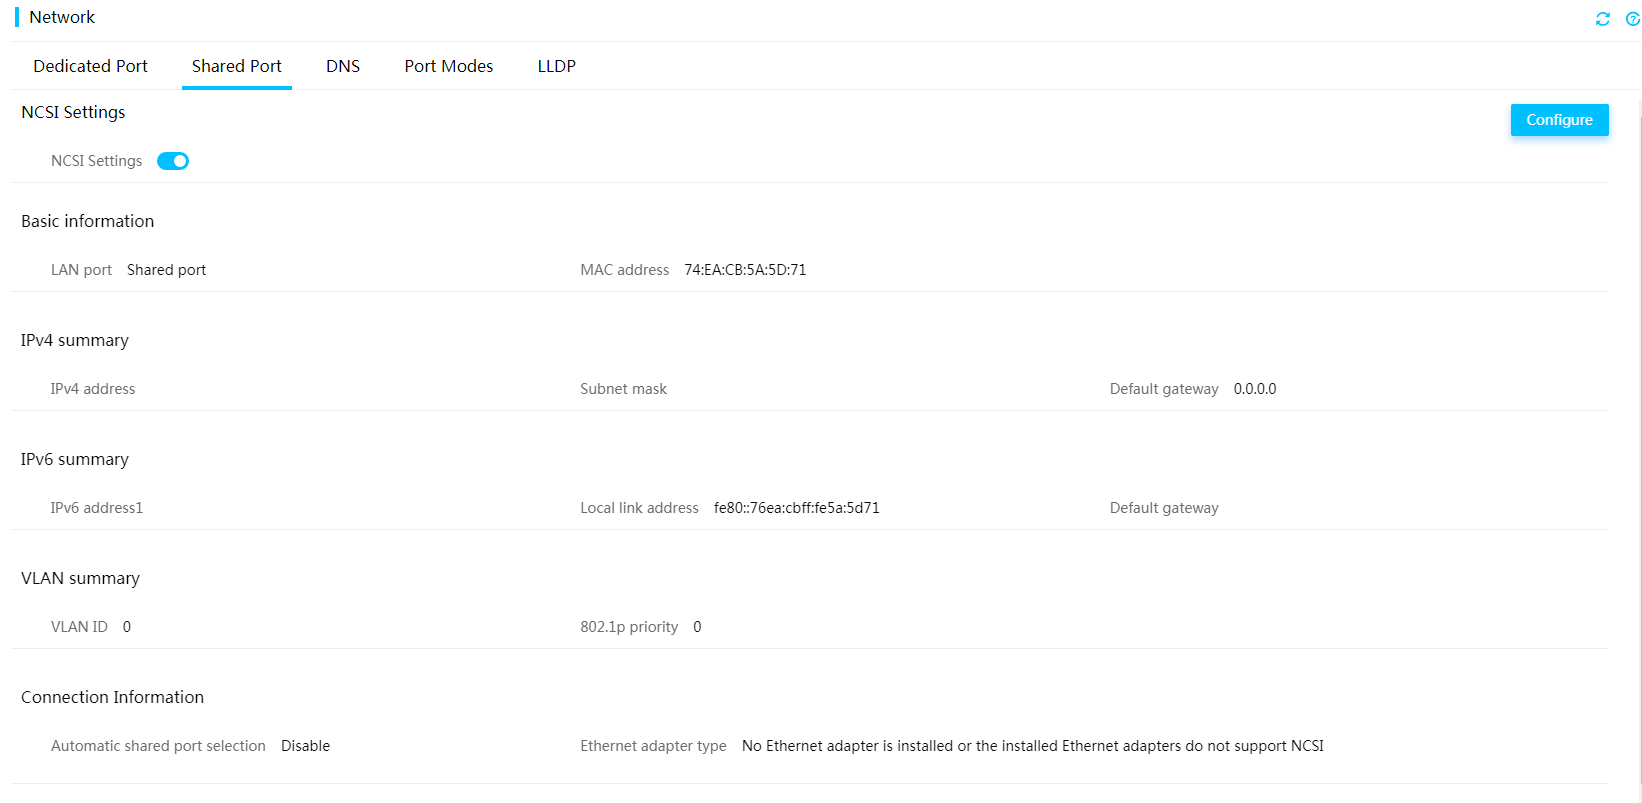
Figure 58 Viewing IPv4 and IPv6 settings of the shared network port.
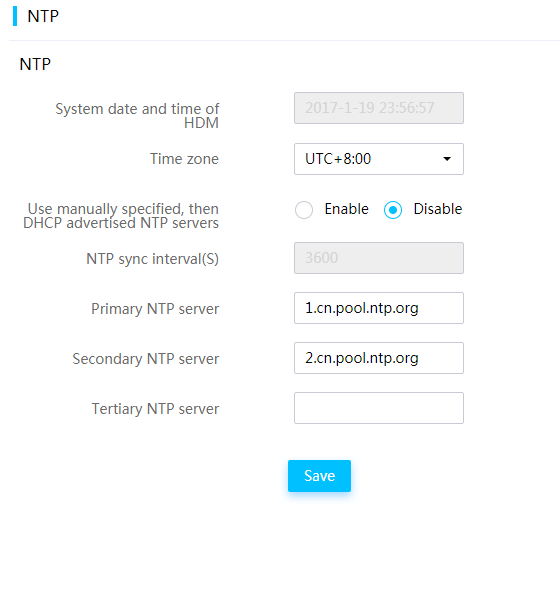
NTP time management
Network Time Protocol (NTP) is an application layer protocol in the TCP/IP protocol family used to synchronize clock time of devices in a network. You can specify the time zone where the server is located from HDM and manually specify one primary NTP server and one secondary NTP server.
With HDM, you can also choose to obtain NTP server settings from the DHCP server. Both IPv4 and IPv6 addresses are supported, and FQDN is also supported when you manually specify an NTP server.
When synchronizing time, HDM uses the time sources in the following order:
· Primary NTP server.
· Secondary NTP server.
· DHCP server as the NTP server.
· ME (only available for Intel products).
· RTC on the BMC.
Figure 59 Configuring NTP settings
DNS
Domain Name System (DNS) is a distributed database used by TCP/IP applications to translate domain names into IP addresses. A complete domain name consists of a host name and top-level and second-level domains. For HDM, the host name can be manually configured or automatically populated based on the serial number of the server. The top-level and second-level domains can also be manually configured or automatically assigned through the DHCP server.
HDM supports mapping the IP addresses of the shared network port and dedicated network to domain names, and registering this mapping relationship with DNS server.
The following registration methods are available:
· nsupdate—The HDM client updates the zone file of the DNS server by executing the nsupdate command.
· FQDN\hostname—The DHCP server dynamically registers the HDM client information to the DNS server after confirming the IP address allocation on the HDM client.
You can add all managed servers to a management domain and access HDM of a server by using the easy-to-remember domain name.
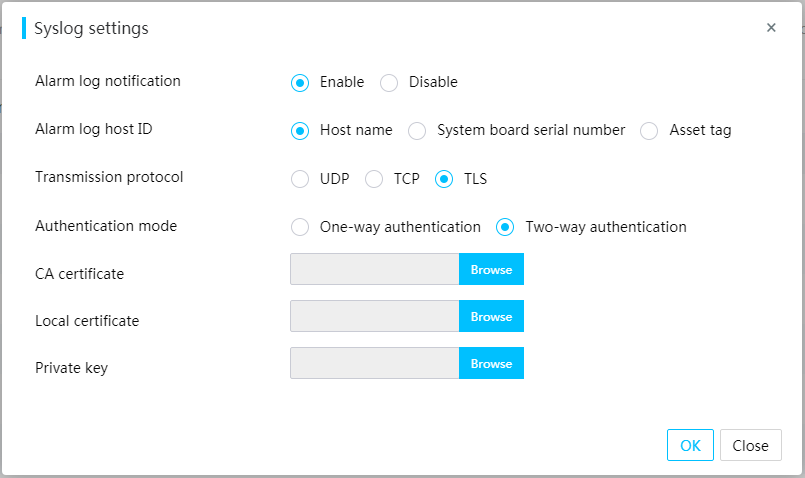
Remote syslog servers
HDM supports using syslog messages to report operation and event logs to destination hosts. You can configure server ports, transmission protocols, log types, and asset tags.
The transmission protocols include UDP, TCP, and TLS. TLS supports one-way authentication and two-way authentication.
Figure 60 Syslog configuration page
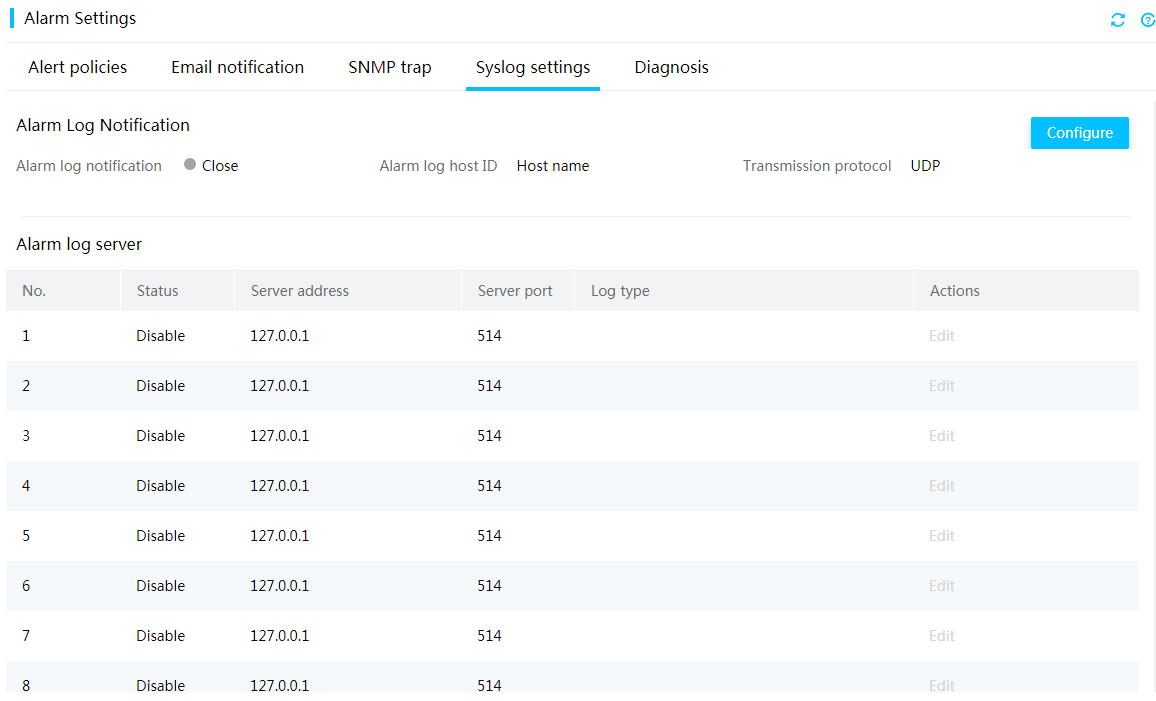
Figure 61 Configuring syslog notification settings
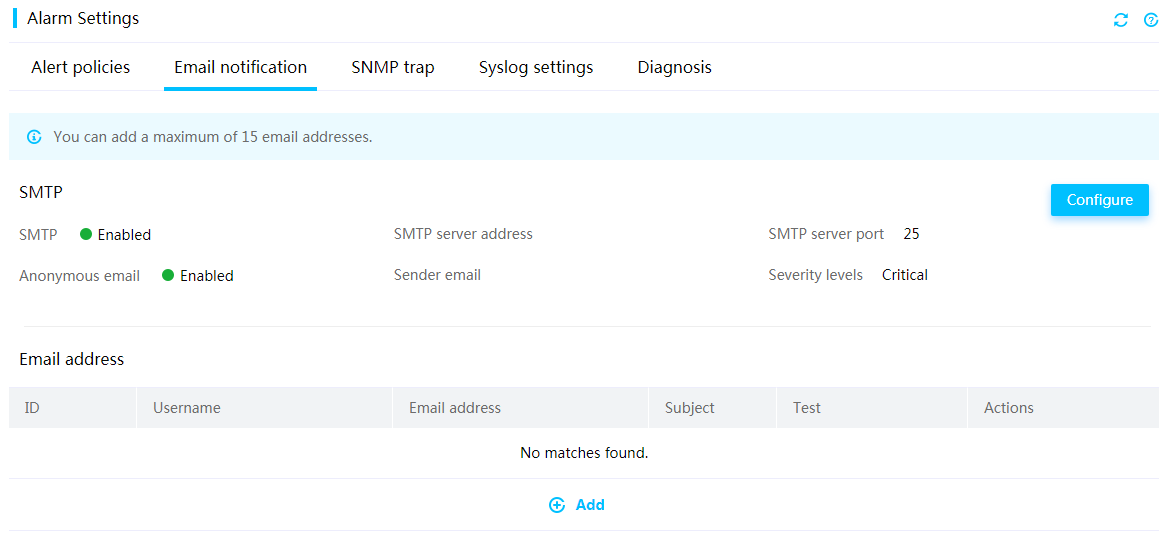
Alert emails
HDM monitors the server status and reports the event log generated by the server to the specified users over emails. Both IPv4 and IPv6 addresses are available for the SMTP server. You can send alert emails as anonymous emails, or send alert emails with sender identity information. A maximum of 16 email recipients are supported for server monitoring.
The server events are reported on a severity level basis and you can select the severity levels from All, Critical, and Minor + Major + Critical.
Figure 62 Configuring SMTP
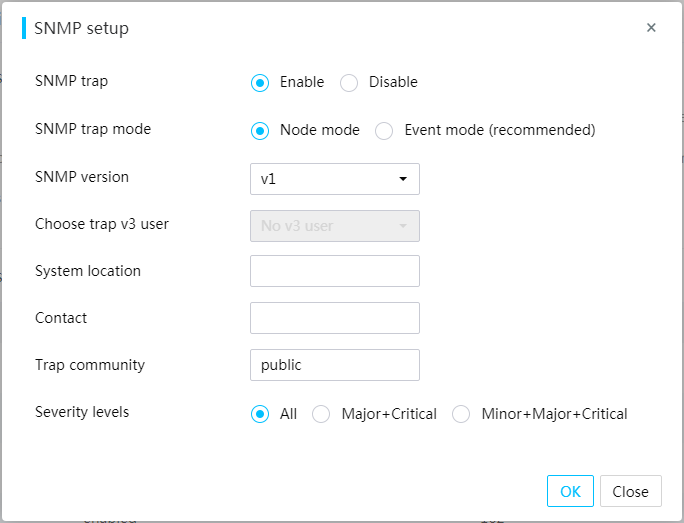
SNMP traps
You can configure SNMP trap settings from HDM and send server events in SNMP traps to users for server monitoring.
HDM support configuring SNMP servers. The server events are reported on a severity level basis and you can select the severity levels from All, Critical, and Minor + Major + Critical.
The server events are reported in the following modes:
· Node mode: Specifies the OID of an SNMP node as the ID of a trap event. The users can identify the faulty module through the OID.
· Event mode: Specifies the OID of the SNMP node that is in a mapping relationship with a trap event as the ID of the event. Information provided by this mode is more accurate. You can identify the fault type through the OID of an event.
Figure 63 SNMP trap configuration page
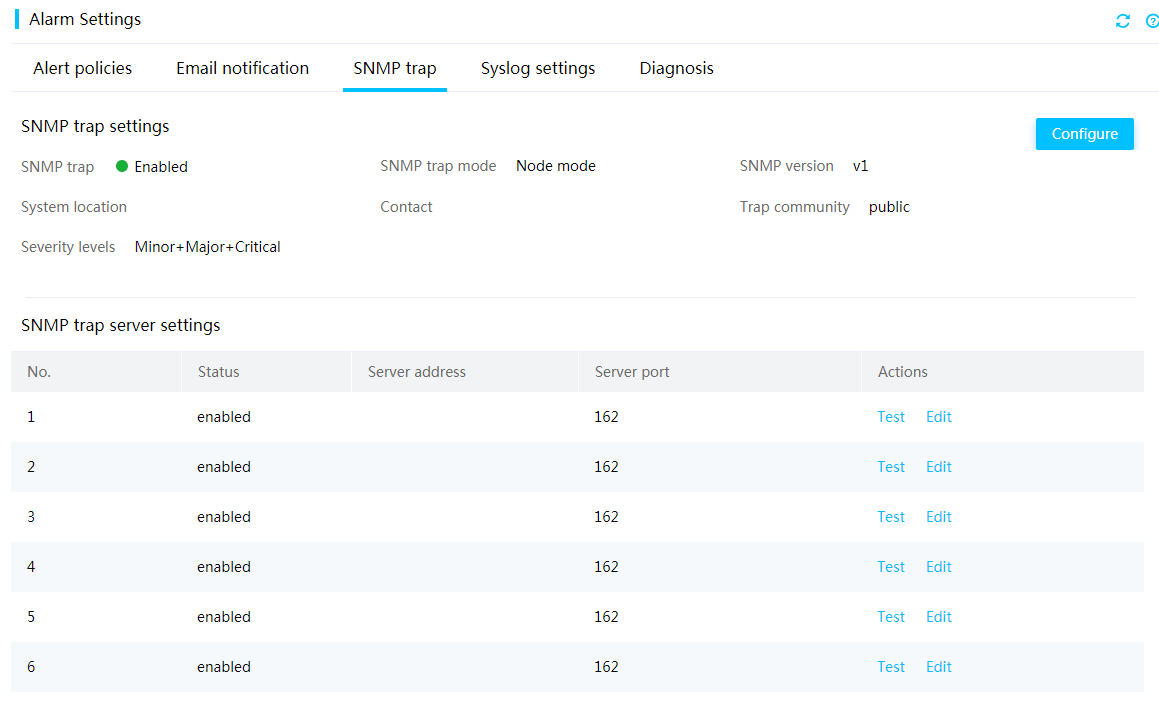
Figure 64 Configuring SNMP trap settings
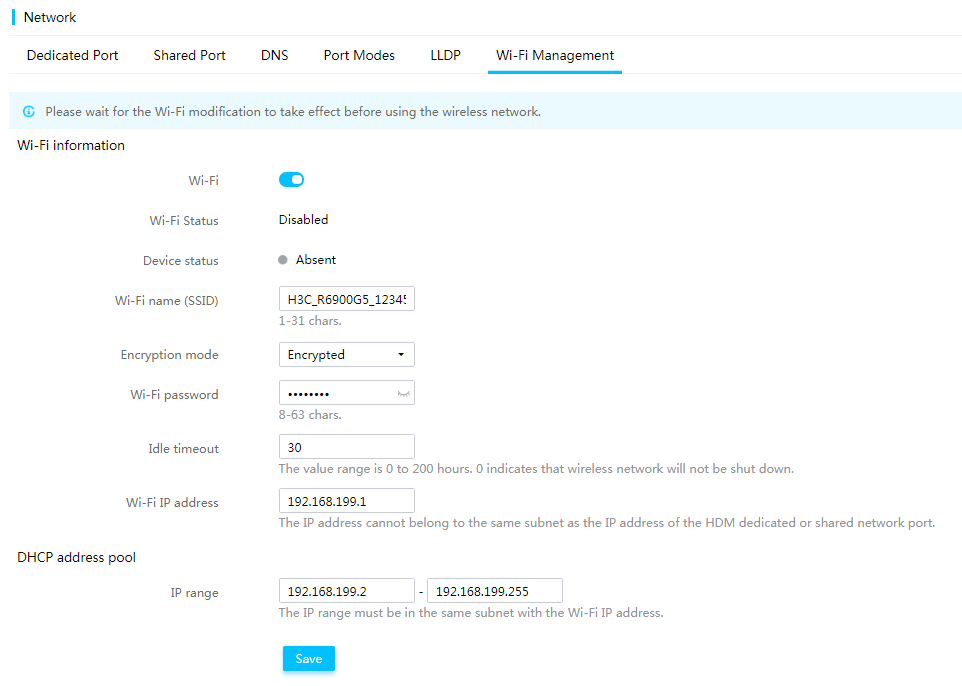
USB Wi-Fi
HDM supports a third-party USB Wi-Fi adapter that connects to the USB Type-C connector on a chassis ear of a G5 server. The USB Wi-Fi adapter provides the wireless hotspot function for HDM. You can use a mobile phone or laptop to access HDM through the wireless network, and perform maintenance and inspection with HDM Mobile or other tools.
Only a Xiaomi portable Wi-Fi adapter is supported, and the adapter must be connected to the Type-C connector on the server through a USB cable.
To improve security, the system allows a maximum of two clients to come online at the same time.
You can configure Wi-Fi settings from HDM, including enablement status of Wi-Fi, Wi-Fi name, encryption mode and Wi-Fi password, idle timeout, Wi-Fi IP address, and DHCP address pool. By default, the following settings apply:
· The Wi-Fi name is the product name_last 10 characters of the device SN format.
· The wireless network is not encrypted to achieve the plug-and-play operation.
HDM supports the following network protocols through the wireless network: Web, Redfish, IPMI, SSH, and Telnet.
Figure 65 Configuring Wi-Fi settings
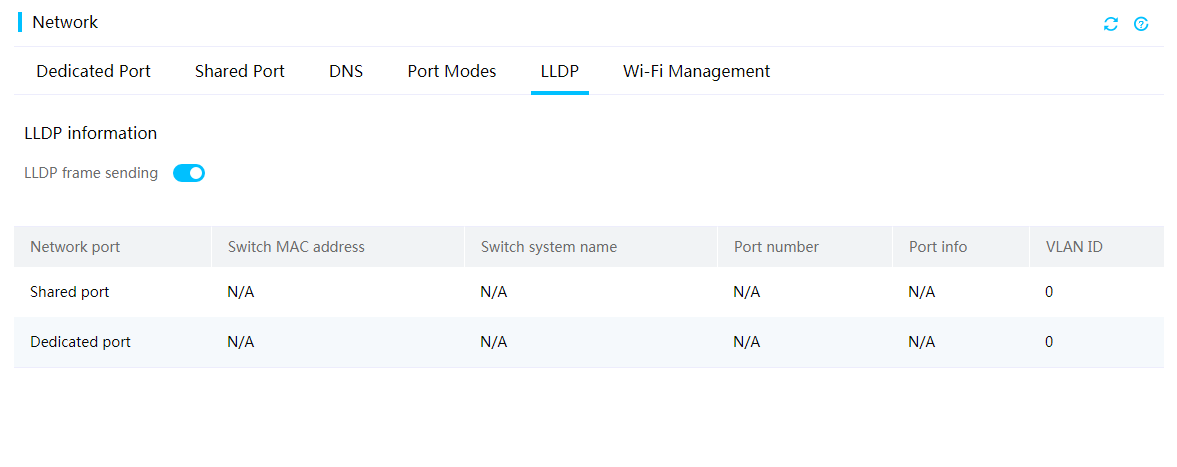
LLDP
The Link Layer Discovery Protocol (LLDP) is a standard link layer protocol that allows network devices from different vendors to discover neighbors and exchange system and configuration information. If the network changes, the network management system can quickly detect the topology changes and update topology information at Layer 2.
You can enable the server to send LLDP frames from HDM for the connected devices to identify the server.
HDM supports LLDP for obtaining the following switch information in the local network:
· Network port—Network port of the server that receives LLDP frames.
· Switch MAC address—MAC address of the connected switch.
· Switch system name—System name of the connected switch.
· Port number—Number of the connected switch port.
· Port info—Information about the connected switch port, port name for example.
· Port rate—Rate of the server port.
· VLAN ID—ID of the VLAN to which the server port belongs.
Figure 66 Configuring LLDP
Security
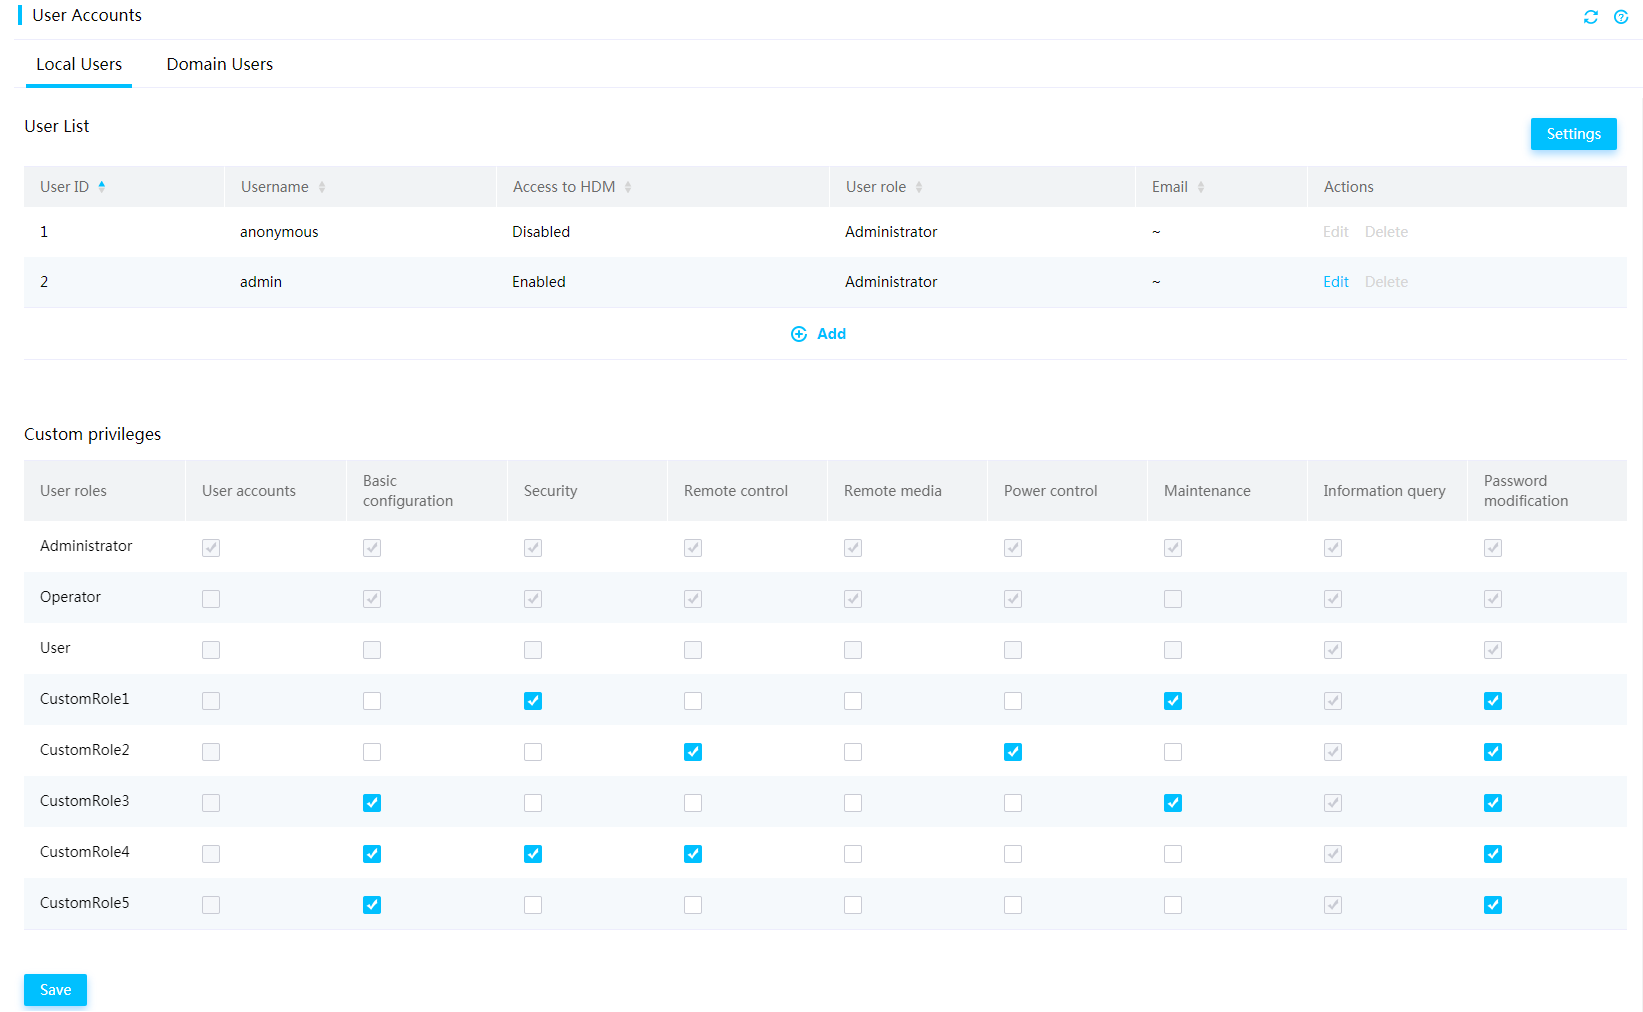
User privileges
You can configure user accounts, including local users and domain users (LDAP users and AD users) to control access to HDM on the User Accounts page.
The network and service access privileges of a user is determined by a user role. Available user roles include:
· Administrator—The user has read and write permissions to all features.
· Operator—The user has read permission to all features and has write permission to some features.
· User—The user has read-only permission.
· CustomRoleN—The user has the privileges specified for the custom role by an administrator user. The system supports a maximum of five custom user roles.
Figure 67 Configuring custom privileges for a user account
Management interfaces and HDM modules
HDM improves security by dividing features and interfaces, such as Redfish and IPMI interfaces, into different modules for network access privileges. Available modules include user accounts, basic configuration, remote console, remote media, security, power control, maintenance, password modification, and information query.
Table 2 shows the typical features of each HDM module.
Table 2 Features of HDM modules
|
Module |
Description |
|
User accounts |
Includes user management, password policy configuration, directory management, configuration import and export, and unified control. |
|
Basic configuration |
Includes network confirmation (such as network port, NTP, SNMP, LLDP, and syslog) and asset tag configuration. |
|
Remote control |
Includes storage management, hard partitioning, resource monitoring, KVM (except for power control and image mounting), VNC configuration, system boot options, UID LED management, SOL connection, MCA policy, and security bezel configuration. |
|
Remote media |
Includes remote media and KVM image mounting. |
|
Security |
Includes access service configuration, firewall, SSL, PFR, and security tip for login. |
|
Power control |
Includes power supply management, fan management, NMI control, and physical power button control. |
|
Maintenance |
Includes drive UID LED management, CUPS, video recording and screenshots, firmware management (firmware update, restart, and primary/backup switchover), factory default restoration, and real-time monitoring. |
|
Password modification |
Includes modification of the current user's password. |
|
Information query |
Supported typically on the GET interface. |
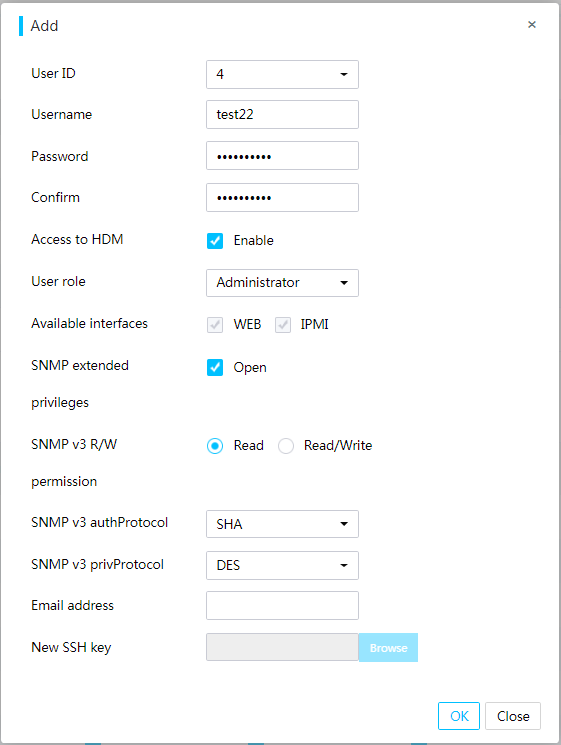
Local users
HDM supports a maximum of 16 local users, and you can select available access privileges (IPMI and Web) and SNMP extended privileges for local users.
Figure 68 Editing a user account
LDAP users
Lightweight Directory Access Protocol (LDAP) enables you to efficiently access online directory services over an IP network. You can save multiple types of data, such as email addresses and email routing information in LDAP directories, and filter them in a convenient and centralized way.
As shown in Figure 69, enabling LDAP directory service centralizes user, permission, and validity period management to the LDAP server, which reduces duplicate configuration, improves management efficiency, and improves system security.
Figure 69 LDAP directory service diagram
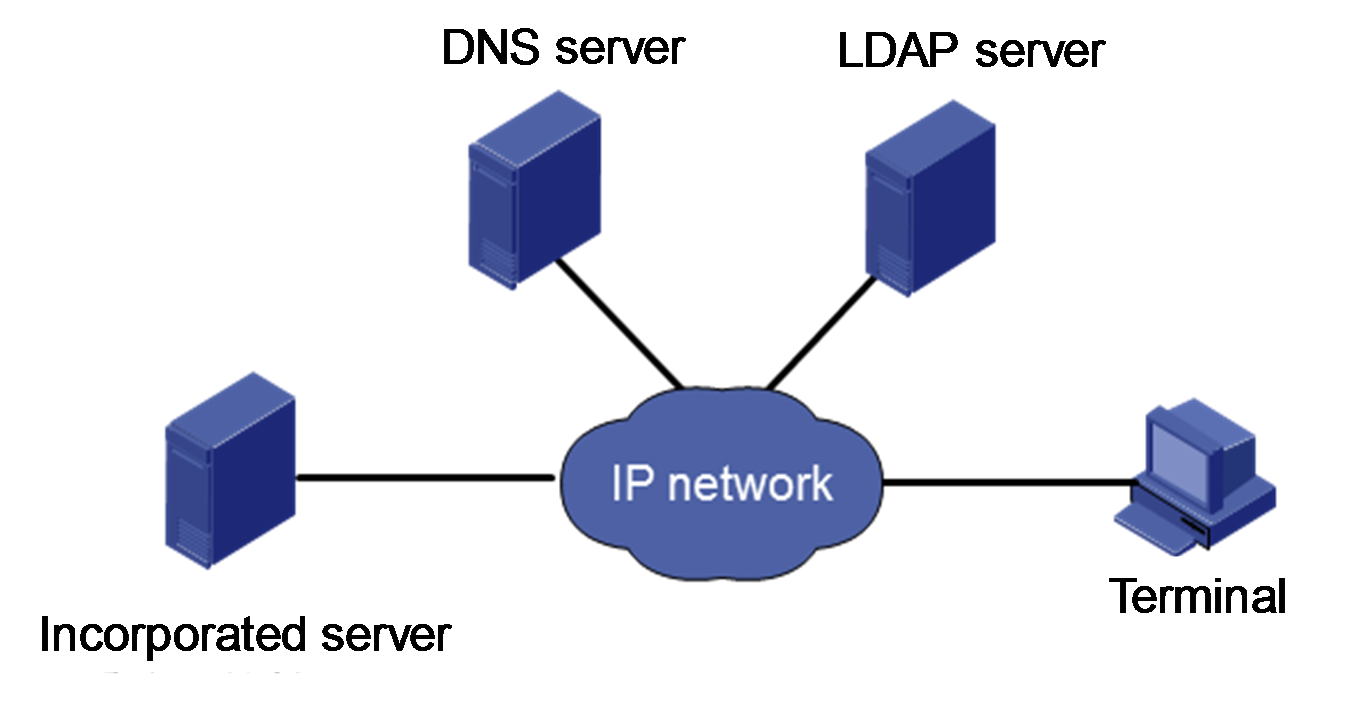
LDAP provides the following advantages:
· High scalability—Dynamically adds users on the LDAP server for all HDMs at the same time.
· Enhanced security—Implements the user password policies on the LDAP server. SSL encryption is supported.
· Real-time performance—Applies user account update on the LDAP server to all HDMs immediately.
· Improved efficiency—Integrates user management for HDM, which minimizes repeated user configuration tasks and improves management efficiency.
AD users
Active Directory (AD) is a directory service developed for Windows OSs. It provides a directory service that centrally manages groups and accesses network resources, making network topology and protocols transparent to users.
Active Directory is managed based on the logical structure of domains, which allows expandability.
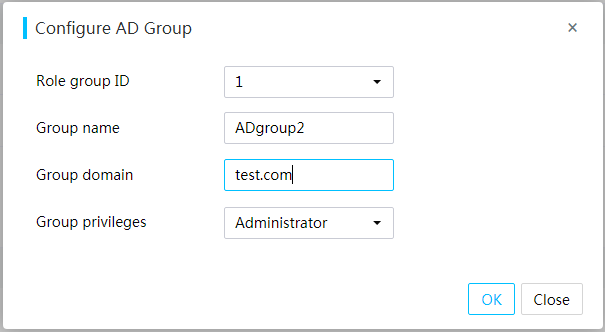
HDM supports AD authentication. This feature enables users to access HDM by using the username and password of a valid Active Directory (AD) group configured on the AD server. The privileges of a user are determined by the AD group to which the user belongs.
Figure 70 Configuring AD authentication
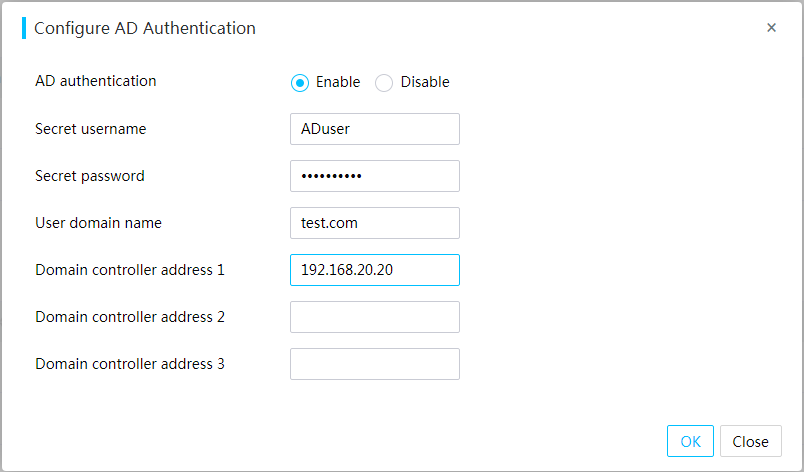
Figure 71 Adding an AD group
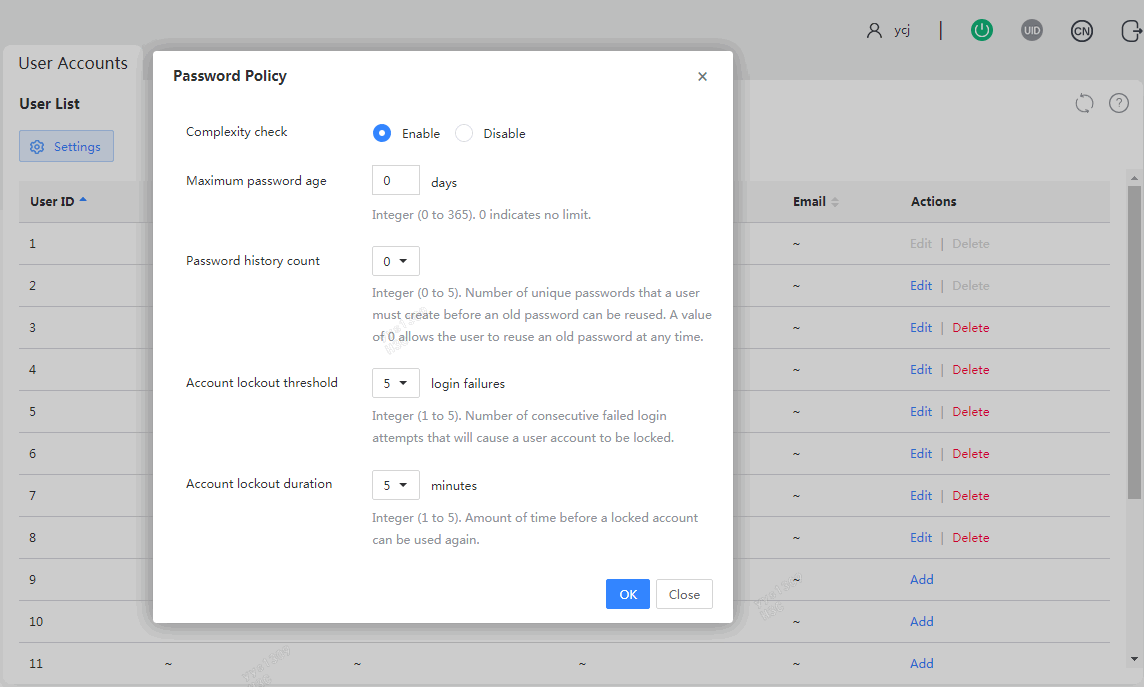
Password policy
You can enhance HDM access security by setting rules that the passwords of user accounts must follow in the password policy.
Procedure
1. In the navigation pane, select Configuration > User Accounts.
2. In the work pane, click Settings.
3. In the dialog box that opens, configure the password policy, and then click OK, as shown in Figure 72.
Figure 72 Configuring the password policy
Parameters
· Complexity check: Disable or enable password complexity check.
¡ If this feature is enabled, passwords must meet the following enhanced complexity requirements:
- 8 to 20 characters in length.
- Case sensitive. Valid characters are letters, digits, spaces, and the following special characters: ` ~ ! @ # $ % ^ & * ( ) _ + - = [ ] \ { } | ; ' : " , . / < > ?
- Must contain characters from at least two of the following categories: uppercase letters, lowercase letters, and digits.
- Must contain at least one space or special character.
- Cannot be identical to the username or the reverse of the username.
- Must meet the old password reuse requirement.
· Maximum password age: Maximum number of days that a password can be used. When a password is about to expire, HDM prompts the user to change the password.
· Password history count: Number of unique passwords that a user must create before an old password can be reused.
· Account lockout threshold: Number of consecutive login failures that will cause a user account to be locked.
· Account lockout duration: Amount of time before a locked account can be used again.
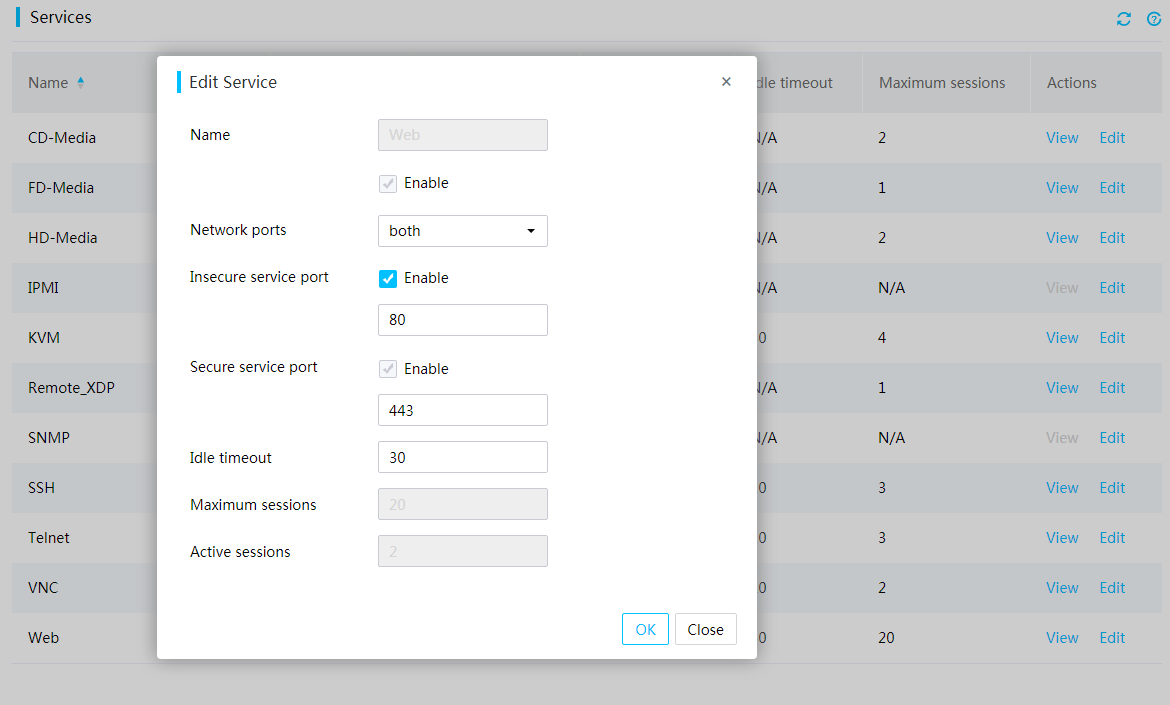
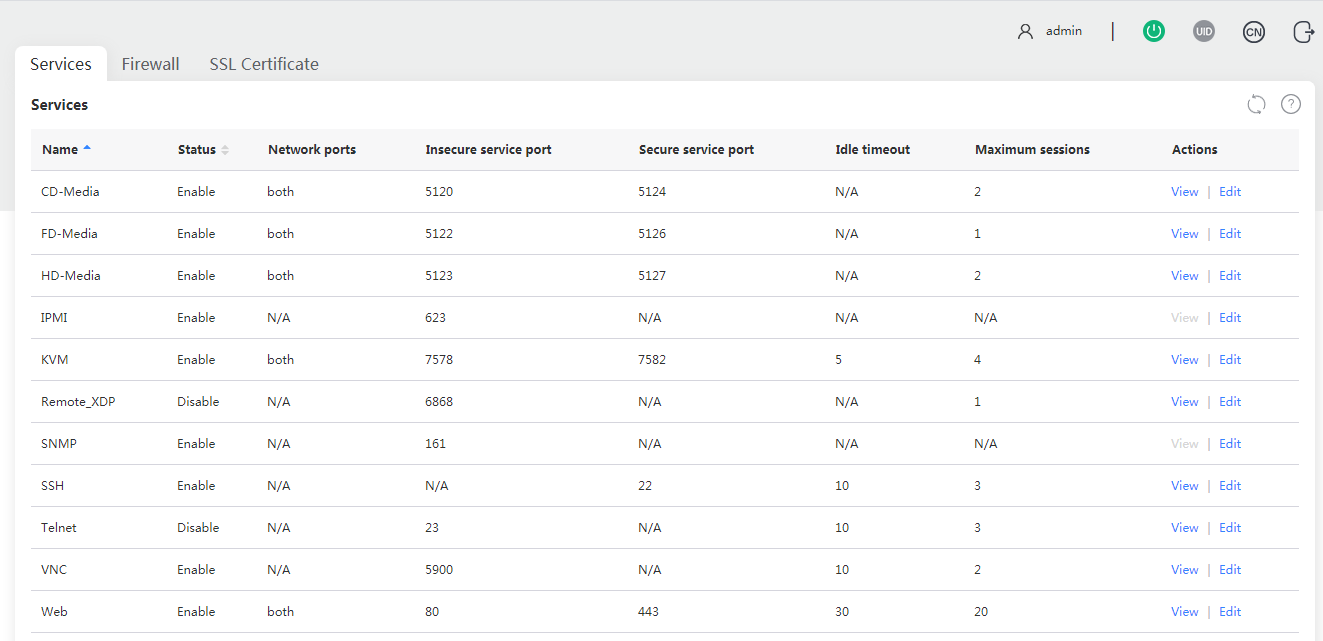
Access services
To meet service and security requirements, HDM allows users to view and control the enablement status of the following services: CD-Media, FD-Media, HD-Media, IPMI, KVM, Remote_XDP, iHDT, SNMP, SSH, Telnet, Web, and VNC.
Figure 73 Configuring access services
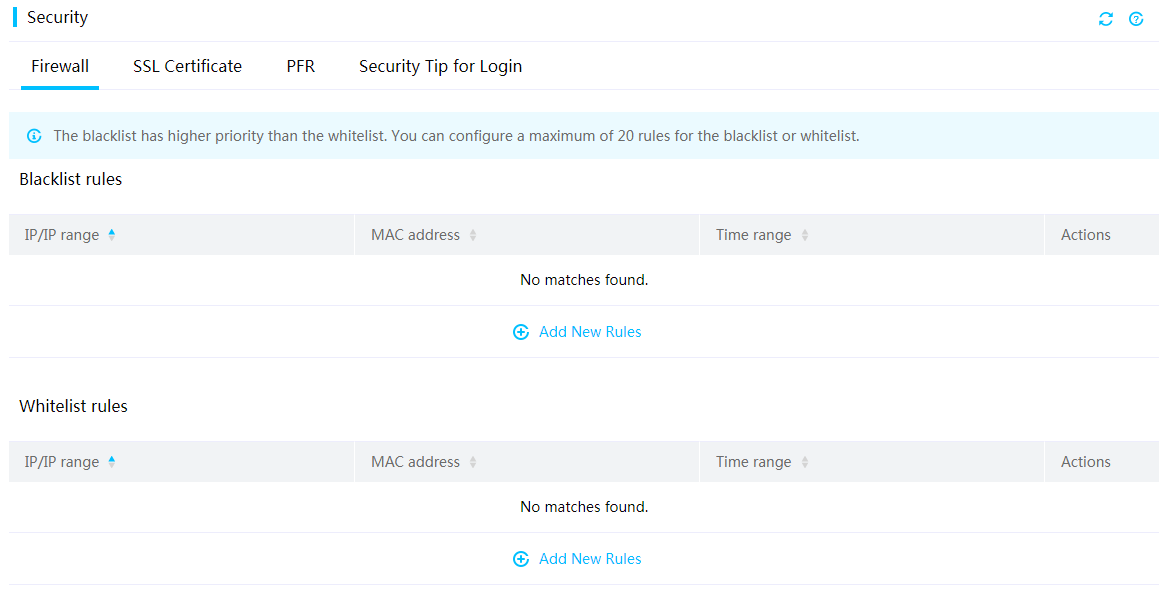
Firewall
The firewall protects HDM from attacks based on firewall rules that identify accesses to be permitted or blocked.
You can create the following firewall rules:
· Blacklist rules—Block accesses to the HDM server from specific IP addresses or MAC addresses. You can configure a blacklist rule to take effect in the specified time range.
A maximum of 20 blacklist rules are supported.
· Whitelist rules—Permit accesses to the HDM server from specific IP addresses of MAC addresses. You can configure a whitelist rule to take effect in the specified time range.
A maximum of 20 blacklist rules are supported.
The blacklist rules take precedence over the whitelist rules.
Figure 74 Configuring firewall settings
SSL certificate
You can manage SSL certificates by uploading, generating, or viewing an SSL certificate.
SSL certificate information includes the certificate user, certification authority, validity period, and serial number.
HDM comes with its own default SSL certificate. As a best practice for security enhancement, replace the default SSL certificate with your own certificate and public key pair.
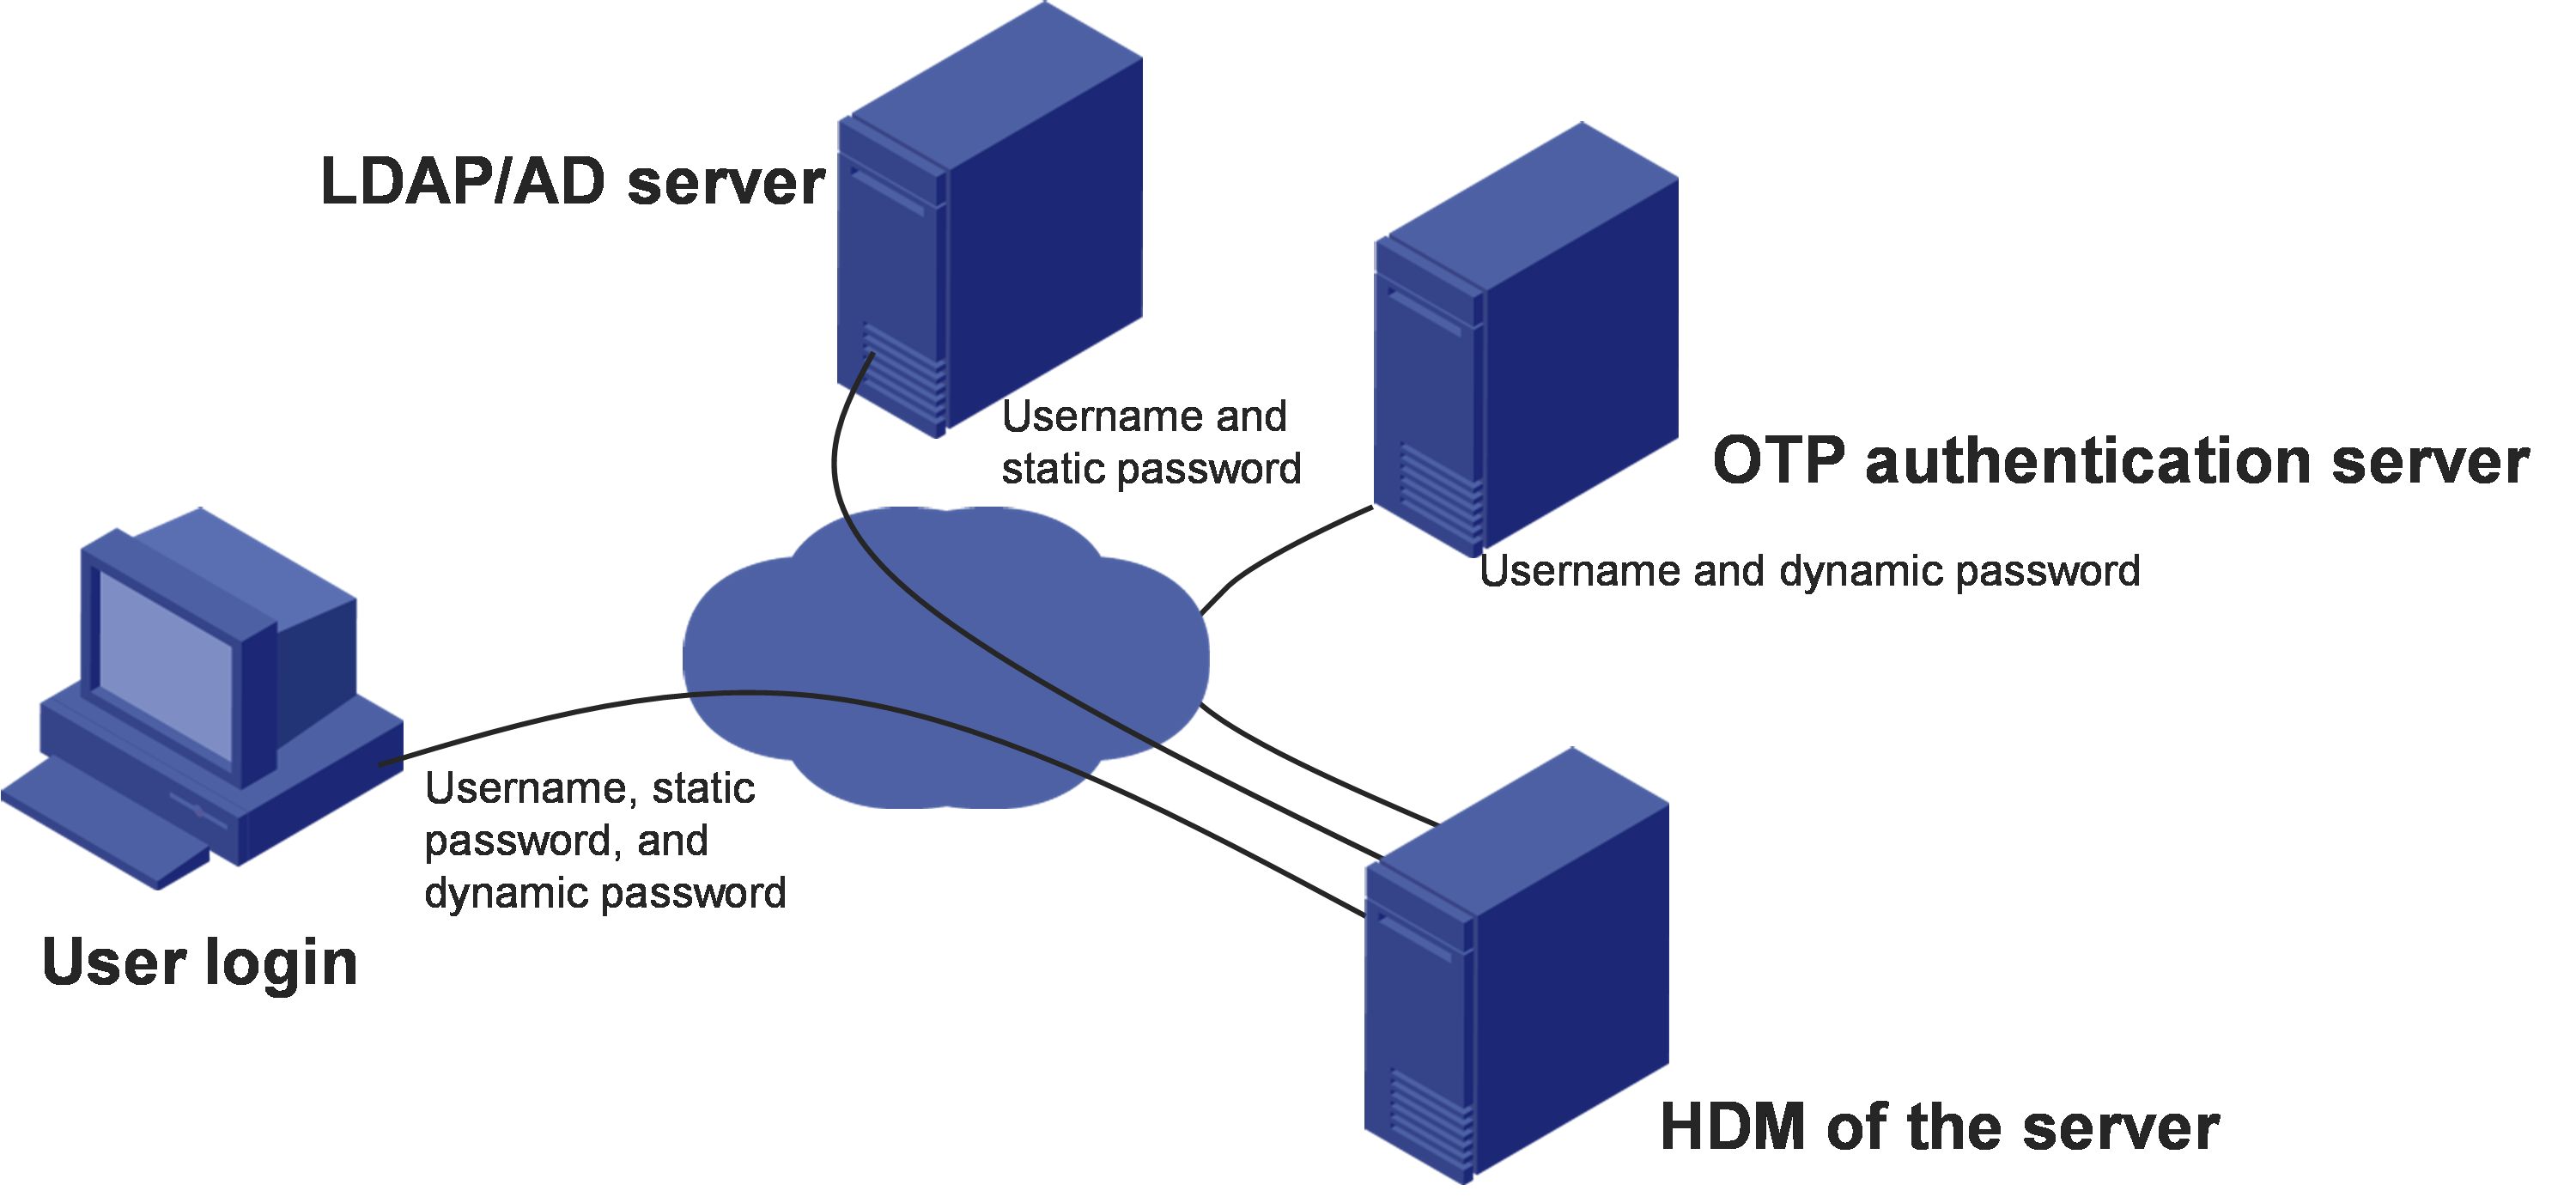
Two-factor authentication
Two-factor authentication requires a static password and a dynamic password for each login attempt to provide enhanced network security.
HDM supports DKEY token and can collaborate with a one-time password (OTP) server to provide two-factor authentication for user login. The DKEY token also supports the GM algorithm and has obtained the certification for the GM algorithm. With this feature configured, a user must enter the correct username, static password, and dynamic password obtained from a mobile phone or hardware token to log in to HDM. The static password must pass authentication on the OTP server.
Figure 75 Network diagram for two-factor authentication
After two-factor authentication is enabled, the HDM login page will add an input box for dynamic passwords, as shown in Figure 76.
Figure 76 HDM login page for two-factor authentication

The Web and Telnet services support two-factor authentication.
Use two-factor authentication with caution. Enabling two-factor authentication will disable some interfaces and services, such as SSH, VNC, IPMI, SNMPv3, and Redfish.
Silicon root of trust
Intel Platform Firmware Resiliency (PFR) improves the reliability of system security by providing firmware protection and inspection.
Intel PFR places the root of trust (RoT) on PFR CPLD for the Intel Xeon processors and the system, and uses the silicon RoT for HDM uboot verification. HDM uboot further performs verification on HDM firmware for trusted system security.
Hardware encryption
HDM's SoC supports hardware security acceleration, which enhances the performance of security related functions. The acceleration module primarily applies to authentication and data encryption and decryption. It supports the following algorithms: AES, DES, 3DES, RC4, MD5, SHA1, SHA224, SHA256, HMAC-MD5, HMAC-SHA1, HMAC-SHA224, and HMAC-SHA256.
Firmware
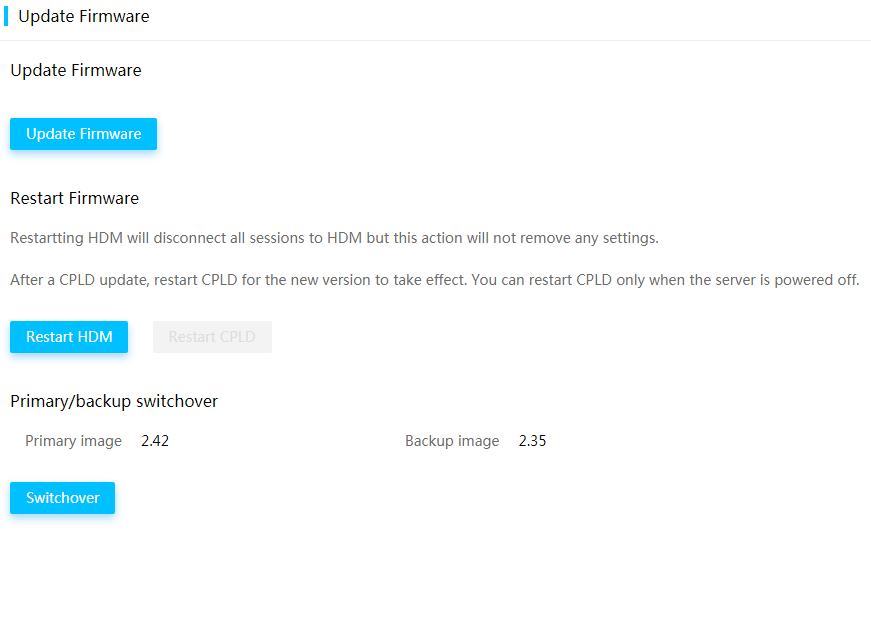
You can perform the following tasks from HDM:
· View the firmware version of HDM, BIOS, CPLD, LCD, and power supplies.
· Update HDM firmware without server power-off or service interruption.
· Update the BIOS, CPLD, LCD, and power supply firmware.
· Perform a primary/backup switchover.
To update firmware, make sure the new image contains a vendor signature and is intact.
Primary and backup images
HDM supports one primary firmware image and one backup firmware image. When a flash misoperation or storage block damage occurs, you can perform an image switchover to run HDM with the backup image.
Figure 77 Viewing primary and backup images
Firmware update
You can update the firmware of HDM, BIOS, CPLD, LCD, or power supplies. As a best practice for compatibility, update the primary and backup firmware images of HDM to the same version.
Figure 78 Update Firmware page
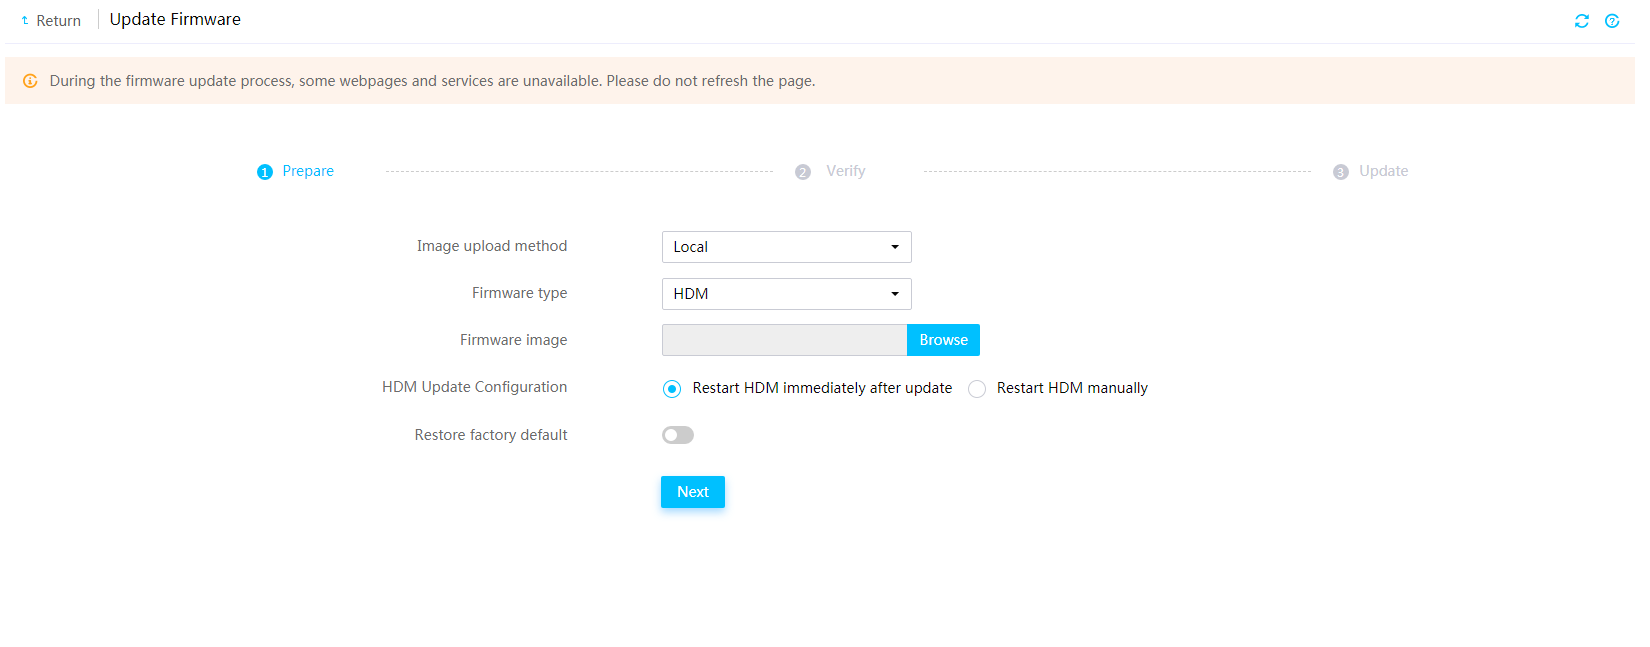
For the new HDM firmware to take effect, you can have HDM automatically restart when the update is complete or manually restart HDM later.
For the new BIOS firmware to take effect, you can have the server automatically reboot immediately or at a scheduled time. Alternatively, you can choose to manually reboot the server.
For both HDM and the BIOS, you can select whether to remove all user-configured settings after you update the firmware.
Power supply firmware update is available only for the DPS-2000 AB-2G power supplies.
Figure 79 Verifying firmware update settings
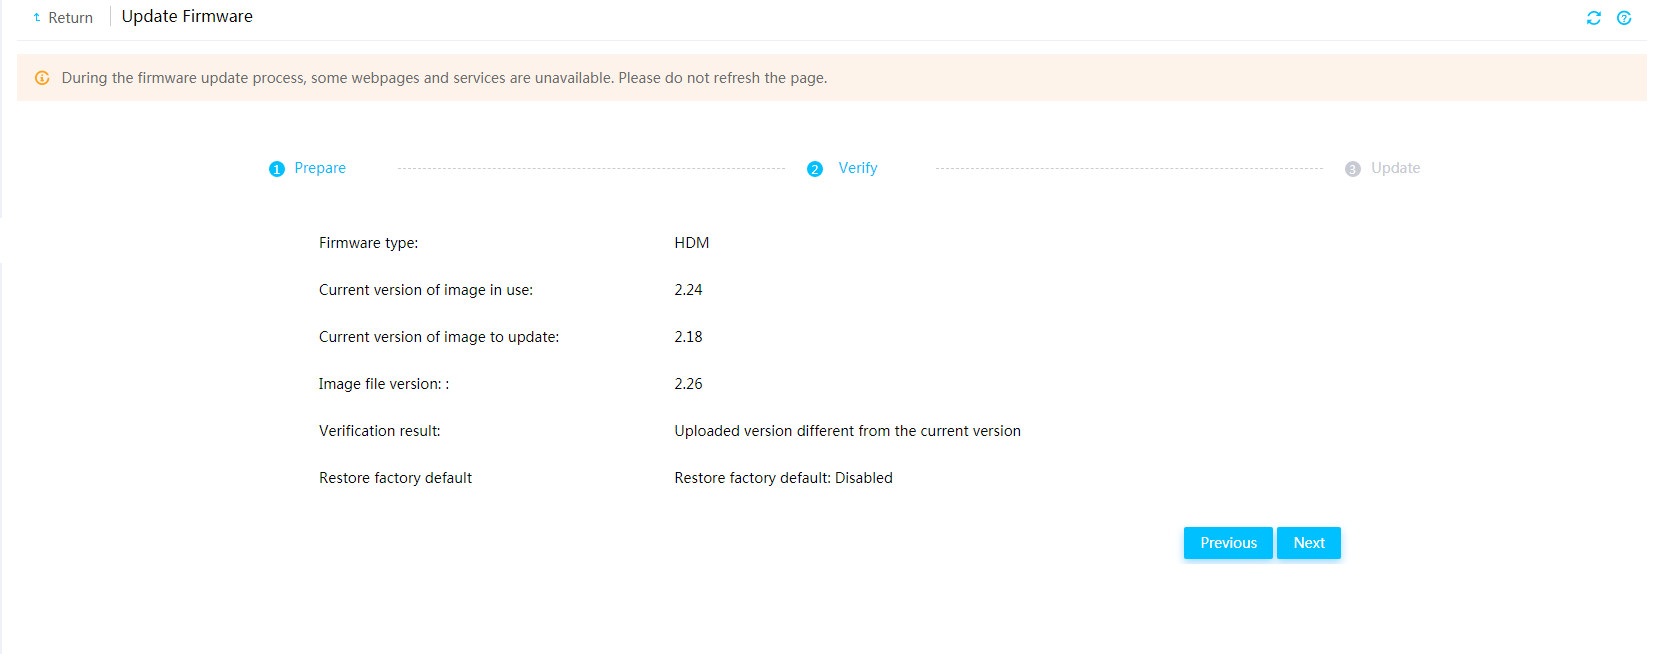
Automatic BIOS update
If you select Retain or Restore for the Restore factory default field on the Update Firmware page, the BIOS firmware image file is only uploaded to the eMMC drive. Then, after you restart the server, the system will perform the BIOS update automatically by obtaining the image file from the eMMC drive.
Configuration management
Importing and exporting configuration
Perform this task to import and export HDM, BIOS, or RAID configuration by using the configuration file, and restore factory default HDM settings.
This feature provides the following advantages:
· Out-of-band management—You can configure the settings of HDM, BIOS, and RAID in an out-of-band manner. A configuration file provides a full set of configuration items.
· Readable and writable configuration file—You can view, edit, and save configuration items in a configuration file for multiple servers.
· Ease of use—A configuration file is easy to manage, which can improve management efficiency.
· Fast import—It takes only two minutes to import a configuration file, and only six minutes to import all the HDM, BIOS, and RAID configuration.
· Powerful configuration customization—HDM supports over 100 configurable items and the BIOS supports over 1000 configurable items. You can also configure RAID levels 0, 1, 5, 6, and 10.
Figure 80 Import/Export Config page
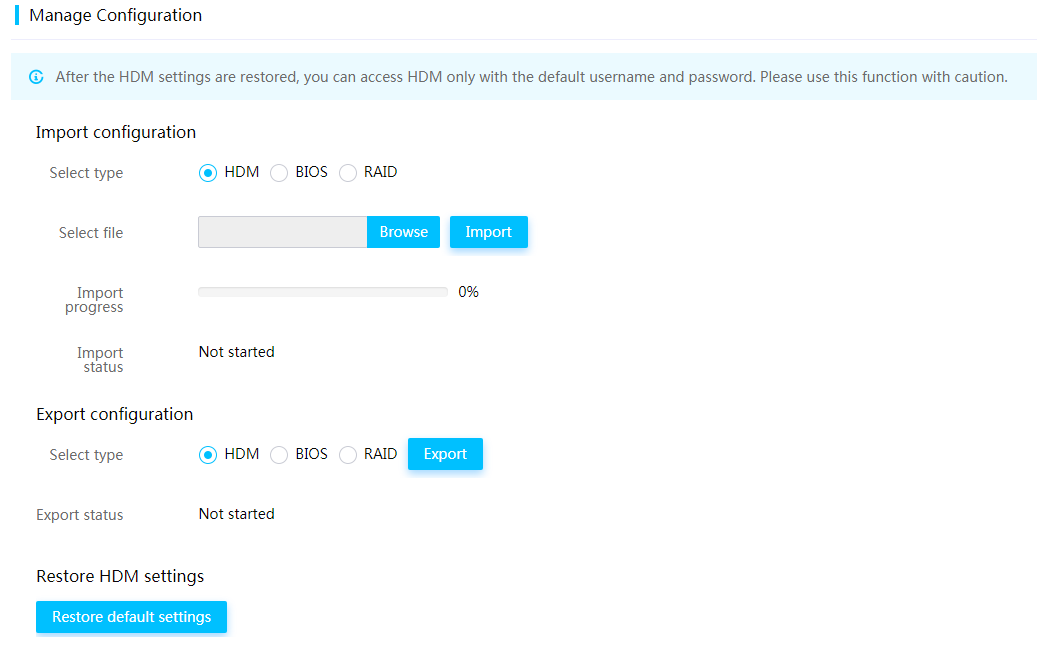
You can apply configuration files in the following scenarios:
· To edit configuration items in bulk, export a configuration file, edit the configuration items, and then import the configuration file.
· To configure and deploy multiple servers of the same model, apply the same configuration file to these servers.
· Apply user-configured settings quickly after you replace the system board or restore the factory default settings.
Restoring HDM to the default settings
HDM supports restoration to the default.
Appendix
Feature difference between G3 and G5 servers
|
Feature |
G3 servers |
G5 servers |
Remarks |
|
LCD display |
Supported |
Supported |
Supported on some rack servers |
|
Diagnostic panel |
Supported |
Not supported |
N/A |
|
Security bezel |
Not supported |
Supported |
Supported on some G5 rack servers |
|
iHDT |
Not supported |
Supported |
Supported on some G5 AMD servers |
|
USB Wi-Fi |
Not supported |
Supported |
Supported on G5 servers with a USB Type-C connector on a chassis ear |
|
Service USB device |
Not supported |
Supported |
Supported on G5 servers with a USB Type-C connector on a chassis ear |
|
Silicon root of trust |
Not supported |
Supported |
Supported on G5 Intel servers |
