- Table of Contents
- Related Documents
-
| Title | Size | Download |
|---|---|---|
| 03-Data buffer configuration | 115.42 KB |
Contents
Restrictions and guidelines: Data buffer configuration
Configuring data buffers manually
Configuring data buffer monitoring
Configuring data buffer alarms
Hardware compatibility with data buffer alarms
Configuring alarm thresholds for the ingress or egress buffer
Configuring alarm thresholds for the Headroom buffer
Configuring packet-drop alarms
Configuring Fabric Monitor and Analyzer
Display and maintenance commands for data buffers
Configuring data buffers
About data buffers
Data buffer types
Data buffers temporarily store packets to avoid packet loss.
The following data buffers are available:
· Ingress buffer—Stores incoming packets when the CPU is busy.
· Egress buffer—Stores outgoing packets when network congestion occurs.
· Headroom buffer—Stores packets when the ingress buffer or egress buffer is used up.
Figure 1 shows the structure of ingress and egress buffers.
Figure 1 Data buffer structure

Cell resources
A buffer uses cell resources to store packets based on packet sizes. A cell resource is 208 bytes. The buffer allocates one cell resource to a 128-byte packet and two cell resources to a 300-byte packet.
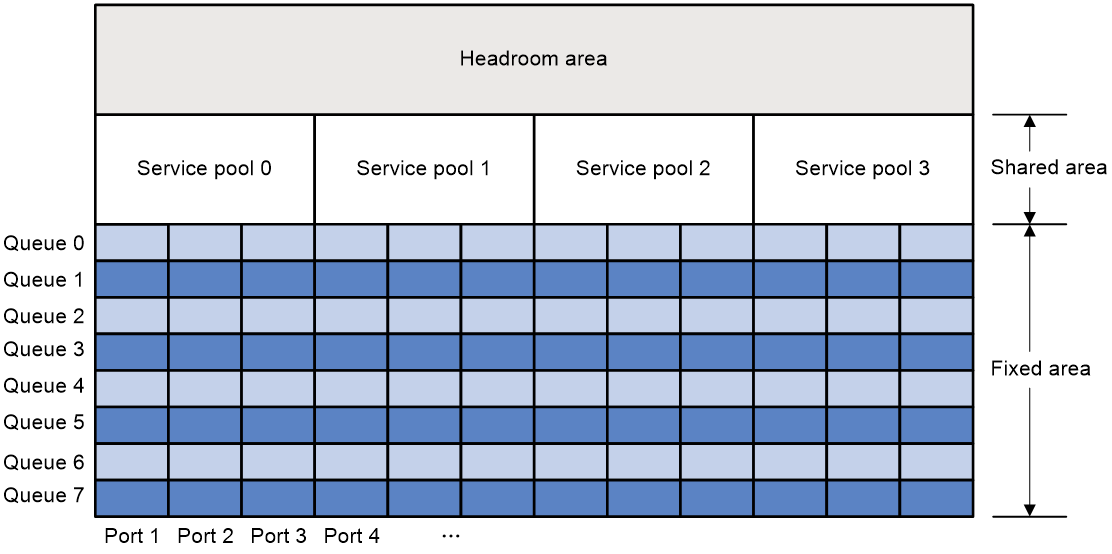
Fixed area and shared area
The cell resources have a fixed area and a shared area.
· Fixed area—Partitioned into queues, each of which is equally divided by all the interfaces on a card, as shown in Figure 2. When congestion occurs or the CPU is busy, the following rules apply:
a. An interface first uses the relevant queues of the fixed area to store packets.
b. When a queue is full, the interface uses the corresponding queue of the shared area.
c. When the queue in the shared area is also full, the interface discards subsequent packets.
The system allocates the fixed area among queues as specified by the user. Even if a queue is not full, other queues cannot preempt its space. Similarly, the share of a queue for an interface cannot be preempted by other interfaces even if it is not full.
· Shared area—Partitioned into queues, each of which is not equally divided by the interfaces, as shown in Figure 2. The system determines the actual shared-area space for each queue according to user configuration and the number of packets actually received and sent. If a queue is not full, other queues can preempt its space.
The system puts packets received or sent on all interfaces into a queue in the order they arrive. When the queue is full, subsequent packets are dropped.
Figure 2 Fixed area and shared area
Restrictions and guidelines: Data buffer configuration
You can configure data buffers either manually or automatically by enabling the Burst feature. If you have configured data buffers in one way, delete the configuration before using the other way. Otherwise, the new configuration does not take effect.
Inappropriate data buffer changes can cause system problems. Before manually changing data buffer settings, make sure you understand its impact on your device. As a best practice, use the burst-mode enable command if the system requires large buffer spaces.
Data buffer tasks at a glance
To configure the data buffer, perform the following tasks:
· Configuring data buffers manually
· (Optional.) Configuring data buffer monitoring
· (Optional.) Configuring data buffer alarms
¡ Configuring alarm thresholds for the ingress or egress buffer
¡ Configuring alarm thresholds for the Headroom buffer
¡ Configuring packet-drop alarms
· (Optional.) Configuring Fabric Monitor and Analyzer
Enabling the Burst feature
About the Burst feature
The Burst feature enables the device to automatically allocate cell and packet resources. It is well suited to the following scenarios:
· Broadcast or multicast traffic is intensive, resulting in bursts of traffic.
· Traffic comes in and goes out in one of the following ways:
¡ Enters a device from a high-speed interface and goes out of a low-speed interface.
¡ Enters from multiple same-rate interfaces at the same time and goes out of an interface with the same rate.
Procedure
1. Enter system view.
system-view
2. Enable the Burst feature.
burst-mode enable
By default, the Burst feature is disabled.
Configuring data buffers manually
About manual data buffer configuration
Each type of resources of a buffer, packet or cell, has a fixed size. After you set the shared-area size for a type of resources, the rest is automatically assigned to the fixed area.
By default, all queues have an equal share of the shared area and the fixed area. You can change the maximum shared-area space and the fixed-area for a queue. The unconfigured queues use the default settings.
Procedure
1. Enter system view.
system-view
2. Configure buffer assignment rules. Choose the options to configure as needed:
¡ Set the total shared-area ratio.
buffer egress [ slot slot-number ] cell total-shared ratio ratio
On an S6800, S6860, or S6861 switch, the default setting is 99%. On an S6820 switch, the default setting is 100%.
¡ Set the maximum shared-area ratio for a queue.
buffer egress [ slot slot-number ] cell queue queue-id shared ratio ratio
The default setting is 88%.
The actual maximum shared-area space for each queue is determined based on your configuration and the number of packets to be received and sent.
¡ Set the fixed-area ratio for a queue.
buffer egress [ slot slot-number ] cell queue queue-id guaranteed ratio ratio
The default setting is 13%.
The sum of fixed-area ratios configured for all queues cannot exceed the total fixed-area ratio. Otherwise, the configuration fails.
3. Apply buffer assignment rules.
buffer apply
You cannot directly modify the applied configuration. To modify the configuration, you must cancel the application, reconfigure data buffers, and reapply the configuration.
Configuring data buffer monitoring
About data buffer monitoring
The data buffer on a switch is shared by all interfaces for buffering packets during periods of congestion.
This feature allows you to identify the interfaces that use an excessive amount of data buffer space. Then, you can diagnose those interfaces for anomalies.
You can set a per-interface buffer usage threshold. The buffer usage threshold for a queue is the same as the per-interface threshold value. The switch automatically records buffer usage for each interface. When a queue on an interface uses more buffer space than the set threshold, the system counts one threshold violation for the queue.
Procedure
1. Enter system view.
system-view
2. Set a per-interface buffer usage threshold.
buffer usage threshold slot slot-number ratio ratio
On an S6800, S6860, or S6861 switch, the default setting is 30%. On an S6820 switch, the default setting is 70%.
Configuring data buffer alarms
About data buffer alarms
This feature works with a network management system (such as IMC). Data buffer alarms include threshold-crossing alarms and packet drop alarms. The device reports these alarms to the network management system for displaying the data buffer usage.
Hardware compatibility with data buffer alarms
The S6820 switch series does not support this feature.
Configuring alarm thresholds for the ingress or egress buffer
1. Enter system view.
system-view
2. Configure the alarm thresholds. Choose the options to configure as needed:
¡ Configure the global alarm threshold for a queue.
buffer { egress | ingress } usage threshold slot slot-number queue queue-id ratio ratio
The default setting is 100%.
¡ Execute the following commands in sequence to configure the alarm threshold for a queue on an interface:
interface interface-type interface-number
buffer { egress | ingress } usage threshold queue queue-id ratio ratio
The default setting is 100%.
3. Enable threshold-crossing alarms.
buffer threshold alarm { egress | ingress } enable
By default, threshold-crossing alarms are disabled.
4. (Optional.) Set the interval for sending threshold-crossing alarms.
buffer threshold alarm { egress | ingress } interval interval
The default setting is 5 seconds.
This command takes effect only when threshold-crossing alarms are enabled.
Configuring alarm thresholds for the Headroom buffer
1. Enter system view.
system-view
2. Configure the alarm thresholds. Choose the options to configure as needed:
¡ Configure the global per-queue alarm threshold.
buffer usage threshold headroom slot slot-number ratio ratio
The default setting is 100%.
¡ Execute the following commands in sequence to configure the alarm threshold for a queue on an interface:
interface interface-type interface-number
buffer usage threshold headroom queue queue-id ratio ratio
By default, the global per-queue alarm threshold is used.
3. Enable threshold-crossing alarms.
buffer threshold alarm headroom enable
By default, threshold-crossing alarms are disabled.
4. (Optional.) Set the interval for sending threshold-crossing alarms.
buffer threshold alarm headroom interval interval
The default setting is 5 seconds.
This command takes effect only when threshold-crossing alarms are enabled.
Configuring packet-drop alarms
About packet drop alarms
This feature allows the device to periodically send packet-drop information to the NMS.
Restrictions and guidelines
This feature does not take effect on the Headroom buffer.
Procedure
1. Enter system view.
system-view
2. Enable packet-drop alarms.
buffer packet-drop alarm enable
By default, packet-drop alarms are disabled.
3. (Optional.) Set the interval for sending packet-drop alarms.
buffer packet-drop alarm interval interval
The default setting is 5 seconds.
This command takes effect only when packet-drop alarms are enabled.
Configuring Fabric Monitor and Analyzer
About Fabric Monitor and Analyzer
The Fabric Monitor and Analyzer (FMA) feature works with IMC to perform device monitoring and analysis. The device acts as an FMA agent, and the IMC server acts as an FMA client. The commands in this section do not take effect after you configure them on the FMA agent. You must configure the following settings on the FMA client:
· Agent's IP address, MAC address, and port number.
· Client's IP address and port number.
After you configure these settings and enable the Microburst feature on the FMA client, the FMA agent automatically receives these settings from the FMA client.
After the FMA agent receives these settings, it can exchange device monitoring and analysis information with the FMA client.
In the current software version, this feature supports only data buffer statistics and detection. You can view data buffer statistics by using the Microburst function on the IMC server. You can also set the buffer usage thresholds for unicast queues and multicast queues on the IMC server. The IMC server provides alarms for queues that exceed the set thresholds.
Restrictions and guidelines
Only the S6800 switch series supports configuring FMA from the CLI. If you configure FMA from the CLI on an S6860, S6861, or S6820 switch, the configuration does not take effect.
Procedure
1. Enter system view.
system-view
2. Configure the agent's IP address.
fma agent-ip agent-ip
By default, no IP address is configured for an agent.
3. Configure the agent's MAC address.
fma agent-mac agent-mac
By default, no MAC address is configured for an agent.
You must specify the MAC address of the Layer 3 interface whose IP address is specified as the agent's IP address. To identify the MAC address of an interface, use the display interface command.
4. Configure the agent's port number.
fma agent-port agent-port
By default, no port number is configured for an agent.
5. Specify the client's IP address
fma client-ip client-ip
By default, the client's IP address is not specified on the FMA agent.
The specified IP address must be the IP address actually used by the client.
6. Specify the client's port number.
fma client-port client-port
By default, the client's port number is not specified on the FMA agent.
The specified port number must be the port number actually used by the client.
7. Enable the FMA feature.
fma enable
By default, this feature is disabled.
Display and maintenance commands for data buffers
Execute display commands in any view.
|
Task |
Command |
|
Display buffer size settings. |
display buffer [ slot slot-number ] [ queue [ queue-id ] ] |
|
Display data buffer usage. |
display buffer usage [ slot slot-number ] |
|
Display buffer usage statistics for interfaces. |
display buffer usage interface [ interface-type [ interface-number ] ] [ verbose ] |
