- Table of Contents
-
- 01-Fundamentals Configuration Guide
- 00-Preface
- 01-CLI configuration
- 02-RBAC configuration
- 03-Login management configuration
- 04-FTP and TFTP configuration
- 05-File system management configuration
- 06-Configuration file management configuration
- 07-Software upgrade configuration
- 08-ISSU configuration
- 09-Emergency shell configuration
- 10-Device management configuration
- 11-Tcl configuration
- 12-Python configuration
- 13-License management
- 14-Preprovisioning feature configuration
- 15-Automatic configuration
- Related Documents
-
| Title | Size | Download |
|---|---|---|
| 10-Device management configuration | 211.14 KB |
Enabling displaying the copyright statement
Setting the system operating mode
Setting the hardware resource mode for tables
Rebooting devices immediately from the CLI
Schedule configuration example
Configuring parity error alarm for entries on forwarding chips
Disabling password recovery capability
Setting serial numbers for fan trays
Specifying the preferred airflow direction
Setting the port status detection timer
Configuring resource monitoring
Setting memory alarm thresholds
Configuring the temperature alarm thresholds
Verifying and diagnosing transceiver modules
Diagnosing transceiver modules
Managing the device
This chapter describes how to configure basic device parameters and manage the device.
You can perform the configuration tasks in this chapter in any order.
Configuring the device name
A device name (also called hostname) identifies a device in a network and is used in CLI view prompts. For example, if the device name is Sysname, the user view prompt is <Sysname>.
|
Step |
Command |
Remarks |
|
1. Enter system view. |
system-view |
N/A |
|
2. Configure the device name. |
sysname sysname |
The default device name is H3C. |
Configuring the system time
Correct system time is essential to network management and communication. Configure the system time correctly before you run the device on the network.
The device can use the locally set system time, or obtain the UTC time from an NTP source and calculate the system time.
· When using the locally set system time, the device uses the clock signals generated by its built-in crystal oscillator to maintain the system time.
· After obtaining the UTC time from an NTP source, the device uses the UTC time, time zone, and daylight saving time to calculate the system time. Then, the device periodically synchronizes its UTC time and recalculates the system time. For more information about NTP configuration, see Network Management and Monitoring Configuration Guide.
The system time calculated by using the UTC time from an NTP time source is more precise.
To configure the device to use the local system time:
|
Step |
Command |
Remarks |
|
1. Enter system view. |
system-view |
N/A |
|
2. Specify the system time source. |
clock protocol none |
By default, the device uses the NTP time source. |
|
3. Return to user view. |
quit |
N/A |
|
4. Set the local system time. |
clock datetime time date |
N/A |
|
5. Enter system view. |
system-view |
N/A |
|
6. Set the time zone. |
clock timezone zone-name { add | minus } zone-offset |
By default, the system uses the UTC time zone. After a time zone change, the device recalculates the system time. To view the system time, use the display clock command. This setting must be consistent with the time zone of the place where the device resides. |
|
7. (Optional.) Set the daylight saving time. |
clock summer-time name start-time start-date end-time end-date add-time |
By default, the daylight saving time is not set. After you set the daylight saving time, the device recalculates the system time. To view the system time, use the display clock command. The settings must be consistent with the daylight saving time parameters of the place where the device resides. |
To configure the device to obtain the UTC time from a time source and calculate the system time:
|
Step |
Command |
Remarks |
|
1. Enter system view. |
system-view |
N/A |
|
2. Specify the NTP time source. |
clock protocol ntp |
By default, the device uses the NTP time source. If you execute this command multiple times, the most recent configuration takes effect. |
|
3. Set the time zone. |
clock timezone zone-name { add | minus } zone-offset |
By default, the system uses the UTC time zone. After you set the time zone, the device recalculates the system time. To view the system time, use the display clock command. This setting must be consistent with the time zone of the place where the device resides. |
|
4. (Optional.) Set the daylight saving time. |
clock summer-time name start-time start-date end-time end-date add-time |
By default, the daylight saving time is not set. After you set the daylight saving time, the device recalculates the system time. To view the system time, use the display clock command. The settings must be consistent with the daylight saving time parameters of the place where the device resides. |
Enabling displaying the copyright statement
This feature enables the device to display the copyright statement in the following situations:
· When a Telnet or SSH user logs in.
· When a console user quits user view. This is because the device automatically tries to restart the user session.
The following is a sample copyright statement:
******************************************************************************
* Copyright (c) 2004-2017 New H3C Technologies Co., Ltd. All rights reserved.*
* Without the owner's prior written consent, *
* no decompiling or reverse-engineering shall be allowed. *
******************************************************************************
To enable displaying the copyright statement:
|
Step |
Command |
Remarks |
|
1. Enter system view. |
system-view |
N/A |
|
2. Enable displaying the copyright statement. |
copyright-info enable |
By default, this function is enabled. |
Configuring banners
Banners are messages that the system displays when a user logs in.
Banner types
The system supports the following banners:
· Legal banner—Appears after the copyright statement. To continue login, the user must enter Y or press Enter. To quit the process, the user must enter N. Y and N are case insensitive.
· Message of the Day (MOTD) banner—Appears after the legal banner and before the login banner.
· Login banner—Appears only when password or scheme authentication is configured.
· Shell banner—Appears before a user accesses user view.
The system displays the banners in the following order: legal banner, MOTD banner, login banner, and shell banner.
Banner input methods
You can configure a banner by using one of the following methods:
· Input the entire command line in a single line.
The entire command line, including the command keywords, the banner, and the delimiters, can have a maximum of 511 characters. The delimiters for the banner can be any printable character but must be the same. You cannot press Enter before you input the end delimiter.
For example, you can configure the shell banner "Have a nice day." as follows:
<System> system-view
[System] header shell %Have a nice day.%
· Input the command line in multiple lines.
The banner can contain carriage returns. A carriage return is counted as two characters.
To input a banner configuration command line in multiple lines, use one of the following methods:
¡ Press Enter after the final command keyword, type the banner, and end the final line with the delimiter character %. The banner plus the delimiter can have a maximum of 1999 characters.
For example, you can configure the banner "Have a nice day." as follows:
<System> system-view
[System] header shell
Please input banner content, and quit with the character '%'.
Have a nice day.%
¡ After you type the final command keyword, type any printable character as the start delimiter for the banner and press Enter. Then, type the banner and end the final line with the same delimiter. The banner plus the end delimiter can have a maximum of 1999 characters.
For example, you can configure the banner "Have a nice day." as follows:
<System> system-view
[System] header shell A
Please input banner content, and quit with the character 'A'.
Have a nice day.A
¡ After you type the final command keyword, type the start delimiter and part of the banner. Make sure the final character of the final string is different from the start delimiter. Then, press Enter, type the rest of the banner, and end the final line with the same delimiter. The banner plus the start and end delimiters can have a maximum of 2002 characters.
For example, you can configure the banner "Have a nice day." as follows:
<System> system-view
[System] header shell AHave a nice day.
Please input banner content, and quit with the character 'A'.
A
Configuration procedure
To configure banners:
|
Step |
Command |
Remarks |
|
1. Enter system view. |
system-view |
N/A |
|
2. Configure the legal banner. |
header legal text |
By default, no legal banner is configured. |
|
3. Configure the MOTD banner. |
header motd text |
By default, no MOTD banner is configured. |
|
4. Configure the login banner. |
header login text |
By default, no login banner is configured. |
|
5. Configure the shell banner. |
header shell text |
By default, no shell banner is configured. |
Setting the system operating mode
The device can operate in the following modes:
· standard—This mode does not support FC or FCoE. By default, the device operates in this mode.
· advance—This mode supports FC and FCoE as well as all features supported in standard mode, and decreases the amount of space for ACLs to store FC and FCoE entries. The available amount of space for ACLs is less than in standard mode. This mode does not support IRF 3.1, which is supported only in standard mode.
· expert—This mode supports FC, FCoE, and FCoE over S-Channel. However, it does not support MAC VLAN, MPLS, QinQ, SPB, TRILL, VLAN mapping, Voice VLAN, VPLS, or VXLAN, which are supported in both standard mode and advanced mode. This mode does not support IRF 3.1 either, which is supported only in standard mode.
For more information about FC, FCoE, and FCoE over S-Channel, see FC and FCoE Configuration Guide.
If the system-working-mode command displays the Not enough hardware resources available. message, perform the following tasks before trying again:
1. Use the display qos-acl resource command to display ACL resource usage.
2. Use the undo acl command to release resources as required.
For more information, see ACL and QoS Command Reference.
To set the system operating mode:
|
Step |
Command |
Remarks |
|
1. Enter system view. |
system-view |
N/A |
|
2. Set the system operating mode. |
system-working-mode { advance | expert | standard } |
By default, the device operates in standard mode. Change to the operating mode takes effect after a system reboot. |
Setting the hardware resource mode for tables
|
|
IMPORTANT: For this feature to take effect, you must save the running configuration and reboot the device. Before rebooting the device, make sure you fully understand the impact on your network, |
The capacities of the MAC address table, ARP/ND table, and routing tables depend on the following conditions:
· Hardware resource mode.
· Whether the hardware-resource routing-mode ipv6-128 command is configured. For more information about the hardware-resource routing-mode ipv6-128 command, see Layer 3—IP Routing Command Reference.
The ARP table and the ND table share the same storage space. The IPv6-64 routing table and the IPv6-128 routing table share the same storage space.
The term "IPv6-64" in Table 1 refers to a prefix length that is equal to or less than 64 bits. The term "IPv6-128" refers to a prefix length that is greater than 64 bits.
Table 1 Table capacities when hardware-resource routing-mode ipv6-128 is not configured
|
Table capacity mode |
MAC address table capacity |
ARP/ND table capacity |
IPv4 routing table capacity |
IPv6-64 routing table capacity |
|
0 |
16K ARP table or 8K ND table |
16K |
8K |
|
|
80K ARP table or 40K ND table |
8K |
|||
|
144K ARP table or 72K ND table |
8K |
|||
|
3 |
16K |
8K |
||
|
16K ARP table or 8K ND table |
250K |
Table 2 Table capacities when hardware-resource routing-mode ipv6-128 is configured
|
Table capacity mode |
MAC address table capacity |
ARP/ND table capacity |
IPv4 routing table capacity |
IPv6 routing table capacity |
|
0 |
288K |
16K ARP table or 8K ND table |
8K |
4K (IPv6-64) or 2K (IPv6-128) |
|
1 |
224K |
80K ARP table or 40K ND table |
8K |
4K (IPv6-64) or 2K (IPv6-128) |
|
2 |
160K |
144K ARP table or 72K ND table |
8K |
4K (IPv6-64) or 2K (IPv6-128) |
|
3 |
96K |
208K ARP table or 104K ND table |
8K |
4K (IPv6-64) or 2K (IPv6-128) |
|
4 |
32K |
16K ARP table or 8K ND table |
128K |
32K (IPv6-64) or 20K (IPv6-128) |
To set the hardware resource mode:
|
Step |
Command |
Remarks |
|
1. Enter system view. |
system-view |
N/A |
|
2. Set the hardware resource mode. |
hardware-resource switch-mode { 0 | 1 | 2 | 3 | 4 } |
The default hardware resource mode is 0. |
Rebooting the device
|
|
CAUTION: · A device reboot might interrupt network services. · To avoid configuration loss, use the save command to save the running configuration before a reboot. For more information about the save command, see Fundamentals Command Reference. · Before a reboot, use the display startup and display boot-loader commands to verify that the startup configuration file and startup software images are correctly specified. If a startup configuration file or software image problem exists, the device cannot start up correctly. For more information about the two display commands, see Fundamentals Command Reference. |
The following device reboot methods are available:
· Schedule a reboot at the CLI, so the device automatically reboots at the specified time or after the specified period of time.
· Immediately reboot the device at the CLI.
During the reboot process, the device performs the following operations:
a. Resets all of its chips.
b. Uses the BootWare to verify the startup software package, decompress the package, and load the images.
c. Initializes the system.
· Power off and then power on the device. This method might cause data loss, and is the least-preferred method.
Using the CLI, you can reboot the device from a remote host.
For data security, the device does not reboot while it is performing file operations.
Rebooting devices immediately from the CLI
Perform this task in user view.
|
Task |
Command |
Remarks |
|
Reboot the device. |
reboot [ slot slot-number [ subslot subslot-number ] ] [ force ] |
Only the S6800-2C, S6800-2C-FC, and S6800-4C switches support the subslot subslot-number option. |
Scheduling a device reboot
The device supports only one device reboot schedule. If you execute the scheduler reboot at or scheduler reboot delay command multiple times or execute both commands, the most recent configuration takes effect.
The automatic reboot configuration takes effect on all member devices. It will be canceled if a master/subordinate switchover occurs.
To schedule a reboot, execute one of the following commands in user view:
|
Task |
Command |
Remarks |
|
Specify the reboot date and time. |
scheduler reboot at time [ date ] |
By default, no reboot date or time is specified. |
|
Specify the reboot delay time. |
scheduler reboot delay time |
By default, no reboot delay time is specified. |
Scheduling a task
You can schedule the device to automatically execute a command or a set of commands without administrative interference.
You can configure a periodic schedule or a non-periodic schedule. A non-periodic schedule is not saved to the configuration file and is lost when the device reboots. A periodic schedule is saved to the startup configuration file and is automatically executed periodically.
Configuration guidelines
Follow these guidelines when you schedule a task:
· The default system time is always restored at reboot. To make sure a task schedule can be executed as expected, reconfigure the system time or configure NTP after you reboot the device. For more information about NTP, see Network Management and Monitoring Configuration Guide.
· To assign a command (command A) to a job, you must first assign the job the command or commands for entering the view of command A.
· Make sure all commands in a schedule are compliant to the command syntax. The system does not check the syntax when you assign a command to a job.
· A schedule cannot contain any one of these commands: telnet, ftp, ssh2, and monitor process.
· A schedule does not support user interaction. If a command requires a yes or no answer, the system always assumes that a Y or Yes is entered. If a command requires a character string input, the system assumes that either the default character string (if any) or a null string is entered.
· A schedule is executed in the background, and no output (except for logs, traps, and debug information) is displayed for the schedule.
Configuration procedure
To configure a schedule for the device:
|
Step |
Command |
Remarks |
|
1. Enter system view. |
system-view |
N/A |
|
2. Create a job. |
scheduler job job-name |
By default, no job exists. |
|
3. Assign a command to the job. |
command id command |
By default, no command is assigned to a job. A command with a smaller ID is executed first. |
|
4. Exit to system view. |
quit |
N/A |
|
5. Create a schedule. |
scheduler schedule schedule-name |
By default, no schedule exists. |
|
6. Assign a job to a schedule. |
job job-name |
By default, no job is assigned to a schedule. You can assign multiple jobs to a schedule. The jobs will be executed concurrently. |
|
7. Assign user roles to the schedule. |
user-role role-name |
By default, a schedule has the user role of the schedule creator. You can assign up to 64 user roles to a schedule. A command in a schedule can be executed if it is permitted by one or more user roles of the schedule. |
|
8. Specify an execution time table for the schedule. |
· Specify the execution date and time: · Specify the execution days and time: · Specify the execution delay time: · Specify the periodic execution points in time: · Specify the start time and execution
interval: |
By default, no execution time is specified for a schedule. A schedule can have only one execution time table. If you execute the time command multiple times, the most recent configuration takes effect. Executing commands clock datetime, clock summer-time, and clock timezone does not change the execution time table that is already configured for a schedule. |
Schedule configuration example
Network requirements
As shown in Figure 1, two interfaces of the device are connected to users.
To save energy, configure the device to perform the following operations:
· Enable the interfaces at 8:00 a.m. every Monday through Friday.
· Disable the interfaces at 18:00 every Monday through Friday.

Scheduling procedure
# Enter system view.
<Sysname> system-view
# Configure a job for disabling interface Ten-GigabitEthernet 1/0/1.
[Sysname] scheduler job shutdown-Ten-GigabitEthernet1/0/1
[Sysname-job-shutdown-Ten-GigabitEthernet1/0/1] command 1 system-view
[Sysname-job-shutdown-Ten-GigabitEthernet1/0/1] command 2 interface ten-gigabitethernet 1/0/1
[Sysname-job-shutdown-Ten-GigabitEthernet1/0/1] command 3 shutdown
[Sysname-job-shutdown-Ten-GigabitEthernet1/0/1] quit
# Configure a job for enabling interface Ten-GigabitEthernet 1/0/1.
[Sysname] scheduler job start-Ten-GigabitEthernet1/0/1
[Sysname-job-start-Ten-GigabitEthernet1/0/1] command 1 system-view
[Sysname-job-start-Ten-GigabitEthernet1/0/1] command 2 interface ten-gigabitethernet 1/0/1
[Sysname-job-start-Ten-GigabitEthernet1/0/1] command 3 undo shutdown
[Sysname-job-start-Ten-GigabitEthernet1/0/1] quit
# Configure a job for disabling interface Ten-GigabitEthernet 1/0/2.
[Sysname] scheduler job shutdown-Ten-GigabitEthernet1/0/2
[Sysname-job-shutdown-Ten-GigabitEthernet1/0/2] command 1 system-view
[Sysname-job-shutdown-Ten-GigabitEthernet1/0/2] command 2 interface ten-gigabitethernet 1/0/2
[Sysname-job-shutdown-Ten-GigabitEthernet1/0/2] command 3 shutdown
[Sysname-job-shutdown-Ten-GigabitEthernet1/0/2] quit
# Configure a job for enabling interface Ten-GigabitEthernet 1/0/2.
[Sysname] scheduler job start-Ten-GigabitEthernet1/0/2
[Sysname-job-start-Ten-GigabitEthernet1/0/2] command 1 system-view
[Sysname-job-start-Ten-GigabitEthernet1/0/2] command 2 interface ten-gigabitethernet 1/0/2
[Sysname-job-start-Ten-GigabitEthernet1/0/2] command 3 undo shutdown
[Sysname-job-start-Ten-GigabitEthernet1/0/2] quit
# Configure a periodic schedule for enabling the interfaces at 8:00 a.m. every Monday through Friday.
[Sysname] scheduler schedule START-pc1/pc2
[Sysname-schedule-START-pc1/pc2] job start-Ten-GigabitEthernet1/0/1
[Sysname-schedule-START-pc1/pc2] job start-Ten-GigabitEthernet1/0/2
[Sysname-schedule-START-pc1/pc2] time repeating at 8:00 week-day mon tue wed thu fri
[Sysname-schedule-START-pc1/pc2] quit
# Configure a periodic schedule for disabling the interfaces at 18:00 every Monday through Friday.
[Sysname] scheduler schedule STOP-pc1/pc2
[Sysname-schedule-STOP-pc1/pc2] job shutdown-Ten-GigabitEthernet1/0/1
[Sysname-schedule-STOP-pc1/pc2] job shutdown-Ten-GigabitEthernet1/0/2
[Sysname-schedule-STOP-pc1/pc2] time repeating at 18:00 week-day mon tue wed thu fri
[Sysname-schedule-STOP-pc1/pc2] quit
Verifying the scheduling
# Display the configuration information of all jobs.
[Sysname] display scheduler job
Job name: shutdown-Ten-GigabitEthernet1/0/1
system-view
interface ten-gigabitethernet 1/0/1
shutdown
Job name: shutdown-Ten-GigabitEthernet1/0/2
system-view
interface ten-gigabitethernet 1/0/2
shutdown
Job name: start-Ten-GigabitEthernet1/0/1
system-view
interface ten-gigabitethernet 1/0/1
undo shutdown
Job name: start-Ten-GigabitEthernet1/0/2
system-view
interface ten-gigabitethernet 1/0/2
undo shutdown
# Display the schedule information.
[Sysname] display scheduler schedule
Schedule name : START-pc1/pc2
Schedule type : Run on every Mon Tue Wed Thu Fri at 08:00:00
Start time : Wed Sep 28 08:00:00 2011
Last execution time : Wed Sep 28 08:00:00 2011
Last completion time : Wed Sep 28 08:00:03 2011
Execution counts : 1
-----------------------------------------------------------------------
Job name Last execution status
start-Ten-GigabitEthernet1/0/1 Successful
start-Ten-GigabitEthernet1/0/2 Successful
Schedule name : STOP-pc1/pc2
Schedule type : Run on every Mon Tue Wed Thu Fri at 18:00:00
Start time : Wed Sep 28 18:00:00 2011
Last execution time : Wed Sep 28 18:00:00 2011
Last completion time : Wed Sep 28 18:00:01 2011
Execution counts : 1
-----------------------------------------------------------------------
Job name Last execution status
shutdown-Ten-GigabitEthernet1/0/1 Successful
shutdown-Ten-GigabitEthernet1/0/2 Successful
# Display schedule log information.
[Sysname] display scheduler logfile
Job name : start-Ten-GigabitEthernet1/0/1
Schedule name : START-pc1/pc2
Execution time : Wed Sep 28 08:00:00 2011
Completion time : Wed Sep 28 08:00:02 2011
--------------------------------- Job output -----------------------------------
<Sysname>system-view
System View: return to User View with Ctrl+Z.
[Sysname]interface ten-gigabitethernet 1/0/1
[Sysname-Ten-GigabitEthernet1/0/1]undo shutdown
Job name : start-Ten-GigabitEthernet1/0/2
Schedule name : START-pc1/pc2
Execution time : Wed Sep 28 08:00:00 2011
Completion time : Wed Sep 28 08:00:02 2011
--------------------------------- Job output -----------------------------------
<Sysname>system-view
System View: return to User View with Ctrl+Z.
[Sysname]interface ten-gigabitethernet 1/0/2.
[Sysname-Ten-GigabitEthernet1/0/2]undo shutdown
Job name : shutdown-Ten-GigabitEthernet1/0/1
Schedule name : STOP-pc1/pc2
Execution time : Wed Sep 28 18:00:00 2011
Completion time : Wed Sep 28 18:00:01 2011
--------------------------------- Job output -----------------------------------
<Sysname>system-view
System View: return to User View with Ctrl+Z.
[Sysname]interface ten-gigabitethernet 1/0/1
[Sysname-Ten-GigabitEthernet1/0/1]shutdown
Job name : shutdown-Ten-GigabitEthernet1/0/2
Schedule name : STOP-pc1/pc2
Execution time : Wed Sep 28 18:00:00 2011
Completion time : Wed Sep 28 18:00:01 2011
--------------------------------- Job output -----------------------------------
<Sysname>system-view
System View: return to User View with Ctrl+Z.
[Sysname]interface ten-gigabitethernet 1/0/2
[Sysname-Ten-GigabitEthernet1/0/2]shutdown
Configuring parity error alarm for entries on forwarding chips
The device detects parity errors in entries on forwarding chips. The parity error alarm feature enables the device to perform the following operations:
· Collects statistics for parity errors at intervals, and issues an alarm if the number of the errors exceeds the alarm threshold.
· Generates logs for the detected parity errors.
To configure parity error alarm for entries on forwarding chips:
|
Step |
Command |
Remarks |
|
1. Enter system view. |
system-view |
N/A |
|
2. Set the parity error statistics interval for entries on forwarding chips. |
parity-error monitor period value |
By default, the parity error statistics interval is 60 seconds. |
|
3. Set the parity error alarm threshold for entries on forwarding chips. |
parity-error monitor threshold value |
By default, the parity error alarm threshold is 5000. |
|
4. Enable parity error logging for entries on forwarding chips. |
parity-error monitor log enable |
By default, parity error logging is disabled for entries on forwarding chips. |
Disabling password recovery capability
Password recovery capability controls console user access to the device configuration and SDRAM from BootWare menus.
If password recovery capability is enabled, a console user can access the device configuration without authentication to configure a new password.
If password recovery capability is disabled, console users must restore the factory-default configuration before they can configure new passwords. Restoring the factory-default configuration deletes the next-startup configuration files.
To enhance system security, disable password recovery capability.
To disable password recovery capability:
|
Step |
Command |
Remarks |
|
1. Enter system view. |
system-view |
N/A |
|
2. Disable password recovery capability. |
undo password-recovery enable |
By default, password recovery capability is enabled. |
Setting serial numbers for fan trays
About setting serial numbers for fan trays
After you set serial numbers for fan trays correctly, the display device manuinfo and display device manuinfo fan commands can display serial numbers and manufacturing dates of fan trays.
Restrictions and guidelines
This feature is supported only on the switches labeled with the product code LS-6800-54QF-H3 or LS-6800-54QT-H3 in Release 2612P06 and later.
The serial number of a fan tray is printed on a label on the fan tray. Enter the serial number correctly for the correct fan tray.
The display device manuinfo and display device manuinfo fan commands display NONE for the serial number and manufacturing date fields of a fan tray in the following situations:
· The fan tray does not have a serial number configured.
· The configured serial number is incorrect.
Procedure
1. Enter system view.
system-view
2. Set the serial number for a fan tray.
download manuinfo slot slot-number fan fan-id serial-num serial-number
By default, fan trays do not have serial numbers configured.
Specifying the preferred airflow direction
Two fan tray models are available for the device. One model has air flow from the port side to the power supply side. The other model has air flow from the power supply side to the port side.
Select the correct fan tray model and set the preferred airflow direction to the airflow direction of the ventilation system in the equipment room. If a fan tray is not operating correctly or has a different airflow direction than the configured one, the system sends traps and logs.
To specify the preferred airflow direction:
|
Step |
Command |
Remarks |
|
1. Enter system view. |
system-view |
N/A |
|
2. Specify the preferred airflow direction. |
fan prefer-direction slot slot-number { power-to-port | port-to-power } |
The default varies by device model.
The default airflow direction is from the power supply side to the port side.
The default varies by device model.
The default varies by device model. |
Setting the port status detection timer
To set the port status detection timer:
|
Step |
Command |
Remarks |
|
1. Enter system view. |
system-view |
N/A |
|
2. Set the port status detection timer. |
shutdown-interval time |
The default setting is 30 seconds. |
Monitoring CPU usage
To monitor CPU usage, the device performs the following operations:
· Samples CPU usage at 1-minute intervals, and compares the samples with CPU usage thresholds to identify the CPU usage status and send alarms or notifications accordingly.
· If CPU usage tracking is enabled, samples and saves CPU usage at intervals. You can use the display cpu-usage history command to display the historical CPU usage statistics in a coordinate system.
The device supports the following CPU usage thresholds:
· Minor threshold—If the CPU usage increases to or above the minor threshold but is less than the severe threshold, the CPU usage enters minor alarm state. The device sends minor alarms periodically until the CPU usage increases above the severe threshold or the minor alarm is removed.
· Severe threshold—If the CPU usage increases above the severe threshold, the CPU usage enters severe alarm state. The device sends severe alarms periodically until the severe alarm is removed.
· Recovery threshold—If the CPU usage decreases below the recovery threshold, the CPU usage enters recovered state. The device sends a recovery notification.
CPU usage alarms and notifications can be sent to NETCONF, SNMP, and the information center to be encapsulated as NETCONF events, SNMP traps and informs, and log messages. For more information, see NETCONF, SNMP, and information center in Network Management and Monitoring Configuration Guide.
Figure 2 CPU alarms and alarm-removed notifications

To monitor CPU usage:
|
Step |
Command |
Remarks |
|
1. Enter system view. |
system-view |
N/A |
|
2. Set the CPU usage threshold. |
monitor cpu-usage threshold severe-threshold minor-threshold minor-threshold recovery-threshold recovery-threshold [ slot slot-number [ cpu cpu-number ] ] |
The default settings are as follows: · Severe CPU usage threshold—99%. · Minor CPU usage alarm threshold—80%. · CPU usage recovery threshold—75%. |
|
3. Set CPU usage alarm resending intervals. |
monitor resend cpu-usage { minor-interval minor-interval | severe-interval severe-interval } * [ slot slot-number [ cpu cpu-number ] ] |
By default, the minor alarm resending interval is 300 seconds and the severe alarm resending interval is 60 seconds. |
|
4. Enable CPU usage tracking. |
monitor cpu-usage enable [ slot slot-number [ cpu cpu-number ] ] |
By default, CPU usage tracking is enabled. |
|
5. Set the sampling interval for CPU usage tracking. |
monitor cpu-usage interval interval [ slot slot-number [ cpu cpu-number ] ] |
By default, the sampling interval for CPU usage tracking is 1 minute. |
|
6. Exit to user view. |
quit |
N/A |
|
7. Display CPU usage statistics. |
display cpu-usage [ summary ] [ slot slot-number [ cpu cpu-number ] ] |
This command is available in any view. |
|
8. Display CPU usage monitoring settings. |
display cpu-usage configuration [ slot slot-number [ cpu cpu-number ] ] |
This command is available in any view. |
|
9. Display the historical CPU usage statistics in a coordinate system. |
display cpu-usage history [ job job-id ] [ slot slot-number [ cpu cpu-number ] ] |
This command is available in any view. |
Configuring resource monitoring
The resource monitoring feature enables the device to monitor the available amounts of types of resources, for example, the space for ARP entries. The device samples the available amounts at intervals and compares the samples with resource depletion thresholds to identify the resource depletion status.
The device supports a minor resource depletion threshold and a severe resource depletion threshold for each supported resource type.
· If the available amount is equal to or less than the minor resource depletion threshold but greater than the severe resource depletion threshold, the resource type is in minor alarm state.
· If the available amount is equal to or less than the severe resource depletion threshold, the resource type is in severe alarm state.
· If the available amount increases above the minor resource depletion threshold, the resource type is in recovered state.
When a resource type enters severe alarm state, the device issues a severe alarm. If the resource type stays in severe alarm state, the device resends severe alarms periodically.
When a resource type enters minor alarm state, the device issues a minor alarm. If the resource type stays in minor alarm state or changes from severe alarm state to minor alarm state, the device identifies whether resending of minor resource depletion alarms is enabled. If the feature is disabled, the device does not issue additional minor alarms. If the feature is enabled, the device resends minor alarms periodically.
Resource depletion alarms can be sent to NETCONF, SNMP, and the information center to be encapsulated as NETCONF events, SNMP traps and informs, and log messages. For more information, see NETCONF, SNMP, and information center in Network Management and Monitoring Configuration Guide.
Figure 3 Resource depletion alarms and alarm-removed notifications

To configure resource monitoring:
|
Step |
Command |
Remarks |
|
1. Enter system view. |
system-view |
N/A |
|
2. Set resource depletion thresholds. |
resource-monitor resource resource-name slot slot-number cpu cpu-number by-percent minor-threshold minor-threshold severe-threshold severe-threshold |
The default settings vary by resource types. In Release 2609, use the display current-configuration | include "resource-monitor resource" command to display resource depletion thresholds. In Release 2612 and later, use the display resource-monitor command to display resource depletion thresholds. |
|
3. Specify destinations for resource depletion alarms. |
resource-monitor output { netconf-event | snmp-notification | syslog } * |
By default, resource depletion alarms are sent to NETCONF, SNMP, and the information center. |
|
4. Enable resending of minor resource depletion alarms. |
resource-monitor minor resend enable |
By default, resending of minor resource depletion alarms is enabled. |
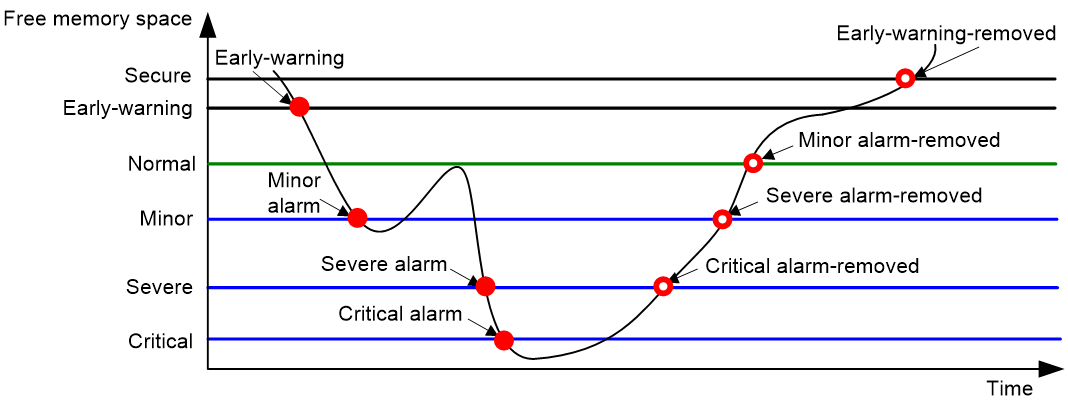
Setting memory alarm thresholds
To ensure correct operation and improve memory efficiency, the system monitors the amount of free memory space in real time. If the amount of free memory space reaches the minor, severe, or critical alarm threshold, the system issues an alarm to affected service modules and processes.
The early warning feature warns you of an approaching insufficient-memory condition.
As shown in Table 3 and Figure 4, the system supports the following free-memory thresholds:
· Sufficient-memory threshold.
· Early-warning threshold.
· Normal state threshold.
· Minor alarm threshold.
· Severe alarm threshold.
· Critical alarm threshold.
Table 3 Memory alarm notifications and memory alarm-removed notifications
|
Notification |
Triggering condition |
Remarks |
|
Early-warning notification |
The amount of free memory space decreases to or below the early-warning threshold for the first time. |
After generating and sending an early-warning notification, the system does not generate or send any additional early-warning notifications until the first early warning is removed. |
|
Minor alarm notification |
The amount of free memory space decreases to or below the minor alarm threshold for the first time. |
After generating and sending a minor alarm notification, the system does not generate or send any additional minor alarm notifications until the first minor alarm is removed. |
|
Severe alarm notification |
The amount of free memory space decreases to or below the severe alarm threshold for the first time. |
After generating and sending a severe alarm notification, the system does not generate or send any additional severe alarm notifications until the first severe alarm is removed. |
|
Critical alarm notification |
The amount of free memory space decreases to or below the critical alarm threshold for the first time. |
After generating and sending a critical alarm notification, the system does not generate or send any additional critical alarm notifications until the first critical alarm is removed. |
|
Critical alarm-removed notification |
The amount of free memory space increases to or above the severe alarm threshold. |
N/A |
|
Severe alarm-removed notification |
The amount of free memory space increases to or above the minor alarm threshold. |
N/A |
|
Minor alarm-removed notification |
The amount of free memory space increases to or above the normal state threshold. |
N/A |
|
Early-warning-removed notification |
The amount of free memory space increases to or above the sufficient-memory threshold. |
N/A |
Figure 4 Memory alarm notifications and alarm-removed notifications
To set memory alarm thresholds:
|
Step |
Command |
Remarks |
|
1. Enter system view. |
system-view |
N/A |
|
2. Set the memory usage threshold. |
memory-threshold [ slot slot-number [ cpu cpu-number ] ] usage memory-threshold |
By default, the memory usage threshold is 100%. |
|
3. Set the free-memory thresholds. |
memory-threshold [ slot slot-number [ cpu cpu-number ] ] [ ratio ] minor minor-value severe severe-value critical critical-value normal normal-value [ early-warning early-warning-value secure secure-value ] |
On S6800-54QT (LS-6800-54QT), S6800-54QT (LS-6800-54QT-H1), S6800-54QF (LS-6800-54QF), and S6800-54QF (LS-6800-54QF-H1) switches, the defaults vary by the configuration loaded at startup. · If the switches start up with the factory defaults, the default settings are as follows: ¡ Minor alarm threshold—122 MB. ¡ Severe alarm threshold—61 MB. ¡ Critical alarm threshold—41 MB. ¡ Normal state threshold—143 MB. ¡ Early-warning threshold—164 MB. ¡ Sufficient-memory threshold—184 MB. · If the switches start up with the initial configuration, the default settings are as follows: ¡ Minor alarm threshold—256 MB. ¡ Severe alarm threshold—128 MB. ¡ Critical alarm threshold—64 MB. ¡ Normal state threshold—304 MB. ¡ Early-warning threshold—320 MB. ¡ Sufficient-memory threshold—368 MB. On other models of devices, the default settings are as follows: · Minor alarm threshold—256 MB. · Severe alarm threshold—128 MB. · Critical alarm threshold—64 MB. · Normal state threshold—304 MB. · Early-warning threshold—320 MB. · Sufficient-memory threshold—368 MB. |
|
4. Set memory depletion alarm resending intervals. |
monitor resend memory-threshold { critical-interval critical-interval | early-warning-interval early-warning-interval | minor-interval minor-interval | severe-interval severe-interval } * [ slot slot-number [ cpu cpu-number ] ] |
The following are the default settings: · Early warning resending interval—1 hour. · Minor alarm resending interval—12 hours. · Severe alarm resending interval—3 hours. · Critical alarm resending interval—1 hour. |
Configuring the temperature alarm thresholds
The device monitors its temperature by temperature sensors. You can configure the following temperature thresholds:
· Low-temperature threshold.
· High-temperature warning threshold.
· High-temperature alarming threshold.
When the temperature drops below the low-temperature threshold or reaches the high-temperature warning or alarming threshold, the device performs the following operations:
· Sends log messages and traps.
· Sets LEDs on the device panel.
To configure the temperature alarm thresholds:
|
2. Configure the temperature alarm thresholds. |
temperature-limit slot slot-number hotspot sensor-number lowlimit warninglimit [ alarmlimit ] |
The defaults vary by temperature sensor model. To view the defaults, use the undo temperature-limit command to restore the defaults and then execute the display environment command. The high-temperature alarming threshold must be higher than the high-temperature warning threshold. The high-temperature warning threshold must be higher than the low-temperature threshold. |
Disabling USB interfaces
You can use USB interfaces to upload or download files. By default, all USB interfaces are enabled. You can disable USB interfaces as needed.
To disable all USB interfaces:
|
Step |
Command |
Remarks |
|
1. Enter system view. |
system-view |
N/A |
|
2. Disable USB interfaces. |
usb disable |
By default, all USB interfaces are enabled. Before using this command, use the umount command to unmount all USB partitions. For more information about this command, see Fundamentals Command Reference. |
Verifying and diagnosing transceiver modules
Verifying transceiver modules
You can use one of the following methods to verify the genuineness of a transceiver module:
· Display the key parameters of a transceiver module, including its transceiver type, connector type, central wavelength of the transmit laser, transfer distance, and vendor name.
· Display its electronic label. The electronic label is a profile of the transceiver module and contains the permanent configuration, including the serial number, manufacturing date, and vendor name. The data is written to the transceiver module or the device's storage component during debugging or testing of the transceiver module or device.
The device regularly checks transceiver modules for their vendor names. If a transceiver module does not have a vendor name or the vendor name is not H3C, the device repeatedly outputs traps and log messages. For information about logging rules, see Network Management and Monitoring Configuration.
To verify transceiver modules, execute the following commands in any view:
|
Task |
Command |
Remarks |
|
Display the key parameters of transceiver modules. |
display transceiver interface [ interface-type interface-number ] |
N/A |
|
Display the electrical label information of transceiver modules. |
display transceiver manuinfo interface [ interface-type interface-number ] |
This command cannot display information for some transceiver modules. |
Diagnosing transceiver modules
The device provides the alarm and digital diagnosis functions for transceiver modules. When a transceiver module fails or is not operating correctly, you can perform the following tasks:
· Check the alarms that exist on the transceiver module to identify the fault source.
· Examine the key parameters monitored by the digital diagnosis function, including the temperature, voltage, laser bias current, TX power, and RX power.
To diagnose transceiver modules, execute the following commands in any view:
|
Task |
Command |
Remarks |
|
Display transceiver alarms. |
display transceiver alarm interface [ interface-type interface-number ] |
N/A |
|
Display the current values of the digital diagnosis parameters on transceiver modules. |
display transceiver diagnosis interface [ interface-type interface-number ] |
This command cannot display information about some transceiver modules. |
Restoring the factory-default configuration
|
|
CAUTION: This task is disruptive. Use this task only when you cannot troubleshoot the device by using other methods, or you want to use the device in a different scenario. |
To restore the factory-default configuration for the device, execute the following command in user view:
|
Task |
Command |
Remarks |
|
Restore the factory-default configuration for the device. |
restore factory-default |
This command takes effect after a device reboot. |
Displaying and maintaining device management configuration
Execute display commands in any view. Execute the reset scheduler logfile command in user view. Execute the reset version-update-record command in system view.
|
Task |
Command |
|
Display device alarm information. |
display alarm [ slot slot-number ] |
|
Display the system time, date, time zone, and daylight saving time. |
display clock |
|
Display the copyright statement. |
display copyright |
|
Display current CPU usage statistics. |
display cpu-usage [ summary ] [ slot slot-number [ cpu cpu-number ] ] |
|
Display CPU usage monitoring settings. |
display cpu-usage configuration [ slot slot-number [ cpu cpu-number ] ] |
|
Display historical CPU usage statistics in a coordinate system. |
display cpu-usage history [ job job-id ] [ slot slot-number [ cpu cpu-number ] ] |
|
Display hardware information. Only the S6800-2C, S6800-2C-FC, and S6820-4C switches support the subslot subslot-number option. |
display device [ flash | usb ] [ slot slot-number [ subslot subslot-number ] | verbose ] |
|
Display electronic label information for the device. Only the S6800-2C, S6800-2C-FC, and S6820-4C switches support the subslot subslot-number option. |
display device manuinfo [ slot slot-number [ subslot subslot-number ] ] |
|
Display electronic label information for a fan tray. |
display device manuinfo slot slot-number fan fan-id |
|
Display electronic label information for a power supply. |
display device manuinfo slot slot-number power power-id |
|
Display or save operating information for features and hardware modules. |
display diagnostic-information [ hardware | infrastructure | l2 | l3 | service ] [ key-info ] [ filename ] |
|
Display device temperature information. |
display environment [ slot slot-number ] |
|
Display the operating states of fan trays. |
display fan [ slot slot-number [ fan-id ] ] |
|
Display hardware resource mode information for the MAC address table, ARP and ND tables, and routing tables. |
display hardware-resource [ switch-mode ] |
|
Display memory usage statistics. |
display memory [ summary ] [ slot slot-number [ cpu cpu-number ] ] |
|
Display memory alarm thresholds and statistics. |
display memory-threshold [ slot slot-number [ cpu cpu-number ] ] |
|
Display power supply information. |
display power [ slot slot-number [ power-id ] ] |
|
Display resource monitoring information. This command is available in Release 2612 and later. |
display resource-monitor [ resource resource-name] [ slot slot-number [ cpu cpu-number ] ] |
|
Display job configuration information. |
display scheduler job [ job-name ] |
|
Display job execution log information. |
display scheduler logfile |
|
Display the automatic reboot schedule. |
display scheduler reboot |
|
Display schedule information. |
display scheduler schedule [ schedule-name ] |
|
Display system stability and status information. |
display system stable state |
|
Display system working mode information. |
display system-working-mode |
|
Display system version information. |
display version |
|
Display startup software image upgrade records. |
display version-update-record |
|
Clear job execution log information. |
reset scheduler logfile |
|
Clear startup software image upgrade records. |
reset version-update-record |
|
|
NOTE: The display device manuinfo command cannot display fan tray electronic label information on the following switches: · S6800-4C (LS-6800-4C), S6800-4C (LS-6800-4C-H1), S6800-54QF (LS-6800-54QF-H3), and S6800-54QT (LS-6800-54QT-H3) switches running a version prior to Release 2612P06. · S6800-4C (LS-6800-4C) and S6800-4C (LS-6800-4C-H1) switches running Release 2612P06 or later. The display device manuinfo slot slot-number fan fan-id command is not supported on the following switches: · S6800-4C (LS-6800-4C), S6800-4C (LS-6800-4C-H1), S6800-54QF (LS-6800-54QF-H3), and S6800-54QT (LS-6800-54QT-H3) switches running a version prior to Release 2612P06. · S6800-4C (LS-6800-4C) and S6800-4C (LS-6800-4C-H1) switches running Release 2612P06 or later. |
