- Table of Contents
- Related Documents
-
| Title | Size | Download |
|---|---|---|
| 01-Text | 3.13 MB |
Common configuration procedures
Configuring NQA link monitoring
Configuring network inspection
Modifying device configuration
Auditing NQA instance configurations
Importing non-Web configured NQA instances
Auditing NQA instance configurations
Managing the NQA instance topology
Viewing the NQA instance topology
Specifying the link label displaying method
Viewing KQI class or KQI details
Bulk deleting KQIs or KQI classes
Modifying basic information of a KQI class
Viewing the service level list
Viewing the service level details
Adding an SLA by service model
Viewing the path analysis list
Viewing the path analysis details
Deleting multiple path analyses
Viewing the latest polling result
Configuring network inspection
Viewing the collection task list
Viewing collection task details
Modifying the status of a collection task
Viewing collection task history
Viewing collection task details
Viewing the collection template list
Configuring a collection template
Viewing the collection item list
Querying collection items and collection item groups
Viewing collection item details
Deleting collection items and collection item groups
Adding a collection item group
Modifying a user-defined collection item group
Viewing report types and report templates
Uploading an inspection report template
Enabling an inspection report template
Deleting inspection report templates
Evaluating network service configuration example
Evaluating voice service configuration example
Evaluating email service configuration example
Evaluating network infrastructure performance configuration example
Overview
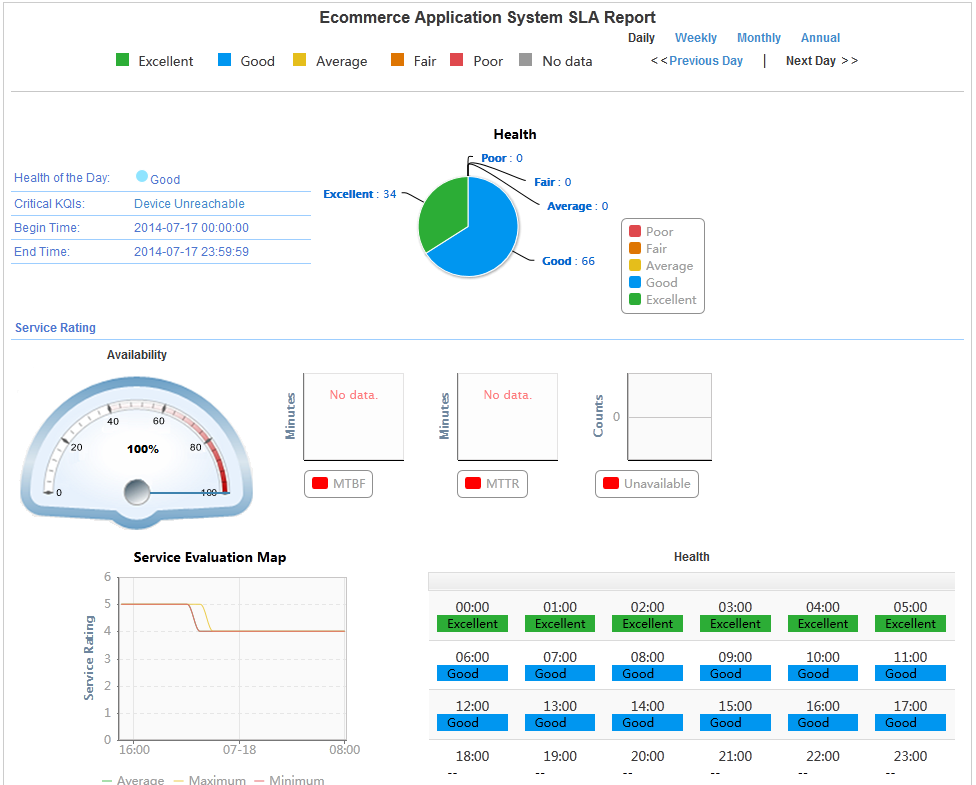
Service Health Manager (SHM) provides a solution to ensure the network service quality. It monitors network services in real time and enables you to quickly locate network failures.
SLA
Service Level Agreement (SLA) evaluates the service health based on the service availability, mean time to repair (MTTR), and mean time between failures (MTBF). It gets key performance indexes (KPIs) from the network quality analyzer (NQA) instance module and IMC components, such as Performance Management, Alarm Management, and network traffic analyzer (NTA).
Figure 1 SLA scheme
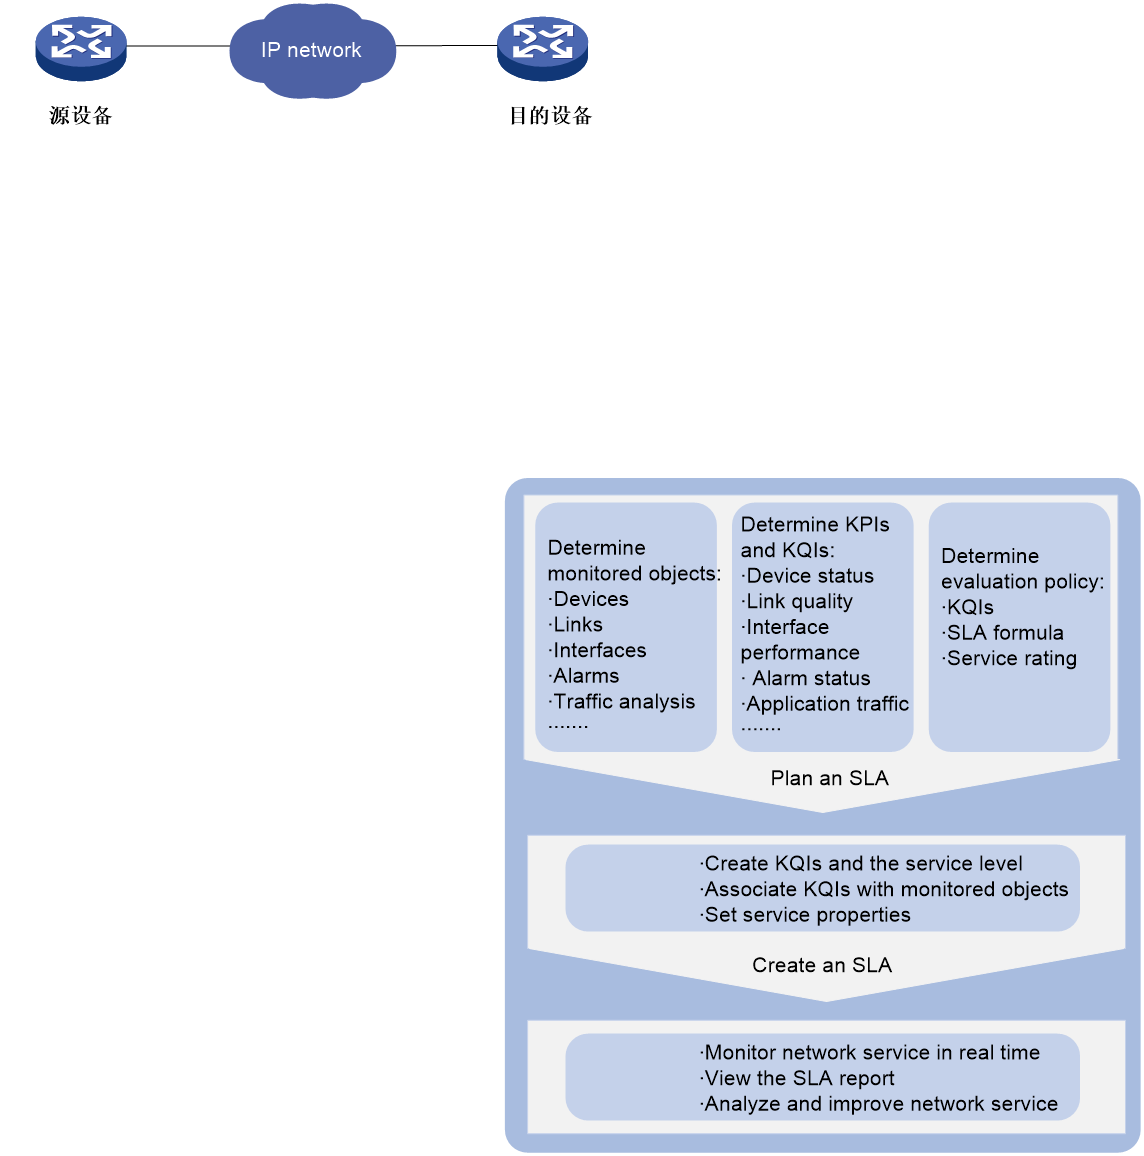
SHM provides access to the following modules that are used for creating an SLA:
· Key quality index—KQI includes one or multiple KPIs and provides KQIs for the SLA.
· Service level—Defines the service level for the SLA.
· SLA—Associates KQIs and monitored objects and provides the service evaluation policy.
Understanding of the network topology and analysis for KPIs and KQIs are required for correct SLA service evaluation.
NQA
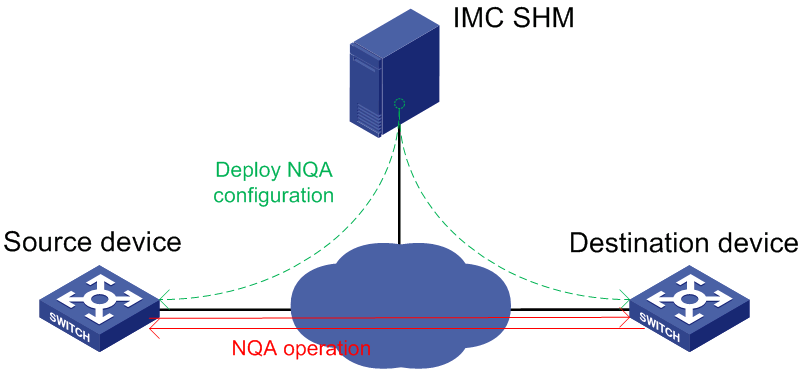
As shown in Figure 2, the source device (NQA client) initiates an NQA operation by sending probe packets to the destination device. The destination device responds to the NQA client by sending replies. The NQA client then calculates the operation result.
SHM provides access to the following NQA modules:
· NQA Config—Provides resources for creating NQA instances, such as NQA types and NQA levels.
· NQA Instance—Enables you to create and deploy NQA instances for link monitoring by selecting NQA devices and configuring monitor information.
· NQA topology—Displays the NQA devices and instances in topology, and provides basic NQA instance management function.
SHM periodically collects the NQA instance statistics for network performance analysis.
Path analysis
Path analysis detects path changes from a source to a destination. This function allows you to obtain, baseline, and poll paths from the source to the destination. If the polling result is not consistent with a baseline path, an alarm can be triggered. The alarm notification can be instantly delivered through email or SMS messages.
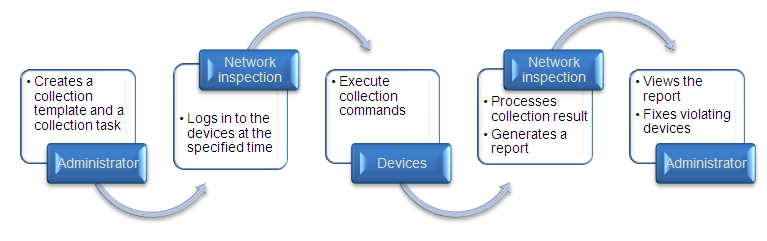
Network inspection
Network inspection provides a convenient method for you to examine status and basic configurations on a large number of devices.
Figure 3 Network inspection workflow
Quick start guide
The following information guides you quickly through the main functions of the SHM component.
Navigation menus
SHM provides a breadcrumb navigation menu and a navigation tree. This document describes accessing different modules from the navigation tree.
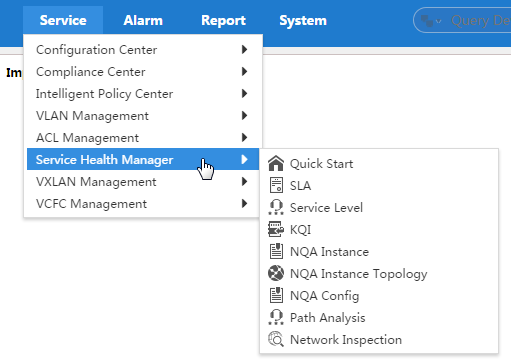
Breadcrumb navigation menu
As shown in Figure 4, the breadcrumb navigation menu has two levels. Hover the cursor over a menu option to display its submenus. For more information about each menu option's function, see Table 1.
Figure 4 SHM breadcrumb navigation menu
Navigation tree
Figure 5 shows the SHM navigation tree.
To access the SHM navigation tree:
1. Click the Service tab on the top navigation bar.
2. From the left navigation tree, click Service Health Manager.
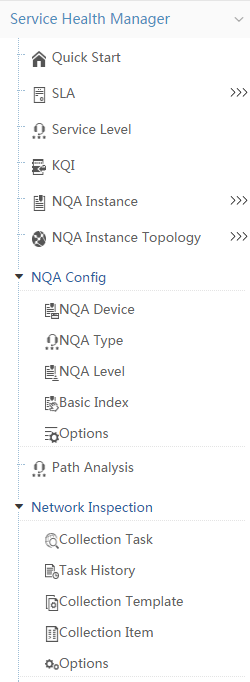
Table 1 SHM navigation menu options
|
Navigation menu option |
Task |
|
Quick Start |
View the general operation process for SHM and links to the configuration tasks. For more information about the SHM operation process, see Figure 6. |
|
SLA |
· Add, modify, and delete SLAs. · Start and stop the SLA. · Generate service health reports. |
|
Service Level |
Add, modify, and delete service levels. |
|
KQI |
· Add, modify, and delete KQIs. · Add, modify, and delete KQI classes. |
|
NQA Instance |
· Add, modify, and delete NQA instances. · Deploy NQA instances. · Generate NQA instance reports. · Add, modify, and delete NQA groups. |
|
NQA Instance Topology |
· View the NQA devices and instances topology. · Configure TCP or UDP listening ports. · Delete NQA devices and instances. |
|
NQA Config |
Navigate to the following NQA configuration pages: · NQA Device—Add or delete NQA devices, modify the enabling status of the NQA server or client, and configure TCP or UDP listening ports. · NQA Type—Add, modify, and delete NQA types, and display NQA reports. · NQA Level—Add, modify, and delete NQA levels. · Basic Index—Display basic indexes and modify parameters of the basic indexes. · Options—Configure an audit interval and the achieving rate state parameters. |
|
Path Analysis |
· Add, modify, and delete path analyses. · Poll paths. · View the latest polling result. |
|
Network Inspection |
Navigate to the following network inspection configuration pages: · Collection Task—Add, modify, and delete collection tasks, execute collection tasks, view the collection task history, and fix violating devices. · Task History—View the collection task history and download inspection reports. · Collection Template—Add, modify, and delete collection templates. · Collection Item—Add, modify, and delete collection items or groups of collection items. · Options—Specify templates for exporting the collection task history. |
Operation process
SHM uses SLAs to calculate and evaluate service availability and health condition. The SHM operation process is displayed on the Quick Start page.
To display the SHM operation process:
1. Click the Service tab.
2. From the navigation tree, select Service Health Manager > Quick Start.
Figure 6 SHM operation process
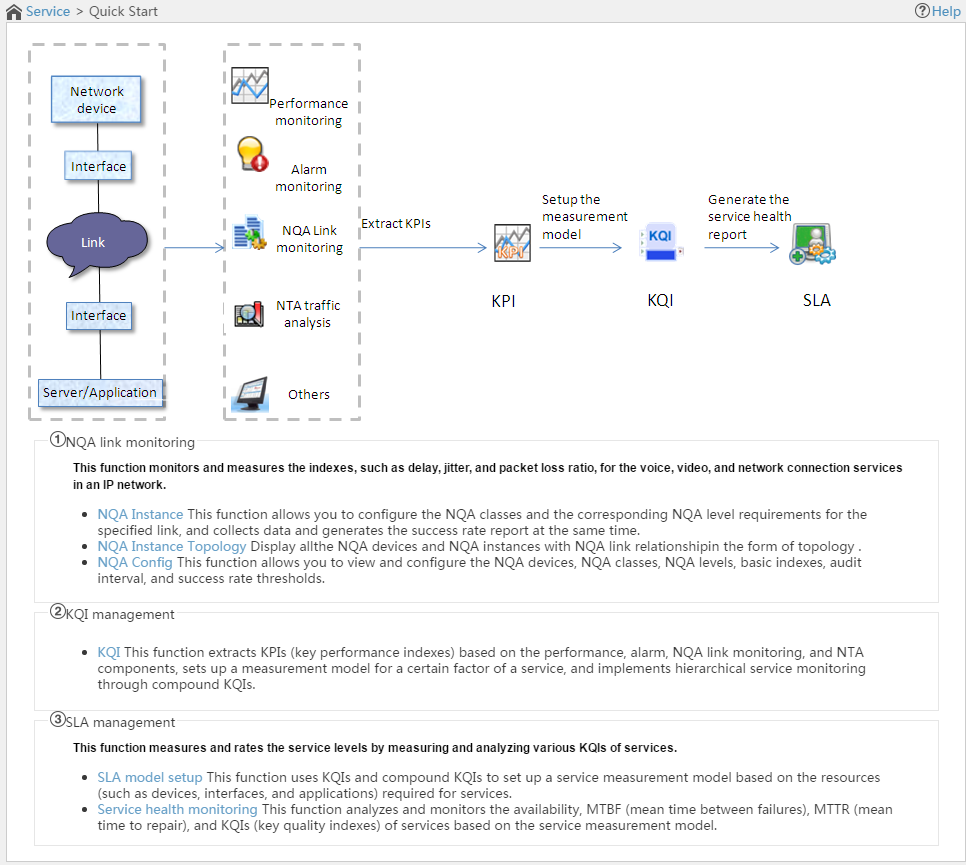
SHM provides the following functions:
· Service monitoring and evaluation—Uses the IMC Enterprise and Standard platform or service components to monitor network resources, and uses SLAs to evaluate the service health level.
· NQA link monitoring—Associates performance indexes with the monitored links by NQA instances. This function allows you to understand the network conditions and provides statistics for SLA evaluation.
· Network inspection—Examines basic configuration and operating status of network devices in batch, and fixes violating devices.
Common configuration procedures
Configuring NQA link monitoring
1. On the NQA Device page, perform the following tasks:
a. Add network devices that support both NQA and SNMP.
b. Configure the network devices. For example, you can enable the NQA client or the NQA server, or configure a TCP or UDP listening service.
2. On the NQA Type, NQA Level, and Basic Index pages, configure the parameters for the monitored link.
System-defined NQA types, NQA levels, and basic indexes are available and support modification. You can also create new NQA types and NQA levels.
3. On the Options page, specify an audit interval and the achieving rate state parameters.
Skip this step if you use the default settings.
4. On the NQA Instance page, add an NQA instance to associate the monitored link with monitored parameters, and deploy the NQA instance.
After the NQA instance has been deployed for a period, you can view the monitoring result in the NQA report. The available report types include detail report, comparison report, summary report, and achieving rate report.
Configuring an SLA
1. On the KQI page, configure KQIs.
To evaluate a service, you can use system-defined KQIs, or create new KQIs and define the KQI evaluation policy.
2. On the Service Level page, configure a service level.
Skip this step if you do not reference a service level for an SLA.
3. On the SLA page, create an SLA.
To create an SLA, select network resources, associate KQIs with the network resources, and configure the KQI and SLA evaluation policies.
After the SLA has run for a period, you can view the service availability and health condition on the SLA page, and examine the network performance.
Configuring network inspection
1. On the Collection Items and Collection Template pages, configure the collection items for the device to be monitored.
Collection items provide the commands for collecting device statistics. Collection templates specify the commands for each device model.
2. On the Collection Task page, create a collection task by specifying the monitored device and schedule type.
After the collection task is executed, you can view the inspection result and report on the Collection Task or Collection Task History page. The inspection report can be downloaded in HTML, Word, or PDF format.
For violating devices, you can use the fix function to fix their vulnerabilities.
Common operations
Navigating a list
If a list contains enough entries, use the following aids to navigate the list:
· Click ![]() to page forward
in the list.
to page forward
in the list.
· Click ![]() to page forward
to the end of the list.
to page forward
to the end of the list.
· Click ![]() to page backward
in the list.
to page backward
in the list.
· Click ![]() to page backward
to the front of the list.
to page backward
to the front of the list.
· Click a page number to display the page in the list. The list can display up to 10 page numbers.
· Select 8, 15, 50, 100, or 200 at the bottom of the list to configure how many items per page you want to display.
Figure 7 NQA level list
Sorting a list
You can sort a list by every field that
contains a Sort icon ![]() in
the column label.
in
the column label.
· When the list is sorted by a field in ascending
order, the column label of the selected field is blue and contains an Ascending icon ![]() .
.
· When the list is sorted by a field in descending
order, the column label of the selected field is blue and contains a Descending icon ![]() .
.
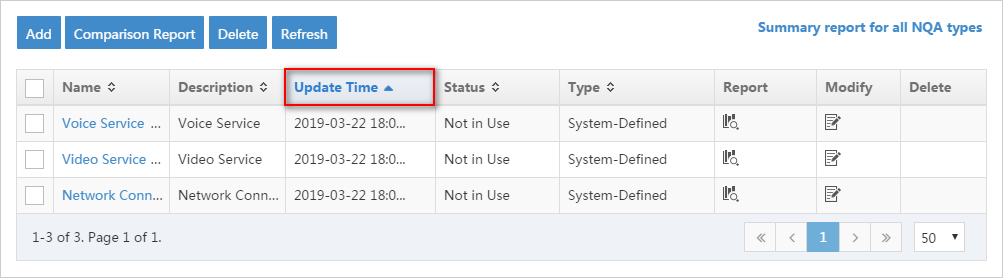
Figure 8 Summary report for all NQA types
Adding devices
You can add devices from the IMC Enterprise and Standard platform to SHM.
Accessing the window for selecting devices
You can access the window for selecting devices from the NQA Device page or SLA page. For information about the access method, see related chapters.
On the page for selecting devices, you can filter devices by view or advanced query.
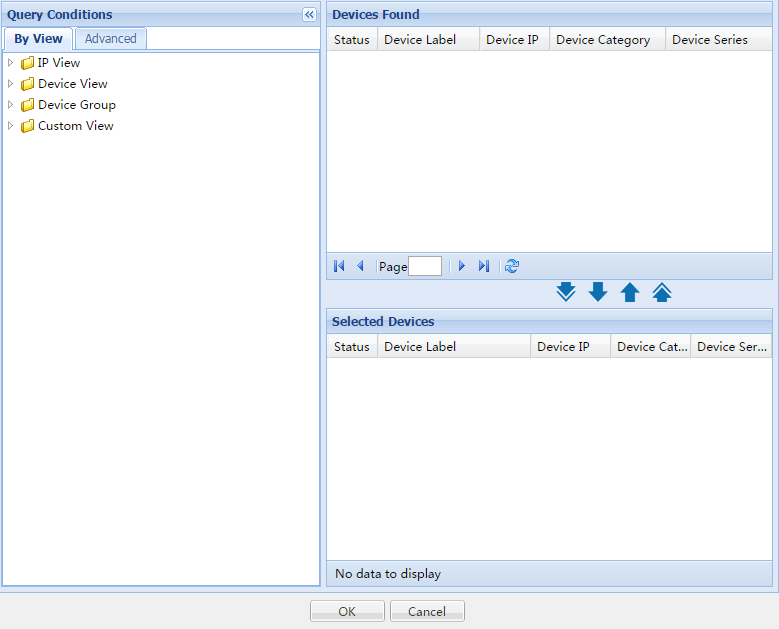
Figure 9 Selecting devices
Filtering devices by view
1. In the Query Conditions area, click the By View tab.
2. Click the Expand
icon ![]() to the left of the IP View, Device View, or Custom View
field, and then select a subview.
to the left of the IP View, Device View, or Custom View
field, and then select a subview.
The views are described as follows:
¡ IP View—Displays devices by network segment.
¡ Device View—Displays devices by device category.
¡ Custom View—Displays devices by custom view. The view has a subview named Devices Not In Views to display devices that do not belong to any custom view.
All devices in the subview are displayed in the Devices Found area.
Filtering devices by advanced query
1. In the Query Conditions area, click the Advanced tab.
2. Specify one or more of the following query criteria:
¡ Device IP—Enter a device IP address.
If Exact Query is selected, enter a complete IPv4 address. If Exact Query is not selected, enter a partial or complete IPv4 address.
¡ Device IP List—Click the Configuration icon ![]() next to the Device IP List field to
perform an exact query for multiple devices.
next to the Device IP List field to
perform an exact query for multiple devices.
In the Device IP List Configuration window, enter multiple IP addresses separated by commas, semicolons, or carriage returns, click Add, and click OK.
¡ Device Label—Enter a partial or complete device label.
¡ Device Status—Select a device state from the list: Unmanaged, Unknown, Normal, Warning, Minor, Major, or Critical.
¡ Device Category—Select a device type from the list: Routers, Switches, Servers, Security, Storage, Wireless, Voice, Surveillance, Video, Virtual Devices, Module, Application Controller, Printers, SDN Controller, UPS, Desktops, or Others.
¡ Device Series—Select a device series from the list. Options include all device series that are added to the IMC Enterprise and Standard platform.
¡ Contact—Enter partial or complete contact information for devices. The string is case insensitive.
¡ Location—Enter partial or complete location information for devices. The string is case insensitive.
¡ Device Reachability—Select a reachability state from the list: Reachable or Unreachable.
Empty fields are ignored.
3. Click Query.
All matching devices are displayed in the Devices Found area.
Selecting devices
1. Add devices to the Selected Devices area:
¡ To
add one or more devices, select the devices in the Devices
Found area and click the Add icon ![]() .
.
¡ To
add all devices, click the Add All icon ![]() .
.
2. Remove undesired devices from the Selected Devices area:
¡ To
remove one or more devices, select the devices in the Selected
Devices area and click the Remove icon ![]() .
.
¡ To
remove all devices, click the Remove All icon ![]() .
.
3. Click OK.
|
|
NOTE: · If less than two devices are found, the window
does not include the Add All icon · To select multiple devices, press Ctrl when you select the devices. |
Configuring NQA
The NQA Config page provides access to the following modules, which provide resources for creating and deploying NQA instances:
· NQA device—Provides NQA-capable devices for NQA instances.
· NQA type—Provides operation types for NQA instances.
· NQA level—Provides the threshold information of performance parameters.
· Basic index—Provides basic indexes for NQA types.
· Options—Provides audit and achieving rate status monitoring functions.
To access the NQA Config page:
1. Click the Service tab.
2. From the left navigation tree, click Service Health Manager > NQA Config.
Managing NQA devices
NQA devices are devices that support the NQA feature.
Viewing the NQA device list
1. Click the Service tab.
2. From the left navigation tree, click Service Health Manager > NQA Config > NQA Device.
The NQA Device page appears.
NQA device list contents
¡ Device Status—State of the NQA device. The value can be Unmanaged, Unknown, Normal, Warning, Minor, Major, or Critical.
¡ Device Name—Label of the NQA device. Click the NQA device name to view its details.
¡ Server Status—NQA server enabling state of the NQA device. The value can be Enabled or Disabled.
¡ Client Status—NQA client enabling state of the NQA device. The value can be Enabled or Disabled.
¡ Synchronization Status—Synchronization state of the NQA device. The value can be Succeeded or Synchronizing.
¡ Synchronization Time—Last time the synchronization was completed.
¡ Audit Status—NQA instance configuration audit state on the NQA device. The value can be Finished or Auditing.
¡ Audit Time—Last time the NQA instance configuration on the NQA device was audited.
¡ Non-Web Management Index Items—Number of non-Web configured NQA instances that are not imported to SHM from the NQA device. If the value of this field is not zero, click this link of the NQA device to view its non-Web configured NQA instances. You can import these NQA instances to SHM. For more information, see "Importing non-Web configured NQA instances."
¡ Modify—This column contains the following icons:
- Modify Enable status—Click the Modify Enable
Status icon ![]() to modify the NQA server or client
enabling state of the NQA device. For more information,
see "Modifying the NQA server or client
enabling state."
to modify the NQA server or client
enabling state of the NQA device. For more information,
see "Modifying the NQA server or client
enabling state."
- Modify TCP Configuration—Click the Modify TCP Configuration icon
![]() to modify
the TCP listening service on the NQA device. For more information, see "Modifying TCP listening services."
to modify
the TCP listening service on the NQA device. For more information, see "Modifying TCP listening services."
- Modify UDP Configuration—Click the Modify UDP Configuration icon
![]() to
modify the UDP listening service on the NQA device. For more information, see
"Modifying UDP listening services."
to
modify the UDP listening service on the NQA device. For more information, see
"Modifying UDP listening services."
- Delete Non-Web Management Base Index Items—Click the Delete Non-Web Management Base Index Items icon ![]() to delete non-Web configured NQA instances on the NQA device. For more information,
see "Deleting non-Web configured NQA
instances."
to delete non-Web configured NQA instances on the NQA device. For more information,
see "Deleting non-Web configured NQA
instances."
¡ Delete—Click the Delete icon ![]() to delete the NQA device. For more information, see "Deleting NQA devices."
to delete the NQA device. For more information, see "Deleting NQA devices."
Querying NQA devices
1. Access the NQA device list page.
2. In the Query area, enter a partial or complete NQA device name in the Name field.
This field supports fuzzy matching.
3. Click Query.
All matching NQA devices are displayed in the NQA device list.
Click Reset to set the query criteria to default and display all NQA devices in the NQA device list.
Importing NQA devices
Only devices that support both SNMP and NQA can be imported.
To import NQA devices:
1. Access the NQA device list page.
2. Click Import.
The page for importing devices appears.
3. Click Select Device, and select NQA devices.
The selected devices appear in the Imported Device List.
To delete an unwanted NQA device, click
the Delete icon ![]() for the device.
for the device.
4. Click OK.
Modifying device configuration
Modify the following configuration on NQA devices in compliance with the requirements described in Table 4.
When you modify TCP or UDP listening services, follow these restrictions and guidelines:
· The TCP or UDP server address must be the IP address of an interface on the NQA server.
· Multiple TCP or UDP listening services can be configured on an NQA device. You cannot delete listening services that are used by NQA instances.
· If the NQA device is VRF-aware, you can modify the VRF name for a TCP or UDP listening service.
Modifying the NQA server or client enabling state
1. Access the NQA device list page.
2. In the Modify
column, click the Modify Enable Status icon ![]() for the NQA
device you want to modify.
for the NQA
device you want to modify.
The page for modifying the NQA server or client enabling state appears.
3. In the Authentication Client Configuration area, modify the following parameters:
¡ Server Status—Select whether to enable the NQA server.
¡ Client Status—Select whether to enable the NQA client.
4. Click OK.
Modifying TCP listening services
1. Access the NQA device list page.
2. In the Modify
column, click the Modify TCP Configuration icon ![]() for the NQA
device whose TCP listening services you want to modify.
for the NQA
device whose TCP listening services you want to modify.
The page for modifying TCP listening services appears.
3. Modify the TCP listening service as follows:
¡ To add a TCP listening service, click Add. Enter a TCP server address and a port number in the TCP Server Address and TCP Server Port fields, respectively, and then click OK.
¡ To
delete a TCP listening service, click the Delete icon
![]() for the
TCP listening service.
for the
TCP listening service.
¡ To bulk delete TCP listening services, select the services, and click Delete.
Modifying UDP listening services
1. Access the NQA device list page.
2. In the Modify
column, click the Modify UDP Configuration icon ![]() for the NQA
device whose UDP listening services you want to modify.
for the NQA
device whose UDP listening services you want to modify.
The page for modifying UDP listening services appears.
3. Modify the UDP listening service as follows:
¡ To add a UDP listening service, click Add. Enter a UDP server address and a port number in the UDP Server Address and UDP Server Port fields, respectively, and then click OK.
¡ To
delete a UDP listening service, click the Delete icon
![]() for the
UDP listening service.
for the
UDP listening service.
¡ To bulk delete UDP listening services, select the services, and click Delete.
Deleting non-Web configured NQA instances
1. Access the NQA device list page.
2. In the Modify
column, click the Delete Non-Web Management Base Index
Items icon ![]() for the NQA device whose non-Web configured NQA instances you want
to delete.
for the NQA device whose non-Web configured NQA instances you want
to delete.
A confirmation dialogue box appears.
3. Click OK.
The non-Web configured NQA instances are deleted on the NQA device. The Non-Web Management Index Items field displays 0.
Deleting NQA devices
You cannot delete NQA devices that are referenced by NQA instances.
Deleting an NQA device
1. Access the NQA device list page.
2. Click the Delete
icon ![]() for the
device you want to delete.
for the
device you want to delete.
The Delete icon ![]() does not appear
for NQA devices that are referenced by NQA instances.
does not appear
for NQA devices that are referenced by NQA instances.
A confirmation dialog box appears.
3. Click OK.
Bulk deleting NQA devices
1. Access the NQA device list page.
2. Select one or multiple NQA devices you want to delete, and click Delete.
A confirmation dialog box appears.
3. Click OK.
Auditing NQA instance configurations
The audit function examines whether NQA instance configurations are consistent on both SHM and NQA devices.
To audit NQA instance configurations on all NQA devices:
1. Access the NQA device list page.
2. Click Audit All.
The following items will be refreshed:
¡ Audit status, audit time, and the non-Web management index items in the NQA device list.
¡ Audit status, audit time, and audit result in the NQA instance list.
Importing non-Web configured NQA instances
You can import non-Web configured NQA instances from the Non-Web Management Base Index Items List. SHM filters the following non-Web configured NQA instances out from the list:
· NQA instances without specified source and destination IP addresses.
· NQA instances (except DHCP-type instances) with no basic indexes or incomplete basic index settings.
To import non-Web configured NQA instances:
1. Access the NQA device list page.
2. Click the non-zero link of the Non-Web Management Index Items for the NQA device.
3. Select an NQA instance you want to import from the Non-Web Management Base Index Items List.
4. In the Basic Information area, configure the following parameters for the NQA instance:
¡ Name—Enter a name of the NQA instance.
¡ NQA Level Name—Select an NQA level for the NQA instance.
¡ NQA Type Name—Select an NQA type for the NQA instance. If no NQA type is available for this NQA instance, create an NQA type. For more information, see "Adding an NQA type."
¡ Group—Select an NQA group for the NQA instance. If no option is available for this NQA instance, create an NQA group. For more information, see "Adding an NQA group."
5. Click OK.
The system refreshes the value of the Non-Web Management Index Items field for the NQA device. The imported NQA instance is added to the NQA instance list.
Managing NQA types
NQA types provide operation types for NQA instances by referencing one or multiple basic indexes.
Viewing the NQA type list
1. Click the Service tab.
2. From the left navigation tree, click Service Health Manager > NQA Config > NQA Type.
The NQA Type page appears.
NQA type list contents
¡ Name—Name of the NQA type. Click the name of the NQA type to view its details.
¡ Description—Description of the NQA type.
¡ Update Time—Last time the NQA type was added or modified.
¡ Status—Whether the NQA type is being used by an NQA instance. The value can be Not in Use or Used.
¡ Type—How the NQA type is defined. The value can be User-Defined or System-Defined.
¡ Report—Click the Report icon ![]() to view the achieving rate report of all NQA instances that
reference the NQA type. For more information, see
"Viewing NQA type reports."
to view the achieving rate report of all NQA instances that
reference the NQA type. For more information, see
"Viewing NQA type reports."
¡ Modify—Click the Modify icon ![]() to modify the NQA type. For more information, see "Modifying an NQA type."
to modify the NQA type. For more information, see "Modifying an NQA type."
¡ Delete—Click the Delete icon ![]() to delete the NQA type. For more information, see "Deleting NQA types."
to delete the NQA type. For more information, see "Deleting NQA types."
Querying NQA types
1. Access the NQA type list page.
2. In the Query area, enter a partial or complete NQA type name in the Name field.
This field supports fuzzy matching.
3. Click Query.
All matching NQA types are displayed in the NQA type list.
Click Reset to set the query criteria to default and display all NQA types in the NQA type list.
Viewing NQA type details
1. Access the NQA type list page.
2. Click the name of the NQA type whose detailed information you want to view.
The page that displays the NQA type details appears.
¡ Basic Information
- Name—Name of the NQA type.
- NQA Type Description—Description of the NQA type.
¡ Basic Index Information
- Basic Index Name—Name of the basic index. Click the name of the basic index to view its details.
- Description—Description of the basic index. It describes the function of the basic index.
- Index Group—Group to which the basic index belongs.
Adding an NQA type
In addition to the system-defined video service, network connection service, and voice service, you can add an NQA type by referencing the basic indexes descried in Table 3.
To add an NQA type:
1. Access the NQA type list page.
2. Click Add.
The page for adding an NQA type appears.
3. In the Basic Information area, configure basic information for the NQA type as follows:
¡ Name—Enter a unique NQA name.
¡ NQA Type Description—Enter a description for the NQA type.
4. In the Basic Index Information area, configure basic indexes for the NQA type as follows:
¡ To add basic indexes, click Add. Select one or more basic indexes that are in the same index group, and click OK. The added basic indexes are displayed in the basic index list with their default settings.
¡ To
modify the settings of a basic index, click the Modify
icon ![]() for the
basic index.
for the
basic index.
¡ To delete
a basic index, click the Delete icon ![]() for the basic index. To delete all basic
indexes, click Delete All.
for the basic index. To delete all basic
indexes, click Delete All.
5. Click OK.
Modifying an NQA type
You cannot modify NQA types that are being referenced by NQA instances.
To modify an NQA type:
1. Access the NQA type list page.
2. Click the Modify
icon ![]() for the
NQA type you want to modify.
for the
NQA type you want to modify.
The page for modifying the NQA type appears.
3. Modify the NQA type as described in "Adding an NQA type."
The NQA type name cannot be modified.
4. Click OK.
Deleting NQA types
You cannot delete NQA types that are system defined or are being referenced by NQA instances.
Deleting an NQA type
1. Access the NQA type list page.
2. Click the Delete
icon ![]() for the
NQA type you want to delete.
for the
NQA type you want to delete.
The Delete icon ![]() does not appear
for NQA types that are system defined
or are being referenced by NQA instances.
does not appear
for NQA types that are system defined
or are being referenced by NQA instances.
A confirmation dialog box appears.
3. Click OK.
Bulk deleting NQA types
1. Access the NQA type list page.
2. Select one or multiple NQA types you want to delete, and click Delete.
A confirmation dialog box appears.
3. Click OK.
Viewing NQA type reports
An NQA type report displays the summary achieving rate of all NQA instances that use this NQA type.
Viewing the detail report
1. Access the NQA type list page.
2. Click the Report
icon ![]() of the
NQA type.
of the
NQA type.
Viewing the comparison report
1. Access the NQA type list page.
2. Select two or multiple NQA types, and click Comparison Report.
Viewing the summary report for all NQA types
1. Access the NQA type list page.
2. Click Summary Report for all NQA types.
NQA type report layout
All NQA type reports have the same layout. This section uses a detail report as an example.
Figure 10 A detail report for an NQA type
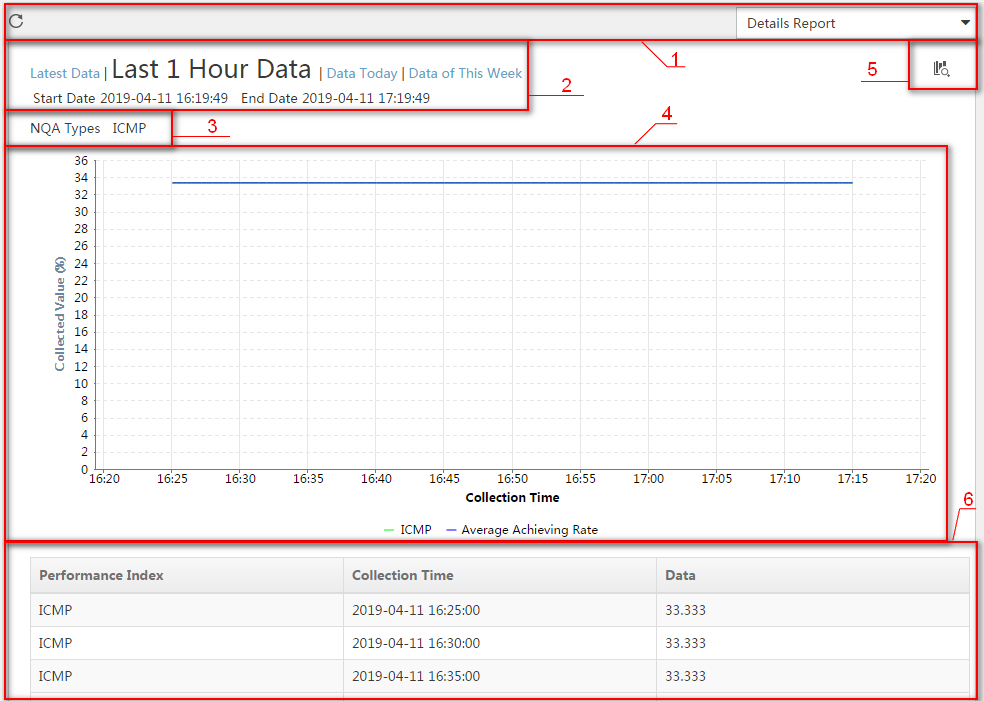
Table 2 Description of the detail report fields
|
No. |
Description |
|
1 |
The area provides the following operations: · Click the Refresh
icon · Select the report type you want to view. Options are Details Report, Daily Report, and Monthly Report. |
|
2 |
Click a time range for statistics collection. Options vary by report type. In this example, you can select Latest Data, Last 1 Hour Data, Data Today, or Data of This Week. The selected time range is displayed at the bottom of this area. |
|
3 |
NQA type name. |
|
4 |
The trend graph shows the changes of the summary achieving rate of all NQA instances that use the NQA type over the collection time in a line chart. |
|
5 |
Click the Report icon |
|
6 |
Achieving rate table displays the summary achieving rate of all NQA instances that uses the NQA type in each collection time. |
Managing NQA levels
NQA levels provide threshold information for NQA instances. If the NQA operation result of an NQA instance reaches or exceeds the specified threshold, the system generates alarms based on the alarm policy.
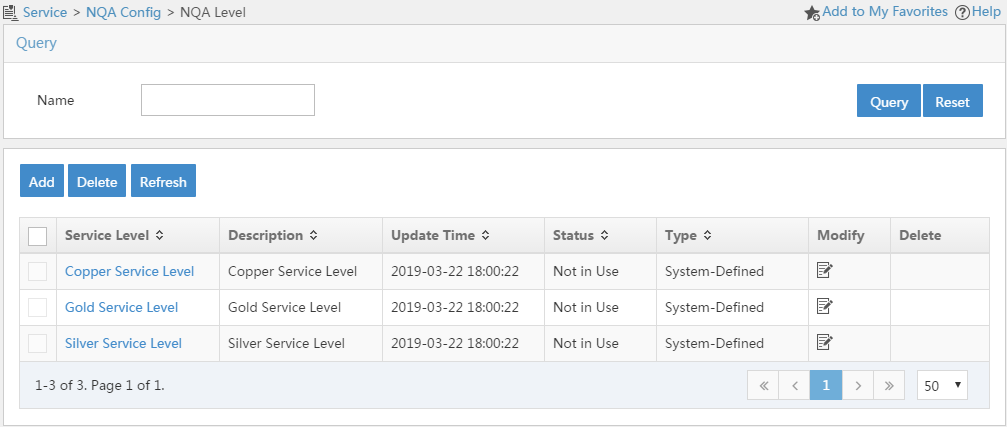
Viewing the NQA level list
1. Click the Service tab.
2. From the left navigation tree, click Service Health Manager > NQA Config > NQA Level.
The NQA Level page appears.
NQA level list contents
¡ Service Level—Name of the NQA level.
¡ Description—Description of the NQA level.
¡ Update Time—Last time the NQA level was added or modified.
¡ Status—Whether the NQA level is being used by an NQA instance. The value can be Used or Not in Use.
¡ Type—How the NQA level is defined. The value can be System-Defined or User-Defined.
¡ Modify—Click the Modify icon ![]() to modify the NQA level. For more information, see "Modifying an NQA level."
to modify the NQA level. For more information, see "Modifying an NQA level."
¡ Delete—Click the Delete icon ![]() to delete the NQA level. For more information, see "Deleting NQA levels."
to delete the NQA level. For more information, see "Deleting NQA levels."
Querying NQA levels
1. Access the NQA level list page.
2. In the Query area, enter a partial or complete NQA level name in the Name field.
This field supports fuzzy matching.
3. Click Query.
All matching NQA levels are displayed in the NQA level list.
Click Reset to set the query criteria to default and display all NQA levels in the NQA level list.
Viewing NQA level details
1. Access the NQA level list page.
2. Click the name of the NQA level whose detailed information you want to view.
The page that displays the NQA level details appears.
Detailed information includes:
¡ Service Level Name—Name of the NQA level.
¡ Service Level Description—Description of the NQA level.
¡ Service Level Threshold Information—Threshold information of the NQA level.
Adding an NQA level
1. Access the NQA level list page.
2. Click Add.
The page for adding an NQA level appears.
3. Configure the following parameters:
¡ In the Basic Information area, enter an NQA level name and description in the Service Level Name and Service Level Description fields, respectively.
¡ In the Threshold Information area, select threshold names and enter values.
4. Click OK.
Modifying an NQA level
You cannot modify NQA levels that are being referenced by NQA instances.
To modify an NQA level:
1. Access the NQA level list page.
2. Click the Modify
icon ![]() for the
NQA level you want to modify.
for the
NQA level you want to modify.
The page for modifying the NQA level appears.
3. Modify the following parameters:
¡ In the Basic Information area, modify the NQA level description in the Service Level Description field.
The NQA level name cannot be modified.
¡ In the Threshold Information area, select names of the thresholds you want to modify and enter values.
To restore the default settings of the system-defined NQA level, click Restore.
4. Click OK.
Deleting NQA levels
You can delete only user-defined NQA levels that are not referenced by NQA instances.
Deleting an NQA level
1. Access the NQA level list page.
2. Click the Delete
icon ![]() for the
NQA level you want to delete.
for the
NQA level you want to delete.
The Delete icon ![]() does not appear
for the NQA levels that are system defined or are being referenced by NQA instances.
does not appear
for the NQA levels that are system defined or are being referenced by NQA instances.
A confirmation dialog box appears.
3. Click OK.
Bulk deleting NQA levels
1. Access the NQA level list page.
2. Select one or multiple NQA levels you want to delete, and click Delete.
A confirmation dialog box appears.
3. Click OK.
Managing basic indexes
Basic indexes provide basic performance parameters for NQA instances. You can use default settings of a basic index or modify its settings.
Table 3 Functions and default settings of basic indexes
|
Basic index |
Index group |
Function |
Default settings |
|
HW UDP echo |
HW |
Measures the round-trip time between the NQA client (HW device) and a UDP port on the NQA server |
· Service type: 10 · Packet lifetime (in milliseconds): 10 · Packet size (in bytes): 100 · String to be filled in the payload of each probe packet: aaa · Source port: 1000 · Destination port: 1000 |
|
HW TCP connection |
HW |
Measures the time for the NQA client (HW device) to establish a TCP connection to a port on the NQA server |
· Service type: 10 · Packet lifetime (in milliseconds): 10 · Destination port: 1000 |
|
H3C UDP echo |
H3C |
Measures the round-trip time between the NQA client (H3C device) and a UDP port on the NQA server |
· Service type: 10 · Packet lifetime (in milliseconds): 10 · Packet size (in bytes): 100 · String to be filled in the payload of each probe packet: aaa · Source port: 1000 · Destination port: 1000 |
|
H3C TCP connection |
H3C |
Measures the time for the NQA client (H3C device) to establish a TCP connection to a port on the NQA server |
· Service type: 10 · Packet lifetime (in milliseconds): 10 · Destination port: 1000 |
|
Cisco UDP echo |
Cisco |
Measures the round-trip time between the NQA client (Cisco device) and a UDP port on the NQA server |
· Service type: 10 · Destination port: 1000 |
|
Cisco TCP connection |
Cisco |
Measures the time for the NQA client (Cisco device) to establish a TCP connection to a port on the NQA server |
· Service type: 10 · Destination port: 1000 |
|
ICMP echo |
Basic |
Measures the reachability of a destination IP address |
· Service type: 10 · Packet lifetime (in milliseconds): 10 · Packet size (in bytes): 100 · String to be filled in the payload of each probe packet: aaa |
|
UDP echo |
Basic |
Measures the round-trip time between the NQA client and a UDP port on the NQA server |
· Service type: 10 · Packet lifetime (in milliseconds): 10 · Packet size (in bytes): 100 · String to be filled in the payload of each probe packet: aaa · Source port: 1000 · Destination port: 7 |
|
TCP connection |
Basic |
Measures the time for the NQA client to establish a TCP connection to a port on the NQA server |
· Service type: 10 · Packet lifetime (in milliseconds): 10 · Destination port: 7 |
|
HTTP |
Advanced |
Measures the time for the NQA client to obtain data from an HTTP server |
· Service type: 10 · Packet lifetime (in milliseconds): 10 · HTTP operation type: Get · URL of the HTTP server: http://127.0.0.1 |
|
DLSw |
Advanced |
Measures the response time of a DLSw device |
· Service type: 10 · Packet lifetime (in milliseconds): 10 |
|
DHCP |
Advanced |
Tests whether the DHCP server can respond to client requests, and measure the time for the NQA client to get an IP address from the DHCP server |
No configurable parameters exist. |
|
FTP |
Advanced |
Measures the time for the NQA client to transfer a file to, or download a file from an FTP server |
· Service type: 10 · Packet lifetime (in milliseconds): 10 · FTP operation type: Get · FTP login username: anonymous · FTP file name: ftp://test.txt · FTP login password: 123456 |
|
UDP jitter |
Advanced |
Measures unidirectional and bidirectional jitters to verify whether the network can carry jitter-sensitive services such as real-time voice and video services |
· Service type: 10 · Packet lifetime (in milliseconds): 10 · Packet size (in bytes): 100 · String to be filled in the payload of each probe packet: aaa · Source port: 1000 · Destination port: 1000 · Number of probe packets sent in each jitter operation: 10 |
|
Voice |
Advanced |
Measures VoIP network performance based on the ICPIF and MOS values |
· Service type: 10 · Packet lifetime (in milliseconds): 10 · Packet size (in bytes): 100 · String to be filled in the payload of each probe packet: aaa · Source port: 1000 · Destination port: 1000 · Number of probe packets sent in each voice operation: 10 |
Table 4 Configuration requirements of the basic indexes
|
Basic indexes |
Whether the NQA client is required |
Whether the NQA server is required |
Whether the TCP listening port is required |
Whether the UDP listening port is required |
|
UDP echo or H3C/HW/Cisco UDP echo |
Yes |
Yes |
No |
Yes |
|
TCP connection or H3C/HW/Cisco TCP connection |
Yes |
Yes |
Yes |
No |
|
ICMP echo |
Yes |
No |
No |
No |
|
HTTP |
Yes |
No |
No |
No |
|
DLSw |
Yes |
No |
No |
No |
|
DHCP |
Yes |
No |
No |
No |
|
FTP |
Yes |
No |
No |
No |
|
UDP jitter |
Yes |
Yes |
No |
Yes |
|
Voice |
Yes |
Yes |
No |
Yes |
Viewing the basic index list
1. Click the Service tab.
2. From the left navigation tree, click Service Health Manager > NQA Config > Basic Index.
The Basic Index page appears.
Basic index list contents
¡ Name—Name of the basic index. Click the name of the basic index to view its parameter configuration.
¡ Description—Description of the basic index. It describes the function of the basic index.
¡ Index Group—Index group to which the basic index belongs. The value can be Cisco, H3C, HW, Advanced, or Basic.
¡ Modify—Click the Modify icon ![]() to modify the basic index. For more information, see "Modifying a basic index."
to modify the basic index. For more information, see "Modifying a basic index."
Querying basic indexes
1. Access the basic index list page.
2. In the Query area, specify one or more of the following query criteria:
¡ Name—Enter a partial or complete basic index name.
This field supports fuzzy matching.
¡ Index Group—Select an index group.
Empty fields are ignored.
3. Click Query.
All matching basic indexes are displayed in the basic index list.
Click Reset to set the query criteria to default and display all basic indexes in the basic index list.
Modifying a basic index
1. Access the basic index list page.
2. Click the Modify
icon ![]() for the
basic index you want to modify.
for the
basic index you want to modify.
The page for modifying the basic index appears.
3. Modify parameters of the basic index.
To restore the default settings of the basic index, click Restore.
4. Click OK.
Managing options
The Options page allows you to configure optional parameters (audit interval and achieving rate) for NQA operations.
To configure the optional parameters for NQA operations:
1. Click the Service tab.
2. From the left navigation tree, click Service Health Manager > NQA Config > Options.
The Options page appears.
3. In the Audit area, enter an audit interval in the Audit Interval (hours) field. The default value is 24 hours.
4. In the Achieving Rate State area, configure the following parameters:
¡ Start Achieving Rate Check—Select this option to enable the achieving rate test function.
¡ Level-1 Threshold—Set the level-1 threshold of the achieving rate. The default value is 60.
¡ Level-2 Threshold—Set the level-2 threshold of the achieving rate. The default value is 80.
When you enable the achieving rate test function, the achieving rate state is identified by color and displayed in the Achieving Rate field of the NQA instance list:
- Green—Normal state. The achieving rate value is greater than level-2 threshold.
- Yellow—Warning state. The achieving rate value is between level-1 threshold and level-2 threshold, or is level-2 threshold.
- Red—Critical state. The achieving rate value is less than or equal to level-1 threshold.
5. Click OK.
Managing NQA instances
The following information describes how to create and deploy the NQA instance for a link, and view the link monitoring result.
Managing NQA instances
An NQA instance is a set of operation parameters, such as the operation type, destination IP address, and destination port number. When you deploy an NQA instance, SHM deploys the NQA instance configuration to NQA devices.
Viewing the NQA instance list
1. Click the Service tab.
2. From the left navigation tree, click Service Health Manager > NQA Instance.
The NQA instance list page appears. This page has two tabs: All Instances and NQA Groups. To enter the NQA group list page, click the NQA Groups tab.
NQA instance list contents
¡ NQA Instance Name—Name of the NQA instance.
¡ NQA Group—Group to which the NQA instance belongs. All instances in an NQA group require the same access right.
¡ Service Type Name—Name of the NQA type that is referenced by the NQA instance. An NQA type is a set of basic indexes.
¡ NQA Level—Service level of the NQA instance. An NQA level defines a set of threshold specifications.
¡ Number of Alarms—Number of alarms generated by the NQA instance.
¡ Deployment Status—Whether the NQA instance has been successfully deployed.
¡ Instance Start Time—Time when the NQA instance started.
¡ Achieving Rate—Rate of the operation results below the threshold specifications. You can click the achieving rate for the NQA instance to view its achieving rate report. If the achieving rate fails to be generated, this field displays a hyphen (-). If you enable the achieving rate test function, the achieving rate state is identified by color and displayed in this field:
- Green—Normal state.
- Yellow—Warning state.
- Red—Critical state.
¡ Audit Status—State of the progress to audit the NQA instance configuration on the NQA device. The value can be Finished or Auditing.
¡ Audit Time—Last time the NQA instance configuration on the NQA device was audited.
¡ Audit Result—NQA instance audit result:
- Identical is displayed if the NQA instance configuration is consistent on both the SHM and the NQA device.
- Different is displayed if the NQA instance configuration is inconsistent on both the SHM and the NQA device. Click Different to view the NQA instance configuration difference between the SHM and the NQA device.
¡ Task Status—State of the NQA
instance, ![]() Stop,
Stop, ![]() Start, or
Start, or ![]() Restore. This
column also provides the following operations:
Restore. This
column also provides the following operations:
- Click Stop to start the NQA instance.
- Click Start to stop the NQA instance.
- Click Restore to redeploy the NQA instance configuration. This operation is available when Failed is displayed in the Deployment Status column.
¡ Operation—This column contains the following icons:
- Report—Click the Report icon ![]() to display the
detail report for the NQA
instance. For more information about the detail report, see "NQA instance reports."
to display the
detail report for the NQA
instance. For more information about the detail report, see "NQA instance reports."
- Copy—Click the Copy icon ![]() to copy the NQA instance. For more information, see "Copying an NQA instance."
to copy the NQA instance. For more information, see "Copying an NQA instance."
- Modify—Click the Modify icon ![]() to modify the NQA instance. For more information, see
"Modifying an NQA instance." This icon does not appear for a running NQA instance.
to modify the NQA instance. For more information, see
"Modifying an NQA instance." This icon does not appear for a running NQA instance.
- Delete—Click the Delete icon ![]() to delete the NQA instance. For more information, see
"Deleting NQA instances." This icon does not appear for a running NQA instance.
to delete the NQA instance. For more information, see
"Deleting NQA instances." This icon does not appear for a running NQA instance.
- Restore Configuration—Click the Restore Configuration icon ![]() to redeploy the
NQA instance configuration. This operation is available when Different is
displayed in Audit Result.
to redeploy the
NQA instance configuration. This operation is available when Different is
displayed in Audit Result.
Querying NQA instances
1. Access the NQA instance list page.
2. In the query area, specify one or more of the following query criteria:
¡ Instance Name—Enter a partial or complete NQA instance name.
This field supports fuzzy matching.
¡ NQA Type Name—Select the NQA type of an NQA instance.
¡ NQA Level—Select the NQA level of an NQA instance.
¡ Audit Result—Select the audit result of an NQA instance. Options are All, Identical, and Different.
Empty fields are ignored.
3. Click Query.
All matching NQA instances are displayed in the NQA instance list.
Click Reset to set the query criteria to default and display all NQA instances in the NQA instance list.
Viewing NQA instance details
The section describes the commonly used methods to view NQA instance details.
Method 1
1. Access the NQA instance list page.
2. In the NQA instance list, click the name of the NQA instance whose detailed information you want to view.
Method 2
1. Access the NQA instance list page.
2. In the NQA instance list, click the NQA group for the NQA instance whose detailed information you want to view.
The page for the NQA group appears. All instances in this NQA group are displayed in the list.
3. Click the name of the NQA instance whose detailed information you want to view.
Method 3
1. Click the Service tab.
2. From the left navigation tree, click Service Health Manager > NQA Instance Topology.
The NQA Instance Topology page appears.
3. Right-click the link on the topology of the NQA instance whose detailed information you want to view.
4. Select View NQA Instance Details from the shortcut menu.
NQA instance details
· NQA Instance Name—Name of the NQA instance.
· NQA Instance Description—Description of the NQA instance.
· NQA Level Name—NQA level of the NQA instance.
· NQA Type Name—NQA type of the NQA instance.
· Execution Start Date—Start date of the NQA instance.
· Execution End Date—End date of the NQA instance.
· Collection Start Time—Start time of the NQA instance.
· Collection End Time—End time of the NQA instance.
· Alarm Policy—Alarm policy of the NQA instance.
· NQA Instance Execution Period(min)—Interval at which the NQA instance runs.
· Execution Date(week)—Date when the NQA instance runs per week.
· Source Device Name—Name of the device that initiates the NQA operation.
· Destination Device Name—Name of the device that processes the NQA probe packets.
· Source IP Address—IP address of the device that initiates the NQA operation.
· Destination IP Address—IP address of the device that processes the NQA probe packets.
· Source Port—Interface to send the NQA probe packets.
· VRF Name—Name of the VRF for the ICMP operation.
· Timeout(s)—Probe timeout time in the NQA operation.
· Test Times—Probe times in each NQA operation.
· Configuring Routing Table Bypass—Whether the routing table bypass function is enabled.
Creating an NQA instance
You can add or copy NQA instances to create new NQA instances.
Adding an NQA instance
1. Access the NQA instance list page.
2. In the NQA instance list, click Add Instance.
The page for adding an NQA instance appears.
Figure 11 Configuring basic parameters for an NQA instance
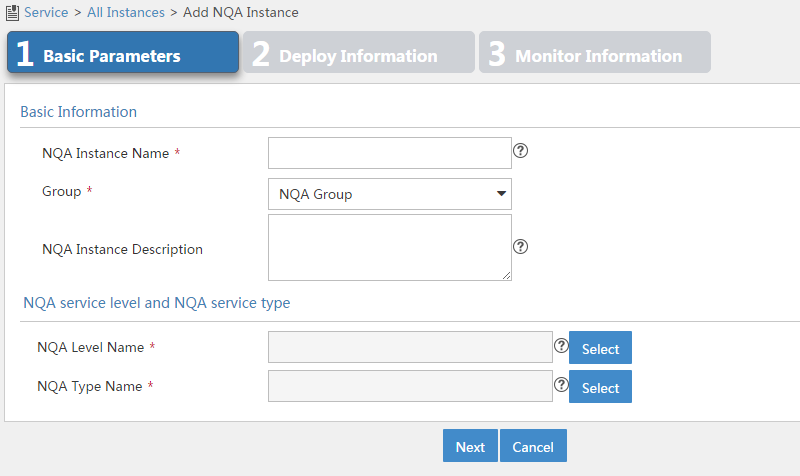
3. Configure basic parameters as follows:
¡ NQA Instance Name—Enter a name for the NQA instance.
¡ Group—Select a group to which the NQA instance belongs. If no options are available, return to the NQA group list page and create an NQA group for the NQA instance. For more information, see "Adding an NQA group."
¡ NQA Instance Description—Enter a description for the NQA instance.
¡ NQA Level Name—Select an NQA level for the NQA instance.
¡ NQA Type Name—Select an NQA type for the NQA instance.
4. Click Next.
The page shown in Figure 12 appears.
Figure 12 Configuring deployment information
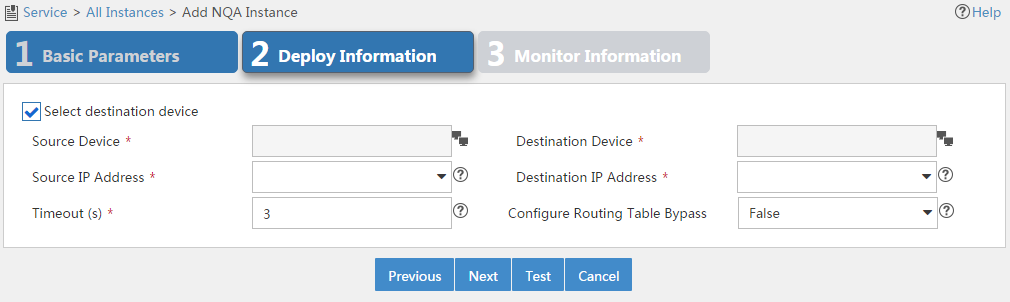
5. Configure the following parameters:
¡ Select Destination Device—Select this option for operations that require the destination device. For more information, see Table 4. By default, the option is selected.
¡ Source Device—Select the device that initiates the NQA operation.
¡ Destination Device—Select the device that processes the NQA probe packets.
When you select a source or destination device, the system automatically fills in the settings for the source or destination IP addresses and ports. You can change the settings.
¡ Source IP Address—Select the IP address of the device that initiates the NQA operation.
¡ Destination IP Address—Select the IP address of the device that processes the NQA probe packets.
¡ Source Port—Select the source interface for the DHCP operation. For a successful operation, the selected interface must be up.
¡ VRF Name—Select this option and enter the VRF name for the ICMP echo operation in the field next to this option.
¡ Timeout (s)—Enter the probe timeout time.
¡ Test Times—Enter the probe times in each NQA operation.
¡ Configure Routing Table Bypass—Select whether to enable the routing table bypass function. By default, this function is disabled.
6. Click Test to check whether the NQA instance is correctly configured.
If the test fails, modify the parameters that you have configured in Figure 12.
7. Click Next.
Figure 13 Configuring monitor information
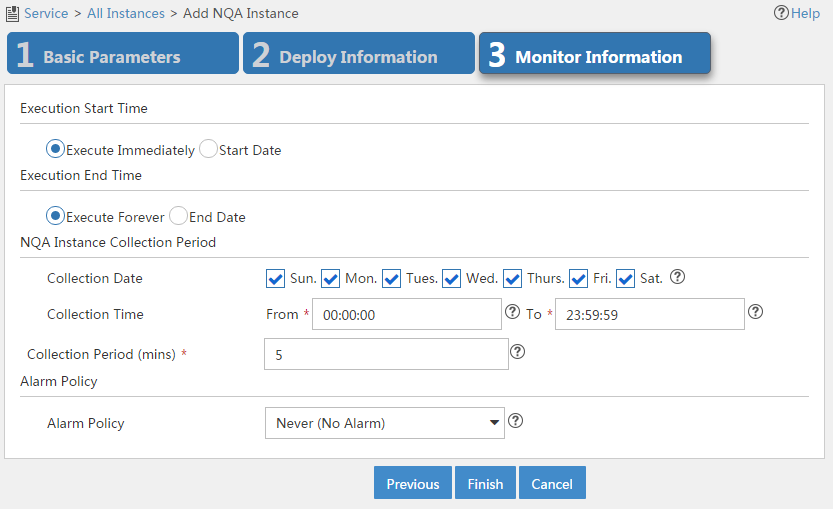
8. Configure monitor information as follows:
¡ Execution Start Time—Select the time to start the NQA instance: Execute Immediately or Start Date.
¡ Execution End Time—Select the time to stop the NQA instance: Execute Forever or End Date.
¡ NQA Instance Collection Period—Specify the period for collecting NQA instance statistics:
- Collection Date—Select the date to collect NQA instance statistics per week.
- Collection Time—Select the start time and end time to collect NQA instance statistics per day.
- Collection Period (mins)—Select the interval to collect NQA instance statistics.
¡ Alarm Policy—Select the alarm policy of the NQA instance. Select one of the following options:
- Never (No Alarm)—Alarms are never triggered.
- Immediately (Triggers Alarm At Once)—An alarm is immediately triggered when a threshold violation occurs.
- Consecutive (X Consecutive Threshold Violations Trigger Alarm)—An alarm is triggered when the number of the consecutive threshold violations reaches X. The value range is 1 to 5.
- X of Y (X Threshold Violations in Recent Y times Trigger Alarm)—An alarm is triggered when the number of the consecutive threshold violations reaches X out of the recent Y operations. The value ranges for X and Y are both 1 to 5.
- Average (Average Value in the Recent X Times violates the Threshold and Triggers Alarm)—An alarm is triggered when the average threshold of each X operations reaches the threshold. The value range is 1 to 5.
9. Click Finish.
The newly added NQA instance is displayed in the NQA instance list.
Copying an NQA instance
1. Access the NQA instance list page.
2. In the Operation
column, click the Copy icon ![]() for the NQA
instance you want to copy.
for the NQA
instance you want to copy.
3. Configure the parameters for the NQA instance. For more information, see "Adding an NQA instance."
Compared with the name of the copied instance, the default name of the new NQA instance is marked with Copy name.
Starting or stopping an NQA instance
After you add an NQA instance, the Task Status column on the NQA instance list page displays the NQA instance status according to the execution start and end time.
· The icon ![]() indicates that the NQA instance has stopped.
indicates that the NQA instance has stopped.
· The icon ![]() indicates
that the NQA instance is
running.
indicates
that the NQA instance is
running.
You can also manually start or stop the NQA instance as follows:
· Click Stop to start the NQA instance.
· Click Start to stop the NQA instance.
Modifying an NQA instance
You cannot modify a running NQA instance.
To modify an NQA instance:
1. Access the NQA instance list page.
2. In the Operation
column, click the Modify icon ![]() for the NQA instance you want to modify.
for the NQA instance you want to modify.
The page for modifying the NQA instance appears.
3. Modify the NQA instance parameters. For more information, see "Adding an NQA instance."
4. Click OK.
Deleting NQA instances
You cannot delete a running NQA instance.
When you delete an NQA instance, the NQA instance configuration on NQA devices is also deleted.
Deleting an NQA instance
1. Access the NQA instance list page.
2. In the Operation
column, click the Delete icon ![]() for the NQA instance you want to delete.
for the NQA instance you want to delete.
A confirmation dialog box appears.
3. Click OK.
Bulk deleting NQA instances
1. Access the NQA instance list page.
2. Select one or multiple NQA instances you want to delete, and click Delete.
A confirmation dialog box appears.
3. Click OK.
Adding an NQA group
1. Access the NQA instance list page.
2. Click Add Group.
3. Add an NQA group as described in "Adding an NQA group."
Auditing NQA instance configurations
The audit function examines whether NQA instance configurations are consistent on both SHM and NQA devices.
To audit NQA instance configurations on all NQA devices:
1. Access the NQA instance list page.
2. Click Audit All.
The following items will be refreshed:
¡ Audit status, audit time, and audit result in the NQA instance list.
¡ Audit status, audit time, and the non-Web management index items in the NQA device list.
Managing NQA groups
You can assign multiple NQA instances to an NQA group for management.
Viewing the NQA group list
1. Access the NQA instance list page.
2. Click the NQA Groups tab.
The NQA group list page appears.
NQA group list contents
¡ NQA Group Name—Name of the NQA group.
¡ Description—Description of the NQA group.
¡ Achieving Rate—Click the achieving rate to view the achieving rates for the NQA instances of the NQA group.
¡ Report—Click the Report icon ![]() to view the detail report of the NQA group. For more information,
see "NQA instance reports."
to view the detail report of the NQA group. For more information,
see "NQA instance reports."
¡ Modify—Click the Modify icon ![]() to modify the NQA group. For more information, see "Modifying an NQA group."
to modify the NQA group. For more information, see "Modifying an NQA group."
¡ Delete—Click the Delete icon ![]() to delete an NQA
group. For more information, see "Deleting NQA groups."
to delete an NQA
group. For more information, see "Deleting NQA groups."
Querying NQA groups
1. Access the NQA group list page.
2. In the query area, enter a partial or complete NQA group name in the NQA Group Name field.
This field supports fuzzy matching.
3. Click Query.
All matching NQA groups are displayed in the NQA group list.
Click Reset to set the query criteria to default and display all NQA groups in the NQA group list.
Viewing NQA group details
1. Access the NQA group list page.
2. Click the name of the NQA group whose detailed information you want to view.
The page displays the NQA group information. The list displays all instances of the NQA group. For more information about the parameter description of the NQA instance, see "Viewing the NQA instance list."
Adding an NQA instance
1. Access the NQA group list page.
2. Click Add Instance.
3. Configure and deploy an NQA instance as described in "Adding an NQA instance."
Adding an NQA group
1. Access the NQA instance list page.
2. Click Add Group.
The page for adding an NQA group appears.
3. Configure the following parameters:
¡ NQA Group Name—Enter a name of the NQA group.
¡ Access Right—Select an operator that can view or manage the NQA group. Options are Administrator Group, Maintainer Group, and Viewer Group.
¡ Description—Enter a description of the NQA group.
4. Click OK.
The newly added NQA group is displayed in the NQA group list.
Modifying an NQA group
1. Access the NQA group list page.
2. Click the Modify icon ![]() for the NQA group
you want to modify.
for the NQA group
you want to modify.
The page for modifying the NQA group appears.
3. Modify the parameters for the NQA group. For more information, see "Adding an NQA group."
4. Click OK.
Deleting NQA groups
You can delete only NQA groups that do not have any NQA instances.
Deleting an NQA group
1. Access the NQA group list page.
2. Click the Delete icon ![]() for the NQA group
you want to delete.
for the NQA group
you want to delete.
A confirmation dialog box appears.
3. Click OK.
Bulk deleting NQA groups
1. Access the NQA group list page.
2. Select one or multiple NQA groups you want to delete, and click Delete.
A confirmation dialog box appears.
3. Click OK.
NQA instance reports
The NQA instances provide different types of NQA reports for operation result analysis.
Viewing NQA instance reports
Viewing a detail report
To view a detail report for an NQA instance:
1. Access the NQA instance list page.
2. In the Operation
column, click the Report icon ![]() for the NQA
instance whose detail report you want to view.
for the NQA
instance whose detail report you want to view.
To view a detail report for an NQA group:
3. Access the NQA group list page.
4. Click the Report
icon ![]() for the
NQA group whose detail report you want to view.
for the
NQA group whose detail report you want to view.
Viewing a comparison report
1. Access the NQA instance list page.
2. Select two or multiple NQA instances that have the same basic indexes, and click Comparison Report.
Viewing a summary report
1. Access the NQA instance list page.
2. Select one to five NQA instances that have the same basic indexes, and click Summary Report.
Viewing an achieving rate report
Method 1:
1. Access the NQA instance list page.
2. Click the achieving rate for the NQA instance.
Method 2:
1. Access the NQA group list page.
2. Click the achieving rate for the NQA group.
The achieving rate report displays the achieving rates for all NQA instances in this group.
NQA instance report layout
All NQA reports have the same layout. This section uses a detail report as an example.
Figure 14 A detail report for an NQA instance
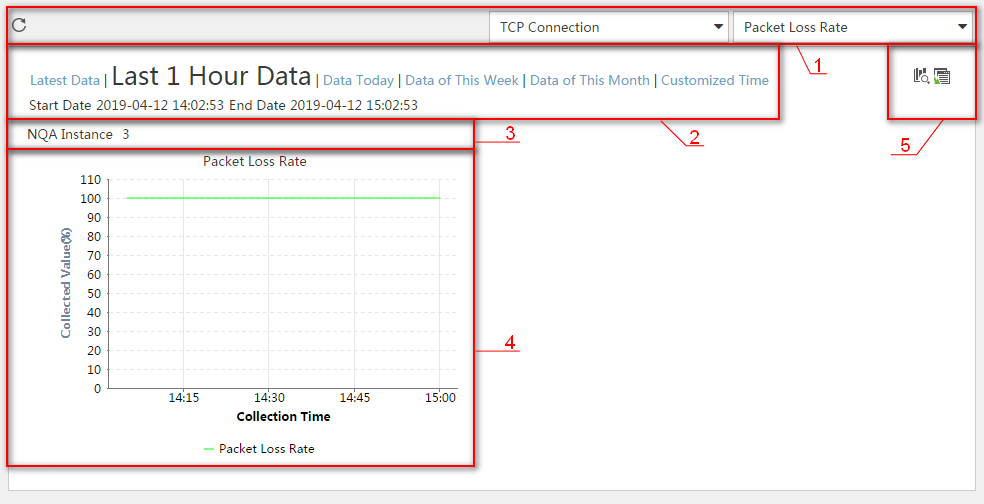
Table 5 Description of the detail report fields
|
No. |
Description |
|
1 |
The area provides the following operations: · Click the Refresh
icon · Select a basic index and performance index you want to view from the basic index list and performance index list, respectively. In this example, the basic index and performance index are Voice and Packet Loss Rate, respectively. |
|
2 |
Click a time range for statistics collection. Options are Latest Data, Last 1 Hour Data, Data Today, Data of This Week, Data of This Month, and Customized Time. The selected time range is displayed at the bottom of this area. By default, the report of today is displayed. |
|
3 |
NQA instance name. |
|
4 |
The trend graph shows the changes of the performance index over the collection time in a line chart. |
|
5 |
The area provides the following operations: · Report—Click the Report icon · Table—Click the Table
icon |
Managing the NQA instance topology
The NQA instance topology displays the NQA devices and instances in topology, and provides basic NQA instance management function. For more information about the topology functions and its supported operations, see HPE IMC Enterprise and Standard Platform Administrator Guide.
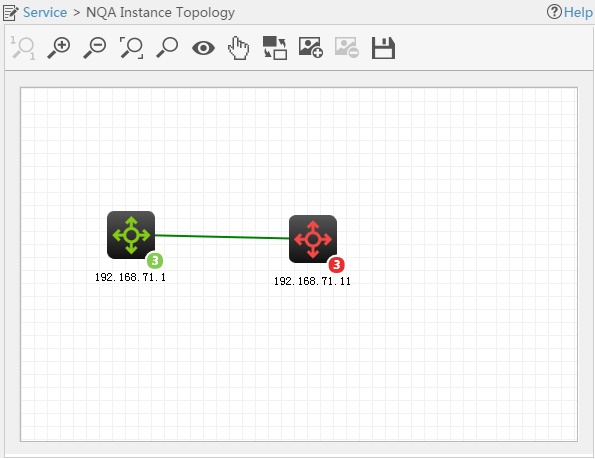
Viewing the NQA instance topology
1. Click the Service tab.
2. From the left navigation tree, click Service Health Manager > NQA Instance Topology.
The NQA Instance Topology page appears.
An NQA instance is represented by a link. The red and green links indicate the stopped and running NQA instances, respectively.
Figure 15 NQA instance topology
Viewing NQA instance details
1. Access the NQA Instance Topology page.
2. Right-click the link between NQA devices.
3. Click View NQA Instance Details from the shortcut menu.
The page that displays detailed information about the NQA instance appears. For more information about parameter description of the NQA instance, see "Viewing NQA instance details."
Specifying the link label displaying method
1. Access the NQA Instance Topology page.
2. Right-click the blank area on the topology page.
3. Select Link Label from the shortcut menu, and then select one of the following options:
¡ Show Name—The NQA instance name is displayed as the link name in the topology.
¡ No Label—The link name is not displayed.
Configuring an NQA device
1. Access the NQA Instance Topology page.
2. Right-click the NQA device.
3. Select one of the following options from the shortcut menu:
¡ Modify Enable Status—Modify the NQA client or server enabling status of the device. For more information, see "Modifying the NQA server or client enabling state."
¡ Modify TCP Configuration—Modify the TCP listening service on the device. For more information, see "Modifying TCP listening services."
¡ Modify UDP Configuration—Modify the UDP listening service on the device. For more information, see "Modifying UDP listening services."
Deleting an NQA instance
1. Access the NQA Instance Topology page.
2. Right-click the red link between the NQA devices.
3. Click Delete NQA Instances from the shortcut menu.
A confirmation dialogue box appears.
4. Click OK.
When you delete an NQA instance, the NQA instance configuration on NQA devices is also deleted.
Managing KQIs
Key quality indexes (KQIs) is an important element for creating an effective SLA. KQIs are expressed as a function of KPIs. They are used to define the terms under which the offered services are monitored and evaluated. System-defined KQIs are available for evaluating device status, interface performance, link quality, and traffic conditions. You can also create KQIs for network evaluations.
Viewing KQI list
1. Click the Service tab.
2. From the left navigation tree, click Service Health Manager > KQI.
3. The KQI page appears. The KQI list displays all KQI classes and unclassified KQIs. KQI classes cannot be further subclassified.
KQI list contents
¡ Name—Name of the KQI or KQI class.
¡ Description—Description of the KQI or KQI class.
¡ Type—Type of the KQI or KQI class. The value can be System-Defined or User-Defined.
¡ Copy—Click the Copy
icon ![]() to copy
the KQI to create a new KQI. For more information, see "Copying a KQI."
to copy
the KQI to create a new KQI. For more information, see "Copying a KQI."
¡ Modify—Click the Modify icon ![]() to modify the KQI or KQI class. For more information, see "Modifying a KQI"
and "Modifying basic information of a KQI class."
to modify the KQI or KQI class. For more information, see "Modifying a KQI"
and "Modifying basic information of a KQI class."
¡ Delete—Click the Delete icon ![]() to delete the KQI or KQI class. For more information, see "Deleting KQIs or KQI classes."
to delete the KQI or KQI class. For more information, see "Deleting KQIs or KQI classes."
Querying KQIs or KQI classes
1. Access the KQI page.
2. In the Query area, specify one or more of the following query criteria:
¡ Name—Enter a partial or complete name of the KQI or KQI class. This field supports fuzzy matching.
¡ Description—Enter a partial or complete description of the KQI or KQI class. This field supports fuzzy matching.
Empty fields are ignored.
3. Click Query.
All matching KQIs or KQI classes are displayed in the KQI list.
Click Reset to set the query criteria to default and display all KQIs and KQI classes in the KQI list.
Viewing KQI class or KQI details
Viewing KQI class details
1. Access the KQI page.
2. Click the name of the KQI class whose detailed information you want to view.
The page that displays the KQI class members appears.
KQI class member list contents
¡ Name—Name of the KQI.
¡ Description—Description of the KQI.
¡ Type—Type of the KQI. The value can be System-Defined or User-Defined.
¡ Copy—Click the Copy
icon ![]() to copy
the KQI to create a new KQI. For more information, see "Copying a KQI."
to copy
the KQI to create a new KQI. For more information, see "Copying a KQI."
¡ Modify—Click the Modify icon ![]() to modify the KQI. For more information, see "Modifying a KQI."
to modify the KQI. For more information, see "Modifying a KQI."
¡ Delete—Click the Delete icon ![]() to delete the KQI. For more information, see "Deleting KQIs or KQI classes."
to delete the KQI. For more information, see "Deleting KQIs or KQI classes."
The page also provides the following operations:
¡ Click Add to add a KQI to the KQI class. For more information, see "Adding a KQI."
¡ Click Delete to delete a selected KQI. For more information, see "Deleting KQIs or KQI classes."
¡ Click Parent Category to enter the KQI page.
Viewing KQI details
1. Access the KQI page.
2. Click the name of a KQI.
The page that displays the KQI details appears.
¡ Basic KQI Information
- Name—Name of the KQI.
- Description—Description of the KQI.
¡ KPI Indexes in KQI
- Alias—Alias of the KPI. It is used in KQI calculation method.
- Name—Name of the KPI.
- KPI Type—Type of the KPI.
- Value Range—Value range of the KPI indicator result. The system also provides performance rating reference for some KPIs.
¡ KQI Calculation Method—Method of combining KPIs to define the KQI calculation.
¡ KQI Rating—Evaluation policy of the KQI.
Table 6 describes the system-defined KQI classes.
Table 6 System-defined KQI classes
|
System-defined KQI class |
KPI type in the KQI class |
Remarks |
|
Link |
N/A |
|
|
Voice |
N/A |
|
|
Device interface |
N/A |
|
|
Device |
N/A |
|
|
Device status |
N/A |
|
|
Interface traffic |
Available when the NTA component is installed |
|
|
Application traffic |
Available when the NTA component is installed |
|
|
Host traffic |
Available when the NTA component is installed |
|
KQI name |
KPI names (alias) |
KPI value range |
KQI formula |
KQI value range and rating |
|
Unreachable Rate |
unreachablerate (A) |
0 to 100 (%) |
Average |
0: 5 0 to 20: 4 20 to 30: 3 30 to 50: 2 Other: 1 (service unavailable) |
|
Error Rate |
errorratio (A) |
0 to 100% |
Average |
0: 5 0 to 0.001: 4 0.001 to 0.01: 3 0.01 to 0.1: 2 Other: 1 (service unavailable) |
|
one way average relay |
s2davgdelay (A) d2savgdelay (B) |
> 0 |
Average |
0 to 5: 5 5 to 15: 4 15 to 25: 3 25 to 50: 2 Other: 1 (service unavailable) |
|
Packet Loss Rate |
lostpacket (A) |
0 to 100% |
Average |
0: 5 0 to 0.001: 4 0.001 to 0.01: 3 0.01 to 0.1: 2 Other: 1 (service unavailable) |
|
Jitter |
S2D_PLUS_AVG_JITTER (A) S2D_NEG_AVG_JITTER (B) D2S_PLUS_AVG_JITTER (C) D2S_NEG_AVG_JITTER (D) |
> 0 |
Average |
0 to 5: 5 5 to 10: 4 10 to 20: 3 20 to 30: 2 Other: 1 (service unavailable) |
|
Average RTT |
RTT (A) |
> 0 |
Average |
0 to 10: 5 10 to 30: 4 30 to 50: 3 50 to 100: 2 Other: 1 (service unavailable) |
|
KQI name |
KPI names (alias) |
KPI value range |
KQI formula |
KQI value range and rating |
|
Voice icpif |
Voice ICPIF (A) |
0 to 500 |
Average |
0: 5 0 to 1: 4 1 to 2: 3 2 to 3: 2 Other: 1 (service unavailable) |
|
Voice MOS |
Voice MOS (A) |
1 to 5 |
Average |
4.4 to 5: 5 4 to 4.4: 4 3 to 4: 3 2 to 3: 2 Other: 1 (service unavailable) |
|
Unreachable Rate |
unreachablerate (A) |
0 to 100 (%) |
Average |
0: 5 0 to 20: 4 20 to 30: 3 30 to 50: 2 Other: 1 (service unavailable) |
|
Error Rate |
errorratio (A) |
0 to 100% |
Average |
0: 5 0 to 0.001: 4 0.001 to 0.01: 3 0.01 to 0.1: 2 Other: 1 (service unavailable) |
|
one way average delay |
s2davgdelay (A) d2savgdelay (B) |
> 0 |
Average |
0 to 5: 5 5 to 15: 4 15 to 25: 3 25 to 50: 2 Other: 1 (service unavailable) |
|
Packet Loss Rate |
lostpacket (A) |
0 to 100% |
Average |
0: 5 0 to 0.001: 4 0.001 to 0.01: 3 0.01 to 0.1: 2 Other: 1 (service unavailable) |
|
Jitter |
S2D_PLUS_AVG_JITTER (A) S2D_NEG_AVG_JITTER (B) D2S_PLUS_AVG_JITTER (C) D2S_NEG_AVG_JITTER (D) |
> 0 |
Average |
0 to 5: 5 5 to 10: 4 10 to 20: 3 20 to 30: 2 Other: 1 (service unavailable) |
|
Average RTT |
RTT (A) |
> 0 |
Average |
0 to 10: 5 10 to 30: 4 30 to 50: 3 50 to 100: 2 Other: 1 (service unavailable) |
|
KQI name |
KPI names (alias) |
KPI value range |
KQI formula |
KQI value range and rating |
|
Interface Performance |
inspeed (A) outspeed (B) |
> 0 |
Sum |
Other: 5 |
|
Valid Through Usage |
inspeed (A) |
> 0 |
'sum(A)'*(1-'avg(C)')+'sum(B)'*(1-'avg(D)') |
Other: 5 |
|
outspeed (B) |
> 0 |
|||
|
Inpacket lost (C) |
0 to 100 (%) |
|||
|
Outpacket lost (D) |
0 to 100 (%) |
|||
|
Max Bandwidth Usage |
Inutilizationratio (A) Oututilizationratio (B) |
0 to 100 (%) |
Maximum |
60 to 80: 5 30 to 60: 4 0 to 30: 3 80 to 90: 2 Other: 1 (service unavailable) |
|
KQI name |
KPI names (alias) |
KPI value range |
KQI formula |
KQI value range and rating |
|
Device alarms |
Critical Alarms (A) Major Alarms (B) Minor Alarms (C) Warning Alarms (D) |
> 0 |
'sum(A)'*0.8+'sum(B)'*0.5+'sum(C)'*0.2+'sum(D)'*0.1 |
0: 5 0 to 2: 4 2 to 5: 3 5 to 10: 2 Other: 1 (service unavailable) |
|
KQI name |
KPI name (alias) |
KPI value range |
KQI formula |
KQI value range and rating |
|
CPU Usage |
CPU_USAGE (A) |
0 to 100 (%) |
Average |
0 to 30: 5 30 to 60: 4 60 to 80: 3 80 to 90: 2 Other: 1 (service unavailable) |
|
Memory Usage |
Memory_Usage (A) |
0 to 100 (%) |
Average |
0 to 30: 5 30 to 60: 4 60 to 80: 3 80 to 90: 2 Other: 1 (service unavailable) |
|
Device Unreachable |
Device_NOTREACH_USAGE (A) |
0 to 100 (%) |
Average |
0: 5 0 to 20: 4 20 to 30: 3 30 to 50: 2 Other: 1 (service unavailable) |
|
Device Response Time |
Device_RESPONSETIME (A) |
> 0 |
Average |
0 to 10: 5 10 to 30: 4 30 to 50: 3 50 to 100: 2 Other: 1 (service unavailable) |
|
KQI name |
KPI name (alias) |
KPI value range |
KQI formula |
KQI value range and rating |
|
In Traffic |
In Traffic (A) |
N/A |
Sum |
Other: 5 |
|
Out Traffic |
Out Traffic (B) |
N/A |
Sum |
Other: 5 |
|
In Speed |
In Speed (C) |
N/A |
Average |
Other: 5 |
|
Out Speed |
Out Speed (D) |
N/A |
Average |
Other: 5 |
|
KQI name |
KPI name (alias) |
KPI value range |
KQI formula |
KQI value range and rating |
|
Traffic |
Traffic (A) |
N/A |
Sum |
Other: 5 |
|
Speed |
Speed (B) |
N/A |
Average |
Other: 5 |
|
KQI name |
KPI name (alias) |
KPI value range |
KQI formula |
KQI value range and rating |
|
In Traffic |
In Traffic (A) |
N/A |
Sum |
Other: 5 |
|
Out Traffic |
Out Traffic (B) |
N/A |
Sum |
Other: 5 |
|
In Speed |
In Speed (C) |
N/A |
Average |
Other: 5 |
|
Out Speed |
Out Speed (D) |
N/A |
Average |
Other: 5 |
Adding a KQI
1. Access the KQI page.
2. Click Add.
The page for adding a KQI appears.
3. In the Basic KQI Information area, configure basic information for the KQI:
¡ Name—Enter a name for the KQI.
¡ Class—Select a class for the KQI. The default class for the KQI is Uncategorized KQI.
If you add a KQI on the KQI class page, the KQI belongs to the KQI class by default.
¡ Description—Enter a description for the KQI.
4. In the Select KPI Indexes for KQI(View KPI) area, select one or multiple KPIs. For system-defined KPIs, see Table 6.
¡ To
add one or multiple KPIs, select the KPIs from the left list and click the icon ![]() . The selected
KPIs appear in the right list.
. The selected
KPIs appear in the right list.
If multiple KPIs are to be added, make sure they are of the same type.
¡ To
remove one or multiple KPIs, select the KPIs from the right list and click the
icon ![]() . The selected KPIs appear in the left list.
. The selected KPIs appear in the left list.
¡ To
remove all selected KPIs, click the icon ![]() .
.
5. In the Configure KQI Formula area, configure the KQI calculation formula:
¡ Minimum—Selects the minimum value among all participating KPIs.
¡ Maximum—Selects the maximum value among all participating KPIs.
¡ Average—Calculates the average value of all participating KPIs.
¡ Sum—Calculates the sum of all participating KPIs.
¡ Variance—Calculates the variance value of all participating KPIs.
¡ Random—Evaluates the KQI by assigning specific threshold values.
Configure the formula as follows:
- In the When resource values subarea, select the greater than sign (>), the equal sign (=), or the less than sign (<), and enter the threshold to define a threshold requirement.
- In the KQI value field of the When resource values subarea, enter a KQI value for KPIs that meet the threshold requirement.
- In the KQI value field of the Other subarea, enter a KQI value for KPIs that do not meet the threshold requirement.
¡ Percent—Evaluates KQI by assigning specific percentage values.
Configure the formula as follows:
- In the When resource values subarea, select the greater than sign (>), the equal sign (=), or the less than sign (<), and enter the percentage and threshold to define a threshold requirement.
- In the KQI value field of the When resource values subarea, enter a KQI value for KPIs that meet the threshold requirement.
- In the When resource values subarea, you can click Add or Delete to modify the threshold requirement.
- In the KQI value field of the Other subarea, enter a KQI value for KPIs that do not meet the threshold requirement.
¡ Formula—Select this option to create a formula if the all the above formulas do not meet the requirement.
To create a formula:
- Click Insert KPI to select the KPI and the calculation method.
- Click Insert symbol to select the operators and functions.
- Click Check Formula to check whether the formula is correct.
To clear the formula, click Clear.
6. Configure the KQI evaluation policy:
a. Determine the KQI value ranges and their respective ratings.
A maximum of five ratings can be defined. Each rating can be numbered 1 through 5, representing Poor, Fair, Average, Good, and Excellent in ascending order.
b. In the Rating column, select the box, and then select a rating from the list.
c. In the KQI value column, enter each KQI value range.
Each value range includes the minimum value, but does not include the maximum value. If other values are out of the value ranges, select the box for Other in the Rating column. You can modify the rating and availability for these values.
d. In the Availability column, select an availability status for each KQI value range. The status can be Available, Partially Available, or Unavailable.
Partially Available requires you to specify a value in the Unavailable Factors field. The value is in the range of 0 to 1. When measuring the availability, the system multiplies the rating by this value to modify the final availability status.
7. Click OK.
Copying a KQI
1. Access the KQI page.
2. Click the Copy
icon ![]() for the
KQI you want to copy.
for the
KQI you want to copy.
The Copy KQI page appears.
3. Configure the parameters for the KQI. For more information, see "Adding a KQI."
The default name of the new KQI is marked with Copy name.
Modifying a KQI
1. Access the KQI page.
2. Click the Modify
icon ![]() for the
KQI you want to modify.
for the
KQI you want to modify.
The page for modifying the KQI appears.
3. Modify the KQI parameters. For more information, see "Adding a KQI."
4. Click OK.
Deleting KQIs or KQI classes
You can delete only user-defined KQIs or KQI classes.
Deleting a KQI or KQI class
1. Access the KQI page.
2. Click the Delete
icon ![]() for the
KQI or KQI class you want to delete.
for the
KQI or KQI class you want to delete.
A confirmation dialog box appears.
3. Click OK.
Bulk deleting KQIs or KQI classes
1. Access the KQI page.
2. Select one or multiple KQIs or KQI classes you want to delete, and click Delete.
A confirmation dialog box appears.
3. Click OK.
Creating a KQI class
1. Access the KQI page.
2. Click Add Class.
The page for creating a KQI class appears.
3. Configure the following parameters:
¡ Name—Enter a name for the KQI class.
¡ Description—Enter a description for the KQI class.
4. Click OK.
Modifying a KQI class
Modifying basic information of a KQI class
1. Access the KQI page.
2. Click the Modify
icon ![]() for the
KQI class whose basic information you want to modify.
for the
KQI class whose basic information you want to modify.
3. Modify the following parameters:
¡ Name—Modify the name of the KQI class.
¡ Description—Modify the description of the KQI class.
4. Click OK.
Modifying KQIs in a KQI class
Adding a KQI to a KQI class
1. Access the KQI page or the page of the KQI class to which you want to add a KQI.
2. Add the KQI to the KQI class. For more information, see "Adding a KQI."
Deleting KQIs from the KQI class
1. Access the page of the KQI class from which you want to delete KQIs.
2. Delete the KQIs. For more information, see "Deleting KQIs or KQI classes."
Modifying a KQI in the KQI class
1. Access the page of the KQI class on which you want to modify a KQI.
2. Click the Modify
icon ![]() for the
KQI you want to modify. For more information, see "Modifying a KQI.
for the
KQI you want to modify. For more information, see "Modifying a KQI.
Managing service levels
Service level is used by the SLA to define the methods for service availability checking and IMC alarm generation. When a service's unavailability exceeds the specified threshold, SHM generates an alarm and informs the administrator.
To check the service unavailability, define an appropriate service level and reference it when you create an SLA.
Viewing the service level list
1. Click the Service tab.
2. From the navigation tree, click Service Health Manager > Service Level.
The service level list page appears.
Service level list contents
¡ Name—Name of the service level.
¡ Description—Description of the service level.
¡ Status—Status of the service level. The status includes Used and Not in Use.
¡ Copy—Click the Copy
icon ![]() to copy
a service level. For more information about copying a service level, see "Copying a service level."
to copy
a service level. For more information about copying a service level, see "Copying a service level."
¡ Modify—Click the Modify icon ![]() to modify a service level. For more information about modifying a
service level, see "Modifying a service level."
to modify a service level. For more information about modifying a
service level, see "Modifying a service level."
¡ Delete—Click the Delete icon ![]() to delete a service level. For more information about deleting a
service level, see "Deleting a service level."
to delete a service level. For more information about deleting a
service level, see "Deleting a service level."
Viewing the service level details
1. Access the service level list page.
2. Click the name of a service level to view its detailed information.
Basic information area
¡ Name—Name of the service level.
¡ Description—Description of the service level.
¡ Generate Alarm by—When a warning or violation occurs in the SLA, an IMC alarm is generated if you select Warning, Violation, or both. A warning or violation state for the service availability is generated according to the following parameters:
- Count Violation Time—When the time for service unavailability reaches the threshold in the specified period, the service status changes to warning or violation.
- Count Violation Duration—When the service unavailability duration reaches the threshold, the service status changes to warning or violation.
- Count Violations—When the time and the violation count for service unavailability reach their corresponding thresholds in the specified time range, the service status changes to warning or violation.
Creating a service level
You can add or copy a service level to create a new service level.
Adding a service level
1. Access the service level list page.
2. Click Add in the service level list.
3. On the Add Service Level page, configure the following parameters:
¡ Name—Enter a name for the service level.
¡ Description—Enter a description for the service level.
¡ Generate Alarm by—Select Warning, Violation, or both. SHM generates an IMC alarm according to the configuration of the Count Violation Time Count, Violation Duration, and Count Violations parameters.
¡ Count Violation Time—When the time for service unavailability reaches the threshold in the specified period, the service status changes to warning or violation.
- Period—Select a time period from the list. Options are Hourly, Daily, and Monthly.
- Warning If Total Unavailable Time Reaches—Enter a threshold for the unavailable time.
- Violation If Total Unavailable Time Reaches—Enter a threshold for the unavailable time.
¡ Count Violation Duration—When the service unavailability duration reaches the threshold, the service status changes to warning or violation.
- Warning If Total Unavailable Time Reaches—Enter a threshold for the unavailable duration.
- Violation If Total Unavailable Time Reaches—Enter a threshold for the unavailable duration.
¡ Count Violations—When the time and violation count for service unavailability reach their corresponding thresholds in the specified time range, the service status changes to warning or violation.
- Time Range—Enter the interval.
- Warning If Every Unavailable Time Exceeds and Count Reaches—Enter a threshold for each field.
- Violation If Every Unavailable Time Exceeds and Count Reaches—Enter a threshold for each field.
4. Click OK.
Copying a service level
1. Access the service level list page.
2. In the service level list, click the Copy icon ![]() for a service level.
for a service level.
3. Modify the parameters on the Copy Service Level page.
For the copied service level, its name is the original name followed by Copy name.
For more information about other parameters, see "Adding a service level."
4. Click OK.
The new service level appears in the service level list.
Modifying a service level
1. Access the service level list page.
2. Click the Modify
icon ![]() for a
service level.
for a
service level.
3. Modify the parameters on the Modify Service Level page.
For information about service level parameters, see "Adding a service level."
4. Click OK.
Deleting service levels
You can delete a single service level or delete service levels in batches.
Deleting a service level
1. Access the service level list page.
2. Click the Delete
icon ![]() for a
service level.
for a
service level.
3. In the confirmation dialog box that appears, click OK.
Bulk deleting service levels
1. Access the service level list.
2. Select the service levels you want to delete.
3. Click Delete.
4. In the confirmation dialog box that appears, click OK.
Managing SLAs
The SLA includes service-related network resources, KQIs, calculating methods, and the measuring policies. The administrator uses the SLA to monitor and measure network services, network service quality, MTTR, MTBF, and key factors that affect the network service for management and improvement.
Viewing the SLA list
1. Click the Service tab.
2. From the navigation tree, select Service Health Manager > SLA.
The SLA page appears. It contains the List View tab and the Icon View tab. The page displays the List View tab by default.
Viewing the SLAs in list view
1. Access the SLA page.
2. Click the List View tab.
SLA list contents
¡ Name—Name of the SLA. Click the name
to view the service health report. Click the ![]() icon to view KQIs under the SLA. When invalid KQIs exist for SLA, the
icon to view KQIs under the SLA. When invalid KQIs exist for SLA, the ![]() icon appears.
icon appears.
¡ Health—Health status of the network
service. The status can be Excellent, Good, Average, Fair, or Poor, represented by ![]() ,
, ![]() ,
, ![]() ,
, ![]() , or
, or![]() , respectively. This field displays nothing when no data exists for the service
health evaluation.
, respectively. This field displays nothing when no data exists for the service
health evaluation.
¡ Availability—Availability status of the network
service. The status can be Available, Partially Available, or Unavailable,
represented by ![]() ,
, ![]() , or
, or ![]() , respectively. This field displays nothing when no data exists for
the service availability evaluation.
, respectively. This field displays nothing when no data exists for
the service availability evaluation.
¡ Violated—Violation status of the network service. The status can be Normal,
Warning, or Violated,
represented by ![]() ,
, ![]() , and
, and ![]() , respectively. This field displays nothing
when no service level is referenced by the SLA. Click
the violation status to view the referenced service level and result.
, respectively. This field displays nothing
when no service level is referenced by the SLA. Click
the violation status to view the referenced service level and result.
¡ Status—SLA running status. The status can be:
- Waiting—SLA is waiting to be performed.
- Running—SLA is running.
- Stopped—SLA has stopped.
- Finished—SLA has finished the task.
¡ Health of the Day—Today's health
status of the network service. The status can be Excellent,
Good, Average, Fair, Poor, or No Data, represented by ![]() ,
, ![]() ,
, ![]() ,
, ![]() ,
, ![]() , or
, or ![]() ,
respectively. This field displays None when the SLA
is not performed during the interval. The interval is Today
by default. Click Today, Week,
Month, or Year at the
upper-right of the SLA list to set the interval for statistics.
,
respectively. This field displays None when the SLA
is not performed during the interval. The interval is Today
by default. Click Today, Week,
Month, or Year at the
upper-right of the SLA list to set the interval for statistics.
¡ Today's Availability—Availability status
of the network service. The status can be Available,
Partially Available, or Unavailable,
represented by ![]() ,
, ![]() , or
, or ![]() , respectively. This field displays the percentage of the
availability during the time range for the SLA report data. This field displays
nothing when the SLA is not performed.
, respectively. This field displays the percentage of the
availability during the time range for the SLA report data. This field displays
nothing when the SLA is not performed.
¡ Operation—Click the Operation icon ![]() to perform the following operations:
to perform the following operations:
- View—Click View to view the details of the SLA. For more information about SLA details, see "Viewing SLA details."
- Copy—Click Copy to copy the SLA. For more information about copying an SLA, see "Copying an SLA."
- Modify—Click Modify to modify the SLA. For more information about modifying an SLA, see "Modifying an SLA."
- Delete—Click Delete to delete the SLA. For more information about deleting an SLA, see "Deleting a single SLA."
Viewing SLAs in icon view
1. Access the SLA page.
2. Click the Icon View tab.
The SLA list appears in icon view, as shown in Figure 16.
Figure 16 Viewing the SLA in icon view
Table 15 Description of the SLA fields in icon view
|
No. |
Description |
|
1 |
Name of the SLA. |
|
|
Availability status of the service. Hover the pointer over this icon, the latest collection time appears. Click the icon, the Service Availability bar chart appears. |
|
|
Health status of the service indicated by scores in the range of 1 to 5 and colors. Click this icon, the Health bar chart for the SLA and its KQIs appears. |
|
|
Represents MTBF. Click this icon, the MTBF bar chart appears, showing the mean time between failures. |
|
|
Represents MTTR. Click this icon, the MTTR bar chart appears, showing the mean time to repair. |
|
2 |
Availability status for the service during
the time range for the SLA report data. The status can be Available, Partially Available,
or Unavailable, represented by |
|
3 |
Interval for reporting the service health, availability for the service, MTTR, and MTBF. |
Querying SLAs
1. Access the SLA list page.
2. Click Query.
3. In the query area, specify one or more of the following query criteria:
¡ Service Name—Enter an SLA name. This field supports fuzzy matching.
¡ Health—Select a health status. The status can be Excellent, Good, Average, Fair, or Poor.
¡ Availability—Select an availability status of the service. The status can be Available, Partially Available, or Unavailable.
Empty fields are ignored.
4. Click Query.
All matching SLAs are displayed in the SLA list.
5. Click Reset to set the query criteria to default. All SLAs are displayed in the SLA list.
Viewing SLA details
1. Access the SLA list page.
2. In the SLA list, click the Operation icon ![]() for an SLA.
for an SLA.
3. Select View from the shortcut menu.
The page that displays the SLA details appears.
Basic Attributes
¡ Name—Name of the SLA.
¡ Description—Description of the SLA.
¡ Start Date—The time when the SLA starts.
¡ End Date—The time when the SLA ends.
¡ Collection Interval—The interval at which the SLA collects data.
Bound Resources
The resources are grouped by KQI. Click a KQI name to view its detailed information.
¡ Resource Name—Name of the measuring objects bound with a KQI. The objects include devices, NQA instances, or ports.
¡ Resource Type—The category to which the KQI belongs.
Rating Method
¡ Calculation Method—Method the SLA uses to calculate the KQI values.
¡ KQIs for Rating—All KQIs that participate in the SLA calculation and their invalidity scores.
Service Rating
The service rating includes rating the service health and specifications on the service availability.
Service Level Objective
The service level appears that is referenced by the SLA.
If no service level is referenced, this area does not appear.
4. Click Back.
Adding an SLA
You can add an SLA by using one of the following methods:
· Manually adding an SLA. This method is more flexible.
· Adding an SLA by service model. This method requires an .xml file, and is a fast method to create SLAs.
· Adding an SLA through copy.
Manually adding an SLA
Selecting SLA resources
1. Access the SLA list.
2. Click Add and select Manually Add.
3. In the dialog box that appears, click Select Device or Select Interface to add devices or interfaces as the measured objects.
As shown in Figure 17, the selected resources appear in the Network Resource Area.
¡ ![]() —NQA link.
—NQA link.
¡ ![]() —Selected interfaces on the device.
—Selected interfaces on the device.
¡ ![]() —Configuration of the
NQA instance.
—Configuration of the
NQA instance.
To modify the network resources, click Add Device, Add Interface, and Delete Device from the shortcut menu on the device.
Figure 17 Adding SLA resources
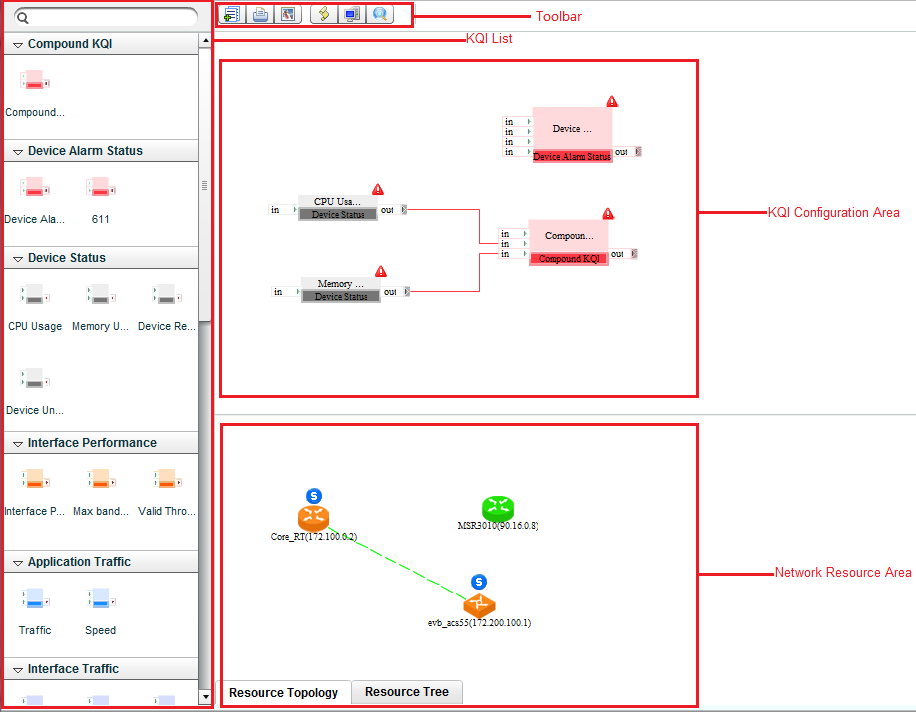
4. Locate the KQIs that you want from the KQI available on the left pane, and drag them to the KQI Configuration Area.
If the existing KQIs do not meet your requirements, create a KQI. For information about creating new KQIs, see "Adding a KQI."
To delete a KQI, right-click the KQI icon, and select Delete KQI from the shortcut menu.
Table 16 Description of the SLA fields in icon view
|
Components |
Description |
|
|
Displays the input of KPI (KQI). The number of icons matches the number of KPIs. Point to the icon to view the KPI name and its value range. |
|
The part between |
Displays the KQI name and the category to which the KQI belongs. |
|
|
Displays the output of KQI. To make the
output serve as the input of the compound KQI, click and drag the icon to the
icon |
|
|
This icon appears when the configuration for a KQI is not complete. |
Configuring a KQI
1. Double-click the KQI icon or right-click the KQI icon, and select Configure KQI.
2. In the Basic KQI Information area, modify the KQI name as needed.
3. In the Configure KQI Resources area, select resources from the list.
4. In the Configure KQI Formula area, configure the KQI calculation formula:
¡ Minimum—Selects the minimum value among all participating KPIs.
¡ Maximum—Selects the maximum value among all participating KPIs.
¡ Average—Calculates the average value of all participating KPIs.
¡ Sum—Calculates the sum of all participating KPIs.
¡ Variance—Calculates the variance value of all participating KPIs.
¡ Random—Evaluates the KQI by assigning specific threshold values.
Configure the formula as follows:
- In the When resource values subarea, select the greater than sign (>), the equal sign (=), or the less than sign (<), and enter the threshold to define a threshold requirement.
- In the KQI value field of the When resource values subarea, enter a KQI value for KPIs that meet the threshold requirement.
- In the KQI value field of the Other subarea, enter a KQI value for KPIs that do not meet the threshold requirement.
¡ Percent—Evaluates KQI by assigning specific percentage values.
Configure the formula as follows:
- In the When resource values subarea, select the greater than sign (>), the equal sign (=), or the less than sign (<), and enter the percentage and threshold to define a threshold requirement.
- In the KQI value field of the When resource values subarea, enter a KQI value for KPIs that meet the threshold requirement.
- In the KQI value field of the Other subarea, enter a KQI value for KPIs that do not meet the threshold requirement.
- In the When resource values subarea, you can click Add or Delete to modify the threshold requirement.
¡ Formula—Select this option to create a formula if the all above formulae cannot meet the requirement.
To create a formula:
- Click Insert KPI to select the KPI and the calculation method.
- Click Insert Symbol to select the operators and functions.
- Click Check Formula to check whether the formula is correct.
To clear the formula, click Clear.
5. Configure the KQI evaluation policy:
a. Determine the KQI value ranges and their respective ratings.
A maximum of five ranges can be defined. Each rating can be numbered 1 through 5, representing Poor, Fair, Average, Good, and Excellent in ascending order.
b. In the Rating column, select the box, and select a rating from the list.
c. In the KQI value column, enter each KQI value range.
Each value range includes the minimum value, but does not include the maximum value. If other values are out of the value ranges, select the box for Other in the Rating column. You can modify the rating and availability for these values.
d. In the Availability column, select an availability status for each KQI value range. The status can be Available, Partially Available, or Unavailable.
Partially Available requires you to specify a value in the Unavailable Factors field. The value is in the range of 0 to 1. When measuring the availability, the system multiplies the rating by this value to modify the final availability status.
6. Click OK.
Configuring a compound KQI
A compound KQI includes multiple KQIs.
When multiple service units and the whole service need to be monitored and measured, configure a compound KQI.
To configure a compound KQI:
1. In the KQI icon list, drag the compound KQI icon to the KQI Configuration Area.
2. Drag the ![]() icon of a KQI to the
icon of a KQI to the ![]() icon of its compound KQI.
icon of its compound KQI.
A red line appears between the KQI and the compound KQI.
To delete a KQI from the compound KQI, right-click the red line, select Delete Line.
3. Double-click the compound KQI icon or right-click the icon, and select Configure KQI.
4. Enter the compound KQI name in the Name field.
5. Follow the instructions in step 3 of the Configuring a KQI.
6. Select a KQI value type as the input of the compound KQI. Options are Actual Value and Rating.
7. Set ratings for the compound KQI.
Use the actual values
a. Enter the threshold for each KQI value range. The value ranges cannot overlap. Each value range includes the minimum value, but does not include the maximum value. If other values are out of the value ranges, specify the Other option.
b. In the Rating column, assign a rating to each KQI value range.
c. Select the availability status for each KQI value range. The status can be Available, Partially Available, or Unavailable.
Partially Available requires you to specify a value for unavailable factors in the range of 0 to 1. When measuring the availability, the system multiplies the rating by this value to calculate its corresponding availability status.
Use the rating
d. Select the rows with ratings assigned.
e. Assign an availability status for each rating. The status can be Available, Partially Available, or Unavailable.
Partially Available requires you to specify a value for unavailable factors in the range of 0 to 1.
8. Click OK.
Setting service properties
1. When all KQIs configuration is complete,
click the Add Service and Quit icon ![]() .
.
The page for setting service properties appears.
2. In the Basic Attributes area, configure the following parameters:
¡ Name—Enter a name for the SLA.
¡ Description—Enter the description for the SLA.
¡ Start Date—Configure the time when the SLA starts.
¡ End Date—Configure the time when the SLA ends.
¡ Collection Interval—Enter the interval at which the SLA collects data.
3. In the KQI area, select KQIs for service rating, and select the invalidity score for each KQI.
The invalidity score can be 1, 2, 3, 4, 5, or None.
4. In the Rating Method area, select a formula. The formula can be Maximum, Minimum, Average, or Weighted.
The Weighted formula requires you to specify a weight for each KQI.
5. In the Service Rating area, select an availability status for each KQI value range. The status can be Available, Partially Available, or Unavailable.
Partially Available requires you to specify a value for unavailable factors in the range of 0 to 1. When measuring the availability, the system multiplies the rating by this value, and gets its corresponding availability status.
6. In the Service Level Object area, select a service level from the list.
To create a service level, see "Adding a service level."
7. Click OK.
Adding an SLA by service model
The service model stored in the XML file defines the KQI configuration and the KQIs' hierarchical relationship. If the XML file has format errors, or has no KQI indexes, the service model will fail to be parsed and will not appear for selection.
Selecting a service model
1. Access the SLA page.
2. Click Add, and select Add by Service Model.
The page displays the successfully parsed service models.
3. Select the service model you want.
4. Click Next.
Configuring measuring objects
1. In the Device Interface area, click Select to select network devices.
The selected devices appear in the device interface list.
To deselect devices, click Delete All to
delete all devices, or click the Delete icon ![]() to delete a device.
to delete a device.
2. In the Service Model area (see Figure 18), verify the KQIs are successfully bound to the measuring objects on the selected devices.
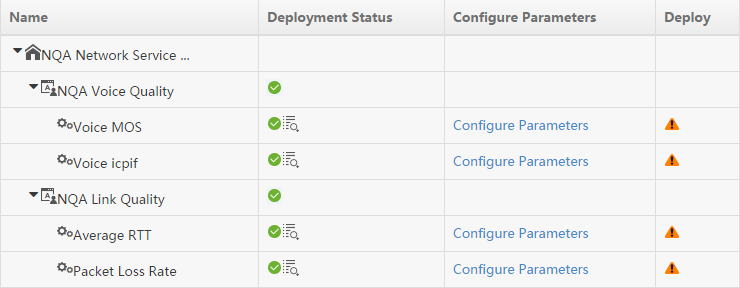
Service Model contents
¡ Name—Displays all KQIs of the service model in a hierarchical way.
¡ Deployment Status—Status for binding measuring objects with KQIs.
- ![]() —The binding is
successful.
—The binding is
successful.
Click the View Bound Measuring Objects icon ![]() to enter the binding configuration page. On the page, click the Unbind icon
to enter the binding configuration page. On the page, click the Unbind icon ![]() to unbind the association between the KQI and the object. To restore the bindings for the default
objects, you can click Reload Resources.
to unbind the association between the KQI and the object. To restore the bindings for the default
objects, you can click Reload Resources.
- ![]() —The binding fails.
To add a measuring object, go
to step 3 of the Configuring measuring objects.
—The binding fails.
To add a measuring object, go
to step 3 of the Configuring measuring objects.
¡ Configure Parameters—Bind NQA instances to a KQI. If the KQI does not measure an NQA link, this field displays nothing.
¡ Deploy—Status of deploying NQA instances to a KQI.
- ![]() —There is no NQA
instances added.
—There is no NQA
instances added.
- ![]() —NQA instances can
be deployed.
—NQA instances can
be deployed.
- ![]() —NQA instances are
successfully deployed to the
KQI.
—NQA instances are
successfully deployed to the
KQI.
3. Add a measuring object by KQI type:
NQA link
a. Click Configure Parameters.
b. On the Configure Deployment Info page, configure the following parameters:
- NQA Instance Name—Enter a name for the NQA instance.
- Select destination device—Select this option for operations that require the destination device. For more information, see Table 3. By default, the option is selected.
- Source Device—Select the device that initiates the NQA operation.
- Source IP Address—Select the IP address of the device that initiates the NQA operation.
- Destination Device—Select the device that processes the NQA probe packets.
- Destination IP Address—Select the IP address of the device that processes the NQA probe packets.
- Source Port—Select the source interface for the DHCP operation. For a successful operation, the selected interface must be up.
- VRF Name—Select this option and enter the VRF name for the ICMP echo operation in the field next to this option.
c. Click OK.
The ![]() icon changes to the
icon changes to the ![]() icon.
icon.
d. Click the ![]() icon to deploy the NQA instances.
icon to deploy the NQA instances.
The ![]() icon changes to the
icon changes to the ![]() icon.
icon.
To view the new measuring object, click
the View Bound Measuring Objects icon ![]() .
.
Interface Performance
e. Click the Selected Interface
Count icon ![]() in the device interface list.
in the device interface list.
f. Select the interfaces to be monitored.
g. Click OK.
The KQI will be automatically bound with the added interfaces.
Other types
Click Select in the device interface area to add device resources. The KQI will automatically be bound with the device resources.
4. Click Next.
Configuring service properties
1. In the Basic Attributes area, configure the following parameters for the SLA:
¡ Name—Enter a name for the SLA.
¡ Description—Enter a description.
¡ Start Date—Specify the time when the SLA starts.
¡ End Date—Specify the time when the SLA ends.
¡ Collection Interval—Enter the interval at which the SLA collects data.
2. In the KQI area, select KQIs for service rating, and select the invalidity score for each KQI.
The invalidity score can be 1, 2, 3, 4, 5, or None. This score assigns a value to the KQI in the SLA rating calculation if the KQI has no measured value. To eliminate the KQI with an invalid value from SLA calculation, select None.
3. In the Rating Method area, select a formula. The formula can be Maximum, Minimum, Average, or Weighted.
The Weighted formula requires you to specify a weight for each KQI.
4. In the Service Rating area, select an availability status for each KQI value range. The status can be Available, Partially Available, or Unavailable.
Partially Available requires you to specify a value for unavailable factors in the range of 0 to 1. When measuring the availability, the system multiplies the rating by this value, and gets its corresponding availability status.
5. In the Service Level Objective area, select a service level from the list.
To create a service level, see "Adding a service level."
6. Click OK.
The new SLA appears in the SLA list.
Copying an SLA
1. Access the SLA list.
2. Click the Operation
icon ![]() for an
SLA.
for an
SLA.
3. Select Copy from the shortcut menu.
4. Click Add Service and Quit, and edit the parameters.
For the copied SLA, its name is the original name followed by Copy name.
For more information about other parameters, see "Manually adding an SLA."
5. Click OK.
Modifying an SLA
1. Access the SLA list.
2. Click the Operation
icon ![]() for an
SLA.
for an
SLA.
3. Select Modify from the shortcut menu.
4. Click Add Service and Quit, modify the parameters of the SLA except its name on the page that set service properties.
For more information about modifying SLA parameters, see "Manually adding an SLA."
5. Click OK.
Deleting SLAs
You can delete a single SLA or delete SLAs in batches.
Deleting a single SLA
1. Access the SLA list.
2. Click the Operation
icon ![]() for an SLA.
for an SLA.
3. Select Delete from the shortcut menu.
4. In the confirmation dialog box that appears, click OK.
Bulk deleting SLAs
1. Access the SLA list.
2. In the SLA list, select one or multiple SLAs.
3. Click Delete.
4. In the confirmation dialog box that appears, click OK.
Starting and stopping an SLA
An SLA starts and stops according to the configured schedule. You can also manually start and stop the SLA.
1. Access the SLA list.
2. In the SLA list, select a started SLA, click Stop to stop the SLA.
3. Select a stopped SLA, click Start to start the SLA.
Understanding SLA reports
The SLA report displays detailed monitoring and measuring information for an SLA. It includes a title bar, the health area, and the KQI area.
In the SLA list, you can click an SLA name or a Health bar chart to display the SLA report.
Title bar
As shown in Figure 19, the
title bar displays the report name and the legend. Click Daily,
Weekly, Monthly, or Annual to set the time period for the report display.
Click the ![]() or
or ![]() icon to view
the report for the previous or next period.
icon to view
the report for the previous or next period.
Figure 19 Tile bar in the SLA report
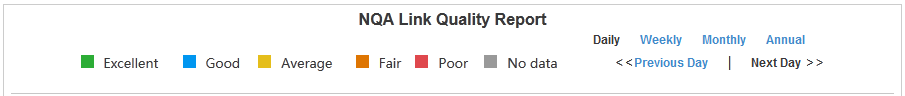
Health
The Health area in the SLA report provides health evaluation on the monitored service, as shown in Figure 20.
Figure 20 Health area
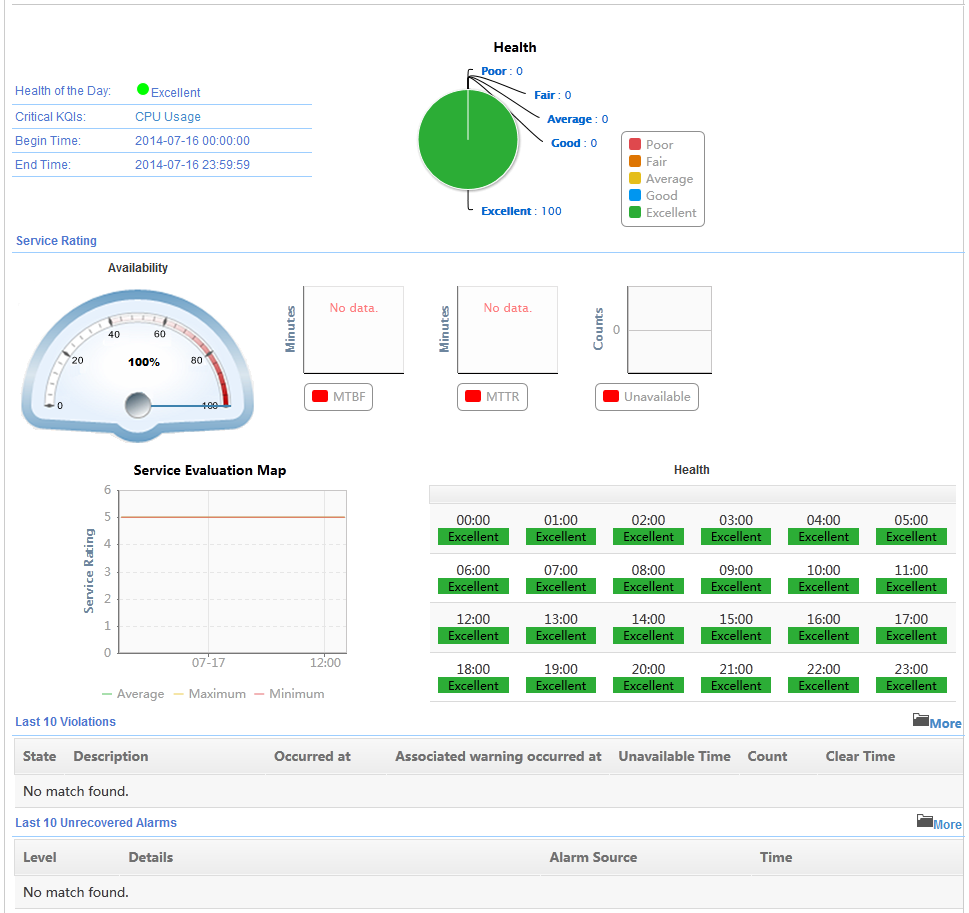
Health area fields:
· Summary Pane—Displays the health status, critical KQI, start time, and end time. Click the name of the critical KQI to view the critical KQI information.
· Health—Displays the percentage information relating to the overall health in a pie chart during the selected time range.
· Availability—Displays the availability percentage of the service during the selected time range in a dashboard.
· MTBF—Displays the Mean Time Between Failures of the service in a bar chart to reflect the unavailability ratio.
· MTTR—Displays the Mean Time to Repair of the service in a bar chart to reflect the respond efficiency.
· Unavailability—Displays the number of times the service was unavailable.
· Service Evaluation Map—Displays the average value, the maximum, and the minimum of the service rating in a line chart.
· Health—Displays the health status for each time range unit in a table. If no data exists, the field displays hyphens (- -).
· Last 10 Violations—Lists basic
information about the last 10 violations. Basic information includes the State, Description, Occurred at, Unavailable Time, and Count. If no
violation occurs in the service or no violation generation rules exist in the
SLA, this list displays No
match found. Click the More
icon ![]() to view
all violations.
to view
all violations.
· Last 10 Unrecovered Alarms—Lists basic
information about the last 10 unrecovered alarms. The basic information
includes Level, Details,
Alarm Source, and Time.
If
no alarm occurs in the service or no alarm generation rules exist in the SLA,
this list displays No match
found. Click the More
icon ![]() to view
all violations.
to view
all violations.
KQI
The KQI area displays statistics for all the KQIs in an SLA. Each KQI has the same layout, as shown in Figure 21.
Figure 21 KQI area
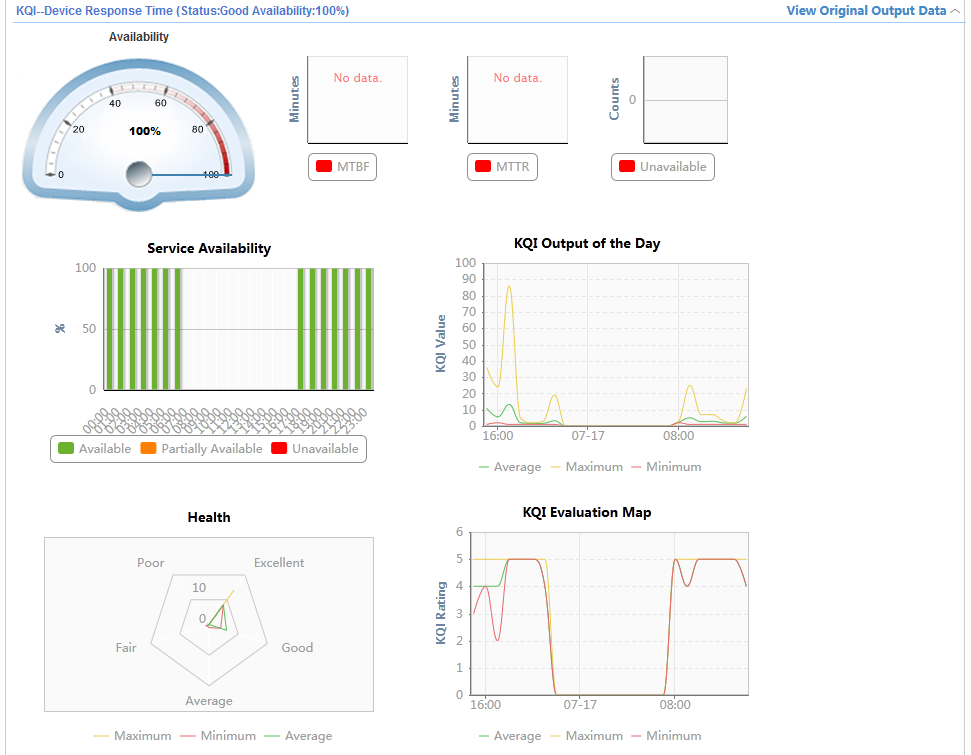
KQI area fields:
· KQI Name—Displays the KQI name, health status, and availability in format of KQI—KQI Name (Status: KQI health status Availability: KQI availability). For example, Status: Good Availability: 100%.
· View Original Output Data—Click this link to view all KPI data in the KQI.
· Availability—Displays the availability percentage of the KQI during the measuring time in a dashboard.
· MTBF—Displays the Mean Time Between Failures of the KQI in a bar chart, reflecting the unavailability ratio.
· MTTR—Displays the Mean Time to Repair of the KQI in a bar chart, reflecting the respond efficiency.
· Unavailability—Displays the number of times the KQI was unavailable.
· Service Availability—Displays the percentage of availability at each time range unit in a bar chart.
· KQI Output of the Day—Displays the KQI value during the selected time range in a line chart.
· Health—Displays the health status for each time range unit in a table. If no data exists, the field displays hyphens (- -).
· KQI Evaluation Map—Displays the average value, the maximum, and the minimum of the KQI rating in a line chart.
Configuring path analyses
SHM uses the path analysis function to detect the path change from a source to a destination. You can obtain, baseline, and poll paths from the source to the destination, and set the alarm policy for inconsistent polling results.
Viewing the path analysis list
1. Click the Service tab.
2. From the navigation tree, click Service Health Manager > Path Analysis.
The path analysis list page appears.
Path analysis list contents
¡ Name—Name of the path analysis.
¡ Source Device IP—IP address of the source device on the path.
¡ Destination Device IP—IP address of the destination device on the path.
¡ Polling Result—Latest polling result.
¡ Creation Time—Time when the path analysis was added.
¡ Operation—This column contains the following icons:
- Modify—Click the Modify icon ![]() to modify the path analysis. For more information, see
"Modifying a path analysis."
to modify the path analysis. For more information, see
"Modifying a path analysis."
- Delete—Click the Delete icon ![]() to delete the path analysis. For more information,
see "Deleting a path analysis."
to delete the path analysis. For more information,
see "Deleting a path analysis."
- View Latest Polling Result—Click the View Latest Polling Result
icon ![]() to view
the latest polling result. For more information, see "Viewing the latest polling result."
to view
the latest polling result. For more information, see "Viewing the latest polling result."
- Poll—Click the Poll icon ![]() to manually poll the path from the source to the destination. Refresh
the page to view the polling
result.
to manually poll the path from the source to the destination. Refresh
the page to view the polling
result.
Viewing the path analysis details
1. Access the path analysis list page.
2. In the path analysis list, click the name of the target path analysis.
The path analysis details page appears.
¡ The Basic Information area displays the following basic parameters of the path analysis:
- Name—Name of the path analysis.
- Source Device IP—IP address of the source device on the path.
- Destination Device IP—IP address of the destination device on the path.
- Polling Interval (Minutes)—Path polling interval in minutes.
- Alarm Policy—Alarm policy for inconsistent path polling results.
¡ The Path Information area displays information about all baseline paths.
Querying path analyses
1. Access the path analysis list page.
2. In the Query area, enter a partial or complete path analysis name in the Name field.
This field supports fuzzy matching.
3. Click Query.
All matching path analyses are listed.
Click Reset to set the query criteria to default and display all path analyses.
Adding a path analysis
1. Access the path analysis list page.
2. Click Add.
The page for adding a path analysis appears.
3. Configure the basic parameters for the path analysis:
¡ Name—Enter a name for the path analysis.
¡ Source Device IP—Click the Select Device icon ![]() , select the source device, and then select
the source IP address.
, select the source device, and then select
the source IP address.
¡ Destination Device IP—Click the Select Device icon ![]() , and select the
destination device. The destination IP address appears
in the box.
, and select the
destination device. The destination IP address appears
in the box.
¡ Polling Interval (Minutes)—Enter a polling interval in the range of 5 to 300 minutes.
¡ Alarm Policy—Select an alarm policy for inconsistent polling results. Options are Never (No Alarm) and Immediately (Triggers Alarm At Once). If you select the Immediately (Triggers Alarm At Once) option, an alarm is triggered if the polling result is inconsistent.
4. Obtain or define paths between the source and destination devices by using the following methods:
¡ Click Path Topology to get all paths from the path topology function. The obtained paths are displayed in the path list.
¡ Click Traceroute Path to get the path from the real-time traceroute result. The obtained path is displayed in the path list.
¡ Click Add, and then add intermediate device IP addresses in the window that appears. Enter an IP address in the IP Address column. To add multiple IP addresses, click Add in the Action column. To confirm the configuration, click OK.
You can also add intermediate device IP addresses after you get paths from the path topology function or the traceroute result.
5. Specify baseline paths by selecting paths in the Baseline column.
6. Click OK.
Modifying a path analysis
1. Access the path analysis list page.
2. Click the Modify
icon ![]() for a
path analysis.
for a
path analysis.
3. Modify the parameters on the Modify Path page.
For information about path analysis configuration parameters, see "Adding a path analysis."
4. Click OK.
Deleting path analyses
You can delete one or multiple path analyses.
Deleting a path analysis
1. Access the path analysis list page.
2. Click the Delete
icon ![]() for the
path analysis you want to delete.
for the
path analysis you want to delete.
3. In the confirmation dialog box that appears, click OK.
Deleting multiple path analyses
1. Access the path analysis list page.
2. Select the path analyses you want to delete.
3. Click Delete.
4. In the confirmation dialog box that appears, click OK.
Viewing the latest polling result
1. Access the path analysis list page.
2. Click the View Latest
Polling Result icon ![]() for the target path analysis.
for the target path analysis.
The Latest Polling Result page appears.
¡ The Basic Information area displays basic parameters of the path analysis:
- Name—Name of the path analysis.
- Source Device IP—IP address of the source device on the path.
- Destination Device IP—IP address of the destination device on the path.
- Polling Interval (Minutes)—Polling interval in minutes.
- Alarm Policy—Alarm policy for the inconsistent polling result.
¡ The Path Information area displays the path information of the path analysis:
- All Paths—All baseline paths.
- Latest Polling Result—Latest polling result of the path analysis. An alarm can be triggered when the path obtained in the polling is not consistent with a baseline path.
Manually polling paths
SHM periodically polls the paths from the source to the destination devices in the path analyses. You can also manually poll these paths.
Polling a path
1. Access the path analysis list page.
2. Click the Poll
icon ![]() for the
target path analysis.
for the
target path analysis.
Refresh the page to view the polling result.
Polling multiple paths
1. Access the path analysis list page.
2. Select multiple path analyses.
3. Click Poll.
Refresh the page later to view the polling result.
Configuring network inspection
Network inspection collects data from devices to evaluate whether an enterprise network meets the basic security requirements of devices. This module ensures the security and stability of the network.
Network inspection uses the following mechanism:
· Uses collection templates to associate device models with collection items. The collection times specify the data to be collected.
· Executes collection tasks to collect data from devices based on the collection templates.
Based on the collected data, network inspection generates collection results, points out vulnerabilities, and allows you to fix violating devices.
The Network Inspection page provides accesses to the following pages:
· Collection Task—Provides centralized management of collection tasks, and allows you to fix vulnerabilities on devices.
· Task History—Provides execution records of collection tasks and downloadable inspection reports.
· Collection Template—Provides associations of collection items with device models for collection tasks to collect data from devices.
· Collection Item—Provides collection items for collection templates.
· Options—Specifies inspection report templates for task history.
To access the Network Inspection page:
1. Click the Service tab.
2. From the navigation tree, select Service Health Manager > Network Inspection.
Managing collection tasks
A collection task inspects basic configurations and status of devices at a scheduled time. The Collection Task page allows you to perform the following tasks:
· Add, modify, and delete collection tasks.
· Enable and disable collection tasks.
· View collection task history.
· Fix violating devices.
Viewing the collection task list
1. Click the Service tab.
2. From the navigation tree, select Service Health Manager > Network Inspection > Collection Task.
The collection task list page appears.
Collection task list contents
¡ Status—Status of the collection task. The status can be Running, Finished, Enabled, or Disabled.
¡ Task Name—Name of the collection task. Click the name to view detailed information about the collection task. For more information, see "Viewing collection task details."
¡ Schedule Type—Schedule type of the collection task. The schedule type can be Immediate or Periodical.
¡ Creation Time—Time when the collection task was created.
¡ Operation—This column provides icons for you to enable or disable a periodical collection task. For more information, see "Modifying the status of a collection task."
¡ Inspection Result—Result of the most recent execution for the collection task. The result can be:
- Failed—IMC failed to execute the collection task.
- Major or Normal—IMC successfully executed the collection task. The inspection result displays the highest alarm state of devices. Hover your cursor over the result to see the number of devices in each state.
¡ Fix—Click the Fix
icon ![]() to fix violating
devices. For more information, see "Fixing violating devices." This icon appears only when IMC detected violating device in
the most recent execution of the collection task.
to fix violating
devices. For more information, see "Fixing violating devices." This icon appears only when IMC detected violating device in
the most recent execution of the collection task.
¡ Modify—Click the Modify icon ![]() to modify the parameters of a periodical collection task. For more
information, see "Modifying a collection task."
to modify the parameters of a periodical collection task. For more
information, see "Modifying a collection task."
¡ History—Click the History icon ![]() to view execution records of the collection task. For more
information, see "Viewing collection task history."
to view execution records of the collection task. For more
information, see "Viewing collection task history."
Querying collection tasks
1. Access the collection task list page.
2. In the query box on the top right of the collection task list area, enter a partial or complete collection task name.
This field supports fuzzy matching.
3. Click the Query
icon ![]() .
.
All matching collection tasks are displayed in the collection task list.
Viewing collection task details
1. Access the collection task list page.
2. Click a collection task name.
The collection task details page appears.
Task Attributes
¡ Task Name—Name of the collection task.
¡ Schedule Type—Schedule type of the collection task.
¡ Begin Time—Scheduled execution time for the periodical collection task.
¡ Description—Description of the collection task.
Device Information
This area displays a list of devices that the collection task inspects. Contents of the device list include Status, Device Name, IP Address, Device Model, and Device Source.
Adding a collection task
1. Access the collection task list page.
2. Click Add.
The Add Task page appears.
3. In the Task Attributes area, configure basic information for the collection task:
¡ Task Name—Enter a unique name for the collection task.
¡ Schedule Type—Select a schedule type for the collection task:
- Immediate—Executes the collection task immediately after the collection task is created.
- Periodical—Periodically executes the collection task on a scheduled time.
¡ Begin Time—Configure the execution time for the collection task. This parameter appears only when you select Periodical as the schedule type.
¡ Description—Enter a description for the collection task.
4. In the Select Target area, select the devices to be inspected by the collection task by using one of the following methods:
¡ To select devices:
- Select the Select Device option.
- Click Select Device.
- Select the devices to be inspected, and then click OK.
The devices appear in the target device list.
¡ To select devices by device model:
- Select the Select Model option.
- Click Select Model.
- Select the device models to be inspected, and then click OK.
- In the filtered device list area, click Select Device.
- On the window that appears, select the devices to be excluded from the collection task, and then click OK.
The window displays only devices of the selected models.
¡ To select devices by custom view:
- Select the Select Custom View option.
- Click Select View.
- Select the custom views that include the devices to be inspected, and then click OK.
The custom views appear in the view list.
5. You can delete devices or custom views by using the following methods:
¡ Click
the Delete icon ![]() to delete a single device or custom view.
to delete a single device or custom view.
¡ Click Delete All to delete all devices or custom views.
6. Click OK.
The collection task appears in the collection task list.
Modifying a collection task
1. Access the collection task list page.
2. Click the Modify
icon ![]() for a
collection task.
for a
collection task.
The Modify Task page appears. You can modify only periodical collection tasks.
3. Modify the following parameters:
¡ Begin Time—Modify the execution time for the collection task.
¡ Description—Modify the description for the collection task.
4. Click OK.
Deleting collection tasks
1. Access the collection task list page.
2. Select one or multiple collection tasks.
You cannot delete collection tasks in Running state.
3. Click Delete.
A confirmation dialog box appears.
4. Click OK.
Deleting a collection task also deletes its execution records.
Modifying the status of a collection task
1. Access the collection task list page.
2. Modify the status of a collection task:
¡ Click
![]() in the Operation column to enable a disabled collection task.
in the Operation column to enable a disabled collection task.
¡ Click
![]() in the Operation column to disable an enabled collection task.
in the Operation column to disable an enabled collection task.
¡ Select collection tasks in Enabled or Disabled state and click Start to immediately execute the collection tasks.
Viewing collection task history
1. Access the collection task list page.
2. Click the History
icon ![]() for a
collection task.
for a
collection task.
The task history list page appears. The task history list displays execution records of the collection task.
Task history list contents
¡ Task Name—Collection task name. Click the name to view detailed information about the collection task.
¡ Task Description—Collection task description.
¡ Start Time—Execution start time of the execution record.
¡ End Time—Execution end time of the execution record.
¡ Result—Result for the execution record. Click the result to view detailed information about the execution result.
¡ Operation—This column contains the following icons:
- Summary Report—Click
the Summary Report icon ![]() to view the
summary report for the execution record.
to view the
summary report for the execution record.
- Collection Report—Click the Collection Report icon ![]() to view the
collection report for the execution record.
to view the
collection report for the execution record.
- Download—Click
the Download icon ![]() to download the inspection reports for the execution
record.
to download the inspection reports for the execution
record.
Fixing violating devices
1. Access the collection task list page.
2. Click the Fix
icon ![]() for a
collection task.
for a
collection task.
The Fixing Commands tab of the Fix Violating Devices page appears.
The Fix icon ![]() appears only when
the collection task detected violating devices.
appears only when
the collection task detected violating devices.
3. In the Deployment Strategy area, select deployment strategies for fixing violating devices:
¡ View the change before and after deployment.
¡ Deployment stopped. The configuration running on the device is not consistent with the latest running configuration backed up by iMC.
¡ Before deployment, back up the device's running configuration to iMC.
¡ Before deployment, save the device's running configuration as a startup configuration.
¡ After deployment, back up the device's running configuration to iMC.
¡ After deployment, save the device's running configuration as a startup configuration.
The value of the File Type to be Deployed field is fixed to Running Configuration.
4. In the Fixing Commands area, select violating devices and enter the commands to be executed.
5. Click Next.
The Set Task Attributes tab appears.
6. Configure the following parameters:
¡ Task Name—Enter a task name. You can use the default task name Task date time.
¡ Task Type—The value of this field is fixed to Fix Violating Devices.
¡ Schedule Type—The value of this field is fixed to Once.
¡ Schedule Time—Configure the time to fix the devices:
- Immediately—Fix the devices immediately after the fixing task is created.
- Scheduled—Fix the devices on a scheduled time. If you select this option, configure the time to fix the devices.
By default, the fixing task is executed in one hour after the fixing task is created.
¡ Schedule Sequence—Select a schedule sequence: Concurrent or Sequential.
¡ Error Handling—The value of this field is fixed to Stop Deployment on the Current Device.
¡ Task Description—Enter a description for the fixing task. You can use the default description Fix Violating Devices.
7. Click Finish.
Managing task history
The Task History page provides the execution records for all collection tasks and downloadable inspection reports for each execution record.
Viewing the task history list
1. Click the Service tab.
2. From the navigation tree, select Service Health Manager > Network Inspection > Task History.
The task history list page appears.
Task history list contents
¡ Task Name—Collection task name. Click the name to view detailed information about the collection task. For more information, see "Viewing collection task details."
¡ Task Description—Collection task description.
¡ Start Time—Execution start time of the execution record.
¡ End Time—Execution end time of the execution record.
¡ Result—Result for the execution record. Click the result to view detailed information about the execution result. For more information, see "Viewing execution results."
¡ Operation—This column contains the following icons:
- Summary Report—Click
the Summary Report icon ![]() to view the
summary report for the execution record.
to view the
summary report for the execution record.
- Collection Report—Click the Collection Report icon ![]() to view the
collection report for the execution record.
to view the
collection report for the execution record.
- Download—Click
the Download icon ![]() to download the inspection reports for the execution
record.
to download the inspection reports for the execution
record.
For more information about the summary report and the collection report, see "Viewing inspection reports."
Querying task history
You can query task execution records by using the basic query or advanced query function.
Basic query
1. In the query box on the top right of the task history list area, enter a partial or complete collection task name.
This field supports fuzzy matching.
2. Click the Query
icon ![]() .
.
All matching execution records are displayed in the task history list.
Advanced query
1. Click the Advanced
icon ![]() next to the query box.
next to the query box.
2. Specify one or more of the following query criteria:
¡ Task Name—Enter a collection task name. This field supports fuzzy matching.
¡ Time Range—Specify an execution start time range.
Empty fields are ignored.
3. Click Query.
All matching execution records are displayed in the task history list.
4. Click Reset to set the query criteria to default and display all execution records in the task history list.
Viewing collection task details
1. Access the task history list page.
2. Click a collection task name.
The collection task details page appears.
Task Attributes
¡ Task Name—Name of the collection task.
¡ Schedule Type—Schedule type of the collection task.
¡ Begin Time—Scheduled execution time for the periodical collection task.
¡ Description—Description of the collection task.
Device Information
This area displays a list of devices that the collection task inspects. Contents of the device list include Status, Device Name, IP Address, Device Model, and Device Source.
Viewing execution results
1. Access the task history list page.
2. Click the execution result in the Result column for an execution record.
The detailed execution result list page appears. The list displays execution details for all inspected devices. Contents of the detailed execution result list include Device Name, Start Time, End Time, Result, and Device Report.
3. Click the Device Report
icon ![]() for a device.
for a device.
The inspection report for the device appears.
Viewing inspection reports
Inspection reports for an execution record include the summary report and the collection report.
Viewing the summary report
1. Access the task history list page.
2. Click the Summary
Report icon ![]() for an execution record.
for an execution record.
The summary report for the execution record appears. The summary report provides the following information:
¡ Firm Basic Information—Device firm basic information.
¡ Inspect Collect Information—Basic information about the collection task.
¡ Inspect Summary Problems—Number of the devices that meet the requirement of each collection item and the total number of devices.
¡ Major problems analysis & explain—Severity level, requirement, violating devices, and advice for each collection item.
Viewing the collection report
1. Access the task history list page.
2. Click the Collection
Report icon ![]() for an execution record.
for an execution record.
The collection report for the execution record appears. By default, the collection report provides information about the summary report. Figure 22 shows the navigation tree for the collection report.
Figure 22 Collection report navigation tree
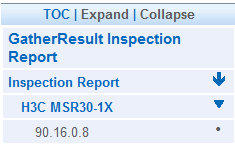
3. Click the Inspection Report node.
The device models inspected by the collection task appear.
4. Click a device model node.
All devices of the device model appear under the device model node. The inspection report for the devices appears.
5. Click a device node.
The inspection report for the device appears.
Downloading inspection reports
1. Access the task history list page.
2. Click the Download
icon ![]() for an
execution record.
for an
execution record.
All inspection reports for the execution record are downloaded.
Deleting task history
1. Access the task history list page.
2. Select one or multiple execution records.
3. Click Delete.
A confirmation dialog box appears.
4. Click OK.
Deleting task execution records does not delete the corresponding collection tasks.
Managing collection templates
A collection template associates a device model with specific collection items. The Collection Template page allows you to add, configure, and delete collection templates, and test collection items.
Viewing the collection template list
1. Click the Service tab.
2. From the navigation tree, select Service Health Manager > Network Inspection > Collection Template.
The collection template list page appears.
Collection template list contents
¡ Collection Series—Device model of the
collection template. Click ![]() to display the
collection items that the template includes. Click a
collection item name to view detailed information about the collection item.
to display the
collection items that the template includes. Click a
collection item name to view detailed information about the collection item.
¡ Command Content—Commands executed by a collection item.
¡ Devices—Number of the devices that match the collection template in the IMC Enterprise and Standard platform.
¡ Type—Type of the collection template. The type can be System Defined or User Defined.
¡ Device Vendor—Vendor of the device model specified in the collection template.
¡ Description—Description of the collection template.
¡ Operation—This column contains the following icons:
- Configuration—Click
the Configuration icon ![]() to modify the
settings of the collection template. For more information, see "Configuring a collection template."
to modify the
settings of the collection template. For more information, see "Configuring a collection template."
- Test—Click the Test icon ![]() to test a
collection item. For more information, see "Testing a collection item."
to test a
collection item. For more information, see "Testing a collection item."
Querying collection templates
1. In the query box on the top right of the collection template list area, enter a partial or complete device model name.
This field supports fuzzy matching.
2. Click the Query
icon ![]() .
.
All matching collection templates are displayed in the collection template list.
Adding a collection template
1. Access the collection template list page.
2. Click Add.
The Add Collection Template page appears.
3. Configure the following parameters:
¡ Collection Series—Click Select Device Series to select a device model.
¡ Group—Select a collection item group.
¡ Collection Item—The left list displays available collection items. The right list displays selected collection items. Use the following icons to select collection items:
- Click the Add icon ![]() to add one or
more collection items to the selected item list.
to add one or
more collection items to the selected item list.
- Click the Add All icon ![]() to add all available collection items to the selected
item list.
to add all available collection items to the selected
item list.
- Click the Remove icon ![]() to remove one or
more collection items from the selected item list.
to remove one or
more collection items from the selected item list.
- Click the Remove All icon ![]() to remove all
collection items from the selected item list.
to remove all
collection items from the selected item list.
4. Click OK.
Configuring a collection template
1. Access the collection template list page.
2. Click the Configure
icon ![]() for a collection template.
for a collection template.
The Configure dialog box appears.
3. Modify the following parameters:
¡ Group—Select a collection item group.
¡ Collection items—The left list displays available collection items. The right list displays selected collection items. Use the following icons to select collection items:
- Click the Add icon ![]() to add
one or more collection items to the selected item list.
to add
one or more collection items to the selected item list.
- Click the Add All icon ![]() to add
all available collection items
to the selected item list.
to add
all available collection items
to the selected item list.
- Click the Remove icon ![]() to
remove one or more collection items from the selected item list.
to
remove one or more collection items from the selected item list.
- Click the Remove All icon ![]() to
remove all collection items from the selected item list.
to
remove all collection items from the selected item list.
4. Click OK.
Testing a collection item
1. Access the collection template list page.
2. Click ![]() for a collection template.
for a collection template.
All collection items of the collection template appear.
3. Click the Test
icon ![]() for a
collection item.
for a
collection item.
The Collection Item Test dialog box
appears. The Test icon ![]() is grayed out if no device matches the device model of the
collection template.
is grayed out if no device matches the device model of the
collection template.
4. From the Select Device list, select a device.
The Select Device list displays all devices that match the device model of the collection template in IMC.
5. Click Collection Test.
The collection result is displayed after the test is completed.
6. Click Analysis Test.
The analysis result for the collection test is displayed.
Deleting collection templates
1. Access the collection template list page.
2. Select one or multiple user-defined collection templates.
3. Click Delete.
A confirmation dialog box appears.
4. Click OK.
Managing collection items
A collection item executes commands to collect data from devices, analyzes the collected data, and provides advice for users to remove vulnerabilities. The Collection Item page allows you to add, modify, and delete collection items, and view detailed information about collection items.
Viewing the collection item list
1. Click the Service tab.
2. From the navigation tree, select Service Health Manager > Network Inspection > Collection Item.
The collection item list page appears.
Collection item list contents
¡ Name—Name of the collection item or collection item group. Click the name to view detailed information about the collection item or to view collection items of the group. For more information, see "Viewing collection item details."
¡ Command Content—Commands executed by the collection item.
¡ Description—Description of the collection item or collection item group.
¡ Type—Type of the collection item or collection item group. The type can be System Defined or User Defined.
¡ Operation—This column contains the following icons:
- Modify—Click the
Modify icon ![]() to modify a user-defined collection item or user-defined group. For more information, see "Modifying a user-defined collection item" and "Modifying basic information about a
collection item group."
to modify a user-defined collection item or user-defined group. For more information, see "Modifying a user-defined collection item" and "Modifying basic information about a
collection item group."
- Modify Threshold—Click Modify Threshold to modify the threshold for a system-defined collection item. For more information, see "Modifying the threshold for a system-defined collection item."
Querying collection items and collection item groups
1. In the query box on the top right of the collection item list area, enter a partial or complete collection item name or collection item group name.
This field supports fuzzy matching.
2. Click the Query
icon ![]() .
.
All matching collection items or collection item groups are displayed in the collection item list.
Viewing collection item details
Viewing collection item group details
1. Access the collection item list page.
2. Click the name of a collection item group.
The member list of the collection item group appears.
Collection item group member list contents
¡ Name—Name of the collection item or subgroup. Click the name to view detailed information about the collection item or subgroup.
¡ Command Content—Commands executed by the collection item.
¡ Description—Description of the collection item or subgroup.
¡ Type—Type of the collection item or subgroup. The type can be System Defined or User Defined.
¡ Operation—This column provides the Modify icon ![]() . Click the icon to modify the collection item or subgroup. For more information, see
"Modifying a collection item" and "Modifying basic information about a
collection item group."
. Click the icon to modify the collection item or subgroup. For more information, see
"Modifying a collection item" and "Modifying basic information about a
collection item group."
Member list toolbar
¡ Add—Click Add to add a collection item to the collection item group. For more information, see "Adding a collection item." This button is available only to user-defined collection item groups.
¡ Add Group—Click Add Group to add a subgroup to the collection item group. For more information, see "Adding a collection item group." This button is available only to user-defined collection item groups.
¡ Delete—Click Delete to remove members from the collection item group. This button is available only to user-defined collection item groups.
¡ Back to Upper List—Click Back to Upper List to return to the collection item list page.
Viewing collection item details
Click the name of a collection item.
The collection item details page appears.
Collection item details
· Item Name—Name of the collection item.
· Command Content—Commands executed by the collection item.
· Report Title—Title of the collection item in inspection reports.
· Requirement—Requirement for the collected data.
· Advice—Advice in inspection reports when the collected data does not meet the requirement of the collection item.
· Description—Description of the collection item.
· Severity—Severity level generated when the collected data does not meet the requirement of the collection item.
· Rule Type—Type of the rule for analyzing the collected data. The rule type can be System Defined, Match Rule, Python Script, or Display.
IMC also displays the corresponding match rule, threshold, or python script name for the rule.
Adding a collection item
1. Access the collection item list page.
2. Click Add.
The Add Collection Item page appears.
3. Configure the following parameters:
¡ Item Name—Enter a name for the collection item.
¡ Command Content—Enter the commands that the collection item executes.
¡ Report Title—Enter the title to be displayed for the collection item in inspection reports.
¡ Requirement—Enter the requirement for the collected data.
¡ Advice—Enter the advice for users when the collected data does not meet the requirement.
¡ Description—Enter a description for the collection item.
¡ Severity—Select a severity level for the collected data that does not meet the requirement: Common or Major.
¡ Rule Type—Select a rule type:
- Match Rule—Select this type to specify a regular expression in the Command Rule Information area.
- Python Script—Select this type to import a python script.
- Display—Select this type to display the original collected data in inspection reports.
¡ Group—Select a group for the collection item.
4. Click OK.
Modifying a collection item
Modifying a user-defined collection item
1. Access the collection item list page.
2. Click the Modify
icon ![]() for a user-defined
collection item.
for a user-defined
collection item.
The Modify Collection Item page appears.
3. Modify the parameters for the collection item. (See "Adding a collection item.")
4. Click OK.
Modifying the threshold for a system-defined collection item
1. Access the collection item list page.
2. Click the name of a collection item group.
The collection item group member list page appears.
3. Click Modify Threshold for a collection item.
4. Modify the threshold.
5. Click OK.
Deleting collection items and collection item groups
1. Access the collection item list page.
2. Select one or multiple collection items or collection item groups.
You can delete only user-defined collection items or collection item groups.
3. Click Delete.
A confirmation dialog box appears.
4. Click OK.
Deleting a collection item group also deletes the group's members.
Adding a collection item group
1. Access the collection item list page.
2. Click Add Group.
The Add Group dialog box appears.
3. Configure the following parameters:
¡ Group Name—Enter a name for the collection item group.
¡ Description—Enter a description for the collection item group.
4. Click OK.
The collection item group appears in the collection item list.
Modifying a user-defined collection item group
You can modify basic information for a user-defined collection item group, and add, delete, and modify members for the group.
Modifying basic information about a collection item group
1. Access the collection item list page.
2. Click the Modify
icon ![]() for a
collection item group.
for a
collection item group.
The Modify Group page appears.
3. Modify the description for the group.
4. Click OK.
Managing members of a collection item group
1. Access the member list page for a collection item group.
2. Click Add to add a collection item to the collection item group. For more information, see "Adding a collection item."
3. Click Add Group to add a subgroup to the collection item group. For more information, see "Adding a collection item group."
4. Click Delete to delete one or multiple collection items and subgroups.
5. Click the Modify
icon ![]() for a
collection item to modify settings of the collection item. For more
information, see "Modifying a collection item."
for a
collection item to modify settings of the collection item. For more
information, see "Modifying a collection item."
Configuring options
The Options page allows you to configure the types of inspection reports, and import cover files and copyright files for inspection reports.
Viewing report types and report templates
1. Click the Service tab.
2. From the navigation tree, select Service Health Manger > Network Inspection > Options.
The network inspection options page appears.
Report Type
This area displays the types of reports that can be downloaded: HTML, Word, and PDF.
The HTML option is selected and not configurable.
Report Template
This area displays a list of inspection report templates. Information about the templates includes:
¡ Template Name—Name of the template.
¡ Description—Description of the template.
¡ Type—Type of the template, which can be System Defined or User Defined.
¡ Status—Status of the template:
- Enabled—The template is enabled.
- Disabled—The template is disabled. Click Disabled to enable the template. For more information, see "Enabling an inspection report template."
¡ Delete—Click the Delete icon ![]() to delete the template. For more
information, see "Deleting inspection report templates."
to delete the template. For more
information, see "Deleting inspection report templates."
Configuring the report types
In the Report Type area, select the report types that you want IMC to generate.
Uploading an inspection report template
1. In the Report Template area, click Upload.
2. Configure the following parameters:
¡ Template Name—Enter a name for the template.
¡ Description—Enter a description for the template.
¡ Cover File—Import a cover file for inspection reports.
¡ Copyright File—Import a copyright file for inspection reports.
3. Click OK.
Enabling an inspection report template
In the Report Template area, click Disabled for a template to enable the template. The status of the template becomes Enabled. The status of the former enabled template becomes Disabled, because only one template can be enabled at one time.
Deleting inspection report templates
You cannot delete enabled templates and system-defined templates.
Deleting a single template
1. In the Report Template
area, click the Delete icon ![]() for a template.
for a template.
A confirmation dialog box appears.
2. Click OK.
Bulk deleting templates
1. In the Report Template area, select one or multiple templates.
2. Click Delete.
A confirmation dialog box appears.
3. Click OK.
SHM configuration examples
The following information provides SHM configuration examples for you to evaluate the network service, and locate indexes that affect the network service.
Evaluating network service configuration example
Network requirements
As shown in Figure 23, it takes users a long time to log in to the VPN gateway and access the internal servers. The pre-analysis shows problems occur on the VPN gateway and the core router. To identify the critical factor that affects the network service, configure an SHM SLA to monitor those devices and the link between them.
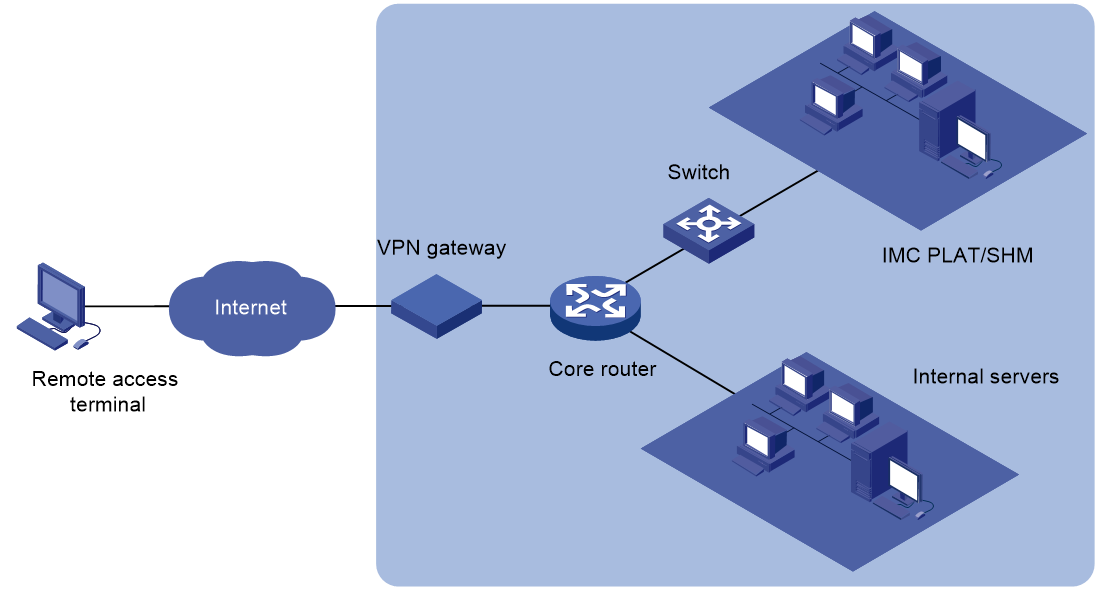
Requirement analysis
The main factors that can cause poor network services include the following items:
· Performance of the link between the VPN gateway and the core router, such as jitter, one-way average delay, and unreachable rate.
· Response time and unreachable rate of the VPN gateway and the core router.
To identify the critical factor that affects the network service, you can configure an SLA as described in Table 17 that monitors and measures the KQI on the target objects.
|
Monitored object |
Object type |
System-defined KQI |
KQI data source |
|
VPN gateway and core router |
Key device |
· Device unreachable · Device response time |
Performance Management |
|
Link between the VPN gateway and the core router |
Key link |
· Unreachable rate · One way average delay · Packet loss rate · Jitter · Average RTT |
NQA instance module |
Configuration procedures
Make sure you have administrator access to perform the following configuration tasks.
Importing the key devices to the IMC Enterprise and Standard platform
Import the VPN gateway and the core router to the IMC Enterprise and Standard platform. For more information, see HPE IMC Enterprise and Standard Platform Administrator Guide.
Adding monitoring attributes on the key devices
This section adds monitoring attributes to the VPN gateway. You can add monitoring attributes to the core router in the same way.
To add monitoring attributes to the VPN gateway:
1. Click the Resource tab.
2. From the left navigation tree, click Performance Management > Monitoring Settings.
The Monitoring Settings page appears.
3. Click the value in the Instances column of the VPN gateway to check whether Device Unreachability Proportion and Response Time of Device are in the Item Name column.
¡ If the two items are displayed in the Item Name column, go to "Creating NQA instances for link monitoring."
¡ If the instance value number is 0, or the two items are not in the Item Name column, go to the following steps to add them.
The page for adding monitoring items appears.
5. In the Select Index area, click Add. Select Response Time of Device (ms) and Device Unreachability Proportion (%) from System-Device Defect, and click OK.
6. In the Select Device area, click Add, and then select the VPN gateway.
Use the default settings for other parameters.
For more information about Performance Management, see HPE IMC Enterprise and Standard Platform Administrator Guide.
Creating NQA instances for link monitoring
Before you create NQA instances, make sure the VPN gateway and the core router support both SNMP and NQA.
To monitor the link between the VPN gateway and the core router, create two NQA instances that each use the basic indexes ICMP echo, UDP echo, and TCP connection. One instance monitors the operations from the VPN gateway to the core router, and the other instance monitor the operations in the opposite direction.
This section creates an NQA instance with the VPN gateway and the core router as the source and destination devices, respectively. You can create the other NQA instance in the same way.
To create the NQA instance:
1. Import the VPN gateway and the core router to the SHM:
a. Click the Service tab.
b. From the left navigation tree, click Service Health Manager > NQA Config > NQA Device.
The NQA Device page appears.
c. Click Import.
The page for importing devices appears.
d. Click Select Device, and select the VPN gateway and the core router.
e. Click OK.
2. Modify device configuration:
a. Enable the NQA client and the NQA server on the VPN gateway and the core router, respectively. For more information, see "Modifying the NQA server or client enabling state."
b. Add a TCP listening service on the core router. For more information, see "Modifying TCP listening services."
c. Add a UDP listening service on the core router. For more information, see "Modifying UDP listening services."
3. Create an NQA type that includes the basic indexes ICMP echo, UDP echo, and TCP connection:
a. Click the Service tab.
b. From the left navigation tree, click Service Health Manager > NQA Config > NQA Type.
The NQA Type page appears.
c. Click Add.
The page for adding an NQA type appears.
d. In the Basic Information area, configure basic information for the NQA type:
- Name—Enter Link for VPN Logon.
- NQA Type Description—Enter monitor the link for VPN logon.
e. In the Basic Index Information area, configure basic indexes for the NQA type:
- Click Add.
- Select Basic from the Index Group Name List in the Query area.
- Select ICMP Echo, UDP Echo, and TCP Connection in the Basic Index Information area.
- Click OK.
The added basic indexes are displayed in
the basic index list. You can click
the Modify icon ![]() to modify the settings for an index.
to modify the settings for an index.
f. Click OK.
Figure 24 Configuring the NQA type
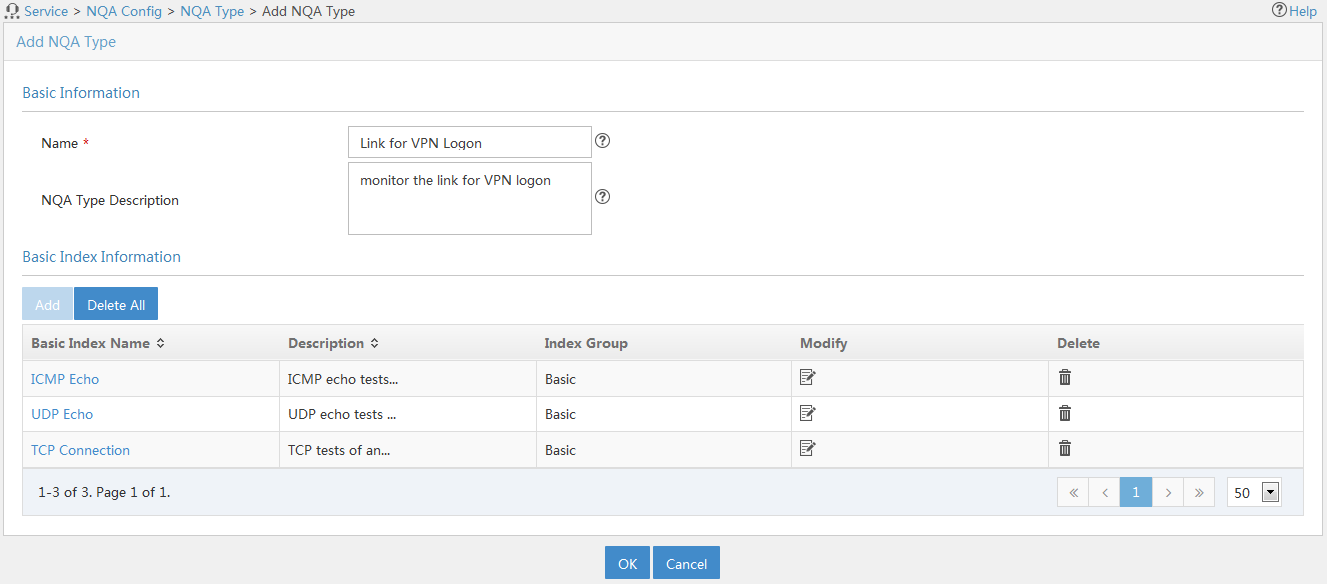
4. Create the NQA instance:
a. Click the Service tab.
b. From the left navigation tree, click Service Health Manager > NQA Instance.
c. Click Add Group.
d. On the page that appears, enter 111 in the NQA Group Name field.
Use the default settings for other parameters.
e. Click OK.
The NQA Groups page appears.
f. Click Add Instance.
The page for adding an NQA instance appears.
Figure 25 Configuring basic parameters for the NQA instance
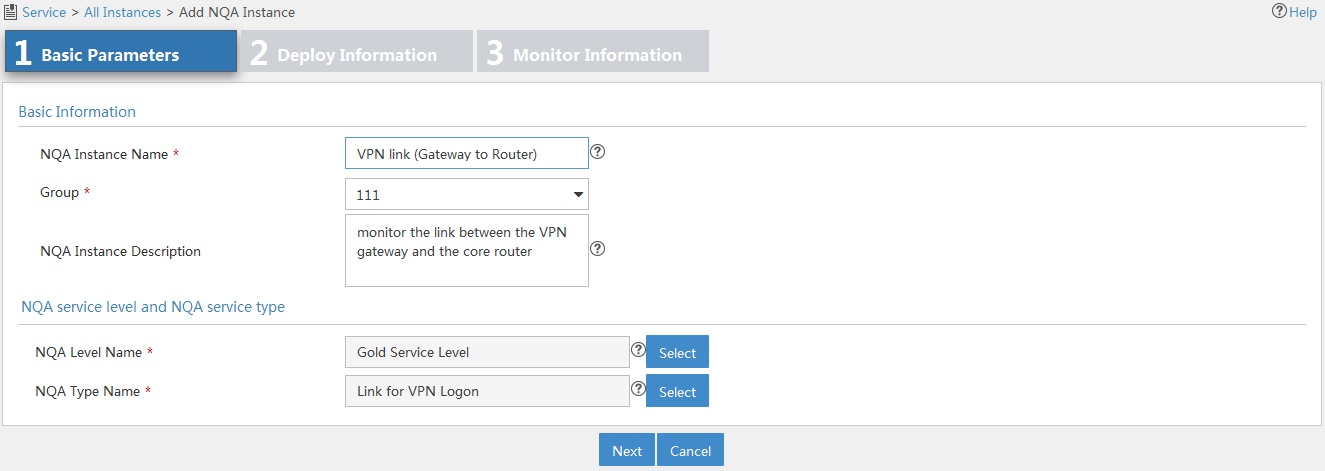
5. Configure basic parameters for the NQA instance:
a. NQA Instance Name—Enter VPN link (Gateway to Router).
b. Group—Select 111.
c. NQA Instance Description—Enter monitor the link between the VPN gateway and the core router.
d. NQA Level Name—Select Gold Service Level.
e. NQA Type Name—Select Link for VPN Logon.
6. Click Next.
The page for configuring deployment information appears.
Figure 26 Configuring deployment information

7. Configure the following parameters:
a. Source Device—Select the VPN gateway.
b. Destination Device—Select the core router.
c. Source IP Address—Select the source IP address for NQA operations.
d. Destination IP Address—Select the destination IP address for NQA operations.
Use the default settings for other parameters.
8. Click Test to check whether the NQA instance is correctly configured.
If the test fails, modify the parameters that you have configured in Figure 26.
9. Click Next.
The page for configuring monitor information appears. Use the default settings on the page.
Figure 27 Configuring monitor information
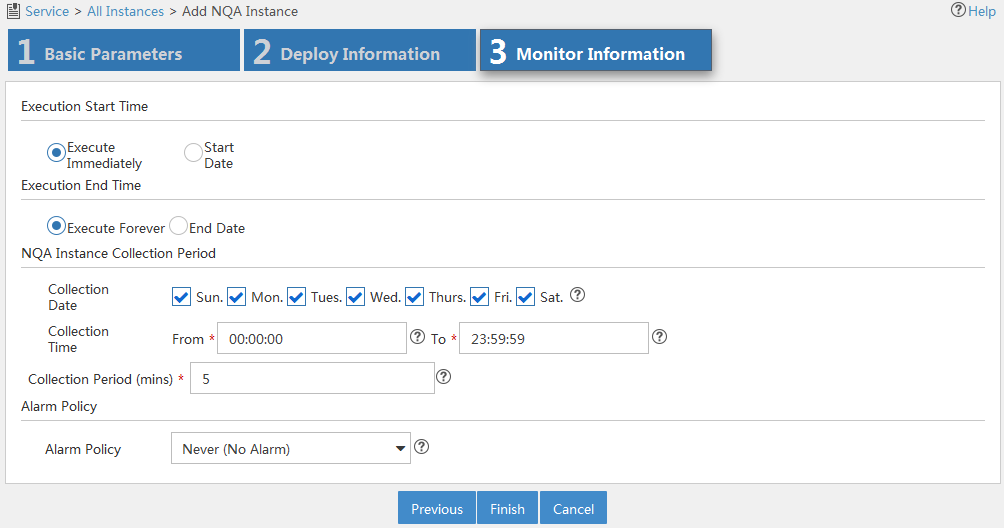
10. Click Finish.
The newly added NQA instance is displayed in the NQA instance list.
For more information about adding NQA groups and creating NQA instances, see " Adding an NQA group" and "Adding an NQA instance," respectively.
Creating an SLA
This configuration example uses system-defined KQIs and requires no service level setting. For more information about configuring KQIs and service levels, see "Adding a KQI " and "Adding a service level."
To create an SLA:
1. Click the Service tab.
2. From the left navigation tree, click Service Health Manager > SLA.
The SLA page appears.
3. Click Add and select Manually Add.
The page for adding an SLA appears.
4. Click Select Device to add the VPN gateway and the core router to the SLA.
The two devices appear in the Resource Topology area. NQA instances between the two devices are also imported and represented by a green dashed line.
5. In the left area of the page, select the following KQIs and drag them to the area above the Resource Topology area.
¡ Select Device Response Time and Device Unreachable from the Device Status KQI class.
¡ Select Jitter, one way average delay, Average RTT, Packet Loss Rate, and Unreachable Rate from the NQA Link Quality KQI class.
Figure 28 Adding SLA monitored objects
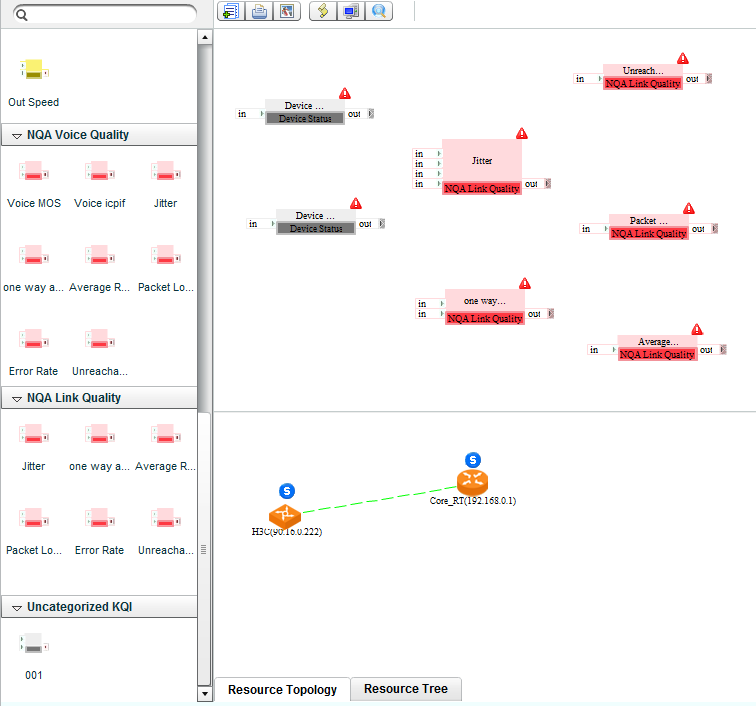
6. Associate the KQIs with the monitored objects:
a. Double-click the icon of a KQI, for example, jitter.
The page for configuring the KQI appears.
b. In the Configure KQI Resources area, select the key link from the Resource Name column.
Use the default settings for other parameters on the page.
To modify the formula in the Configure KQI Formula area, follow the instructions in "Configuring a KQI."
c. Click OK.
The KQI and the monitored objects are associated.
d. Associate other KQIs with the monitored objects in the same way the jitter is associated with the monitored objects.
a. In the tool bar of
the page for adding the SLA, click the Add Service and Quit icon ![]() .
.
b. In the Basic Attributes area, enter VPN SLA in the Name field.
c. In the KQI area, select Device Unreachable, Unreachable Rate, Device Response Time, and Average RTT.
d. In the Rating Method area, select Average.
e. In the Service Rating area, select Available for each rating.
Use the default settings for other parameters on the page.
f. Click OK.
The newly added VPN SLA is displayed in the SLA list.
For more information about creating an SLA, see "Manually adding an SLA."
Figure 29 Setting service properties
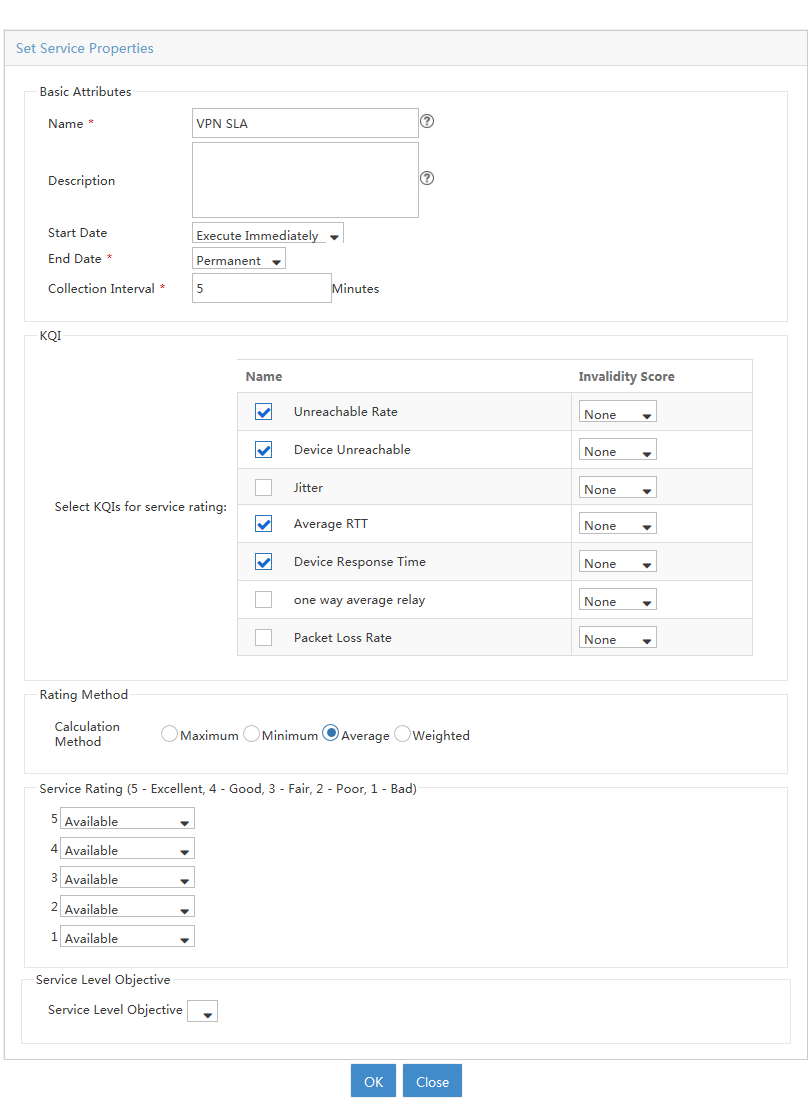
Viewing the SLA report
After the SLA runs for a time period, view the SLA report as follows:
1. Access the SLA page.
2. Click the VPN SLA or the horizontal bar chart in the Health of the Day column in the SLA view list.
The health condition shows that the service level is poor, and the critical KQI is Average RTT within the SLA.
You can click Average RTT to view its KQI details, and click View Original Output Data for the KQI to further examine the network performance.
For more information about the SLA report, see "Understanding SLA reports."
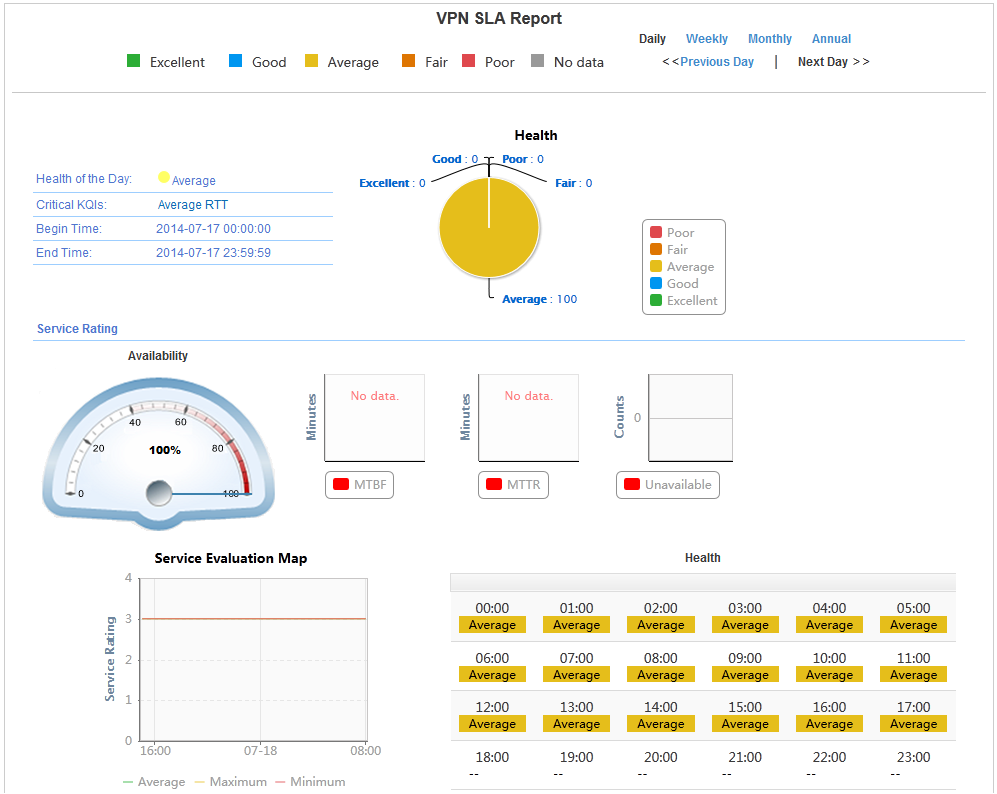
Evaluating voice service configuration example
Network requirements
As shown in Figure 31, users in the network are experiencing unsatisfactory voice call quality.
The pre-analysis shows problems occur on Switch A, Switch B, the voice gateway, and the VCX server. To identify the critical factor that affects the voice service, configure an SHM SLA to monitor the devices and links among Switch A, Switch B, and the voice gateway.
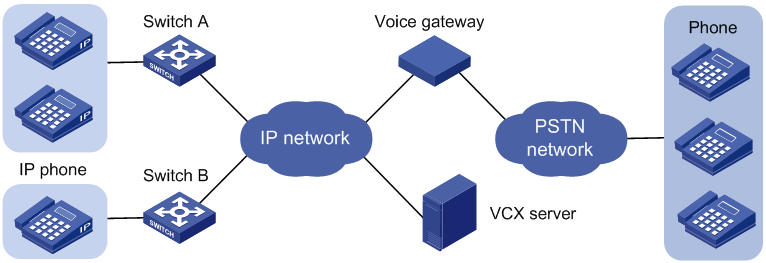
Requirement analysis
The main factors that can affect the voice call quality include the following items:
· Voice performance of key links, such as voice MOS, and unreachable rate.
· Response time and unreachable rate of Switch A, Switch B, the VCX server, and the voice gateway.
To identify the critical factor that affects the network service, you can configure an SLA as described in Table 18 that monitors and measures the KQI on the target objects.
|
Monitored object |
Object type |
System-defined KQI |
KQI data source |
|
· Switch A · Switch B · Voice gateway · VCX server |
Key device |
· Device unreachable · Device response time |
Performance Management |
|
Link between the following devices: · Switch A and Switch B · Switch A and the voice gateway · Switch B and the voice gateway |
Key link |
· Voice ICPIF · Voice MOS · Unreachable rate · Error rate · One way average delay · Packet loss rate · Jitter · Average RTT |
NQA instance module |
Configuration procedures
Make sure you have administrator access to perform the following configuration tasks.
Importing the key devices to the IMC Enterprise and Standard platform
Import Switch A, Switch B, the voice gateway, and the VCX server to the IMC Enterprise and Standard platform. For more information, see HPE IMC Enterprise and Standard Platform Administrator Guide.
Adding monitoring attributes on the key devices
This section adds monitoring attributes to Switch A. You can add monitoring attributes to Switch B, the voice gateway, and the VCX server in the same way.
To add monitoring attributes to Switch A:
1. Click the Resource tab.
2. From the left navigation tree, click Performance Management > Monitoring Settings.
The Monitoring Settings page appears.
3. Click the value in the Instances column of Switch A to check whether Device Unreachability Proportion and Response Time of Device are in the Item Name column.
¡ If the two items are displayed in the Item Name column, go to "Creating NQA instances for link monitoring."
¡ If the instance value number is 0, or the two items are not displayed in the Item Name column, go to the following steps to add them.
The page for adding monitoring items appears.
5. In the Select Index area, click Add. Select Response Time of Device (ms) and Device Unreachability Proportion (%) from System-Device Defect, and click OK.
6. In the Select Device area, click Add, and then select Switch A.
Use the default settings for other parameters.
For more information about Performance Management, see HPE IMC Enterprise and Standard Platform Administrator Guide.
Creating NQA instances for link monitoring
Before you create NQA instances, make sure Switch A, Switch B, and the voice gateway support both SNMP and NQA.
To monitor the voice quality of key links between Switch A, Switch B, and the voice gateway, create six NQA instances that use the voice operation. Every two NQA instances between the two devices monitor the voice operation in different directions.
This section creates an NQA instance from Switch A to the voice gateway. You can create the other five NQA instances in the same way.
To create the NQA instance:
1. Import Switch A and the voice gateway to the SHM:
a. Click the Service tab.
b. From the left navigation tree, click Service Health Manager > NQA Config > NQA Device.
The NQA Device page appears.
c. Click Import.
The page for importing devices appears.
d. Click Select Device, and select Switch A and the voice gateway.
e. Click OK.
2. Modify device configuration:
a. Enable the NQA client and the NQA server on Switch A and the voice gateway, respectively. For more information, see "Modifying the NQA server or client enabling state."
b. Add a UDP listening service on the voice gateway. For more information, see "Modifying UDP listening services."
3. Create the NQA instance:
a. Click the Service tab.
b. From the left navigation tree, click Service Health Manager > NQA Instance.
c. Click Add Group.
d. On the page that appears, enter 001 in the NQA Group Name field.
Use the default settings for other parameters.
e. Click OK.
The NQA Groups page appears.
f. Click Add Instance.
The page for adding an NQA instance appears.
Figure 32 Configuring basic parameters for the NQA instance
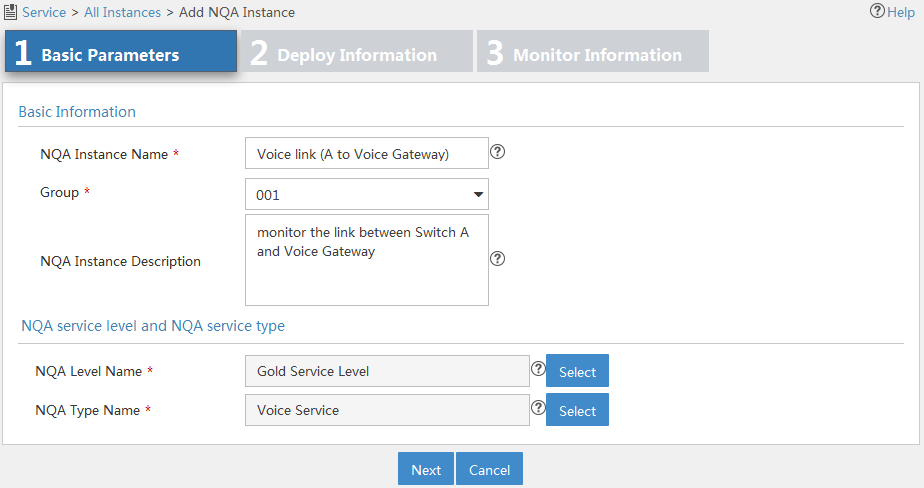
4. Configure basic parameters for the NQA instance:
a. NQA Instance Name—Enter Voice link (A to Voice Gateway).
b. Group—Select 001.
c. NQA Instance Description—Enter monitor the link between Switch A and Voice Gateway.
d. NQA Level Name—Select Gold Service Level.
e. NQA Type Name—Select Voice Service.
5. Click Next.
The page for configuring deployment information appears.
Figure 33 Configuring deployment information
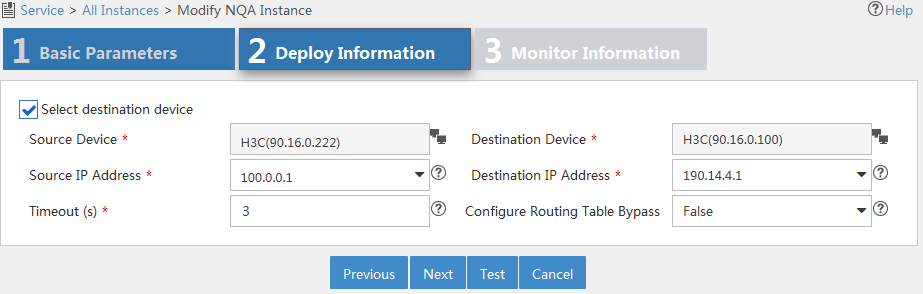
6. Configure the following parameters:
a. Source Device—Select Switch A.
b. Destination Device—Select the voice gateway.
c. Source IP Address—Select the source IP address for the voice operation.
d. Destination IP Address—Select the destination IP address for the voice operation.
Use the default settings for other parameters.
7. Click Test to check whether the NQA instance is correctly configured.
If the test fails, modify the parameters that you have configured in Figure 33.
8. Click Next.
The page for configuring monitor information appears. Use the default settings on the page.
Figure 34 Configuring monitor information
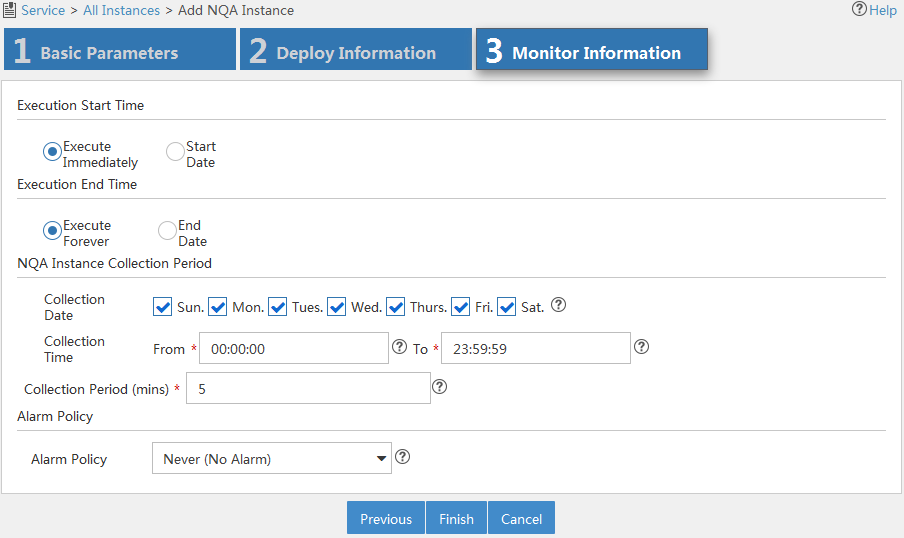
9. Click Finish.
The newly added NQA instance is displayed in the NQA instance list.
For more information about adding NQA groups and creating NQA instances, see " Adding an NQA group" and "Adding an NQA instance," respectively.
Creating an SLA
This configuration example uses system-defined KQIs and requires no service level setting. For more information about configuring KQIs and service levels, see "Adding a KQI " and "Adding a service level."
To create an SLA:
1. Click the Service tab.
2. From the left navigation tree, click Service Health Manager > SLA.
The SLA page appears.
3. Click Add and select Manually Add.
The page for adding an SLA appears.
4. Click Select Device to add Switch A, Switch B, the voice gateway, and the VCX server.
The devices appear in the Resource Topology area. NQA instances between Switch A, Switch B, the voice gateway are also imported and represented by green dashed lines.
5. In the left area of the page, select the following KQIs and drag them to the area above the Resource Topology area.
¡ Select Device Response Time and Device Unreachable from the Device Status KQI class.
¡ Select Voice MOS, Voice icpif, Average RTT, Jitter, one way average delay, Error Rate, Packet Loss Rate, and Unreachable Rate from the NQA Voice Quality KQI class.
Figure 35 Adding SLA monitored objects
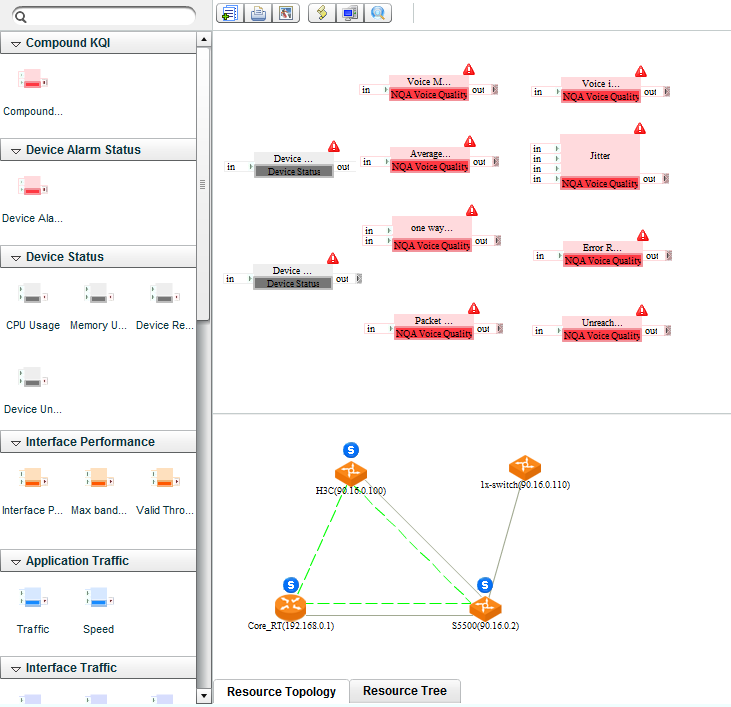
6. Associate the KQIs with the monitored objects:
a. Double-click the icon of a KQI, for example, voice MOS.
The page for configuring the voice MOS appears.
b. In the Configure KQI Resources area, select key links described in Table 18 from the Resource Name column.
Use the default settings for other parameters on the page.
To modify the formula in the Configure KQI Formula area, follow the instructions in "Configuring a KQI."
c. Click OK.
The voice MOS and the monitored objects are associated.
d. Associate other KQIs with the monitored objects in the same way the voice MOS is associated with the monitored objects.
7. Configure a compound KQI that includes voice MOS and packet loss rate:
a. Drag the compound KQI icon from the Compound KQI list to the area above the Resource Topology area.
b. Click the icon ![]() of Voice MOS.
of Voice MOS.
The icon ![]() appears.
appears.
c. Drag the icon ![]() to the uppermost
icon
to the uppermost
icon ![]() of the
compound KQI.
of the
compound KQI.
A red line appears between the voice MOS and the compound KQI, indicating that the voice MOS is successfully added to the compound KQI.
d. Add the packet loss rate to the compound KQI in the same way the voice MOS is added to the compound KQI.
Figure 36 Creating a compound KQI
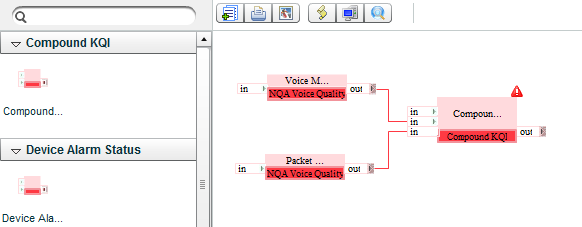
a. Double-click the compound KQI icon.
The page for configuring the compound KQI appears.
b. Configure the compound KQI settings:
- In the Basic KQI Information area, enter compound KQI for voice links in the Name field.
- In the Configure KQI Formula area, select the average formula and rating as the KQI value type.
- In the Rate KQI area, select ratings 5, 4, 3 for the KQI value ranges, and rating 1 for other values. Ratings 3, 4, and 5 correspond to KQI values 2 to 3, 3 to 4, and 4 to 5. Select Available and Unavailable for ratings 3 through 5 and rating 1, respectively.
c. Click OK.
Figure 37 Configuring the compounding KQI
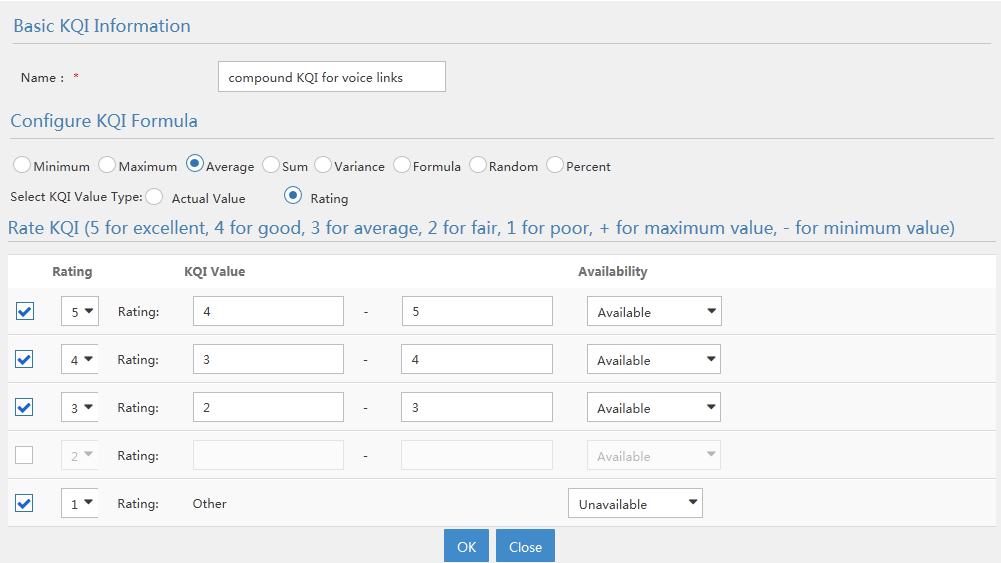
8. Set service properties:
a. In the tool bar of the page for adding the
SLA, click the Add Service and Quit icon ![]() .
.
The page for setting service properties appears.
b. In the Basic Attributes area, enter Voice SLA in the Name field.
c. In the KQI area, select Device Response Time, Voice icpif, Device Unreachable, Voice MOS, Packet Loss Rate, Unreachable Rate, and Jitter.
d. In the Rating Method area, select Maximum.
e. In the Service Rating area, select Available for ratings 2 through 5, and Unavailable for rating 1.
Use the default settings for other parameters on the page.
f. Click OK.
The newly added voice SLA is displayed in the SLA list.
Figure 38 Setting service properties
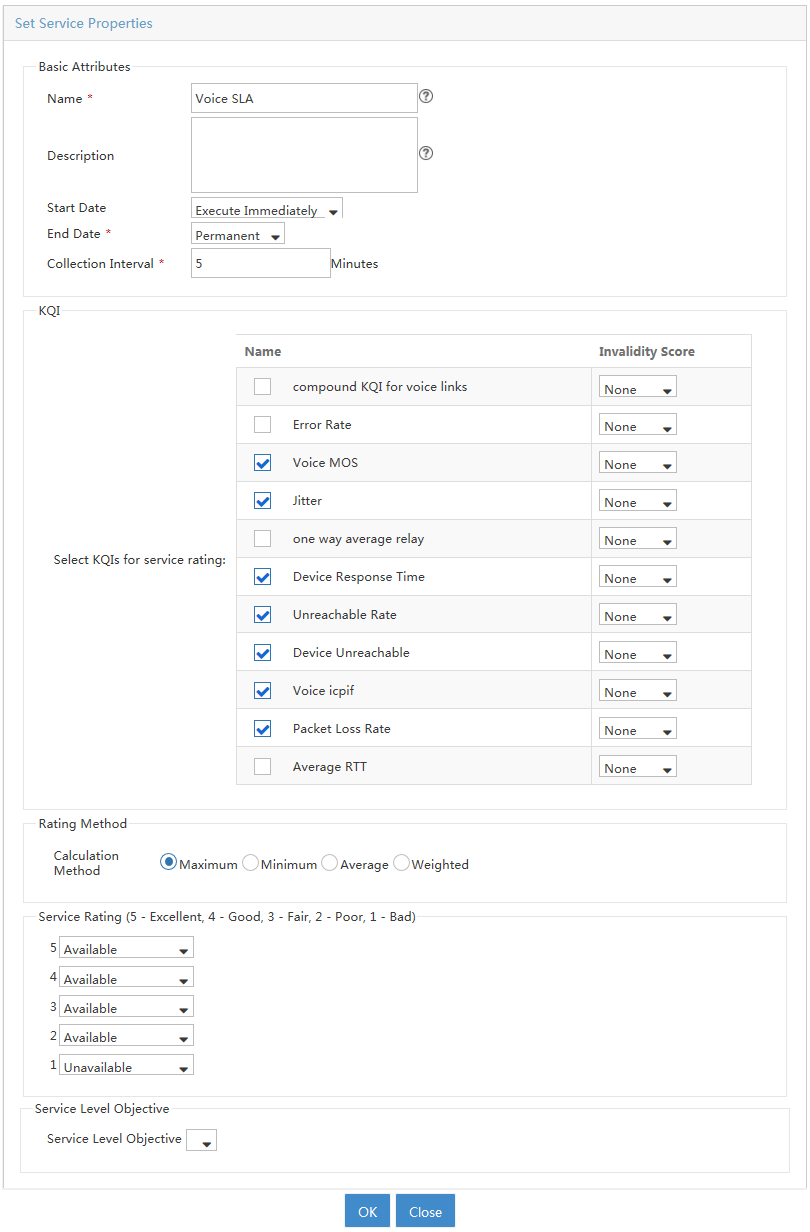
For more information about creating an SLA, see "Manually adding an SLA."
Viewing the SLA report
After the SLA runs for a time period, view the SLA report as follows:
1. Access the SLA page.
2. Click the Voice SLA or the horizontal bar chart in the Health of the Day column in the SLA view list.
The health condition shows that the service level is excellent and the critical KQI is Voice MOS within the SLA.
You can click Voice MOS to view its KQI details, and click View Original Output Data for the KQI to further examine the network performance.
For more information about the SLA report, see "Understanding SLA reports."
Figure 39 Voice SLA report
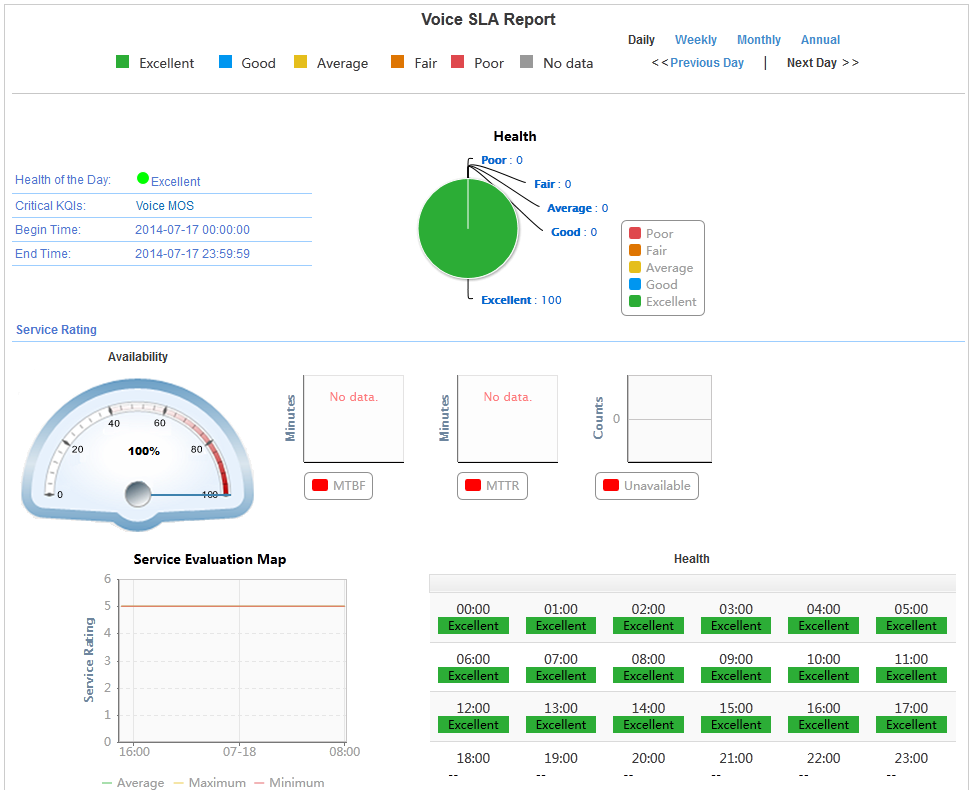
Evaluating email service configuration example
Network requirements
As shown in Figure 40, email sending and receiving is slow for branch offices. The pre-analysis shows problems occur on the following devices:
· Router A.
· Router B.
· Switch C.
· Switch D.
· Mail server.
· DNS MX server.
To identify the critical factor that affects the network service, configure an SHM SLA to monitor the following objects:
· Devices—Router A, Router B, Switch C, Switch D, the mail server, and the DNS MX server.
· Links—Link between routers, and links between Router B and switches in the branch.
· Interfaces—Interface S2 on Router A and Interface S1 on Router B.
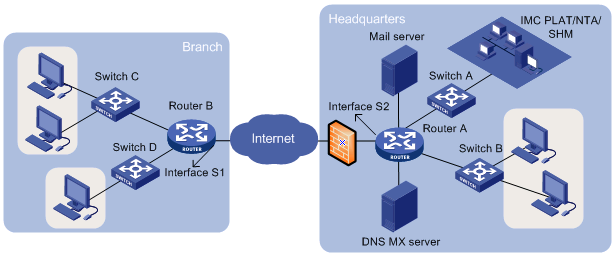
Requirement analysis
The main factors that can cause poor email services include the following items:
· Performance of the links between Router A and Router B, Router B and Switch C, and Router B and Switch D, such as jitter, one-way average delay, and unreachable rate.
· Response time and device unreachable rate of Router A, Router B, Switch C, and Switch D.
· Performance of the mail server and the DNS MX server, such as CPU usage, memory usage, device unreachable rate, and the response time.
· Performance of Interfaces S1 and S2, such as interface performance, maximum bandwidth usage, inbound traffic, and outbound traffic.
To identify the critical factor that affects the network service, you can configure an SLA as described in Table 19 that monitors and measures the KQI on the target objects.
|
Monitored object |
Object type |
System-defined KQI |
KQI data source |
|
|
· Router A · Router B · Switch C · Switch D |
Key device |
Device unreachable Device response time |
Performance Management |
|
|
· Mail server · DNS MX server |
Key device |
Device unreachable Device response time CPU usage Memory usage |
Performance Management |
|
|
Link between the following devices: · Router A and Router B · Router B and Switch C · Router B and Switch D |
Key link |
Jitter One way average delay Average RTT Packet loss rate Error rate Unreachable rate |
NQA instance module |
|
|
· Interface S1 · Interface S2 |
Key interfaces |
Interface performance Valid through usage Max bandwidth usage |
Performance Management |
|
|
In traffic Out traffic |
NTA
Make sure NTA is deployed in the same IMC system where SHM is deployed. |
Configuration procedures
Make sure you have administrator access to perform the following configuration tasks.
Importing the key devices to the IMC Enterprise and Standard platform
Import the following devices to the IMC Enterprise and Standard platform:
· Router A.
· Router B.
· Switch C.
· Switch D.
· Mail server.
· DNS MX server.
For more information, see HPE IMC Enterprise and Standard Platform Administrator Guide.
Adding monitoring attributes on the key devices
The KQIs interface performance, valid through usage, and max bandwidth usage have multiple KPIs. For more information, see Table 9. When you add monitoring attributes on routers, make sure the monitoring attributes that are associated with KPIs are added on the key devices.
Table 20 Required monitoring attributes on the key devices
|
Devices |
Monitoring attributes |
|
Router A and Router B |
· Response time of device · Device unreachability proportion · CPU usage · Memory usage · Interface receiving rate · Interface transmitting rate · Interface inbound bandwidth usage · Interface outbound bandwidth usage · Interface inbound packet loss rate · Interface outbound packet loss rate |
|
Switch C and Switch D |
· Response time of device · Device unreachability proportion |
This section adds monitoring attributes to Router A. You can add monitoring attributes to Router B, Switch C, and Switch D in the same way. For the required monitoring attributes on each device, see Table 20.
To add monitoring attributes to Router A:
1. Click the Resource tab.
2. From the left navigation tree, click Performance Management > Monitoring Settings.
The Monitoring Settings page appears.
3. Click the value in the Instances column of Router A to check whether the required monitoring attributes are in the Item Name column.
¡ If they are displayed in the Item Name column, go to "Creating traffic analysis tasks."
¡ If the instance value number is 0, or they are not in the Item Name column, go to the following steps to add them.
4. Click Add Monitor.
The page for adding monitoring items appears.
5. In the Select Index area, click Add.
a. Select Response Time of Device (ms) and Device Unreachability Proportion (%) from System-Device Defect.
b. Select CPU Usage (%) from System-CPU Usage.
c. Select Memory Usage (%) from System-Memory Usage.
d. Select the following attributes from System-Interface Statistics.
- Interface Receiving Rate (bps).
- Interface Transmitting Rate (bps).
- Interface Inbound Bandwidth Usage (%).
- Interface Outbound Bandwidth Usage (%).
- Interface Inbound Packet Loss Rate (%).
- Interface Outbound Packet Loss Rate (%).
e. Click OK.
6. In the Select Device area, click Add, and then select Router A.
Use the default settings for other parameters.
7. Click OK.
For more information about Performance Management, see HPE IMC Enterprise and Standard Platform Administrator Guide.
Creating traffic analysis tasks
Make sure Router A and Router B support exporting sFlow, NetStream, or NetFlow logs as UDP packets. In this example, sFlow logs are used.
Create traffic analysis tasks to analyze bidirectional traffic of Interfaces S1 and S2. This sections creates the traffic analysis task for Interface S2 (GigabitEthernet 1/0/10). You can create the traffic analysis task for Interfaces S1 in the same way.
To creates the traffic analysis task for Interface S2:
1. Configure Router A:
# Assign the IP address 90.16.0.200 of Interface S2 to the sFlow agent.
<Router A>system-view
[Router A]sflow agent ip 90.16.0.200
# Configure information about the sFlow collector. Specify the sFlow collector ID as 1, IP address as 90.16.0.220, port number as 9020, and description as NTAServer.
[Router A]sflow collector 1 ip 90.16.0.220 port 9020 description NTAServer
# Enable counter sampling and set the counter sampling interval to 120 seconds on GigabitEthernet 1/0/10.
[Router A]interface GigabitEthernet 1/0/10
[Router A-GigabitEthernet1/0/10]sflow counter interval 120
# Specify sFlow collector 1 for counter sampling.
[Router A-GigabitEthernet1/0/10]sflow counter collector 1
[Router A-GigabitEthernet1/0/10]quit
2. Add Router A to NTA:
a. Click the Service tab.
b. From the left navigation tree, click Traffic Analysis and Audit > Settings.
The Settings page appears.
c. Click Device Management.
d. Click Add.
The page for adding devices appears.
e. Click Select, and select Router A.
f. Click OK.
3. Add the listening port 9020 to NTA:
a. Access the Settings page.
b. Click Server Management.
The Server List page appears.
c. Click the Modify
icon ![]() for the NTA server.
for the NTA server.
d. In the Basic information area, check whether 9020 is displayed in the Listening Port field.
If 9020 is not displayed, enter 9020.
e. In the Device information area, select Router A.
f. Click Deploy.
4. Add a traffic analysis task:
a. Access the Settings page.
b. Click Traffic Analysis Task Management.
c. Click Add.
The Select Task Type page appears.
d. Select Interface, and click Next.
The Add Traffic Analysis Task page appears.
e. Configure the traffic analysis task:
- In the Task Name field, enter interface.
- In the Reader field, select Administrator Group, Maintainer Group, and Viewer Group.
- In the Interface Information area, click Select, and then select GigabitEthernet1/0/10.
Use the default settings for other parameters on the page.
f. Click OK.
For more information about NTA, see HPE IMC NTA Administrator Guide.
Figure 41 Configure the traffic analysis task
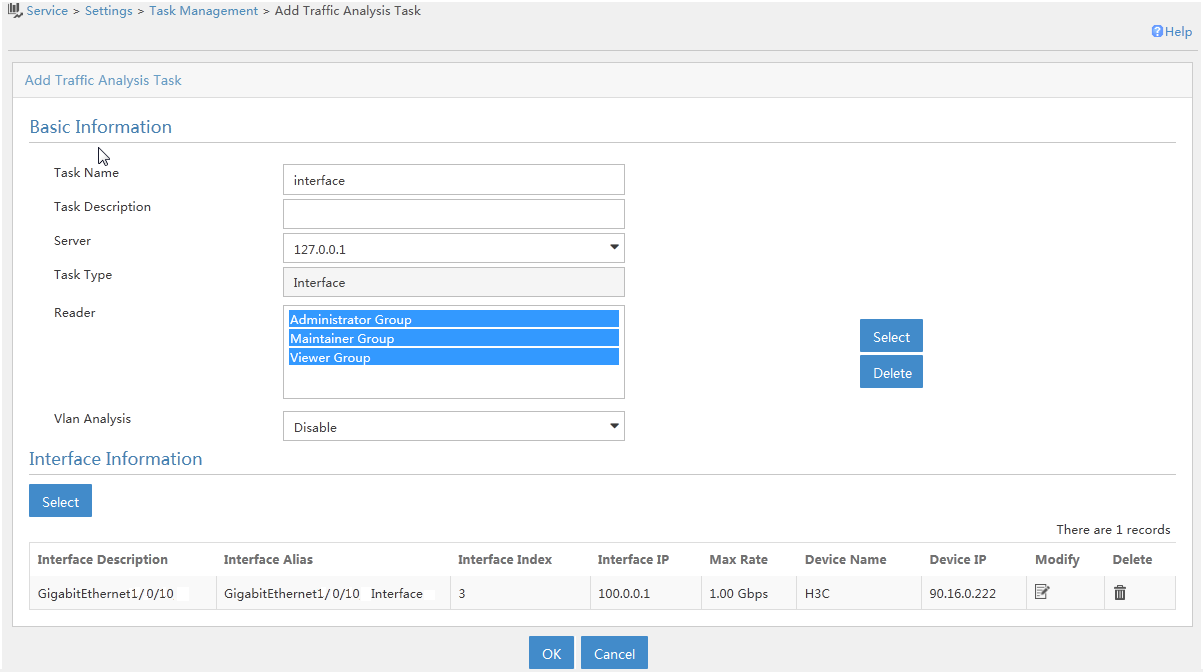
Creating NQA instances for link monitoring
Before you create NQA instances, make sure Router A, Router B, Switch C, and Switch D support both SNMP and NQA.
To monitor the quality of the key links, you must create six NQA instances that use the ICMP echo, UDP echo, and TCP connection operations. Every two NQA instances between the two devices monitor the operation in different directions.
This section creates an NQA instance from Router A to Router B. You can create the other five NQA instances in the same way.
To create the NQA instance:
1. Import Router A and Router B to the SHM:
a. Click the Service tab.
b. From the left navigation tree, click Service Health Manager > NQA Config > NQA Device.
The NQA Device page appears.
c. Click Import.
The page for importing devices appears.
d. Click Select Device, and select Router A and Router B.
e. Click OK.
2. Modify device configuration:
a. Enable the NQA client and the NQA server on Router A and Router B, respectively. For more information, see "Modifying the NQA server or client enabling state."
b. Add a TCP listening service on Router B. For more information, see "Modifying TCP listening services."
c. Add a UDP listening service on Router B. For more information, see "Modifying UDP listening services."
3. Create an NQA type that includes the basic indexes ICMP echo, UDP echo, and TCP connection:
a. Click the Service tab.
b. From the left navigation tree, click Service Health Manager > NQA Config > NQA Type.
The NQA Type page appears.
c. Click Add.
The page for adding an NQA type appears.
d. In the Basic Information area, configure basic information for the NQA type:
- Name—Enter Link for Mail Service.
- NQA Type Description—Enter monitor the link for Mail Service.
e. In the Basic Index Information area, configure basic indexes for the NQA type:
- Click Add.
- Select Basic from the Index Group Name List in the Query area.
- Select ICMP Echo, UDP Echo, and TCP Connection in the Basic Index Information area.
- Click OK.
The added basic indexes are displayed in
the basic index list. You can click the Modify icon ![]() to modify the
settings for an index.
to modify the
settings for an index.
f. Click OK.
Figure 42 Configuring the NQA type
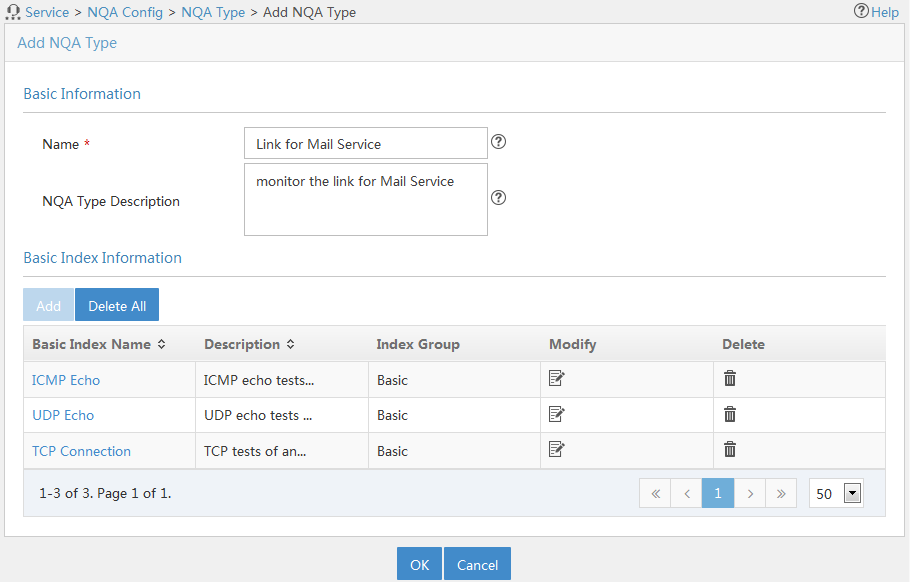
4. Create the NQA instance:
a. Click the Service tab.
b. From the left navigation tree, click Service Health Manager > NQA Instance.
c. Click Add Group.
The page for adding an NQA group appears.
d. Enter 001 in the NQA Group Name field.
Use the default settings for other parameters.
e. Click OK.
The NQA Groups page appears.
f. Click Add Instance.
The page for adding an NQA instance appears.
Figure 43 Configuring basic parameters for the NQA instance

5. Configure basic parameters for the NQA instance:
a. NQA Instance Name—Enter Mail link (Router A to Router B).
b. Group—Select 001.
c. NQA Instance Description—Enter monitor the link between Router A and Router B.
d. NQA Level Name—Select Gold Service Level.
e. NQA Type Name—Select Link for Mail Service.
6. Click Next.
The page for configuring deployment information appears.
Figure 44 Configuring deployment information
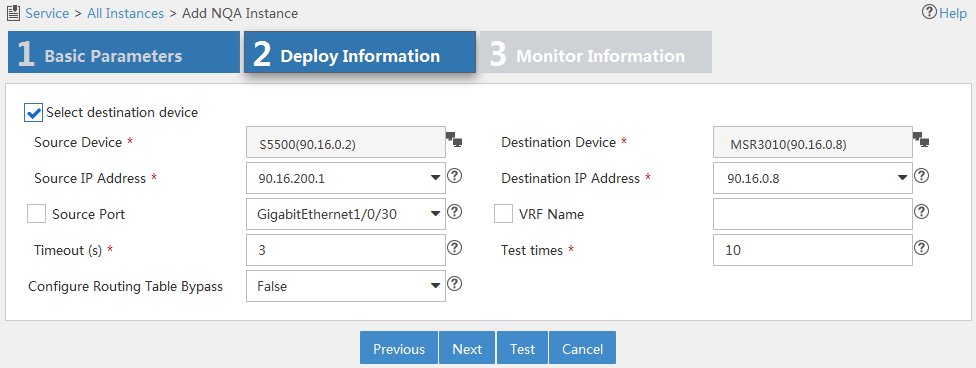
7. Configure the following parameters:
a. Source Device—Select Router A.
b. Destination Device—Select Router B.
c. Source IP Address—Select the source IP address for NQA operations.
d. Destination IP Address—Select the destination IP address for NQA operations.
Use the default settings for other parameters.
8. Click Test to check whether the NQA instance is correctly configured.
If the test fails, modify the parameters that you have configured in Figure 44.
9. Click Next.
The page for configuring monitor information appears. Use the default settings on the page.
Figure 45 Configuring monitor information

10. Click Finish.
The newly added NQA instance is displayed in the NQA instance list.
For more information about adding NQA groups and creating NQA instances, see " Adding an NQA group" and "Adding an NQA instance," respectively.
Creating an SLA
This configuration example uses system-defined KQIs and requires no service level setting. For more information about configuring KQIs and service levels, see "Adding a KQI " and "Adding a service level."
To create an SLA:
1. Click the Service tab.
2. From the left navigation tree, click Service Health Manager > SLA.
The SLA page appears.
3. Click Add and select Manually Add.
The page for adding an SLA appears.
4. Click Select Device to add Router A, Router B, Switch C, Switch D, the mail server, and the DNS MX server.
The devices appear in the Resource Topology area. NQA instances between them are also imported and represented by green dashed lines.
5. Right-click the Resource Topology area, select Add Interfaces, and then select Interfaces S1 and S2.
6. In the left area of the page, select the following KQIs and drag them to the area above the Resource Topology area.
¡ Select Device Response Time, Device Unreachable, CPU Usage, and Memory Usage from the Device Status KQI class.
¡ Select Jitter, one way average delay, Average RTT, Packet Loss Rate, Error Rate, and Unreachable Rate from the NQA Link Quality KQI class.
¡ Select Interface Performance, Max Bandwidth Usage, and Valid Through Usage from the Interface Performance KQI class.
¡ Select In Traffic and Out Traffic from the Interface Traffic KQI class.
Figure 46 Adding SLA monitored objects
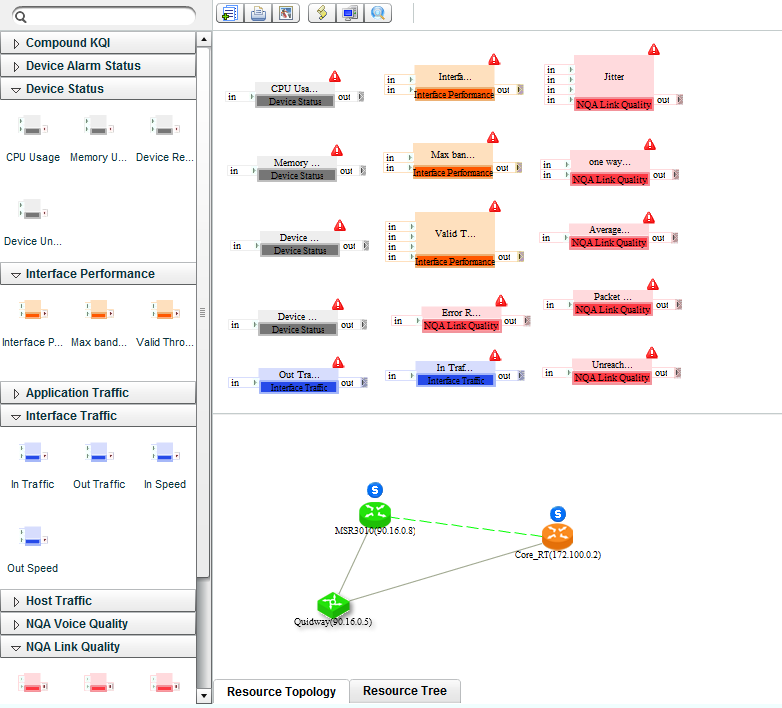
7. Associate the KQIs with the monitored objects:
a. Double-click the icon of a KQI, for example, jitter.
The page for configuring the jitter appears.
b. In the Configure KQI Resources area, select key links described in Table 19 from the Resource Name column.
Use the default settings for other parameters on the page.
To modify the formula in the Configure KQI Formula area, follow the instructions in "Configuring a KQI."
c. Click OK.
The KQI and the monitored objects are associated.
d. Associate other KQIs with the monitored objects in the same way the jitter is associated with the monitored objects.
8. Set service properties:
a. In the tool bar of the page for adding the
SLA, click the Add Service and Quit icon ![]() .
.
The page for setting service properties appears.
b. In the Basic Attributes area, enter Mail SLA in the Name field.
c. In the KQI area, select Device Response Time, Unreachable Rate, Average RTT, Valid Through Usage, and Device Unreachable.
d. In the Rating Method area, select Average.
e. In the Service Rating area, select Available for ratings 3 through 5, and Unavailable for ratings 1 and 2.
Use the default settings for other parameters on the page.
f. Click OK.
The newly added SLA is displayed in the SLA list.
For more information about creating an SLA, see "Manually adding an SLA."
Figure 47 Setting service properties
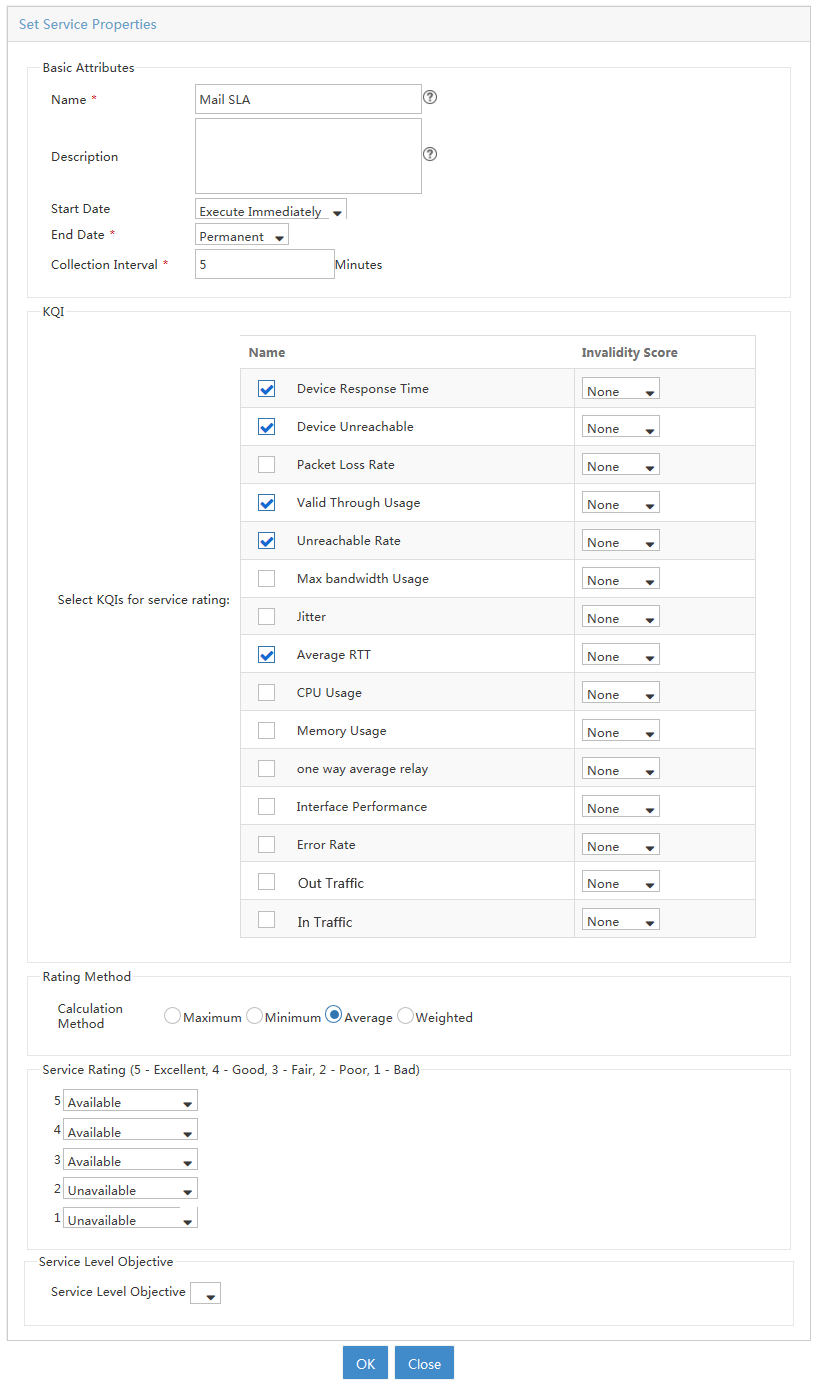
Viewing the SLA report
After the SLA runs for a time period, view the SLA report as follows:
1. Access the SLA page.
2. Click the Mail SLA or the horizontal bar chart in the Health of the Day column in the SLA view list.
The health condition shows that the service level is fair and the critical KQI is Unreachable Rate within the SLA.
You can click Unreachable Rate to view its KQI details, and click View Original Output Data for the KQI to further examine the network performance.
Figure 48 Mail SLA report
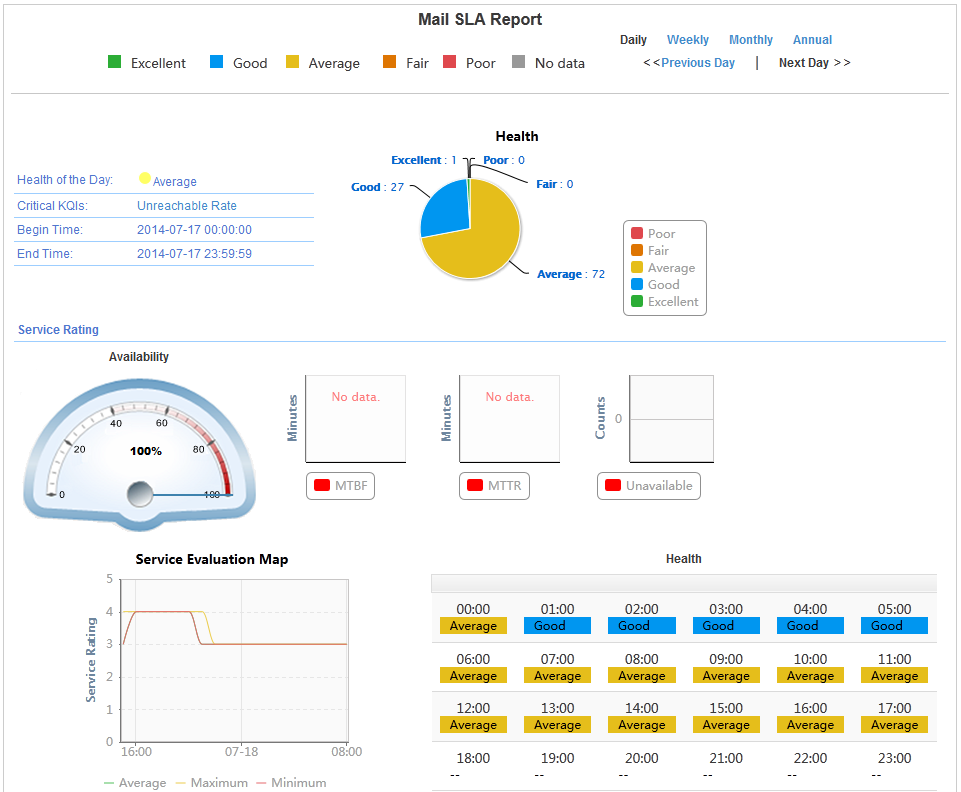
Evaluating network infrastructure performance configuration example
Network requirements
As shown in Figure 49, the Ecommerce application system provides Ecommerce service for users. To evaluate the performance of the network infrastructure that supports the system, configure an SHM SLA to monitor the core router, Switch A, servers in the Ecommerce application system, and the link between the router and Switch A.
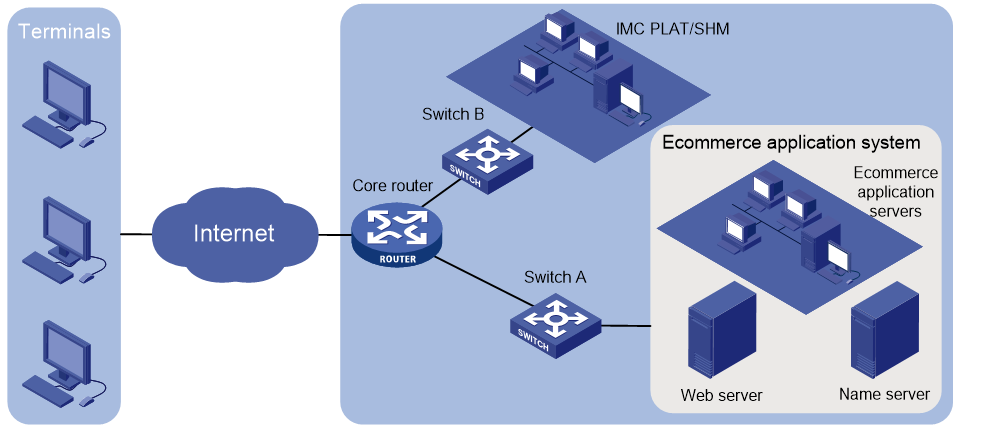
Requirement analysis
The main factors that can affect the performance of the network infrastructure include the following items:
· Performance of the link between the core router and Switch A, such as jitter, one-way average delay, average RTT, packet loss rate, and unreachable rate.
· Response time and unreachable rate of the core router and Switch A.
· Performance of the Ecommerce application server, Web server, and name server, such as CPU usage, unreachable rate, and response time.
To evaluate the network performance, you can configure an SLA as described in Table 21 that monitors and measures the KQI on the target objects.
|
Monitored object |
Object type |
System-defined KQI |
KQI data source |
|
· Core router · Switch A |
Key device |
· Device unreachable · Device response time |
Performance Management |
|
· Ecommerce application server · Web server · Name server |
Key device |
· Device unreachable · Device response time · CPU usage · Memory usage |
Performance Management |
|
Link between the core router and Switch A |
Key link |
· Jitter · One way average delay · Average RTT · Packet loss rate · Jitter · Unreachable rate |
NQA instance module |
Configuration procedures
Make sure you have administrator access to perform the following configuration tasks.
Importing the key devices to the IMC Enterprise and Standard platform
Import the following devices to the IMC Enterprise and Standard platform:
· Core router.
· Switch A.
· Ecommerce application server.
· Web server.
· Name server.
For more information, see HPE IMC Enterprise and Standard Platform Administrator Guide.
Adding monitoring attributes on the key devices
This section adds monitoring attributes to the core router. You can add monitoring attributes to other key devices in the same way.
To add monitoring attributes to the core router:
1. Click the Resource tab.
2. From the left navigation tree, click Performance Management > Monitoring Settings.
The Monitoring Settings page appears.
3. Click the value in the Instances column of the core router to check whether Device Unreachability Proportion, Response Time of Device, CPU Usage, and Memory Usage are in the Item Name column.
¡ If they are displayed in the Item Name column, go to "Creating NQA instances for link monitoring."
¡ If the instance value number is 0, or they are not in the Item Name column, go to the following steps to add them.
4. Click Add Monitor.
The page for adding monitoring items appears.
5. In the Select Index area, click Add.
a. Select Response Time of Device (ms) and Device Unreachability Proportion (%) from System-Device Defect.
b. Select CPU Usage (%) from System-CPU Usage.
c. Select Memory Usage (%) from System-Memory Usage.
6. In the Select Device area, click Add, and then select the core router.
Use the default settings for other parameters.
7. Click OK.
For more information about Performance Management, see HPE IMC Enterprise and Standard Platform Administrator Guide.
Creating NQA instances for link monitoring
Before you create NQA instances, make sure the core router and Switch A support both SNMP and NQA.
To monitor the link between the core router and Switch A, create two NQA instances that each use the basic indexes ICMP echo, UDP echo, and TCP connection. One instance monitors the operations from the core router to Switch A, and the other instance monitor the operations in the opposite direction.
This section creates an NQA instance with the core router and Switch A as the source and destination devices, respectively. You can create the other NQA instance in the same way.
To create the NQA instance:
1. Import the core router and Switch A to the SHM:
a. Click the Service tab.
b. From the left navigation tree, click Service Health Manager > NQA Config > NQA Device.
The NQA Device page appears.
c. Click Import.
The page for importing devices appears.
d. Click Select Device, and select the core router and Switch A.
e. Click OK.
2. Modify device configuration:
a. Enable the NQA client and the NQA server on the core router and Switch A, respectively. For more information, see "Modifying the NQA server or client enabling state."
b. Add a TCP listening service on Switch A. For more information, see "Modifying TCP listening services."
c. Add a UDP listening service on Switch A. For more information, see "Modifying UDP listening services."
3. Create an NQA type that includes the basic indexes ICMP echo, UDP echo, and TCP connection:
a. Click the Service tab.
b. From the left navigation tree, click Service Health Manager > NQA Config > NQA Type.
The NQA Type page appears.
c. Click Add.
The page for adding an NQA type appears.
d. In the Basic Information area, configure basic information for the NQA type:
- Name—Enter Link for Ecommerce System.
- NQA Type Description—Enter monitor the link for Ecommerce System.
e. In the Basic Index Information area, configure basic indexes for the NQA type:
- Click Add.
- Select Basic from the Index Group Name List in the Query area.
- Select ICMP Echo, UDP Echo, and TCP Connection in the Basic Index Information area.
- Click OK.
The added basic indexes are displayed in
the basic index list. You can click the Modify icon ![]() to modify the
settings for an index.
to modify the
settings for an index.
f. Click OK.
Figure 50 Configuring the NQA type
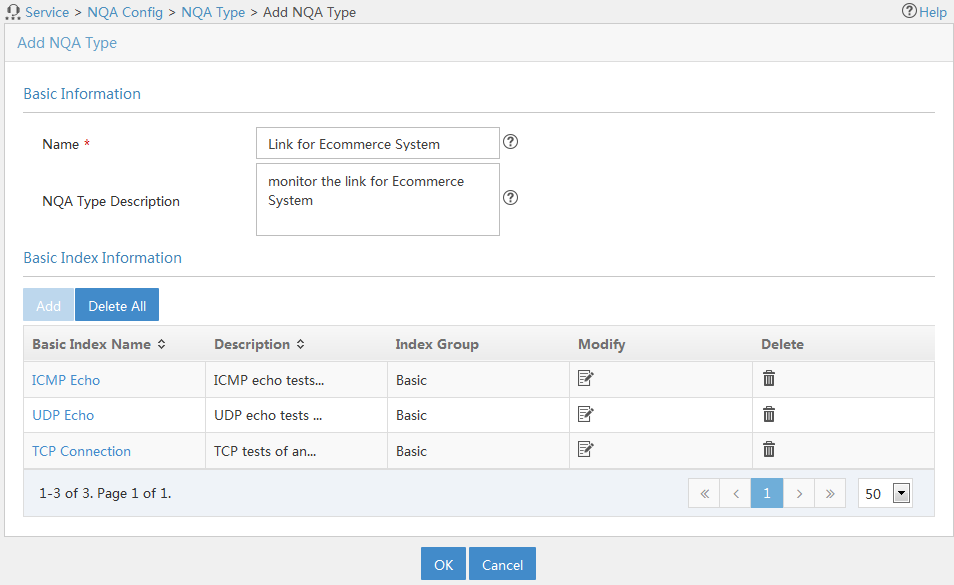
4. Create the NQA instance:
a. Click the Service tab.
b. From the left navigation tree, click Service Health Manager > NQA Instance.
c. Click Add Group.
d. On the page that appears, enter 001 in the NQA Group Name field.
Use the default settings for other parameters.
e. Click OK.
The NQA Groups page appears.
f. Click Add Instance.
The page for adding an NQA instance appears.
Figure 51 Configuring basic parameters for the NQA instance
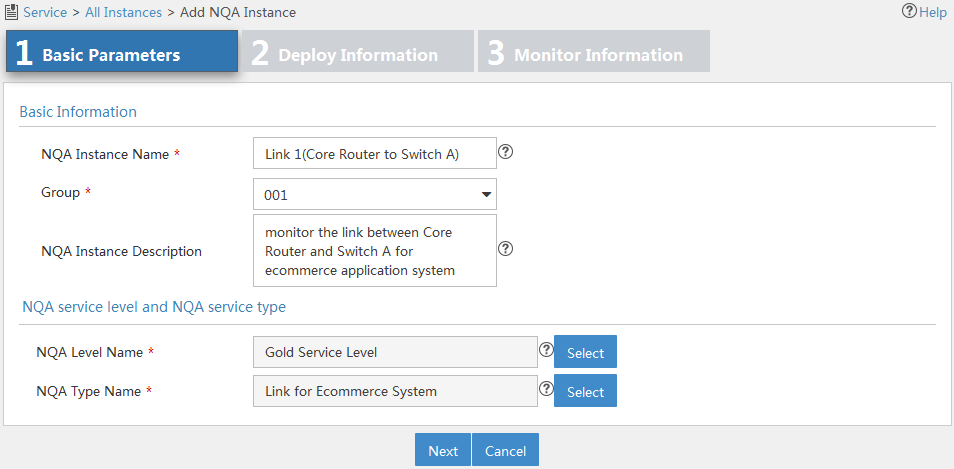
5. Configure basic parameters for the NQA instance:
a. NQA Instance Name—Enter Link 1 (Core Router to Switch A).
b. Group—Select 001.
c. NQA Instance Description—Enter monitor the link between Core Router and Switch A for ecommerce application system.
d. NQA Level Name—Select Gold Service Level.
e. NQA Type Name—Select Link for Ecommerce System.
6. Click Next.
The page for configuring deployment information appears.
Figure 52 Configuring deployment information
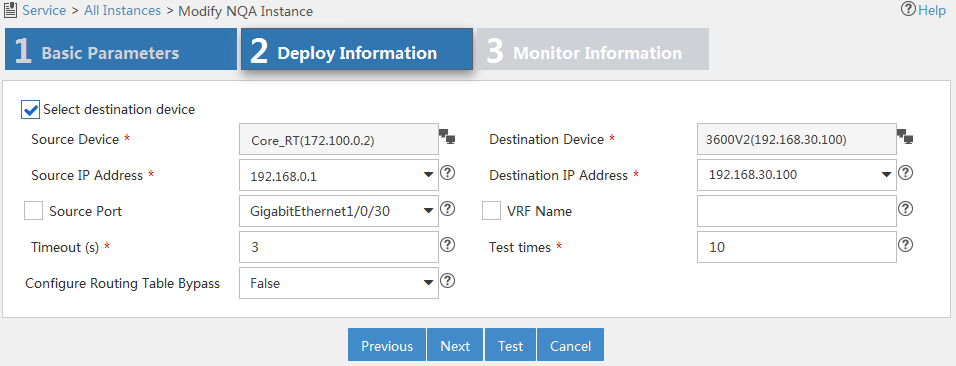
7. Configure the following parameters:
a. Source Device—Select the core router.
b. Destination Device—Select Switch A.
c. Source IP Address—Select the source IP address for NQA operations.
d. Destination IP Address—Select the destination IP address for NQA operations.
Use the default settings for other parameters.
8. Click Test to check whether the NQA instance is correctly configured.
If the test fails, modify the parameters that you have configured in Figure 52.
9. Click Next.
The page for configuring monitor information appears. Use the default settings on the page.
Figure 53 Configuring monitor information
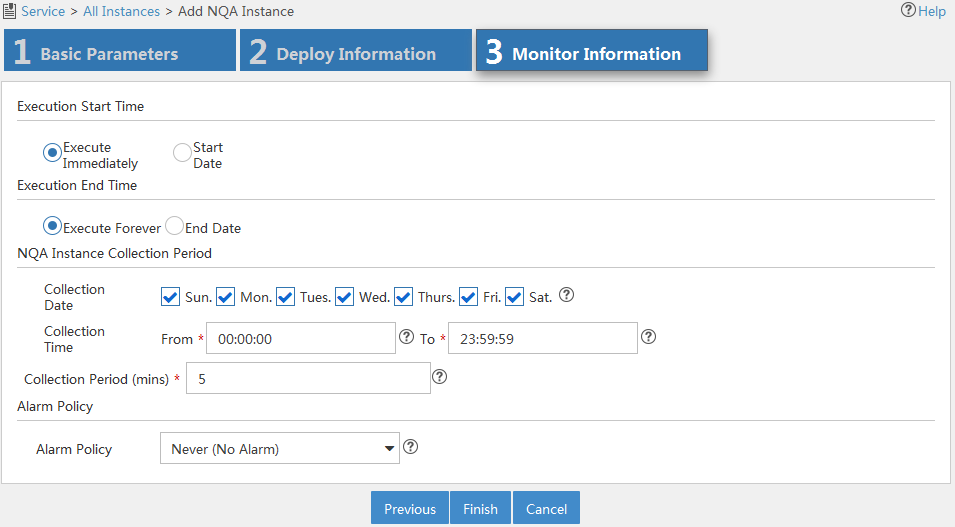
10. Click Finish.
The newly added NQA instance is displayed in the NQA instance list.
For more information about adding NQA groups and creating NQA instances, see " Adding an NQA group" and "Adding an NQA instance," respectively.
Creating an SLA
This configuration example uses system-defined KQIs and requires no service level setting. For more information about configuring KQIs and service levels, see "Adding a KQI " and "Adding a service level."
To create an SLA:
1. Click the Service tab.
2. From the left navigation tree, click Service Health Manager > SLA.
The SLA page appears.
3. Click Add and select Manually Add.
The page for adding an SLA appears.
4. Click Select Device to add the core router, Ecommerce application server, Web server, name server, and Switch A to the SLA.
The devices appear in the Resource Topology area. NQA instances between the core router and Switch A are also imported and represented by a green dashed line.
5. In the left area of the page, select the following KQIs and drag them to the area above the Resource Topology area.
¡ Select Device Unreachable, CPU Usage, and Memory Usage from the Device Status KQI class.
¡ Select Device Response Time twice from the Device Status KQI class.
The second selected Device Response Time KQI is named Device Response Time 1. The two KQIs are used for building a compound KQI.
¡ Select Jitter, one way average delay, Average RTT, Packet Loss Rate, and Unreachable Rate from the NQA Link Quality KQI class.
Figure 54 Adding SLA monitored objects
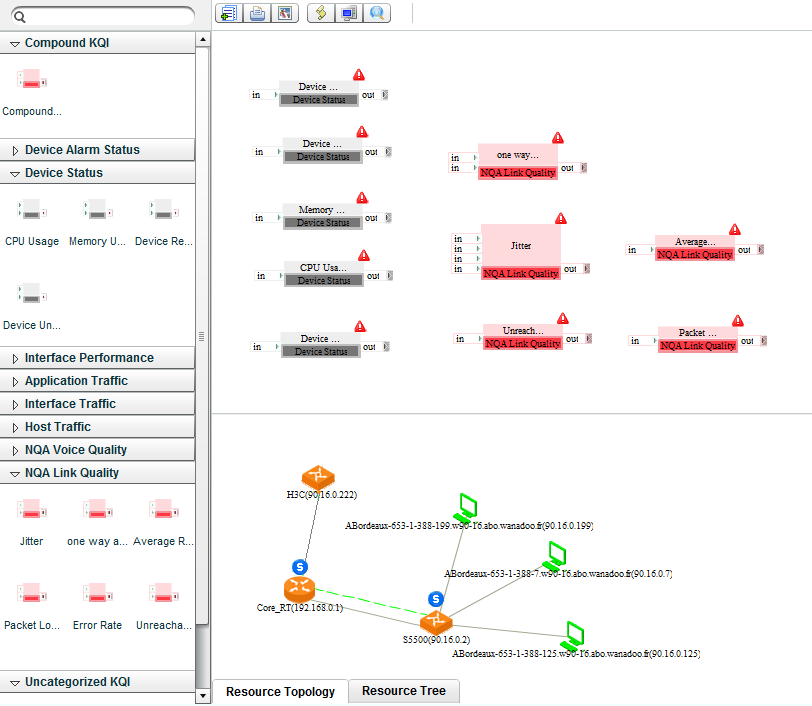
6. Associate the KQIs with the monitored objects:
a. Double-click the icon of a KQI, for example, jitter.
The page for configuring the KQI appears.
b. In the Configure KQI Resources area, select the key link from the Resource Name column.
Use the default settings for other parameters on the page.
To modify the formula in the Configure KQI Formula area, follow the instructions in "Configuring a KQI."
c. Click OK.
The KQI and the monitored objects are associated.
d. Associate other KQIs with the monitored objects in the same way the jitter is associated with the monitored objects.
- Associate Device Response Time with the core router and Switch A.
- Associate Device Response Time 1 with the Ecommerce application server, Web server, and name server.
- Associate other KQIs with the monitored objects as described in Table 21.
7. Configure a compound KQI that includes Device Response Time and Device Response Time 1:
a. Drag the compound KQI icon from the Compound KQI list to the area above the Resource Topology area.
b. Click the icon ![]() of Device Response Time.
of Device Response Time.
The icon ![]() appears.
appears.
c. Drag the icon ![]() to the
uppermost icon
to the
uppermost icon ![]() of the compound KQI.
of the compound KQI.
A red line appears between Device Response Time and the compound KQI, indicating that Device Response Time is successfully added to the compound KQI.
d. Add Device Response Time 1 to the compound KQI in the same way Device Response Time is added to the compound KQI.
Figure 55 Creating a compound KQI
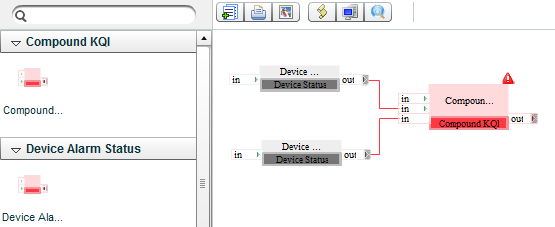
a. Double-click the compound KQI icon.
The page for configuring the compound KQI appears.
b. Configure the compound KQI settings:
- In the Basic KQI Information area, enter compound KQI for response time in the Name field.
- In the Configure KQI Formula area, select the average formula and rating as the KQI value type.
- In the Rate KQI area, select ratings 5, 4, 3, and 2 for the KQI value ranges, and rating 1 for other values. Ratings 2, 3, 4, and 5 correspond to KQI values 1 to 2, 2 to 3, 3 to 4, and 4 to 5. Select Available and Unavailable for ratings 3 through 5 and ratings 1 through 2, respectively.
c. Click OK.
Figure 56 Configuring the compounding KQI
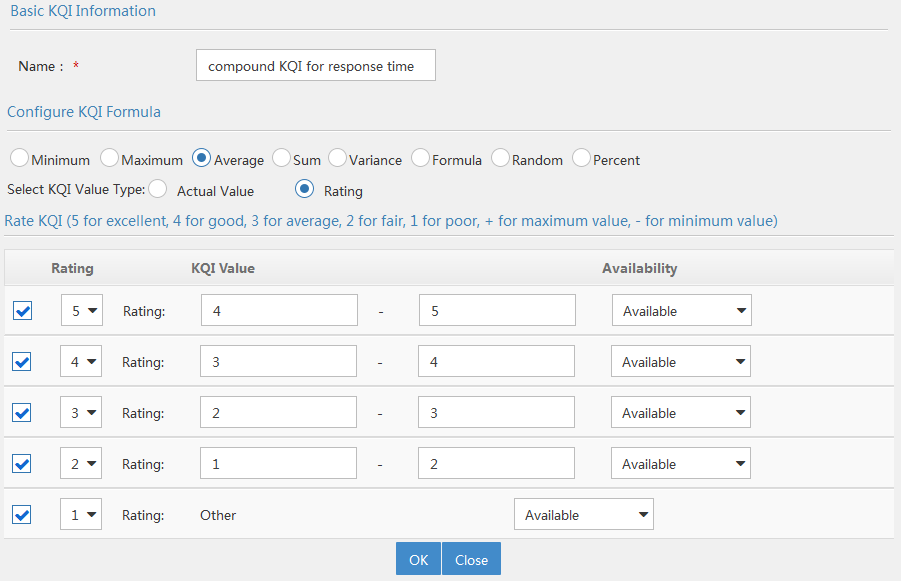
8. Set service properties:
a. In the tool bar of the page for adding the
SLA, click the Add Service and Quit icon ![]() .
.
b. In the Basic Attributes area, enter Ecommerce Application System SLA in the Name field.
c. In the KQI area, select Unreachable Rate, compound KQI for response time, Jitter, Device Unreachable, Packet Loss Rate, and Average RTT.
d. In the Rating Method area, select Average.
e. In the Service Rating area, select Available and Unavailable for ratings 3 through 5 and ratings 1 through 2, respectively.
Use the default settings for other parameters on the page.
f. Click OK.
The newly added SLA is displayed in the SLA list.
For more information about creating an SLA, see "Manually adding an SLA."
Figure 57 Setting service properties
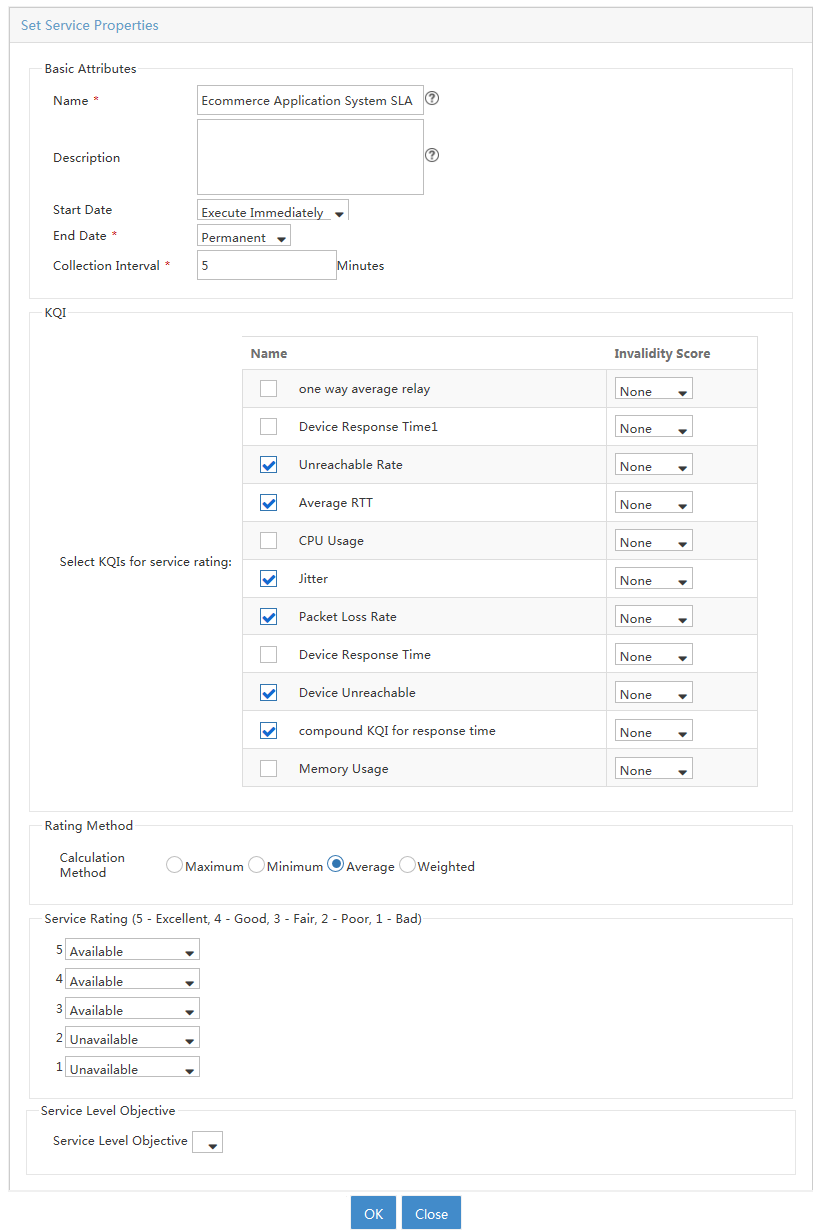
Viewing the SLA report
After the SLA runs for a time period, view the SLA report as follows:
1. Access the SLA page.
2. Click the Ecommerce Application System SLA or the horizontal bar chart in the Health of the Day column in the SLA view list.
The health condition shows that the service level is excellent and the critical KQI is Unreachable Rate within the SLA.
In the Service Rating area, examine values of Availability, MTBF, MTTR, Unavailable, and Service Rating to further evaluate the network performance.
For more information about the SLA report, see "Understanding SLA reports."
Figure 58 Ecommerce Application System SLA report